catalogue of wave energy test centres · where ocean energy1 has been explicitly included in an...
TRANSCRIPT
Grant Agreement IEE/09/809/SI2.558291 (1/10/2010 -30/09/2013), 4/11/2010 SOWFIA
Streamlining of Ocean Wave Farms Impact Assessment
Deliverable D.2.1
Catalogue of Wave Energy Test Centres
March 20111
1Update September 2012

Grant Agreement IEE/09/809/SI2.558291 (1/10/2010 -30/09/2013), 4/11/2010 SOWFIA
Streamlining of Ocean Wave Farms Impact Assessment
SOWFIA project synopsis
The Streamlining of Ocean Wave Farms Impact Assessment (SOWFIA) Project (IEE/09/809/
SI2.558291) is an EU Intelligent Energy Europe (IEE) funded project that draws together ten
partners, across eight European countries, who are actively involved with planned wave farm
test centres. The SOWFIA project aims to achieve the sharing and consolidation of pan-
European experience of consenting processes and environmental and socio-economic impact
assessment (IA) best practices for offshore wave energy conversion developments.
Studies of wave farm demonstration projects in each of the collaborating EU nations are
contributing to the findings. The study sites comprise a wide range of device technologies,
environmental settings and stakeholder interests. Through project workshops, meetings,
ongoing communication and networking amongst project partners, ideas and experiences
relating to IA and policy are being shared, and co-ordinated studies addressing key questions
for wave energy development are being carried out.
The overall goal of the SOWFIA project is to provide recommendations for approval process
streamlining and European-wide streamlining of IA processes, thereby helping to remove
legal, environmental and socio-economic barriers to the development of offshore power
generation from waves. By utilising the findings from technology-specific monitoring at
multiple sites, SOWFIA will accelerate knowledge transfer and promote European-wide
expertise on environmental and socio-economic impact assessments of wave energy projects.
In this way, the development of the future, commercial phase of offshore wave energy
installations will benefit from the lessons learned from existing smaller-scale developments.
Grant Agreement IEE/09/809/SI2.558291 (1/10/2010 -30/09/2013), 4/11/2010 SOWFIA
Streamlining of Ocean Wave Farms Impact Assessment
Grant Agreement number: IEE/09/809/SI2.558291
Project acronym: SOWFIA
Project title: Streamlining of Ocean Wave Farms Impact Assessment
Deliverable D2.1
Catalogue of Wave Energy Test Centres
Authors:
Victoria Osta Mora-Figueroa
Cristina Huertas Olivares
Brian Holmes
Anne Marie O‟Hagan
Editors:
Yago Torre-Enciso
Ruth Leeney
Affiliation:
R&D Department, Inabensa, Sevilla,
Spain.
Hydraulics & Maritime Research
Centre, University College Cork,
Ireland.
Ente Vasco de la Energía (EVE),
Bilbao, Spain.
School of Marine Science &
Engineering, University of Plymouth,
England.
March 2011
Annex Updated: September 2012
“The sole responsibility for the content of this publication lies with the authors. It does not necessarily reflect the opinion of
the European Union. Neither the EACI nor the European Commission are responsible for any use that may be made of the
information contained therein”
I+D+i 2
Executive Summary
The objective of this catalogue is to provide an overview of the development of wave energy
projects across Europe. This is framed within the context of the need to address climate
change and concerns over security of oil and gas supplies. Both of these have driven
European policy-makers to develop and implement a European energy policy. The European
Commission has set ambitious targets for all Member States through a Directive promoting
the use of energy from renewable sources (2009/28/EC), taken forward at Member State level
through a National Renewable Energy Action Plan (NREAP). Many coastal European States
have recognised that marine renewable energy developments will play a key role in meeting
their targets. This document presents the targets set by each State in their NREAP and
specifically identifies the level of ocean energy (tidal or wave) that would be required to meet
those targets. Offshore wind is included for comparative purposes. The NREAP targets are
supplemented by ocean energy objectives garnered from various other strategies and
roadmaps.
This report also addressed the future potential spatial footprint of wave energy developments.
The targets set in the NREAPs and other documented scenarios are used to calculate the
potential number and spatial extent of wave energy farms required, based on the current state
of the technology and operational experience. These predictions will provide an essential
contribution to future Maritime Spatial Planning (MSP) systems in EU Member States. The
final data section gives an overview of the wave energy development situation in Europe as of
early 2011, summarising the wave energy projects that have been tested in the sea to date,
those that are currently operational and those that are in the planning stage. These projects
range from demonstration type projects to examples of where full-scale devices have been
deployed or are planned for deployment in the near future. Information presented relates
primarily to the physical characteristics of the site and the technology type in place.
The catalogue concludes with a summary of the main findings from the above work. The
document is accompanied by an Annex, with information on devices that have been tested in
the sea since 1999, those that are currently operational and those that are in the planning
stage. The data contained in the catalogue will act as the foundation for many of the SOWFIA
Project‟s deliverables. Most imminently, an inventory of all available environmental impact
data collected, or in the process of collection, at each of the wave energy test centres listed
here will be developed.
This catalogue therefore provides a snapshot of the state of the wave energy industry in
Europe and its predicted development in the coming decade. It forms a baseline for
understanding the developments needed in technology, policy, funding and monitoring. This
is essential if the required European-wide device development and testing programmes,
technical support infrastructure, and streamlined consenting and permitting regimes are to be
developed to facilitate the growth of this industry. Throughout these processes, social,
environmental and economic impacts must be considered. The report has four aims: to
document the various targets set by coastal Member States for ocean energy; to determine the
spatial requirements for these; to provide a methodology for progressing the technology; and
to outline the devices that have been tested in the sea since 1999 and those that are in the
planning stage.

I+D+i 3
Contents 1 Introduction ........................................................................................................................ 4
1.1 Rationale ..................................................................................................................... 4
1.2 Structure ..................................................................................................................... 4 1.3 Terminology ............................................................................................................... 5
2 Targets ................................................................................................................................ 7 2.1 Legal context .............................................................................................................. 7 2.2 Importance of renewables ........................................................................................ 11
2.3 Progress to date ........................................................................................................ 11 2.4 Strategic Environmental Assessment (SEA) ............................................................ 27 2.5 Discussion ................................................................................................................ 30
3 Spatial planning requirements for anticipated wave energy developments ..................... 33
3.1 Context ..................................................................................................................... 33 3.2 Wave farms needed .................................................................................................. 33 3.3 Spatial footprint of wave farms ................................................................................ 35
4 Progressing Wave Energy ................................................................................................ 37 4.1 Advancing to commercial scale ............................................................................... 37
4.1.1 Five Stage Development Schedule ..................................................................... 37 4.1.2 Support infrastructure ......................................................................................... 39
4.2 Wave energy test centres, pilot zones and commercial projects .............................. 39 4.3 Analysis .................................................................................................................... 47
4.4 Conclusions .............................................................................................................. 50 5 References ........................................................................................................................ 51 6 Wave Energy Test Centres Annex ................................................................................... 57
6.1 Full-scale test centres ............................................................................................... 58
6.2 Large-scale test centres ............................................................................................ 71 6.3 Demonstration sites .................................................................................................. 76 6.4 Other demonstrations ............................................................................................... 82

I+D+i 4
1 Introduction
1.1 Rationale
The objective of this catalogue is to provide context for the future development of wave
energy. This is achieved by identifying the level of ocean energy that could be introduced in
order to achieve the targets set by Member States, what progress has been made to date in this
regard, what is needed by 2020, the timeframe associated with achieving this set of targets,
and what this will look like in reality. To do this, the document is presented in four key
sections, followed by an Annex of physical and technical data.
1.2 Structure
Following this general introduction, the second section presents the targets set by EU Member
States to achieve their renewable energy obligations under European law. The options
presented here are derived not only from the National Renewable Energy Action Plans
(NREAPs), but numerous other industry association roadmaps, government policies and
strategies as well as economic „think-tank‟ organisations. Some Member States, for example
Ireland, had set targets for ocean energy prior to the legal obligation to submit an NREAP to
the European Commission. Where this is the case, the associated targets are also presented in
this section. An emphasis is, however, placed upon the NREAPs as these are what respective
Member State governments have committed to do. It should be noted from the outset that
while there is a legal obligation on Member States to reach their renewable energy targets, the
path they choose to get there is discretionary and decided at the Member State level.
Where ocean energy1 has been explicitly included in an NREAP, this would suggest that there
is a firm Government commitment made to exploring this as a realistic option. Given that
ocean energy is still a nascent industry, some NREAPs do not specifically include ocean
energy as a mechanism to achieve their targets. Where this is the case, recourse has been
made to the other sources of information. The numbers put forward in these other sources are
described here as „scenarios‟ to avoid confusion with the legally binding targets. This section
also presents a brief synopsis of the Strategic Environmental Assessment (SEA) work that has
been conducted in some Member States in relation to ocean energy development plans, as the
information contained and knowledge garnered from these experiences will be essential in
progressing development of the sector in an environmentally acceptable and sustainable
manner. This section of the document therefore highlights the level of effort and commitment
that each country has made in order to achieve the ambitious European 2020 targets.
The third section of the report utilises the targets and scenarios derived from the documents
reviewed in the previous section to calculate the potential number and spatial extent of wave
energy farms needed to meet the anticipated wave energy scenarios, based on the current state
of the technology and operational experience. This will be important for the future
development of Maritime Spatial Planning (MSP) systems in EU Member States. As a
relatively new industry, little is known or accepted about the actual footprint a wave energy
1 The NREAP template produced by the European Commission for use and completion by individual Member
States refers to „ocean energy‟ which is taken to include ocean current, wave and tidal.

I+D+i 5
farm would have. Examples of arrays from various technologies are presented here for
illustration purposes.
The fourth section summarises the wave energy projects that have been tested in the sea since
1999, those that are currently operational and those that are in the planning stage. These
projects range from test or demonstration type projects to examples of where full-scale
devices have been deployed or planned for deployment in the near future. Information
presented relates primarily to the physical characteristics of the site and the technology type in
place. This section originally gave an overview of the actual situation in Europe in early 2011.
An update of this section now gives an overview of the situation in Europe in September
2012.
The catalogue concludes with the main findings from the above work. The document is
complemented by an Annex, where all wave energy projects are listed with their main
features. The information contained in this catalogue will act as a basis for further work
during the lifespan of the SOWFIA project.
This catalogue, and the broader work to be undertaken within the SOWFIA project, is
premised on the fact that, to achieve the ambitious wave energy targets already set out, a
European wide comprehensive device development and testing programme is required,
together with an extensive technical support infrastructure and a consenting and permitting
regime that will facilitate the device deployment process. Such a regime must also be
cognisant of the local and regional social, environmental and economic conditions and must
proceed in a sustainable manner. The report has four aims: to document the various targets set
by coastal Member States for ocean energy; to determine the spatial requirements for these; to
provide a methodology for progressing the technology; and to outline the devices that have
been tested in the sea since 1999 and those that are in the planning stage.
1.3 Terminology
In this document a distinction is made between wave energy farms, parks, test sites and other
locations. The International Electrotechnical Commission (IEC) has a Technical Committee
(TC114) that continues to work on accepted terminology for marine energy. While the
nomenclature has not yet been fully agreed upon, the following definitions, put forward by the
IEC, will be used within this document (IEC, in press):
Array - farm of marine energy converters arranged specifically so as to enhance energy
capture;
Farm - group of similar marine energy converters of the same type (either WECs or TECs)
sharing a connection to the electric grid;
Park - a designated geographical region containing one or more marine energy farms;
As noted by the IEC-TC114 farm spacing will normally be dictated by installation, mooring
and access requirements (IEC, in press).
The terms test site, pilot zone, pre-commercial and commercial are not defined in the IEC
terminology document, however, for the purposes of this catalogue they are defined as
follows:

I+D+i 6
Test site – a location to test solo prototypes, or small arrays, of wave energy devices. These
locations tend to be environmentally benign and may accommodate one or more devices of
different technology types at any one time, depending on berth availability and capacity. Test
sites may or may not be grid-connected as they are intended, first and foremost, to prove
operational concepts.
Pilot zone - is usually a single, coherent zone to concentrate activities, facilitate baseline
studies, monitoring activities and the construction of associated infrastructure. These tend to
be grid connected and operate on a „one-stop-shop‟ basis where licensing and permitting have
been streamlined. They can accommodate device demonstrations as well as pre-commercial
and commercial scale devices.
Pre-commercial – an area with a higher installed capacity per technology and an appropriate
term of a licence/lease. These areas are grid connected and have the potential to become
commercial scale sites through time.
Commercial – large scale farms of devices that have been suitably proved in test and sea
conditions and are ready to supply the market. These areas are grid-connected. In a
commercial site a long term lease is usually granted and an appropriate feed-in-tariff agreed.
Large-scale test centre – a national or regional centre established for the testing of pre-
prototype (not full-scale) devices, circa 1:4.
Full-scale test centre - a national or regional centre established for the testing of prototype
devices circa 1:1.
Demonstration site – variable scale of devices; not an official national or regional test centre.
Device developers and/or project proponents utilise these sites and may previously have used
large and/or full scale test centres.

I+D+i 7
2 Targets
2.1 Legal context
The need to address climate change, and concerns over security of supply, has driven
European policy-makers to develop and implement a European energy policy. In 2009, the
European Commission set ambitious targets for all Member States through a Directive on the
promotion of the use of energy from renewable sources (2009/28/EC). This requires the EU to
reach a 20% share of energy from renewable sources by 2020 and a 10% share of renewable
energy specifically in the transport sector. The Directive requires Member States to submit
National Renewable Energy Action Plans (NREAPs) that establish pathways for the
development of renewable energy sources, to the Commission by June 2010.
The NREAPs were prepared in accordance with a template published by the Commission and
provide detailed roadmaps of how each Member State expects to reach its legally binding
2020 target for the share of renewable energy in their final energy consumption. Member
States must also set out the sectoral targets, the technology mix they expect to use, the
trajectory they will follow and the measures and reforms they will undertake to overcome the
barriers to developing renewable energy. Table 1 shows the share of energy from renewable
sources that Member States consumed in 2005 along with the targets for 2020.
It should be noted that the 2020 targets specified in Table 1, for coastal Member States of the
EU, are legally binding on those Member States. The path or mix that a Member States selects
to meet these targets is of their own choosing and not binding. The fact that some States have
chosen to achieve their targets through the inclusion of ocean energy could however suggest a
desire, and more importantly, act as a driver at the national level to progress ocean energy
development.
Table 1 National overall share and targets for the proportion of energy from renewable
sources in gross final consumption of energy in 2020 (Source: Member State NREAPs)
Member State
Share of energy from renewable
sources in gross final
consumption of energy, 2005
Target for share of energy
from renewable sources in
gross final consumption of
energy, 2020
Belgium 2.2% 13%
Denmark 17.0% 30%
France 10.3% 23%
Germany 5.8% 18%
Greece 6.9% 18%
Ireland 3.1% 16%
Italy 5.2% 17%
Portugal 20.5% 31%
Spain 8.7% 20%
Sweden 39.8% 49%
The Netherlands 2.4% 14%
United Kingdom 1.3% 15%

I+D+i 8
Estimation of total contribution (installed capacity, gross electricity generation) expected from
ocean (wave and tidal) and offshore wind to meet the binding 2020 targets and the indicative
interim trajectory for the shares of energy from renewable resources in electricity for the
period between 2010-2014 is presented in Table 2. Offshore wind is included for comparative
purposes. From this it is clear that there will be little or no contribution from wave and tidal
energy between now and 2015.
Table 2 Estimation of total contribution (installed capacity, gross electricity generation)
expected from ocean (wave and tidal) and offshore wind to meet the binding 2020
targets and the indicative interim trajectory for the shares of energy from renewable
resources in electricity for 2010-2014 (Source: Member State NREAPs)
Member State Source 2010
(MW)
2011
(MW)
2012
(MW)
2013
(MW)
2014
(MW)
Belgium Tide, Wave, Ocean n/a n/a n/a n/a n/a
Offshore wind n/a n/a n/a n/a n/a
Denmark Tide, Wave, Ocean 0 0 0 0 0
Offshore wind 661 756 856 1256 1256
France Ocean current, wave, tidal 240 240 256 271 287
Offshore wind 5542 6830 7598 8512 9572
Germany Tide, Wave, Ocean 0 0 0 0 0
Offshore wind 150 432 792 1302 2040
Greece Tide, Wave, Ocean 0 0 0 0 0
Offshore wind 0 0 0 0 0
Ireland1 Tide, Wave, Ocean (a)
(b)
0
0
0
0
0
0
0
0
0
0
Offshore wind (a)
(b)
36
36
36
36
36
36
252
252
252
252
Italy Tide, Wave, Ocean 0 0 0 0 0
Offshore wind 0 0 0 100 129
Portugal Tide, wave, ocean 5 5 5 10 35
Offshore wind 0 0 0 0 0
Spain Tide, wave, ocean 0 0 0 0 0
Offshore wind 0 0 0 0 50
The
Netherlands
Tide, Wave, Ocean 0 0 0 0 0
Offshore wind 228 228 228 465 940
United
Kingdom
Tide, wave, ocean 0 0 0 0 0
Offshore wind 1390 1980 2650 3470 4450
1 Both a modelled and a non-modelled scenario are presented in the NREAP for Ireland. Figures (a) relate to the
modelled scenario and figures (b) are from the non-modelled scenario. The non-modelled scenario is an „export‟
scenario illustrating Ireland‟s potential to become a net exporter if the appropriate conditions (economic,
technical and environmental) existed. It could be considered as aspirational.
I+D+i 9
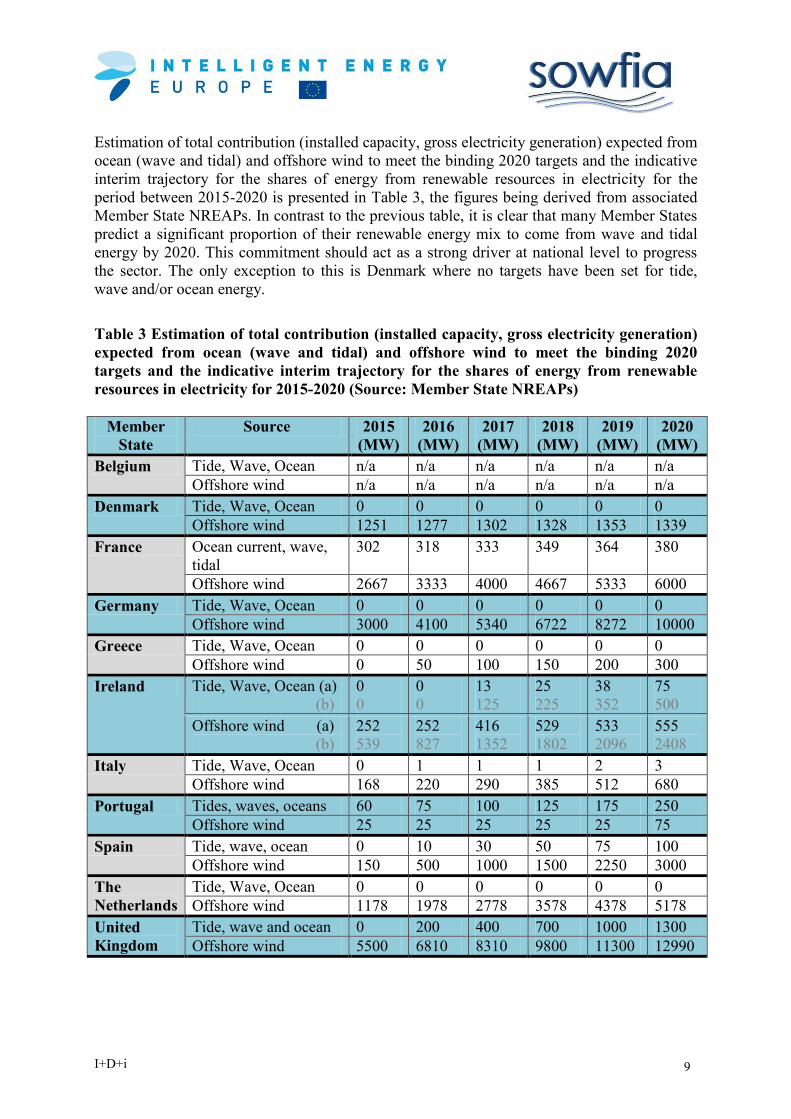
Estimation of total contribution (installed capacity, gross electricity generation) expected from
ocean (wave and tidal) and offshore wind to meet the binding 2020 targets and the indicative
interim trajectory for the shares of energy from renewable resources in electricity for the
period between 2015-2020 is presented in Table 3, the figures being derived from associated
Member State NREAPs. In contrast to the previous table, it is clear that many Member States
predict a significant proportion of their renewable energy mix to come from wave and tidal
energy by 2020. This commitment should act as a strong driver at national level to progress
the sector. The only exception to this is Denmark where no targets have been set for tide,
wave and/or ocean energy.
Table 3 Estimation of total contribution (installed capacity, gross electricity generation)
expected from ocean (wave and tidal) and offshore wind to meet the binding 2020
targets and the indicative interim trajectory for the shares of energy from renewable
resources in electricity for 2015-2020 (Source: Member State NREAPs)
Member
State
Source 2015
(MW)
2016
(MW)
2017
(MW)
2018
(MW)
2019
(MW)
2020
(MW)
Belgium Tide, Wave, Ocean n/a n/a n/a n/a n/a n/a
Offshore wind n/a n/a n/a n/a n/a n/a
Denmark Tide, Wave, Ocean 0 0 0 0 0 0
Offshore wind 1251 1277 1302 1328 1353 1339
France Ocean current, wave,
tidal
302 318 333 349 364 380
Offshore wind 2667 3333 4000 4667 5333 6000
Germany Tide, Wave, Ocean 0 0 0 0 0 0
Offshore wind 3000 4100 5340 6722 8272 10000
Greece Tide, Wave, Ocean 0 0 0 0 0 0
Offshore wind 0 50 100 150 200 300
Ireland Tide, Wave, Ocean (a)
(b)
0
0
0
0
13
125
25
225
38
352
75
500
Offshore wind (a)
(b)
252
539
252
827
416
1352
529
1802
533
2096
555
2408
Italy Tide, Wave, Ocean 0 1 1 1 2 3
Offshore wind 168 220 290 385 512 680
Portugal Tides, waves, oceans 60 75 100 125 175 250
Offshore wind 25 25 25 25 25 75
Spain Tide, wave, ocean 0 10 30 50 75 100
Offshore wind 150 500 1000 1500 2250 3000
The
Netherlands
Tide, Wave, Ocean 0 0 0 0 0 0
Offshore wind 1178 1978 2778 3578 4378 5178
United
Kingdom
Tide, wave and ocean 0 200 400 700 1000 1300
Offshore wind 5500 6810 8310 9800 11300 12990
I+D+i 10
According to the European Renewable Energy Council (2011), ocean energy will represent
0.15% of electricity consumption in 2020. The Council states that installed capacity is
expected to increase from 245 MW in 2010 to 2,543 MW in 2020. It should be noted however
that 240 MW of that 245 MW installed capacity can be solely attributed to the Rance tidal
power station in France. The EREC Roadmap states that, overall, the NREAPs are “rather
satisfying” with respect to ocean energy, considering that the main Member States active in
the industry have set firm targets and thus reaffirmed their willingness to invest in and
develop these new technologies (EREC, 2011). The Roadmap highlights that Denmark is the
only exception as it has not set a target for the ocean energy sector.
In terms of implementation of the Renewable Energy Directive (2009/28/EC), under Article
4(5), the European Commission will evaluate the NREAPs, and the adequacy of the measures
contained therein, in relation to reaching the 2020 target. The European Commission may
then issue a recommendation in response to a NREAP. Infringement proceedings may also
commence before the European Court of Justice for certain failures such as failure to produce
a credible NREAP, failure to implement all aspects of the Directive, significant deviation
from the plan or trajectory or valid complaints from any EU citizen regarding incorrect
implementation or enforcement by Member States.
Articles 22 and 23 of the Directive prescribe the reporting to be carried out by Member States
and the Commission respectively. In 2011, Member States will begin to report every two
years on progress they have made in reaching their national objectives, as contained in the
NREAPs. The European Commission will then report on progress made in achieving the
objectives of the over-arching Renewable Energy Directive every alternate year, beginning in
2012. Member States who fail to reach their biannual milestones must submit an amended
NREAP by June of the following year. In 2018, the Commission will present a Renewable
Energy Roadmap for the post-2020 period. This may be accompanied by proposals for the
period after 2020 and will take into account the experience of the implementation of the
Directive and technological developments in energy from renewable sources (Article 23(9)).
In November 2010, the European Commission adopted the Communication “Energy 2020 - A
strategy for competitive, sustainable and secure energy” (COM(2010) 639 final). The
Communication sets out the steps which are required to deliver the EU‟s medium term policy
objectives. This strategy puts forward a range of initial policy decisions which will be needed
to meet Europe‟s 2020 energy objectives as they currently stand. The new energy strategy
focuses on five priorities:
1. Achieving an energy-efficient Europe;
2. Building a truly pan-European integrated energy market;
3. Empowering consumers and achieving the highest level of safety and security;
4. Extending Europe's leadership in energy technology and innovation;
5. Strengthening the external dimension of the EU energy market.
Various scenarios in terms of energy mix will be presented in the forthcoming energy
roadmap 2050, which will describe ways of achieving the EU‟s long-term decarbonisation
goal and their implications for energy policy decisions.
I+D+i 11
2.2 Importance of renewables
Renewable sources of energy are essential alternatives to fossil fuels. Their use reduces
greenhouse gas emissions, diversifies energy supply and reduces dependence on unreliable
and volatile fossil fuel markets (in particular hydrocarbons such as oil and gas). Ocean energy
has the potential to be an important component of Europe‟s renewable energy mix, as part of
its longer term energy strategy.
Wave energy has the largest potential in Europe and worldwide and can be captured in a
number of different ways through the use of different converters such as point absorbers,
attenuators, overtopping, oscillating wave surge convertors, and oscillating water columns.
The Marine Institute and Sustainable Energy Ireland (2005) state that “Europe‟s accessible
wave power resource is calculated to be of the order of 320,000 MW with the highest resource
available near the west of Ireland”. The technology has not yet reached the stage of
commercial scale development but progress continues to be made as evidenced through the
growing number of test sites and pilot zones being established across Europe. Up to 50 types
of wave energy converters have been designed, but less than 20% have reached full scale
prototype stage. Wave energy has many advantages over other forms of renewable energy,
being much more predictable than, for instance, wind, giving more scope for short term
planning of grid usage.
2.3 Progress to date
Numerous Member States are aware of the opportunities surrounding the use of this resource
and consequently have established specific targets for wave and tidal energy, separate to the
NREAPs above. The associated objectives, in terms of installed capacity, are commonly put
forward in „roadmaps‟ and associated „action plans‟:
A Roadmap can be defined as a long term strategic planning tool focused on R&D and
business investments to accelerate technology development.
An Action Plan is a specific series of steps taken to accomplish a specified goal. An
action plan generally includes steps, milestones, indicators of progress, responsibilities
and time frame for delivery.
Action plans and roadmaps can be produced and published by any interested body or potential
stakeholder in the industry. For this reason, it is important to specifically identify from where
the action plan, roadmap or strategy derives as, arguably, this can give its contents more
credibility. In this catalogue a range of action plans, roadmaps and strategies have been
sourced, consulted and analysed. The following section of this catalogue seeks to provide an
overview of these texts and help make sense of the hundreds of pages of distilled information
and advice within them:
Who wrote the action plan, roadmap and/or strategy
What are the objectives?
What are the key targets?
What are the issues to be resolved?
What recommendations and actions are put forward?

I+D+i 12
For convenience the documents are organised according to region (European) and Member
State (SOWFIA project partner country), in alphabetical order, along with a few examples
from other jurisdictions. The document descriptions are colour-coded by genesis, according to
the legend in Table 4. No dedicated strategy, road map document or similar exists for ocean
energy in Portugal or Sweden so those countries have been omitted from this section.
Table 4 Colour codes used in this section
Category Colour code
Industry associations
National Governments,
public bodies, semi-
State agencies
Research Centres
Others e.g. forums etc.
It should be noted that under EU law, a Strategic Environmental Assessment (SEA) is
required for plans and programmes prepared or adopted by an authority (at national, regional
or local level) and required by legislative, regulatory or administrative provisions.1
Accordingly many ocean energy development plans and strategies are subject to an SEA,
which aims to identify the likely significant effects of the proposed plan/programme on the
environment and reasonable alternatives to the proposed plan/programme. This information is
contained in a dedicated „Environmental Report‟ which can be a useful reference document
for strategic level environmental information. A list of pertinent SEAs for ocean energy
development across Europe is included here for reference only and will be the focus of more
attention later in the SOWFIA project. In the context of this catalogue, it is the development
plan or strategy that is of most relevance as it is these documents which should identify a
development path to achieve both national and European renewable energy targets.
1 It should be noted that an SEA does not preclude the requirement for a site-level Environmental Impact
Assessment.
I+D+i 13
Europe
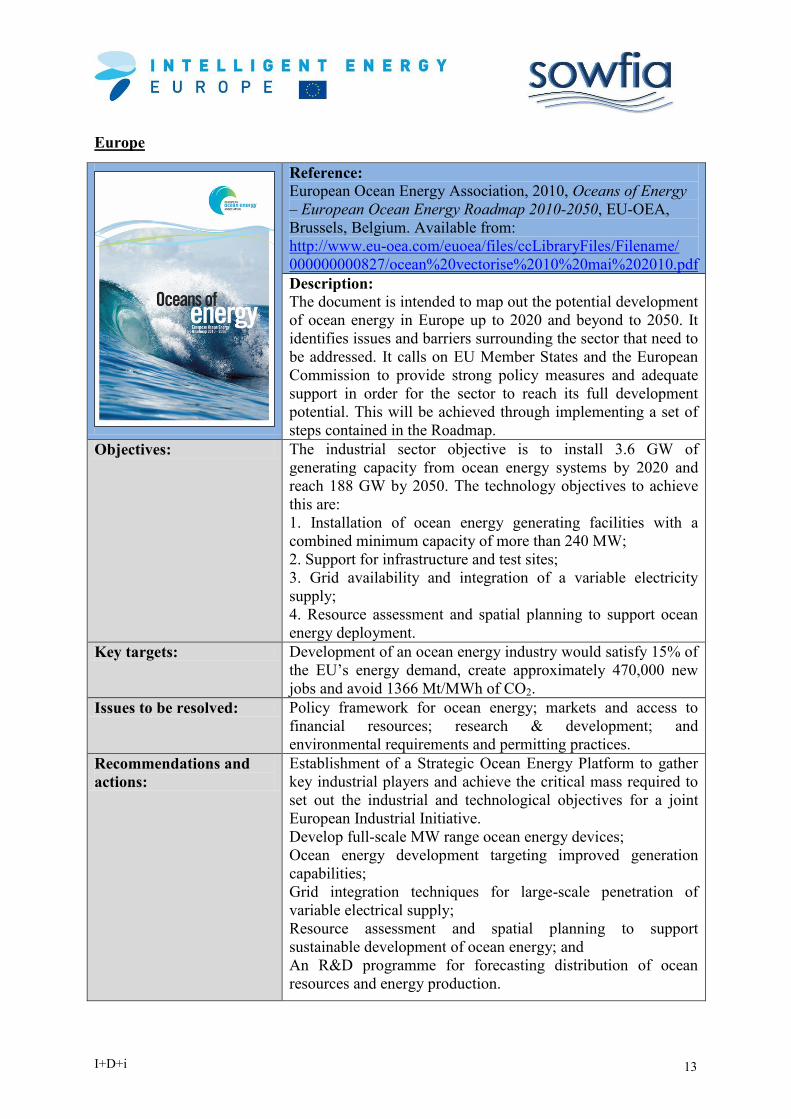
Reference:
European Ocean Energy Association, 2010, Oceans of Energy
– European Ocean Energy Roadmap 2010-2050, EU-OEA,
Brussels, Belgium. Available from:
http://www.eu-oea.com/euoea/files/ccLibraryFiles/Filename/
000000000827/ocean%20vectorise%2010%20mai%202010.pdf
Description:
The document is intended to map out the potential development
of ocean energy in Europe up to 2020 and beyond to 2050. It
identifies issues and barriers surrounding the sector that need to
be addressed. It calls on EU Member States and the European
Commission to provide strong policy measures and adequate
support in order for the sector to reach its full development
potential. This will be achieved through implementing a set of
steps contained in the Roadmap.
Objectives: The industrial sector objective is to install 3.6 GW of
generating capacity from ocean energy systems by 2020 and
reach 188 GW by 2050. The technology objectives to achieve
this are:
1. Installation of ocean energy generating facilities with a
combined minimum capacity of more than 240 MW;
2. Support for infrastructure and test sites;
3. Grid availability and integration of a variable electricity
supply;
4. Resource assessment and spatial planning to support ocean
energy deployment.
Key targets: Development of an ocean energy industry would satisfy 15% of
the EU‟s energy demand, create approximately 470,000 new
jobs and avoid 1366 Mt/MWh of CO2.
Issues to be resolved: Policy framework for ocean energy; markets and access to
financial resources; research & development; and
environmental requirements and permitting practices.
Recommendations and
actions:
Establishment of a Strategic Ocean Energy Platform to gather
key industrial players and achieve the critical mass required to
set out the industrial and technological objectives for a joint
European Industrial Initiative.
Develop full-scale MW range ocean energy devices;
Ocean energy development targeting improved generation
capabilities;
Grid integration techniques for large-scale penetration of
variable electrical supply;
Resource assessment and spatial planning to support
sustainable development of ocean energy; and
An R&D programme for forecasting distribution of ocean
resources and energy production.

I+D+i 14
France
The two documents presented here are of relevance as they refer to French targets for marine
energy which cannot be traced to any other policy document. They should not, however, be
analysed to the same extent as the dedicated strategies from other countries.
Reference:
Ifremer, 2008, Les énergies renouvelables marines - Synthèse
d’une étude prospective à l’horizon 2030, Ifremer, Brest,
France. Available from: http://wwz.ifremer.fr/institut_eng/content/download/39242/536346/
file/Ifremer_synthese-etude-prospective-EnRM.pdf
Description:
In March 2007 the President of Ifremer launched a forward-
thinking study on marine renewable energy by 2030 with
numerous French partners representing major stakeholders
including government departments, industry, research institutes
and specialised agencies.
Objectives: The objective of this work was to provide some answers to
three questions: what technologies produce energy from the
marine environment; what socio-economic conditions are
needed for their development and competitiveness and what are
the respective impacts of these technologies on energy and the
environment. The work has led a range of contrasting possible
futures.
Reference:
Grenelle de la Mer, 2009, Blue Book Commitments of the
Oceans Round Table. Ministry for Ecology, Energy,
Sustainable Development and Marine Affairs, Paris, France.
Available from:
http://www.legrenelle-
environnement.fr/IMG/pdf/Livre_bleu_anglais_web.pdf
Description:
The document contains the outcomes of the first meeting of the
Oceans Round Table (July 2009) chaired by the French
Minister for Ecology, Energy, Sustainable Development and
Marine Affairs. It forms part of the broader Environment
Round Table. Topics discussed include Marine Protected
Areas, ecosystem health, plans for vessels and ports of the
future, integrated ocean and coastal management and a „Blue
Plan‟ for Marine Energy.

I+D+i 15
Objectives: The Grenelle de la Mer or Oceans Round Table is France‟s
response to the EU‟s Integrated Maritime policy. It conveys the
Government‟s decision to commit to new methods of
production, exploitation, and protection and use of maritime
areas on the basis of strong governance that will unite all those
involved.
Key targets: One of France‟s objectives is that by 2020, 23% of all energy
consumed will be generated from renewable sources (50% in
the overseas territories and 30% in Mayotte), which
presupposes increasing the production of renewable energy by
20 million TOE by 2020.
Summary of progress to
date
In March 2009, the Ministry for Ecology, Energy, Sustainable
Development and Marine Affairs requested five Préfets
Coordonnateurs to identify favourable sites and carry out an
individual consultation with a view to delivering a plan in
September 2009 relating to the establishment of deep sea wind
turbines off the coast. This led to a strengthening of the
national partnership initiative for the emergence of marine
energy (IPANEMA), financing of test centres open to
researchers working on all aspects of marine energy
development, and encouraged the development of floating
wind turbine technology, which may be more socially and
environmentally acceptable.
It was recognised that marine energy cannot develop
independently of other types of renewable energy and
consequently it was decided to reserve a place for marine
energy in the national energy package. This would also focus
on ensuring proportionality between marine and terrestrial
renewable energy and support the development of sources of
intermittent renewable energy (wave energy converters and
offshore wind farms) by pre-reserving a share (limit set by
decree) for intermittent energy in the power supplied to the
electricity network, and by systematically preparing risk-
benefit impact studies. It was also decided that the regulations
applicable to marine renewable energy needed clarification and
integration into the various levels of decision-making.

I+D+i 16
Ireland
Reference:
Sustainable Energy Ireland and Marine Institute, 2005, Ocean
Energy in Ireland, Submitted to the Department of
Communications, Marine & Natural Resources. Sustainable
Energy Ireland and Marine Institute, Dublin, Ireland. Available
from:
http://www.seai.ie/Renewables/Ocean_Energy/Ocean_Energy
_Strategy/Ocean_Energy_Strategy_Report_18082006.pdf
Description:
The Ocean Energy Strategy put forward a structured and
phased strategy of development supports to enable Ireland to
utilise its ocean energy resource within a decade. The strategy
was premised on the fact that Ireland had a target of supplying
13.2% of its electricity consumption from renewable sources
by 2010. The strategy recognised that targets were likely to
increase in the longer term and that this would require large
deployments of other forms of renewable energy, including
ocean energy.
Objectives: The objective of the strategy is to advance the speed at which
ocean energy technologies are deployed in Ireland by
increasing the capacity for research and development, both
within academic institutions and commercial entities
developing devices in Ireland. Phase 1 (2005 to 2007) focuses
on development by supporting product R&D and research
facilities. Phase 2 and 3 are pre-commercial phases, relating to
single device and 10MW array respectively, with the objective
of demonstrating the potential for a cost effective fully
functional wave energy converter operating in the Irish
electricity market. In Phase 4 large scale market deployment of
ocean energy is envisaged.
Key targets: In this document ocean energy was not expected to play a role
in meeting Ireland‟s targets until well after 2010.
Issues to be resolved: Technology development was identified as the critical issue for
ocean energy systems. Wave converters must be capable of
surviving extreme weather loading which may add to the cost
of the design. Maintenance costs may be high.
Recommendations and
actions:
A four phase strategy to capitalise on Ireland‟s ocean energy
resource was proposed with review procedures and decision
gates at the end of each phase. In order to implement the Ocean
Energy Strategy, an Advisory Group comprising relevant
parties was proposed together with a step-by-step
implementation plan. Dedicated funding was allocated for each
phase of the Strategy.
I+D+i 17
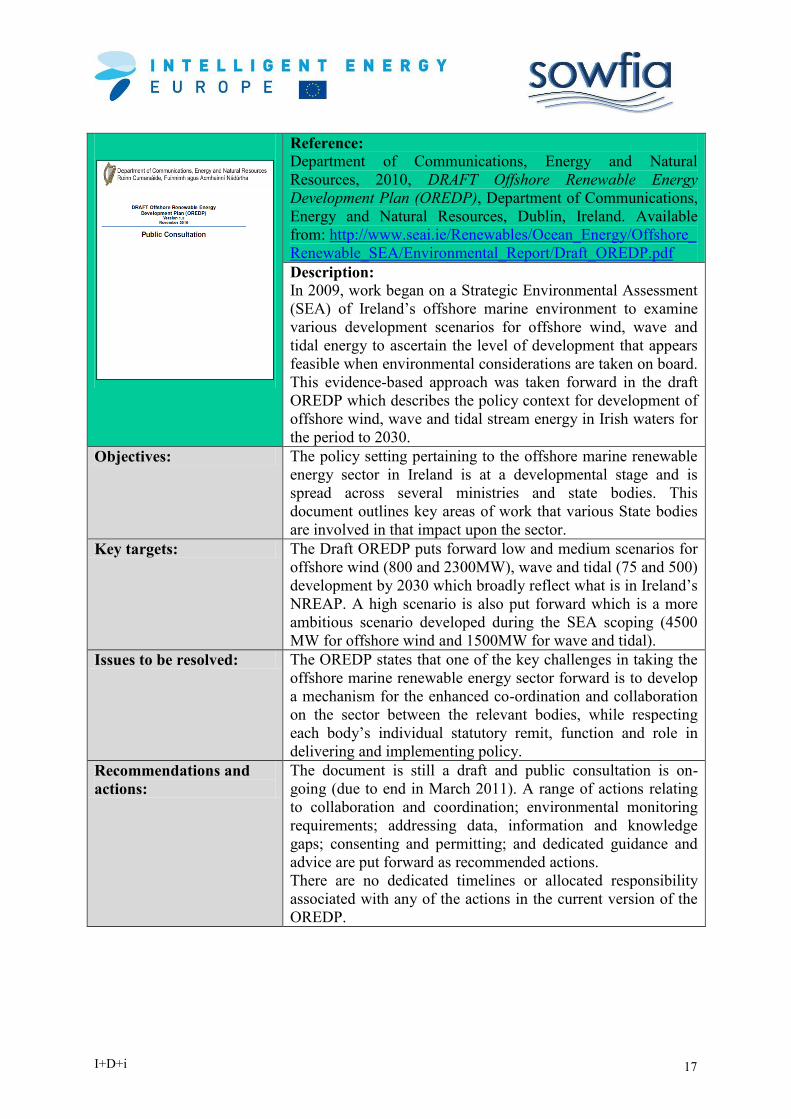
Reference:
Department of Communications, Energy and Natural
Resources, 2010, DRAFT Offshore Renewable Energy
Development Plan (OREDP), Department of Communications,
Energy and Natural Resources, Dublin, Ireland. Available
from: http://www.seai.ie/Renewables/Ocean_Energy/Offshore_
Renewable_SEA/Environmental_Report/Draft_OREDP.pdf
Description:
In 2009, work began on a Strategic Environmental Assessment
(SEA) of Ireland‟s offshore marine environment to examine
various development scenarios for offshore wind, wave and
tidal energy to ascertain the level of development that appears
feasible when environmental considerations are taken on board.
This evidence-based approach was taken forward in the draft
OREDP which describes the policy context for development of
offshore wind, wave and tidal stream energy in Irish waters for
the period to 2030.
Objectives: The policy setting pertaining to the offshore marine renewable
energy sector in Ireland is at a developmental stage and is
spread across several ministries and state bodies. This
document outlines key areas of work that various State bodies
are involved in that impact upon the sector.
Key targets: The Draft OREDP puts forward low and medium scenarios for
offshore wind (800 and 2300MW), wave and tidal (75 and 500)
development by 2030 which broadly reflect what is in Ireland‟s
NREAP. A high scenario is also put forward which is a more
ambitious scenario developed during the SEA scoping (4500
MW for offshore wind and 1500MW for wave and tidal).
Issues to be resolved: The OREDP states that one of the key challenges in taking the
offshore marine renewable energy sector forward is to develop
a mechanism for the enhanced co-ordination and collaboration
on the sector between the relevant bodies, while respecting
each body‟s individual statutory remit, function and role in
delivering and implementing policy.
Recommendations and
actions:
The document is still a draft and public consultation is on-
going (due to end in March 2011). A range of actions relating
to collaboration and coordination; environmental monitoring
requirements; addressing data, information and knowledge
gaps; consenting and permitting; and dedicated guidance and
advice are put forward as recommended actions.
There are no dedicated timelines or allocated responsibility
associated with any of the actions in the current version of the
OREDP.

I+D+i 18
Portugal
Reference:
Associação de Energias Renováveis (APREN). 2010. Roteiro
Nacional das Energias Renovaveis Aplicacao da Directiva
2009/28/CE (Versao Final). Associação de Energias
Renováveis, Lisboa, Portugal. Available from:
http://www.repap2020.eu/fileadmin/user_upload/Roadmaps/
roadmap_APREN_VFinal.pdf
Description:
This document was prepared by the Portuguese Renewable
Energy Association (APREN) as part of the European REPAP
2020 – Renewable Energy Policy Action Paving the way
towards 2020 project. The document outlines the past and
projected total final energy consumption in Portugal, and like
the NREAPs, covers both the transport and heating and cooling
sectors. Only the executive summary is available in English.
Objectives: This document was produced as part of the REPAP project and
has the objective of helping the drafting process of the National
Renewable Energy Action Plans (NREAP). This document
covers all the elements covered in the NREAP but from an
industry perspective.
Key targets: The projection set for tidal, wave and ocean energy in this
document is 300 MW installed by 2020. This is slightly higher
than the NREAP target of 250 MW.
Issues to be resolved: The main barriers to be overcome relate to the licensing
process. These include hastening the mechanisms to comply
with spatial plans, the implementation of a one-stop-shop, an
alteration to the composition and operation of the
Environmental Evaluation Committee and finally changes to
the rules concerning the granting of power connections. For
offshore technologies the document states that it is fundamental
to perform a characterisation campaign of the existing wave
and wind resources, open a funding scheme for these less
mature technologies and, of particular importance to wave
energy, to catalyse the “current stand-by situation of the pilot
zone”.
Recommendations and
actions:
APREN recommends that the renewable energy industry sector
take part in the choice of criteria and administrative procedures
to be adopted in the allocation of new power for each
technology. In terms of the current Feed-in-Tariffs, APREN
proposes the publication of a specific tariff for offshore wind
and geothermal power; an increase in the guarantee period for
solar technologies and a revision of the wave power tariff.

I+D+i 19
Spain
Reference:
Asociación de Productores de Energías Renovables (APPA).
2010. Hoja de ruta del sector de energías renovables en
España. APPA, Madrid, Spain. Available from:
http://www.repap2020.eu/fileadmin/user_upload/Roadmaps/
Hoja_de_ruta_de_EERR_APPA_Proyecto_REPAP_2020__
Junio_2010_.pdf
Description:
This document presents the vision of the Spanish renewable
energy sector on the development of renewable energy sources
(RES) in Spain to 2020, prepared by the Spanish Renewable
Energy Association (APPA), which represents all renewable
technologies. The goal of this “RES roadmap" is to provide the
Spanish government with a compendium of measures deemed
necessary to fulfil and surpass the RES targets for Spain in
2020 as laid down in the Directive 2009/28/EC. After a brief
summary of the current state of development, the roadmap
describes three different scenarios for their possible evolution
in Spain up to 2020: from a „business as usual‟ perspective to
an „accelerated deployment‟ scenario.
Objectives: This document was produced as part of the REPAP project and
has the objective of helping the drafting process of the National
Renewable Energy Action Plans (NREAP). This document
covers all the elements covered in the NREAP but from an
industry perspective, in this case the Spanish Renewable
Energy Association (APPA).
Key targets: The projection for tidal, wave and ocean energy in this
document is 1000 MW installed by 2020. This vastly exceeds
that proposed in the NREAP which has a target of 100 MW.
Issues to be resolved: Measures proposed in this document to achieve the objectives
include defining an action plan for the deployment of smart
grids, introducing micro-grids, promoting energy storage
technologies, giving priority and preference to renewable
energy sources regarding grid access, and establishing public
and transparent rules for the sharing/allocation of costs of
connecting renewable facilities to the grid taking into account
the related benefits.
Recommendations and
actions:
A dedicated Renewable Energy law should be adopted as soon
as possible and set out the targets and instruments necessary for
the fulfilment of the RES Directive commitments (including
dedicated timelines).
I+D+i 20
United Kingdom
Reference:
HM Government/DECC, 2010, Marine Energy Action Plan 2010 –
Executive Summary and Recommendations, HM Government,
London, England. Available from:
http://www.decc.gov.uk/en/content/cms/what_we_do/uk_supply/
energy_mix/renewable/explained/wave_tidal/funding/marine_
action_/marine_action_.aspx Description:
This document focuses on wave, tidal stream and tidal range
technologies and outlines the actions required by private and public
sectors to facilitate the development and deployment of marine
energy technology. It flags up the main barriers to moving the
industry forward into commercial deployment and considers what
needs to be done to overcome them. It sets out an agreed vision for
the marine energy sector to 2030. Work under the Action Plan was
split into five working groups: Technology Road-mapping;
Environment, Planning & Consenting; Finance & Funding;
Infrastructure, Supply Chain & Skills; and Tidal Range (which acted
as a subgroup to include all of these areas of focus).
Objectives: Five high level themes then emerged which focus on: the need to
prove the technology, particularly to stimulate long-term investor
confidence; providing the appropriate regulatory frameworks;
ensuring appropriate funding is in place for the sector (public and
private); co-operation and engagement across the sector and supply
chain; and the importance of interdependency of all these themes.
Key targets: This Government document agrees with the sectors own assessment
for wave and tidal stream that 1-2GW installed capacity could be
achieved by 2020. It is recognised in the Action Plan that this is
aspirational and challenging, but “broadly realistic if all stakeholders
are able to put in place the appropriate mechanisms to enable this
level of deployment”.
Issues to be resolved: Challenges identified relate to environment, planning and
consenting; finance and funding; infrastructure, supply chain and
skills as well as the broader need to prove technology. Technology
development and deployment will require measures to address the
underpinning generic technical challenges. These can be
summarized as: predictability, manufacturability, installability,
operability, scalability, survivability, reliability, and affordability.
Recommendations and
actions:
The Action Plan recommends that UK Government delivery partners
continue to support technology development (at both the device and
enabling technology level, throughout the RD&D cycle) in the
following areas: device and system demonstrators; device
components; guidelines and standards and tool development.
Create a representative strategic coordination group from all UK
States. DECC along with Action Plan members will compile the
findings of the initial phase of the Action Plan into a standalone
document to form the “Preliminary Findings Of The Marine Energy
Action Plan 2010”. DECC will also carry out an annual review,
update and revision of the Marine Energy Action Plan.

I+D+i 21
Reference:
UK Energy Research Centre, 2008, UKERC Marine (Wave and
Tidal Current) Renewable Energy Technology Roadmap – Summary
Report. UKERC, University of Edinburgh, Edinburgh, Scotland.
Available from: http://ukerc.rl.ac.uk/Roadmaps/Marine/Tech_
roadmap_summary%20HJMWMM.pdf
Description:
This document is a technology roadmap: it provides a guide for
mobilising the wave and tidal energy community in the UK down a
deployment pathway towards a target of achieving 2GW installed
capacity by 2020. While technically focused it also considers policy,
environmental and commercialisation aspects of the marine energy
sector, in order to display and put in context these wider influences.
The document was developed through consultation at four
workshops, as well as over 40 one-to-one interviews. The Roadmap
is underpinned by a vision statement, a deployment strategy,
commercial strategy and technical strategy.
Objectives: The roadmap is aimed at providing a focused and coherent approach
to technology development in the marine sector, whilst taking into
account the needs of other stakeholders. The objective of the
document is not to provide a definitive statement on the ultimate
route forward for the industry but rather to show how certain
deployment scenarios can be applied in the sector. It also details the
requirements and timescales involved in achieving them.
Key targets: The Road Map aims to assist the UK marine and renewable energy
community to exploit energy from waves and tidal currents in an
environmentally and socially responsible way, aiming for an
installed capacity of 2GW by 2020 in UK waters; to stimulate policy
and funding instruments to overcome barriers to deployment; to
establish a commercially viable industry supported by an extensive
supply chain and thereby build skills capacity at all levels and to
become competitive with other energy sources by 2020.
Issues to be resolved: Main challenges to deployment are predictability, manufacturability,
installability, operability, survivability, reliability, and affordability.
Each of these challenges is addressed in more detail in the
commercial and technical strategies, in which activities have been
prioritised to meet the deployment scenario. The challenges
identified relate very much to the technology, but it is recognised
that industrial infrastructure is a major challenge facing the sector.
This includes electrical, manufacturing, supply chain and human
resources. In relation to manufacturing, for example, it is stated that
to meet a target of 2GW by 2020 then by 2012, the sector needs to
be able to build 1 unit per week, ramping up to an average of around
4 per week by 2015 to meet the deployment requirements.
Recommendations and
actions:
The document does not contain recommendations per se but the
technical strategy is divided into 12 themes (Technology Working
Areas), which represent the technology development chain in marine
renewable devices and puts forward a rationale and qualified
detailed timelines for each of these. Timelines are accompanied by a
list of prioritised actions developed in consultation with the marine
community. These are very detailed and relate to technical aspects
and, consequently, are not presented here.

I+D+i 22
Scotland
Reference:
Forum for Renewable Energy Development in Scotland (Freds),
2009, Marine Energy Road Map, Freds Marine Energy Group
(MEG), Scotland. Available from:
http://www.scotland.gov.uk/Publications/2009/08/14094700/12
Description:
This document focuses on wave and tidal stream technologies. The
rationale for this focus is that Scotland has great potential for the
development of wave and tidal stream energy (with around 25% of
Europe‟s tidal stream resource and 10% Europe‟s wave resource).
This Road Map assesses the status and potential of the marine energy
industry in Scotland and proposes recommended actions to ensure its
continuing growth.
Objectives: This document sets out scenarios for growth of the industry, to build
on what has already been achieved in terms of public revenue
support for projects in Scotland, strengthening of test site facilities
(EMEC) and completion of an SEA for wave and tidal energy.
Existing road mapping work for the UK marine energy sector has
been based largely on “target” rather than “scenario” methodology,
the former suggesting a possible installed capacity of roughly 1 GW
of marine energy in Scottish waters by 2020. This document sets out
scenarios demonstrating a range of possible deployment pathways,
from low to more aspirational.
Key targets: The vision is to “create the world‟s leading marine energy industry,
one that will provide a substantial contribution to the sustainable
economy and environment of Scotland”. To do this, the Group
recognises that market opportunities for marine energy generation in
Scotland must be promoted and ensure that Scottish companies and
communities are well placed to capture these opportunities.
Issues to be resolved: The Road Map identifies five key issues which will need to be
addressed in order to realise the high growth scenarios. These relate
to finance, grid, planning, infrastructure/supply chain and the lack of
priority status given to the sector in European strategic energy policy.
The Road Map states that the pace of advancement for technologies
has not been as fast as predicted previously in 2004 (Scottish
Executive, 2004). This is attributed to the underestimation of some
technical challenges, as well as the fact that it took longer than
expected to set in place sufficient financial support streams.
Recommendations and
actions:
The document calls on the Scottish Government to launch an open
call with an increased budget and an annual allocation which
developers must “use or lose” within a 12-month window and should
also review the level of ROC banding for tidal stream. DECC are
asked to announce the criteria for the Marine Renewables Proving
Fund and an associated call for funding proposals. Finally a strategic
review of Scottish grid infrastructure for marine energy, identifying
longer-term grid infrastructure upgrades on the basis of expected
development locations, is needed.
MEG will continue with its work programme, set in the context of
the recommendations within this Road Map and undertake a review
of progress against these recommendations in Summer 2012.

I+D+i 23
Northern Ireland
Reference:
Department of Enterprise, Trade and Investment (DETI), 2009, Draft
Offshore Renewable Energy Strategic Action Plan 2009-2020, DETI,
Belfast, Northern Ireland. Available from:
http://www.offshorenergyni.co.uk/Data/Draft_Strategic_Action_Plan
Description:
This Strategic Action Plan (SAP) identifies a programme of enabling
actions which will be essential to the development of the marine
renewable energy resource. It includes actions to maximise the
market opportunities to Northern Ireland companies of the
development of offshore renewables. It also provides the framework
within which offshore renewable energy can be developed through a
competitive call, to be undertaken by The Crown Estate, for
commercial projects. An SEA has already been completed for this
Action Plan. This concluded that between 900 MW and 1200 MW of
capacity could be installed by 2020 from offshore wind and marine
renewables (tidal arrays) in Northern Ireland waters, without
significant adverse effects on the environment.
Objectives: The overall objective of this draft Strategic Action Plan is to optimise
the amount of renewable electricity generated from offshore wind
and marine renewable resources in Northern Ireland‟s waters (to
12M limit) in order to enhance diversity and security of supply,
reduce carbon emissions, contribute to the proposed renewable
electricity targets by 2020 and beyond and develop business and
employment opportunities for NI companies.
Key targets: To develop at least 600 MW of offshore wind and 300 MW from
tidal resources in Northern Ireland waters by 2020. This installed
capacity could equate to a contribution of over 50% towards the
proposed 40% renewable electricity target for 2020.
Issues to be resolved: Critical actions which will need to be addressed relate to the
electricity grid; infrastructure and supply chain; regulatory and
legislative frameworks and support regime.
Recommendations and
actions:
These relate specifically to the issues to be resolved above, e.g.
develop a reinforcement programme of the NI Grid; develop a
practical way forward with Republic of Ireland for handling offshore
renewable energy projects in waters in, around or adjacent to the
Border Bays and agree appropriate operational arrangements;
develop streamlined administrative guidance for developers and
officials on the licensing and consenting regimes for offshore
renewable energy projects and establish an Offshore Renewable
Energy Forum, building on existing cross-departmental group, to
engage with relevant external stakeholders.
The Plan will be reviewed in 2013-14 to inform decisions on future
policy and subject to an overall evaluation post 2020. In the interim,
DETI will produce an annual report on progress against the planned
actions and any revised plans coming forward.

I+D+i 24
Others
A search for marine renewable energy, ocean energy and wave energy strategies, roadmaps
and action plans for Canada, Mexico, Norway, Australia and New Zealand yielded no results
despite the fact that all of these countries are contracting parties to the International Energy
Agency‟s Implementing Agreement on Ocean Energy Systems (IEA-OES).
Norway has no special policies or programmes dedicated to ocean energy, but ocean energy is
included in more general renewable energy policies and programmes (IEA-OES, 2010).
Canada‟s efforts to date have focussed primarily on tidal energy though the development of a
Canadian Marine Renewable Energy Technology Roadmap which is expected to be publically
available in 2012 (IEA-OES, 2010).
Though there is no government programme specifically for ocean energy in Australia, the
Department of Resources, Energy, and Tourism has expressed a desire to see an Australian
ocean energy industry association established (IEA-OES, 2010). Some regional efforts at
State level are also underway, for example, in Western Australia and Tasmania. In 2010 the
Japanese Ocean Energy Association (OEA-J) developed a technology Roadmap for Ocean
Energy which includes targets for wave, current and tidal and ocean thermal energy
conversion (OTEC) but a copy of this could not be located for consideration in this document.
Relevant examples from the United States are presented below.
United States of America - national
Reference:
Thresher, R./National Renewable Energy Laboratory, 2010,
The United States Marine Hydrokinetic Renewable Energy
Technology Roadmap, National Renewable Energy Laboratory,
Golden, Colorado, U.S.A. Available from:
http://www.oceanrenewable.com/wp-
content/uploads/2010/05/1st-draft-roadmap-rwt-8april10.pdf
Description:
This roadmap is a working document to be used to facilitate the
coordinated development of marine renewable energy
technologies and to mobilize the deployment and use of these
technologies in the United States. It has a very similar structure
to the UKERC document, outlined above, containing a vision
statement, deployment, commercial and technical strategies. It
is focused primarily on the scientific and technical steps
necessary to overcome the barriers to the wide-spread use of
these renewable energy technologies. It contains both short
term and long term measureable goals, and agreed technical
pathways for meeting these goals. The roadmap was developed
through consultation with stakeholders through six meetings
involving approximately eighty participants.
Objectives: The vision is to establish a commercially viable marine
renewable energy industry that is supplied by a manufacturing
chain generating domestic jobs and to facilitate enactment of
policies that would make available the funding needed to
overcome the barriers and support the development of the

I+D+i 25
sector, incentivise early stage deployment, foster responsible
siting practices, and ensure sound environmental stewardship.
In terms of environmental studies the Roadmap proposes that
baseline studies be carried out before installation, impact
monitoring is carried out during construction, operational
impact monitoring continues after operation and additional
special studies are commissioned when needed. According to
the roadmap this would be carried out over six years.
Key targets: To deploy a total of 23 GW of combined marine renewable
energy capacity in an economically, environmentally, and
socially responsible manner by 2030. No specific target is set
for wave energy despite the fact that it is one of the
technologies explicitly considered in the Roadmap.
Issues to be resolved: Identified issues to be overcome are siting and permitting
barriers; environmental research needs; technical R&D issues;
policy issues; market development barriers; economics and
financial issues, and grid integration barriers. The document
notes that wave device development from the stage of concept
to ocean prototype testing can take 5 or more years, depending
on complexity.
Recommendations and
actions: The deployment, commercial and technical strategies are each
accompanied by detailed descriptions, scenarios and dedicated
timelines. Timelines are accompanied by a list of research
needs developed in consultation with the marine community.
The document concludes by stating that it is up to each
stakeholder to play their particular role by developing and
executing their plans and projects so that the vision and goals
are fulfilled over the next twenty years.
U.S.A. - Oregon
Reference:
Oregon Wave Energy Trust (OWET), (2010), A Blueprint for
Ocean Energy Development 2010-2015, Oregon Wave Energy
Trust, Portland, Oregon, U.S.A. Available from:
http://www.oregonwave.org/wp-content/uploads/OWET-
Blueprint-2010-2015-FINAL-web.pdf
Description:
This document is based on the outcomes of a Summit held in
2010 where there was open dialogue among developers,
utilities, and regulatory and policy leaders to develop a strategy
to advance ocean energy development in Oregon and the
Pacific Northwest of North America by 2015. Approximately
40 attendees gathered for two days of dialogue and
brainstorming sessions, information sharing, and discussion
about opportunities to advance the industry.
I+D+i 26
Objectives: This Blueprint captures the results of the Summit, identifies
goals for 2015, and recommends actions discussed at the
Summit. It also identifies existing barriers and proposed
solutions, and plans for actions to achieve the goals. OWET
intends for this Blueprint to be used as a focused action plan to
advance a responsible ocean energy industry.
Key targets: The Blueprint states that pilot and demonstration projects using
a phased approach to install 10-to-25 MW, in order to learn
more about the cumulative effects of ocean energy, is a realistic
and responsible development path that is sensitive to existing
users.
Issues to be resolved: The Summit attendees identified numerous issues, falling under
three key topics: connecting to the electrical grid, regulatory
and permitting processes and policies to encourage, finance,
and advance ocean energy development. For each barrier
presented, a range of proposed solutions are put forward. In
relation to environmental information the Blueprint recognises
that this is collected by individual projects and not necessarily
shared with others, resulting in duplicated efforts. The
proposed solution is to increase information sharing through
use of the Dept. of Energy‟s Knowledge Management System
and conduct more outreach events.
Recommendations and
actions:
After a review of the Summit outcomes, OWET developed a
list of priority actions representing the most advantageous and
achievable objectives. These relate to the electric grid,
regulatory and planning issues, and policy and finance. No
definite timelines are associated with any of the actions but it is
stated that OWET will „diligently work‟ on the priority actions.
I+D+i 27
2.4 Strategic Environmental Assessment (SEA)
A Strategic Environmental Assessment (SEA) involves the systematic identification and
evaluation of the impacts of a strategic action (e.g. a plan or programme) on the environment.
In other words it provides for strategic environmental information to be considered at an early
stage in the decision making process. SEAs tend to cover large geographical areas and the
plan/programme being assessed can include a range of different types of project relating to a
number of different broad areas for development, in contrast to an Environmental Impact
Assessment (EIA) which is site-specific and deals with only one project. An SEA focuses on
identifying the „likely‟ significance of „potential‟ effects, whereas an EIA deals with precise
effects and evaluated actual significance.
A number of jurisdictions have completed or are in the process of completing SEAs for the
development of marine renewables. The findings of the SEA can assist in guiding
development to areas where environmental effects are minimal or can be avoided. The
information collated, generated and documented as part of the SEA process often becomes the
first source of environmental information for developers when thinking about site selection
and project development, pointing developers to sources of further and more detailed
information. SEAs are not considered in detail in this catalogue but for reference purposes
information on SEAs carried out, key findings and where they are available from, are
presented in the Table below.
SOWFIA partner country SEA Details
France None available
Ireland
SEA on the Draft Offshore Renewable Energy
Development Plan currently in the final stages (public
consultation phase).
Coverage: all Irish waters from the Mean High Water Mark
out to the 200m water depth contour off the west and south
west coast of Ireland and the Irish Exclusive Economic
Zone off the north, east and south east coast of Ireland.
Finding: Overall, the SEA found that, based on the extent of
the available offshore renewable energy resource within
Irish waters, and the geographical scale of the overall study
area, that it would be possible to achieve a high scenario of
4,500MW from offshore wind and 1,500MW from wave
and tidal energy without likely significant adverse effects
on the environment. This is subject to a number of caveats
contained in the final SEA documents.
SEA Documentation available from:
http://www.seai.ie/Renewables/Ocean_Energy/Offshore_Re
newable_SEA/

I+D+i 28
Portugal None available
Spain SEA of the Spanish NREAP is currently underway. An SEA
for offshore wind energy was completed in 2009.
Sweden None available
Portugal None available
United Kingdom See individual jurisdictions detailed below.
England and Wales
SEA for Offshore Energy completed in 2011 on a draft
plan/programme to enable future renewable leasing for
offshore wind, wave and tidal devices and licensing/leasing
for seaward oil and gas rounds, hydrocarbon and carbon
dioxide gas storage.
Coverage: It covers parts of the UK Renewable Energy
Zone and the territorial waters of England and Wales; for
hydrocarbon gas and carbon dioxide storage it applies to
UK waters (territorial waters and the UK Gas Importation
and Storage Zone); and for hydrocarbon exploration and
production it applies to all UK waters.
Finding: The conclusion of the SEA is that the areas offered
for licensing and leasing should be restricted spatially
through the exclusion of certain areas together with a
number of mitigation measures to prevent, reduce and
offset significant adverse impacts on the environment and
other users of the sea.
SEA Documentation available from: http://www.offshore-
sea.org.uk/consultations/Offshore_Energy_SEA_2/index.ph
p
Scotland
SEA completed in 2007 on Freds MEG Roadmap.
Coverage: The study area covers the entire west and north
coast of Scotland from Shetland to the Solway Firth to a
distance of 12 nautical miles offshore.
Finding: between 1,000MW (wave & tidal, low scenario)
and 2,600MW (high scenario) generating capacity could
potentially be achieved within the SEA study area taking
into account environmental effects and depending on the
types of technology (including array density) deployed.
However, it should be noted that a large proportion of this
capacity is located in the Outer Isles, which are remote
from the mainland and would require longer cable routes to
shore.

I+D+i 29
SEA Documentation available from:
http://www.seaenergyscotland.net/SEA_Public_Environme
ntal_Report.htm
Northern Ireland
SEA completed in 2010 on Offshore Renewable Energy
Strategic Action Plan
Coverage: the full seaward extent of Northern Ireland
territorial waters from the mean high water mark to the 12
nautical mile limit. The study area extends from Lough
Foyle in the North to Carlingford Lough in the South, the
border bays with the Republic of Ireland (not formally
delineated).
Finding: the SEA concluded that between 900MW and
1200MW of electricity could be generated by 2020 from
offshore wind and tidal arrays in Northern Ireland waters,
without significant adverse effects on the environment. As
there is limited potential for wave energy, this technology
was excluded from the target setting in the related SAP.
SEA Documentation available from:
http://www.offshorenergyni.co.uk/EnvironmentalReport.ht
ml

I+D+i 30
2.5 Discussion
While most countries recognise the potential for wave energy in their surrounding waters,
relatively few of these have dedicated wave, or indeed ocean, energy strategies, plans or
roadmaps. Those that do exist derive from western European countries, around the Atlantic
arc. The obligation to produce a National Renewable Energy Action Plan (NREAP) by June
2010 has perhaps raised the profile of renewable energy development at Governmental level,
many of them containing explicit targets for wave and tidal energy. A summary table of
targets, derived from the preceding information on NREAPs, and scenarios contained in other
relevant documents are presented in Table 5.
Table 5 Summary table of targets from NREAPs and other documented scenarios to be
achieved by 2020
Country NREAP target
(wave, tidal)
(MW)
Ocean energy
scenarios (MW)
Europe (Total) n/a 36001
Denmark 0 5001
France 380 8001
Ireland 75
500
5001
Portugal 250 3001
0.4 – 3002
Spain 100 6001
Sweden 0 0
UK 1300 20001
Scotland n/a 13003
Northern Ireland n/a n/a4
1 European Ocean Energy Association, 2010.
2 WavEC Seminar. 2010.
3 Scottish Executive, 2004
4 The Northern Ireland Strategic Action Plan (DETI, 2009) only considers tidal energy at this time.
Denmark is the only country with no dedicated target for tidal, wave and ocean energy within
its NREAP. According to the EREC (2011) the Danish Government based its 2020
projections for renewable energy on a “frozen policy” scenario, meaning it is based on the
existing policy framework and legislation. While the Danish NREAP states that the over-
arching Danish target of 30% renewable energy by 2020 will be met, the EREC state that, for
the moment, the financial incentives are in general not high enough to encourage the
investment needed to reach the this 30% target (EREC, 2011). France has no dedicated road
map or strategy for marine renewable energy or wave energy specifically. The overall French
RES target of 23% was enacted in the Grenelle law of 3 August 2009 and each technology

I+D+i 31
target is enshrined in statutory texts1, yet ocean energy targets and scenarios are difficult to
trace to official documents.
In Portugal the projection set for tidal, wave and ocean energy in the industry document is 300
MW installed by 2020 (APREN, 2010). This is slightly higher than the NREAP target of 250
MW. The same is true for Sweden where the industry document has a projection of 100 MW
of installed capacity of tidal, wave and ocean energy by 2020 whereas the Swedish NREAP
has no target for tidal, wave and ocean energy.
In Spain, there are limited national targets for ocean energy or wave energy specifically at the
moment. The Institute for Diversification and Saving of Energy (IDAE), however, has
initiated the preparation of a new Renewable Energy Plan for the period 2011 – 2020 which
will include wave energy targets for the first time (IEA-OES, 2009). Regional Governments
of several areas (the Basque Country, Cantabria, Asturias, Galicia and the Canary Islands) are
promoting the installation of test facilities and demonstration projects. Two of them have set
targets on ocean energy so far: the Basque Country plans 5 MW of installed power by 2010,
and the Canary Islands consider 50 MW by 2015 (IEA-OES, 2009). In relation to wave
energy, the NREAP states that Spain is currently initiating the development of the first pilot
projects for harnessing wave energy, with different prototypes. These will be in the
demonstration phase for the next few years but it is expected that by 2016 the best technology
to capture energy from the sea will become apparent. This, in turn, will allow commercial
development of the sector with the launch of the first commercial plants becoming operational
after this time.
In the United Kingdom, a range of documents all of which have implications for the
development of renewable energy, and to a lesser extent wave energy, have been published in
recent years. The UK NREAP was published on 1 July 2010, shortly after the election of a
new Government in May. While the NREAP includes the new government‟s commitments,
some decisions have not been made on key outstanding issues. The Department of Energy and
Climate Change announced a reduction in, and effectively capped the anticipated spend on,
feed-in tariffs in October 2010. The Government will publish a detailed report in April 2011
looking at the deployment of renewables post 2020 out to 2030 and 2050 (EREC, 2011).
It is difficult to ascertain with any certainty how realistic the various targets and scenarios are
for ocean energy. Part of this is due to the fact that in none of the documents reviewed is
ocean energy expressly divided into wave and tidal components with corresponding targets
for each. For countries with Atlantic Ocean coastlines, it is more than likely that the majority
of their ocean energy will be provided by wave energy and not tidal. Another explanation is
the fact that both wave and tidal technologies have not yet reached the commercial scale so
their ability to reach the anticipated targets cannot yet be determined.
A review and analysis of ocean energy systems development and supporting strategies,
published by the IEA-OES in 2006, recognised that at that time there had not been sufficient
demonstration of full-scale prototypes to prove that the technologies work. The review states
that this is fundamental and the key barrier preventing deployment of ocean energy
technologies and must be tackled to ensure that research, development and demonstration
progresses to the pre-commercial stage of demonstrating multiple devices in farms (IEA-OES,
2006). Arguably this is still the case and may explain why not every coastal European country
has an ocean, wave or tidal development strategy or roadmap.
1 Programmations pluriannuelles des investissements.
I+D+i 32
Related research initiatives may help address this issue. In Europe, for example, the FP7
funded Off-shore Renewable Energy Conversion platforms Coordinated Action (ORECCA)1
project aims to create a framework for knowledge sharing and to develop a roadmap for
research activities in the context of offshore renewable energy. In particular, the project will
stimulate collaboration in research activities leading to innovative, cost efficient and
environmentally benign offshore renewable energy conversion platforms for wind, wave and
other ocean energy resources.
The next section of this report endeavours to quantify how many wave energy farms are
needed to reach the 2020 objectives. This will assist developers, planners and regulators, as
well as the wider community, to appreciate the level of effort required to achieve these
targets. It will also be of fundamental use in developing a Maritime Spatial Planning (MSP)
system. MSP is a planning process that enables integrated, forward-looking, and consistent
decision-making on the human uses of the sea, and in doing so facilitates sustainable
development (Ehler and Douvere, 2009). The European Commission have advocated that
Member States develop an MSP system for their maritime domain and many are already
progressing with this, for example, Belgium, Germany and Portugal. It is important that, as a
new and developing industry, the wave energy sector can move towards documenting its
likely future spatial requirements.
1 See http://www.orecca.eu/
I+D+i 33
3 Spatial planning requirements for anticipated wave energy developments
3.1 Context
This part of the catalogue utilises the targets derived from the national NREAPs and
ambitious industry documents (reviewed in the previous section) to calculate the potential
number and spatial extent of wave energy farms needed to meet the documented scenarios.
Currently, some jurisdictions are in the process of developing and implementing dedicated
Maritime Spatial Plans for marine renewable energy, for example, Marine Scotland‟s
Maritime Spatial Planning (MSP) work on Pentland Firth and Orkney Waters (Scottish
Government/Marine Scotland, 2009) and Sweden where MSP will be operational in 2012.
MSP is seen as a mechanism for the sustainable management of marine activities and
increased protection of the marine environment and natural resources. Consequently the
European Commission have advocated its use at Member State level and the MSP process
will form a specific area of activity for Government departments and agencies in the near
future.
MSP must consider all maritime sectors simultaneously and planning for a single
development sector in isolation (such as wave energy) contradicts one of the fundamental
aims of marine spatial planning. Most maritime sectors, however, are firmly established and
their coverage or areas of use well known and documented. This is not the case for wave
energy as it is still in the development phase. Accordingly, it would be helpful to explore the
potential number of wave energy farms needed to achieved the desired capacity and calculate
the spatial area a wave energy farm is likely to occupy.
3.2 Wave farms needed
All the documents reviewed as part of this work combine wave and tidal energy into ocean
energy. Consequently it is not possible to emphatically state what proportion of renewables
will be derived from wave energy by 2020. Based on the potential wave resource around the
western European arc it is probable that the greater proportion of ocean energy will be derived
from wave energy in countries such as Ireland, the UK and Portugal where there is a greater
wave resource than tidal resource. For the purposes of this work, the numbers put forward in
the EU-OEA‟s Oceans of Energy Roadmap (2010) and the NREAPs have been used. To
calculate the amount of farms needed, a number of presumptions have been made here:
1. Developers anticipate wave farms will comprise of between 10 to 250 devices for a
full-scale commercial generating station. In this example an early stage wave energy
farm composed of 20 devices of 1 MW capacity is used.
2. The figures from the EU-OEA‟s Oceans of Energy Roadmap (2010) have been used
here. In this catalogue it is presumed that all ocean energy will come from wave
energy to provide the maximum amount of sea space that could be required:
Europe: 4700 MW;
Denmark: 500 MW;
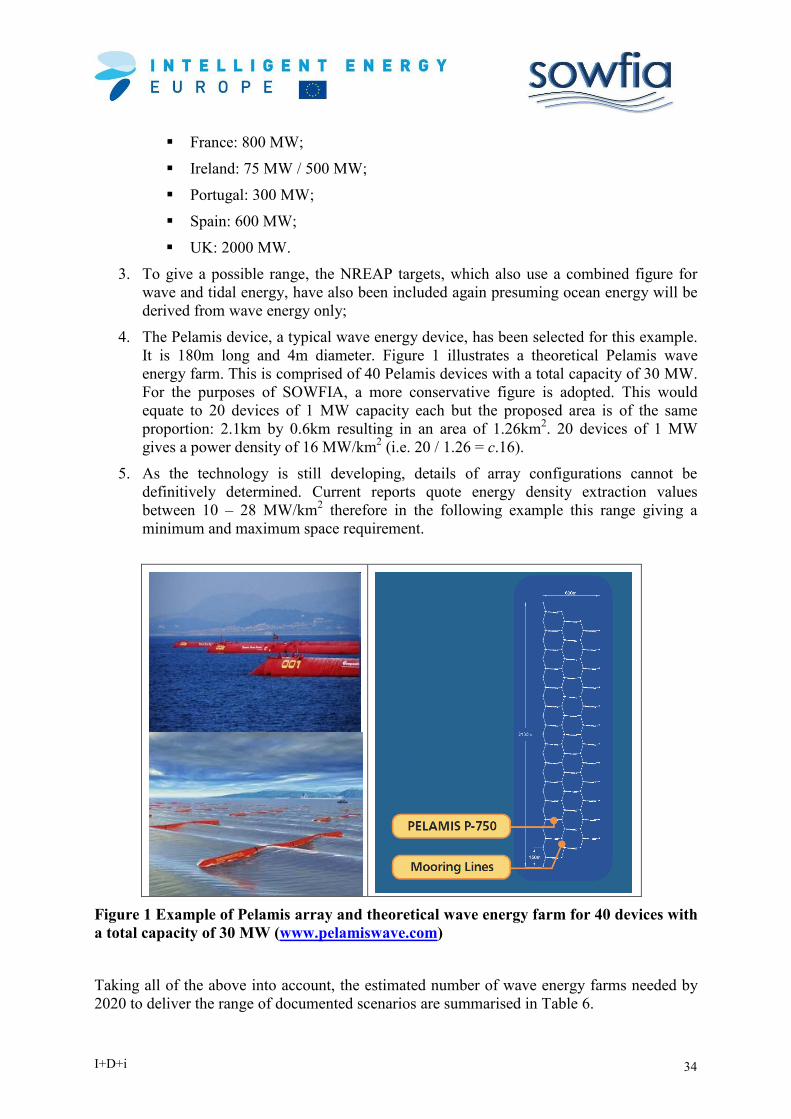
I+D+i 34
France: 800 MW;
Ireland: 75 MW / 500 MW;
Portugal: 300 MW;
Spain: 600 MW;
UK: 2000 MW.
3. To give a possible range, the NREAP targets, which also use a combined figure for
wave and tidal energy, have also been included again presuming ocean energy will be
derived from wave energy only;
4. The Pelamis device, a typical wave energy device, has been selected for this example.
It is 180m long and 4m diameter. Figure 1 illustrates a theoretical Pelamis wave
energy farm. This is comprised of 40 Pelamis devices with a total capacity of 30 MW.
For the purposes of SOWFIA, a more conservative figure is adopted. This would
equate to 20 devices of 1 MW capacity each but the proposed area is of the same
proportion: 2.1km by 0.6km resulting in an area of 1.26km2. 20 devices of 1 MW
gives a power density of 16 MW/km2 (i.e. 20 / 1.26 = c.16).
5. As the technology is still developing, details of array configurations cannot be
definitively determined. Current reports quote energy density extraction values
between 10 – 28 MW/km2 therefore in the following example this range giving a
minimum and maximum space requirement.
Figure 1 Example of Pelamis array and theoretical wave energy farm for 40 devices with
a total capacity of 30 MW (www.pelamiswave.com)
Taking all of the above into account, the estimated number of wave energy farms needed by
2020 to deliver the range of documented scenarios are summarised in Table 6.

I+D+i 35
Table 6 Wave energy farms needed if 2020 targets for wave energy are achieved
Country NREAP
targets (MW)
EU-OEA
figures (MW)
Wave energy
farms (20 MW)
10 MW/km2
Min./Max.
Wave energy
farms (20 MW)
28 MW/km2
Min./Max.
Denmark 0 500 0/50 0/18
France 380 8001 38/80 14/29
Ireland 75 500 7.5/50 3/18
Portugal 250 300 25/30 9/11
Spain 100 600 10/60 4/22
UK 1300 2000 130/200 47/72
TOTAL 210.5/470 95/170
On the basis of the above hypotheses, to achieve the objectives described, it would be
necessary to install and operate between 95 and 470 wave energy farms in Europe by 2020
depending on the installed capacity and wave energy density. The UK targets are much more
ambitious than those put forward by the EU-OEA for Europe as a whole. For the UK, a total
of 47-200 wave energy farms of 20 MW (or pro rata for larger farms) would be required by
2020. The remainder of the countries listed could potentially contribute to the European target
at a lower rate. Theoretically France will need to install a minimum of 14 farms or a
maximum of 80 farms; Spain 4-60 (min.-max.) farms, Denmark 18-50 farms, Ireland 3-50
farms and Portugal would require a minimum of 9 and a maximum of 30 wave energy farms.
3.3 Spatial footprint of wave farms
To calculate the spatial extent or footprint of a wave energy farm is difficult as it will depend
on the technology being deployed. Similarly, different technologies will have different
spacing and mooring requirements which will again have consequences for the sea area
occupied. Local, regional, national and international regulations and legislation usually
require a buffer zone to be created around any farm development for the purposes of
navigational safety. Equally international best practice on cable protection suggests that a
buffer of 500m should be created around any cables or pipelines to prevent damage from
navigational activities such as shipping and fishing practices.
None of the aforementioned factors can yet be definitely expressed but will still need to be
considered in planning the development and management of wave farms. In future this is
likely to take place within a dedicated Maritime Spatial Planning system, so this information
has the potential to assist in that process.
The results for each country are presented in Table 7.
1 This figure includes Le Rance tidal power station which has an installed capacity of 240MW.
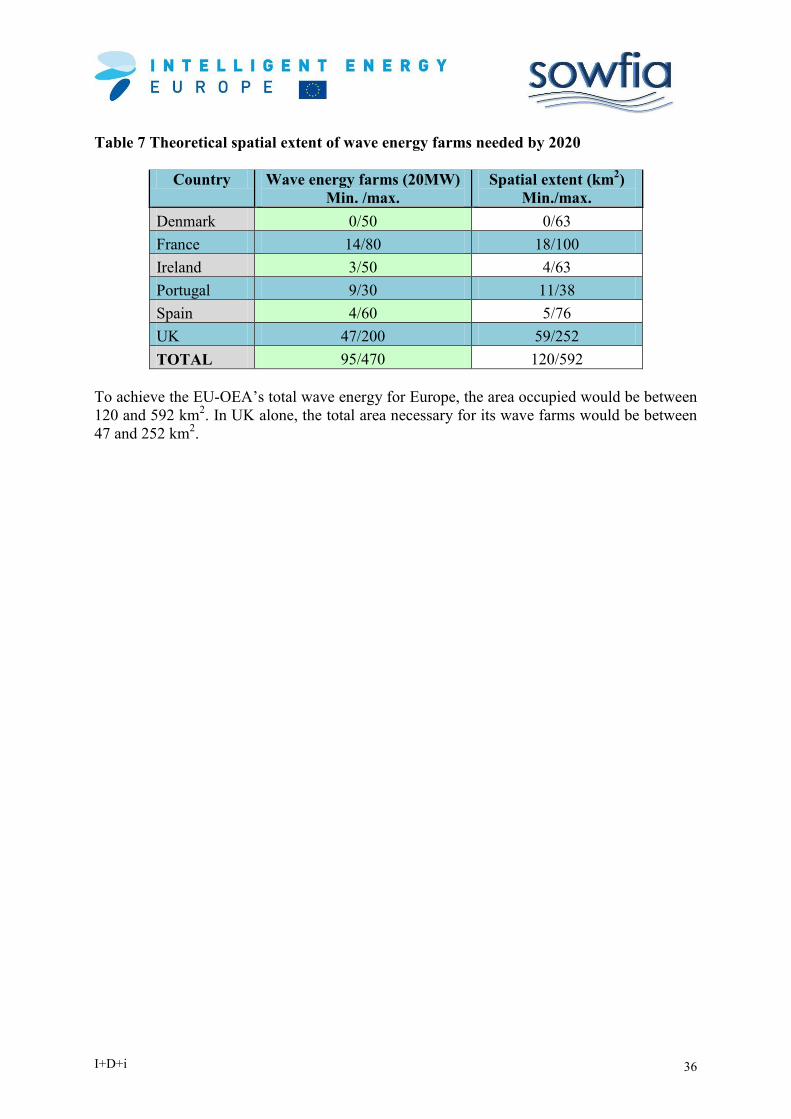
I+D+i 36
Table 7 Theoretical spatial extent of wave energy farms needed by 2020
Country Wave energy farms (20MW)
Min. /max.
Spatial extent (km2)
Min./max.
Denmark 0/50 0/63
France 14/80 18/100
Ireland 3/50 4/63
Portugal 9/30 11/38
Spain 4/60 5/76
UK 47/200 59/252
TOTAL 95/470 120/592
To achieve the EU-OEA‟s total wave energy for Europe, the area occupied would be between
120 and 592 km2. In UK alone, the total area necessary for its wave farms would be between
47 and 252 km2.

I+D+i 37
4 Progressing Wave Energy
4.1 Advancing to commercial scale
In order to achieve the ambitious targets set out by national governments and industry
associations outlined in the previous sections, two important elements must be put in place.
These are:
1. A structured funding plan based on the International Energy Association‟s Ocean
Energy Systems (IEA-OES) five stage development schedule;
2. A support infrastructure where companies may quickly and efficiently test their
concepts and devices, at a range of stages, from proof of concept, through pre-
production to pre-commercial scale.
4.1.1 Five Stage Development Schedule
While substantial knowledge has been gained on the requirements for extracting energy from
ocean waves, at the current stage of technical advancement, the development of wave energy
devices still requires a cautious and measured methodology to be followed. Commercial scale
wave energy can only become a reality following full scale testing of wave energy converters
at sea and it is essential that the correct engineering procedures are followed leading up to the
first sea trials. The most efficient and effective means of doing this is to proceed according to
the Stage Gate development programme. The principle behind this is to sequence design
development so that the required knowledge is obtained at different stages to facilitate safe
transmission along a course of increasing technical complexity and investment requirements.
This approach is now becoming accepted as the best practice and is being formalised in a
document under production by the Annex II of the Ocean Energy Systems Implementing
Agreement (IEA, 2009).
To accommodate all requirements a five-stage schedule has evolved as the optimum for the
development of wave energy devices. Figure 2 shows the overall structure of the programme.
Device development should not be regarded as a straight line process and feedback loops and
repetition of stages should be expected. The five stages basically align with small (1:50 -
100); medium (1:10 - 25); large (1:3 - 8) and full (1:1 - 2) scale models that can be tested
initially in hydraulic laboratories and, at later stages, in the open sea conditions.
Stages 3 to 5 occur in open water conditions. There is a growing agreement that before full
scale pre-production prototype WECs are built and deployed, a large scale unit in the region
of 1:4 scale, should be tested at a benign outdoor site, which happens at Stage 3. At this stage,
sea states are lower, the test sites involve shorter boat trips and the support services required
(harbours, support vessels etc) are more readily available. The technical motivation is that it is
very difficult to bench test the device‟s assembled sub-systems so this approach enables the
machine to become a serviceable test rig. To reduce the fiscal risk it is recommended that this
phase is conducted at an established test site, where licensing and permitting issues together
with environmental requirements may be addressed as part of the test site‟s facilities.
Prototype scale testing commences in Stage 4. Here the device must progress from a pre-
production to a pre-commercial machine. The device to be tested at this level would be at, or
close to, full size but still a solo machine. The budget required for this scale of testing and the
duration of testing both increase significantly in line with the sheer scale of operations.
Essentially during this stage, testing should verify the overall design to individual component
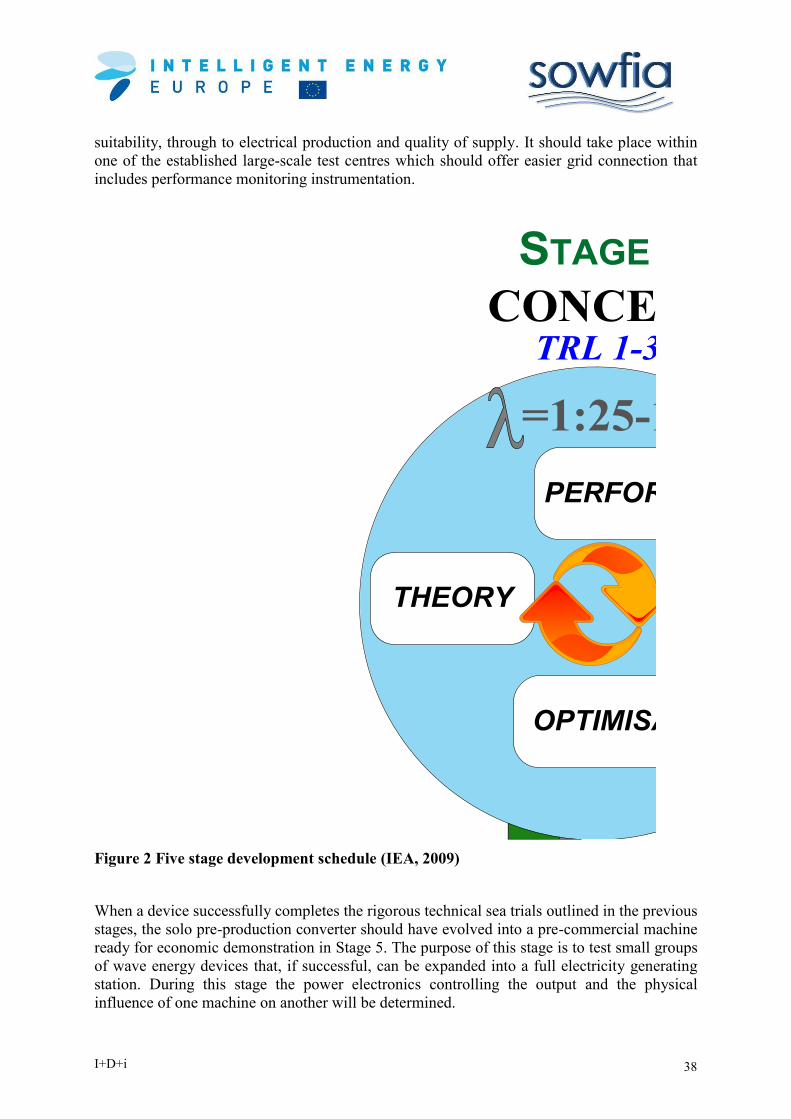
I+D+i 38
suitability, through to electrical production and quality of supply. It should take place within
one of the established large-scale test centres which should offer easier grid connection that
includes performance monitoring instrumentation.
Figure 2 Five stage development schedule (IEA, 2009)
When a device successfully completes the rigorous technical sea trials outlined in the previous
stages, the solo pre-production converter should have evolved into a pre-commercial machine
ready for economic demonstration in Stage 5. The purpose of this stage is to test small groups
of wave energy devices that, if successful, can be expanded into a full electricity generating
station. During this stage the power electronics controlling the output and the physical
influence of one machine on another will be determined.
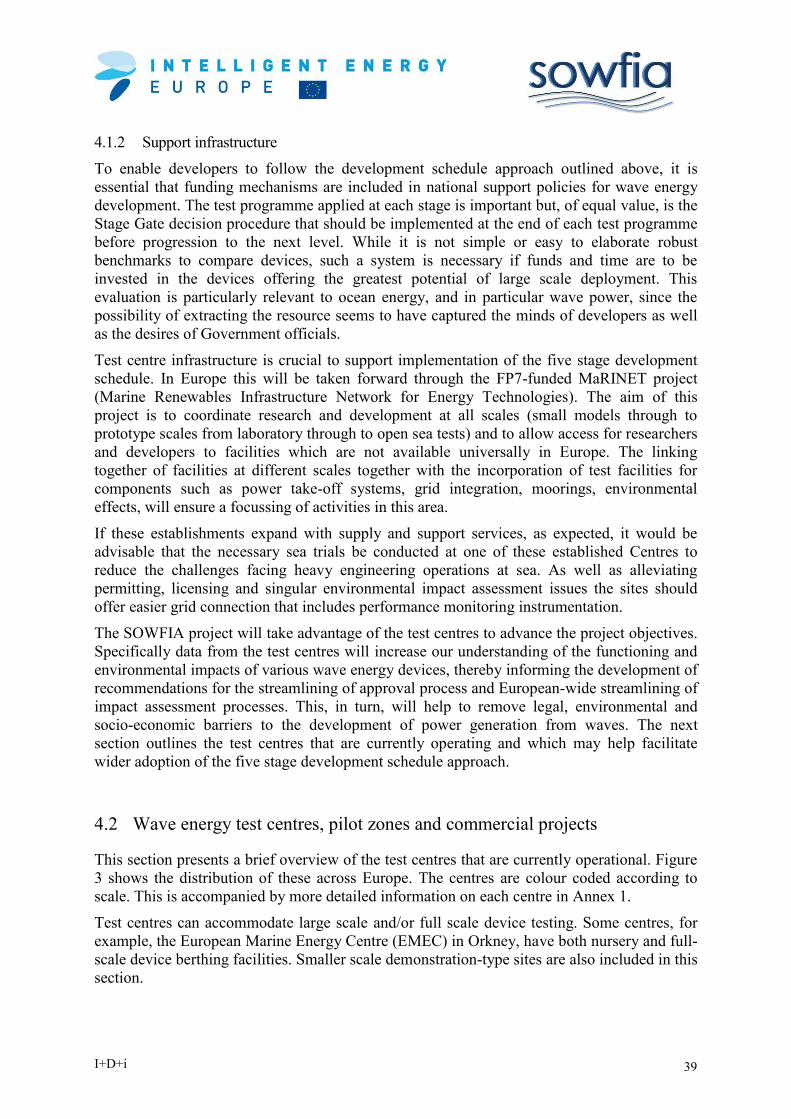
I+D+i 39
4.1.2 Support infrastructure
To enable developers to follow the development schedule approach outlined above, it is
essential that funding mechanisms are included in national support policies for wave energy
development. The test programme applied at each stage is important but, of equal value, is the
Stage Gate decision procedure that should be implemented at the end of each test programme
before progression to the next level. While it is not simple or easy to elaborate robust
benchmarks to compare devices, such a system is necessary if funds and time are to be
invested in the devices offering the greatest potential of large scale deployment. This
evaluation is particularly relevant to ocean energy, and in particular wave power, since the
possibility of extracting the resource seems to have captured the minds of developers as well
as the desires of Government officials.
Test centre infrastructure is crucial to support implementation of the five stage development
schedule. In Europe this will be taken forward through the FP7-funded MaRINET project
(Marine Renewables Infrastructure Network for Energy Technologies). The aim of this
project is to coordinate research and development at all scales (small models through to
prototype scales from laboratory through to open sea tests) and to allow access for researchers
and developers to facilities which are not available universally in Europe. The linking
together of facilities at different scales together with the incorporation of test facilities for
components such as power take-off systems, grid integration, moorings, environmental
effects, will ensure a focussing of activities in this area.
If these establishments expand with supply and support services, as expected, it would be
advisable that the necessary sea trials be conducted at one of these established Centres to
reduce the challenges facing heavy engineering operations at sea. As well as alleviating
permitting, licensing and singular environmental impact assessment issues the sites should
offer easier grid connection that includes performance monitoring instrumentation.
The SOWFIA project will take advantage of the test centres to advance the project objectives.
Specifically data from the test centres will increase our understanding of the functioning and
environmental impacts of various wave energy devices, thereby informing the development of
recommendations for the streamlining of approval process and European-wide streamlining of
impact assessment processes. This, in turn, will help to remove legal, environmental and
socio-economic barriers to the development of power generation from waves. The next
section outlines the test centres that are currently operating and which may help facilitate
wider adoption of the five stage development schedule approach.
4.2 Wave energy test centres, pilot zones and commercial projects
This section presents a brief overview of the test centres that are currently operational. Figure
3 shows the distribution of these across Europe. The centres are colour coded according to
scale. This is accompanied by more detailed information on each centre in Annex 1.
Test centres can accommodate large scale and/or full scale device testing. Some centres, for
example, the European Marine Energy Centre (EMEC) in Orkney, have both nursery and full-
scale device berthing facilities. Smaller scale demonstration-type sites are also included in this
section.

I+D+i 40
FaB Test
Figure 3 Location of the wave energy test centres and demonstration sites across
Europe.

I+D+i 41
Table 8 European test centres and demonstration sites of various scales (Adapted from Waveplam, 2008) Country Location Name Est’d Seabed
Area
Water
Depth
Energy
Flux
Dist. to
shore
Port/Harbour
Distance
Stage Grid
Connectio
n
Facilities Devices
FULL SCALE TEST CENTRES Denmark
Roshage Pier,
Hanstholm
DanWEC 2009 1 km2 12m 5 kW/m 200m Hanstholm, 1.5
km
3/4 Yes Access Pier Wave Star (in
place)
Dexawave (in
place) England
St. Ives Bay,
Cornwall
WaveHub 2010 8 km2 50m –
65m
~20kW/m 16 km Plymouth, 160 km
Falmouth, 100 km
St. Ives, 9 km
4/5 Yes, 11kV at
present,
33kV
planned
Wave buoys
4 berths
OE Buoy
(planned)
France
Le Croisic,
Pays de la
Loire
SEMREV 2007 1 km2 35m 14.4 kW/m 15 km Le Croisic, 18km 4/5 Yes, 20kV Wave buoys
3 berths
Ireland
Belmullet,
Co. Mayo
Atlantic Marine
Energy Test
Site (AMETS)
In
planning
since
2009
Area A:
10.5km2
Area B:
6.5km2
50m –
120m
50 kW/m 7 km Galway City,
190km
Killybegs, 125 km
4/5 Yes, 10kV
planned
Wave buoys,
4 berths
planned
Norway
Runde Island,
Runde, west
Norway
Runde
Environmental
Centre
2008 30-50m 500m 25 km SW of
Aalesund
3/4 Yes, 22kV Pier Seabased (in
place)
Portugal
Figueira da
Foz
Portuguese
Pilot Zone
2007 320 km2
30m –
90m
32 kW/m 5-8 km Leixoes, 148 km
Peniche, 63 km
Fig. da Foz, 37
km
4 Yes
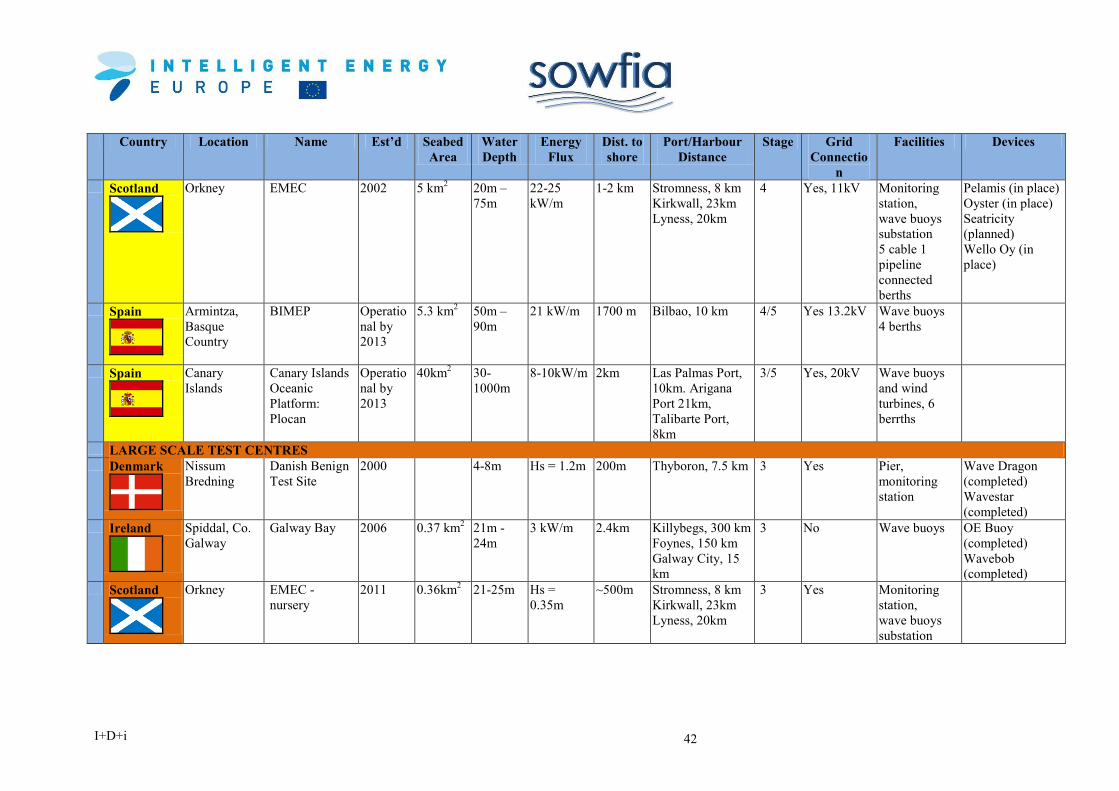
I+D+i 42
Country Location Name Est’d Seabed
Area
Water
Depth
Energy
Flux
Dist. to
shore
Port/Harbour
Distance
Stage Grid
Connectio
n
Facilities Devices
Scotland
Orkney EMEC 2002 5 km2 20m –
75m
22-25
kW/m
1-2 km Stromness, 8 km
Kirkwall, 23km
Lyness, 20km
4 Yes, 11kV
Monitoring
station,
wave buoys
substation
5 cable 1
pipeline
connected
berths
Pelamis (in place)
Oyster (in place)
Seatricity
(planned)
Wello Oy (in
place)
Spain
Armintza,
Basque
Country
BIMEP Operatio
nal by
2013
5.3 km2 50m –
90m
21 kW/m 1700 m Bilbao, 10 km 4/5 Yes 13.2kV Wave buoys
4 berths
Spain
Canary
Islands
Canary Islands
Oceanic
Platform:
Plocan
Operatio
nal by
2013
40km2 30-
1000m
8-10kW/m 2km Las Palmas Port,
10km. Arigana
Port 21km,
Talibarte Port,
8km
3/5 Yes, 20kV Wave buoys
and wind
turbines, 6
berrths
LARGE SCALE TEST CENTRES Denmark
Nissum
Bredning
Danish Benign
Test Site
2000
4-8m Hs = 1.2m 200m Thyboron, 7.5 km 3 Yes Pier,
monitoring
station
Wave Dragon
(completed)
Wavestar
(completed) Ireland
Spiddal, Co.
Galway
Galway Bay 2006 0.37 km2 21m -
24m
3 kW/m 2.4km Killybegs, 300 km
Foynes, 150 km
Galway City, 15
km
3 No Wave buoys OE Buoy
(completed)
Wavebob
(completed) Scotland
Orkney EMEC -
nursery
2011 0.36km2 21-25m Hs =
0.35m
~500m Stromness, 8 km
Kirkwall, 23km
Lyness, 20km
3 Yes Monitoring
station,
wave buoys
substation

I+D+i 43
Country Location Name Est’d Seabed
Area
Water
Depth
Energy
Flux
Dist. to
shore
Port/Harbour
Distance
Stage Grid
Connectio
n
Facilities Devices
England
Falmouth
Bay,
Cornwall
FaB Test 2011 2km2 20-50m Unavailabl
e
3-5km Falmouth, 5km 3 No 3 berths Fred Olsen BOLT
Lifesaver (In
place)
DEMONSTRATION SITE Portugal
Pico Is.
Azores
Pico Test Plant 1999 -- ~10m 13.4 kW/m -- Peniche, 1600 km
Horta, 16km
3/4 15kV Grid
Connection
1 Substation PICO OWC (in
place)
Portugal
Aguçadoura
Aguçadoura
Wave Farm
2007
40-50m 32 kW/m 5 km Peniche, 240 km
Leixoes, 32 km
Monserrate, 25
km
5 Yes Wave Buoys
Substation
3 berths
Pelamis (Ended)
Portugal
Peniche
Peniche test site 2007 2km2
15-20m 30 kW/m 0.5 km Peniche
3/4 No n/a Waveroller (In
place)
Spain
Basque
country
Mutriku 2011 n/a <10m 4.8 kW/m
(summer)
18kW/m
(winter)
onshore Mutriku 3/4 296kW
(16x18.5
kW)
n/a Mutriku Multi-
OWC (In place)
Sweden
Lysekil, near
Gothenburg
Lysekil Wave
Energy
Research Site
2003 0.04km2 25m 2.6± 0.3
kW/m
2km Lysekil harbour
10 km
Yes, 10kV n/a Seabased (In
place)

I+D+i 44
Denmark
Denmark has a medium-low wave energy resource, but they have one of the best wave energy
programmes to develop the power extraction. There are two wave energy test centres installed
in Denmark. The Danish Marine Test Site (DanWEC) situated in Hanstholm and the Nissum
Bredning Test Station for Wave Energy (NBPB). Several Danish wave energy companies are
pursuing their developments: Wave Star A/S prototype has been operating in the North Sea in
Hanstholm since 2010. The Dexawave device has operated for 10 months in Nissum Bredning
and is now operating at DanWEC, Hanstholm.
France
France has 3,247 km of coastline and a resource of 420 TWh of wave energy along the
Atlantic coast. In 2008, the French Government began investing in the development of a wave
energy test centre under the name of SEM-REV (Site d' Expérimentation en Mer pour la
Récupération de l'Energie des Vagues). This site occupies approximately a 1km2 test zone
area and is fully instrumented and monitored. The test site comprises a 2.5 MVA power cable
connected to the national grid through an onshore substation. A new substation will be built
on land and will be the connection point to the 20 kV local electricity distribution grid which
is connected to the national Electricity Transport Network through an existing substation
(Mouslim et al., 2009). Several wave energy devices have been under development in France
in the last decade. However none of these have yet been tested at full scale in open sea
conditions. A national call for tenders was launched in 2010 by the French Energy
Development Agency „ADEME‟ and this programme will fund the first full scale marine
renewable energy prototypes in France including wave energy devices.
Ireland
The west coast of Ireland is recognised as having one of the highest levels of wave power in
Europe, reaching up to 76 kW/m. As part of Ireland‟s Ocean Energy Strategy the Government
established the Ocean Energy Development Unit (OEDU) in the Sustainable Energy
Authority of Ireland, the State‟s national energy agency. The OEDU is tasked with
coordinating the relevant activities of State agencies and initiating other measures to promote
and develop the ocean energy sector. Initially this concentrated on providing support to
industry, enhancing research facilities, creating wave and tidal test facilities, supporting
reform of the planning and consenting regime and grid development. The OEDU also operate
a Prototype Development Fund aimed at stimulating the development and deployment of
ocean energy devices and systems.
Ireland has two wave energy test sites. The first of these, located in Galway Bay on Ireland‟s
west coast, was licensed for operation in March 2006. The site is 37 hectares in area, in waters
21-24 metres deep and therefore suitable for the testing of 1/3-1/5 scale devices. To date, two
devices have been tested in the site: Wavebob and Ocean Energy‟s Seileán device. The latter
most recently concluded a test programme at Galway Bay in 2011 as part of the EU FP7
CORES project.
More recently the creation of a second, full-scale grid-connected test centre was announced.
This is known as the Atlantic Marine Energy Test Site (AMETS) and will be located off
Annagh Head, in Belmullet, Co. Mayo, also on Ireland‟s west coast. The purpose of this test
site is to provide a location for the temporary mooring and deployment of wave energy

I+D+i 45
devices so that their performance in generating electricity and their survivability can be tested
and demonstrated in open ocean conditions. It is proposed for the site to operate for up to 20
years with devices on site intermittently throughout the year. An Environmental Impact
Statement (EIS) has been published for the site and a foreshore lease has been applied for.
The decision on the foreshore lease will be made in 2012. If the foreshore lease application is
successful, the next step in the project will be the installation of cables to connect the test site
to the grid. It is hoped that AMETS will be ready for the first full scale wave energy
converters in 2014.
Norway
Norway has no special policies or programmes dedicated to ocean energy, but ocean energy is
included in more general renewable energy policies and programmes.
Runde Island is the primary wave energy test centre in Norway. The island is the
southernmost bird cliff in Norway and designated for conservation purposes. The island is
located in a highly productive area with the main spawning grounds for many important
North-east Atlantic fish populations occurring in the vicinity.
The FP7 Seewec project is built up around the Fred Olsen FO³, a floating wave energy
converter, intended for installation in the near shore environment. The basic concept of the
FO³ device consists of several (12 or 21) point absorbers placed under a floating platform.
Following sea trials off the southern coast of Norway, the results showed that it was
worthwhile to pursue an alternative concept, based on a single point absorber moored directly
to the seabed rather than attached to a platform.
Portugal
The Portuguese Government demonstrated its commitment to the development of wave
energy through the creation of a dedicated wave energy pilot zone in 2008. The main
objective of the pilot zone is to simplify licensing and permitting procedures by allocating
these responsibilities to a dedicated Management Body thereby creating a „one stop shop‟.
Other objectives of the zone are to attract demonstration and industrial development to
Portugal, to create a competitive national cluster supported by R&D and innovation activities
and to increase Portugal‟s renewable energy production. The Pilot Zone covers an area of
320km² located between the 30m and 90m isobaths. The total capacity is 80 MW (medium
voltage) and 250 MW (high voltage). The zone can accommodate three types of projects:
demonstration (up to 4 MW); pre-commercial (up to 20 MW) and commercial (> 20 MW).
Elsewhere in the Açores, the Pico OWC was built in 1999 and has fed increasing amounts of
electricity into the electrical grid, yielding more than 850 operational hours in 2010 (IEA-
OES, 2010). The plant is designed to host a second turbo-generation group, which will be
facilitated through the European-funded MariNET project on infrastructures.
The technologies tested in Portugal to date have been Pelamis and Waveroller and the Wells
turbine in Pico.
Spain
The higher resource levels of wave energy are situated along the north west Spanish coast.
Spain is beginning to develop wave energy projects by installing demonstration scale devices.
It is expected that commercial scale wave energy will be reached by 2016. Until December

I+D+i 46
2011, the fixed tariff for wave energy was lower than for hydro or wind energy (7.44c€/kWh).
There was, however, the possibility to request a specific tariff for each project on a case-by-
case basis. Since January 2012, there is no feed-in tariff for renewable energies but this is a
temporary measure. If the feed-in tariffs‟ program is reopened it will concern those less
developed technologies such as the marine energy ones.
The OceanLider R&D project was launched at the end of 2009, funded by the Ministry of
Science and Innovation. This €30M project is led by “Iberdrola Ingeniería y Construcción”
and covers resource assessment, O&M, technology, grid connection and environmental
aspects. The project has duration of 40 months and 20 industrial partners and 24 research
centres are participating (IEA-OES, 2010).
Several other wave energy projects continue to progress including the Biscay Marine Energy
Platform (Bimep) which is expected to be operational in 2013. The Mutriku OWC breakwater
was connected to the grid in May 2011, while the “PIPO” wave energy converter on the
PLOCAN‟s test site in Gran Canaria is also progressing. In Cantabria, the first OPT‟s
Powerbuoy of 40 kW was installed at sea, in September 2008. It has since been removed to
incorporate some technical improvements (IEA-OES, 2009).
At a national scale, R&D investment is best represented by the PSE-MAR, a strategic
research project funded by the Ministry of Science and Innovation (MICINN ). This aims at
developing three different wave energy converting technologies, a test and demonstration site
and guidance on non-technical issues. This project is comprised of three developers
(HIDROFLOT, PIPO Systems and OCEANTEC), industrial companies, R&D centres and
universities (IEA-OES, 2009).
Sweden
The Swedish Energy Agency is supporting the wave energy development in Sweden through
grant aid and a favourable feed-in-tariff for renewables. The wave energy demonstration
project at Lysekil has been running since 2003 and is still continuing. The current permit
expires at the end of 2013. A new application for prolonged and extended consent is ongoing.
The work is led by Uppsala University, who are also partners in the WESA project, which
involves testing a wave energy converter in the Baltic Sea, outside of Hammarudda in
Finland. This project was launched in 2012.
United Kingdom
In February 2011, the UK Department of Energy and Climate Change (DECC) published a
Strategic Environmental Assessment (SEA) to enable future leasing for offshore wind, wave
and tidal devices and licensing/leasing for oil and gas rounds, hydrocarbon and carbon
dioxide gas storage. A leasing round for the first commercial wave and tidal leasing round in
ten sites in Scotland‟s Pentland Firth and Orkney waters was held in March 2010. Developers
have proposed to have 1.2 GW of installed capacity by 2020. In March 2010, the Crown
Estate announced the launch of the Northern Ireland Offshore Renewable Energy Leasing
Round. There will be a short industry consultation process starting on 1st April to help shape
the Leasing Rounds offered in September 2011, with the potential for development rights to
be awarded as soon as Spring 2012. It should be noted that this leasing round applies to

I+D+i 47
offshore wind and tidal only and not wave, given the limited resource around Northern
Ireland.
In terms of test centres, in Scotland, the European Marine Energy Centre (EMEC) continues
to expand in Orkney with three additional grid-connected berths (2 tidal, 1 wave) and two
nursery sites, one for wave and one for tidal, each with two berths, (IEA-OES, 2010).
Currently, a number of devices are deployed there namely Aquamarine‟s Oyster 1, two
Pelamis devices and Wello Oy‟s Penguin. Seatricity are currently preparing to deploy there.
In England, the WaveHub, marine energy project continues to develop. It is located 16
kilometres offshore and is grid-connected by a socket on the seabed off the coast of Cornwall
in the south west of England. WaveHub is comprised of four berths each covering two square
kilometres. It has an initial maximum capacity of 20 MW but has been designed with the
potential to scale up to 50 MW in the future (IEA-OES, 2010).
The Falmouth Bay Test Site (FaB Test) was established in 2011 and is a nursery facility for
testing wave energy devices, components and deployment procedures. It is envisaged that it
will be a stepping stone for those looking to deploy at Wave Hub. Fred Olsen‟s BOLT
Lifesaver wave energy device was the first to be deployed there in April 2012.
4.3 Analysis
As can be seen from the entries in the Annex there are many different types of wave energy
converters in the process of development. At this nascent stage of the industry no single
device, or generic type, has proven to be superior to others, indeed there is no reason to
believe only a single design will prove successful and it is likely that several different units
will suit the various deployment zones that can be exploited. In general these wave farm sites
will be:
On-shore: the structure is in contact with the coastline (typical water depth <10m);
In-shore: water is too shallow for safe moorings so bottom standing devices are under
development (typical water depth between 10m & 25m); and
Near-shore: water depth is sufficient for safe mooring and too deep for static, bottom
standing units (typical water depth between 25m & 100m).
Note the zone boundaries will not be sharp and some devices may defy theses rules. For
example, a physically small and limited rated capacity moored device may be moored in
intermediate depth water whilst a multiple unit cluster of devices mounted on a single
platform may be located in deeper near-shore waters.
Besides the primary converter alternatives, the secondary energy converter, the power take-off
sub-system (PTO), also offers a limited number of options from which no preferred type has
so far emerged. For example, a twin hull opposing motion hydrodynamic sub-system could be
fitted with a hydraulic PTO or a direct drive generator. Again, as can be seen in the Annex
data, device developers are pursuing all types at this time.
To assist in the appreciation of the various device combinations, and develop a picture of the
technical trends that are establishing for wave energy device design, the Annex data was
analysed against several variable base options and are presented in the following graphs.

I+D+i 48
Figure 4 shows the interest and commitment of EU Member States in the prospects for wave
energy contributing to their electricity generation portfolios. The histogram on the left shows
the number of devices being developed at the sea trials stage, or in planning. The plot to the
right shows how these devices translate into the installed capacity per country.
As can be seen most coastal States have some involvement in ocean energy but the national
distributions also offers insight into the support mechanisms these countries are offering. It
should be noted that the DGTREN-supported wave energy demonstration projects are
included in theses figures against the country the project is to be established in. It should also
be noted that it is unlikely that all of these proposed sea trials will take place and, of those that
do, not all will pass the completion stage gate criteria.
Figure 4 Number of devices deployed (left) and installed capacity (right) in each
European state, at present and planned derived from information in the Annex
Figure 5 shows how the power take-off sub-system trend is developing. To some degree the
type of primary mover skews these results in that air turbines will, in most cases, be unique to
pneumatic devices, such as oscillating water column devices (OWCs). However, the interest
in linear generators for translatory reciprocating devices can be seen.
Figure 5 Number of projects by power take-off system (PTO) (left) and installed
capacity (MW) (right) derived from information in the Annex
Figure 6 shows the mix of development project by deployment site as described above. The
trend towards buoyant moored devices in the near-shore zone (25<depth<100m) is very clear

I+D+i 49
for most countries. This move to the deeper waters is necessary if wave energy is to become a
significant source of electricity supply in the multi-megawatt range. Devices designed for the
in-shore, and particularly on-shore, zones have the potential for quality niche development
projects and local supply potential. Small islands in particular may benefit from this type of
energy supply development.
Figure 6 Number of wave energy projects in each European coastal State at various
distances (km) from the shore, derived from information in the Annex
The final summary statistics in Figure 7 show how the sea trial projects have, and are
continuing to, increase significantly. The ordinate unit is installed capacity (MW) so the move
towards larger individual units is incorporated in the yearly trend.
Figure 7 Installed capacity (MW) by year derived from information in the Annex
Inshore
Nearshore

I+D+i 50
4.4 Conclusions
This study has presented and analysed the targets and forecasts for installed capacity of the
Member States engaged in wave energy development together with the past, present and
currently planned projects. This information leads to the following summary:
It is expected that Europe will have a ocean energy installed capacity of 3.6 GW by
2020 that would avoid 2.61 Mt/yr of carbon dioxide emissions (EU-OEA, 2010);
France, Ireland, Portugal, Spain and the United Kingdom have set ocean energy
targets but none of these countries have separated what proportion will come from the
wave resource and what will come from the tidal resource. The United Kingdom has
the highest target, of between 1300 and 2000 MW by 2020. Within the United
Kingdom, Scotland has the most ambitious objective of achieving 1300 MW by 2020
(Freds, 2009);
From the calculations in this document, based on the Pelamis example, between 95
and 470 wave energy farms of 20 MW each, depending on energy density, would be
required to supply the energy necessary to reach the ambitious European targets by
2020. This equates to a marine spatial area requirement of between 68 and 338km2.
Currently there are 16 Wave Energy Test Centres in Europe with varying numbers of
operational devices. Alongside this there are a number of ad hoc projects progressing
outside of the established wave energy test centres.
Projects developed to date have focused on testing and improving the technical aspects of
specific devices. It is anticipated that when commercial projects begin, sea trials to improve
other device technologies will continue.
Exchange of lessons learned by the pioneering wave energy device development companies
are a mechanism that has been promoted and advocated by some Member States as a
necessary mechanism to reach targets by the proposed timeline. This mantra was a prime
consideration in the EU FP6 project, EquiMar, and will be continued in the SOWFIA project
to help overcome permitting, licensing and environmental issues by facilitating exchange of
information between project developers and other target audiences. The SOWFIA project‟s
first workshop, to be held in Autumn 2011, will encourage such an exchange of experiences
amongst project developers and other industry stakeholders, paving the way for more
efficient, streamlined planning and development of wave energy in Europe.

I+D+i 51
5 References
Associação de Energias Renováveis (APREN). (2010). Roteiro Nacional das Energias
Renovaveis Aplicacao da Directiva 2009/28/CE (Versao Final). Associação de Energias
Renováveis, Lisboa, Portugal. Available from:
http://www.repap2020.eu/fileadmin/user_upload/Roadmaps/roadmap_APREN_VFinal.pd
f
Asociación de Productores de Energías Renovables (APPA). (2010). Hoja de ruta del
sector de energías renovables en España. APPA, Madrid, Spain. Available from:
http://www.repap2020.eu/fileadmin/user_upload/Roadmaps/Hoja_de_ruta_de_EERR_AP
PA_Proyecto_REPAP_2020__Junio_2010_.pdf
Department of Communications, Energy and Natural Resources. (2010). DRAFT
Offshore Renewable Energy Development Plan (OREDP). Department of
Communications, Energy and Natural Resources, Dublin, Ireland. Available from:
http://www.seai.ie/Renewables/Ocean_Energy/Offshore_Renewable_SEA/Environmental
_Report/Draft_OREDP.pdf
Department of Enterprise, Trade and Investment (DETI). (2009). Draft Offshore
Renewable Energy Strategic Action Plan 2009-2020. DETI, Belfast, Northern Ireland.
Available from: http://www.offshorenergyni.co.uk/Data/Draft_Strategic_Action_Plan.pdf
Dutch Government. (2010). Nationaal actieplan voor energie uit hernieuwbare bronnen
(English version). Available from:
http://ec.europa.eu/energy/renewables/transparency_platform/action_plan_en.htm
Ehler, C. and Douvere, F. (2009). Marine Spatial Planning: a step-by-step approach
toward ecosystem-based management. Intergovernmental Oceanographic Commission
and Man and the Biosphere Programme. IOC Manual and Guides No. 53, ICAM Dossier
No. 6. Paris: UNESCO.
EquiMar project: Rousseau, N., Rosa-Clot, M., and Danos, F. (2010). Report on the state
of ocean energy in Europe: technologies, test sites, and joint projects. FP7 project on
Equitable Testing and Evaluation of Marine Energy Extraction Devices in terms of
Performance, Cost and Environmental Impact (EquiMar). Available from:
http://www.chrissmithonline.co.uk/files/equimard9.1eu-oea-2.pdf
European Ocean Energy Association. (2010). Oceans of Energy – European Ocean
Energy Roadmap 2010-2050, EU-OEA, Brussels, Belgium. Available from:
http://www.eu-
oea.com/euoea/files/ccLibraryFiles/Filename/000000000827/ocean%20vectorise%2010%
20mai%202010.pdf
European Renewable Energy Council (EREC). (2011). Mapping Renewable Energy
Pathways towards 2020: EU Roadmap. EREC, Brussels, Belgium. Available from:
http://www.repap2020.eu/fileadmin/user_upload/Roadmaps/EREC-roadmap-V4_final.pdf
Faber Maunsell and Metoc Plc. (2007). Scottish Marine Renewables Strategic
Environmental Assessment. Available from:
http://www.seaenergyscotland.net/SEA_Public_Environmental_Report.htm
Federal-Regional Energy Consultation Group CONCERE-ENOVER. (2010). National
renewable energy action plan for Belgium pursuant to Directive 2009/28/EC. Available
from: http://ec.europa.eu/energy/renewables/transparency_platform/action_plan_en.htm
Federal Republic of Germany. (2010). National Renewable Energy Action Plan in
accordance with Directive 2009/28/EC on the promotion of the use of energy from

I+D+i 52
renewable sources. Available from:
http://ec.europa.eu/energy/renewables/transparency_platform/action_plan_en.htm
Forum for Renewable Energy Developing in Scotland (Freds). (2009). Marine Energy
Road Map. Freds Marine Energy Group (MEG), Scotland. Available from:
http://www.scotland.gov.uk/Publications/2009/08/14094700/12
Grenelle de la Mer. (2009). Blue Book Commitments of the Oceans Round Table.
Ministry for Ecology, Energy, Sustainable Development and Marine Affairs, Paris,
France. Available from: http://www.legrenelle-
environnement.fr/IMG/pdf/Livre_bleu_anglais_web.pdf
Government of Ireland. (2010). National Renewable Energy Action Plan – IRELAND.
Submitted under Article 4 of Directive 2009/28/EC. Available from:
http://ec.europa.eu/energy/renewables/transparency_platform/action_plan_en.htm
Governo de Portugal. (2010). National Renewable Energy Action Plan, submitted under
Article 4 of Directive 2009/28/EC. Available from:
http://ec.europa.eu/energy/renewables/transparency_platform/action_plan_en.htm
HM Government/DECC. (2010). Marine Energy Action Plan 2010 – Executive Summary
and Recommendations. HM Government, London, England. Available from:
http://www.decc.gov.uk/en/content/cms/what_we_do/uk_supply/energy_mix/renewable/e
xplained/wave_tidal/funding/marine_action_/marine_action_.aspx
HM Government (2010). National Renewable Energy Action Plan for the United
Kingdom Article 4 of the Renewable Energy Directive 2009/28/EC. Available from:
http://ec.europa.eu/energy/renewables/transparency_platform/action_plan_en.htm
IEA-OES. (2009). Annual report. Available from: http://www.iea-
oceans.org/_fich/6/Annual_Report_2009_v2.pdf
IEA-OES. (2010). Annex I: Information Collation and Dissemination Newsletter. October
2010. Available from: http://www.iea-oceans.org/_fich/6/OES-
IA_Bulletin_October_2010.pdf
Ifremer. (2008). Les énergies renouvelables marines - Synthèse d‟une étude prospective à
l‟horizon 2030. Ifremer, Brest, France. Available from: http://wwz.ifremer.fr/institut_eng/content/download/39242/536346/file/Ifremer_synthese-etude-
prospective-EnRM.pdf
International Electrotechnical Commission (IEC). In Press. Technical Committee 114 (TC
114) Marine energy – wave, tidal and other water current converters – Part 1
Terminology. IEC, Geneva, Switzerland.
Italian Ministry of Economic Development. (2010). Italian National Renewable Energy
Action Plan (in line with the provisions of Directive 2009/28/EC and Commission
Decision of 30 June 2009). Available from:
http://ec.europa.eu/energy/renewables/transparency_platform/action_plan_en.htm
Klima Og Energiministeriet. (2010). National Action Plan For renewable energy in
Denmark. Available from:
http://ec.europa.eu/energy/renewables/transparency_platform/action_plan_en.htm
Ministère de l'Écologie, de l'Énergie, du Développement durable et de la Mer. (2009).
National action plan for the promotion of renewable energies 2009-2020. Available from:
http://ec.europa.eu/energy/renewables/transparency_platform/action_plan_en.htm
Ministerio de Industria, Turismo y Comercio. (2010). Plan de Acción Nacional de
Energías Renovables de España (PANER) 2011 – 2020. Government of Spain, Madrid,
Spain. Available from:

I+D+i 53
http://www.idae.es/index.php/mod.documentos/mem.descarga?file=/documentos_201006
30_PANER_Espana_version_final_[1]_cdb842de.pdf
Ministry of Environment, Energy and Climate Change (Greece). (2010). National
Renewable Energy Action Plan in the scope of Directive 2009/28/EC. Available from:
http://ec.europa.eu/energy/renewables/transparency_platform/action_plan_en.htm
Mouslim, H., Babarit, A., Clément, A., and Borgarino, B. (2009). Development of the
French Wave Energy Test Site SEM-REV. Proceedings of the 8th European Wave and
Tidal Energy Conference, Uppsala, Sweden, 2009, pp.31-35.
Oregon Wave Energy Trust (OWET). (2010). A Blueprint for Ocean Energy Development
2010-2015. Oregon Wave Energy Trust, Portland, Oregon, U.S.A. Available from:
http://www.oregonwave.org/wp-content/uploads/OWET-Blueprint-2010-2015-FINAL-
web.pdf
Regeringskansliet. (2010). The Swedish National Action Plan for the promotion of the use
of renewable energy in accordance with Directive 2009/28/EC and the Commission
Decision of 30.06.2009. Available from:
http://ec.europa.eu/energy/renewables/transparency_platform/action_plan_en.htm
Scottish Executive. (2004). Harnessing Scotland‟s Marine Energy Potential. Forum for
Renewable Energy Development in Scotland/Marine Energy Group (MEG).
http://www.scotland.gov.uk/Resource/Doc/17002/0028242.pdf
Scottish Government / Marine Scotland. (2009). Pentland Firth and Orkney Waters
Marine Spatial Plan (MSP) Framework and Regional Locational Guidance (RLG) for
Marine Renewable Energy. Prepared for the Scottish Government by AECOM and Metoc.
Available from: http://www.scotland.gov.uk/Resource/Doc/274332/0082049.pdf
Sustainable Energy Ireland and Marine Institute. (2005). Ocean Energy in Ireland,
Submitted to the Department of Communications, Marine & Natural Resources.
Sustainable Energy Ireland and Marine Institute, Dublin, Ireland. Available from:
http://www.seai.ie/Renewables/Ocean_Energy/Ocean_Energy_Strategy/Ocean_Energy_St
rategy_Report_18082006.pdf
Sustainable Energy Authority of Ireland (SEAI). (2010). Strategic Environmental
Assessment (SEA) of the Offshore Renewable Energy Development Plan (OREDP) in the
Republic of Ireland. Environmental Report. Produced for SEAI by AECOM, Metoc and
CMRC. Available from:
http://www.seai.ie/Renewables/Ocean_Energy/Offshore_Renewable_SEA
Swedish Association for Renewable Energies (SERO). (2010). National Renewable
Energy Source Industry Roadmap. SERO, Stockholm, Sweden. Available from:
http://www.repap2020.eu/fileadmin/user_upload/Roadmaps/REPAP_Sweden_Roadmap_
FinalVersion.pdf
Thresher, R./National Renewable Energy Laboratory. (2010). The United States Marine
Hydrokinetic Renewable Energy Technology Roadmap, National Renewable Energy
Laboratory, Golden, Colorado, U.S.A. Available from:
http://www.oceanrenewable.com/wp-content/uploads/2010/05/1st-draft-roadmap-rwt-
8april10.pdf
UK Energy Research Centre. (2008). UKERC Marine (Wave and Tidal Current)
Renewable Energy Technology Roadmap – Summary Report. UKERC, University of
Edinburgh, Edinburgh, Scotland. Available from:
http://ukerc.rl.ac.uk/Roadmaps/Marine/Tech_roadmap_summary%20HJMWMM.pdf

I+D+i 54
UK Government, Department of Energy and Climate Change (2009). UK Offshore
Energy Strategic Environmental Assessment. Available from: http://www.offshore-
sea.org.uk/site/scripts/book_info.php?consultationID=16&bookID=11
Waveplam project: Hydraulics and Maritime Research Centre (HMRC). (2009). State of
the art analysis. Available from: http://www.waveplam.eu/page/default.asp?la=1&id=5

I+D+i 55
Bibliography
Atlantica Transnational Network (2010). Desarrollo de las energías marinas: condiciones
de éxito en las regiones de la RTA del Arco Atlántico. Available from:
http://www.cescanarias.org/documentos/rta/rta_energia_final_es.pdf
British Wind Energy Association. (2006). The Path to Power. Delivering confidence in
Britain‟s wave and tidal stream industry. Available from:
http://www.bwea.com/pdf/pathtopower/PathtoPower_low.pdf
BWEA/Entec (2009). Marine Renewable Energy. State of the Industry report. Available
from: http://www.bwea.com/pdf/marine/Marine_report_enteclogo.pdf
Campbell, H.V. (2010). A Rising Tide: Wave Energy in the United States and Scotland.
Sea Grant Law and Policy Journal, Vol. 2, No. 2, Winter 2009/2010. Available from:
http://nsglc.olemiss.edu/SGLPJ/Vol2No2/Campbell.pdf
Carbon Trust (2006). Future Marine Energy. Results of the Marine Energy Challenge:
Cost competitiveness and growth of wave and tidal stream energy. Available from:
http://www.oceanrenewable.com/wp-content/uploads/2007/03/futuremarineenergy.pdf
Centre for Renewable Energy Sources (CRES) (2002). Wave Energy Utilization in
Europe. Current status and perspectives. Available from:
http://www.cres.gr/kape/pdf/download/Wave%20Energy%20Brochure.pdf
Department of Communications, Marine and Natural Resources (2007). The Energy
Policy Framework 2007 – 2020, Delivering A Sustainable Energy Future For Ireland.
Available from: http://www.dcenr.gov.ie/NR/rdonlyres/54C78A1E-4E96-4E28-A77A-
3226220DF2FC/27356/EnergyWhitePaper12March2007.pdf
Greenpeace International and European Renewable Energy Council (EREC). (2007).
Energy (r)evolution. A Sustainable Global Energy Outlook. Available from:
http://www.energyblueprint.info/fileadmin/media/documents/energy_revolution.pdf
IEA-OES (2010). Implementing Agreement on Ocean Energy Systems. Annex I. See
further: http://www.iea-oceans.org/tasks.asp?id=1
IEA-OES (2010). Generic and Site-related Wave Energy Data. Annex II. See further:
http://www.iea-oceans.org/tasks.asp?id=2
NEEDS project: A. Ricci. (2009). Policy Use of the NEEDS Results. Final deliverable
from the New Energy Externalities Developments for Sustainability (NEEDS) Integrated
Project. Available from: http://www.needs-project.org/docs/Needs.pdf
Oregon Wave Energy Trust (OWET). (2009). Garrad Hassan Wave Energy Technology
Review. OWET Utility Market Initiative. Available from:
http://www.oregonwave.org/wp-content/uploads/Task-2.1.2-Garrad-Hassan-Wave-
Energy-Technology-Review.pdf
RenewableUK. (2011). Wave and Tidal Energy in the UK - State of the industry report.
Available from: http://www.bwea.com/pdf/marine/Wave_Tidal_energy_UK.pdf
Scottish Government (2010). Further Scottish Leasing Round (Saltire Prize Projects)
Discussion Paper on Proposed Geographic Areas. See further:
http://www.scotland.gov.uk/Publications/2010/03/23084725/1
UK Government, Department of Energy and Climate Change (2009). Climate Change Act
2008. Impact Assessment. Available from:
http://www.decc.gov.uk/assets/decc/85_20090310164124_e_@@_climatechangeactia.pdf
UK Government (2009). The UK Low Carbon Transition Plan. Available from:
http://www.decc.gov.uk/en/content/cms/what_we_do/lc_uk/lc_trans_plan/lc_trans_plan.as
px

I+D+i 56
World Energy Council (2010). Survey of Energy Resources. Available from:
http://www.worldenergy.org/publications/3040.asp
Websites of interest
Aegir Wave Power (joint venture between Pelamis and Vattenfall)
www.aegirwave.com
DEXAWAVE Wave Energy Converter
www.dexawave.com
Nordic Folkecenter for Renewable Energy (non-profit organisation)
www.folkecenter.net
Irish Marine Institute
www.marine.ie
Ocean Navitas (wave power developers)
www.oceannavitas.com
Pelamis Wave Power
www.pelamiswave.com
Renewable Energy Development (information service)
http://renewableenergydev.com/red/
Runde Environmental Centre, Norway
www.rundecentre.no
Sustainable Energy Authority of Ireland (State energy agency)
www.seai.ie
Wave Dragon
www.wavedragon.net
Voith Hydro Wavegen Ltd.
www.wavegen.co.uk
Other resources:
Wave Energy Centre (2010). Principais players mundiais. Países, promotores e
tecnólogos. Presentation available from:
http://www.emam.com.pt/images/stories/EnergiaOndas/principais%20players%20mundiai
s.pdf
Wave Energy Centre (2010). Offshore Energy in Portugal. WavEC Seminar. Presentation
available from: http://www.wavec.org/client/files/02_Antonio_Sarmento.pdf

I+D+i 57
6 Wave Energy Test Centres Annex
This annex presents the devices under sea trials or planned for testing at wave energy test
centres or other ad hoc sites around Europe. The Annex is divided into three sections, full
scale test centre, large scale test centres and demonstration sites. Important information
relating to the sites is given in tables along with information on any projects that are either
proposed, planned, in place, completed or were ended prematurely at the sites.
In some cases, all the information relating to the test sites was not found or is not available.
Where this is the case, „Not available‟ is included in the table.
A number of the test centres are partners in the EU FP7 MARINET project. This project is
running from 2011 to 2015 and involves test centres offering periods of free access to their
facilities to companies, research groups etc. Test centres providing access as part of
MARINET are mentioned in the Annex.

I+D+i 58
6.1 Full-scale test centres
DanWEC, Denmark
The Danish Marine Test Site (DanWEC) is located in Hanstholm, in the north-west of
Denmark in the North Sea. It has a fetch of about 600km to the west, sheltered by the UK.
The site is grid connected. To date, the devices which have been tested at DanWEC are Wave
Star and Dexawave.
Location: Hanstholm, NW part of Denmark
Name DanWEC: Danish Marine Test Site
Date Established in 2009
Device scale Prototype scale
Distance to shore 200m
Area (m2) 1 km
2
Depth (m)
12 m
Wave resource ~5kW/m average
Grid connection Yes
Total power level (MW) Not available
Number of berths Not available
Connection voltage (kV) Not available
Costs Unknown
Project promoter Project owner: Port Forum of Hanstolm
Website http://www.danwec.com/
MARINET Access No

I+D+i 59
Name Device Wave Star Dexawave
Technology type Vertical Oscillation Oscillator
Power Take Off Hydraulic PTO Hydraulic PTO
Capacity Project 110kW 5kW
Project Status In Place In Place
Start date 2009 2009
Wave Star Dexawave
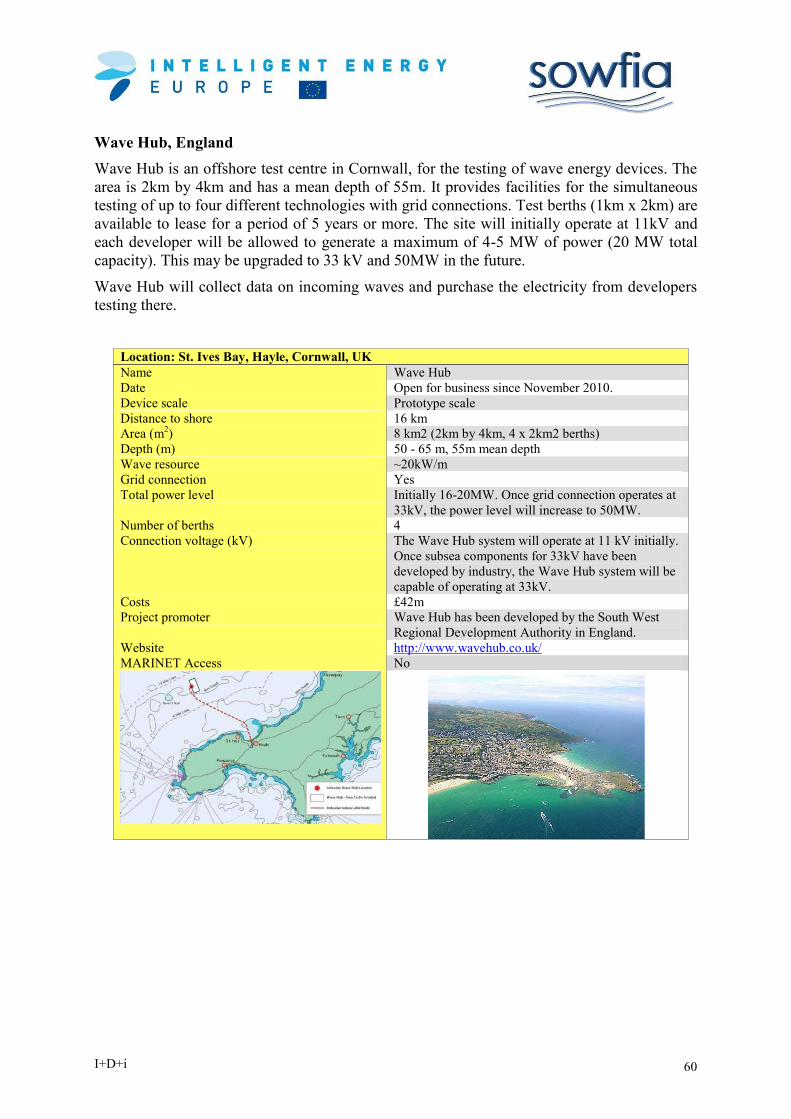
I+D+i 60
Wave Hub, England
Wave Hub is an offshore test centre in Cornwall, for the testing of wave energy devices. The
area is 2km by 4km and has a mean depth of 55m. It provides facilities for the simultaneous
testing of up to four different technologies with grid connections. Test berths (1km x 2km) are
available to lease for a period of 5 years or more. The site will initially operate at 11kV and
each developer will be allowed to generate a maximum of 4-5 MW of power (20 MW total
capacity). This may be upgraded to 33 kV and 50MW in the future.
Wave Hub will collect data on incoming waves and purchase the electricity from developers
testing there.
Location: St. Ives Bay, Hayle, Cornwall, UK
Name Wave Hub
Date Open for business since November 2010.
Device scale Prototype scale
Distance to shore 16 km
Area (m2) 8 km2 (2km by 4km, 4 x 2km2 berths)
Depth (m)
50 - 65 m, 55m mean depth
Wave resource ~20kW/m
Grid connection Yes
Total power level Initially 16-20MW. Once grid connection operates at
33kV, the power level will increase to 50MW.
Number of berths 4
Connection voltage (kV) The Wave Hub system will operate at 11 kV initially.
Once subsea components for 33kV have been
developed by industry, the Wave Hub system will be
capable of operating at 33kV.
Costs £42m
Project promoter Wave Hub has been developed by the South West
Regional Development Authority in England.
Website http://www.wavehub.co.uk/
MARINET Access No

I+D+i 61
Name Device OE Buoy
Technology type Floating OWC
Power Take Off Air Turbine
Capacity Project (MW) 1.5MW
Project Status Planned
Start date Deployment announced for late
2012
Name Device OWEL
Technology type Pulsed Air WEC
Power Take Off Pneumatic
Capacity Project (MW) 0.35MW
Project Status Planned
Start date Currently in detailed design
phase. Subject to raising suitable
finance, the marine demonstrator
will be deployed at Wave Hub in
2013

I+D+i 62
SEM-REV, France
The SEM-REV (Site d' Expérimentation en Mer pour la Récupération de l'Energie des
Vagues) test site is being developed jointly by the Ecole Centrale de Nantes (ECN) and the
French National Centre for Scientific Research (CNRS). The test centre is co-funded by the
Pays de la Loire Region, the Loire-Atlantique department, the French Government and the
European Regional Development Fund. It is still being developed and to date, no wave energy
devices have been deployed there.
Location: Pays de la Loire, France
Name SEM-REV: Site d' Expérimentation en Mer
pour la Récupération de l'Energie des Vagues
Date In development since October 2007
Device scale Prototype scale
Distance to shore 15 km
Area 1km2
Depth
35 m
Wave resource 14.4 kW/m (23 year mean)
Grid connection Under construction – Cable laying operation
commenced in May 2012
Total power level (MW) 2.5 MW
Number of berths 4
Connection voltage (kV) 20 kV
Costs €5.8 million (2008)
Project promoter Ecole Centrale de Nantes
Website http://www.semrev.fr/en/
MARINET Access No

I+D+i 63
Atlantic Marine Energy Test Site (AMETS), Ireland
The Sustainable Energy Authority of Ireland is in the process of developing a national wave
energy test site, to be known as the Atlantic Marine Energy Test Site, off Annagh Head,
Belmullet, in the west of Ireland (Co. Mayo). This will provide a location for temporary
mooring and deployment of full-scale wave energy devices. The purpose of the test site will
be to test the performance of pre-commercial wave energy devices in extreme open ocean
conditions.
It is expected that the site will operate for up to 20 years with devices on site intermittently
throughout the year. The total capacity will be 10 MW. An Environmental Impact Statement
(EIS) has been published for the site and a foreshore lease has been applied for. If the
foreshore lease application is successful, the next step in the project will be the installation of
cables to connect the test site to the grid. It is hoped that AMETS will be ready for the first
full scale wave energy converters in 2014.
Location: Belmullet, Co Mayo, Ireland
Name Atlantic Marine Energy Test Site (AMETS)
Date In planning since c. 2009
Device scale Prototype Scale (Extreme open ocean conditions)
Distance to shore Two test areas:
Test Area A: 10.5km from shore (Cable: 16km)
Test Area B: 6.5km from shore (Cable: 6.5km)
Area Test Area A: 6.9km2
Test Area B: 1.5km2
Depth
Test Area A: 100m
Test Area B: 50m
Wave resource Test Area A: 70-75kW/m
Test Area B: 55-60kW/m
(Source: AMETS Environmental Impact Statement)
Grid connection Grid connection planned. Application for
government funding for grid connection will be
made after foreshore license decision (~Sep‟ 2012)
Total power level (MW) 10MW total
Number of berths Test Area A: 2
Test Area B: 2
Connection voltage (kV) 10kV
Costs Not available
Project promoter SEAI and Marine Institute
Website http://www.seai.ie/Renewables/Ocean_Energy/Bel
mullet_Wave_Energy_Test_Site/
MARINET Access Yes
I+D+i 64
Runde Island, Norway
Runde Island is the location of the primary test centre in Norway and is situated on the west
coast of the country. Runde Island itself is the southernmost bird cliff in Norway and
designated for conservation purposes. It hosts the „Storwave‟ wave power plant, which is a
fixed, shore-based plant with a chamber for collecting the power. The Centre on Runde
promotes the use of renewable energies, particularly ocean energy. Devices can be installed
here for demonstration and education, and subsequently for harnessing power.
Location: Runde, Norway
Name Runde Environmental Centre and Marine Energy
Test Centre
Date Opened in June, 2009
Device scale Prototype scale
Distance to shore ~500m
Area Not available
Depth (m)
30 – 50m
Wave resource Not available
Grid connection Yes
Total power level (MW) Not available
Number of berths Not available
Connection voltage (kV) 22 kV
Costs Not available
Project promoter Runde Environmental Centre
Website www.rundecentre.no
MARINET Access No

I+D+i 65
Pilot Zone, Portugal
The Pilot Zone is located off the west coast of Portugal, about 130km north of Lisbon. The
area test site is 320km2 in waters between 30m to 90m. So far no wave energy devices have
been installed there.
Location: North São Pedro de Moel, Portugal
Name Pilot Zone
Date In planning since 2007
Device scale Prototype scale
Distance to shore 5-8km.
Area (km2) 320km
2
Depth (m)
30 - 90m
Wave resource 32kW/m (WERATLAS)
Grid connection Planned
Total power level (MW) 1st phase 80 MW / 2
nd phase 250 MW
Number of berths Not available
Connection voltage (kV) Not available
Costs Not available
Project promoter Not available
Website -
MARINET Access No

I+D+i 66
European Marine Energy Centre (EMEC), Scotland
The European Marine Energy Centre (EMEC) on the Orkney Islands in Scotland is one of the
first grid connected test sites within Europe and is the first one in the world to create a test
base for tidal and wave energy devices. The substation for wave energy is located at Billia
Croo. EMEC has 14 full scale test berths (wave and tidal) and two nursery test sites, one wave
and one tidal.
Location: Orkney Island, Scotland
Name EMEC: European Marine Energy Centre (Billia Croo)
Date Established in 2003
Device scale Prototype scale
Distance to shore 5 deepwater berths: 1-2km from shore
2 shallow water berth: <1km from shore
Area Deepwater berths: ~5 km2total
Shallow water berths: ~0.5km2 total
Depth
Deepwater berths: 50 – 75m
Shallow water berths: ~20m
Wave resource 22-25 kW/m
Grid connection Yes
Total power level (MW) Allowed output = 7MW
Number of berths 6 (5 cable connected, 1 pipeline connected)
Connection voltage 11 kV
Costs Not available
Project promoter
Website www.emec.org.uk
MARINET Access No (Nursery Sites are included)

I+D+i 67
Name Device Oyster Pelamis Wello Oy Seatricity
Technology type Surge Flap Attenuator Rotating Mass Multiple point
absorber
Power Take Off Hydro turbine Hydraulic Rotary Hydro turbine
Capacity Project
(kW)
315 800 750 1500(2 x
750kW)
500 1000
Project Status Completed In place
(Plans to
install
further
capacity)
Completed In place In place Devices under
construction
Start date 2009 2012 2004 2010 2012 2012
Oyster Pelamis Wello Oy
Seatricity

I+D+i 68
Biscay Marine Energy Platform (Bimep), Spain
The Biscay Marine Energy Platform (Bimep) test centre is being constructed off the coast of
the village of Armintza in Northern Spain. It will be a test centre for real scale prototypes.
There will be four connection berths for testing wave energy devices and offshore wind
turbines. No devices have deployed there yet.
Location: Basque Country, Spain
Name Bimep: Biscay Marine Energy Platform
Date Under development since 2009, expected
completion date October 2013.
Device scale Prototype scale
Distance to shore 1700 m
Area (km2) 5.3 km
2
Depth (m)
50 to 90m
Wave resource 21 kW/m
Grid connection Under Construction
Total power level (MW) 20 MW
Number of berths 4 (Each with 5MW power connection)
Connection voltage (kV) 4 x 13 kV connection cables to shore
Costs €20M estimated
Project promoter Ente Vasco de la Energia
Website http://www.eve.es/energia_marina/index_cas
.htm
MARINET Access Yes
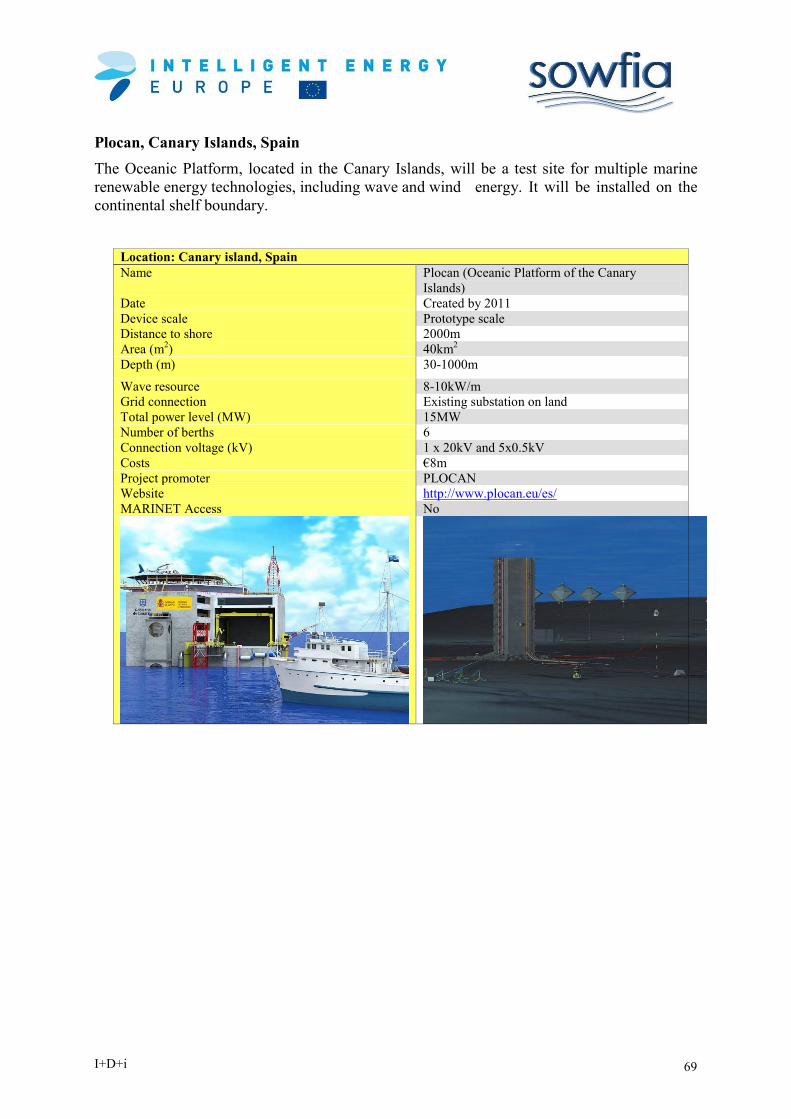
I+D+i 69
Plocan, Canary Islands, Spain
The Oceanic Platform, located in the Canary Islands, will be a test site for multiple marine
renewable energy technologies, including wave and wind energy. It will be installed on the
continental shelf boundary.
Location: Canary island, Spain
Name Plocan (Oceanic Platform of the Canary
Islands)
Date Created by 2011
Device scale Prototype scale
Distance to shore 2000m
Area (m2) 40km
2
Depth (m)
30-1000m
Wave resource 8-10kW/m
Grid connection Existing substation on land
Total power level (MW) 15MW
Number of berths 6
Connection voltage (kV) 1 x 20kV and 5x0.5kV
Costs €8m
Project promoter PLOCAN
Website http://www.plocan.eu/es/
MARINET Access No

I+D+i 70
Name Device APC-Pisys
Technology type Vertical Oscillation
Power Take Off Mechanical Transmission
Capacity Project (MW) 0.015
Project Status Planned
Start date 2013

I+D+i 71
6.2 Large-scale test centres
Nissum Bredning, Denmark
The Nissum Bredning test centre is located in western Limfjord, not far from the Folkecenter
in the north western Jutland peninsula of Denmark. It was built in 2000 at a site of medium
wave energy to test technologies in their early stages. It is connected to the grid and can be
accessed via a 150m bridge. Thirty wave energy devices have been tested there for varying
lengths of time between 1/10 and 1/4 scale.
Location: Nissum Bredning, Denmark
Name Nissum Bredning Test Station for Wave Energy
Date Established in 2000
Device scale Sub-prototype scale (~1/4 – 1/10)
Distance to shore 200m
Area (m2) Not available
Depth (m)
4-8m
Wave resource Hs 1.2m
Grid connection Yes
Total power level (MW) 0.5 MW
Number of berths Not available
Connection voltage (kV) Not available
Costs Initial grant of over €5 million from Danish Energy
Agency
Project promoter Nordic Folkecenter for Renewable Energy
Website http://www.folkecenter.net/gb/rd/wave-energy/
MARINET Access Yes
Name Device Wave Dragon Wave Star Dexa Wave
Technology type Overtopping Vertical Oscillation Attenuator
Power Take Off Hydro Turbine Hydraulic PTO Hydraulic PTO
Capacity Project (kW) 20 20 5.5 Not available
Project Status Completed Completed Completed Completed
Start date 2003 2006 2006 2008

I+D+i 72
Galway Bay, Ireland
The Galway Bay Wave Energy Test Site is a sub-prototype scale, non-grid connected test site,
located 2.4km from Spiddal in Galway Bay, Co. Galway, Ireland. The wave conditions at the
site give a good representation at one quarter scale of combinations of height and period for
exposed north western Atlantic conditions. It can accommodate prototypes of scales 1:3 to
1:5. Two developers have used the test site to date, both on a number of occasions, namely
Ocean Energy Ltd and Wavebob. Most recently Ocean Energy Ltd. deployed their device, the
OE buoy, for three months as part of the EU FP7 CORES project in 2011.
Location: Spiddal, Co. Galway, Ireland
Name Galway Bay Wave Energy Test Site
Date Established in 2006
Device scale Sub-prototype scale (c. 1:3 – 1:5)
Distance to shore 2.4 km
Area 0.37 km2
Depth (m)
21-24m
Wave resource 3 kW/m
Grid connected No
Total power level (MW) n/a
Number of berths 2
Connection voltage (kV) n/a
Costs Not available
Project promoter SEAI and Marine Institute
Website http://www.marine.ie/home/aboutus/organisationsta
ff/researchfacilities/Ocean+Energy+Test+Site.htm
MARINET Access Yes
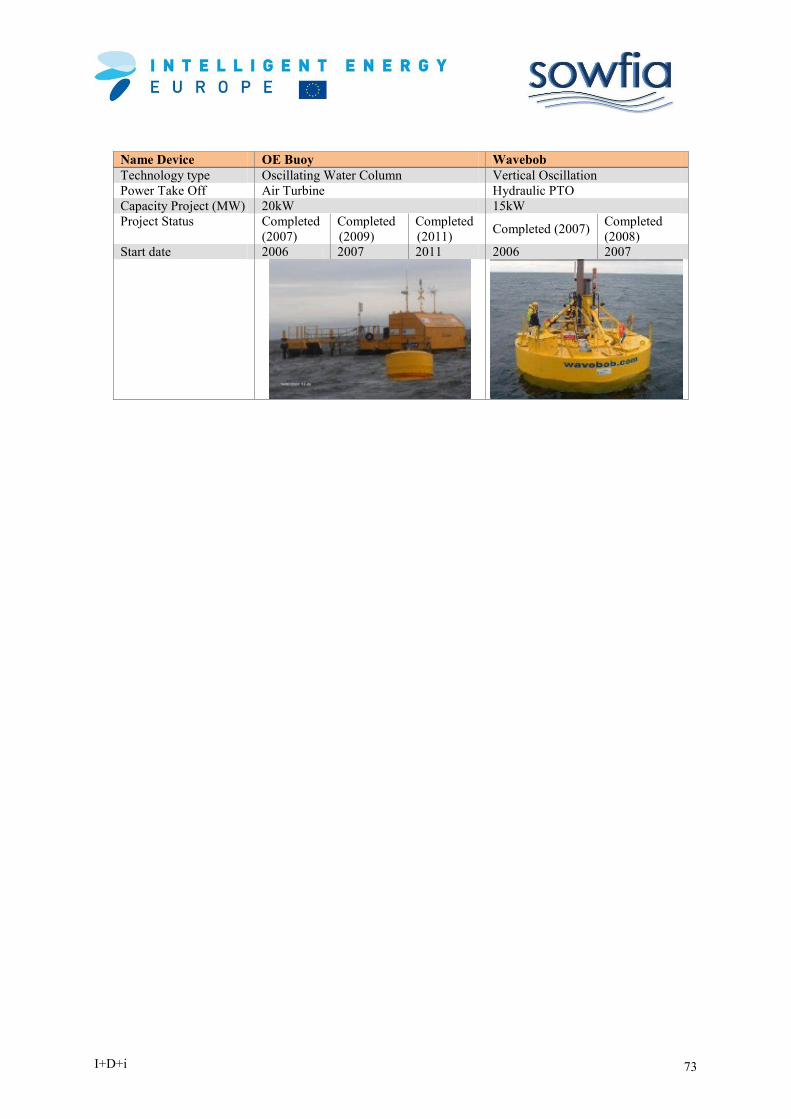
I+D+i 73
Name Device OE Buoy Wavebob
Technology type Oscillating Water Column Vertical Oscillation
Power Take Off Air Turbine Hydraulic PTO
Capacity Project (MW) 20kW 15kW
Project Status Completed
(2007)
Completed
(2009)
Completed
(2011) Completed (2007)
Completed
(2008)
Start date 2006 2007 2011 2006 2007
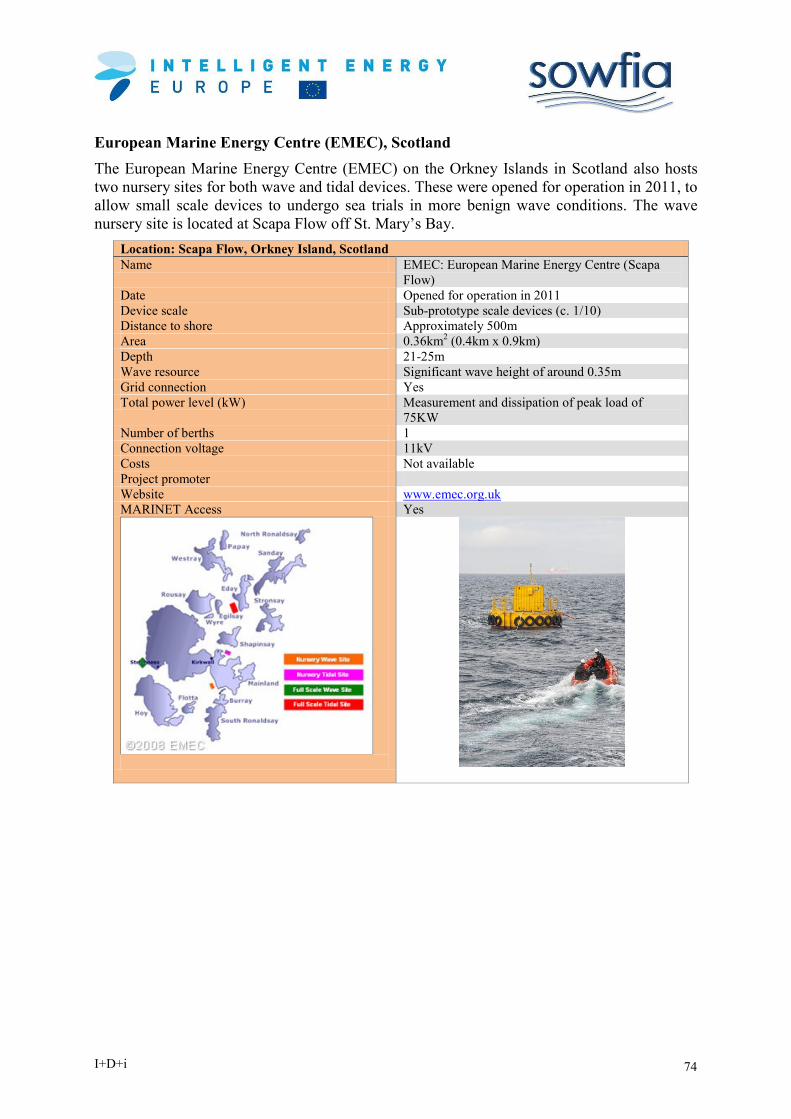
I+D+i 74
European Marine Energy Centre (EMEC), Scotland
The European Marine Energy Centre (EMEC) on the Orkney Islands in Scotland also hosts
two nursery sites for both wave and tidal devices. These were opened for operation in 2011, to
allow small scale devices to undergo sea trials in more benign wave conditions. The wave
nursery site is located at Scapa Flow off St. Mary‟s Bay.
Location: Scapa Flow, Orkney Island, Scotland
Name EMEC: European Marine Energy Centre (Scapa
Flow)
Date Opened for operation in 2011
Device scale Sub-prototype scale devices (c. 1/10)
Distance to shore Approximately 500m
Area 0.36km2 (0.4km x 0.9km)
Depth
21-25m
Wave resource Significant wave height of around 0.35m
Grid connection Yes
Total power level (kW) Measurement and dissipation of peak load of
75KW
Number of berths 1
Connection voltage 11kV
Costs Not available
Project promoter
Website www.emec.org.uk
MARINET Access Yes
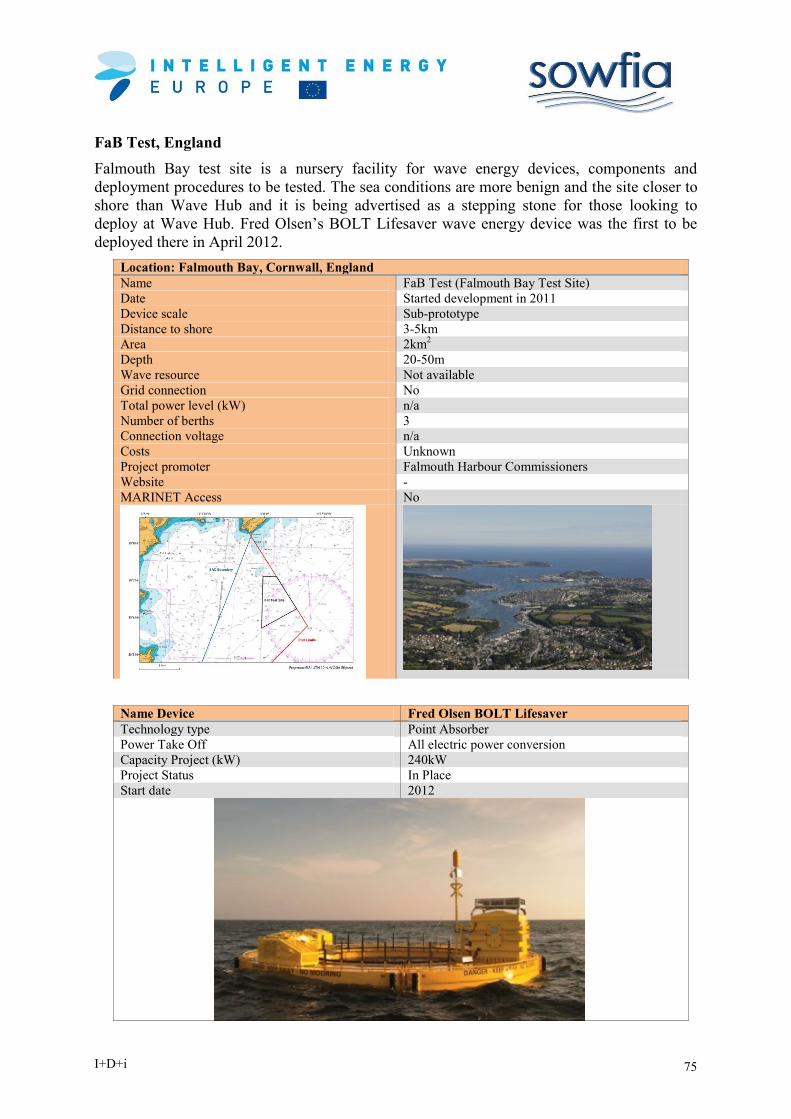
I+D+i 75
FaB Test, England
Falmouth Bay test site is a nursery facility for wave energy devices, components and
deployment procedures to be tested. The sea conditions are more benign and the site closer to
shore than Wave Hub and it is being advertised as a stepping stone for those looking to
deploy at Wave Hub. Fred Olsen‟s BOLT Lifesaver wave energy device was the first to be
deployed there in April 2012.
Location: Falmouth Bay, Cornwall, England
Name FaB Test (Falmouth Bay Test Site)
Date Started development in 2011
Device scale Sub-prototype
Distance to shore 3-5km
Area 2km2
Depth
20-50m
Wave resource Not available
Grid connection No
Total power level (kW) n/a
Number of berths 3
Connection voltage n/a
Costs Unknown
Project promoter Falmouth Harbour Commissioners
Website -
MARINET Access No
Name Device Fred Olsen BOLT Lifesaver
Technology type Point Absorber
Power Take Off All electric power conversion
Capacity Project (kW) 240kW
Project Status In Place
Start date 2012
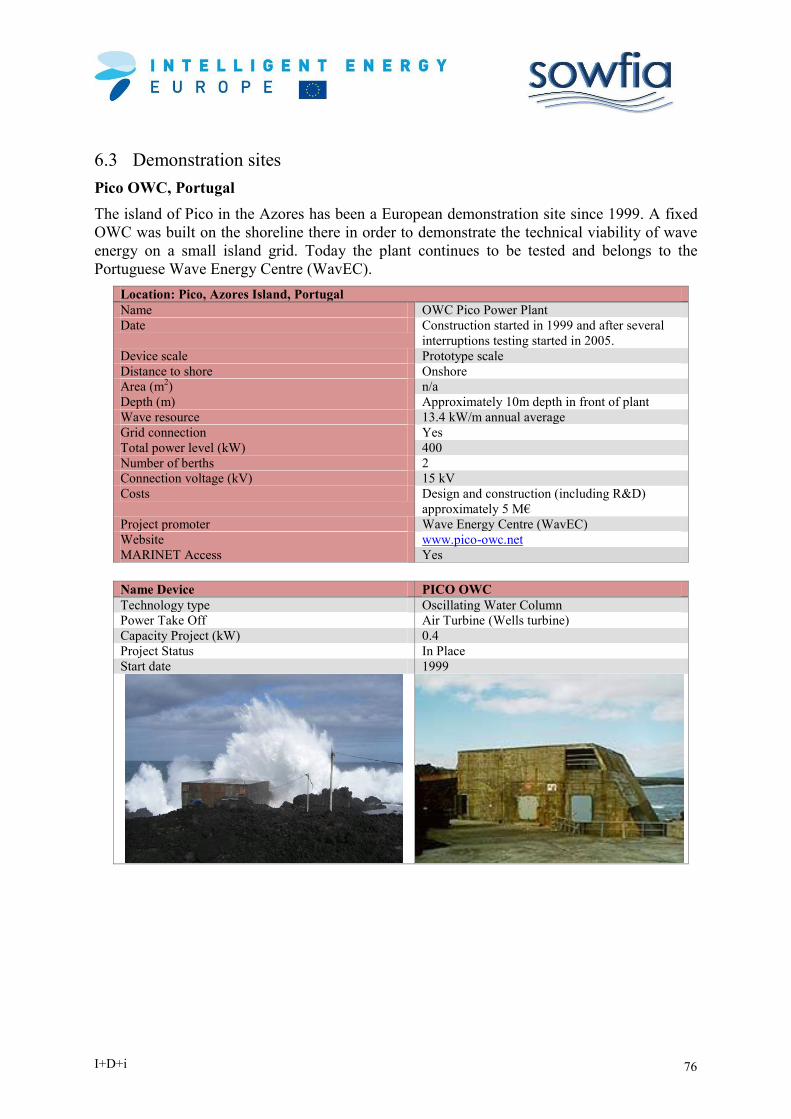
I+D+i 76
6.3 Demonstration sites
Pico OWC, Portugal
The island of Pico in the Azores has been a European demonstration site since 1999. A fixed
OWC was built on the shoreline there in order to demonstrate the technical viability of wave
energy on a small island grid. Today the plant continues to be tested and belongs to the
Portuguese Wave Energy Centre (WavEC).
Location: Pico, Azores Island, Portugal
Name OWC Pico Power Plant
Date Construction started in 1999 and after several
interruptions testing started in 2005.
Device scale Prototype scale
Distance to shore Onshore
Area (m2) n/a
Depth (m)
Approximately 10m depth in front of plant
Wave resource 13.4 kW/m annual average
Grid connection Yes
Total power level (kW) 400
Number of berths 2
Connection voltage (kV) 15 kV
Costs Design and construction (including R&D)
approximately 5 M€
Project promoter Wave Energy Centre (WavEC)
Website www.pico-owc.net
MARINET Access Yes
Name Device PICO OWC
Technology type Oscillating Water Column
Power Take Off Air Turbine (Wells turbine)
Capacity Project (kW) 0.4
Project Status In Place
Start date 1999

I+D+i 77
Aguçadoura, Portugal
Aguçadoura test site is an offshore test centre located near Póvoa de Varzim, north of Oporto,
in Portugal. The first wave energy device to be tested at the site was the Archimedes Wave
swing in 2004, which was deployed there for a number of months. In 2008, three Pelamis
devices were deployed there and connected to the Portuguese grid in what was advertised as
the world‟s first wave farm. This was shut down two months after the official opening of the
farm. The site is presently being used for testing offshore wind turbines.
Location: Near Porto, in Portugal
Name Aguçadoura test site
Date 2007
Device scale Prototype scale
Distance to shore 5km
Area (m2) Not available
Depth (m)
40-50 m
Wave resource 32 kW/m
Grid connection Yes
Total power level (MW) 4 MW at present (future 20MW)
Number of berths 3
Connection voltage (kV) 15
Costs Unknown
Project promoter
Website -
MARINET Access No

I+D+i 78
Name Device Pelamis
Technology type Oscillator
Power Take Off Hydraulic
Capacity Project (MW) 2.25 MW (3 x 0.75 MW)
Project Status Ended
Start date 2008
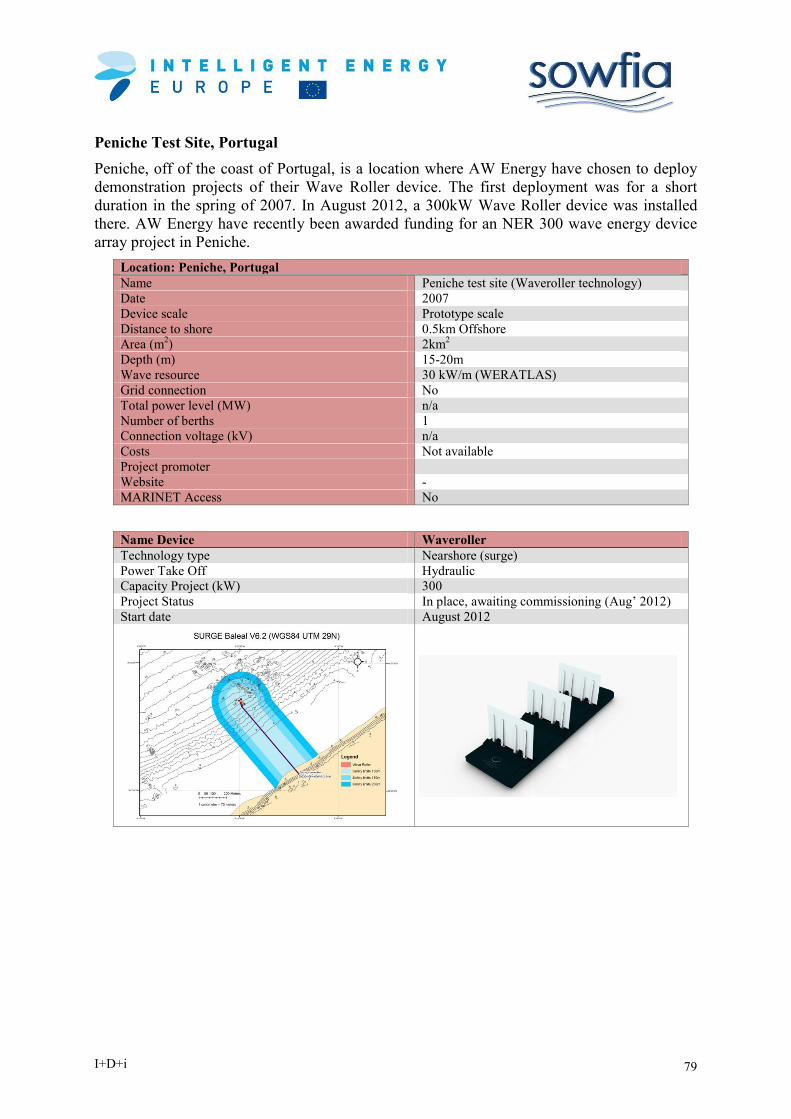
I+D+i 79
Peniche Test Site, Portugal
Peniche, off of the coast of Portugal, is a location where AW Energy have chosen to deploy
demonstration projects of their Wave Roller device. The first deployment was for a short
duration in the spring of 2007. In August 2012, a 300kW Wave Roller device was installed
there. AW Energy have recently been awarded funding for an NER 300 wave energy device
array project in Peniche.
Location: Peniche, Portugal
Name Peniche test site (Waveroller technology)
Date 2007
Device scale Prototype scale
Distance to shore 0.5km Offshore
Area (m2) 2km
2
Depth (m)
15-20m
Wave resource 30 kW/m (WERATLAS)
Grid connection No
Total power level (MW) n/a
Number of berths 1
Connection voltage (kV) n/a
Costs Not available
Project promoter
Website -
MARINET Access No
Name Device Waveroller
Technology type Nearshore (surge)
Power Take Off Hydraulic
Capacity Project (kW) 300
Project Status In place, awaiting commissioning (Aug‟ 2012)
Start date August 2012
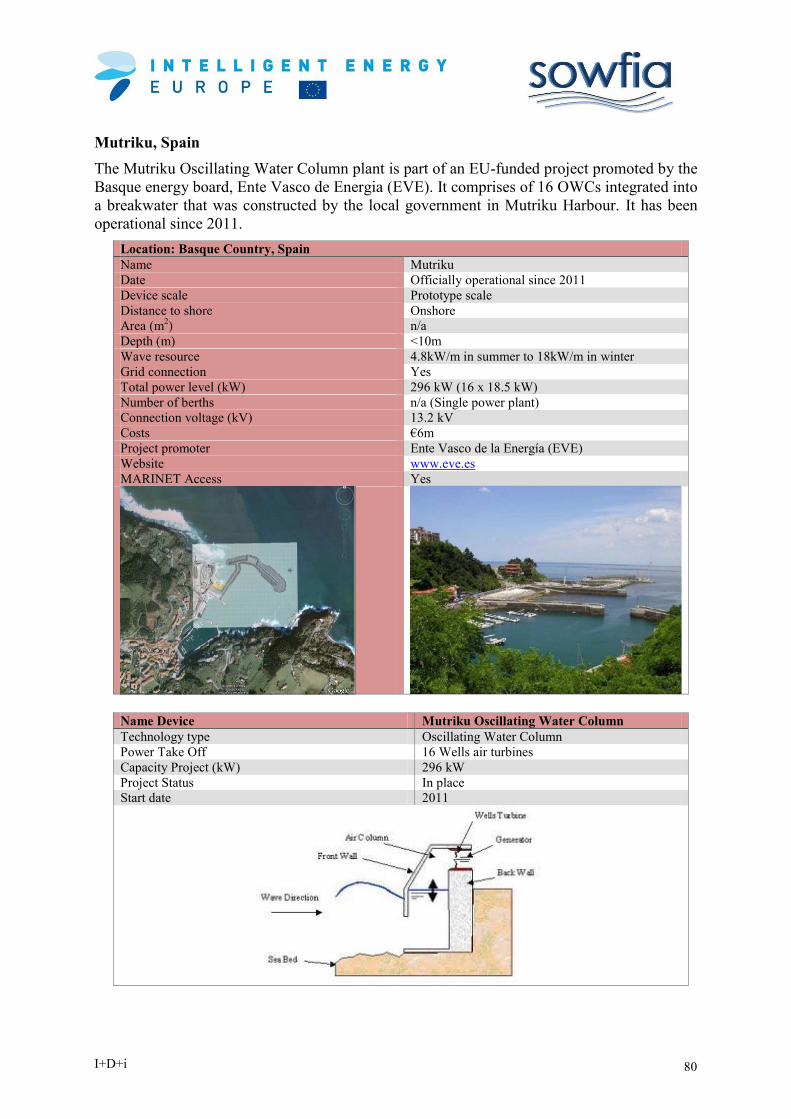
I+D+i 80
Mutriku, Spain
The Mutriku Oscillating Water Column plant is part of an EU-funded project promoted by the
Basque energy board, Ente Vasco de Energia (EVE). It comprises of 16 OWCs integrated into
a breakwater that was constructed by the local government in Mutriku Harbour. It has been
operational since 2011.
Location: Basque Country, Spain
Name Mutriku
Date Officially operational since 2011
Device scale Prototype scale
Distance to shore Onshore
Area (m2) n/a
Depth (m)
<10m
Wave resource 4.8kW/m in summer to 18kW/m in winter
Grid connection Yes
Total power level (kW) 296 kW (16 x 18.5 kW)
Number of berths n/a (Single power plant)
Connection voltage (kV) 13.2 kV
Costs €6m
Project promoter Ente Vasco de la Energía (EVE)
Website www.eve.es
MARINET Access Yes
Name Device Mutriku Oscillating Water Column
Technology type Oscillating Water Column
Power Take Off 16 Wells air turbines
Capacity Project (kW) 296 kW
Project Status In place
Start date 2011

I+D+i 81
Lysekil, Sweden
Lysekil Wave Energy Research Site has been developed by Uppsala University to a wave
energy device concept in real sea conditions over a long duration. The site is situated to the
north west of the city of Gothenburg, Sweden. A technical and biological research project is
running there called the Lysekil project. The site can accommodate ten point absorbers, a
maximum of ten linear generators, plus 2 sub-bottom substations and also a maximum of 30
environmental buoys for marine environmental studies. It started in 2003 and has permission
to operate until 2014.
Location: North west of Gothenburg, Sweden
Name Lysekil Wave Energy Research Site
Date Project started in 2004
Device scale Prototype Scale
Distance to shore 2 km
Area 40,000 m2
Depth (m)
25m
Wave resource 2.6 ± 0.3 kW/m
Grid connection Yes
Total power level (MW) Total 10MW total planned by end 2015
Number of berths n/a
Connection voltage (kV) 10kV
Costs Not available
Project promoter Uppsala University
Website http://www.el.angstrom.uu.se/forskningsprojekt/Wa
vePower/Lysekilsprojektet_E.html
MARINET Access No
Name Device Seabased
Technology type Vertical oscillation
Power Take Off Linear generator
Capacity Project 100 kW (10 x 10kW)
Project Status In Place
Start date 2004

I+D+i 82
6.4 Other demonstrations
Apart from the projects in test sites, there are other locations where devices are being tested or
are planned for deployment. A selection of these projects is included below.
Denmark
Name Device Leancon Poseidon FPP
Technology type OWC Oscillator
Power Take Off Air Turbine Hydro Turbine
Location Leancon Onsevig
Capacity Project 0.14 MW
Project Status In Place In Place
Start date 2007 2009

I+D+i 83
Netherlands
Name Device Wave Rotor (c-Energy)
Technology type Vertical Oscillation
Power Take Off Hydro Turbine
Location Borssele
Capacity Project 0.035 MW
Project Status Completed
Start date 2009

I+D+i 84
Spain
Name Device Oceantec WEC
Ocean Power
Technologies PB40
Ocean Power
Technologies PB40
(WAVEPORT
Project)
Technology
type
Oscillator Point Absorber Point Absorber
Power Take Off Hydraulic system Hydraulic system Hydraulic system
Location Basque Country Santoña Santoña
Capacity Project 500kW 40 kW
40kW
Project Status Proposed Completed
Planned
Start date 2013+ 2008 2012+
Oceantech WEC
OPT Powerbuoy
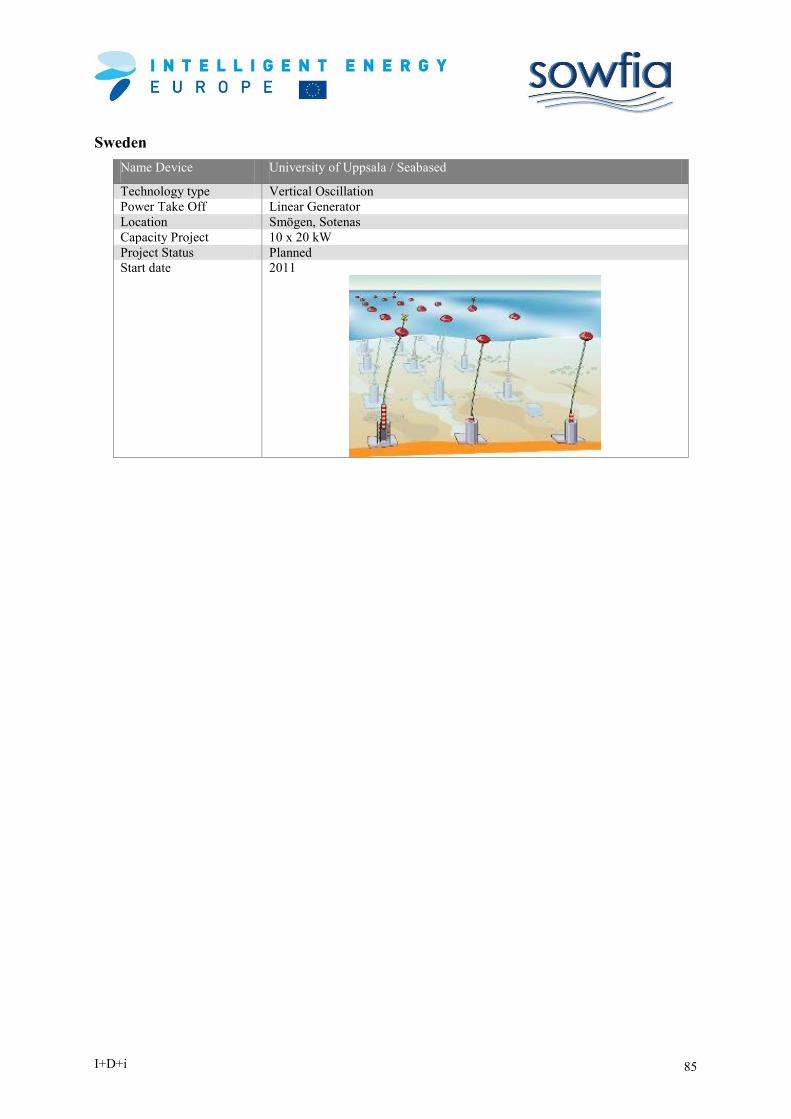
I+D+i 85
Sweden
Name Device University of Uppsala / Seabased
Technology type Vertical Oscillation
Power Take Off Linear Generator
Location Smögen, Sotenas
Capacity Project 10 x 20 kW
Project Status Planned
Start date 2011

I+D+i 86
UK
Name Device Pelamis Oyster
Technology type Attenuator Surge flap
Power Take Off Hydraulic system Hydro turbine
Location Shetland Bernera Sutherland North West Lewis
Capacity Project
(MW)
10 10 15 40
Project Status Proposed Proposed Proposed Proposed
Start date Not
available
Not
available
Not
available
Not available
Name Device Wavegen Wells Turbine Ocean Power Technologies PB150
Technology type OWC Point absorber
Power Take Off Air Turbine Hydraulic
Location Islay Limpet 33 nautical miles from Invergordon,
Scotland
Capacity Project 500kW 150kW
Project Status In Place Completed (2011)
Start date 2000 2011

I+D+i 87
Portugal
Name Device Wavebob (EU FP7 STANDPOINT
PROJECT)
Technology type Point Absorber
Power Take Off Hydraulic
Location Either Wave Energy Pilot Zone, near
Nazare or
Capacity Project 1.5MW
Project Status Planned
Start date 2012