cat compensation
TRANSCRIPT

8/9/2019 Cat Compensation
http://slidepdf.com/reader/full/cat-compensation 1/7
61
Executive Compensation Tables
2009 Summary Compensation Table
Name andPrincipal Position Year Salary Bonus 2
Stock Awards 3
Option Awards 4
Non-Equity
Incentive PlanCompensation 5
Change inPension Value
and NonqualifiedDeferred
CompensationEarnings 6
All Other Compensation 7 Total
J.W. Owens 2009 $ 1,550,004 $ — $ 407,413 $ 3,578,115 $ 868,001 $ 1,985,254 $ 360,998 $ 8,749,785
Chairman & CEO 2008 $ 1,550,004 $ — $ 981,794 $ 7,461,609 $ 4,353,227 $ 2,932,489 $ 377,413 $ 17,656,536
2007 $ 1,512,504 $ 300,000 $ 1,186,354 $ 7,136,911 $ 4,442,998 $ 2,575,395 $ 324,147 $ 17,478,309
D.R. Oberhelman 2009 $ 729,996 $ — $ 148,292 $ 1,179,874 $ 266,635 $ 505,259 $ 164,719 $ 2,994,775
Group President 2008 $ 729,996 $ 60,000 $ 284,238 $ 2,577,707 $ 1,495,186 $ 619,845 $ 124,812 $ 5,891,784
2007 $ 729,996 $ 198,000 $ 289,631 $ 2,610,192 $ 1,666,505 $ 568,400 $ 121,431 $ 6,184,155
R.P. Lavin 1 2009 $ 584,004 $ — $ 132,644 $ 1,055,465 $ 196,257 $ 366,197 $ 148,887 $ 2,483,454
Group President 2008 $ 584,004 $ 10,000 $ 363,633 $ 2,484,182 $ 1,071,222 $ 381,424 $ 619,217 $ 5,513,682
S.L. Levenick 2009 $ 729,996 $ — $ 132,644 $ 1,055,465 $ 264,505 $ 621,419 $ 144,239 $ 2,948,268
Group President 2008 $ 729,996 $ 10,000 $ 284,238 $ 2,577,707 $ 1,457,336 $ 699,119 $ 212,908 $ 5,971,304
2007 $ 712,248 $ 110,000 $ 289,631 $ 2,579,339 $ 1,560,817 $ 531,446 $ 180,868 $ 5,964,349
E.J. Rapp 1 2009 $ 584,004 $ — $ 132,644 $ 1,055,465 $ 196,190 $ 362,994 $ 100,886 $ 2,432,183
Group President 2008 $ 584,004 $ 10,000 $ 323,936 $ 2,453,022 $ 1,071,010 $ 312,921 $ 49,348 $ 4,804,241
G.R. Vittecoq8 2009 $ 895,957 $ — $ 140,003 $ 1,113,944 $ 327,253 $ 882,754 $ 35,838 $ 3,395,749
Group President 2008 $ 880,993 $ 20,000 $ 284,238 $ 2,484,182 $ 1,735,385 $ 843,600 $ 45,240 $ 6,293,638
2007 $ 826,177 $ 82,618 $ 422,801 $ 2,270,803 $ 1,896,463 $ 1,228,584 $ 43,047 $ 6,770,493
S.H. Wunning 2009 $ 729,996 $ — $ 132,644 $ 1,055,465 $ 264,925 $ 481,115 $ 168,011 $ 2,832,156
Group President 2008 $ 729,996 $ 10,000 $ 284,238 $ 2,484,182 $ 1,465,075 $ 777,695 $ 190,418 $ 5,941,604
2007 $ 715,746 $ 24,000 $ 289,631 $ 2,585,518 $ 1,581,445 $ 708,727 $ 160,698 $ 6,065,765
D.B. Burritt 2009 $ 504,000 $ — $ 89,945 $ 505,129 $ 144,791 $ 438,896 $ 59,212 $ 1,741,973
Vice President & CFO 2008 $ 494,751 $ 25,000 $ 169,478 $ 1,024,730 $ 858,879 $ 436,890 $ 88,269 $ 3,097,997
2007 $ 454,503 $ — $ 155,485 $ 981,632 $ 930,660 $ 352,648 $ 102,032 $ 2,976,9601 Mr. Lavin and Mr. Rapp were not NEOs in 2007.2 There was no Lump Sum Discretionary Cash Bonus awarded to NEOs for 2009 performance.
3 The following Restricted Stock Units (RSUs) were granted to NEOs on March 2, 2009: Mr. Owens —20,152; Mr. Oberhelman —7,335; Mr. Lavin —6,561; Mr. Levenick —6,561; Mr. Rapp—6,561; Mr. Vittecoq —6,925; Mr. Wunning —6,561; and Mr. Burritt —4,449. The amounts included in this column represent the aggregate grant date fair market value for RSUs andrestricted stock granted in the years shown calculated in accordance with Financial Accounting Standards Board Standards Codification Topic 718, Compensation – Stock Compensation(FASB ASC Topic 718). In general, the aggregate grant date fair market value is the amount of the total expense the Company expects to report in its financial reporting over the equityaward’s vesting schedule. The amounts reported reflect the total accounting expense and do not reflect the actual value that will be realized by the NEO. Assumptions made in thecalculation of these amounts are included in Note 2 “Stock based compensation” to the Company’s consolidated financial statements for the fiscal year ended December 31, 2009, included inthe Company’s Annual Report on Form 10-K (Form 10-K) filed with the SEC on February 19, 2010.
4 The following SARs were granted to NEOs on March 2, 2009: Mr. Owens —504,180; Mr. Oberhelman —166,252; Mr. Lavin —148,722; Mr. Levenick —148,722; Mr. Rapp —148,722; Mr.Vittecoq —156,962; Mr. Wunning —148,722; and Mr. Burritt —71,176. The amounts included in this column represent the aggregate grant date fair market value for SARs granted in theyears shown in accordance with FASB ASC Topic 718. In general, the aggregate grant date fair market value is the amount of the total expense the Company expects to report in its financialreporting over the equity award’s vesting schedule. The amounts reported reflect the total accounting expense and do not reflect the actual value that will be realized by the NEO.Assumptions made in the calculation of these amounts are included in Note 2 “Stock based compensation” to the Company’s consolidated financial statements for the fiscal year endedDecember 31, 2009, included in the Company’s Form 10-K filed with the SEC on February 19, 2010.
5 The amounts in this column reflect the cash payments made to NEOs under the LTCPP with respect to performance over a three-year plan cycle from 2007 through 2009. The 2009 ESTIPor STIP did not trigger a payout, as the performance metrics of the plan(s) were not achieved.
6 Because NEOs do not receive “preferred” or “above market” earning on compensation deferred into SDCP, SEIP and/or DEIP, the amount shown represents only the change between theactuarial present value of each officer’s total accumulated pension benefit between December 31, 2008 and December 31, 2009. The amount assumes the pension benefit is payable at eachNEO’s earliest unreduced retirement age based upon the officer’s current compensation.
7 All Other Compensation for 2009 consists of the following items detailed in a separate table appearing on page 62: Matching contributions to the Company’s 401(k) plan; matchingcontributions to SDCP/EIP; corporate aircraft usage; home security; life insurance premiums for Mr. Owens under the Directors’ Charitable Award Program; and ISE allowances.
8 All amounts reported for Mr. Vittecoq were paid in Swiss Francs and have been converted to U.S. dollars using the exchange rate in effect on December 31, 2009 (1 Swiss Franc = .96340 USDollar). Mr. Vittecoq's 2009 Swiss Franc base salary has remained constant from 2008's level at CHF 929,994. The conversion of Swiss Franc to the U.S. dollar amount inflates Mr.Vittecoq's reported base salary, as the U.S. dollar has depreciated against the Swiss Franc.

8/9/2019 Cat Compensation
http://slidepdf.com/reader/full/cat-compensation 2/7
62
2009 All Other Compensation Table
Name Year
MatchingContributions
401(k)
MatchingContributions
SDCP/EIPFinancial
Counseling 2 Corporate Aircraft 3
TaxGross-Up on
Corporate Aircraft 3
HomeSecurity 4
Director’sCharitable
AwardInsurance
Premiums 5 Other 6 Total All Other Compensation
J. W. Owens 2009 $ 14,700 $ 189,494 $ — $ 116,523 $ — $ 5,201 $ 32,560 $ 2,520 $ 360,998
2008 $ 13,800 $ 213,780 $ 13,530 $ 89,044 $ 9,936 $ 1,952 $ 32,851 $ 2,520 $ 377,413
2007 $ 13,500 $ 168,672 $ 4,545 $ 102,840 $ 3,660 $ 919 $ 30,011 $ — $ 324,147
D. R. Oberhelman 2009 $ 14,700 $ 71,491 $ — $ 21,190 $ — $ 55,718 $ N/A $ 1,620 $ 164,719
2008 $ 13,800 $ 83,544 $ 5,325 $ 13,585 $ 3,273 $ 4,385 $ — $ 900 $ 124,812
2007 $ 13,500 $ 72,726 $ 4,975 $ 21,000 $ 4,795 $ 4,435 $ — $ — $ 121,431
R. P. Lavin 2009 $ 14,700 $ 51,974 $ — $ 520 $ — $ 950 $ N/A $ 80,743 $ 148,887
2008 $ 13,800 $ 50,972 $ 8,000 $ — $ 98 $ 1,520 $ — $ 544,827 $ 619,217
S. L. Levenick 2009 $ 14,700 $ 68,491 $ — $ 58,500 $ — $ 928 $ N/A $ 1,620 $ 144,239
2008 $ 13,800 $ 35,280 $ 8,000 $ 51,376 $ 2,572 $ 1,094 $ — $ 100,786 $ 212,908
2007 $ 13,500 $ 62,265 $ 8,000 $ 95,720 $ 464 $ 919 $ — $ — $ 180,868
E. J. Rapp 2009 $ 14,700 $ 51,974 $ — $ 32,587 $ — $ 725 $ N/A $ 900 $ 100,886
2008 $ 13,800 $ 21,240 $ 8,000 $ 3,458 $ 1,047 $ 903 $ — $ 900 $ 49,348
G. R. Vittecoq 2009 $ N/A 1 $ 35,838 $ — $ — $ — $ — $ N/A $ $ 35,838
2008 $ N/A1 $ 35,240 $ 10,000 $ — $ — $ — $ — $ — $ 45,240
2007 $ N/A1 $ 33,047 $ 10,000 $ — $ — $ — $ — $ — $ 43,047
S. H. Wunning 2009 $ 14,700 $ 68,491 $ — $ 83,200 $ — $ — $ N/A $ 1,620 $ 168,011
2008 $ 13,800 $ 75,242 $ 18,575 $ 81,181 $ — $ — $ — $ 1,620 $ 190,418
2007 $ 13,500 $ 65,178 $ 8,000 $ 74,020 $ — $ — $ — $ — $ 160,698
D. B. Burritt 2009 $ 14,700 $ 42,684 $ — $ — $ — $ 928 $ N/A $ 900 $ 59,212
2008 $ 13,800 $ 44,390 $ 6,600 $ 20,254 $ 1,423 $ 902 $ — $ 900 $ 88,269
2007 $ 13,500 $ 39,647 $ 7,500 $ 38,880 $ 1,586 $ 919 $ — $ — $ 102,032
1 Mr. Vittecoq participates in a non-U.S. Employee Investment Plan.
2 The Officers Financial Counseling Program was eliminated effective January 1, 2009.
3 Several of our NEOs serve as board members for other corporations at the request of the Company, and the personal usage noted above primarily consists of NEOflights to attend these outside board meetings. Under the rules of the SEC, use of aircraft for this purpose is deemed to be personal, even though Caterpillar considers these flights beneficial to the Company and for a business purpose. Other personal usage is limited to the NEOs, their spouses or other guests, and CEOapproval is required for all personal use. The value of personal aircraft usage reported above is based on Caterpillar’s incremental cost per flight hour, including theweighted average variable operating cost of fuel, oil, aircraft maintenance, landing and parking fees, catering and other smaller variable costs. Occasionally, aspouse or other guest may accompany the NEO, and if the Company aircraft is already scheduled for business purposes and can accommodate additionalpassengers, no additional variable operating cost is incurred. Effective January 1, 2009, the tax gross-up on spousal accompanied travel was eliminated. Companyaircraft is provided for security purposes and allows the NEOs to devote additional time to Caterpillar business.
4 Amounts reported for Home Security represent the cost provided by an outside security provider for hardware and monitoring service. The incremental costassociated with the home security services is determined based upon the amounts paid to the outside service provider.
5 Mr. Owens received no direct compensation for serving on the Board, but is entitled to participate in the Directors’ Charitable Award Program. The amount reportedincludes Company paid life insurance premiums and administrative fees for Mr. Owens’ participation in the program.
6 Mr. Lavin was an International Service Employee (ISE) based in China until his return to the U.S. in December of 2007. The amount shown includes foreign serviceallowances typically paid by the Company on behalf of ISEs, including allowances for Mr. Lavin’s foreign and U.S. taxes attributable to his international serviceassignment. These allowances are intended to ensure that our ISEs are in the same approximate financial position as they would have been if they lived in the U.S.during the time of their international service.
The amount shown also includes the premium cost of Company provided basic life insurance under a Group Variable Universal Life policy. The coverage amount istwo times base salary, capped at $500,000. The premium cost is as follows: Mr. Owens—$2,520; Mr. Oberhelman—$1,620; Mr. Lavin—$1,620; Mr. Levenick — $1,620; Mr. Rapp—$900; Mr. Wunning —$1,620; and Mr. Burritt —$900. Mr. Vittecoq is not covered under a Company sponsored life insurance product.

8/9/2019 Cat Compensation
http://slidepdf.com/reader/full/cat-compensation 3/7
63
Grants of Plan-Based Awards in 2009
Estimated Future Payouts Under Non-Equity Incentive Plan Awards 1
NameGrantDate Threshold Target Maximum
All Other Stock Awards:
Number of Shares of Stock or Units 2
All Other Option Awards:Number of SecuritiesUnderlyingOptions 3
Exercise or BasePrice of Option
Awards ($/share)
Grant DateFair Value
of Stock andOption Awards ($) 4
J.W. Owens LTCPP $ 1,317,503 $ 2,635,007 $ 3,952,510 — $ — $ —
ESTIP $ 627,752 $ 2,092,505 $ 4,000,000 — $ — $ — 03/02/2009 $ — $ — $ — 20,152 $ — $ 407,413
03/02/2009 $ — $ — $ — — 504,180 $ 22.17 $ 3,578,115D.R. Oberhelman LTCPP $ 626,117 $ 1,252,234 $ 1,878,351 — $ — $ —
ESTIP $ 218,999 $ 729,996 $ 1,459,992 — $ — $ —03/02/2009 $ — $ — $ — 7,335 $ — $ 148,29203/02/2009 $ — $ — $ — — 166,252 $ 22.17 $ 1,179,874
R. P. Lavin LTCPP $ 321,202 $ 642,404 $ 963,607 — $ — $ — ESTIP $ 175,201 $ 584,004 $ 1,168,008 — $ — $ — 03/02/2009 $ — $ — $ — 6,561 $ — $ 132,644
03/02/2009 $ — $ — $ — — 148,722 $ 22.17 $ 1,055,465S.L. Levenick LTCPP $ 401,498 $ 802,996 $ 1,204,493 — $ — $ —
ESTIP $ 218,999 $ 729,996 $ 1,459,992 — $ — $ —03/02/2009 $ — $ — $ — 6,561 $ — $ 132,64403/02/2009 $ — $ — $ — — 148,722 $ 22.17 $ 1,055,465
E.J. Rapp LTCPP $ 321,202 $ 642,404 $ 963,607 — $ — $ — ESTIP $ 175,201 $ 584,004 $ 1,168,008 — $ — $ — 03/02/2009 $ — $ — $ — 6,561 $ — $ 132,644
03/02/2009 $ — $ — $ — — 148,722 $ 22.17 $ 1,055,465G.R. Vittecoq LTCPP $ 492,776 $ 985,552 $ 1,478,328 — $ — $ —
ESTIP $ 268,787 $ 895,956 $ 1,791,912 — $ — $ —03/02/2009 $ — $ — $ — 6,925 $ — $ 140,00303/02/2009 $ — $ — $ — — 156,962 $ 22.17 $ 1,113,944
S.H. Wunning LTCPP $ 401,498 $ 802,996 $ 1,204,493 — $ — $ — ESTIP $ 218,999 $ 729,996 $ 1,459,992 — $ — $ — 03/02/2009 $ — $ — $ — 6,561 $ — $ 132,644
03/02/2009 $ — $ — $ — — 148,722 $ 22.17 $ 1,055,465D.B. Burritt LTCPP $ 226,800 $ 453,600 $ 680,400 — $ — $ —
STIP $ 133,583 $ 445,276 $ 890,552 — $ — $ —03/02/2009 $ — $ — $ — 4,449 $ — $ 89,94503/02/2009 $ — $ — $ — — 71,176 $ 22.17 $ 505,129
1 The amounts reported in this column are estimated awards under the LTCPP, ESTIP and STIP. The LTCPP estimates are based upon a predetermined percentageof an executive’s base salary throughout the three-year cycle, and Caterpillar’s achievement of specified performance levels (relative PPS growth and return onassets) over the three-year period. The threshold amount is earned if at least 50 percent of the targeted performance level is achieved. The target amount is earned if at least 100 percent of the targeted performance level is achieved. The maximum award is earned at 150 percent or greater of the targeted performance level. Basesalary levels for 2009 were used to calculate the estimated dollar value of future payments for the 2009 to 2011 performance cycle. The ESTIP estimates are basedupon the executive’s base salary for 2009, and the achievement of specific performance metrics (75 percent Corporate Return on Assets and 25 percent EnterpriseQuality). Prior to any ESTIP payout, a profit per share of $2.50 must be achieved for a payout to occur. The STIP estimate for Mr. Burritt was based upon his basesalary for 2009, and the achievement of specific performance metrics (87.5 percent Corporate Return on Assets and 12.5 percent Enterprise Quality). Prior to anySTIP payout, a profit per share of $2.50 must be achieved for a payout to occur. For the 2009 ESTIP and STIP, the threshold amount was earned if at least 30percent of the targeted performance level was achieved. The target amount was earned if at least 70 percent of the targeted performance level was achieved. Themaximum award was earned at 200 percent or greater of the targeted performance level, with a plan cap set at $4,000,000. The 2009 ESTIP and STIP performancemetrics were not achieved, and there was no cash payout for the 2009 plan year to report in the column “Non-Equity Incentive Plan Compensation” of the SummaryCompensation table.
2 All RSUs are granted to the NEOs under the LTIP and will vest three years from the grant date. Plan provisions exist for accelerated vesting in the event of termination due to long-service separation (age 55 with 10 or more years of Company service), death, total disability or change in control. The actual realizable valueof the RSU will depend on the fair market value of Caterpillar stock at the time of vesting.
3 Amounts reported represent SARs granted under the LTIP. The base price for all SARs granted to the NEOs is the closing price of Caterpillar stock on the grant date.The grant price was based upon the closing price ($22.17) for Caterpillar stock on the grant date of March 2, 2009. All SARs granted to the NEOs will vest three yearsfrom the grant date. Plan provisions exist for accelerated vesting in the event of termination due to long-service separation (age 55 with 10 or more years of Companyservice), death, total disability or change in control. The actual realizable value of the SAR will depend on the fair market value of Caterpillar stock at the time of exercise.
4 The amounts shown do not reflect realized compensation by the NEO. The amounts shown represent the value of the SAR and RSU awards granted to the NEOsbased upon the grant date value of the award as determined in accordance with FASB ASC Topic 718.

8/9/2019 Cat Compensation
http://slidepdf.com/reader/full/cat-compensation 4/7

8/9/2019 Cat Compensation
http://slidepdf.com/reader/full/cat-compensation 5/7
65
Outstanding Equity Awards at 2009 Fiscal Year-End (continued)
Option Awards Stock AwardsNumber of Securities Underlying
Unexercised SARs/Options
NameGrantDate
VestingDate Exercisable Unexercisable
SAR / OptionExercise
Price
SAR / OptionExpiration
Date 1
Number of Sharesor Units of Stock
That HaveNot Vested 2
Market Value of Shares or Units of Stock That Have
Not Vested 3
G.R. Vittecoq 06/12/2001 06/12/2004 48,000 — $ 26.7650 06/12/2011 — $ —06/11/2002 06/11/2005 54,000 — $ 25.3575 06/11/2012 — $ —06/10/2003 06/10/2006 54,000 — $ 27.1425 06/10/2013 — $ —
06/08/2004 12/31/2004 126,000 — $ 38.6275 06/08/2014 — $ —02/18/2005 02/18/2005 130,000 — $ 45.6425 02/18/2015 — $ —02/17/2006 02/17/2009 95,000 — $ 72.0500 02/17/2016 — $ —03/02/2007 03/02/2010 — 109,516 $ 63.0400 03/02/2017 — $ —03/03/2008 03/03/2011 — 111,294 $ 73.2000 03/03/2018 — $ —03/02/2009 03/02/2012 — 156,962 $ 22.1700 03/02/2019 — $ —
— — — — $ — — 15,866 14 $ 904,204— — — — $ — — 2,177 15 $ 124,067
S.H. Wunning 06/11/2002 06/11/2005 60,000 — $ 25.3575 06/11/2012 — $ —06/10/2003 06/10/2006 54,000 — $ 27.1425 06/10/2013 — $ —06/08/2004 12/31/2004 126,000 — $ 38.6275 06/08/2014 — $ —02/18/2005 02/18/2005 130,000 — $ 45.6425 02/18/2015 — $ —02/17/2006 02/17/2009 95,000 — $ 72.0500 02/17/2016 — $ —03/02/2007 03/02/2010 — 124,694 $ 63.0400 03/02/2017 — $ —03/03/2008 03/03/2011 — 111,294 $ 73.2000 03/03/2018 — $ —
03/02/2009 03/02/2012 — 148,722 $ 22.1700 03/02/2019 — $ —— — — — $ — — 15,502 16 $ 883,459D.B. Burritt 06/10/2003 06/10/2006 23,100 — $ 27.1425 06/10/2013 — $ —
06/08/2004 12/31/2004 23,100 — $ 38.6275 06/08/2014 — $ —02/18/2005 02/18/2005 54,000 — $ 45.6425 02/18/2015 — $ —02/17/2006 02/17/2009 48,000 $ 72.0500 02/17/2016 — $ —03/02/2007 03/02/2010 — 47,342 $ 63.0400 03/02/2017 — $ —03/03/2008 03/03/2011 — 45,909 $ 73.2000 03/03/2018 — $ —03/02/2009 03/02/2012 — 71,176 $ 22.1700 03/02/2019 $
— — — — $ — — 9,493 17 $ 541,0071 SARs granted in 2009 are exercisable three years after the grant date. The SARs were granted with a 10-year term, subject to earlier termination in the event of
separation from service.2 In addition to the RSUs and restricted stock granted in 2009 to the NEOs (reported in the 2009 Summary Compensation Table), the amounts shown also include the
portion of any prior grants that were not vested as of December 31, 2009. Plan provisions exist for accelerated vesting in the event of termination due to long-serviceseparation (age 55 with 10 or more years of company service), death, total disability or change in control.
3 The market value of the non-vested RSUs and restricted shares (or equivalent shares in the case of Mr. Vittecoq) is calculated using the closing price of Caterpillar
common stock on December 31, 2009 ($56.99 per share).4 This amount includes 14,238 RSUs that are scheduled to vest on March 2, 2010; 14,193 RSUs scheduled to vest on March 3, 2011; and 20,152 RSUs scheduled to
vest on March 2, 2012.5 This amount includes 6,664 shares of restricted stock scheduled to vest on March 1, 2010; 1,667 shares scheduled to vest on April 2, 2010; 1,667 shares scheduled to
vest on April 2, 2011; and 1,666 shares scheduled to vest on April 2, 2012.6 This amount includes 4,832 RSUs that are scheduled to vest on March 2, 2010; 4,109 RSUs scheduled to vest on March 3, 2011; and 7,335 RSUs scheduled to vest
on March 2, 2012.7 This amount includes 998 shares of restricted stock scheduled to vest on March 1, 2010, and 332 shares scheduled to vest on March 1, 2011.8 This amount includes 2,594 RSUs that are scheduled to vest on March 2, 2010; 4,109 RSUs scheduled to vest on March 3, 2011; and 6,561 RSUs scheduled to vest
on March 2, 2012.9 This amount includes 332 shares of restricted stock scheduled to vest on March 1, 2010; 334 shares scheduled to vest on April 2, 2010; 334 shares scheduled to vest
on April 1, 2011; 333 shares scheduled to vest on April 2, 2011; 333 shares scheduled to vest on April 1, 2012; 333 shares scheduled to vest on April 2, 2012; and 333shares scheduled to vest on April 1, 2013.
10 This amount includes 4,832 RSUs that are scheduled to vest on March 2, 2010; 4,109 RSUs scheduled to vest on March 3, 2011; 6,561 RSUs scheduled to vest onMarch 2, 2012.
11 This amount includes 334 shares of restricted stock scheduled to vest on March 1, 2010, and 332 shares scheduled to vest on March 1, 2011.12 This amount includes 2,594 RSUs that are scheduled to vest on March 2, 2010; 4,109 RSUs scheduled to vest on March 3, 2011; and 6,561 RSUs scheduled to vest
on March 2, 2012.13 This amount includes 334 shares of restricted stock scheduled to vest on April 2, 2010; 167 shares scheduled to vest on April 1, 2011; 333 shares scheduled to vest
on April 2, 2011; 167 shares scheduled to vest on April 1, 2012; 333 shares scheduled to vest on April 2, 2012; and 166 shares scheduled to vest on April 1, 2013.14 This amount includes 4,832 RSUs that are scheduled to vest on March 2, 2010; 4,109 RSUs scheduled to vest on March 3, 2011; and 6,925 RSUs scheduled to vest
on March 2, 2012.15 This amount includes 726 shares of restricted stock (in phantom form) scheduled to vest on April 2, 2010; 726 shares (in phantom form) scheduled to vest on April 2,
2011; and 725 shares (in phantom form) scheduled to vest on April 2, 2012.16 This amount includes 4,832 RSUs that are scheduled to vest on March 2, 2010; 4,109 RSUs scheduled to vest on March 3, 2011; and 6,561 RSUs scheduled to vest
on March 2, 2012.17 This amount includes 2,594 RSUs that are scheduled to vest on March 2, 2010; 2,450 RSUs scheduled to vest on March 3, 2011; and 4,449 RSUs scheduled to vest
on March 2, 2012.
8/9/2019 Cat Compensation
http://slidepdf.com/reader/full/cat-compensation 6/7
66
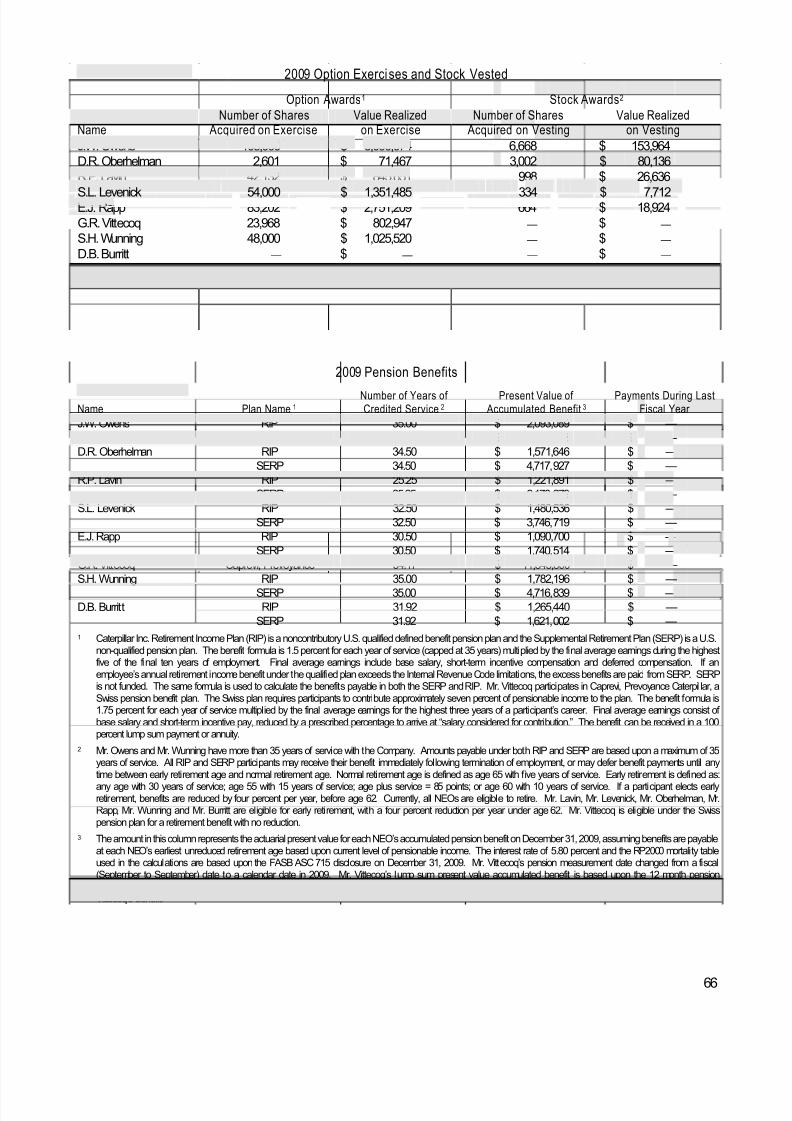
2009 Option Exercises and Stock Vested
Option Awards1 Stock Awards2
NameNumber of Shares
Acquired on ExerciseValue Realized
on ExerciseNumber of Shares
Acquired on VestingValue Realized
on VestingJ.W. Owens 108,000 $ 3,090,074 6,668 $ 153,964D.R. Oberhelman 2,601 $ 71,467 3,002 $ 80,136R.P. Lavin 42,132 $ 845,651 998 $ 26,636
S.L. Levenick 54,000 $ 1,351,485 334 $ 7,712E.J. Rapp 83,202 $ 2,751,209 664 $ 18,924G.R. Vittecoq 23,968 $ 802,947 — $ — S.H. Wunning 48,000 $ 1,025,520 — $ —
D.B. Burritt — $ — — $ —1 Upon exercise, option holders may surrender shares to pay the option exercise price and satisfy income tax-withholding requirements. The amounts shown are
gross amounts absent netting for shares surrendered.
2 Upon release of the restricted stock, shares are surrendered to satisfy income tax-withholding requirements. The amounts shown are gross amounts absent nettingfor shares surrendered. Mr. Vittecoq received a cash payment for the value of his equivalent restricted shares. Equivalent restricted shares are issued to Mr.Vittecoq as they provide a tax efficient award under Swiss tax law.
2009 Pension Benefits
Name Plan Name 1 Number of Years of Credited Service 2
Present Value of Accumulated Benefit 3
Payments During LastFiscal Year
J.W. Owens RIP 35.00 $ 2,093,089 $ —SERP 35.00 $ 16,124,598 $ —
D.R. Oberhelman RIP 34.50 $ 1,571,646 $ —SERP 34.50 $ 4,717,927 $ —
R.P. Lavin RIP 25.25 $ 1,221,891 $ —SERP 25.25 $ 2,178,279 $ —
S.L. Levenick RIP 32.50 $ 1,480,536 $ —SERP 32.50 $ 3,746,719 $ —
E.J. Rapp RIP 30.50 $ 1,090,700 $ —SERP 30.50 $ 1,740,514 $ —
G.R. Vittecoq Caprevi, Prevoyance 34.17 $ 11,843,800 $ —S.H. Wunning RIP 35.00 $ 1,782,196 $ —
SERP 35.00 $ 4,716,839 $ —D.B. Burritt RIP 31.92 $ 1,265,440 $ —
SERP 31.92 $ 1,621,002 $ —1 Caterpillar Inc. Retirement Income Plan (RIP) is a noncontributory U.S. qualified defined benefit pension plan and the Supplemental Retirement Plan (SERP) is a U.S.
non-qualified pension plan. The benefit formula is 1.5 percent for each year of service (capped at 35 years) multiplied by the final average earnings during the highestfive of the final ten years of employment. Final average earnings include base salary, short-term incentive compensation and deferred compensation. If anemployee’s annual retirement income benefit under the qualified plan exceeds the Internal Revenue Code limitations, the excess benefits are paid from SERP. SERPis not funded. The same formula is used to calculate the benefits payable in both the SERP and RIP. Mr. Vittecoq participates in Caprevi, Prevoyance Caterpillar, aSwiss pension benefit plan. The Swiss plan requires participants to contribute approximately seven percent of pensionable income to the plan. The benefit formula is1.75 percent for each year of service multiplied by the final average earnings for the highest three years of a participant’s career. Final average earnings consist of base salary and short-term incentive pay, reduced by a prescribed percentage to arrive at “salary considered for contribution.” The benefit can be received in a 100percent lump sum payment or annuity.
2 Mr. Owens and Mr. Wunning have more than 35 years of service with the Company. Amounts payable under both RIP and SERP are based upon a maximum of 35years of service. All RIP and SERP participants may receive their benefit immediately following termination of employment, or may defer benefit payments until anytime between early retirement age and normal retirement age. Normal retirement age is defined as age 65 with five years of service. Early retirement is defined as:
any age with 30 years of service; age 55 with 15 years of service; age plus service = 85 points; or age 60 with 10 years of service. If a participant elects earlyretirement, benefits are reduced by four percent per year, before age 62. Currently, all NEOs are eligible to retire. Mr. Lavin, Mr. Levenick, Mr. Oberhelman, Mr.Rapp, Mr. Wunning and Mr. Burritt are eligible for early retirement, with a four percent reduction per year under age 62. Mr. Vittecoq is eligible under the Swisspension plan for a retirement benefit with no reduction.
3 The amount in this column represents the actuarial present value for each NEO’s accumulated pension benefit on December 31, 2009, assuming benefits are payableat each NEO’s earliest unreduced retirement age based upon current level of pensionable income. The interest rate of 5.80 percent and the RP2000 mortality tableused in the calculations are based upon the FASB ASC 715 disclosure on December 31, 2009. Mr. Vittecoq’s pension measurement date changed from a fiscal(September to September) date to a calendar date in 2009. Mr. Vittecoq’s lump sum present value accumulated benefit is based upon the 12 month pensionmeasurement date ending on December 31, 2009. The EVK 2000 mortality table and the Swiss disclosure interest rate of 3.25 percent were used to calculate Mr.Vittecoq’s benefit.

8/9/2019 Cat Compensation
http://slidepdf.com/reader/full/cat-compensation 7/7
67
2009 Nonqualified Deferred Compensation 1
Name PlanName
ExecutiveContributions
in 2009 1
RegistrantContributions
in 2009 2
AggregateEarnings in
2009 3
AggregateBalance
at 12/31/09 4
J.W. Owens SDCP $ 189,494 $ 189,494 $ 491,230 $ 1,833,156
SEIP $ — $ — $ 168,362 $ 709,933
DEIP $ — $ — $ 257,481 $ 1,105,316
D.R. Oberhelman SDCP $ 71,491 $ 71,491 $ 370,307 $ 1,219,547
SEIP $ — $ — $ 122,680 $ 500,324
DEIP $ — $ — $ 161,667 $ 659,323
R.P. Lavin SDCP $ 161,400 $ 51,974 $ 303,969 $ 760,181
SEIP $ — $ — $ 45,051 $ 183,732
DEIP $ — $ — $ 3,012 $ 12,285
S.L. Levenick SDCP $ 240,040 $ 68,491 $ 379,830 $ 2,125,909
SEIP $ — $ — $ 7,337 $ 30,444
DEIP $ — $ — $ 531,671 $ 3,317,614
E.J. Rapp SDCP $ 51,974 $ 51,974 $ 340,888 $ 1,222,127
SEIP $ — $ — $ 11,419 $ 47,596
DEIP $ — $ — $ 79,997 $ 611,986
G.R. Vittecoq EIP $ 53,757 $ 35,838 $ 542,394 $ 2,197,860
S.H. Wunning SDCP $ 390,255 $ 68,491 $ 297,176 $ 2,362,309
SEIP $ — $ — $ 80,492 $ 328,566
DEIP $ — $ — $ 222,581 $ 909,210
D.B. Burritt SDCP $ 151,304 $ 42,684 $ 72,914 $ 606,364
SEIP $ — $ — $ 399 $ 17,231
DEIP $ — $ — $ 12,920 $ 96,2271 The Supplemental Deferred Compensation Plan (SDCP) is a non-qualified deferred compensation plan created in March of 2007 with a retroactive effective date of
January 1, 2005, which effectively replaced the existing plans, Supplemental Employees’ Investment Plan (SEIP) and Deferred Employees’ Investment Plan (DEIP).All future contributions will be made under SDCP.
2 SDCP allows eligible U.S. employees, including all NEOs (except Mr. Vittecoq), to voluntarily defer a portion of their base salary and short-term incentive pay into theplan and receive a Company matching contribution. LTCPP pay may also be deferred, but does not qualify for any Company matching contributions. Mr. Vittecoq isa participant in a non-U.S. Employee Investment Plan that allows him to contribute a portion of his base salary to the plan and receive a Company matchingcontribution. Amounts deferred by executives in 2009 for base salary, short-term incentive pay and/or long-term cash performance payouts are included in the 2009Summary Compensation Table. Matching contributions in non-qualified deferred compensation plans made by Caterpillar in 2009 are also included in the 2009 All
Other Compensation Table under the Matching Contributions SDCP column. SDCP participants may elect a lump sum payment, or an installment distributionpayable for up to 15 years after separation.
3 Aggregate earnings comprise interest, dividends, capital gains and appreciation/depreciation of investment results.
4 This column includes any amounts deferred under SEIP and/or DEIP prior to the creation of SDCP. The investment choices available to the participant mirror thoseof our 401(k) plan. Amounts in this column were previously reported in the Summary Compensation table for the years 2007 - 2009 as follows: Mr. Owens$1,143,892; Mr. Oberhelman $595,261; Mr. Lavin $315,318; Mr. Levenick $829,753; Mr. Rapp $146,428; Mr. Vittecoq $260,313; Mr. Wunning $1,396,360; and Mr.Burritt $362,062.