casterton flood intelligence & warning improvements
TRANSCRIPT

Casterton Flood Intelligence & Warning Improvements Reference: R.M8575.003.01.Final Date: 15 January 2014 Confidential
A part of BMT in Energy and Environment


T:\M8575.MAJ.Casteron_FI\docs\R.M8575.003.01.Final.docx
Casterton Flood Intelligence & Warning Improvements
Prepared for: Glenelg Hopkins Catchment Management Authority
Prepared by: BMT WBM Pty Ltd (Member of the BMT group of companies)
Offices Brisbane Denver London Mackay Melbourne Newcastle Perth Sydney Vancouver

T:\M8575.MAJ.Casteron_FI\docs\R.M8575.003.01.Final.docx
Document Control Sheet
BMT WBM Pty Ltd Level 5, 99 King Street Melbourne Vic 3000 Australia PO Box 604 Collins Street West Vic 8007 Tel: +61 3 8620 6100 Fax: +61 3 8620 6105 ABN 54 010 830 421 www.bmtwbm.com.au
Document: R.M8575.003.01.Final
Title: Casterton Flood Intelligence & Warning Improvements
Project Manager: Philip Pedruco
Author:
Client: Glenelg Hopkins Catchment Management Authority
Client Contact: Jacinta Herrmann
Client Reference: Philip Pedruco
Synopsis: This report documents the findings and results of the Casterton Flood Intelligence and Warning Improvements
REVISION/CHECKING HISTORY
Revision Number Date Checked by Issued by
0 19/11/2013 MT PP
1 14/1/2014 MT
PP
DISTRIBUTION
Destination Revision
0 1 2 3 4 5 6 7 8 9 10
GHCMA (hard copy) GHCMA (pdf) BMT WBM File BMT WBM Library
1 1
1 1 1 1

Casterton Flood Intelligence & Warning Improvements i Contents
T:\M8575.MAJ.Casteron_FI\docs\R.M8575.003.01.Final.docx
Contents
1 Introduction 1
1.1 Background (incl. History and Catchment details) 1
1.2 Previous Studies 1
1.3 Aims and Objectives 2
1.4 Report Outline 2
2 Data Collection 4
2.1 Data 4
3 Data Review and Analysis 6
3.1 Adjustments to data 6 3.1.1 LiDAR Data 6 3.1.2 Casterton Gauge Heights 6
3.2 Regression Relationships 6 3.2.1 Dergholm Gauge Heights 7 3.2.2 Wando Vale to Casterton 8 3.2.3 Dergholm to Casterton 10
4 Existing Flood Warning System 13
5 Flood Modelling 14
5.1 Hydrology 14 5.1.1 Flood Frequency Analysis 14 5.1.2 Rainfall-Runoff Modelling 15 5.1.3 Wannon River Inflow 18 5.1.3.1 Flood Frequency Analysis 18 5.1.3.2 Representative Hydrograph 19 5.1.3.3 Probable Maximum Flood 20
5.2 Hydraulics 20 5.2.1 Model Schematisation 20 5.2.2 TUFLOW Version 21 5.2.3 Event Modelling 21 5.2.4 Model Extent 23 5.2.5 2D Domain 23 5.2.5.1 2D Hydraulic Structures 23 5.2.5.2 Surface Roughness 23 5.2.6 1D Network 23 5.2.7 Boundary Conditions 23

Casterton Flood Intelligence & Warning Improvements ii Contents
T:\M8575.MAJ.Casteron_FI\docs\R.M8575.003.01.Final.docx
5.3 Flood Mapping 26 5.3.1 Description of flooding 26 5.3.1.1 20% AEP event 26 5.3.1.2 10% AEP event 26 5.3.1.3 5% AEP event 26 5.3.1.4 2% AEP event 27 5.3.1.5 1% AEP event 27 5.3.1.6 The PMF event 27 5.3.2 Comparison with previous flood mapping 34
5.4 Influence of the Wannon River 40
6 Flood Information 45
6.1 Casterton Gauge Level 45
6.2 Property Inundation 46
6.3 Road Closures 46
7 Flood Visualisation Tool 48
7.1 Flood Information 48
7.2 Features of the Flood Visualisation Tool 48
7.3 Limitations 49
8 Conclusions and Recommendations 50
8.1 River gauging relationships 50 8.1.1 Updated flood modelling and mapping 50 8.1.2 Review and update of the flood warning system for Casterton 51 8.1.3 Flood Visualisation Tool 51
8.2 Recommendations 51
9 References 52
Appendix A Regression Analysis Diagnostics A-1
A.1 Old and new Dergholm Regression Analysis Diagnostics A-1
A.2 Wando Vale – Casterton Regression Analysis Diagnostics A-3
A.3 Dergholm – Casterton Regression Analysis Diagnostics A-5
Appendix B Flood Warning Service Level Agreement for the Glenelg River at Casterton B-1
Appendix C Flood Forecast and Warning Service Level Agreement for the Glenelg River at Casterton C-1
Appendix D PMP Calculation D-1
Appendix E Property Inundation E-1

Casterton Flood Intelligence & Warning Improvements iii Contents
T:\M8575.MAJ.Casteron_FI\docs\R.M8575.003.01.Final.docx
List of Figures Figure 1-1 Significant hydrologic features 3
Figure 3-1 Old and New Dergholm Regression Analysis 8
Figure 3-2 Wando Vale Casterton Regression Analysis 10
Figure 3-3 Dergholm Casterton Regression Analysis 12
Figure 5-1 RORB model layout 17
Figure 5-2 Flood Magnitude prediction by FFA 19
Figure 5-3 TUFLOW model layout 25
Figure 5-4 Casterton 20% AEP Peak Flood Depth Map 28
Figure 5-5 Casterton 10% AEP Peak Flood Depth Map 29
Figure 5-6 Casterton 5% AEP Peak Flood Depth Map 30
Figure 5-7 Casterton 2% AEP Peak Flood Depth Map 31
Figure 5-8 Casterton 1% AEP Peak Flood Depth Map 32
Figure 5-9 Casterton PMF Peak Flood Depth Map 33
Figure 5-10 Comparison of previous and revised flood mapping for the 10% AEP event 36
Figure 5-11 Comparison of previous and revised flood mapping for the 5% AEP event 37
Figure 5-12 Comparison of previous and revised flood mapping for the 2% AEP event 38
Figure 5-13 Comparison of previous and revised flood mapping for the 1% AEP event 39
Figure 5-14 Comparison of the 1% AEP hydrographs for Glenelg and Wannon Rivers 40
Figure 5-15 1% AEP Flood Level Long Section in the Glenelg River with various Wannon inflow offsets 41
Figure 5-16 Glenelg River chainages 42
Figure 5-17 Level time plots for various locations on the Glenelg River 43
Figure 5-18 Peak gauge height at Casterton under a number of combination of inflows on the Glenelg and Wannon Rivers 44
Figure 6-1 AEP above floor flooding, property inundation and road closures 47
Figure A-1 Old and New Dergholm Residuals verses Fitted Plot A-2
Figure A-2 Old and New Dergholm Normal Q-Q Plot A-2
Figure A-3 Old and New Dergholm Residuals verses Fitted Leverage Plot A-3
Figure A-4 Wando Vale – Casterton Residuals verses Fitted Plot A-4
Figure A-5 Wando Vale – Casterton Normal Q-Q Plot A-4
Figure A-6 Wando Vale – Casterton Residuals verses Fitted Leverage Plot A-5
Figure A-7 Dergholm – Casterton Residuals verses Fitted Plot A-6
Figure A-8 Dergholm – Casterton Residuals Normal Q-Q Plot A-6
Figure A-9 Dergholm – Casterton Residuals verses Fitted Leverage Plot A-7
Casterton Flood Intelligence & Warning Improvements iv Contents
T:\M8575.MAJ.Casteron_FI\docs\R.M8575.003.01.Final.docx
List of Tables Table 1-1 Notable Floods in Casterton 1
Table 2-1 Datasets 4
Table 3-1 Changes to Casterton Gauge Heights 6
Table 3-2 Old and New Gauge Heights for the Glenelg River at Casterton 7
Table 3-3 Wando Vale Casterton Peak Height Data 9
Table 3-4 Dergholm Casterton Peak Height Data 11
Table 5-1 Peak flow estimates for the Glenelg River at Casterton 15
Table 5-2 List of durations the hydraulic model was run for 16
Table 5-3 Flood Magnitudes for Different ARI as estimated by the FFA 19
Table 5-4 GSAM Estimate of PMP Rainfall Depth 20
Table 5-5 The PMF peak flows for a variety of durations 20
Table 5-6 List of modelled events 21
Table 6-1 Casterton Gauge Heights for notable events 45
Table A-1 Wando Vale – Casterton Regression model summary A-1
Table A-2 Wando Vale –Casterton Regression model summary A-4
Table A-3 Wando Vale –Casterton Regression model summary A-6
Table E-1 Property Inundation E-2
Table E-2 Above Floor Flooding E-12

Casterton Flood Intelligence & Warning Improvements 1 Introduction
T:\M8575.MAJ.Casteron_FI\docs\R.M8575.003.01.Final.docx
1 Introduction The town of Casterton is located in south-western Victoria on the Glenelg River and has a long history of flooding with major flood events in 1906, 1946 and 1983. To improve the understanding of the impact of flooding on the Casterton community the Glenelg Hopkins Catchment Management Authority (GHCMA) commissioned the Casterton Flood Intelligence and Warning Improvements study (the Study). The report documents the findings and conclusions of the Study.
1.1 Background (incl. History and Catchment details) The location of Casterton is shown in Figure 1-1 together with the Glenelg River catchment including major tributaries, river and rainfall gauges and other significant features. The Glenelg River has a catchment area of approximately 12,000km2 at its point of discharge to Bass Strait at Nelson.
The catchment headwaters are in the Grampians which drain towards the west to Rockland Reservoir. From Rocklands the Glenelg River generally drains to the west until its confluence with the Chetwynd River upstream of Dergholm. The river then gradually turns to the south east and flows towards Casterton, with the Wando River joining the Glenelg between Dergholm and Casterton. Downstream of Casterton, near Sandford, the Wannon River joins the Glenelg River, which is its largest tributary. From this point the Glenelg River drains in a generally southerly direction until it discharges to Bass Strait.
The Casterton Central Business District is located on the right hand bank of the Glenelg River in an incised valley that rises steeply to the east and west of the town. During major flood events water breaks out of the Glenelg River and inundates the town centre from the north. During minor flood events water inundates the low-lying land near the river. In addition to the major flood events experienced in Casterton the town has been subject to numerous smaller flood events. Floods typically occur in later winter and early spring. Table 1-1 provides a list of notable floods in Casterton.
Table 1-1 Notable Floods in Casterton
1870 1893 1894 1906 1909 1910 1915 1946 1950
1955 1958 1975 1978 1983 1991 1992 1996
1.2 Previous Studies A number of studies on flooding in Casterton have previously been completed. These include:
Feasibility Study on the Construction of a Levee around the Casterton Township (Alexander, 1983)
Glenelg Flood Investigations (Cardno Lawson Treloar Pty Ltd, 2008) on behalf of Glenelg Shire Council
A History of Flooding in Casterton (Glenelg Hopkins Catchment Management Authority, 2010)
Casterton Flood Intelligence & Warning Improvements 2 Introduction
T:\M8575.MAJ.Casteron_FI\docs\R.M8575.003.01.Final.docx
Casterton Flood Investigations Floodplain Management Report (Cardno Pty Ltd1, 2010) on behalf of Glenelg Shire Council and Glenelg Hopkins Catchment Management Authority.
1.3 Aims and Objectives The purpose of the Study was to develop effective flood warning and flood mapping tools with the objective of providing an improved flood warning system for Casterton. In order to achieve this objective the Study had the following aims:
The collection and collation of flood information for Casterton;
The review of the existing flood warning system;
The development and revision of flood models for Casterton;
The production of flood maps for Casterton;
The update of the flood warning system for Casterton; and
The development of a Flood Visualisation Tool.
1.4 Report Outline This report documents the findings, results and recommendations of the Study. The report is presented in the following 8 Sections:
1. Introduction;
2. Data Collection;
3. Data Review;
4. Existing Flood Warning System;
5. Flood Modelling;
6. Flood Information;
7. Flood Visualisation Tool; and
8. Conclusions and Recommendations.
1 Formerly Cardno Lawson Treloar Pty Ltd


Casterton Flood Intelligence & Warning Improvements 4 Data Collection
T:\M8575.MAJ.Casteron_FI\docs\R.M8575.003.01.Final.docx
2 Data Collection A number of datasets were obtained to undertake the Study and these are outlined in this Section.
2.1 Data As part of the Study a number of organisations were contacted to obtain data, these organisation included:
Glenelg Hopkins Catchment Management Authority (GHCMA);
Victorian State Emergency Service (VicSES);
Bureau of Meteorology (BoM);
Thiess Environmental Service; and
Glenelg Shire Council.
The datasets used in the Study are listed in Table 2-1 together with relevant details.
Table 2-1 Datasets
Dataset Supplier Date Comments
Glenelg River Peak Stage Correlation: Casterton to Dergholm
BoM 1976 - 2002
Dergholm Flood Class Level Transfer GHCMA
Glenelg River at Casterton River Height (238212)
VWRDW* 1973 - 2002
Glenelg River at Casterton Instantaneous Flow (238212)
VWRDW* 1973 - 2002 Significant data gap 01/01/1989 to 02/12/2001
Glenelg River at Dergholm Instantaneous Flow (238211)
VWRDW* 2004 - 2012
Glenelg River at Sandford Instantaneous Flow (238202)
VWRDW* 1908 - 2012 Significant data gap from 31/07/1918 to 08/02/1957
Henty Creek at Henty Instantaneous Flow (238238)
VWRDW* 1974 - 1989
Wannon River at Henty Instantaneous Flow (238228)
VWRDW* 1973 - 2012
Wannon River at Sandford Computed Average Daily Flow (238222)
VWRDW* 1963 - 1967

Casterton Flood Intelligence & Warning Improvements 5 Data Collection
T:\M8575.MAJ.Casteron_FI\docs\R.M8575.003.01.Final.docx
Dataset Supplier Date Comments
Casterton Floor Level Survey Data GHCMA 2013
Casterton Flood Investigation: Floodplain Management Report
Cardno 2011
Casterton Flood Investigation: Peak Flood Surfaces
Cardno 2011 10%, 5%, 2% and 100% AEP events only
Casterton Flood Investigation: RORB model
Cardno 2011
Glenelg River Cross Section Survey 2006
Glenelg Flood Investigation Cardno 2008
A Brief History of Flooding at Casterton GHCMA 2010
GIS and Aerial Photography GHCMA
LiDAR GSC 2009
Dergholm (Hillgrove) Daily Rainfall BoM 1899 - 2013
BoM Paper Charts of Glenelg River BoM 1964 - 1996
ISC LiDAR GHCMA 2010 See Section 3.1.1
* Victorian Water Resources Data Warehouse2 (note that the VWRDW has been superseded by the DEPI Water Monitoring site)
2 http://www.vicwaterdata.net/vicwaterdata/home.aspx

Casterton Flood Intelligence & Warning Improvements 6 Data Review and Analysis
T:\M8575.MAJ.Casteron_FI\docs\R.M8575.003.01.Final.docx
3 Data Review and Analysis The data obtained as part of the Study was reviewed to ensure its suitability for use. This included comparison with existing datasets, checking quality codes and other methods as appropriate. During this review a number of anomalies were noted and these were addressed as outlined below.
In addition, this section also describes investigations into the relationships between gauges. The relationships between the gauges were investigated using linear regression. The locations of these gauges are shown on Figure 1-1.
3.1 Adjustments to data This Section reports any adjustments made to the collected data. During the review process it was noted that the LiDAR data had been corrected to site information in the previous flood mapping study.. The zero levels, or datums, for the river gauges were also reviewed and it was found that there had been historic changes to the zero gauge levels at Casterton and Dergholm. In addition, the location of the Glenelg River at Dergholm gauge had recently changed. The adjustments are discussed in more detail below.
3.1.1 LiDAR Data The LiDAR obtained for the Study had previously been reviewed by Cardno (2010). The Cardno study found that the LiDAR data differed from topographic survey by 320mm on average across Casterton town centre. This was corrected by lowering the LiDAR data by 320mm. This corrected dataset was used in the Study.
3.1.2 Casterton Gauge Heights The zero gauge level for the Glenelg River at Casterton gauge has changed over time. Thiess Environmental Services have provided the gauge zero levels provided in Table 3-1.
Table 3-1 Changes to Casterton Gauge Heights
Date gauge zero valid to Gauge Zero Level in m AHD
June 1965 to January 1969 38.888
January 1969 to August 1977 38.820
August 1977 to present 38.453
Where the Casterton gauge heights were required to be compared to modelled flood levels the appropriate adjustment was made.
3.2 Regression Relationships A number of regression relationships, or linear models, between old and new data as well as between gauging stations were investigated. This analysis is outlined below with further details provided in Appendix A.

Casterton Flood Intelligence & Warning Improvements 7 Data Review and Analysis
T:\M8575.MAJ.Casteron_FI\docs\R.M8575.003.01.Final.docx
3.2.1 Dergholm Gauge Heights The Dergholm stream gauge used for flood monitoring consisted of staff gauges only. The Bureau of Meteorology had an arrangement with the landholder who read the gauge and relayed that data to the BoM for flood warning. BoM received notification that the landholder was going to step down from this role in 2011. As part of the environmental flows monitoring along the Glenelg River a telemetered gauge was installed downstream of the flood warning gauge in 2004. When BoM received the notification that the landholder would no longer read the gauge it was determined that shifting the flood warning for Casterton to the existing telemetred gauge was the most appropriate course of action. The datum at the new location was not set the same level as the datum at the old location. For this reason it is necessary to derive a relationship between the two datums. To achieve this, a linear regression relationship was derived between concurrent readings from the old and new sites.
A total of 10 river peaks were obtained from the GHCMA for both the Old and New Dergholm gauge sites. The selected events are show in Table 3-2.
Table 3-2 Old and New Gauge Heights for the Glenelg River at Casterton
Dergholm Old
Gauge Height in m
Dergholm New
Gauge Height in m
2.95 3.23
3.00 3.32
3.18 3.59
3.38 3.77
3.50 3.82
3.97 4.32
4.60 4.82
4.10 4.41
4.60 4.85
4.00 4.37
A regression analysis using ordinary least squares was undertaken on the old and new Glenelg River heights at Dergholm and the results are presented in Figure 3-1. This figure demonstrates that there is a strong relationship between the old and new gauge heights at Dergholm, with a coefficient of determination (R2) of 0.99. This strong relationship was expected given that the gauging station has only moved downstream 100 - 200m. Regression model diagnostics are presented in Appendix A.

Casterton Flood Intelligence & Warning Improvements 8 Data Review and Analysis
T:\M8575.MAJ.Casteron_FI\docs\R.M8575.003.01.Final.docx
Figure 3-1 Old and New Dergholm Regression Analysis
3.2.2 Wando Vale to Casterton Anecdotal evidence from the community indicated that initial flood peaks on the Glenelg River at Casterton were due to discharge from the Wando River. Inspection of the stream flow records for Casterton and Wando Vale supported this and a regression analysis was undertaken.
The concurrent stream flow records from Casterton and Wando Vale were interrogated and a total of 10 flood events between 1975 and 1988 were selected. The initial peak river height at Casterton and the peak river height at Wando Vale were extracted. The selected events are shown in Table 3-2 together with the time and date of each of the peaks and the difference between the peaks in terms of hours.

Casterton Flood Intelligence & Warning Improvements 9 Data Review and Analysis
T:\M8575.MAJ.Casteron_FI\docs\R.M8575.003.01.Final.docx
Table 3-3 Wando Vale Casterton Peak Height Data
Date of Peak at
Wando
Wando Height
(m)
Date of Peak at
Casterton
Casterton
Height (m)
Difference in
hours
25/10/1975 17:00 1.90 26/10/1975 07:00 4.75 14
09/10/1975 17:00 1.73 10/10/1975 00:00 3.38 7
16/10/1976 11:00 2.66 16/10/1976 21:00 4.66 10
18/09/1978 13:00 3.10 18/09/1978 22:00 5.82 9
10/10/1979 07:00 1.94 10/10/1979 15:00 4.52 8
08/09/1983 11:00 2.68 09/09/1983 01:00 5.78 14
26/08/1984 20:00 1.95 27/08/1984 02:00 4.71 6
17/09/1986 11:00 1.71 17/09/1986 22:00 4.00 11
19/07/1987 00:00 1.44 19/07/1987 03:00 3.97 3
25/07/1988 16:00 1.63 25/07/1988 21:00 4.03 5
A regression analysis using ordinary least squares was undertaken on the peak flow at Wando Vale and the Casterton initial peak flow and is presented in Figure 3-2. This figure demonstrates that there is a relationship between the peak flow at Wando Vale and the initial peak at Casterton, with a coefficient of determination (R2) of 0.73. The resulting relationship is show in Figure 3-2 where Casterton is the initial peak on the Glenelg River at Casterton in meters and Wando is the Wando River peak at Wando Vale in meters. The average difference in the timing of the peaks from Wando Vale to Casterton is 8.7 hours with a range of 3 – 14 hours. Regression model diagnostics are presented in Appendix A.

Casterton Flood Intelligence & Warning Improvements 10 Data Review and Analysis
T:\M8575.MAJ.Casteron_FI\docs\R.M8575.003.01.Final.docx
Figure 3-2 Wando Vale Casterton Regression Analysis
3.2.3 Dergholm to Casterton Previous analysis by the BoM indicated that there is a strong relationship between flood peaks at Dergholm and Casterton, on the Glenelg River. Flood peak data for these two sites were obtained and a regression analysis undertaken.
There are only hard copy paper records of flood peaks at Dergholm for the period prior to 2010. Peak flood heights at Dergholm were extracted from paper records provided by the BoM. The corresponding flood peaks were extracted from the continuous series at Casterton where those records existed. Where corresponding flood peaks did not exist in Casterton, continuous record flood peaks were taken from the BoM paper records if they existed. The resulting paired flood events are presented in Table 3-4.

Casterton Flood Intelligence & Warning Improvements 11 Data Review and Analysis
T:\M8575.MAJ.Casteron_FI\docs\R.M8575.003.01.Final.docx
Table 3-4 Dergholm Casterton Peak Height Data
Casterton Event Date Dergholm Event Date Difference in
hours
6.08 02/10/1996 22:00 5.125 02/10/1996 03:00 19
4.55 05/08/1995 03:00 4.5 03/08/1995 22:00 29
3.8 20/07/1995 02:00 4.1 18/07/1995 00:00 50
3.9 29/09/1992 16:00 3.95 26/09/1992 07:00 81
4.45 25/09/1992 01:00 4.6 23/09/1992 15:30 33.5
3.85 01/09/1992 17:00 4.1 31/08/1992 18:30 22.5
4.05 19/09/1991 09:00 4.25 18/09/1991 04:00 29
6.19 24/08/1991 22:00 5.3 24/08/1991 02:00 20
4 07/09/1988 09:00 4.35 05/09/1988 18:00 39
4.1 27/07/1988 17:30 4.4 26/07/1988 18:00 23.5
3.25 24/10/1986 09:00 3.375 23/10/1986 17:00 16
4.1 19/09/1984 09:00 4.2 18/09/1984 06:00 27
3.85 06/09/1984 09:00 4.2 05/09/1984 06:00 27
6.3 09/09/1983 22:00 5.4 09/09/1983 02:00 20
5.4 10/08/1981 22:00 4.8 09/08/1981 15:00 31
5.25 19/08/1981 03:30 4.5 18/08/1981 16:30 11
Similar to the analysis between Wando Vale and Casterton, a regression analysis was undertaken on the peak flow at Dergholm and the peak flow Casterton, with the result presented in Figure 3-3. This figure demonstrates that there is a strong relationship between the peak flow at Dergholm and Casterton with a coefficient of determination (R2) of 0.89. The average difference in the timing of the peaks from Wando Vale to Casterton is 30 hours with a range of 11 – 81 hours. Regression model diagnostics are presented in Appendix A.

Casterton Flood Intelligence & Warning Improvements 12 Data Review and Analysis
T:\M8575.MAJ.Casteron_FI\docs\R.M8575.003.01.Final.docx
Figure 3-3 Dergholm Casterton Regression Analysis


Casterton Flood Intelligence & Warning Improvements 13 Existing Flood Warning System
T:\M8575.MAJ.Casteron_FI\docs\R.M8575.003.01.Final.docx
4 Existing Flood Warning System As part of the Study a workshop between stakeholders in the Casterton Flood Warning System was held on the 4th June 2013. The stakeholders included:
The BoM;
GHCMA;
DEPI;
VicSES;
GSC;
Michael Cawood and Associates; and
BMT WBM
Prior to the workshop a discussion paper titled Flood Warning Service Level Agreement for the Glenelg River at Casterton (BMT WBM and Michael Cawood and Associates, 2013a) was issued. The discussion paper provided background on floodplain management together with flood warning. The paper discussed the existing flood warning system including arrangements for service delivery in Victoria. The discussion paper also outlined matters for discussion at the workshop based on the information available at the time of writing. The discussion paper has been included in this report in Appendix B.
Following the workshop a draft Flood Forecast and Warning Service Level Agreement for the Glenelg River at Casterton (BMT WBM and Michael Cawood and Associates, 2013b) was issued to all stakeholders. The Service Level Agreement (SLA) outlines the roles and responsibilities of entities involved in the (total) flood warning system for the Glenelg River to Casterton along with draft delivery and performance criteria. The SLA has been included in this report in Appendix C.
At the time of writing the SLA had been reviewed by stakeholders with no requested amendments, however, it has not been formally endorsed by any stakeholders.


Casterton Flood Intelligence & Warning Improvements 14 Flood Modelling
T:\M8575.MAJ.Casteron_FI\docs\R.M8575.003.01.Final.docx
5 Flood Modelling Flood models are in fact a combination of a number of different mathematical relationships that represent different flood processes. In general, there is a hydrologic model which converts rainfall to runoff and a hydraulic model which calculates water levels, velocities and flood extents. The results of the hydraulic model are used to produce flood maps. This Section describes both the hydrologic and hydraulic modelling and also presents the flood mapping of Casterton. Also in this Section, the backwater effect from the Wannon River is analysed using the flood modelling results.
The flood modelling undertaken as part of the Study was based on existing flood modelling for the Casterton Flood Investigation: Floodplain Management Study (Cardno, 2010). This is referred to as Cardno (2010) for the remainder of the report. However, it was necessary to extend the flood modelling to achieve the aims of the Study. Brief descriptions of these models are provided below.
The Cardno (2010) hydraulic modelling of the study area used a steady state analysis technique with the flow rate determined from hydrologic analysis of the catchment. In this previous study the peak flow rate of the Glenelg catchment was calculated using both rainfall-runoff modelling and Flood Frequency Analysis (FFA). The RORB hydrologic modelling package was used to undertake the rainfall-runoff modelling and the FFA was undertaken using a Log Pearson Type III distribution fitted by the method of moments. The peak flows determined by the FFA were then applied to a SOBEK 2D hydraulic model.
The flood modelling undertaken as part of the Study utilised the existing hydrology, however the existing SOBEK model was not available. For this reason a 1D/2D linked TUFLOW hydraulic model was constructed by the GHCMA, with the assistance of BMT WBM, for the purposes of the Study. The Study used an unsteady flow analysis or flows that vary with time.
5.1 Hydrology The flood response of a catchment can be characterised by analysing the peak discharge through Flood Frequency Analysis (FFA) or by undertaking rainfall-runoff (hydrologic) modelling. Both of these approaches were undertaken as part of Cardno (2010), and are described below. In addition to the hydrologic modelling undertaken in the Cardno (2010), inflows for the Wando River were also required in order to investigate their impact on flood levels in Casterton. The hydrologic analysis was also expanded to include the Probable Maximum Flood (PMF) as part of the Study.
Figure 1-1 shows the significant hydrologic features of the Glenelg River catchment to Casterton. This figure shows that the Glenelg River at Casterton stream gauge is located immediately upstream of the Glenelg Highway Bridge near the centre of Casterton. The location of this stream gauge has moved over time and this is its current location.
5.1.1 Flood Frequency Analysis Flood Frequency Analysis (FFA) involves the fitting of a statistical distribution to the gauged streams flow data. Once a statistical distribution has been fitted to the stream flow data, estimates of the rarity of flood events can be made in terms of probability, that is, an estimate of the return period of an event can be made. This was completed as part the Flood Investigation: Floodplain Management Study. The previous study fitted a Log Pearson Type III distribution to the annual maximum series on the Glenelg River at Casterton.

Casterton Flood Intelligence & Warning Improvements 15 Flood Modelling
T:\M8575.MAJ.Casteron_FI\docs\R.M8575.003.01.Final.docx
Given the relatively short instantaneous flow record at the Casterton stream gauge the previous study extended this record using the average daily flow record at Casterton and the Sandford stream flow record. Therefore, the annual maximum series was in fact a number of series concatenated together. These series were:
The peak instantaneous flow at Casterton (1974 – 1988);
The average daily flow at Casterton (1960 - 1974) factored based on regression analysis between the peak instantaneous flow and daily flow at Casterton; and
The peak instantaneous flow at Casterton based on the peak flow at Sandford using a regression relationship between the concurrent periods of record between the two gauges.
The FFA analysis was undertaken using the recommendations in Australian Rainfall and Runoff (1987) including fitting the distribution using the Method of Moments.
It should be noted that recent advice on FFA issued by the Australian Rainfall and Runoff technical committee recommends that Bayesian methods or higher order L-Moment techniques are used in preference to the methods outlined in previous versions of ARR (e.g. 1987). Specifically, published on the ARR website, the following Practice Advice is given:
“Log Pearson 3 (LP3) is no longer specifically recommended - the user should select the distribution which best fits the data. In many locations research has found the best fit is either the Generalised Extreme Value (GEV) or LP3, but other distributions are not precluded.
“The log space moment fitting technique recommended in ARR87 is no longer recommended as other techniques have been shown to be more efficient. The preferred technique uses Bayesian methods as described in the draft flood frequency chapter () mentioned above.”
However, this advice post-dates the Flood Investigation: Floodplain Management Study and, while it is likely that the resulting peak flows using the revised FFA guidelines will change, it is not recommended that the analysis be revised at this stage. If a significant flood event were to occur on the Glenelg River it is recommended that the FFA is then revised.
The Flood Investigation: Floodplain Management Study provided the estimated peak flows in Table 5-1 for the Glenelg River at Casterton. These were the peak flows that were adopted for both the Flood Investigation: Floodplain Management Study and the Study.
Table 5-1 Peak flow estimates for the Glenelg River at Casterton
20% AEP Event 10% AEP Event 5% AEP Event 2% AEP Event 1% AEP Event
164 m3/s 220 m3/s 277 m3/s 355 m3/s 415 m3/s
5.1.2 Rainfall-Runoff Modelling Rainfall-runoff modelling, or hydrologic modelling, of the Glenelg River Catchment was undertaken in the Flood Investigation: Floodplain Management Study using the RORB hydrological modelling package. The output from RORB was used to provide the upstream input into the TUFLOW hydraulic model, but the hydrographs were factored to match the FFA peak flow estimates.

Casterton Flood Intelligence & Warning Improvements 16 Flood Modelling
T:\M8575.MAJ.Casteron_FI\docs\R.M8575.003.01.Final.docx
The downstream extent of the RORB model, as shown in Figure 5-1, is approximately 4km upstream of the Casterton stream gauge. This model was calibrated to the 1983 and 1975 flood events in Casterton. These events were calculated to be 10% Annual Exceedance Probability (AEP) (or 10 year Average Recurrence Interval (ARI)) and 6.67% AEP (or 15 year ARI event) respectively. The m (0.96) and kc (115) parameters were determined from the calibration events and these were applied to the design events. The Initial Loss and Continuing Loss parameters used for design events were 20mm and 2.0mm/hr respectively. The critical storm duration was the 30 hour event.
As part of the Study the calibrated RORB model was run for a number of design events. This included the following AEP events, for the durations listed in Table 5-2.
The 20% AEP (1 in 5 year ARI) event;
The 10% AEP (1 in 10 year ARI) event;
The 20% AEP (1 in 20 year ARI) event;
The 50% AEP (1 in 50 year ARI) event; and
The 100% AEP (1 in 100 year ARI) event.
Table 5-2 List of durations the hydraulic model was run for
10m 15m 20m 25m 30m 45m 1h 1.5h 2h 3h
4.5h 6h 9h 12h 18h 24h 30h 36h 48h 72h


Casterton Flood Intelligence & Warning Improvements 18 Flood Modelling
T:\M8575.MAJ.Casteron_FI\docs\R.M8575.003.01.Final.docx
5.1.3 Wannon River Inflow The Casterton Community have suggested that flood levels in Casterton are affected by the inflows from the Wannon River downstream of Casterton, as shown in Figure 1-1. This is known as a backwater effect. To investigate this, the Study incorporated the confluence of the Wannon River and Glenelg Rivers into the hydraulic model. As the RORB model did not cover the Wannon River catchment, analysis on stream gauges on the Wannon River was undertaken.
There were a number of stream gauges in the Wannon River catchment including the Wannon River at Sandford gauge, the Wannon River at Henty gauge and the Henty Creek at Henty gauge. Of these only the Wannon River at Henty gauge is still operational. The Wannon River at Sandford was located downstream of the confluence with the Henty Creek and hence the recorded flows on both the Wannon River and the Henty Creek. However, the Wannon River at Sandford gauge has only 4 years of data as listed in Table 2-1 and this length of record is not sufficient to undertake the required analysis.
To undertake FFA on the Wannon River an annual maximum peak flow series was required. To construct an annual maximum flow series for the Wannon River including the contribution from Henty Creek, the following steps were undertaken:
An annual maximum series was extracted from the Wannon River at Henty instantaneous flow data.
For the years (1974-1988) of concurrent data at both the Henty Creek at Henty and the Wannon River at Henty gauges, the peak flows from the Henty Creek gauge at the time of the peak flow at the Wannon at Henty gauge were extracted.
The peaks were summed to approximate the Wannon flow downstream of the confluence.
A regression relationship between the Wannon River at Henty annual maximum flow series, and the annual maximum flow series from the Wannon River at Henty and Henty Creek peak flows was developed.
The regression relationship was then applied to the annual maximum flow series at the Wannon River at Sandford for the period that was not concurrent with the Henty Creek gauge, i.e. 1989-2012, to account for the Henty creek flows.
This could be considered conservative, as the addition of peaks will generally overestimate flows due to timing of peaks not being exactly concurrent in the real situation.
It is of note that the intended usage of the Wannon River discharge estimates is to investigate the impact of these on flood levels in Casterton. This analysis is suitable for these purposes. However, these discharge estimates are not intended to be used to determine flood levels for planning purposes or otherwise. If flood levels for planning purposes are required it is recommended that full flood frequency analysis together with hydrologic modelling is undertaken.
5.1.3.1 Flood Frequency Analysis The annual maximum series from 1973-2012 was ordered and given an initial plotting position using the Cunnane method. A generalised extreme value (GEV) probability model was fitted using
Casterton Flood Intelligence & Warning Improvements 19 Flood Modelling
T:\M8575.MAJ.Casteron_FI\docs\R.M8575.003.01.Final.docx
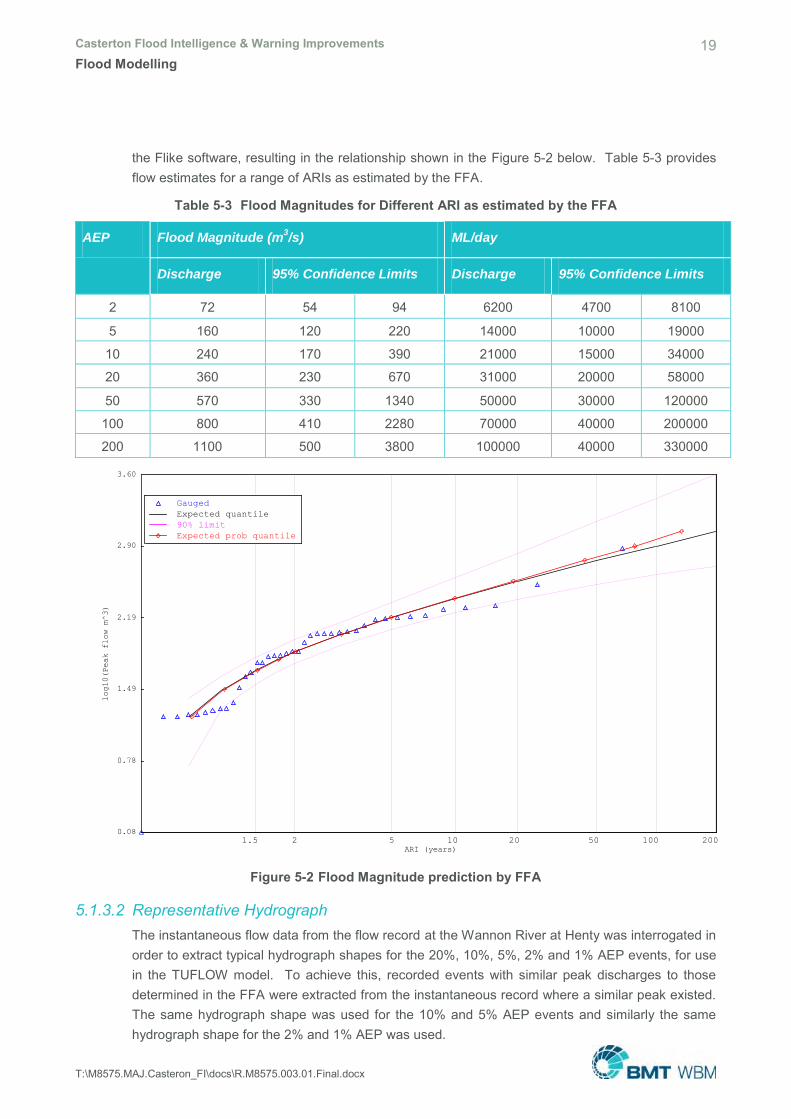
the Flike software, resulting in the relationship shown in the Figure 5-2 below. Table 5-3 provides flow estimates for a range of ARIs as estimated by the FFA.
Table 5-3 Flood Magnitudes for Different ARI as estimated by the FFA
AEP Flood Magnitude (m3/s) ML/day
Discharge 95% Confidence Limits Discharge 95% Confidence Limits
2 72 54 94 6200 4700 8100
5 160 120 220 14000 10000 19000
10 240 170 390 21000 15000 34000
20 360 230 670 31000 20000 58000
50 570 330 1340 50000 30000 120000
100 800 410 2280 70000 40000 200000
200 1100 500 3800 100000 40000 330000
Figure 5-2 Flood Magnitude prediction by FFA
5.1.3.2 Representative Hydrograph The instantaneous flow data from the flow record at the Wannon River at Henty was interrogated in order to extract typical hydrograph shapes for the 20%, 10%, 5%, 2% and 1% AEP events, for use in the TUFLOW model. To achieve this, recorded events with similar peak discharges to those determined in the FFA were extracted from the instantaneous record where a similar peak existed. The same hydrograph shape was used for the 10% and 5% AEP events and similarly the same hydrograph shape for the 2% and 1% AEP was used.
-1 5
ARI (years)
0.08
0.78
1.49
2.19
2.90
3.60
log10(Peak flow m^3)
1.5 2 5 10 20 50 100 200
Gauged
Expected quantile
90% limit
Expected prob quantile
Casterton Flood Intelligence & Warning Improvements 20 Flood Modelling
T:\M8575.MAJ.Casteron_FI\docs\R.M8575.003.01.Final.docx
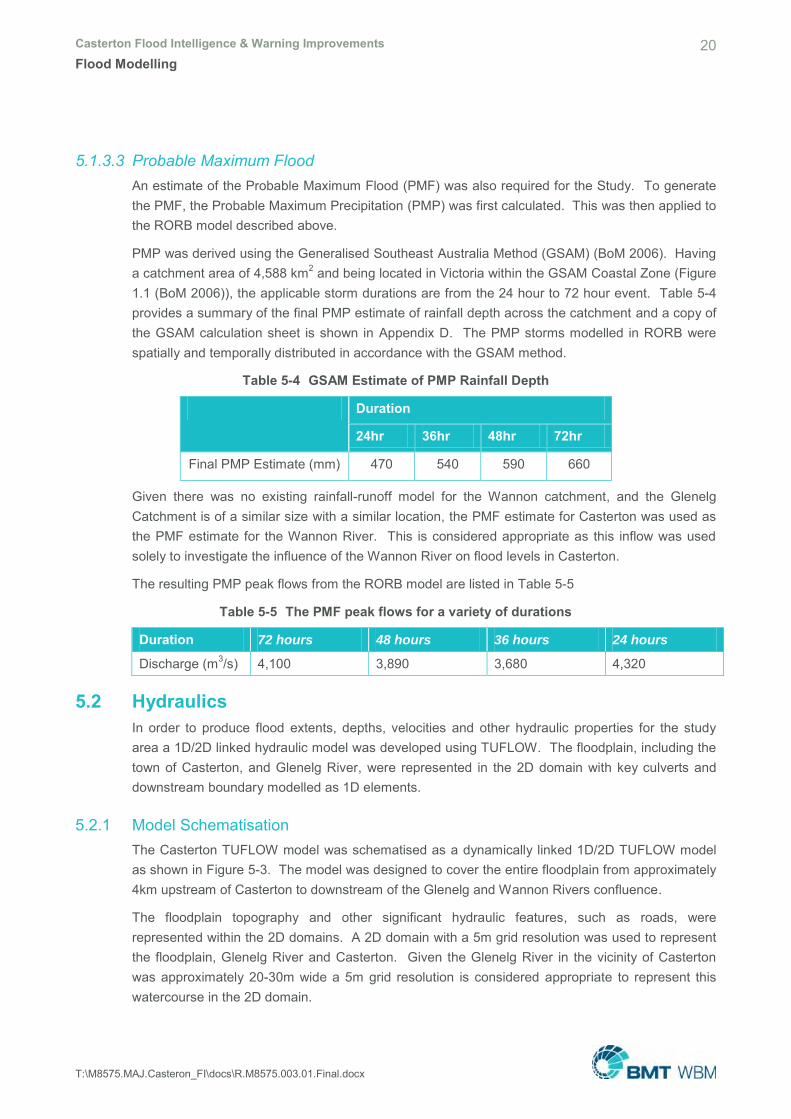
5.1.3.3 Probable Maximum Flood An estimate of the Probable Maximum Flood (PMF) was also required for the Study. To generate the PMF, the Probable Maximum Precipitation (PMP) was first calculated. This was then applied to the RORB model described above.
PMP was derived using the Generalised Southeast Australia Method (GSAM) (BoM 2006). Having a catchment area of 4,588 km2 and being located in Victoria within the GSAM Coastal Zone (Figure 1.1 (BoM 2006)), the applicable storm durations are from the 24 hour to 72 hour event. Table 5-4 provides a summary of the final PMP estimate of rainfall depth across the catchment and a copy of the GSAM calculation sheet is shown in Appendix D. The PMP storms modelled in RORB were spatially and temporally distributed in accordance with the GSAM method.
Table 5-4 GSAM Estimate of PMP Rainfall Depth
Duration
24hr 36hr 48hr 72hr
Final PMP Estimate (mm) 470 540 590 660
Given there was no existing rainfall-runoff model for the Wannon catchment, and the Glenelg Catchment is of a similar size with a similar location, the PMF estimate for Casterton was used as the PMF estimate for the Wannon River. This is considered appropriate as this inflow was used solely to investigate the influence of the Wannon River on flood levels in Casterton.
The resulting PMP peak flows from the RORB model are listed in Table 5-5
Table 5-5 The PMF peak flows for a variety of durations
Duration 72 hours 48 hours 36 hours 24 hours
Discharge (m3/s) 4,100 3,890 3,680 4,320
5.2 Hydraulics In order to produce flood extents, depths, velocities and other hydraulic properties for the study area a 1D/2D linked hydraulic model was developed using TUFLOW. The floodplain, including the town of Casterton, and Glenelg River, were represented in the 2D domain with key culverts and downstream boundary modelled as 1D elements.
5.2.1 Model Schematisation The Casterton TUFLOW model was schematised as a dynamically linked 1D/2D TUFLOW model as shown in Figure 5-3. The model was designed to cover the entire floodplain from approximately 4km upstream of Casterton to downstream of the Glenelg and Wannon Rivers confluence.
The floodplain topography and other significant hydraulic features, such as roads, were represented within the 2D domains. A 2D domain with a 5m grid resolution was used to represent the floodplain, Glenelg River and Casterton. Given the Glenelg River in the vicinity of Casterton was approximately 20-30m wide a 5m grid resolution is considered appropriate to represent this watercourse in the 2D domain.

Casterton Flood Intelligence & Warning Improvements 21 Flood Modelling
T:\M8575.MAJ.Casteron_FI\docs\R.M8575.003.01.Final.docx
External inflow boundaries were applied to the model to represent flow in the Glenelg River and Wannon River. A stage-discharge relationship was developed to represent the downstream boundary which was applied downstream of the Glenelg and Wannon River confluences.
Details of the model setup and application are described below and shown in Figure 5-3.
5.2.2 TUFLOW Version Model runs were performed with the 2012-05-AB build of TUFLOW. The double precision version of TUFLOW was used in line with the recommendations in the TUFLOW manual for study areas with elevations above 100m AHD.
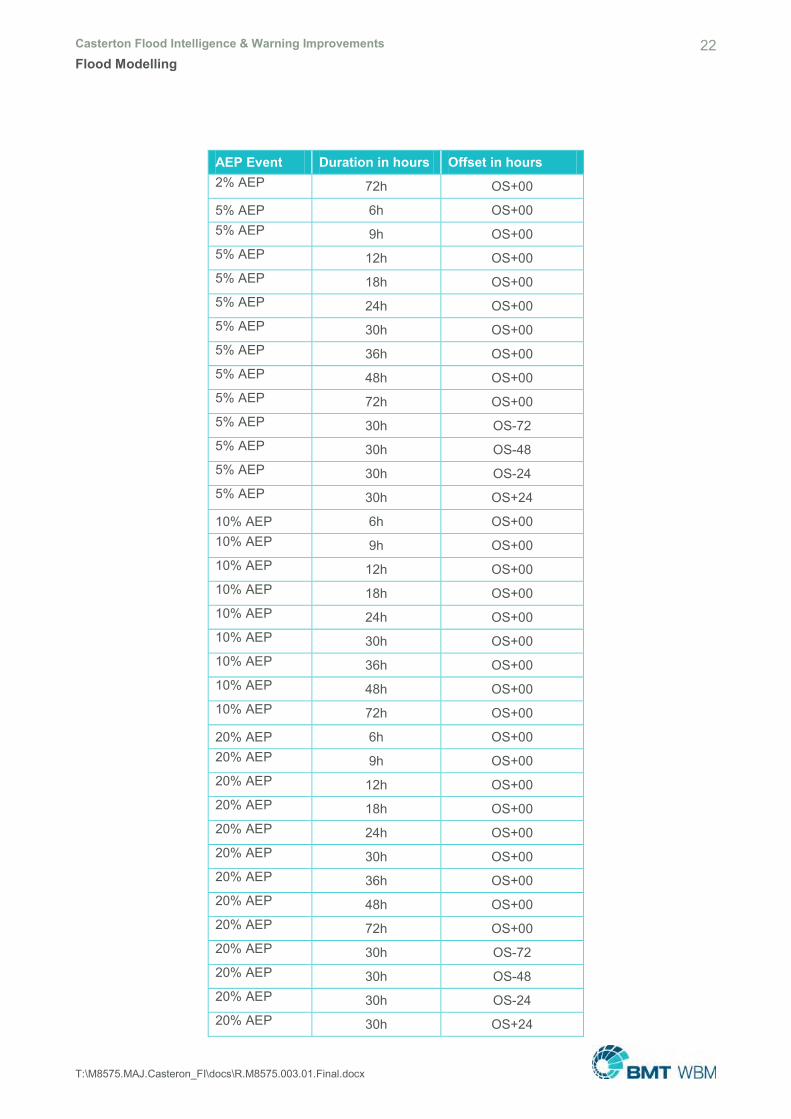
5.2.3 Event Modelling The hydraulic model was run for a number of design events in combination with different durations as well as different timings, or offsets, for the Wannon inflow, as discussed in Section 5.4. Table 5-6 provides a list of the modelled flood events. The column titled AEP event lists the probability of the AEP event, the duration column contains information regarding the storm duration of the event and the offset column indicates the temporal offset of the Wannon inflow.
Table 5-6 List of modelled events
AEP Event Duration in hours Offset in hours
1% AEP 6h OS+00
1% AEP 9h OS+00
1% AEP 12h OS+00
1% AEP 18h OS+00
1% AEP 24h OS+00
1% AEP 30h OS+00
1% AEP 36h OS+00
1% AEP 48h OS+00
1% AEP 72h OS+00
1% AEP 30h OS-72
1% AEP 30h OS-48
1% AEP 30h OS-24
1% AEP 30h OS+24
2% AEP 6h OS+00
2% AEP 9h OS+00
2% AEP 12h OS+00
2% AEP 18h OS+00
2% AEP 24h OS+00
2% AEP 30h OS+00
2% AEP 36h OS+00
2% AEP 48h OS+00
Casterton Flood Intelligence & Warning Improvements 22 Flood Modelling
T:\M8575.MAJ.Casteron_FI\docs\R.M8575.003.01.Final.docx
AEP Event Duration in hours Offset in hours 2% AEP 72h OS+00
5% AEP 6h OS+00
5% AEP 9h OS+00
5% AEP 12h OS+00
5% AEP 18h OS+00
5% AEP 24h OS+00
5% AEP 30h OS+00
5% AEP 36h OS+00
5% AEP 48h OS+00
5% AEP 72h OS+00
5% AEP 30h OS-72
5% AEP 30h OS-48
5% AEP 30h OS-24
5% AEP 30h OS+24
10% AEP 6h OS+00
10% AEP 9h OS+00
10% AEP 12h OS+00
10% AEP 18h OS+00
10% AEP 24h OS+00
10% AEP 30h OS+00 10% AEP 36h OS+00
10% AEP 48h OS+00
10% AEP 72h OS+00
20% AEP 6h OS+00
20% AEP 9h OS+00
20% AEP 12h OS+00
20% AEP 18h OS+00
20% AEP 24h OS+00
20% AEP 30h OS+00
20% AEP 36h OS+00
20% AEP 48h OS+00
20% AEP 72h OS+00
20% AEP 30h OS-72
20% AEP 30h OS-48
20% AEP 30h OS-24
20% AEP 30h OS+24

Casterton Flood Intelligence & Warning Improvements 23 Flood Modelling
T:\M8575.MAJ.Casteron_FI\docs\R.M8575.003.01.Final.docx
5.2.4 Model Extent The model domain extends from approximately four kilometres upstream of Casterton to approximately three kilometres downstream of the Glenelg and Wannon River confluence, covering 14.2 km2 of the Glenelg River floodplain, as shown in Figure 5-3. The model extent allows for the flood behaviour within the study area to be reliably represented without the influence of boundary effects.
5.2.5 2D Domain The geometry of the 2D domain was established by constructing a uniform grid of square elements. One of the key considerations in establishing a 2D hydraulic model relates to the selection of an appropriate grid element size. Element size affects the resolution, or degree of accuracy, of the representation of the physical properties of the study area as well as the size, and thus memory request, of the computer model and its run times. Selecting a very fine grid element size will result in both higher resolution results and longer model run times.
A grid resolution of 5m was selected for consistency with the existing SOBEK hydraulic model.
In TUFLOW, each 5m square grid element contains information on ground topography, sampled from the DEM at 2.5 m spacing and surface resistance to flow (Manning’s n value).
5.2.5.1 2D Hydraulic Structures Three bridge crossings were represented as ‘layered’ flow constrictions as shown in Figure 5-3. A layered flow constriction is a feature in TUFLOW that enables modelling of flow beneath the bridge, through the pedestrian and vehicle barriers, and overtopping the barriers, in separate layers within a given grid cell. The bridges modelled using these approaches were:
The Glenelg Highway Bridge;
The Anderson Road Bridge; and
The footbridge in Apex Park.
5.2.5.2 Surface Roughness The roughness layer, or Manning's n layer, was based on the Manning’s layer from the SOBEK hydraulic model. This was done for consistency with the original modelling. The adopted roughness layer is shown in Figure 5-3.
5.2.6 1D Network Key culverts in Casterton were identified and these were incorporated into the model as 1D elements. The location of these culverts is shown in Figure 5-3.
5.2.7 Boundary Conditions A hydraulic model requires inflow boundaries and outlet boundaries to allow water into and out of the model in a realistic manner. Often 2D hydraulic models will have external and internal inflow boundaries. The external inflow boundaries account for flow generated from outside of the model extents (external boundaries) whereas internal boundaries account for the runoff generated from

Casterton Flood Intelligence & Warning Improvements 24 Flood Modelling
T:\M8575.MAJ.Casteron_FI\docs\R.M8575.003.01.Final.docx
within the model extents. In the previous study no internal boundaries were applied and this was replicated in the Study. Flow is removed from the model through downstream boundaries, which are generally a fixed water level or a stage discharge relationship.
The Study model incorporated two upstream boundaries; one on each of the Glenelg and Wannon Rivers as shown in Figure 5-3. The Glenelg River inflow boundary was located approximately 4km upstream of Casterton. The Wannon River inflow boundary was located approximately 4.5km upstream of the confluence with the Wannon River. Both of these boundaries were applied as a discharge time boundary or ‘unsteady’ flow boundaries.
The downstream boundary was represented as a stage-discharge boundary.


Casterton Flood Intelligence & Warning Improvements 26 Flood Modelling
T:\M8575.MAJ.Casteron_FI\docs\R.M8575.003.01.Final.docx
5.3 Flood Mapping Peak flood depth maps were prepared from the flood modelling results of the following events:
20% AEP (10 year ARI) event;
10% AEP (10 year ARI) event;
5% AEP (20 year ARI) event;
2% AEP (50 year ARI) event;
1% AEP (100 year ARI) event; and
The Probable Maximum Flood (PMF) – this is the flood that is a result of the PMP.
These flood maps were based on the respective AEP events for both the Glenelg and Wannon inflows. The storm duration for the Glenelg inflow was the 30 hour storm with the exception of the PMF event, which was based on the 72 hour storm event. There was no offset on the Wannon inflow.
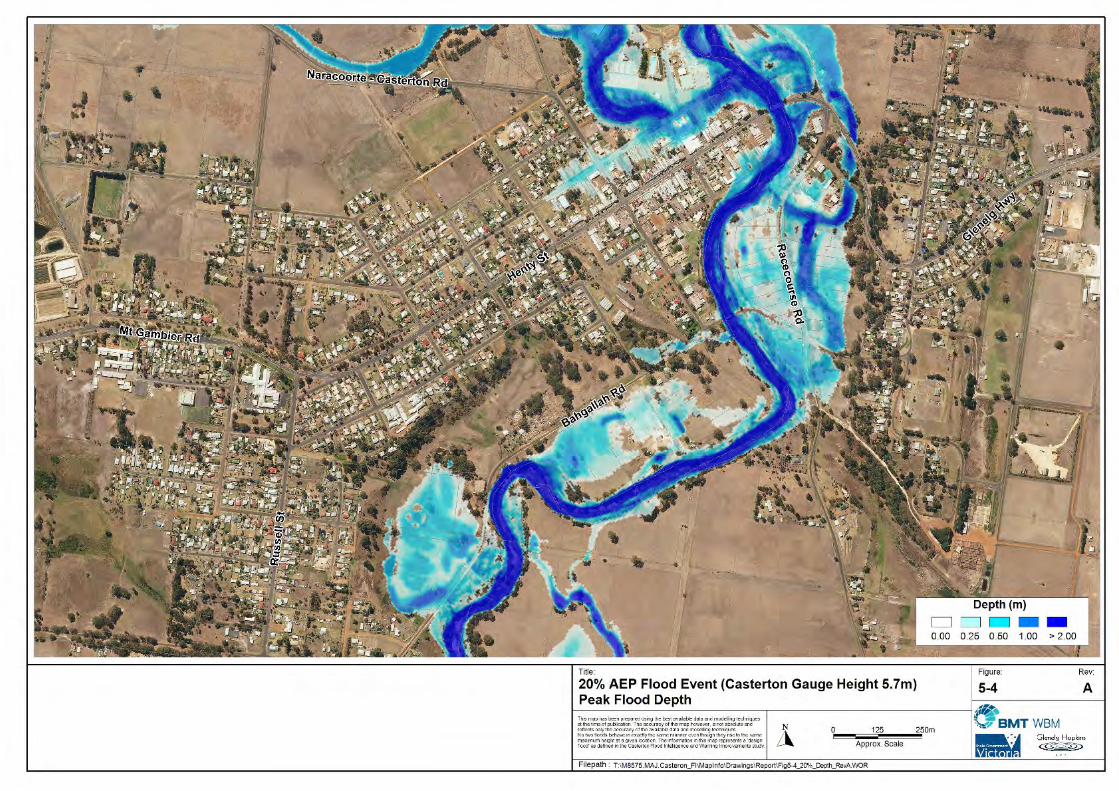
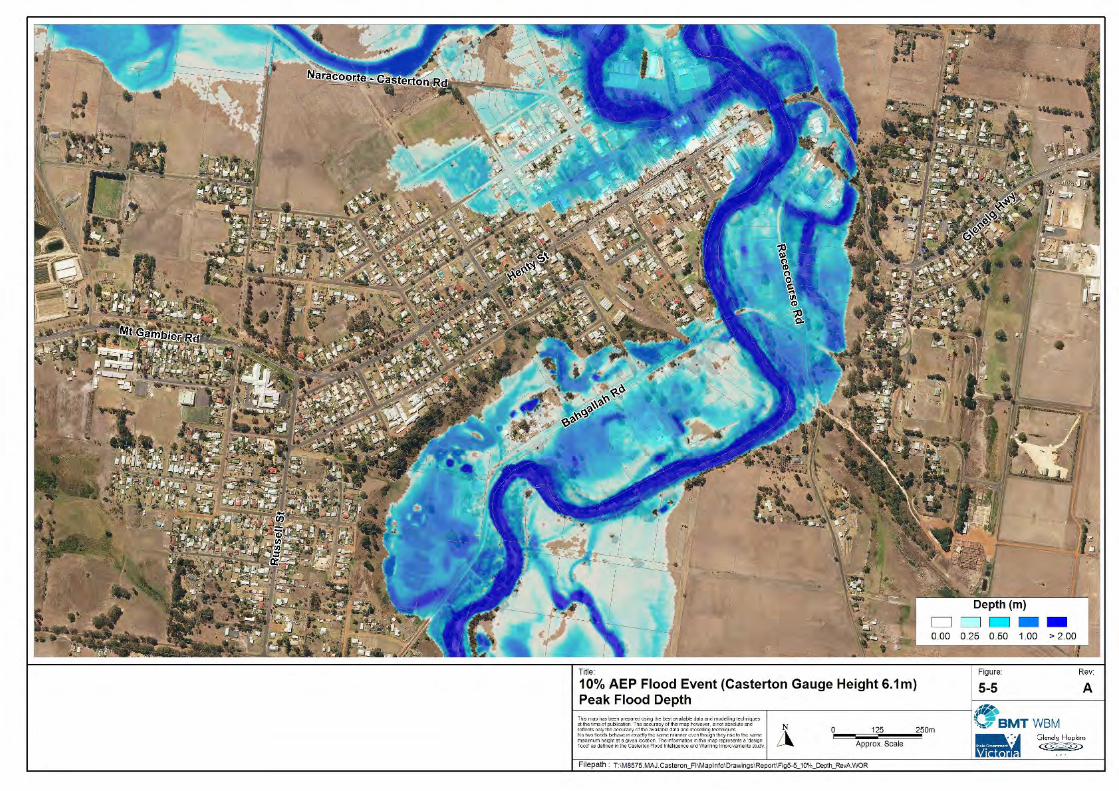
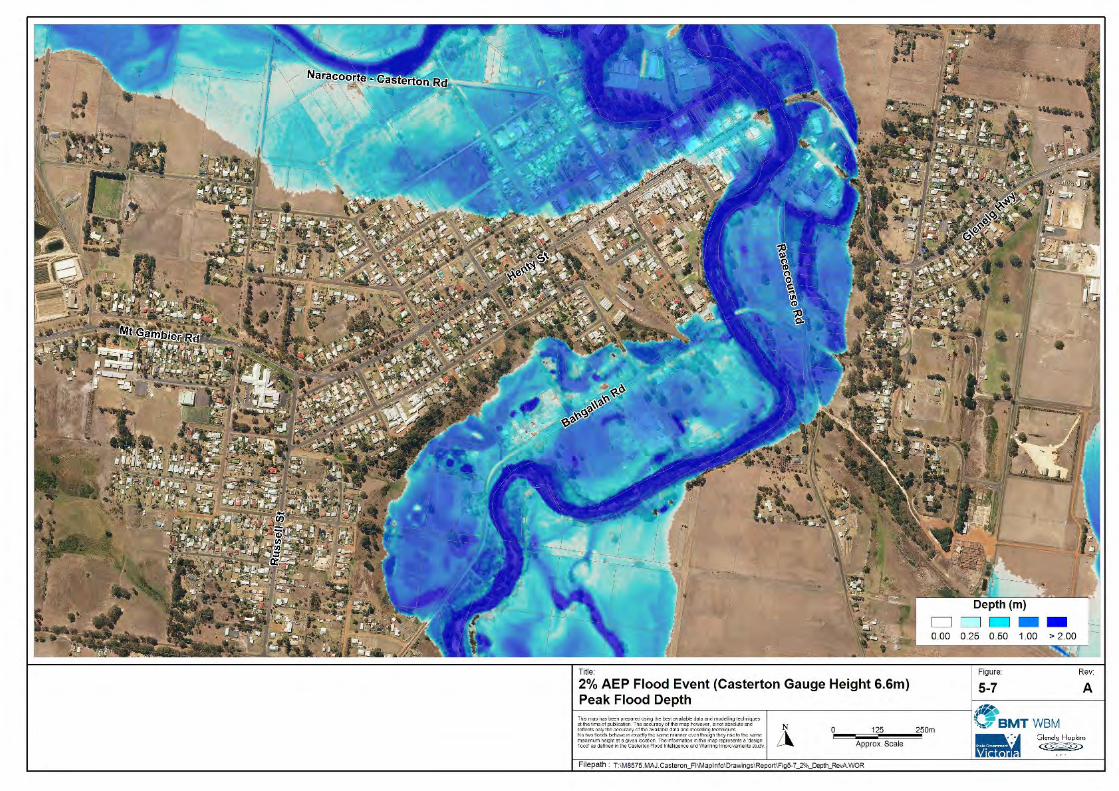
The resulting flood depth maps are presented in Figure 5-4 to Figure 5-9 respectively.
5.3.1 Description of flooding A brief description of the resulting flooding for each AEP event is presented below.
5.3.1.1 20% AEP event The 20% AEP event resulted in flooding of flow lying land, in and around Casterton, to shallow depths as shown in Figure 5-4. This includes the area around Island Park and Murray Street, the paddocks along Racecourse Road between the Glenelg Highway and Anderson Road, as well as the land between Bahgallah Road and the Glenelg River. The low lying land between Gazard Street and Bahgallah Road was also inundated during this event.
Areas of deeper flooding occur in cut-offs and billabongs.
5.3.1.2 10% AEP event The pattern of flooding experienced in the 20% AEP event is exacerbated in the 10% AEP with increased flood depths in all previously noted areas as shown in Figure 5-5. In addition, the fields and the paddocks to the north of Casterton experience shallow flooding. The extent of flooding in the vicinity of Island Park and Murray Street increased encompassing McPherson Street, McKinlay Street and Kirby Streets. The depth also increased along Murray Street. The flooding now extends to the north of Bahgallah Road and access to the bridge along Anderson Road is overtopped.
5.3.1.3 5% AEP event The general pattern of flooding experienced in the 10% AEP event is exacerbated in the 5% AEP event with increased flood depths as shown in Figure 5-6. In general there is a relatively minor increase in flood extent due to the steep nature of the catchment.

Casterton Flood Intelligence & Warning Improvements 27 Flood Modelling
T:\M8575.MAJ.Casteron_FI\docs\R.M8575.003.01.Final.docx
5.3.1.4 2% AEP event While there is a general increase in flood depths in the 2% AEP event compared with the 5% AEP event there are only small increases in flood extent, due to the steep nature of the floodplain in and around Casterton. This is illustrated in Figure 5-7. During this event access along the Glenelg Highway is cut.
5.3.1.5 1% AEP event Again, there is a general increase in flood depths comparing the 1% AEP event to the 2% AEP event and there were only small increases in flood extent, due to the steep nature of the floodplain in and around Casterton. This is illustrated in Figure 5-8
5.3.1.6 The PMF event There were significant increases in flood depths throughout all inundated areas in Casterton comparing the PMF event to the 1% AEP event, as shown in Figure 5-9. However, there are only modest increases in the flood extent for the reasons outlined above.


Casterton Flood Intelligence & Warning Improvements 34 Flood Modelling
T:\M8575.MAJ.Casteron_FI\docs\R.M8575.003.01.Final.docx
5.3.2 Comparison with previous flood mapping A comparison of the flood mapping completed as part of Flood Investigation: Floodplain Management Study (Cardno, 2010) and the flood mapping from the Study was undertaken. This comparison has been undertaken between the 10% AEP, 5% AEP, 2% AEP and 1% AEP events.
The comparison involved the preparation of peak flood heights for each AEP event. It is of note that only the four AEP events listed above were available from Cardno (2010). These were then subtracted from each other to produce a flood level difference, or flood impact, grid. The change in peak flood height was then colour contoured and mapped.
The map for each scenario in the hydraulic assessment illustrates no change in flood level, within a +/- 0.02 m tolerance, as a yellow colour, reductions in flood level are shaded with greens and increases in flood level are shaded with browns/reds.
Flood impacts maps representing the difference between the previous flood mapping and the flood mapping completed by the Study are presented in Figure 5-10 to Figure 5-13.
There are a number of differences between the previous flood mapping and the revised flood mapping. These are:
The previous flood mapping was based on steady state flow rates whereas the revised flood mapping is based on unsteady flow rates (i.e hydrographs). In general, an unsteady analysis will lead to lower flood levels than a steady analysis, as the steady approach effectively has an unlimited volume of water available to fill storages. Unsteady flow modelling, on the other hand, accounts for floodplain dynamics so storages are only filled by the available volume of water. This effect is expected to be more prevalent in smaller events.
The revised flood modelling has been extended to downstream of the Glenelg and Wannon Rivers confluence by approximately 6km along the river. For this reason the comparison between flood modelling results has been limited to the area upstream of the downstream boundary in the previous model.
The schematisation of the downstream boundary differs between the previous flood modelling and the revised flood modelling. The previous flood modelling is understood to have used a fixed water level of 37.0m AHD as the downstream boundary. The revised flood modelling used a head verses discharge relationship based on the floodplain cross section. The ground levels in the vicinity of the previous flood modellings downstream boundary are around 36.5 m AHD in the channel and 42.0m AHD on the floodplain. The modelled flood levels in the revised flood modelling in this area are around 41 – 42 m AHD. Given this, it is expected that the flood levels from the previous flood modelling will be lower than the revised flood modelling in this area.
The Wannon River has been incorporated into the revised flood model. For this reason it is expected that the flood levels in the vicinity of confluence, and immediately upstream, will be higher than those in the previous flood modelling.
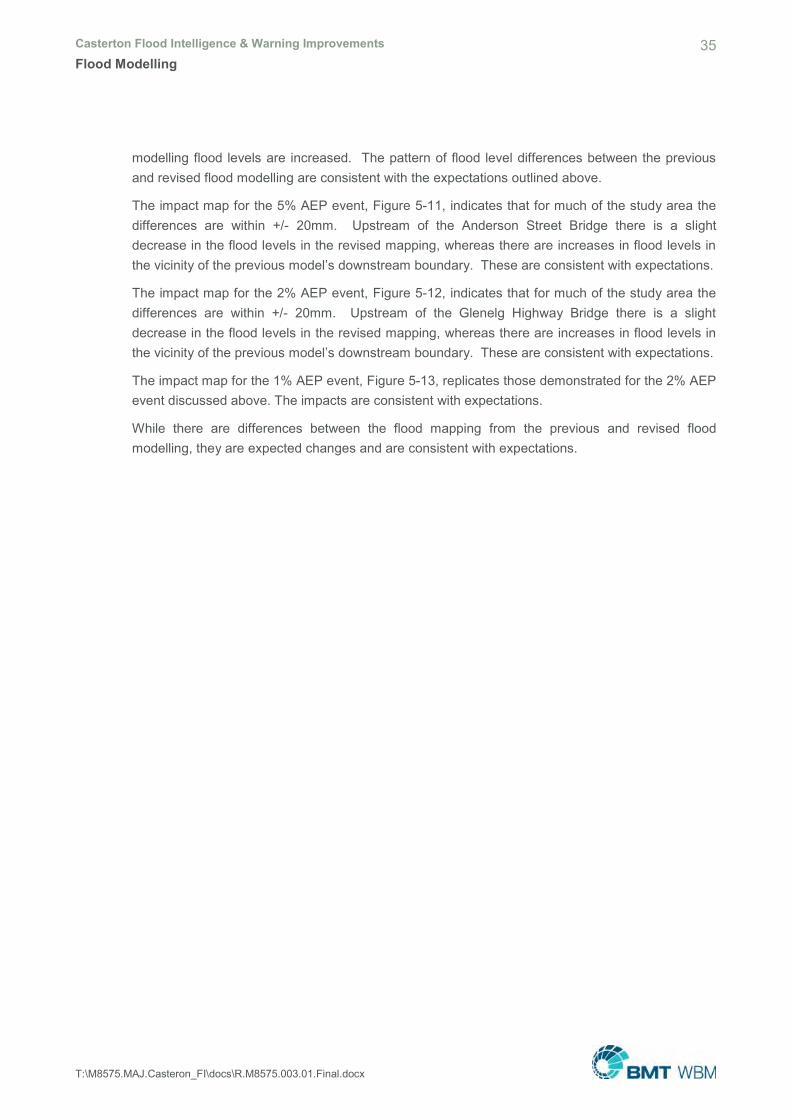
The impact map for the 10% AEP event, Figure 5-10, indicates that the flood levels upstream of the Anderson Road Bridge are lower in the revised flood modelling. The differences in flood levels are generally less 100mm in this area. In the vicinity of the downstream boundary of the previous flood
Casterton Flood Intelligence & Warning Improvements 35 Flood Modelling
T:\M8575.MAJ.Casteron_FI\docs\R.M8575.003.01.Final.docx
modelling flood levels are increased. The pattern of flood level differences between the previous and revised flood modelling are consistent with the expectations outlined above.
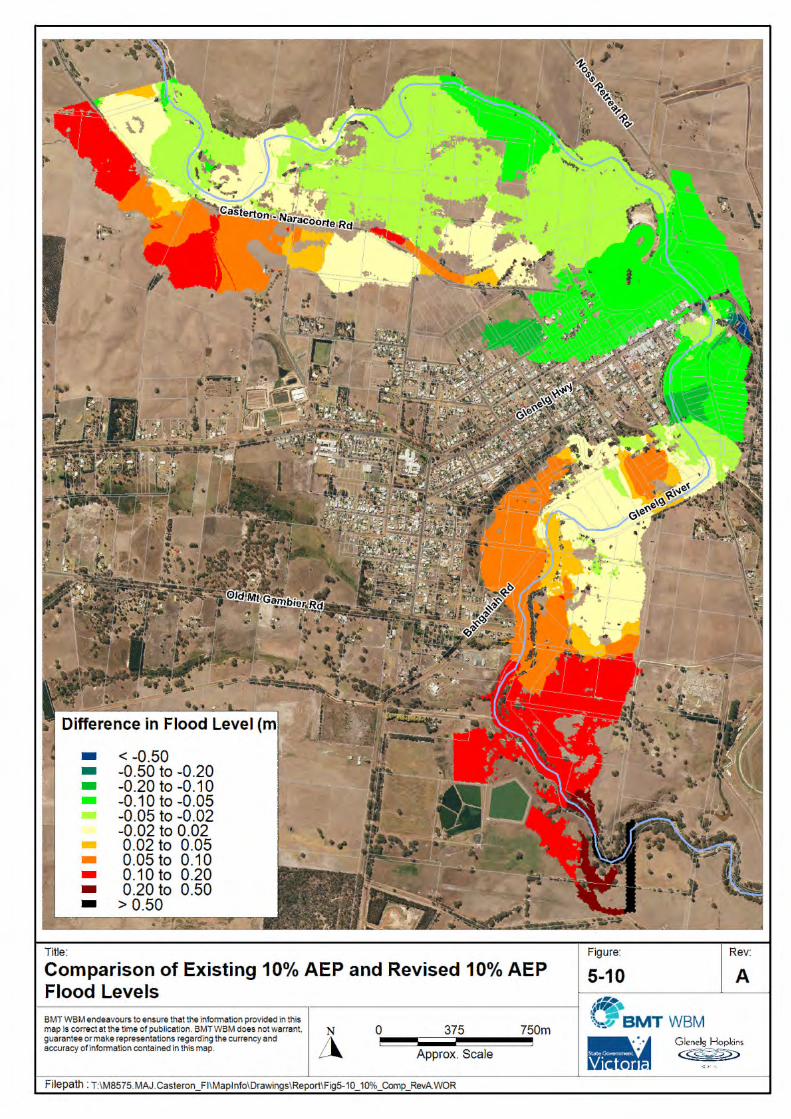
The impact map for the 5% AEP event, Figure 5-11, indicates that for much of the study area the differences are within +/- 20mm. Upstream of the Anderson Street Bridge there is a slight decrease in the flood levels in the revised mapping, whereas there are increases in flood levels in the vicinity of the previous model’s downstream boundary. These are consistent with expectations.
The impact map for the 2% AEP event, Figure 5-12, indicates that for much of the study area the differences are within +/- 20mm. Upstream of the Glenelg Highway Bridge there is a slight decrease in the flood levels in the revised mapping, whereas there are increases in flood levels in the vicinity of the previous model’s downstream boundary. These are consistent with expectations.
The impact map for the 1% AEP event, Figure 5-13, replicates those demonstrated for the 2% AEP event discussed above. The impacts are consistent with expectations.
While there are differences between the flood mapping from the previous and revised flood modelling, they are expected changes and are consistent with expectations.


Casterton Flood Intelligence & Warning Improvements 40 Flood Modelling
T:\M8575.MAJ.Casteron_FI\docs\R.M8575.003.01.Final.docx
5.4 Influence of the Wannon River As previously noted, the Casterton community are concerned that the Wannon River inflow affects flood levels in Casterton. This phenomenon can occur due to the backup of water from the confluence. This is due to the increased water level on one tributary reducing the capacity of the other to discharge flows downstream of the confluence. This effect is known as a backwater effect.
The Wannon River’s catchment size at its confluence with the Glenelg River of 4,450km2 compares to the Glenelg River catchment area at this location of 4,600km2. This it is also worth considering inflow from each tributary during flood events. The Wannon River represents a significant inflow to the Glenelg River with a peak 1% AEP of approximately 800m3/s compared to the Glenelg River 1% AEP peak of approximately 415m3/s. Given this, a backwater effect can be expected at this location.
The potential backwater effect from the Wannon River on the flood levels in Casterton was investigated using the unsteady TUFLOW model developed as part of the Study. Corresponding AEP event inflows have been applied to both the Glenelg and Wannon inflow boundaries and the timing of the inflows relative to each other shifted. This has been undertaken for the 1% AEP, 5% AEP and 20% AEP events The timing of the Wannon inflows were varied to coincide with different parts of the Glenelg River hydrograph including the peak. The peak flood levels in Casterton were then analysed to check for increases in flood levels.
To investigate the influence of the Wannon River on flood levels in Casterton it is necessary to consider the timing of the peaks on Glenelg and Wannon Rivers. Figure 5-14 shows the 1% AEP hydrographs for both the Glenelg and Wannon Rivers together with the Wannon River hydrograph offset in time by +24 hours, no offset, -24 hours, -48 hours and -72 hours. This figure indicates that the peak on the Glenelg and Wannon Rivers approximately coincide when the Wannon River is offset by -72 hours with other offset peaks coinciding with the second peak in the Glenelg River. The results of offsetting the Wannon inflows are discussed below.
Figure 5-14 Comparison of the 1% AEP hydrographs for Glenelg and Wannon Rivers

Casterton Flood Intelligence & Warning Improvements 41 Flood Modelling
T:\M8575.MAJ.Casteron_FI\docs\R.M8575.003.01.Final.docx
The peak water levels along the Glenelg River resulting from the various Wannon River offsets are shown in Figure 5-15. The chainage along the Glenelg River is show in Figure 5-16. Figure 5-15 clearly shows that the influence of the Wannon inflow dissipates by around chainage 6000m for all offsets. This location is between Peachy Road and Old Mt Gambier Road. There is no change in peak flood level near the Glenelg Highway (approximate chainage 8300m).
Figure 5-15 1% AEP Flood Level Long Section in the Glenelg River with various Wannon inflow offsets
Time-series plots of river level verses time at various locations have been prepared and are presented in Figure 5-17. This figure demonstrates the influence of the Wannon Rivers inflow on the flood levels in the vicinity of the confluence of the Glenelg and Wannon Rivers. At the confluence the -72 hour offset produced the highest flood levels indicating there is a backwater effect. The backwater effect from the Wannon River has largely dissipated at chainage 6000m which falls between the Glenelg Highway and the confluence, with the -72 hour offset producing the highest flood level change by approximately 90mm. The level-time plot at the Glenelg Highway shows that the Wannon River inflow does not affect flood levels at this location.


Casterton Flood Intelligence & Warning Improvements 43 Flood Modelling
T:\M8575.MAJ.Casteron_FI\docs\R.M8575.003.01.Final.docx
Figure 5-17 Level time plots for various locations on the Glenelg River

Casterton Flood Intelligence & Warning Improvements 44 Flood Modelling
T:\M8575.MAJ.Casteron_FI\docs\R.M8575.003.01.Final.docx
The impact of Wannon River inflow was also investigated for the 20% and 5% AEP events, as well as the PMF event, on the Glenelg and Wannon Rivers independently. These results are summarised in Figure 5-18. In this figure the AEP events are grouped by colour with the:
Golden colour representing the 20% AEP events;
Pink colour representing the 5% AEP events;
Dark blue colour representing the 1% AEP events;
Light blue colour representing the PMF event on the Glenelg River; and
Grey colour representing the PMF on the Wannon River.
Reading this figure from left to right; the lines are drawn from the Glenelg River AEP event to the Wannon River AEP event with a range of offsets. These lines then indicate the peak gauge height (at the Glenelg Highway) on the right hand axis.
This figure shows that all the 20%, 5% and 1% AEP events result in the same peak gauge height at the Glenelg Highway. This indicates that the Wannon River inflow has no influence on the peak flood level at the Casterton gauge (located upstream of the Glenelg Highway).
Figure 5-18 Peak gauge height at Casterton under a number of combination of inflows on the Glenelg and Wannon Rivers
The analysis presented above demonstrates that the backwater effect from the Wannon River does not influence flood levels at Casterton for events up to and including the 1% AEP event. It is also of note that the analysis presented here has assumed conservative conditions, where the 1% AEP event on both catchments (the Glenelg to the confluence with the Wannon River catchment and the Wannon catchment), coincide. This is considered to be unlikely, and the joint probability of the events modelled in this analysis is far less than the 1% AEP.


Casterton Flood Intelligence & Warning Improvements 45 Flood Information
T:\M8575.MAJ.Casteron_FI\docs\R.M8575.003.01.Final.docx
6 Flood Information The data analysis and flood modelling undertaken for the Study was used to extract flood information for the town of Casterton. This information has been used to improve the technical aspects of the Flood Warning System. This includes information on forecasting flood levels at Casterton, flood maps and flood information as discussed below.
Flood information gathered, or generated, as part of this Study is presented in this section. Where appropriate this information has also been used in the Flood Visualisation Tool.
6.1 Casterton Gauge Level For effective communication of flood information it is important that it is linked to a local gauge, where one exists. While the use of AEP provides an understanding of the frequency of the event, it has no practical meaning during flood events and is not readily understood by the community. In the case of Casterton there was a continuous gauge recorder on the Glenelg River that has now been decommissioned, as discussed in Section 3.1.2. While the continuous recorder has been decommissioned, it is understood that during flood events river heights are taken from the staff gauge at the Glenelg Highway crossing. The zero gauge level at the staff gauge is the same as the decommissioned continuous gauge. This allows consistent reporting of gauge levels to the Casterton community.
As previously outlined the Casterton flood model was run for over 50 flood events which were combinations of different AEPs and durations. The results were interrogated to compile a list of peak flood levels which were converted to gauge height. From these events a subset was selected to illustrate the expected flooding for a given gauge height. The selected peak gauge levels are listed in Table 6-1.
Peak flood depth maps that correspond to these peak gauge levels have been presented in the Flood Visualisation Tool.
Table 6-1 Casterton Gauge Heights for notable events
Event Level in m AHD Gauge Height in m
1% AEP Event 45.26 6.80
2% AEP Event 45.09 6.64
Mar-1946 44.90 6.45
5% AEP Event 44.84 6.38
Aug-1983 44.75 6.30
Aug-1991 44.64 6.19
10% AEP Event 44.59 6.14
Oct-1996 44.53 6.08
Oct-1975 44.30 5.85
20% AEP Event 44.28 5.82
Sep-1978 44.27 5.82
Sep-1992 42.90 4.45

Casterton Flood Intelligence & Warning Improvements 46 Flood Information
T:\M8575.MAJ.Casteron_FI\docs\R.M8575.003.01.Final.docx
Event Level in m AHD Gauge Height in m
Jan-1911 42.90 4.45
Jul-1995 42.25 3.80
6.2 Property Inundation A floor level survey of Casterton was undertaken as part of the Study. This information, together with ground levels from the LiDAR data, was compared to modelled flood levels to determine property inundation. Property inundation and above floor flooding were determined for a number of flood events using the following:
A property was considered to be inundated if the modelled flood extent infringed the property boundary for a given event.
Above floor inundation was calculated as the difference between the surveyed floor level and the flood level at the point the survey was taken.
A list of the property flooding is provided in Appendix E Table E-1 and above floor flooding is provided in Appendix E Table E-2. The property inundation and above floor flooding for the 1% AEP event is shown in Figure 6-1.
Other events are shown in the Flood Visualisation tool.
6.3 Road Closures Sag points in key roads in and around Casterton were identified and road closure criteria were calculated. The road closure criteria were based on the interim guidelines in the Australian Rainfall and Runoff Revision Project 10: Appropriate Safety Criteria for Vehicles (Shand, et al., 2011) for small passenger vehicles.
The criterion, or Equation of stability, was defined as DV ≤ 0.3 where D is the depth in meters and V is velocity in meter per second. In addition, there are also limiting depths and velocities. The limiting still water depth is 0.3m, the limiting high velocity depth is 0.1m, and the limiting velocity is 3.0m/s. Each location identified was evaluated against these criteria for each modelled event.
The resulting information was incorporated into the Flood Visualisation Tool, as described in Section 7, with the road closures for the 1% AEP event shown in Figure 6-1.


Casterton Flood Intelligence & Warning Improvements 48 Flood Visualisation Tool
T:\M8575.MAJ.Casteron_FI\docs\R.M8575.003.01.Final.docx
7 Flood Visualisation Tool One of the key aims the Study was the development of a Flood Visualisation Tool for Casterton to assist emergency management services. This tool aimed to communicate flood information effectively and clearly through a portable software tool. This section provides documentation on the flood information available in the Flood Visualisation Tool and also the features. Comments are also provided on any limitations on its usage.
7.1 Flood Information The Flood Visualisation Tool provides the following flood information:
1. The flood extents for 10 gauge heights that span a range of expected events in Casterton.
2. The relationship between gauge flood height and BoM flood class levels.
3. Historic flood heights.
4. Expected frequency of gauge flood heights.
5. Modelled time-series of flood heights and length of inundation for each of the 10 modelled design events.
6. Number of properties inundated with corresponding flood height for each of the 10 modelled events.
7. Number of properties with above floor inundation for each of the 10 modelled events.
8. Information on road closures with corresponding flood height for each of the 10 modelled events.
9. Peak flood height in Casterton based Dergholm peak flood height.
10. Initial flood peak height in Casterton based on the Wando Vale peak flood height.
The information on gauge heights has been determined as previously outlined and has been related to flood modelling output through the relationship between gauge height and Australian Height Datum (AHD). The information on flood peaks in Casterton has been based on the regression relationships described in Section 3.2. The information on timing and duration of inundation has been based on the hydraulic modelling results for Casterton, determined as part of the Study. Information on property flooding and road closures has been extracted from the flood modelling results as described above.
7.2 Features of the Flood Visualisation Tool The Flood Visualisation Tool has a number of features in addition to the data outlined above. The required functionality has been determined through consultation with stakeholders. These features include:
The ability to pan and zoom.
The Flood Visualisation Tool is standalone.
There is no requirement for an internet connection.

Casterton Flood Intelligence & Warning Improvements 49 Flood Visualisation Tool
T:\M8575.MAJ.Casteron_FI\docs\R.M8575.003.01.Final.docx
The ability to change between 10 different flood heights.
Display of a gauge height-time relationship for events with the ability to pan and zoom on this chart.
Provision of gauge heights for any time on the gauge height time plot.
Calculation of the predicted peak in Casterton based on the peak at Dergholm together with the BoM flood class level.
Calculation of the predicted initial peak in Casterton based on the peak at Wando Vale.
7.3 Limitations The flood visualisation tool has been designed to assist emergency management services prepare for, and respond to, flood events. It has not been designed to inform planning decisions, such as planning overlays or planning scheme amendments, and the results are not intended to be used to set floor levels.
Due to the statistical techniques that underpin the analysis for the flood forecasting relationship that are used in the Flood Visualisation Tool, and the limited range of events available for use in the analysis, predicted Casterton flood levels are indicative only.
The mapping that was prepared for the Flood Visualisation Tool used the best available data and modelling techniques at the time of publication. However, the accuracy of this map is not absolute and reflects only the accuracy of the available data and modelling techniques.
It should also be noted that no two floods behave in exactly the same manner even though they rise to the same maximum height at a given location. The information in these maps represents a variety of ‘design floods’ as defined in the Casterton Flood Warning and Intelligence Study.

Casterton Flood Intelligence & Warning Improvements 50 Conclusions and Recommendations
T:\M8575.MAJ.Casteron_FI\docs\R.M8575.003.01.Final.docx
8 Conclusions and Recommendations The Casterton Flood Intelligence & Warning Improvements Study has developed flood information for the Casterton Community. The information developed as part of the Study is suitable for incorporation into the flood warning system for Casterton and will support future developments in the flood warning system. This information included relationships between river gauging stations, updated flood modelling together with revised flood mapping, a review of the existing flood warning systems as well as recommendations and the development of a Flood Visualisation Tool. A summary of each of these study elements is provided below.
8.1 River gauging relationships The Study has created coherent set of relationships between gauges on the Glenelg system. Relationships between the following gauges were developed:
The old and new Glenelg River gauges at Dergholm.
○ This allowed historic data from the Dergholm gauge to be converted to the new gauge extending the period of record.
A relationship between the Glenelg River at Casterton and Dergholm gauge was developed.
○ This developed a relationship between the peak heights between the gauges.
The Wando River at Wando Vale and Casterton gauges:
○ This developed a relationship between the first peak at Casterton and the peak height at Wando Vale.
8.1.1 Updated flood modelling and mapping The flood modelling and flood mapping for Casterton were updated as part of the Study. This flood mapping was based on results of a TUFLOW hydraulic model of Casterton developed in conjunction with the Glenelg Hopkins Catchment Management Authority. This hydraulic model supersedes the previous flood modelling developed for Casterton and has a number of advantages.
The TUFLOW hydraulic model is owned by the GHCMA.
The model has been extended to downstream of the Wannon River confluence to allow the investigation of the backwater effect from the Wannon River on flood levels in Casterton.
The Probable Maximum Flood has been modelled and mapped.
The TUFLOW model has been run as an unsteady hydraulic model which accounts for flow varying with time, whereas the previous modelling was based on a steady state flow analysis.
The TUFLOW models representation of the downstream boundary provides a more realistic boundary condition than the previous hydraulic model.
In addition, to these improvements the results and outputs of the flood modelling, including flood maps, have been related to the Casterton gauge.

Casterton Flood Intelligence & Warning Improvements 51 Conclusions and Recommendations
T:\M8575.MAJ.Casteron_FI\docs\R.M8575.003.01.Final.docx
The backwater effect from the Wannon River on flood levels in Casterton was investigated in the hydraulic model. The results of this indicated there is a backwater effect from the Wannon River on the Glenelg River, this effect does not extend upstream of Peachy Road.
8.1.2 Review and update of the flood warning system for Casterton A review of the flood warning system for Casterton was undertaken as part of the Study. This review concluded that there is a need for a flood warning system in Casterton and that the deliverables of this study would enhance that flood warning system. In addition, the Study developed a Service Level Agreement for the flood warning system in Casterton in conjunction with all stakeholders in the flood warning system.
8.1.3 Flood Visualisation Tool The information on flooding in Casterton developed as part of the Study was incorporated into Flood Visualisation Tool. The purpose of the Flood Visualisation Tool was to communicate flood information effectively and clearly through a portable software tool for emergency services. This tool has been distributed to the GHCMA who are the custodians of the tool.
8.2 Recommendations The Study has a number of recommendations, these are:
The Flood Frequency Analysis for Casterton should be updated to current standards following the next large flood event.
The flood model (hydraulic and hydrologic) should be recalibrated following the next large flood event.
The flood information, including the regression relationships between river gauges, will be provided to the Bureau of Meteorology to assist their flood warning responsibilities.
Stakeholders in the flood warning system in Casterton should be trained in the use of the Food Visualisation Tool.
The flood warning Service Level Agreement should be adopted.
The Municipal Flood Emergency Plan should be updated using the information developed as part of the Study

Casterton Flood Intelligence & Warning Improvements 52 References
T:\M8575.MAJ.Casteron_FI\docs\R.M8575.003.01.Final.docx
9 References Alexander, W.S. (1983). Feasibility study into levee around the Casterton Township.
BMT WBM and Michael Cawood and Associates (2013a). Flood Warning Service Level Agreement for the Glenelg River at Casterton: Discussion Paper (R.M8575.001.00.docx), Melbourne, Victoria.
BMT WBM and Michael Cawood and Associates (2013b). Flood Forecast and Warning Service Level Agreement for the Glenelg River at Casterton (R.M8575.002.00.docx), Melbourne, Victoria.
Cardno Pty Ltd (2010). Casterton Flood Investigations: Floodplain Management Report (RM2298), Prepared for Glenelg Hopkins CMA and Glenelg Shire Council, Collingwood, Victoria.
Cardno Lawson Treloar Pty Ltd (2008). Casterton Flood Investigations (LJ5580 RM2187), Collingwood, Victoria.
Glenelg Hopkins Catchment Management Authority (2010) A History of Flooding in Casterton, Unpublished report, Hamilton, Victoria
Shand, T.D,, Cox, R.J., Blacka, M.J. and Smith, G.P. (2011). Appropriate Safety Criteria for Vehicles – Literature Review. Australian Rainfall and Runoff Revision: Project 10.


Casterton Flood Intelligence & Warning Improvements A-1 Regression Analysis Diagnostics
T:\M8575.MAJ.Casteron_FI\docs\R.M8575.003.01.Final.docx
Appendix A Regression Analysis Diagnostics This appendix presents the regression model diagnostics for the regression analysis undertaken in this project.
A.1 Old and new Dergholm Regression Analysis Diagnostics Overall the Old and New Dergholm river gauges were strongly linearly correlated, indicating a strong relationship between the Old Dergholm and New Dergholm river heights. However, it should be noted that the number of events that were available and analysed represents a small sample size.
The summary table (Table A-1) indicates that both the intercept and the gradient terms in the linear regression are significantly different from 0 at the 0.1% level given the t values. This means that the Old Dergholm values are significant predictors of the New Dergholm values.
Figure A-1 shows the residuals versus fitted values. This plot shows that the residuals are distributed either side of zero, and also that they are not biased with negative residuals occurring for smaller values and positive residuals occurring for larger values (or vice versa).
Figure A-2 indicates that the residuals are approximately normally distributed with the exception of the point labelled 3.
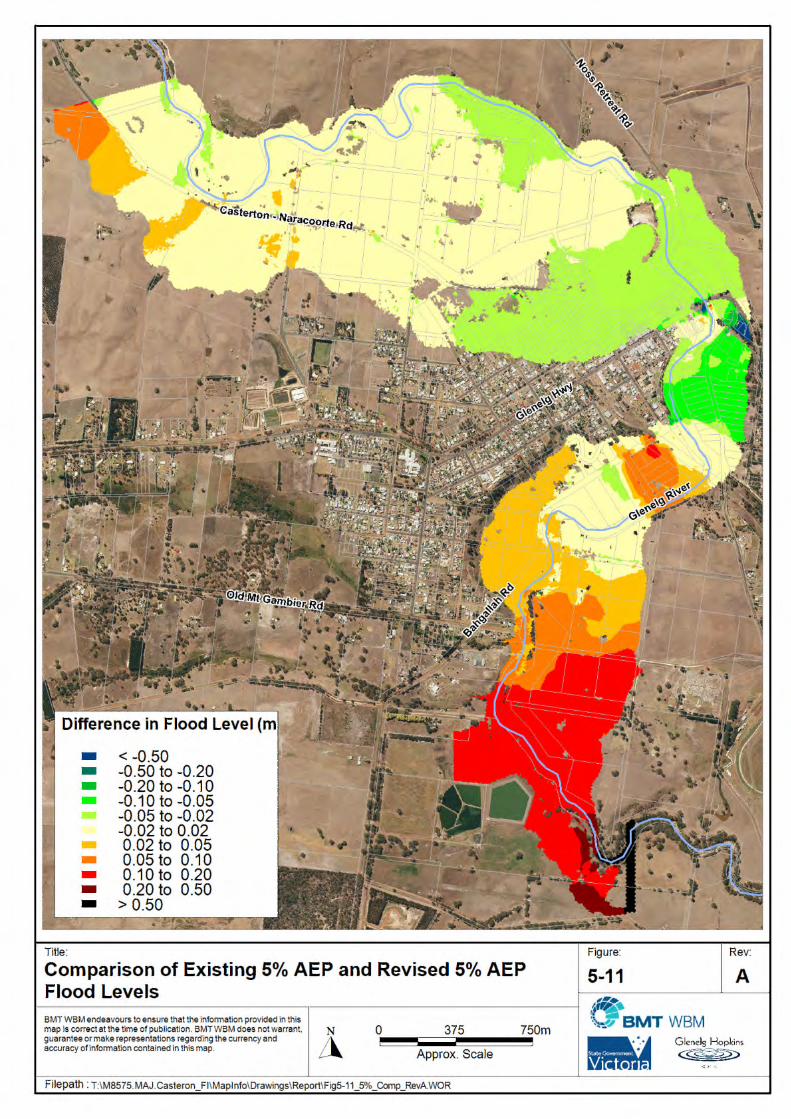
Figure A-3 shows the Leverage and Cook’s Distance for the regression model. Leverage is a measure of the influence of a predictor on the regression results and calculates how far a predictor is from its mean. Cook’s distance combines Leverage together with residuals. For small datasets, observations with Cook’s Distance values greater than 4/n, where n is the number of observations, can be considered highly influential. Given there are 10 observations the critical value of Cook’s distance is 0.4. All values of Cook’s Distance are less than 0.4 with the exception of the point labelled 1. Reference to Figure A-2 indicates that point 1 falls near the Q-Q line indicating that while this point may be highly influential it is consistent with the rest of the data.
Table A-1 Wando Vale – Casterton Regression model summary
Coefficients Estimate Std. Error t value Pr(>|t|)
Intercept (b) 0.512 0.112 4.563 0.00184
Gradient (m) 0.949 0.030 31.887 1.02e-09

Casterton Flood Intelligence & Warning Improvements A-2 Regression Analysis Diagnostics
T:\M8575.MAJ.Casteron_FI\docs\R.M8575.003.01.Final.docx
Figure A-1 Old and New Dergholm Residuals verses Fitted Plot
Figure A-2 Old and New Dergholm Normal Q-Q Plot
Casterton Flood Intelligence & Warning Improvements A-3 Regression Analysis Diagnostics
T:\M8575.MAJ.Casteron_FI\docs\R.M8575.003.01.Final.docx
Figure A-3 Old and New Dergholm Residuals verses Fitted Leverage Plot
A.2 Wando Vale – Casterton Regression Analysis Diagnostics Overall the Wando Vale peak – Casterton initial peak relationship diagnostics indicated a strong relationship between the peak flood height on the Wando River at Wando Vale and the initial peak on the Glenelg at Casterton. However, it should be noted that the number of events available and analysed represents a small sample size.
The summary table (Table A-2) indicated that both the intercept and the gradient terms in the linear regression are significantly different from 0 at the 1% level given the t values. This means that the Wando Vale values are significant predictors of the response at Casterton.
Figure A-4 shows the residuals versus fitted values. This plot shows that the residuals are distributed either side of zero, and also that they are not biased with negative residuals occurring for smaller values and positive residuals occurring for larger values (or vice versa).
Figure A-5 indicates that the residuals are approximately normally distributed with the exception of the points labelled 2 and 3.
Figure A-7 shows the Leverage and Cook’s Distance for the regression model. Leverage is a measure of the influence of a predictor on the regression results and calculates how far a predictor is from its mean. Cook’s distance combines Leverage and residuals. For small datasets, observations with Cook’s Distance values greater than 4/n, where n is the number of observations, can be considered highly influential. Given there are 10 observations the critical value of Cooks distance is 0.4. All values of Cook’s Distance are less than 0.4. For this reason no observations were considered highly influential.

Casterton Flood Intelligence & Warning Improvements A-4 Regression Analysis Diagnostics
T:\M8575.MAJ.Casteron_FI\docs\R.M8575.003.01.Final.docx
Table A-2 Wando Vale –Casterton Regression model summary
Coefficients Estimate Std. Error t value Pr(>|t|)
Intercept (b) 2.0334 0.5662 3.592 0.00707
Gradient (m) 1.2192 0.2649 4.603 0.00175
Figure A-4 Wando Vale – Casterton Residuals verses Fitted Plot
Figure A-5 Wando Vale – Casterton Normal Q-Q Plot

Casterton Flood Intelligence & Warning Improvements A-5 Regression Analysis Diagnostics
T:\M8575.MAJ.Casteron_FI\docs\R.M8575.003.01.Final.docx
Figure A-6 Wando Vale – Casterton Residuals verses Fitted Leverage Plot
A.3 Dergholm – Casterton Regression Analysis Diagnostics Overall the Dergholm – Casterton peak relationship diagnostics indicated a strong relationship between the peak flood heights between the 2 sites. However, as above, it should be noted that the number of events available and analysed represents a small sample size.
The summary table (Table A-3) indicated that both the intercept and the gradient terms in the regression are significantly different from 0 at the 1% level given the t values. This means that the Dergholm values are significant predictors of the response at Casterton.
Figure A-7 shows the residuals versus fitted values. This plot shows that the residuals are distributed either side of zero. However, this plot does suggest that there may be a slight positive bias for both large and small estimates. It should be recalled that the sample size is small, which may be distorting results.
Figure A-8 indicates that the residuals are approximately normally distributed as expected.
Figure A-9 shows the Leverage and Cook’s Distance for the regression model. Leverage is a measure of the influence of a predictor on the regression results and calculates how far a predictor is from its mean. Cook’s distance combines Leverage and residuals. For small datasets, observations with Cook’s Distance values greater than 4/n, where n is the number of observations, can be considered highly influential. Given there are 11 observations the critical value of Cook’s distance is 0.36. All values of Cook’s Distance are less than 0.36. For this reason no observations were considered highly influential.

Casterton Flood Intelligence & Warning Improvements A-6 Regression Analysis Diagnostics
T:\M8575.MAJ.Casteron_FI\docs\R.M8575.003.01.Final.docx
Table A-3 Wando Vale –Casterton Regression model summary
Coefficients Estimate Std. Error t value Pr(>|t|)
Intercept (b) -4.1572 0.8120 -5.119 0.000156
Gradient (m) 1.8442 0.1707 10.802 3.56e-08
Figure A-7 Dergholm – Casterton Residuals verses Fitted Plot
Figure A-8 Dergholm – Casterton Residuals Normal Q-Q Plot

Casterton Flood Intelligence & Warning Improvements A-7 Regression Analysis Diagnostics
T:\M8575.MAJ.Casteron_FI\docs\R.M8575.003.01.Final.docx
Figure A-9 Dergholm – Casterton Residuals verses Fitted Leverage Plot


Casterton Flood Intelligence & Warning Improvements B-1 Flood Warning Service Level Agreement for the Glenelg River at Casterton
T:\M8575.MAJ.Casteron_FI\docs\R.M8575.003.01.Final.docx
Appendix B Flood Warning Service Level Agreement for the Glenelg River at Casterton

Flood Warning Service Level Agreement for the Glenelg River at Casterton Discussion Paper
A part of BMT in Energy and Environment
R.M8575.001.00 May 2013

T:\M8575.MAJ.CASTERON_FI\DOCS\R.M8575.001.00.DOCX
Flood warning service level agreement for the Glenelg
River at Casterton – Discussion paper
Prepared For: Glenelg Hopkins CMA
Prepared By: BMT WBM Pty Ltd (Member of the BMT group of companies) and
Michael Cawood and Associates
Offices
Brisbane Denver Mackay
Melbourne Newcastle
Perth Sydney
Vancouver
T:\M8575.MAJ.CASTERON_FI\DOCS\R.M8575.001.00.DOCX
DOCUMENT CONTROL SHEET
BMT WBM Pty Ltd BMT WBM Pty Ltd Level 5, 99 King Street MELBOURNE VIC 3000 Australia PO Box 604 Collins Street West VIC 8007 Tel: +61 3 8620 6100 Fax: +61 3 8620 6105 ABN 54 010 830 421 www.bmtwbm.com.au
Document :
Project Manager :
R.M8575.001.00.docx
Philip Pedruco
Client :
Client Contact:
Client Reference
Glenelg Shire Council
Jacinta Herrmann
201112-1320 Title : Flood warning service level agreement for the Glenelg River at Casterton - Discussion
paper
Author : Michael Cawood and Philip Pedruco
Synopsis : Discussion paper for a workshop aimed at seeking an agreement on what needs to be done in order to meet flood warning system requirements for Casterton; confirm roles and responsibilities; and, establish draft performance criteria in a Total Flood Warning System context.
REVISION/CHECKING HISTORY
REVISION NUMBER
DATE OF ISSUE CHECKED BY ISSUED BY
0 29/05/2013 PP
PP
DISTRIBUTION
DESTINATION REVISION
0 1 2 3
GHCMA
GSC
BoM
VICSES
DEPI
BMT WBM File
BMT WBM Library

CONTENTS I
T:\M8575.MAJ.CASTERON_FI\DOCS\R.M8575.001.00.DOCX
CONTENTS
Contents i List of Figures ii List of Tables ii
1 INTRODUCTION 1-1
2 FLOODPLAIN MANAGEMENT AND FLOOD WARNING 2-1
2.1 Overview 2-1
2.2 Limitations of Flood Warning Systems 2-2
2.3 The Total Flood Warning System 2-3
2.4 Total Flood Warning System Building Blocks 2-4
3 THE EXISTING FLOOD WARNING SYSTEM 3-1
3.1 Arrangements for Service Delivery in Victoria 3-1
3.2 Who Does What in the Glenelg River Catchment 3-1
3.3 Flood Forecasting Service Provided by the Bureau of Meteorology 3-1
3.3.1 Overview 3-1
3.3.2 Flood Watches 3-2
3.3.3 Flood Warnings 3-2
3.3.4 Flash Flooding 3-3
3.3.5 Severe Thunderstorm and Severe Weather Warnings 3-4
3.4 Data Sharing 3-5
3.5 Water Act 2007 and Water Regulations 2008 3-5
4 STATUS OF RECENT LOCAL PROJECTS THAT SUPPORT IMPROVED FLOOD WARNING 4-1
4.1 Flood and Related Studies 4-1
4.2 Planning Scheme Update 4-1
4.3 Flood Visualisation Tool 4-1
4.4 Flood Emergency Plan 4-2
4.5 GIS Resident Flood Datasets 4-2
4.6 Flood Information Brochure 4-2

LIST OF FIGURES II
T:\M8575.MAJ.CASTERON_FI\DOCS\R.M8575.001.00.DOCX
4.7 Data Collection Network Upgrade 4-2
4.8 Flood Forecast Model 4-3
5 MATTERS FOR CONSIDERATION 5-1
5.1 Introduction 5-1
5.2 Flood Risk at Casterton 5-1
5.3 Awareness 5-1
5.4 Response / Mitigation 5-1
5.5 Message Construction and Dissemination (alerting and notification) 5-2
5.6 Interpretation 5-2
5.7 Flood Detection and Prediction 5-2
5.8 Data Collection and Collation 5-3
5.9 Review 5-3
5.10 Flood Warning Service Level Agreement 5-3
5.11 Consequential Adjustments 5-3
6 REFERENCES 6-1
7 GLOSSARY OF TERMS 7-1
APPENDIX A: FLOOD CLASS LEVELS A-1
LIST OF FIGURES
Figure 1-1 The Glenelg River Catchment 1-2
Figure 2-1 The Total Flood Warning System (derived from AEMI, 1995) 2-4
Figure 3-1 Glenelg River Catchment Flood Warning & Data Dissemination Schematic 3-6
LIST OF TABLES
Table 2-1 Flood Warning System Building Blocks 2-6

INTRODUCTION 1-1
T:\M8575.MAJ.CASTERON_FI\DOCS\R.M8575.001.00.DOCX
1 INTRODUCTION
This discussion paper has been prepared as a lead-in to a workshop aimed at:
Seeking agreement on what needs to be done in order to meet flood warning system requirements for Casterton;
Confirming roles and responsibilities; and
Establishing draft performance criteria in a Total Flood Warning System (TFWS) context.
In addition to providing background on flood warning matters, this paper provides a starting point for firming up on stakeholder entity roles and responsibilities and the development of a set of parameters that define flood forecast and warning delivery requirements for the at-risk communities at Casterton.
The Glenegl River catchment, in which Casterton is located, is shown in Figure 1-1 together with stream gauging stations and synoptic or continuous rainfall stations.
The proposed Service Level Agreement (SLA) will in effect be a statement of requirements for the delivery of flood forecast and warning services to at-risk communities at Casterton. It will document the agreed parameters and working arrangements for delivery of flood forecast and warning services for Casterton so that community and agency requirements (in terms of people / assets at risk and viable response actions and associated timings) drive service delivery. The SLA will be accompanied by relevant supporting information. This will include details of the roles and responsibilities of each stakeholder entity with respect to each element of the TFWS. These will have their genesis in the legislation, policies, procedures and other arrangements that comprise the framework for flood warning service delivery within Victoria but be stated in terms specific to Casterton.
It is possible that (in time) the SLA may provide the basis for post-event evaluations of flood forecast and warning system performance on a location by location basis. Any gaps between what is required and service delivery on each of the TFWS components could be documented and form the basis for longer term upgrade plans.
The remainder of this discussion paper comprises four main sections.
Section 2 provides background to the development of a flood warning service level agreement. The place of flood warning systems in a risk based approach to floodplain management is discussed and the concept of the TFWS introduced. Stakeholder entity roles and responsibilities are then outlined in the context of the TFWS model and current State arrangements.
Section 3 presents an overview of the existing flood warning service for Casterton as provided by the Bureau of Meteorology. The status and delivery of other components of the TFWS are not documented.
Section 4 contains a summary of recent projects that provide some benefit to the TWFS for the Glenelg River at Casterton and possibly further afield.
Section 5 has been included to stimulate some consideration of the matters that will be discussed at the initial flood warning SLA workshop. It would be beneficial if readers could reflect on these and related matters prior to the workshop

Filepath :
Figure:
Title
:
www.bmtwbm.com.au
Rev:
Glenelg River Catchment
T:\M
8575.M
AJ.Casteron_FI\M
apInfo\Drawings\SLA_WS\Fig_1_1.W
OR
1-1
BMT W
BM endeavours to
ensure th
at th
e inform
ation provided in th
is
map is corre
ct a
t the tim
e of p
ublication. B
MT W
BM does not w
arra
nt,
guarantee or m
ake re
presentations re
garding th
e curre
ncy and
accuracy of in
form
ation contained in th
is map.
A
030km
15
Approx. S
cale

FLOODPLAIN MANAGEMENT AND FLOOD WARNING 2-1
T:\M8575.MAJ.CASTERON_FI\DOCS\R.M8575.001.00.DOCX
2 FLOODPLAIN MANAGEMENT AND FLOOD WARNING
2.1 Overview
A clear and precise definition of what is meant by ‘floodplain management’ is difficult to find. FIFMTF (1992) proposes a definition that sits comfortably within the context of the Victorian Flood Management Strategy (DNRE, 1998) as follows.
“Floodplain Management is a decision making process where the goal is to achieve ‘wise use’ of the nation’s floodplains and where ‘wise use’ is categorised as “any (set of) activities that are compatible with the risk to natural resources (the natural and beneficial functions of the floodplain) and human resources (life and property)”.
There is no simple answer on how to achieve ‘wise use’ as floods, floodplains and the assets they support are highly variable within and between areas. Further, community perceptions of benefits and risk also vary within and between locations and communities. There is however, general agreement that the key to sound floodplain management is effective floodplain land use management and associated response in conjunction with, in some cases, appropriate physical / structural modifications. This and the shift to a risk based approach to floodplain management are reflected in current Australian best practice guides (e.g. EMA, 1999; ARMCANZ, 2000) and in Victorian State policy (e.g. DNRE, 1998; DoI, 2000a, b & c).
Consistent with the above, emphasis within floodplain management has moved from the wholesale implementation of structural solutions for flooding to a much greater reliance on non-structural solutions such as:
Land use planning which seeks to discourage flood-vulnerable uses from flood prone areas;
Provision of flood warning services together with measures to assist communities understand and utilise those warnings; and
Implementation of emergency management measures such as flood emergency (or response) plans to guide property-protecting and life-preserving activities at the actual time of flooding.
Flood warning systems provide a means of gathering information about impending floods, communicating that information to those who need it (those at risk) and facilitating effective and timely responses from them (Mileti and Sorenson, 1990). Thus flood warning systems aim to enable and persuade people and organisations to take action to increase personal safety and reduce the damage caused by flooding1.
While flood forecasting and warning are recognised as valuable floodplain management strategies (see for example EMA 1999, ARMCANZ 2000, DNRE 1998, DIPNR 2005, ASFPM 2006), it is essential that flood warning systems consider not only the production of accurate and timely forecasts but also the efficient dissemination of those forecasts to response agencies and threatened communities in a manner and in words that elicit appropriate responses based on well-developed
1 More generally, the objective of early warning is to empower individuals and communities, threatened by natural or similar hazards, to
act in sufficient time and in an appropriate manner so as to reduce the possibility of personal injury, loss of life and damage to property, or nearby and fragile environments (IDNDR, 1997).

FLOODPLAIN MANAGEMENT AND FLOOD WARNING 2-2
T:\M8575.MAJ.CASTERON_FI\DOCS\R.M8575.001.00.DOCX
mechanisms that maintain flood awareness within communities (IDNDR, 1997: EMA, 2009b). Hence, equally important to the development of flood warning mechanisms is the need for robust flood awareness programs to ensure communities are capable of response. The ‘flood warning coupled with flood awareness and preparedness’ theme is reiterated in BTRE (2002) and EMA (2009a, b & c).
2.2 Limitations of Flood Warning Systems
No single floodplain management measure is guaranteed to give complete protection against flooding. For example, levees can be overtopped when a flood exceeds design height or fail when construction standards are poor or maintenance is inadequate. Likewise, flood response plans can be poorly formulated or applied ineffectually by those responsible for putting their provisions into practice when flooding occurs.
Flood warning systems are, by their very nature, complex. They are a combination of technical, organisational and social arrangements. To function effectively they must be able to:
Forecast coming floods in terms of the time to exceed critical levels and the expected severity (using data inputs that may include rainfall and upstream river heights and / or flows along with modelling techniques);
Transmit the forecast to those who will be affected (the at-risk communities) in ways that they understand; and
Trigger appropriate behaviours from the at-risk communities (for example, to protect assets and / or to evacuate out of the path of the floodwaters, etc.).
It is not surprising, given the above, that flood warning systems often work imperfectly and have, on occasions, failed. Indeed, as Handmer (2000) points out, “flood warnings often do not work well and too frequently fail completely – and this despite great effort by the responsible authorities”. While in some cases the problem is the result of a physical, mechanical or technical failure (for example of gauges or telemetry or of communications equipment during a flood event) or perhaps in defining what constitutes success (or failure), the more common reason is that the systems have not been properly conceptualised at the design stage and in terms of their operation despite the considerable and conscientious efforts of those involved. All too often, too little attention has been paid to issues of risk communication. In particular to:
Building a local awareness and better understanding of flood risk along with knowledge of what can be done to minimise that risk;
Determining what information is required by the at-risk community and with what lead times (e.g. assuming that the delivery of an accurate peak forecast with limited lead time is required for locations where a time to exceed key levels and an approximate peak level with sufficient lead time to enable appropriate response actions would be more useful and enable the TFWS to deliver real benefits);
Establishing systems to distribute warnings and required information to and within target communities; and
Ensuring that recipients of warning messages understand what the message is telling them and what it means for their property and individual circumstances in terms of the damage reducing actions they need to take.

FLOODPLAIN MANAGEMENT AND FLOOD WARNING 2-3
T:\M8575.MAJ.CASTERON_FI\DOCS\R.M8575.001.00.DOCX
In many cases where flood warning systems have been developed, the bulk of the effort has been devoted to creating and strengthening data collection networks, devising and upgrading forecasting tools and facilities and utilising new dissemination technologies to distribute the forecast to at-risk communities. While all these things are important, they are never sufficient by themselves to ensure that flood warnings are heeded by those who receive them. Other equally vital elements of the system such as risk communication and the comprehension that people have of the flood problems they may face (and the value that warnings can offer) need at least as much attention at the design stage and in system operation. The lesson from many studies of flood warning systems (e.g. Smith and Handmer, 1986; Phillips, 1998; Handmer, 1997; 2000; 2001; 2002) is that the status of all elements of the system must be given appropriate resourcing if the system is to be made capable of functioning effectively.
Studies of flood warning system failures (e.g. Brisbane in 1974, Charleville and Nyngan in 1990, Benalla in 1993, Canada in 1997, England in 1998 and again in 2007, Kempsey and Grafton in 2001, New Zealand in 2005) suggest that the most common reasons for poor system performance are that those in the path of floods have either not understood the significance of the warnings they have received, or have not known that there were things they could do to mitigate the effects of flooding. The result has all too often been unnecessary loss of private belongings and commercial and industrial plant, stock and records and / or unnecessary risk to life.
Flood warning systems (and investments in their implementation) that over-emphasise the collection of input data and / or the production of flood forecasts relative to the attention given to other elements (such as message construction, the information provided in the messages, matching information delivery to community needs, and the education of flood prone communities about floods and flood warnings) will fail to fully meet the needs of the at-risk communities they have been set up to serve.
2.3 The Total Flood Warning System
In 1995 the Australian Emergency Management Institute, following a national review of flood warning practices after severe flooding in the eastern states in 1990, published a best-practice manual entitled ‘Flood Warning: an Australian Guide’ (AEMI, 1995). In describing practices for the design, implementation and operation of flood warning systems in Australia, the manual introduced the concept of the ‘total flood warning system’ (TFWS). It also re-focused attention on flood warning as an effective and credible flood mitigation measure but made it clear that successful system implementation required the development of some elements that hitherto had been given little attention as well as the striking of an appropriate balance between each of the elements. In particular, it was noted that more attention needed to be given to risk communication and the education of communities about the flood risk, the measures which people could take to alleviate the problems that flooding causes and the place of warnings in triggering appropriate actions and behaviours. It was made clear that implementing a flood warning system wasn’t just a matter of installing a data collection network, developing a forecast tool and forwarding predicted flood levels and times to key agencies.
While the 1995 manual has been updated (in 1999 and again in 2009) and is now known more formally as Manual 21 of the Australian Emergency Manual Series (EMA, 2009b), the concepts and terminology introduced in 1995 remain valid.

FLOODPLAIN MANAGEMENT AND FLOOD WARNING 2-4
T:\M8575.MAJ.CASTERON_FI\DOCS\R.M8575.001.00.DOCX
The TFWS concept is shown in diagrammatic form in Figure 2-1. It represents the many interests that must be brought together to deliver an effective flood warning service: no single agency is likely to be able to provide all the skills required. It therefore makes clear the need for several agencies to play a part, with clearly-defined roles and with the various elements carefully integrated, and for the members of flood liable communities to be involved. Put another way, “effective warning systems rely on the close cooperation and coordination of a range of agencies, organisations and the community” (DoTARS, 2002). This message was reinforced in Neil Comrie’s report on the Victorian 2010-11 floods review (Comrie, 2011).
Figure 2-1 The Total Flood Warning System (derived from AEMI, 1995)
The philosophy that underlies the TFWS concept coupled with the need for a coherent set of linked operational responsibilities and overlapping functions are documented and discussed in the context of guiding principles for effective early warning in IDNDR (1997). While this discussion paper is developed around the TFWS building blocks, direct parallels can be drawn between the guiding principles documented in IDNDR (1997) and the discussion herein.
2.4 Total Flood Warning System Building Blocks
The TFWS is based on the eight building blocks which are listed in Table 2-1 together with organisations involvement and the available tools for the TFWS. The building blocks are:
Data collection & collation;

FLOODPLAIN MANAGEMENT AND FLOOD WARNING 2-5
T:\M8575.MAJ.CASTERON_FI\DOCS\R.M8575.001.00.DOCX
Flood detection & prediction (i.e. forecasting);
Message construction;
Message dissemination (i.e. Flood alerting and notification: communicating the warning message and information);
Interpretation (i.e. What does the forecast height mean for me or you);
Response;
Review; and
Awareness.
An effective flood warning system requires all system components to be in place and for stakeholders, including members of flood liable communities, to be working together. Effectiveness can be measured by considering whether people have:
Received appropriately timely and accurate information;
Understood that information and appreciated what it means for them; and
Been prompted by the information to initiate relevant damage-reducing or safety-enhancing actions (for example, by avoiding flooded or closed roads, moving property and / or livestock, evacuating to a suitable location, etc.) within timeframes appropriate to the circumstances.
Thus, an effective flood warning system is made up of several building blocks. Each building block represents a component of the TFWS. The blocks (derived from AEMI, 1995) along with the basic tools to facilitate delivery against each of the TFWS elements are presented in Table 2-1.
These building blocks need to be appropriately developed and integrated to provide a successful and effective flood warning system. Such a system considers not only the production of an accurate, timely and appropriate forecast but also the efficient dissemination of that forecast to response agencies and the threatened community in a manner that elicits an appropriate response. An informed and flood aware community is more likely to receive the full benefits of the warning system.

FLOODPLAIN MANAGEMENT AND FLOOD WARNING 2-6
T:\M8575.MAJ.CASTERON_FI\DOCS\R.M8575.001.00.DOCX
Table 2-1 Flood Warning System Building Blocks
[Based on the Emergency Management Manual Victoria, Commonwealth-State arrangements for flood warning service provision (Bureau of
Meteorology, 1987) and VFWCC (2001)]
Building Blocks of a Flood Warning System
Entities Involved in Victoria Basic Tools
DATA COLLECTION & COLLATION
BoM provides real time data for flood warning from the national rain gauge network and provides technical assistance for improved data collection networks to support flood warning systems. MW provides real time river and additional rain data for flood warning for the Port Phillip and Westernport region. River and other rain data availability assured through the DSE-managed Regional Surface Water Monitoring Partnerships (involve BoM, DSE, RWAs, CMAs, LG, etc.). LG (as the prime beneficiary) has O&M funding responsibilities for upgraded flood warning networks if gauges have been installed primarily for flood warning purposes (VFWCC, 2001).
Data collection network (e.g. rain & stream gauges, weather radar, satellite images). System to convey data from field to forecast centre (eg. radio or telephone telemetry). Data management system to check, correct, store, display data. Information on water storage levels, inflows and operations.
Arrangements and facilities for system / equipment maintenance and calibration. For example, the Regional Surface Water Monitoring Partnerships, data warehousing, etc.
FLOOD DETECTION & PREDICTION (ie. Forecasting)
BoM prepares flood forecasts for rural areas and provincial centres. Murray forecasts determined in conjunction with Murray Darling Basin Authority. MW prepares flood forecasts for the main streams in the Port Phillip and Westernport region. BoM provides predictions of weather conditions likely to lead to flash flooding for the whole State. LG is primarily responsible for flash flood forecasting but likely to be assisted by MW in the Port Phillip and Westernport region.
Information on critical levels / effects at key and other locations. Appropriately representative flood class levels at key locations. Flood forecast techniques (ie. hydrologic and rainfall-runoff models, stream height and flow correlations, simple nomograms based on rainfall). URBS models developed for most of the larger Victorian catchments but not for Glenelg.
Meteorological analyses and data.
MESSAGE CONSTRUCTION
Warning messages are prepared by: BoM for weather conditions likely to lead to flash
flooding for the whole State; BoM for flooding in rural areas and provincial centres; MW for flooding in the Port Phillip and Westernport
region but disseminated through BoM system; LG for flash flooding in municipal areas.
Warning messages / products and message dissemination system.

FLOODPLAIN MANAGEMENT AND FLOOD WARNING 2-7
T:\M8575.MAJ.CASTERON_FI\DOCS\R.M8575.001.00.DOCX
Building Blocks of a Flood Warning System
Entities Involved in Victoria Basic Tools
Opportunity exists for enhancement of messages by LG through inclusion of local impacts and related information.
MESSAGE DISSEMINATION (ie. flood alerting and notification: communicating the warning message and information)
BoM to VICSES, LG, VicPol, CMAs and media. VICSES alerts relevant agencies and organisations when BoM issues flood warning(s) and may enhance flood warning(s) by issuing community safety information and action statements as part of flood bulletins. VICSES may refer relevant agencies and organisations to BoM website or to VICSES website and / or Flood and Storm Information Line (when activated) for key messages and action statements. VICSES is not required to disseminate flood watches or warnings. LG disseminate information further. Not clear that messages are disseminated sufficiently to at-risk communities. BoM provides ALERT system co-operators with ENVIROMON software to collate and display data and initiate flood alerts that are based on exceedance of criteria such as rainfall volumes or rates and / or river levels or rates of rise.
Formal media channels2 – TV, radio and print.
Internet (e.g. email, BoM website, VICSES website).
Tape message services (e.g. VICSES’ Flood and Storm Information Line for key messages and action statements).
Other channels - fax / faxstream, phone / pager (eg. SMS such as offered by StreetData, voice, local communication ‘trees’), voice messaging systems (e.g. Xpedite is in use for Maribyrnong, Shepparton-Mooroopna, Euroa, Benalla, Traralgon, Nathalia and Moolap in Geelong and being considered for other communities, the Emergency Alert (EA) system), community radio (e.g. FM-88).
Doorknocking.
2 ABC Radio has entered into a formal agreement with the Victorian Government and the Bureau of Meteorology to broadcast, in full, weather related warnings including those for flood. The
agreement provides for the interruption of normal programming at any time to allow the broadcast of warning messages. This agreement will ensure that flood (and other) warnings issued by the BoM are broadcast in their entirety and as soon as possible after they are received in the ABC’s studio.

FLOODPLAIN MANAGEMENT AND FLOOD WARNING 2-8
T:\M8575.MAJ.CASTERON_FI\DOCS\R.M8575.001.00.DOCX
Building Blocks of a Flood Warning System
Entities Involved in Victoria Basic Tools
Other opportunities for at-risk communities to confirm warning details.
INTERPRETATION (ie. what does the forecast height mean for me or you)
LG and community but is spread across LG, VICSES and CMAs, none of whom consider it core business. Opportunity for MW and CMAs to assist LG through provision of flood related expertise and experience re impacts, etc – both during planning for and responding to flood.
Interpretative tools (i.e. flood inundation maps from experience, studies, VFD and related databases, flood information cards, flood histories, local knowledge, flood emergency plans that have tapped community knowledge and experience as well as flood related studies and other sources, etc.).
RESPONSE
VICSES are the Control Agency for flood response. Strong involvement from LG, VicPol and community. Should be driven by flood emergency plans (MFEPs) that include local flood intelligence gained from experience and extracted from flood study deliverables. Should also be driven by personal and business flood response plans.
Flood management tools (e.g. MFEP complete with inundation maps and past ‘intelligence’, effective public dissemination of flood information, local flood awareness, individual and business flood action plans, etc.).
Community flood education and flood awareness raising, flood response guidelines and related information – all those tools that together work to build flood resilient communities (see the Awareness building block below).
Personal and business flood action plans (see EMA website, VICSES tool kit, etc).
Comprehensive use of available experience, knowledge and information.
REVIEW
All stakeholder entities including the VFWCC and communities potentially have opportunity to provide review comments. LG, MW, CMAs and VICSES have a role in collecting post-flood data (hydrologic, flood extent, impacts, damages, etc.).
Post-event debriefs (agency, community), etc.
Review and update of personal, business and other flood action plans.
Collection of flood ‘intelligence’ and flood damage data during and after the event including Rapid Impact Assessments.
AWARENESS VICSES has adopted a lead role with the roll-out of the FloodSafe program. Involvement from LG, MW and CMAs (and RWAs in some instances).
Identification of vulnerable communities and properties (ie. flood inundation maps, information on flood levels / depths and extents, property-specific flood depths, etc.).

FLOODPLAIN MANAGEMENT AND FLOOD WARNING 2-9
T:\M8575.MAJ.CASTERON_FI\DOCS\R.M8575.001.00.DOCX
Building Blocks of a Flood Warning System
Entities Involved in Victoria Basic Tools
Activities and tools (e.g. participative community flood education, flood awareness raising, flood risk communication) that aim to build flood resilient communities (i.e. communities that can anticipate, prepare for, respond to and recover quickly from floods while also learning from and improving after flood events).
VICSES’ FloodSafe and StormSafe (flash / stormwater flooding) programs.
Local flood education plans – developed, implemented and evaluated locally (e.g. Cities of Maroondah, Whitehorse, Wodonga, Benalla and Greater Geelong).
Local Flood Guides, residents’ kits, flood level information, flood inundation maps, flood markers, property-specific flood charts (eg. Glenorchy, Horsham, Dimboola, Warracknabeal), flood levels in meter boxes (e.g. Benalla, Traralgon) and on rate notices, etc.

THE EXISTING FLOOD WARNING SYSTEM 3-1
T:\M8575.MAJ.CASTERON_FI\DOCS\R.M8575.001.00.DOCX
3 THE EXISTING FLOOD WARNING SYSTEM
3.1 Arrangements for Service Delivery in Victoria
Arrangements for the provision of flood warning services in Victoria (and thus for the Glenelg River catchment) were formalised in working arrangements approved by the Commonwealth Government in 1987 (Bureau of Meteorology, 1987) and agreed to in-principle by the Victorian Government through the State Disaster Council in early 1988. These arrangements were reiterated and aspects clarified in Arrangements for Flood Warning Services in Victoria (VFWCC, 2001) and then endorsed by the relevant Minister at both State and Federal level3. State and local entity responsibilities are addressed in the Emergency Management Manual Victoria (State of Victoria – OESC, 2012) as well as in applicable State legislation.
In response to recommendations contained in the Munro review (Munro, 2011) and in order to clarity service provision, the Bureau of Meteorology is currently working on the development of an SLA that will formalise the service levels for each catchment for which flood warnings are currently provided.
The State Government’s response to the Victorian Floods Review (Victorian Government, 2012) also indicates that:
The BoM has started a review and update of the flood warning arrangements documentation in order to provide clarity on roles and responsibilities, including the inter-relationship between the Commonwealth and the state;
Service delivery arrangements will be revisited through a process to “review and update arrangements for flood warning systems in Victoria, including further clarifying the service provided by the Commonwealth Government through the BoM”; and
The Victorian Flood Management Strategy (DNRE 1998) will be reviewed and updated.
3.2 Who Does What in the Glenelg River Catchment
Using the TFWS model and building blocks introduced at Sections 2.3 and 2.4 in the context of the arrangements outlined in Section 3.1, the roles of stakeholder entities in the Glenelg River catchment coupled with local requirements and arrangements at Casterton need to be summarised into a (draft) flood warning SLA.
3.3 Flood Forecasting Service Provided by the Bureau of Meteorology
3.3.1 Overview
Flood watches for the Glenelg River catchment and flood warnings for the Glenelg River at Casterton are disseminated by the Bureau of Meteorology’s computer system via a combination of fax and
3 While this document is firm on ‘who pays’ with regard to data collection networks it is not so specific on roles and responsibilities for
the delivery on other aspects of the TFWS (e.g. on the development and delivery of flood awareness programs / activities, the interpretation of flood forecast information at the local level, etc.).

THE EXISTING FLOOD WARNING SYSTEM 3-2
T:\M8575.MAJ.CASTERON_FI\DOCS\R.M8575.001.00.DOCX
email to the media, VICSES, Councils and other stakeholder agencies and organisations. Arrangements applying for the Glenelg River at Casterton are shown in Figure 3-1
Flood watches and warnings, along with all available rain and river level / flow data, radar imagery and other related information, are posted to the BoM’s website4.
If the BoM issues the warning outside normal business hours, the VICSES Regional Duty Officer will call appropriate MEROs or Deputy MEROs to alert them to the situation and the warning. While VICSES does not disseminate flood watches or warnings, it may enhance the warning by issuing community safety information and action statements and may refer relevant agencies and organisations to the BoM’s website or to its own website and / or the Flood and Storm Information Line (when activated) for key messages and action statements (VICSES, SOP009). Other stakeholder agencies and organisations, including Councils, are responsible for onward dissemination of the warning details within the local community.
As part of a State-wide emergency services agreement, ABC Radio has entered into a formal agreement with the Victorian Government and the Bureau of Meteorology to broadcast, in full, weather related warnings including those for flood. The agreement provides for the interruption of normal programming at any time to allow the broadcast of warning messages. This agreement will ensure that flood (and other) warnings issued by the BoM are broadcast in their entirety and as soon as possible after they are received in the ABC’s studio.
3.3.2 Flood Watches
Flood watches issued by the BoM provide a ‘heads up’ of likely flooding. They are aimed specifically at raising flood preparedness in the period leading up to a flood event within those areas likely to be affected in order to reduce threat to life and property. Flood watches are based on an assessment of developing weather situations and indicators of current catchment wetness. They provide generalised statements about the developing weather situation including expected forecast rainfall totals, and they also describe the current state (i.e. wetness) of the catchments within the target area and indicate the streams at risk from flooding. Instructions for obtaining rain and stream level observations and access to updated watches and warnings are also included.
Normally, the BoM would issue a flood watch 24 to 36 hours in advance of any likely flooding and issue updates as required. If at any time during this period there was an imminent threat of flooding, the flood watch would be upgraded to a flood warning.
3.3.3 Flood Warnings
Flood warnings include predictions of flooding based on actual and / or predicted rainfall information and recorded river levels and flows.
The BoM determines flood predictions for the Glenelg River at Casterton through application of a peak height correlation between Dergholm and Casterton. While this takes account of the inflows above Dergholm and generally provides around 18 – 36 hours lead time of the likely impact on river
4 For the Glenelg catchment, available rainfall data is updated to the BoM’s website hourly from AWS’ and around 3-hourly from
telemetered ran gauges while river data is updated approximately every 3 hours.

THE EXISTING FLOOD WARNING SYSTEM 3-3
T:\M8575.MAJ.CASTERON_FI\DOCS\R.M8575.001.00.DOCX
levels at Casterton, it cannot account for inflows from the intervening tributaries such as the Wando River (see Figure 1-1). This means that during widespread rain events or following heavy rain over the central part of the catchment, the initial rise at Casterton, in terms of both the time to exceed key levels and peak height, is not able to be forecast.5.
Warnings are categorised as ‘minor’, ‘moderate’ or ‘major’ (see Appendix A for an explanation of these terms and current flood class levels) and indicate the peak height and expected severity of the flood at Casterton. Warnings usually include:
A statement about recorded rainfall and forecast rainfall totals;
The most recent available river heights, time of observations and trends (rising, steady, falling) at Dergholm, Casterton and Wando Vale and, if available, also from Harrow and Sandford;
Outflows from Rocklands Reservoir if it is spilling;
A forecast of the height and likely timing of flood levels at Casterton based on Dergholm levels;
A weather forecast and the likely impact of expected rainfall on flooding;
A warning re-issue date and time;
Contact information; and
VICSES action statements
Note 1: The term “significant rises” may be used in the early stages of an event when it is clear that stream levels will rise but it is too early to say whether they will reach flood level.
Note 2: The term “local flooding” or “flash flooding” may be used for localised flooding resulting from intense rainfall over a small area.
Note 3: The forecast may include additional information on river level behaviour.
Note 4: In the event of a large flood or a flood following a long dry spell, the forecast may include reference to a recent similarly sized event so that recipients can gain a more personal appreciation of flood severity.
Additional information (e.g. weather radar and satellite images, updated rain and river level information, details of current watches and warnings) can be obtained from the BoM’s website (www.bom.gov.au/hydro/flood/vic) or for the cost of a local call on 1300 659 217.
3.3.4 Flash Flooding
Flash flooding6 is often associated with severe thunderstorms or small scale weather systems that are locally intense and slow moving. The BoM can forecast the environment in which these sorts of
5 The BoM also utilise available rainfall from locations within and adjacent to the catchment, satellite and weather radar imagery and
forecast rainfall information to inform the forecast process, whenever possible. The radar of most relevance to the Glenelg River catchment is located at Mt Gambier. Nearby radars may also be of some relevance.
6 The BoM’s policy on the provision of flash flood warning services is enunciated in a document dated May 1996 (Bureau of Meteorology, 1996). Following a definition of flash flooding (“flooding occurring within about 6 hours of rain, usually the result of intense local rain and characterised by rapid rises in water levels”), the document describes the policy framework which underpins the flash flood warning service provided by the BoM. The 1987 working arrangements (Bureau of Meteorology, 1987) also refer to the provision of flash flood warning services and make it clear that the BoM does not have an exclusive role. Comrie (2011)

THE EXISTING FLOOD WARNING SYSTEM 3-4
T:\M8575.MAJ.CASTERON_FI\DOCS\R.M8575.001.00.DOCX
weather events may occur and provides a generalised service to that effect. As it is not yet technically feasible to predict individual flash flooding events except on time scales of tens of minutes at the very best, the BoM does not provide warnings for flash flooding for specific watercourses and locations.
The BoM’s flash flood warning service is made up of four components that depend on the sophistication of available monitoring and forecast capabilities as follows.
Generalised warnings (issued to the general public and VICSES, generally as a regional Severe Weather Warning) associated with the onset of heavy rainfall;
Radar based warnings of rainfall (issued to the media and VICSES as a Severe Thunderstorm Warning) that could lead to flash flooding within specific areas, but only where those areas are covered by suitable weather watch radar and where a threshold intensity, chosen such that its exceedance will produce flash flooding irrespective of existing antecedent catchment conditions, is expected to be equalled or exceeded;
Area specific predictions of rainfall intensities but only in areas covered by suitable weather watch radar (this service is not available for the Glenelg River catchment), and
Support and advice to local authorities regarding the establishment of automated flash flood warning systems (e.g. ALERT systems) and related matters.
The BoM is continuing to invest heavily in new technologies which include state of the art radars and a method of estimating rainfall accumulations using a combination of radar and electronically telemetered rain gauges. It is expected that within time these tools will assist in evaluating the likely onset of a possible flash flood event and should assist in the warning process.
3.3.5 Severe Thunderstorm and Severe Weather Warnings
The BoM issues severe thunderstorm warnings whenever severe thunderstorms are occurring in an area or are expected to develop or move into the area during the ensuing few hours. The warnings describe the area under threat and the particular hazards likely to be associated with the thunderstorms, including flash flooding. These warnings are distributed to the media, VICSES and a few selected local governments7 and are available to the public via the internet and various telephone and fax based services. An image (map) is made available with the text of the warning to show the area at risk.
Severe weather warnings aim to provide advance (up to 24 hours) notice of very heavy rainfall that is considered likely to lead to flash flooding or storm surge. They are issued by the BoM to the media, VICSES a few selected local governments6 when such weather is expected but only when such weather is not the direct result of severe thunderstorms and is not covered by other warnings.
recommended that the state should engage with the BoM to review flash flood warning systems in Victoria and that is should determine which agency is responsible for flash flood warnings. The Victorian Government (2012) has indicated that the BoM supports the review of existing flash flood warning systems, subject to further clarification of roles and responsibilities and a number of other related matters.
7 It is not clear how other local governments receive severe thunderstorm and severe weather warnings and related information other than via the media and through general situational awareness.

THE EXISTING FLOOD WARNING SYSTEM 3-5
T:\M8575.MAJ.CASTERON_FI\DOCS\R.M8575.001.00.DOCX
While VICSES does not disseminate severe thunderstorm or severe weather warnings, it may enhance the warnings by issuing community safety information and action statements and may refer relevant agencies and organisations to the BoM’s website or to its own website and / or the Flood and Storm Information Line (when activated) for key messages and action statements (VICSES, SOP008).
3.4 Data Sharing
The BoM is a signatory to the Surface Water Monitoring Partnership which facilitates formalised cost and data sharing arrangements at water monitoring sites across the State. The role of the Partnership is to provide a coordinated and cost effective approach to water monitoring across the region. Ultimately, all data collected under the Partnership contract is archived to and made available through the Victorian Water Resources Data Warehouse. The additional advantage of the Partnership is the ability to pool resources and share information to maximize benefits to the region.
3.5 Water Act 2007 and Water Regulations 2008
In the Commonwealth Water Act 2007 (Part 7, Division 3 Section 126) it states that a person specified in the regulations, must give to the Bureau of Meteorology a copy of the water information specified in the Water Regulations 2008. While the regulations specify the time at which, the format in which and the type of data (including precipitation, river flow and river level) to be provided, they do not specify the locations8 (in terms of sites except in so far as there is a requirement to provide geo-referencing in metadata) for which data is to be provided.
The Water Regulations 2008 (which came into effect on 30 June 2008) divides providers of water information into categories with Category H referring to providers of information for flood warning and forecasting. The agencies deemed to be providers of information are listed in Schedule 2 Part 8 of the regulation. In relation to the Glenelg catchment, Grampians Wimmera Mallee Water, DSE and the Glenelg Hopkins Catchment Management Authority are listed under the Schedule as providers of water information for flood warning and forecasting. Other agencies with an interest in the catchment are listed under other categories (see http://www.bom.gov.au/water/regulations/search.php?jurisdiction=VIC
Category H providers are required to transfer data to the Bureau of Meteorology within an hour of receiving it into their (office based) data system. However, an organisation does not have to provide data if they reasonably expect that the BoM already has that data. For the purposes of complying with the Water Regulations, the transfer of data via existing telephone telemetry and the availability of quality controlled data through the data warehouse probably meets this requirement.
8 The regulations require that named persons supply the Bureau of Meteorology with all the information that is in their possession,
custody or control.
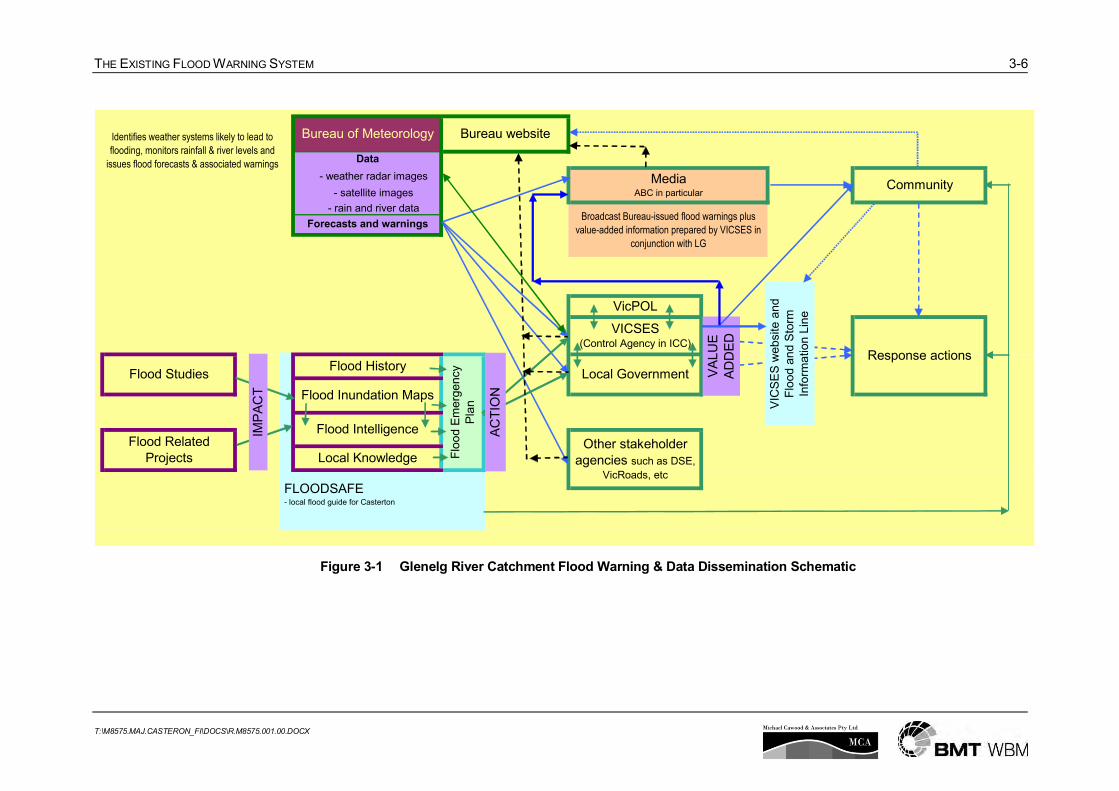
THE EXISTING FLOOD WARNING SYSTEM 3-6
T:\M8575.MAJ.CASTERON_FI\DOCS\R.M8575.001.00.DOCX
Community
Response actions
VICSES(Control Agency in ICC)
Flood Intelligence
Flood Studies Local GovernmentFlood Inundation Maps
MediaABC in particular
Identifies weather systems likely to lead to
flooding, monitors rainfall & river levels and
issues flood forecasts & associated warnings - weather radar images
- satellite images
Data
Bureau of Meteorology Bureau website
Flood Related Projects
Other stakeholder agencies such as DSE,
VicRoads, etc
Broadcast Bureau-issued flood warnings plus
value-added information prepared by VICSES in
conjunction with LG
Floo
d Em
erge
ncy
Plan
Local Knowledge
Flood History
FLOODSAFE- local flood guide for Casterton
Forecasts and warnings
VicPOL
- rain and river data
IMPA
CT
ACTI
ON
VALU
E AD
DED
VIC
SES
web
site
and
Fl
ood
and
Stor
m
Info
rmat
ion
Line
Figure 3-1 Glenelg River Catchment Flood Warning & Data Dissemination Schematic
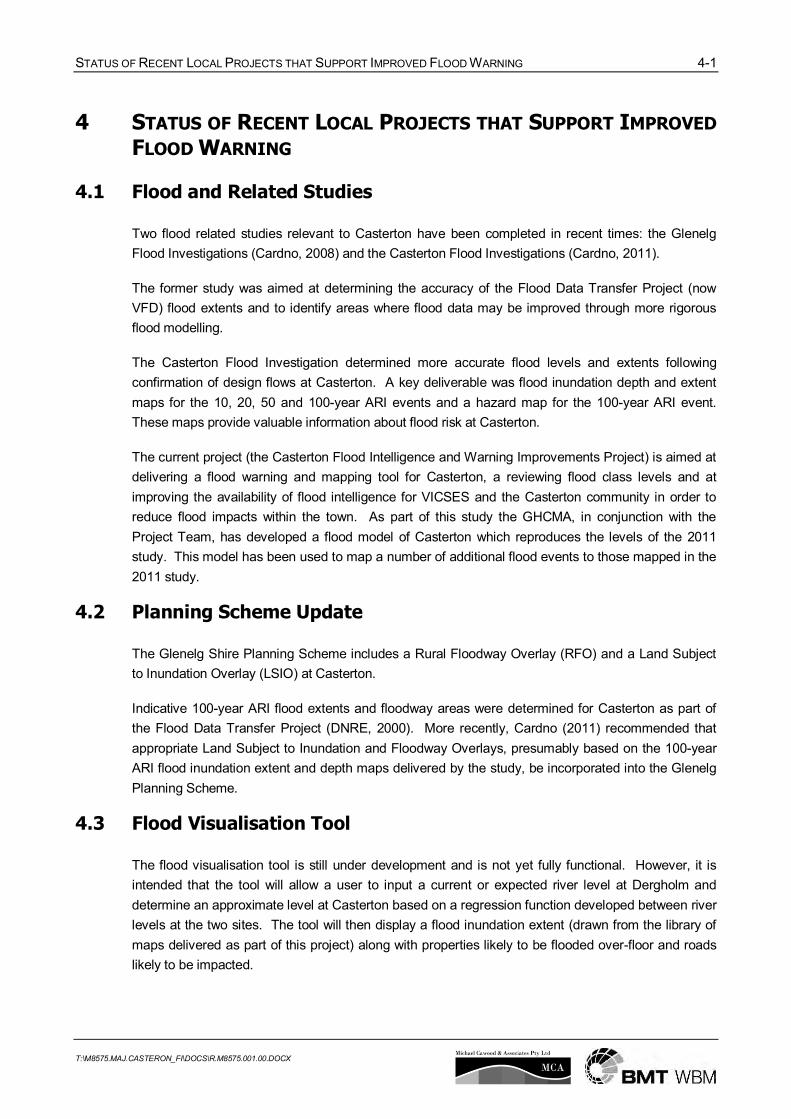
STATUS OF RECENT LOCAL PROJECTS THAT SUPPORT IMPROVED FLOOD WARNING 4-1
T:\M8575.MAJ.CASTERON_FI\DOCS\R.M8575.001.00.DOCX
4 STATUS OF RECENT LOCAL PROJECTS THAT SUPPORT IMPROVED
FLOOD WARNING
4.1 Flood and Related Studies
Two flood related studies relevant to Casterton have been completed in recent times: the Glenelg Flood Investigations (Cardno, 2008) and the Casterton Flood Investigations (Cardno, 2011).
The former study was aimed at determining the accuracy of the Flood Data Transfer Project (now VFD) flood extents and to identify areas where flood data may be improved through more rigorous flood modelling.
The Casterton Flood Investigation determined more accurate flood levels and extents following confirmation of design flows at Casterton. A key deliverable was flood inundation depth and extent maps for the 10, 20, 50 and 100-year ARI events and a hazard map for the 100-year ARI event. These maps provide valuable information about flood risk at Casterton.
The current project (the Casterton Flood Intelligence and Warning Improvements Project) is aimed at delivering a flood warning and mapping tool for Casterton, a reviewing flood class levels and at improving the availability of flood intelligence for VICSES and the Casterton community in order to reduce flood impacts within the town. As part of this study the GHCMA, in conjunction with the Project Team, has developed a flood model of Casterton which reproduces the levels of the 2011 study. This model has been used to map a number of additional flood events to those mapped in the 2011 study.
4.2 Planning Scheme Update
The Glenelg Shire Planning Scheme includes a Rural Floodway Overlay (RFO) and a Land Subject to Inundation Overlay (LSIO) at Casterton.
Indicative 100-year ARI flood extents and floodway areas were determined for Casterton as part of the Flood Data Transfer Project (DNRE, 2000). More recently, Cardno (2011) recommended that appropriate Land Subject to Inundation and Floodway Overlays, presumably based on the 100-year ARI flood inundation extent and depth maps delivered by the study, be incorporated into the Glenelg Planning Scheme.
4.3 Flood Visualisation Tool
The flood visualisation tool is still under development and is not yet fully functional. However, it is intended that the tool will allow a user to input a current or expected river level at Dergholm and determine an approximate level at Casterton based on a regression function developed between river levels at the two sites. The tool will then display a flood inundation extent (drawn from the library of maps delivered as part of this project) along with properties likely to be flooded over-floor and roads likely to be impacted.

STATUS OF RECENT LOCAL PROJECTS THAT SUPPORT IMPROVED FLOOD WARNING 4-2
T:\M8575.MAJ.CASTERON_FI\DOCS\R.M8575.001.00.DOCX
4.4 Flood Emergency Plan
Appendices for inclusion in the Glenelg flood emergency plan (MFEP) are being drafted for Casterton. They will include available intelligence derived from an interpretation of outputs from the flood studies mentioned and other sources. Inundation maps delivered by the flood studies are also referred to and included within the Appendices.
4.5 GIS Resident Flood Datasets
The Victorian Flood Database [VFD]9 datasets provide an additional source of flood information including areas likely to be inundated by 1% AEP flood flows as well as the depth and extent of a number of previous flood events. Results from flood studies are routinely loaded to the VFD datasets which include extents and depth data for rural areas and locations not covered by flood studies. The datasets offer a further source of flood intelligence for emergency managers in times of flood and could be used to assist local response planning and activities. They also provide an indication of where hitherto unrecognised flooding problems / risks exist and where perhaps additional attention to service requirements and standards is warranted.
4.6 Flood Information Brochure
A Local Flood Guide (FloodSafe information brochure) will be developed for Casterton by VICSES in the near future as part of a State-wide initiative. The brochure will be distributed to local residents and be available from both Glenelg Shire and VICSES. The brochure will:
Contain information from the recent flood study reports;
Provide general details about the stream gauges used to provide local flood information;
List historic flood heights and dates;
Give an overview of likely flood behaviour for the 10, 20, 50 and 100-year ARI flood events;
List emergency contact details along with an outline of the help available from these agencies; and
Outline what to do before and during a flood event.
4.7 Data Collection Network Upgrade
There are no firm plans in place to upgrade the network of rain and river stations within the Glenelg River catchment that support flood forecast and warning activities for Casterton. The GHCMA did, however, prepare a submission for an upgraded data collection network following the 2010-11 floods.
DSE have 20 x PALS units that can be deployed at short notice and that will provide river level data in real-time to either a local datum or to AHD. Given the lead time at Casterton, it would appear to be
9 The DNRE Flood Data Transfer Project was completed during 2001 (Gauntlett and Cawood, 2000). In addition to the collection,
collation and upload to GIS of a range of flood related information, the project delivered a series of datasets and maps showing areas likely to be inundated by 1% AEP flood flows as well as by historic floods. These are supported by a suite of reports that outline data availability and describe the underlying analyses and rationales. FDTP outputs (now known as the Victorian Flood Database [VFD] datasets) are routinely updated with the results of subsequent flood studies and provide a consolidated source of flood related information.

STATUS OF RECENT LOCAL PROJECTS THAT SUPPORT IMPROVED FLOOD WARNING 4-3
T:\M8575.MAJ.CASTERON_FI\DOCS\R.M8575.001.00.DOCX
an ideal candidate for a unit as it could be installed ahead of rising water and alleviate the need for manual readings from the staff gauge.
Existing streamflow monitoring sites, shown in Figure 1-1, include:
Glenelg River d/s Rocklands Reservoir (238205) – telemetered but not available from BoM website
Glenelg River at Fulham Bridge (238224) – telemetered and available from BoM website
Glenelg River at Dergholm (238821B) – telemetered and available from BoM website
Wando River at Wando Vale (238223) – telemetered and available from BoM website
Glenelg River at Casterton (238212) – staff gauges only – no arrangements in place for reading gauges
Glenelg River at Sandford (238202) – telemetered but only available from the Enviro Flows website.
4.8 Flood Forecast Model
An updated regression function has between river levels at the new Dergholm site and Casterton as part of this project and has been included in the Flood Visualisation Tool for Casterton. While an additional regression function has been develop that incorporates data from the Wando Vale site, it has not as yet been operationalised.

MATTERS FOR CONSIDERATION 5-1
T:\M8575.MAJ.CASTERON_FI\DOCS\R.M8575.001.00.DOCX
5 MATTERS FOR CONSIDERATION
5.1 Introduction
The purpose of the following paragraphs is to stimulate some consideration of the matters that perhaps need to be discussed at the SLA Workshop as well as to the extent of those discussions. They have been grouped consistent with components of the TFWS (see Section 2.3) in order to assist consideration of the core topic and related issues. Inter-relationships and dependencies have not been documented although it will be apparent that there are many. For example, community ability to interpret a river height forecast into areas and assets at risk from flooding will depend on a combination of available flood intelligence (including flood inundation maps or similar intelligence) and sufficient lead time to do the interpretation and communicate it to those who need to respond. Similarly, the issue of who will do what and when, while outlined in Table 2-1, does need to be discussed and agreed between the stakeholder entities.
5.2 Flood Risk at Casterton
Is the capability of the existing flood warning system for Casterton commensurate with the flood risk or does it need to be upgraded?
Which elements of the TFWS require upgrade?
Is enough known about the flood risk to enable an SLA to be established?
5.3 Awareness
Do the at-risk communities understand the information that is provided in a flood warning?
How do communities know what x metres at the gauge really means for them in terms of flood impacts?
Are property-specific flood charts or meter box labels required for properties likely to experience flooding?
Is there a clear mechanism or chain of responsibility for transferring, maintaining or updating flood knowledge to the community
The MFEP Appendices contain considerable flood intelligence. Who should this be distributed to? How can this intelligence be transferred to the community?
Who is responsible for raising community awareness of flood risk?
5.4 Response / Mitigation
Do we know what happens at critical heights on the reference gauge in those areas subject to flooding?
Is there a clear linkage between flood impact / effect and the necessary response actions and timings?
How much time is required to do what needs to be done to avoid / reduce flood damage?

MATTERS FOR CONSIDERATION 5-2
T:\M8575.MAJ.CASTERON_FI\DOCS\R.M8575.001.00.DOCX
Do there need to be improvements in how information on flood risk and flood behaviour is used to drive community and agency response to a flood situation? If so, how might this be done?
Are the flood class levels for the old staff gauge site at Dergholm applicable to the new site?
Are the Casterton flood class levels about right?
5.5 Message Construction and Dissemination (alerting and notification)
Does current formatting and terminology meet needs?
How are the at-risk communities alerted to a developing flood and how do they obtain relevant information?
How do they receive flood information and how is it disseminated?
How long does it take to disseminate information on likely flood levels and impacts?
Do there need to be changes?
5.6 Interpretation
How do communities know what x metres at the gauge really means for them in terms of flood impacts?
Who interprets flood forecasts? Who identifies areas at risk from flood (ie. the interpretation of forecasts of flood height in terms of lateral extent and areas / assets at risk) as part of the emergency planning process and during an event?
Is there sufficient information about likely flood impacts to enable adequate interpretation of forecasts?
5.7 Flood Detection and Prediction
Is peak height correlation sufficient or do we need a rainfall based prediction model?
What are the forecast requirements10:
o Location
o Issue (and reissue) times and frequency, time of issue
o Lead times (i.e. the time required between forecast issue and flooding or exceedance of critical levels)
o Critical (and flood class) levels (perhaps level at which 1st floor or x number of floors become inundated)
o Content - what is required (e.g. full hydrograph, exceedance of particular levels or peak only)
o Expectations regarding accuracy (level and timing) – does this change with flood severity11
10 These requirements should be driven by the nature of flooding experienced, flood response actions as per flood emergency plans,
available flood intelligence and available rain and river data.

MATTERS FOR CONSIDERATION 5-3
T:\M8575.MAJ.CASTERON_FI\DOCS\R.M8575.001.00.DOCX
o Need for forecasts as the flood recedes
o To whom should forecast be disseminated
o Do any of the above change for flood severity, etc?
5.8 Data Collection and Collation
There are no telemetered rain gauges in the vicinity of the Glenelg catchment. Are telemetered rain gauges required? Where and why?
Does the river gauge at Casterton need to be upgraded to telemetry?
If so, who would pay capital and who would pay on-going costs?
Are additional river gauges required? Where and why? Who pays for what?
Is access to data through the BoM’s website sufficient for stakeholders and the local community?
Are existing data sharing arrangements sufficient?
Post-event data collection and collation – rapid assessment by VICSES, role of GHCMA, role of Glenelg Shire, merge into GHCMA’s GIS and the VFD and into Glenelg Shire Council’s flood emergency plan.
5.9 Review
Should the flood warning dissemination facilities and processes be tested? To what extent and how often?
What about other TFWS component checks?
5.10 Flood Warning Service Level Agreement
SLA update process and triggers and timing – after an event, following completion of a flood or related study and after implementation of any structural flood mitigation works?
Who will drive the review / update process?
5.11 Consequential Adjustments
Regional Surface Water Monitoring Partnership.
11 Cyclone warning related research in Australia has indicated that it is more important for warnings to be issued on time and well
ahead of impact rather than for them to be highly accurate.

REFERENCES 6-1
T:\M8575.MAJ.CASTERON_FI\DOCS\R.M8575.001.00.DOCX
6 REFERENCES
Agricultural and Resource Management Council of Australia and New Zealand (ARMCANZ) (2000), Standing Committee on Agriculture and Resource Management (SCARM) Report No 73: Floodplain Management in Australia, Best Practice Principles and Guidelines.
Association of State Floodplain Managers, Inc. (ASFPM) (2006): ASFMP Publications List at http://www.floods.org/PDF/PUBSLIST.pdf
Australian Emergency Management Institute (AEMI) (1995): Flood Warning: An Australian Guide.
Bureau of Meteorology (1987): Flood Warning Arrangements - Papers prepared for discussions with Victorian Agencies, December 1987.
Bureau of Meteorology (1996): Bureau of Meteorology Policy on the Provision of the Flash Flood Warning Service. May 1996.
Bureau of Transport and Regional Economics (BTRE) (2002): Benefits of Flood Mitigation in Australia: BTRE Report No 106. Canberra, May 2002.
Cardno (2008): Glenelg Flood Investigations.
Cardno (2011): Casterton Flood Investigations: Floodplain Management Report.
Comrie, N. (2011): Review of the 2010-11 Flood Warnings and Response: Final Report. 1 December 2011.
Department of Infrastructure (DoI) (2000a): Victoria Planning Provisions (VPPs).
Department of Infrastructure (DoI) (2000b): Victoria Planning Provisions Practice Notes: Applying the Flood Provisions in a Planning Scheme, A Guide for Councils.
Department of Infrastructure (DoI) (2000c): Victoria Planning Provisions Practice Notes: Applying for a Planning Permit under the Flood Provision, A Guide for Councils, Referral Authorities and Applicants.
Department of Infrastructure, Planning and Natural Resources (DIPNR) (2005): Floodplain Development Manual: the management of flood liable land. New South Wales Government, April 2005.
Department of Natural Resources and Environment (DNRE) (1998): Victoria Flood Management Strategy.
Department of Natural Resources and Environment (DNRE) (2000): Flood Data Transfer Project – Flood Data and Flood Planning Maps as well as Flood Mapping and River Basin Reports.

REFERENCES 6-2
T:\M8575.MAJ.CASTERON_FI\DOCS\R.M8575.001.00.DOCX
Department of Transport and Regional Services (DoTARS) on behalf of the Council of Australian Governments (COAG) (2002): Natural Disasters in Australia. Reforming Mitigation, Relief and Recovery Arrangements: A report to the Council of Australian Governments by a high level officials’ group. August 2002 published 2004.
Emergency Management Australia (EMA) (1999): Managing the Floodplain. Manual 19 of the Australian Emergency Manual Series.
Emergency Management Australia (EMA) (2009a): Flood Preparedness. Manual 20 of the Australian Emergency Manual Series.
Emergency Management Australia (EMA) (2009b): Flood Warning. Manual 21 of the Australian Emergency Manual Series.
Emergency Management Australia (EMA) (2009c): Flood Response. Manual 22 of the Australian Emergency Manual Series.
Emergency Management Manual Victoria.
Federal Interagency Floodplain Management Task Force (FIFMTF) (1992): Floodplain Management in the United States: An Assessment Report, Volume 1, Summary Report. Washington, DC: Federal Emergency Management Agency.
Gauntlett, I. and Cawood, M.W. (2000): The Victorian Flood Data Transfer Project. 40th Annual Conference, NSW Floodplain Management Authorities, Parramatta, May 10 - 12 2000.
Handmer, J.W. (1997): Flood Warnings: Issues and Practices in Total System Design. Flood Hazard Research Centre, Middlesex University.
Handmer, J.W. (2000): Are Flood Warnings Futile? Risk Communication in Emergencies. The Australasian Journal of Disaster and Trauma Studies. Volume: 2000-2.
Handmer, J.W. (2001): Improving Flood Warnings in Europe: A Research and Policy Agenda. Environmental Hazards. Volume 3:2001.
Handmer, J.W. (2002): Flood Warning Reviews in North America and Europe: Statements and Silence. The Australian Journal of Emergency Management, Volume 17, No 3, November 2002.
International Decade for Natural Disaster Reduction (IDNDR) (1997): Guiding Principles for Effective Early Warning: The Convenors of the International Experts Groups on Early Warning of the Secretariat of the International Decade for Natural Disaster Reduction, IDNDR Secretariat, Geneva, October 1997.
Mileti, D.S. and Sorensen, J.H. (1990): Communication of Emergency Public Warnings: A Social Science Perspective and State-of-the-Art Assessment. Oak Ridge National Laboratory, Oak Ridge, Tennessee.

REFERENCES 6-3
T:\M8575.MAJ.CASTERON_FI\DOCS\R.M8575.001.00.DOCX
Munroe, C. (2011): Review of the Bureau of Meteorology’s capacity to respond to future extreme weather and natural disaster events and to provide seasonal forecasting services. December 2011.
Phillips, T.P. (1998): Review of Easter Floods 1998: Final Report of the Independent Review Team to the Board of the Environment Agency: Volume 1.
Smith, D.I. and Handmer, J.W. (eds) (1986): Flood Warning in Australia: Policies, Institutions and Technology. Centre for Resources and Environmental Studies, Australian National University, Canberra.
State of Victoria – Office of the Emergency Services Commissioner (OESC): The Emergency Management Manual Victoria. 2008.
Victorian Flood Warning Consultative Committee (VFWCC) (2001): Arrangements for Flood Warning Services in Victoria. February 2001.
Victorian Government (2012): Victorian Government’s Response to The Victorian Floods Review. Improving Flood Warning Systems: Implementation Plan. November 2012.
Victoria State Emergency Service (VICSES): Standard Operating Procedure: Notification Process for Flood Warnings SOP009, Version 1.8.
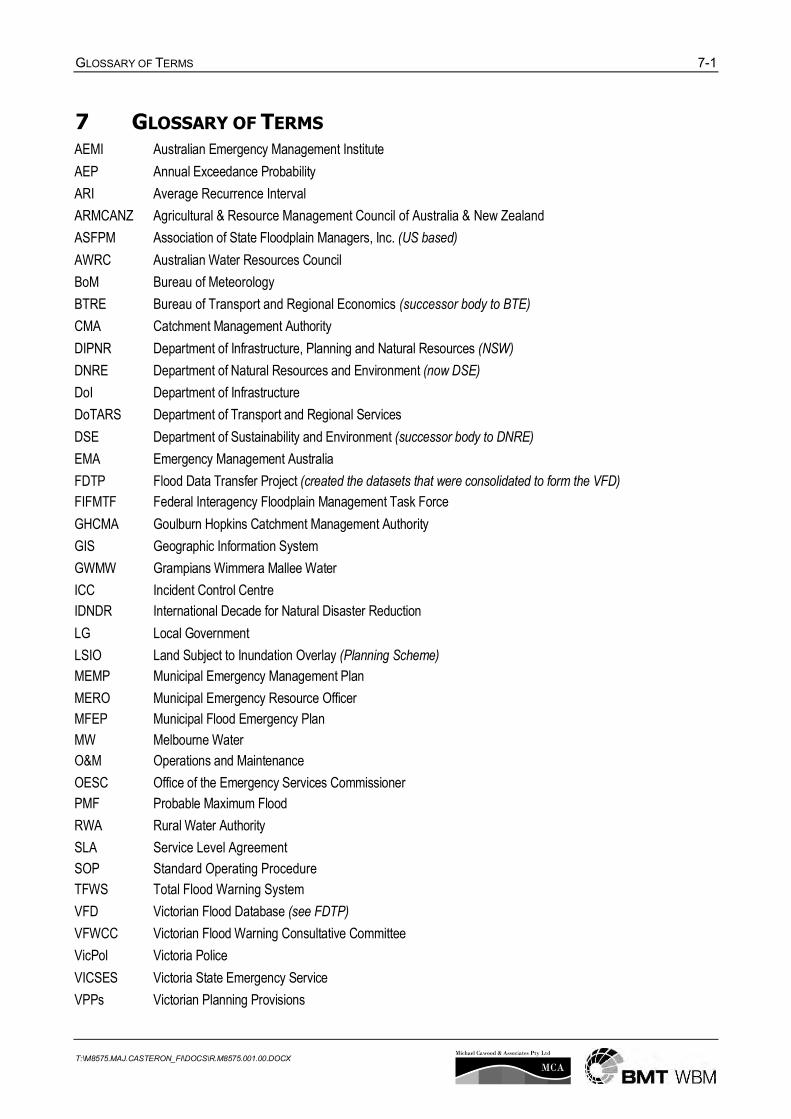
GLOSSARY OF TERMS 7-1
T:\M8575.MAJ.CASTERON_FI\DOCS\R.M8575.001.00.DOCX
7 GLOSSARY OF TERMS AEMI Australian Emergency Management Institute
AEP Annual Exceedance Probability
ARI Average Recurrence Interval
ARMCANZ Agricultural & Resource Management Council of Australia & New Zealand
ASFPM Association of State Floodplain Managers, Inc. (US based)
AWRC Australian Water Resources Council
BoM Bureau of Meteorology
BTRE Bureau of Transport and Regional Economics (successor body to BTE)
CMA Catchment Management Authority
DIPNR Department of Infrastructure, Planning and Natural Resources (NSW)
DNRE Department of Natural Resources and Environment (now DSE)
DoI Department of Infrastructure
DoTARS Department of Transport and Regional Services
DSE Department of Sustainability and Environment (successor body to DNRE)
EMA Emergency Management Australia
FDTP Flood Data Transfer Project (created the datasets that were consolidated to form the VFD)
FIFMTF Federal Interagency Floodplain Management Task Force
GHCMA Goulburn Hopkins Catchment Management Authority
GIS Geographic Information System
GWMW Grampians Wimmera Mallee Water
ICC Incident Control Centre
IDNDR International Decade for Natural Disaster Reduction
LG Local Government
LSIO Land Subject to Inundation Overlay (Planning Scheme)
MEMP Municipal Emergency Management Plan
MERO Municipal Emergency Resource Officer
MFEP Municipal Flood Emergency Plan
MW Melbourne Water
O&M Operations and Maintenance
OESC Office of the Emergency Services Commissioner
PMF Probable Maximum Flood
RWA Rural Water Authority
SLA Service Level Agreement
SOP Standard Operating Procedure
TFWS Total Flood Warning System
VFD Victorian Flood Database (see FDTP)
VFWCC Victorian Flood Warning Consultative Committee
VicPol Victoria Police
VICSES Victoria State Emergency Service
VPPs Victorian Planning Provisions

FLOOD CLASS LEVELS A-1
T:\M8575.MAJ.CASTERON_FI\DOCS\R.M8575.001.00.DOCX
APPENDIX A: FLOOD CLASS LEVELS
Causes inconvenience: Low lying areas next to watercourses are inundated which may require the removal of stock and equipment. Minor roads may be closed and low-level bridges submerged.
Moderate Flooding: In addition to the above, the evacuation of some houses may be required. Main traffic routes may be covered. The area of inundation is substantial in rural areas requiring the removal of stock.
Major Flooding: In addition to the above, extensive rural areas and / or urban areas are inundated. Properties and towns are likely to be isolated and major traffic routes likely to be closed. Evacuation of people from flood affected areas may be required.
FLOOD CLASS LEVELS for river gauges relevant to the Glenelg River catchment
River Station Minor Moderate Major Gauge Zero
Glenelg River d/s Rocklands Reservoir
Glenelg River at Fulham Bridge NA
Glenelg River at Dergholm 4.0 4.8 5.1 NA
Wando River at Wando Vale NA
Glenelg River at Casterton 3.8 5.2 6.0 38.453m AHD
Glenelg River at Sandford NA
??? others ???
It is emphasised that the flood levels quoted in the table above refer to that part of the river where the flood effects can be related to the gauge reading.
The occurrence of a certain class of flooding at one point in a catchment will not necessarily lead to the same class of flooding at other points. This is because the floodplain physiography and use (and thus flood impact) varies along the river and also because antecedent conditions combined with where and how rainfall occurs (both in time and space) will drive how a flood develops and progresses within and along the river system. For example, major flooding in the upper parts of the river system will not always lead to major flooding at Casterton.
It is important to remember that flood impact is dependent on more than the peak height or flow. The rate of rise, duration, extent and season of flooding are also important. For this reason, flood class levels can only be considered as a guide to flood severity.

FLOOD CLASS LEVELS A-2
T:\M8575.MAJ.CASTERON_FI\DOCS\R.M8575.001.00.DOCX
Flood class levels are revised from time to time as experience accumulates and conditions change in affected areas. It is up to Municipalities to drive this process and to ensure that flood class levels reflect community needs. Flood class levels are a key input to the flood warning SLA.
BMT WBM Brisbane Level 8, 200 Creek Street Brisbane 4000
PO Box 203 Spring Hill QLD 4004 Tel +61 7 3831 6744 Fax +61 7 3832 3627 Email [email protected] Web www.bmtwbm.com.au
BMT WBM Denver 8200 S. Akron Street, Unit 120 Centennial Denver Colorado 80112 USA Tel +1 303 792 9814 Fax +1 303 792 9742 Email [email protected] Web www.bmtwbm.com.au
BMT WBM Mackay Suite 1, 138 Wood Street Mackay 4740 PO Box 4447 Mackay QLD 4740 Tel +61 7 4953 5144 Fax +61 7 4953 5132 Email [email protected] Web www.bmtwbm.com.au
BMT WBM Melbourne Level 5, 99 King Street Melbourne 3000 PO Box 604 Collins Street West VIC 8007 Tel +61 3 8620 6100 Fax +61 3 8620 6105 Email [email protected] Web www.bmtwbm.com.au
BMT WBM Newcastle 126 Belford Street Broadmeadow 2292 PO Box 266 Broadmeadow NSW 2292 Tel +61 2 4940 8882 Fax +61 2 4940 8887 Email [email protected] Web www.bmtwbm.com.au
BMT WBM Perth Suite 6, 29 Hood Street Subiaco 6008 Tel +61 8 9328 2029 Fax +61 8 9484 7588 Email [email protected] Web www.bmtwbm.com.au
BMT WBM Sydney Level 1, 256-258 Norton Street Leichhardt 2040 PO Box 194 Leichhardt NSW 2040 Tel +61 2 9713 4836 Fax +61 2 9713 4890 Email [email protected] Web www.bmtwbm.com.au
BMT WBM Vancouver 401 611 Alexander Street Vancouver British Columbia V6A 1E1 Canada Tel +1 604 683 5777 Fax +1 604 608 3232 Email [email protected] Web www.bmtwbm.com.au

Casterton Flood Intelligence & Warning Improvements C-1 Flood Forecast and Warning Service Level Agreement for the Glenelg River at Casterton
T:\M8575.MAJ.Casteron_FI\docs\R.M8575.003.01.Final.docx
Appendix C Flood Forecast and Warning Service Level Agreement for the Glenelg River at Casterton

Flood Forecast and Warning Service Level Agreement for the Glenelg River at Casterton
DRAFT V1.0
June 2013 Page 1 of 8
FLOOD FORECAST AND WARNING SERVICE LEVEL AGREEMENT
Overview of SLA
This Service Level Agreement (SLA) outlines the roles and responsibilities of entities involved in the (total) flood warning system (TFWS) for the Glenelg River to Casterton along with draft delivery and performance criteria. In effect it is a statement of requirements for the delivery of flood forecast and warning services to at-risk communities at Casterton.
This SLA is a “live” document and will be incorporated into the Glenelg Shire Municipal Flood Emergency Plan (MFEP) under the custody of the Glenelg Shire Council. The SLA will be subject to the same review regime as the MFEP1.
It is possible that the SLA will provide the basis for post-event evaluations of TFWS performance.
How this SLA will be incorporated into or recognised by Service Level Specification (SLS) currently being prepared by the Bureau of Meteorology (BoM) is not yet clear.
This SLA was developed through a consultative process involving key stakeholder entities and informed by a Discussion Paper considering all aspects of the TFWS. It has been endorsed by those entities and shall become effective on the last date shown below:
1. Signed for and on behalf of Glenelg Shire Council
…………………………….... CHIEF EXECUTIVE OFFICER
On this day …………………
……………………………… MEMO
On this day …………………
……………………………… MAYOR
On this day …………………
2. Signed for and on behalf of Bureau of Meteorology
……………………………………………… REGIONAL DIRECTOR, VICTORIA
On this day …………………………………
3. Signed for and on behalf of Victoria State Emergency Service
……………………………………………… DIRECTOR OPERATIONS
On this day …………………………………
5. Signed for and on behalf of Glenelg Hopkins Catchment Management Authority
……………………………………………… CHIEF EXECUTIVE OFFICER
On this day …………………………………
1 As per Section 1.5, the MFEP is to be reviewed following any new flood or stormwater drainage study, a change in non-
structural and / or structural flood mitigation measures and / or after a significant flood event within the Municipality.

Flood Forecast and Warning Service Level Agreement for the Glenelg River at Casterton - DRAFT V1.0
July 2013 Page 2 of 8
Need - why a functional TFWS is required for Casterton
Moderate flood risk but ability of community to recover is low.
First over-floor flooding of houses occurs at around the 5-year ARI level. Around 50% of houses are weatherboard and cannot therefore be sandbagged.
The Glenelg Highway is cut near the bridge between 10-year and 20-year level which prevents access into town from the east. If not a large scale regional rain event, access is possible from Dartmoor / Mt Gambier.
CBD is flooded from near the 20-year ARI level. Limited options for mitigation as the rear of CBD properties drop quickly to the river. Sandbagging is also not an option as the drop from rear of properties to ground level is more than 1m.
In a 100-year ARI event, water is up to 1m deep in the main street.
While household goods and stock can be moved, lead time is required to enable this to be done.
Impacts: Town is cut in half Access to hospital is compromised Schools and family services hub (including primary school in McPherson Street) Senior Citizens Centre Henty Street – play group Supermarket Pump stations in Racecourse Road and Andersons Road Police station
There is need for a functional but not ‘gold plated’ TFWS for Casterton
Critical levels
10-year ARI, 20-year ARI and 50-year ARI flood levels
1% and PMF extents are similar – difference is in depths

Flood Forecast and Warning Service Level Agreement for the Glenelg River at Casterton - DRAFT V1.0
July 2013 Page 3 of 8
Flood Warning System Building Blocks
Context Requirement and Responsible Entity
AWARENESS
Community understand the flood risk in context of experience (ie. 1946, 1983) but have a 100-year mindset (ie. 1946 will not happen again for 100 years).
1946 was not a big event at Casterton and a lot has changed since.
Community think VICSES gets flood information wrong and do not see the changes that have and are continuing to occur. Need to personalise letters / correspondence to residents and businesses with addressee’s name.
11% of Casterton population in a flood risk area recognise that they have a flood risk.
Some discussion of a totem pole for Casterton showing critical levels as well as dates and levels of historic floods.
Local Flood Guide / FloodSafe brochure for Casterton. Being produced by VICSES. Distribution later in 2013 will be managed by VICSES. Will be maintained by VICSES.
Meter box stickers with floor and flood levels for individual properties. Going to be produced and distributed later in 2013 by VICSES.
Calendar produced by VICSES with key flood messages available later in 2013 – 2 year pilot project.
Engagement with the community. VICSES, supported by GSC and GHCMA. Need to do it differently in order to build local credibility.
- use Horsham 2011 example. - align with and include local identities. - present at meetings hosted by service groups (eg. Lions Club). - focus on Traders Assoc / Chamber of Commerce. - demonstrate that consequences / impacts can be determined for forecast levels. - demonstrate that mapping is linked to levels at the gauge.
RESPONSE
There is no VICSES presence in Casterton but CFA are strong and active. VICSES will engage with CFA so that CFA spearhead response => multi-agency approach.
VICSES can be on-site ~2 hours after initial alert received.
If Glenelg Highway is cut, can bring in other SES personnel from the west / Mt Gambier.
What can local CFA unit do?
VICSES can bring in specialists if needed.
Critical levels for Casterton are the minor, moderate and major flood class levels as well as the 10-year ARI (several houses flooded over-floor) and 20-year ARI (CBD flooded) levels.
MFEP for Glenelg Shire. GSC MEMPC to establish MFPC (to include CFA and VICPOL). MFEP Appendices to be populated including flood intelligence card. Actions must have regard for timing,
exceedance of critical levels and likely peak. Input from VICSES, GSC, GHCMA, MFPC, local community. Scheduled for build during 2013/14. Lead is VICSES with GSC and MFPC support.
Lead time required to enable items / stock to be moved. Determine lead time required. Indications are that need 8 – 10 hours for 10-year event and 12 – 18 hours
for 50-year event to enable items / stock to be moved Work with locals on what has happened previously.
Critical levels for Casterton. GHCMA to use the Flood Visualisation Tool to confirm 10-year and 50-year ARI levels. GHCMA to use the Flood Visualisation Tool to determine initial trigger levels at Wando Vale (ie. levels at

Flood Forecast and Warning Service Level Agreement for the Glenelg River at Casterton - DRAFT V1.0
July 2013 Page 4 of 8
Flood Warning System Building Blocks
Context Requirement and Responsible Entity
Wando Vale corresponding to critical levels at Casterton). GHCMA to review trigger levels as required and advise VICSES. VICSES to formally confirm critical levels at Casterton and the initial trigger levels at Wando Vale to BoM,
VFWCC and DEPI. Letter to be co-signed by GSC and VICSES-RHQ.
Evacuation plan (MFEP Appendix D). VICPOL to lead build with input from VICSES and GSC.
INTERPRETATION (i.e. converting the predicted flood height into areas and assets likely to be impacted so that the question “what does this mean for me – will I be flooded and to what depth” can be answered.)
Community are happy and familiar with flood class levels.
Does latest mapping and intelligence match flood class level definitions?
The Flood Visualisation Tool shows roads impassable - need criteria used (eg. depth, depth x velocity, etc).
Flood Visualisation Tool has been corrected for the new gauge at Dergholm.
Flood class levels. Using latest mapping and intel, check that levels are consistent with definitions as part of the Casterton
Flood Intelligence & Warning Improvements. Provide evidence (eg. MFEP flood intelligence card). VICSES to formally confirm flood class levels to BoM, VFWCC and DEPI. Letter to be co-signed by GSC
and VICSES-RHQ. Attach letter to this SLA.
GSC to share flood intelligence card from Glenelg Shire MFEP with community. Aimed at building community capacity.
Implement Flood Visualisation Tool GHCMA is custodian and will maintain the tool. GHCMA to provide training to VICSES and GSC. GHCMA will provide a copy of the tool to VICSES and GSC for use during flood operations. Tool provides guidance on likely consequences via maps based on river levels upstream and at Casterton.
Use in conjunction with MFEP. Tool to be available to the EMT for use during flood operations.
- no reliance on internet connection. - must stand alone.
Determine consequences of expected flooding. ICC Intel Cell role (eg. GHCMA and / or consultants contracted to VICSES). Use available tools (eg. MFEP, Flood Visualisation Tool, maps, etc) Move to use of FloodZoom when available. DEPI to provide training.

Flood Forecast and Warning Service Level Agreement for the Glenelg River at Casterton - DRAFT V1.0
July 2013 Page 5 of 8
MESSAGE CONSTRUCTION
BoM prepares messages for weather conditions likely to lead to riverine flooding.
VICSES issues flood bulletins locally, via website, OSOM – value adds to flood warning messages through inclusion of local impacts and related information (determined from expertise in ICC, intelligence contained in MFEP, use of Flood Visualisation Tool, local inputs).
MESSAGE DISSEMINATION (i.e. flood alerting and notification: communicating the warning message and information)
Standard arrangements work OK for Casterton. No obvious need for more sophisticated or time critical methods.
Flood watches and forecasts to be provided by BoM. By email and fax to VICSES, VICPOL, GHCMA, DEPI, VicRoads, media. VICSES alerts GSC when BoM issues flood watches and / or warnings.
- within 2 hours for watches - within 1 hour for warnings
VICSES to enhance warnings and distribute further (as flood bulletins) as per MFEP. All community information and media releases will be authorised by the IC during a flood event.
Community obtain forecasts from web, TV, radio. Forecasts, warnings, data and images available from BoM website (as available).
VICSES to conduct public meetings, distribute community bulletins and issue media releases ahead of and during flooding where possible in order to deliver information and facilitate community response.
Community meetings and door knocking to be used if appropriate / time available. VICSES to lead with support from GSC.
VICSES to initiate use of the Emergency Alert if and as required dependent on severity of flooding / consequences and consistent with guidelines.
Flood warnings and key messages available from VICSES website and VICSES Flood and Storm Information Line (when activated during incidents – 1300 842 737).
ABC radio (774AM) promoted to the community as a reliable source of flood information.
Details of major road closures and re-openings known to VicRoads available from VicRoad’s website.
BoM to propose and formalise process for routine review / update of flood warning addressees and contacts.
Individual entities responsible for ensuring that current details are provided to BoM so that warnings can be delivered.

Flood Forecast and Warning Service Level Agreement for the Glenelg River at Casterton - DRAFT V1.0
July 2013 Page 6 of 8
DETECTION & PREDICTION (i.e. forecasting)
GHCMA to share Casterton Flood Intelligence & Warning Improvements data and outputs with BoM.
BoM need to be advised of: 10-year and 50-year ARI levels at Casterton. Trigger levels at Wando Vale (ie. levels at Wando Vale
corresponding to critical levels at Casterton).
Readings for Casterton gauge not currently available to BoM. Ideally, the gauge should be telemetered.
BoM would like to see a rain gauge in the Wando River catchment to assist appreciation of likely response at the Wando Vale gauge and thus of likely levels at Casterton.
Typically, initial catchment response time is 5 to 10 hours (ie. beginning of first rise at Casterton).
The inclusion of Casterton in the scenario sheet BoM produce for VICSES ahead of significant rain events has not been discussed to date.
Forecast issue times and frequency have not been discussed but are assumed to be as for the current service (ie. at least once per day and more frequently under rapidly changing conditions).
Wannon River does not affect flooding at Casterton.
Location classifications. Casterton - forecast location (ie. quantitative forecast, data, class levels) Dergholm - information location only (ie. now casting, data, may have flood class levels) Wando Vale – data location with trigger levels for likely flooding at Casterton (ie. data only) Above to feed into BoM SLS.
Current flood forecast service from BoM. Levels at Dergholm and forecast for Casterton based on levels at Dergholm. Based on peak height correlation. Above is part of BoM SLS.
Flood forecast service from BoM within 3 months of receipt of trigger information from VICSES. Levels at Dergholm and Wando Vale and forecast for Casterton based on these levels. Based on peak height correlations. Above is additional to current BoM SLS.
All forecasts available on BoM website.
First forecast to be issued by BoM before Casterton reaches minor flood level
Forecast provided by BoM to include: Time to exceed minor, moderate, major, 10-year and 50-year flood levels. Expected peak level at Casterton. Time to peak. Comparison against recent known events.
DATA COLLECTION & COLLATION (and sharing)
Readings for Casterton gauge not currently available to BoM. Ideally, the gauge should be telemetered.
BoM would like to see a rain gauge in the Wando River catchment to assist appreciation of likely response at the Wando Vale gauge and thus of likely levels at Casterton.
A rain gauge is not currently installed at the Wando Vale stream gauge site.
Policy re new or upgrade of gauges is essentially beneficiary pays. Thus any new instrumentation would need to be funded locally. Opportunities exist to secure funding to assist with capital costs but not on-going costs.
Data availability. BoM requires data for Casterton in order to provide a flood forecast for the town.
- Gauge should be telemetered. With high flow rating as needed. All data available on BoM website through routinely updated web-based river height and rainfall bulletins
(unless no data reported). Casterton not available at present GSC to consider whether on-going costs can be met for a simplified telemetered stream gauge at
Casterton and a rain gauge at Wando Vale.
Data sharing agreement Being developed by BoM.

Flood Forecast and Warning Service Level Agreement for the Glenelg River at Casterton - DRAFT V1.0
July 2013 Page 7 of 8
Flood Warning System Building Blocks
Context Requirement and Responsible Entity
DEPI will consider paying capital cost of upgrading the Casterton gauge. A ‘simple’ installation will be considered – along the lines of a permanent PALS similar to what has been installed at the Bairnsdale Pumphouse site.
New equipment / sites would need to be entered into the Partnership if assistance with capital costs was sought.
Partnership assists with determining beneficiaries and recurrent costs.
All Partnership site data is archived to the State water resources data warehouse.
Typically on-going costs for a rain gauge are currently $600 to $1,000 per year depending on whether it is co-located with stream monitoring equipment. Stream gauge costs are higher.
Opportunities to tap into the Research for Farming Project network of rain gauges were discussed.
FloodZoom will provide access to data from 3G sites such as Harrow.
REVIEW
This SLA is a “live” document.
To become effective, all parties must sign.
This SLA is a local agreement.
There needs to be a connection between this SLA and the BoM SLS. Governance on his is not yet clear. Issues needs to be resolved.
DEPI is the TFWS champion.
OESC is developing a TFWS audit process (outcome of Victorian Floods Review (Comrie, 2011). This SLA may have some future role in that process.
This SLA will be incorporated into the Glenelg Shire Municipal Flood Emergency Plan (MFEP).
Custodian is the Glenelg Shire Council.
The SLA will be subject to the same review regime as the MFEP.
GSC in conjunction with GHCMA and VICSES to periodically review and verify flood class and critical levels (in consultation with the affected communities) and VICSES to formally advise BoM of the need for any changes and / or additions.
GSC, GHCMA and VICSES have a role in collecting flood data other than real-time data such as provided through the river and rainfall gauge network (e.g. hydrologic, flood extent, impacts, damages, photos, and other post-flood data). Must be converted to “intelligence” and included in the MFEP and, as needed, in the GHCMA Flood Response Action Plan.

Flood Forecast and Warning Service Level Agreement for the Glenelg River at Casterton
DRAFT V1.0
June 2013 Page 8 of 8
ACRONYMS
ARI Average Recurrence Interval
BoM Bureau of Meteorology
CBD Central Business District
CFA Country Fire Authority
CMA Catchment Management Authority
DEPI Department of Environment and Primary Industry (formerly DSE)
DSE Department of Sustainability and Environment
EMT Emergency Management Team (operate within an ICC)
GHCMA Goulburn Hopkins Catchment Management Authority
GSC Glenelg Shire Council
IC Incident Controller
ICC Incident Control Centre
LG Local Government
MEMO Municipal Emergency Management Officer
MEMPC Municipal Emergency Management Planning Committee
MFEP Municipal Flood Emergency Plan
MFPC Municipal Flood Planning Committee
OESC Office of the Emergency Services Commissioner
OSOM One Source One Message
PALS Portable Automated Logger System
PMF Probable Maximum Flood
RHQ Regional Headquarters
SLA Service Level Agreement (a local agreement attached to the MFEP)
SLS Service Level Specification (produced by BoM)
TFWS Total Flood Warning System
VFD Victorian Flood Database
VFWCC Victorian Flood Warning Consultative Committee
VICPOL Victoria Police
VICSES Victoria State Emergency Service


Casterton Flood Intelligence & Warning Improvements D-1 PMP Calculation
T:\M8575.MAJ.Casteron_FI\docs\R.M8575.003.01.Final.docx
Appendix D PMP Calculation
GSAM WORKSHEET LOCATION INFORMATION
Catchment: Casterton State: VIC
GSAM zone: Coastal Area: 4588 km2 CATCHMENTS FACTOR
Topographical Adjustment Factor TAF = 1.283 (1.0 - 2.0)
Annual Moisture Adjustment Factor
Season EPWseasonal catchment
average EPWseasonal standard MAF Summer (Annual) 58.523 80.80 0.72 (0.60 - 1.05)
Autumn 47.06 71.00 0.66 (0.56 - 0.91)
PMP values (mm)
Summer Autumn
Duration (hours)
Initial Depth (Dsummer)
PMP Estimate (DsxTAFxMAFs)
Initial Depth (Dautumn)
PMP Estimate (DaxTAFxMAFa)
24 505 469 427 363 36 582 541 534 455 48 634 589 631 537 72 713 663 776 660 96 780 725 839 714
FINAL PMP VALUES (mm)
Duration (hours) Maximum of the Seasonal Depths
Rounded PMP
Estimate (nearest 10 mm)
Final PMP Estimate (from
envelope)
24 469 470 470
36 541 540 540
48 589 590 590
72 663 660 660


Casterton Flood Intelligence & Warning Improvements E-1 Property Inundation
T:\M8575.MAJ.Casteron_FI\docs\R.M8575.003.01.Final.docx
Appendix E Property Inundation
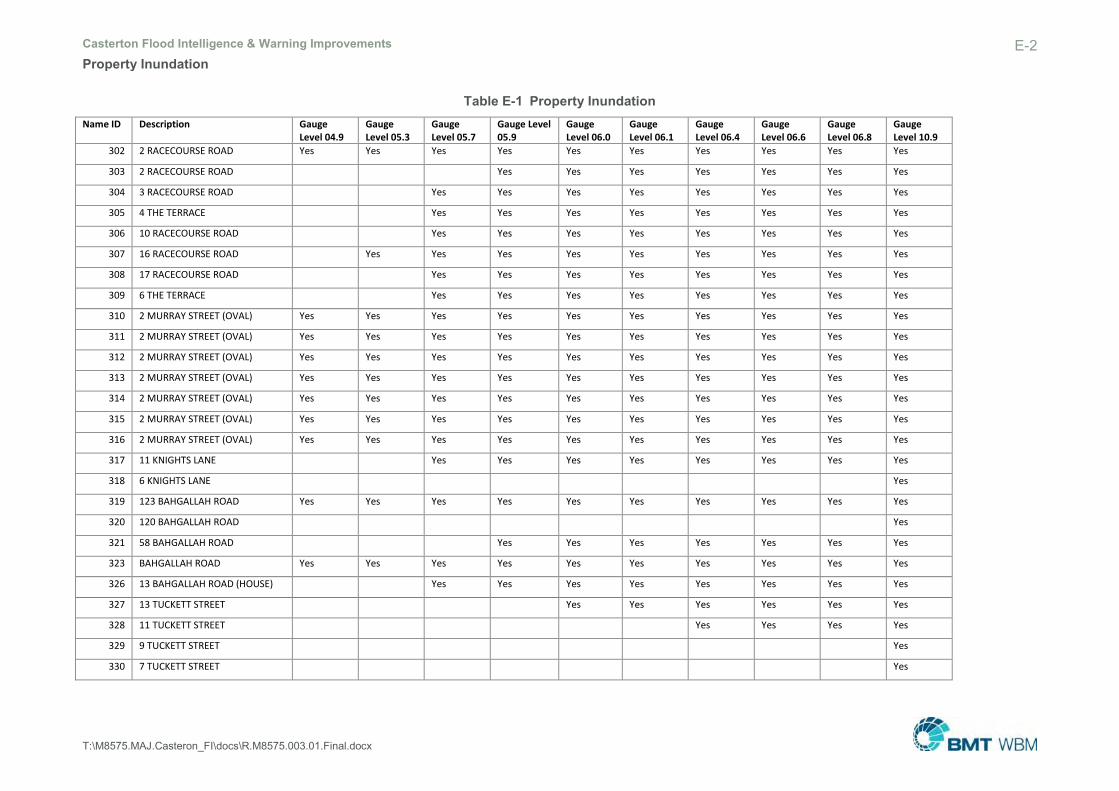
Casterton Flood Intelligence & Warning Improvements E-2 Property Inundation
T:\M8575.MAJ.Casteron_FI\docs\R.M8575.003.01.Final.docx
Table E-1 Property Inundation Name ID Description Gauge
Level 04.9 Gauge Level 05.3
Gauge Level 05.7
Gauge Level 05.9
Gauge Level 06.0
Gauge Level 06.1
Gauge Level 06.4
Gauge Level 06.6
Gauge Level 06.8
Gauge Level 10.9
302 2 RACECOURSE ROAD Yes Yes Yes Yes Yes Yes Yes Yes Yes Yes
303 2 RACECOURSE ROAD Yes Yes Yes Yes Yes Yes Yes
304 3 RACECOURSE ROAD Yes Yes Yes Yes Yes Yes Yes Yes
305 4 THE TERRACE Yes Yes Yes Yes Yes Yes Yes Yes
306 10 RACECOURSE ROAD Yes Yes Yes Yes Yes Yes Yes Yes
307 16 RACECOURSE ROAD Yes Yes Yes Yes Yes Yes Yes Yes Yes
308 17 RACECOURSE ROAD Yes Yes Yes Yes Yes Yes Yes Yes
309 6 THE TERRACE Yes Yes Yes Yes Yes Yes Yes Yes
310 2 MURRAY STREET (OVAL) Yes Yes Yes Yes Yes Yes Yes Yes Yes Yes
311 2 MURRAY STREET (OVAL) Yes Yes Yes Yes Yes Yes Yes Yes Yes Yes
312 2 MURRAY STREET (OVAL) Yes Yes Yes Yes Yes Yes Yes Yes Yes Yes
313 2 MURRAY STREET (OVAL) Yes Yes Yes Yes Yes Yes Yes Yes Yes Yes
314 2 MURRAY STREET (OVAL) Yes Yes Yes Yes Yes Yes Yes Yes Yes Yes
315 2 MURRAY STREET (OVAL) Yes Yes Yes Yes Yes Yes Yes Yes Yes Yes
316 2 MURRAY STREET (OVAL) Yes Yes Yes Yes Yes Yes Yes Yes Yes Yes
317 11 KNIGHTS LANE Yes Yes Yes Yes Yes Yes Yes Yes
318 6 KNIGHTS LANE Yes
319 123 BAHGALLAH ROAD Yes Yes Yes Yes Yes Yes Yes Yes Yes Yes
320 120 BAHGALLAH ROAD Yes
321 58 BAHGALLAH ROAD Yes Yes Yes Yes Yes Yes Yes
323 BAHGALLAH ROAD Yes Yes Yes Yes Yes Yes Yes Yes Yes Yes
326 13 BAHGALLAH ROAD (HOUSE) Yes Yes Yes Yes Yes Yes Yes Yes
327 13 TUCKETT STREET Yes Yes Yes Yes Yes Yes
328 11 TUCKETT STREET Yes Yes Yes Yes
329 9 TUCKETT STREET Yes
330 7 TUCKETT STREET Yes

Casterton Flood Intelligence & Warning Improvements E-3 Property Inundation
T:\M8575.MAJ.Casteron_FI\docs\R.M8575.003.01.Final.docx
331 1 TUCKETT STREET(SHED) Yes Yes Yes Yes Yes Yes Yes Yes
332 1 TUCKETT STREET(PLATFORM) Yes Yes Yes Yes Yes Yes Yes Yes
333 10 McPHERSON STREET Yes
334 12 McPHERSON STREET Yes Yes Yes
335 2-10 McPHERSON STREET Yes Yes Yes
336 3 McPHERSON STREET Yes Yes Yes Yes Yes Yes Yes
337 5 McPHERSON STREET Yes Yes Yes
338 7 McPHERSON STREET Yes
339 9 McPHERSON STREET Yes
340 14-24 MCPHERSON STREET Yes
341 14-24 MCPHERSON STREET Yes
342 14-24 MCPHERSON STREET Yes
343 14-24 MCPHERSON STREET Yes
344 14-24 MCPHERSON STREET Yes
345 15 McPHERSON STREET Yes
346 2 TUCKETT STREET Yes
347 4 TUCKETT STREET Yes
348 1 TUCKETT STREET(STATION) Yes
349 1 TUCKETT STREET Yes Yes Yes Yes Yes Yes Yes Yes
350 17 MCPHERSON STREET Yes
351 21 MCPHERSON STREET Yes
352 23 MCPHERSON STREET Yes
353 19 JACKSON STREET Yes
354 21 JACKSON STREET Yes
355 23 JACKSON STREET Yes
356 23 JACKSON STREET Yes
357 25 JACKSON STREET Yes
358 14-24 MCPHERSON STREET Yes
359 18 JACKSON STREET Yes

Casterton Flood Intelligence & Warning Improvements E-4 Property Inundation
T:\M8575.MAJ.Casteron_FI\docs\R.M8575.003.01.Final.docx
360 25 McPHERSON STREET Yes
361 26 JACKSON STREET Yes
362 24 JACKSON STREET Yes
363 22 JACKSON STREET Yes
364 15 McKINLAY STREET Yes Yes Yes Yes Yes Yes
365 17 McKINLAY STREET Yes Yes Yes Yes Yes Yes
366 20 McKINLAY STREET Yes Yes Yes Yes Yes Yes Yes
367 21 McKINLAY STREET Yes Yes Yes Yes Yes Yes
368 23 McKINLAY STREET Yes Yes Yes Yes Yes Yes
369 25 McKINLAY STREET Yes Yes Yes Yes Yes Yes
370 19 ADDISON STREET Yes Yes Yes Yes Yes Yes
371 22 ADDISON STREET Yes Yes Yes Yes Yes
372 17 ADDISON STREET Yes Yes Yes Yes Yes Yes Yes
373 20 ADDISON STREET Yes Yes Yes Yes Yes
374 15 ADDISON STREET Yes Yes Yes Yes Yes Yes
375 18 ADDISON STREET Yes Yes Yes Yes Yes Yes
376 16 ADDISON STREET Yes Yes Yes Yes Yes Yes
377 13 ADDISON STREET Yes Yes Yes Yes Yes Yes Yes Yes
378 14 ADDISON STREET Yes Yes Yes Yes Yes Yes
379 11 ADDISON STREET Yes Yes Yes Yes Yes Yes Yes Yes
380 12 ADDISON STREET Yes Yes Yes Yes Yes Yes
381 9 ADDISON STREET Yes Yes Yes Yes Yes Yes Yes Yes
382 10 ADDISON STREET Yes Yes Yes Yes Yes Yes
383 7 ADDISON STREET Yes Yes Yes Yes Yes Yes Yes Yes
384 8 ADDISON STREET Yes Yes Yes Yes Yes Yes
385 6 ADDISON STREET Yes Yes Yes Yes Yes
386 51 McPHERSONS STREET Yes Yes Yes Yes Yes Yes Yes
387 42 McPHERSONS STREET Yes Yes Yes Yes Yes Yes Yes
388 45 McPHERSONS STREET Yes Yes Yes Yes Yes Yes Yes Yes

Casterton Flood Intelligence & Warning Improvements E-5 Property Inundation
T:\M8575.MAJ.Casteron_FI\docs\R.M8575.003.01.Final.docx
389 14 MURRAY STREET Yes Yes Yes Yes Yes Yes Yes Yes
390 41 MURRAY STREET Yes Yes Yes Yes Yes Yes Yes Yes
391 31 MURRAY STREET Yes Yes Yes Yes Yes Yes Yes Yes
392 30 MURRAY STREET Yes Yes Yes Yes Yes Yes Yes Yes
393 34 MURRAY STREET Yes Yes Yes Yes Yes Yes Yes
394 36 MURRAY STREET Yes Yes Yes Yes Yes Yes Yes
395 4 ADDISON STREET Yes Yes Yes Yes Yes Yes Yes Yes Yes
396 52 McPHERSONS STREET Yes Yes Yes Yes Yes Yes Yes Yes Yes
397 53 McPHERSONS STREET Yes Yes Yes Yes Yes Yes
398 54 McPHERSONS STREET Yes Yes Yes Yes Yes Yes Yes Yes Yes
399 55 McPHERSONS STREET Yes Yes Yes Yes Yes Yes
400 57 McPHERSONS STREET Yes Yes Yes Yes Yes Yes
401 27 McKINLAY STREET Yes Yes Yes Yes Yes
402 31 McKINLAY STREET Yes Yes Yes Yes Yes
403 33 McKINLAY STREET Yes Yes Yes Yes Yes
404 13 KIRBY STREET Yes Yes Yes Yes Yes Yes
405 35A MURRAY STREET Yes Yes Yes Yes Yes Yes
406 37 MURRAY STREET Yes
407 39 MURRAY STREET Yes
408 41 MURRAY STREET Yes
409 40 MURRAY STREET Yes Yes Yes Yes Yes Yes
410 42 MURRAY STREET Yes Yes Yes Yes Yes Yes
411 44 MURRAY ST (TOP STORY) Yes Yes Yes Yes Yes Yes
412 46 MURRAY STREET Yes Yes Yes Yes Yes Yes
413 48 MURRAY STREET Yes Yes Yes Yes Yes Yes
414 50 MURRAY STREET Yes
415 52 MURRAY STREET Yes
416 14 MITCHELL Yes
417 12 MITCHELL Yes

Casterton Flood Intelligence & Warning Improvements E-6 Property Inundation
T:\M8575.MAJ.Casteron_FI\docs\R.M8575.003.01.Final.docx
418 10 MITCHELL Yes
419 8 MITCHELL Yes
420 6 MITCHELL Yes
421 4 MITCHELL Yes
422 2 MITCHELL Yes Yes
423 7 McEVOY Yes
424 14 McEVOY Yes
425 19 LEAKE STREET Yes
426 17 LEAKE STREET
427 15 LEAKE STREET Yes
428 11 LEAKE STREET Yes
429 9 LEAKE STREET
430 7 LEAKE STREET Yes
431 9 McEVOY Yes
432 16 McEVOY Yes
433 60 KIRBY STREET Yes Yes Yes Yes
434 58 KIRBY STREET Yes Yes Yes Yes
435 56 KIRBY STREET Yes Yes Yes Yes
436 51 KIRBY STREET Yes Yes
437 53 KIRBY STREET Yes
438 55 KIRBY STREET Yes
439 32 MILLER STREET Yes
440 30 MILLER STREET Yes
441 56 ADDISON STREET Yes
442 54 ADDISON STREET Yes
443 52 ADDISON STREET Yes
444 50 ADDISON STREET Yes Yes Yes
445 48 ADDISON STREET Yes
446 46 ADDISON STREET Yes Yes Yes Yes Yes

Casterton Flood Intelligence & Warning Improvements E-7 Property Inundation
T:\M8575.MAJ.Casteron_FI\docs\R.M8575.003.01.Final.docx
447 44 ADDISON STREET Yes Yes Yes Yes
448 45 ADDISON STREET Yes
449 47 ADDISON STREET Yes
450 18 HUITTON STREET Yes
451 16 HUITTON STREET Yes
452 23 HUITTON STREET Yes
453 25 HUITTON STREET Yes
454 22 HUITTON STREET Yes Yes Yes
455 14 CLARKE STREET Yes Yes Yes Yes Yes Yes Yes Yes Yes
457 8 MURRAY STREET Yes Yes Yes Yes Yes Yes Yes Yes Yes
458 12 MURRAY STREET Yes Yes Yes Yes Yes Yes Yes Yes
459 38 McPHERSONS STREET Yes Yes Yes Yes Yes Yes Yes Yes
460 36 McPHERSONS STREET Yes Yes Yes Yes Yes Yes Yes Yes
461 34 McPHERSONS STREET Yes Yes Yes Yes Yes Yes Yes Yes
462 35 McPHERSONS STREET Yes Yes Yes Yes Yes Yes Yes
463 128 HENTY STREET Yes Yes Yes Yes Yes Yes Yes
465 1 CLARKE STREET Yes
467 2 JACKSON STREET Yes
468 4 JACKSON STREET Yes
469 8 JACKSON STREET Yes
470 9 JACKSON STREET Yes
471 10 JACKSON STREET Yes
472 2 CLARKE STREET Yes
473 4 CLARKE STREET Yes
474 3 CLARKE STREET Yes
475 3 CLARKE STREET Yes
476 6 CLARKE STREET Yes
477 8 CLARKE STREET Yes Yes
478 31 HENTY STREET Yes Yes Yes

Casterton Flood Intelligence & Warning Improvements E-8 Property Inundation
T:\M8575.MAJ.Casteron_FI\docs\R.M8575.003.01.Final.docx
479 5 THE TERRACE Yes Yes Yes Yes Yes Yes Yes Yes Yes
480 1 TYRES STREET Yes Yes Yes Yes Yes Yes Yes Yes Yes Yes
481 25 HENTY STREET(REAR) Yes Yes Yes Yes Yes Yes Yes Yes Yes
482 29 HENTY STREET(REAR) Yes Yes Yes Yes Yes Yes Yes Yes
483 27 McPHERSONS STREET Yes
484 148 HENTY STREET Yes Yes Yes Yes Yes Yes Yes Yes
485 150 HENTY STREET Yes Yes Yes Yes Yes Yes
486 152 HENTY STREET Yes Yes Yes Yes Yes Yes Yes Yes
487 154 HENTY STREET Yes Yes Yes Yes Yes Yes Yes Yes
488 156 HENTY STREET Yes
489 156A HENTY STREET Yes
490 32 McKINLAY STREET Yes Yes
491 19 NOSS RETREAT ROAD Yes Yes Yes Yes Yes Yes Yes Yes Yes Yes
492 146 HENTY Yes Yes Yes Yes Yes Yes Yes Yes
493 144 HENTY Yes Yes Yes Yes Yes Yes Yes Yes
494 138 HENTY Yes Yes Yes Yes Yes Yes Yes Yes
495 136 HENTY Yes Yes Yes Yes Yes Yes Yes Yes
496 134 HENTY Yes Yes Yes Yes Yes Yes Yes Yes
497 132 HENTY Yes Yes Yes Yes Yes Yes Yes Yes
498 130 HENTY Yes Yes Yes Yes Yes Yes Yes Yes
499 128 C HENTY Yes Yes Yes Yes Yes Yes Yes Yes
500 128 HENTY Yes Yes Yes Yes Yes Yes Yes Yes
501 128 A HENTY Yes Yes Yes Yes Yes Yes Yes Yes
502 126 HENTY Yes Yes Yes Yes Yes Yes Yes
503 124 HENTY Yes Yes Yes Yes Yes Yes Yes
504 122 HENTY Yes Yes Yes Yes Yes Yes
505 120 HENTY Yes Yes Yes Yes Yes Yes
506 118 HENTY Yes Yes Yes Yes Yes Yes
507 116 HENTY Yes Yes Yes Yes Yes Yes Yes

Casterton Flood Intelligence & Warning Improvements E-9 Property Inundation
T:\M8575.MAJ.Casteron_FI\docs\R.M8575.003.01.Final.docx
508 114 HENTY Yes Yes Yes Yes Yes Yes Yes Yes
509 104 HENTY Yes Yes Yes Yes Yes Yes Yes Yes
510 102 HENTY Yes Yes Yes Yes Yes Yes Yes Yes
511 100 HENTY Yes Yes Yes Yes Yes Yes Yes Yes
512 98 HENTY Yes Yes Yes Yes Yes Yes Yes Yes
513 96 HENTY Yes Yes Yes Yes Yes Yes Yes Yes
514 94 HENTY Yes Yes Yes Yes Yes Yes Yes Yes
515 92/90 HENTY Yes Yes Yes Yes Yes Yes Yes Yes
516 88 HENTY Yes Yes Yes Yes Yes Yes Yes Yes
517 86 HENTY Yes Yes Yes Yes Yes Yes Yes Yes
518 84 HENTY Yes Yes Yes Yes Yes Yes Yes Yes
519 82 HENTY Yes Yes Yes Yes Yes Yes Yes Yes
520 78 HENTY Yes Yes Yes Yes Yes Yes Yes
521 76 HENTY Yes Yes Yes Yes Yes Yes Yes Yes
522 74 HENTY Yes Yes Yes Yes Yes Yes Yes Yes
523 72 HENTY Yes Yes Yes Yes Yes Yes Yes Yes
524 70 HENTY Yes Yes Yes Yes Yes Yes Yes Yes
525 68 HENTY Yes Yes Yes Yes Yes Yes Yes Yes
526 66 HENTY Yes Yes Yes Yes Yes Yes Yes Yes
527 64 HENTY Yes Yes Yes Yes Yes Yes Yes Yes
528 62 HENTY Yes Yes Yes Yes Yes Yes Yes Yes
529 60 HENTY Yes Yes Yes Yes Yes Yes Yes Yes
530 58 HENTY Yes Yes Yes Yes Yes Yes Yes Yes
531 52 HENTY Yes Yes Yes Yes Yes Yes Yes Yes Yes
532 46 WEST HENTY Yes Yes Yes Yes Yes Yes Yes Yes Yes
533 46 EAST HENTY Yes Yes Yes Yes Yes Yes Yes Yes Yes
534 38 HENTY Yes Yes Yes Yes Yes Yes Yes Yes Yes Yes
535 36 HENTY Yes Yes Yes Yes Yes Yes Yes Yes Yes Yes
536 34 HENTY Yes Yes Yes Yes Yes Yes Yes Yes Yes Yes

Casterton Flood Intelligence & Warning Improvements E-10 Property Inundation
T:\M8575.MAJ.Casteron_FI\docs\R.M8575.003.01.Final.docx
537 32 HENTY Yes Yes Yes Yes Yes Yes Yes Yes Yes Yes
538 26 HENTY Yes Yes Yes Yes Yes Yes Yes Yes Yes Yes
539 22 HENTY Yes Yes Yes Yes Yes Yes Yes Yes Yes Yes
540 20 HENTY Yes Yes Yes Yes Yes Yes Yes Yes Yes Yes
541 16 HENTY Yes Yes Yes Yes
542 12 WEST HENTY (ROOMS) Yes Yes Yes Yes Yes Yes Yes
543 12 EAST HENTY (HOTEL) Yes Yes Yes Yes Yes Yes Yes
544 1 HENTY Yes Yes Yes Yes Yes Yes
545 11 HENTY Yes Yes Yes Yes Yes Yes Yes Yes Yes Yes
546 13 HENTY Yes Yes Yes Yes Yes Yes Yes Yes Yes
547 15 HENTY Yes Yes Yes Yes Yes Yes Yes Yes Yes
548 17 HENTY Yes Yes Yes Yes Yes Yes Yes Yes Yes
549 19 HENTY Yes Yes Yes Yes Yes Yes Yes Yes Yes
550 21 HENTY Yes Yes Yes Yes Yes Yes Yes Yes Yes
551 25 HENTY Yes Yes Yes Yes Yes Yes Yes Yes
552 29 HENTY Yes Yes Yes Yes
553 53 HENTY Yes
554 55 HENTY Yes
555 57 HENTY Yes
556 59 HENTY Yes
557 61A HENTY Yes
558 61 HENTY Yes
559 63 HENTY Yes
560 67 HENTY Yes
561 73 HENTY Yes
562 75 HENTY Yes
563 77 HENTY Yes
564 79 HENTY Yes
565 81 HENTY Yes

Casterton Flood Intelligence & Warning Improvements E-11 Property Inundation
T:\M8575.MAJ.Casteron_FI\docs\R.M8575.003.01.Final.docx
566 83 HENTY Yes
567 85 HENTY Yes
568 87 HENTY Yes
569 89 HENTY Yes
570 91 HENTY Yes
571 93 HENTY Yes
572 95 HENTY Yes
573 97 HENTY Yes
574 99 HENTY Yes
575 101 HENTY Yes
576 131 HENTY Yes
577 133 HENTY Yes
578 137 HENTY Yes

Casterton Flood Intelligence & Warning Improvements E-12 Property Inundation
T:\M8575.MAJ.Casteron_FI\docs\R.M8575.003.01.Final.docx
Table E-2 Above Floor Flooding Name ID Description Gauge
Level 04.9 Gauge Level 05.3
Gauge Level 05.7
Gauge Level 05.9
Gauge Level 06.0
Gauge Level 06.1
Gauge Level 06.4
Gauge Level 06.6
Gauge Level 06.8
Gauge Level 10.9
302 2 RACECOURSE ROAD 0.22 0.48 0.65 4.77
303 2 RACECOURSE ROAD 0.17 0.34 4.27
304 3 RACECOURSE ROAD 0.07 0.24 4.18
305 4 THE TERRACE 0.15 4.09
306 10 RACECOURSE ROAD 0.02 0.18 0.45 0.64 4.59
307 16 RACECOURSE ROAD 0 0.25 0.43 4.33
308 17 RACECOURSE ROAD 0.11 4.01
309 6 THE TERRACE 0.01 0.13 0.21 0.42 0.66 0.83 4.66
310 2 MURRAY STREET (OVAL) 3.48
311 2 MURRAY STREET (OVAL) 0.12 0.28 4.28
312 2 MURRAY STREET (OVAL) 0.22 0.38 4.38
313 2 MURRAY STREET (OVAL) 0.14 0.32 0.44 0.71 0.98 1.14 5.15
314 2 MURRAY STREET (OVAL) 0.11 0.22 0.49 0.77 0.93 4.96
315 2 MURRAY STREET (OVAL) 0.26 0.53 0.69 4.71
316 2 MURRAY STREET (OVAL) 0.03 0.22 0.35 0.61 0.88 1.05 5.05
317 11 KNIGHTS LANE 0.88
318 6 KNIGHTS LANE
319 123 BAHGALLAH ROAD
320 120 BAHGALLAH ROAD
321 58 BAHGALLAH ROAD 0.09 0.2 3.47
323 BAHGALLAH ROAD 0.06 0.37 0.52 0.61 0.79 0.98 1.1 4.58
326 13 BAHGALLAH ROAD (HOUSE) 3.3
327 13 TUCKETT STREET
328 11 TUCKETT STREET
329 9 TUCKETT STREET
330 7 TUCKETT STREET

Casterton Flood Intelligence & Warning Improvements E-13 Property Inundation
T:\M8575.MAJ.Casteron_FI\docs\R.M8575.003.01.Final.docx
331 1 TUCKETT STREET(SHED)
332 1 TUCKETT STREET(PLATFORM)
333 10 McPHERSON STREET 2.06
334 12 McPHERSON STREET 2.13
335 2-10 McPHERSON STREET 3.59
336 3 McPHERSON STREET 2.97
337 5 McPHERSON STREET 2.97
338 7 McPHERSON STREET 2.54
339 9 McPHERSON STREET 2.14
340 14-24 MCPHERSON STREET 1.18
341 14-24 MCPHERSON STREET 0.64
342 14-24 MCPHERSON STREET 0.62
343 14-24 MCPHERSON STREET 0.56
344 14-24 MCPHERSON STREET
345 15 McPHERSON STREET 0.54
346 2 TUCKETT STREET 0.41
347 4 TUCKETT STREET 1.04
348 1 TUCKETT STREET(STATION)
349 1 TUCKETT STREET 2.19
350 17 MCPHERSON STREET 0.3
351 21 MCPHERSON STREET 0.16
352 23 MCPHERSON STREET 0.31
353 19 JACKSON STREET 0.17
354 21 JACKSON STREET 0.16
355 23 JACKSON STREET 0.33
356 23 JACKSON STREET 0.22
357 25 JACKSON STREET 0.15
358 14-24 MCPHERSON STREET 0.42
359 18 JACKSON STREET 0.42

Casterton Flood Intelligence & Warning Improvements E-14 Property Inundation
T:\M8575.MAJ.Casteron_FI\docs\R.M8575.003.01.Final.docx
360 25 McPHERSON STREET 0.17
361 26 JACKSON STREET
362 24 JACKSON STREET
363 22 JACKSON STREET
364 15 McKINLAY STREET 0.13 0.3 4.35
365 17 McKINLAY STREET 0.06 0.18 0.47 0.77 0.95 4.99
366 20 McKINLAY STREET 0.03 0.2 4.25
367 21 McKINLAY STREET 0.3 0.47 4.52
368 23 McKINLAY STREET 0.26 0.57 0.74 4.79
369 25 McKINLAY STREET 0.05 0.23 4.27
370 19 ADDISON STREET 3.89
371 22 ADDISON STREET 0.17 4.22
372 17 ADDISON STREET 0.26 0.43 4.47
373 20 ADDISON STREET 0.05 4.09
374 15 ADDISON STREET 0.24 0.41 4.45
375 18 ADDISON STREET 0.13 4.16
376 16 ADDISON STREET 0.27 0.44 4.48
377 13 ADDISON STREET 0.22 0.39 4.42
378 14 ADDISON STREET 0.22 0.39 4.42
379 11 ADDISON STREET 0.07 4.11
380 12 ADDISON STREET 0.25 0.41 4.44
381 9 ADDISON STREET 3.49
382 10 ADDISON STREET 0.14 0.31 4.34
383 7 ADDISON STREET 0.05 0.22 4.25
384 8 ADDISON STREET 0.15 0.32 4.34
385 6 ADDISON STREET 0.25 0.42 4.44
386 51 McPHERSONS STREET 3.89
387 42 McPHERSONS STREET 0.09 4.1
388 45 McPHERSONS STREET 0.02 4.03

Casterton Flood Intelligence & Warning Improvements E-15 Property Inundation
T:\M8575.MAJ.Casteron_FI\docs\R.M8575.003.01.Final.docx
389 14 MURRAY STREET 0.1 0.38 0.66 0.83 4.84
390 41 MURRAY STREET 0.27 0.44 4.46
391 31 MURRAY STREET 0.06 0.25 0.37 0.65 0.94 1.11 5.15
392 30 MURRAY STREET 0.15 0.32 4.36
393 34 MURRAY STREET 0.05 0.22 4.26
394 36 MURRAY STREET 0.12 0.29 4.34
395 4 ADDISON STREET 0.02 4.04
396 52 McPHERSONS STREET 0.11 0.28 4.3
397 53 McPHERSONS STREET 0.28 0.45 4.47
398 54 McPHERSONS STREET 0.21 0.38 4.4
399 55 McPHERSONS STREET 0.05 0.22 4.24
400 57 McPHERSONS STREET 0.05 0.22 4.24
401 27 McKINLAY STREET 0.24 0.42 4.46
402 31 McKINLAY STREET 0.04 0.22 4.27
403 33 McKINLAY STREET 0.18 0.36 4.4
404 13 KIRBY STREET 4.04
405 35A MURRAY STREET 3.1
406 37 MURRAY STREET 2.23
407 39 MURRAY STREET
408 41 MURRAY STREET
409 40 MURRAY STREET 3.88
410 42 MURRAY STREET 1.88
411 44 MURRAY ST (TOP STORY)
412 46 MURRAY STREET
413 48 MURRAY STREET
414 50 MURRAY STREET
415 52 MURRAY STREET
416 14 MITCHELL
417 12 MITCHELL

Casterton Flood Intelligence & Warning Improvements E-16 Property Inundation
T:\M8575.MAJ.Casteron_FI\docs\R.M8575.003.01.Final.docx
418 10 MITCHELL
419 8 MITCHELL
420 6 MITCHELL
421 4 MITCHELL 0.79
422 2 MITCHELL 1.14
423 7 McEVOY
424 14 McEVOY 0.06
425 19 LEAKE STREET
426 17 LEAKE STREET 1.78
427 15 LEAKE STREET 1.55
428 11 LEAKE STREET 1.06
429 9 LEAKE STREET 0.96
430 7 LEAKE STREET
431 9 McEVOY
432 16 McEVOY
433 60 KIRBY STREET 2.2
434 58 KIRBY STREET 2.96
435 56 KIRBY STREET 3.56
436 51 KIRBY STREET 2.5
437 53 KIRBY STREET 2.72
438 55 KIRBY STREET 1.5
439 32 MILLER STREET 0.78
440 30 MILLER STREET
441 56 ADDISON STREET
442 54 ADDISON STREET
443 52 ADDISON STREET
444 50 ADDISON STREET
445 48 ADDISON STREET 1.63
446 46 ADDISON STREET 2.36

Casterton Flood Intelligence & Warning Improvements E-17 Property Inundation
T:\M8575.MAJ.Casteron_FI\docs\R.M8575.003.01.Final.docx
447 44 ADDISON STREET 3.27
448 45 ADDISON STREET
449 47 ADDISON STREET
450 18 HUITTON STREET
451 16 HUITTON STREET 1.56
452 23 HUITTON STREET
453 25 HUITTON STREET 1.51
454 22 HUITTON STREET 3.01
455 14 CLARKE STREET 0.12 0.38 0.65 0.81 4.79
457 8 MURRAY STREET 0.1 0.29 0.41 0.68 0.96 1.12 5.12
458 12 MURRAY STREET 0.1 0.29 0.41 0.68 0.96 1.13 5.13
459 38 McPHERSONS STREET 0.03 0.31 0.48 4.49
460 36 McPHERSONS STREET 0.13 0.25 0.53 0.81 0.98 4.98
461 34 McPHERSONS STREET 0.2 0.37 4.37
462 35 McPHERSONS STREET 0.07 0.19 0.47 0.75 0.92 4.92
463 128 HENTY STREET 0.01 0.29 0.57 0.74 4.74
465 1 CLARKE STREET 1.04
467 2 JACKSON STREET 0.8
468 4 JACKSON STREET 0.47
469 8 JACKSON STREET 0.25
470 9 JACKSON STREET 0.73
471 10 JACKSON STREET 0.15
472 2 CLARKE STREET 1.61
473 4 CLARKE STREET 1.7
474 3 CLARKE STREET 0.88
475 3 CLARKE STREET 0.85
476 6 CLARKE STREET 2.13
477 8 CLARKE STREET 2.71
478 31 HENTY STREET 3.71

Casterton Flood Intelligence & Warning Improvements E-18 Property Inundation
T:\M8575.MAJ.Casteron_FI\docs\R.M8575.003.01.Final.docx
479 5 THE TERRACE 0.29 0.47 4.3
480 1 TYRES STREET 0.08 0.16 0.36 0.59 0.75 4.7
481 25 HENTY STREET(REAR) 0.13 0.37 0.55 4.48
482 29 HENTY STREET(REAR) 3.78
483 27 McPHERSONS STREET
484 148 HENTY STREET 0.7
485 150 HENTY STREET 0.19
486 152 HENTY STREET
487 154 HENTY STREET
488 156 HENTY STREET
489 156A HENTY STREET
490 32 McKINLAY STREET 0.93
491 19 NOSS RETREAT ROAD 0.12 0.4 0.56 4.61
492 146 HENTY 1.02
493 144 HENTY 1.29
494 138 HENTY 1.55
495 136 HENTY 1.9
496 134 HENTY 1.89
497 132 HENTY 2.11
498 130 HENTY 2.36
499 128 C HENTY 2.63
500 128 HENTY 2.75
501 128 A HENTY 2.72
502 126 HENTY 3.07
503 124 HENTY 3.28
504 122 HENTY 3.29
505 120 HENTY 3.31
506 118 HENTY 3.19
507 116 HENTY 3.19

Casterton Flood Intelligence & Warning Improvements E-19 Property Inundation
T:\M8575.MAJ.Casteron_FI\docs\R.M8575.003.01.Final.docx
508 114 HENTY 3.35
509 104 HENTY 3.07
510 102 HENTY 3.12
511 100 HENTY 3.1
512 98 HENTY 3.09
513 96 HENTY 3.13
514 94 HENTY 3.12
515 92/90 HENTY 3.23
516 88 HENTY 3.28
517 86 HENTY 3.27
518 84 HENTY 3.26
519 82 HENTY 3.24
520 78 HENTY 3.41
521 76 HENTY 3.46
522 74 HENTY 3.45
523 72 HENTY 3.59
524 70 HENTY 3.54
525 68 HENTY 3.63
526 66 HENTY 3.61
527 64 HENTY 3.71
528 62 HENTY 3.57
529 60 HENTY 3.57
530 58 HENTY 3.66
531 52 HENTY 3.8
532 46 WEST HENTY 0.02 0.18 4.09
533 46 EAST HENTY 0.15 0.31 4.22
534 38 HENTY 0.05 0.33 0.48 4.38
535 36 HENTY 3.73
536 34 HENTY 0.06 0.33 0.48 4.38

Casterton Flood Intelligence & Warning Improvements E-20 Property Inundation
T:\M8575.MAJ.Casteron_FI\docs\R.M8575.003.01.Final.docx
537 32 HENTY 0.03 0.29 0.44 4.33
538 26 HENTY 0.04 0.3 0.46 4.35
539 22 HENTY 0.02 3.91
540 20 HENTY 3.86
541 16 HENTY 3.81
542 12 WEST HENTY (ROOMS) 0.1 0.25 4.14
543 12 EAST HENTY (HOTEL) 0.01 0.27 0.42 4.32
544 1 HENTY 0.24 0.39 4.3
545 11 HENTY 0.25 0.4 4.3
546 13 HENTY 0.05 0.31 0.46 4.35
547 15 HENTY 0.19 0.45 0.6 4.5
548 17 HENTY 0.13 0.4 0.55 4.45
549 19 HENTY 3.88
550 21 HENTY 0.1 0.36 0.51 4.4
551 25 HENTY 3.82
552 29 HENTY 3.72
553 53 HENTY 2.34
554 55 HENTY 2.92
555 57 HENTY 3.02
556 59 HENTY 3.25
557 61A HENTY 2.88
558 61 HENTY 3.23
559 63 HENTY 2.75
560 67 HENTY 2.59
561 73 HENTY 2.77
562 75 HENTY 2.77
563 77 HENTY 2.62
564 79 HENTY 2.86
565 81 HENTY 2.57

Casterton Flood Intelligence & Warning Improvements E-21 Property Inundation
T:\M8575.MAJ.Casteron_FI\docs\R.M8575.003.01.Final.docx
566 83 HENTY 2.64
567 85 HENTY 2.62
568 87 HENTY 2.62
569 89 HENTY 2.62
570 91 HENTY 2.71
571 93 HENTY 2.68
572 95 HENTY 2.67
573 97 HENTY 2.71
574 99 HENTY 2.49
575 101 HENTY 2.05
576 131 HENTY 1.31
577 133 HENTY 1.36
578 137 HENTY 0.37

BMT WBM Bangalow 6/20 Byron Street Bangalow 2479
Tel +61 2 6687 0466 Fax +61 2 66870422 Email [email protected] Web www.bmtwml.com.au
BMT WBM Brisbane Level 8, 200 Creek Street Brisbane 4000 PO Box 203 Spring Hill QLD 4004 Tel +61 7 3831 6744 Fax +61 7 3832 3627 Email [email protected] Web www.bmtwml.com.au
BMT WBM Denver 8200 S. Akron Street, #B120 Centennial Denver Colorado 80112 USA Tel +1 303 792 9814 Fax +1 303 792 9742 Email [email protected] Web www.bmtwbm.com
BMT WBM London 1st Floor, International House St Katherine’s Way London E1W1TW Email [email protected] Web www.bmtwbm.com.au
BMT WBM Mackay Suite 1, 138 Wood Street Mackay 4740 PO Box 4447 Mackay QLD 4740 Tel +61 7 4953 5144 Fax +61 7 4953 5132 Email [email protected] Web www.bmtwbm.com.au
BMT WBM Melbourne Level 5, 99 King Street Melbourne 3000 PO Box 604 Collins Street West VIC 8007 Tel +61 3 8620 6100 Fax +61 3 8620 6105 Email [email protected] Web www.bmtwbm.com.au
BMT WBM Newcastle 126 Belford Street Broadmeadow 2292 PO Box 266 Broadmeadow NSW 2292 Tel +61 2 4940 8882 Fax +61 2 4940 8887 Email [email protected] Web www.bmtwbm.com.au
BMT WBM Perth Suite 6, 29 Hood Street Subiaco 6008 Tel +61 8 9328 2029 Fax +61 8 9486 7588 Email [email protected] Web www.bmtwbm.com.au
BMT WBM Sydney Level 1, 256-258 Norton Street Leichhardt 2040 PO Box 194 Leichhardt NSW 2040 Tel +61 2 8987 2900 Fax +61 2 8987 2999 Email [email protected] Web www.bmtwbm.com.au
BMT WBM Vancouver Suite 401, 611 Alexander Street Vancouver British Columbia V6A 1E1 Canada Tel +1 604 683 5777 Fax +1 604 608 3232 Email [email protected] Web www.bmtwbm.com