cash on the table - building a better working world - ey - … · 2015-07-29 · cash on the table:...
TRANSCRIPT

Cash on the table: working capital management in the consumer products industry 2014
Cash on the tableWorking capital management in the consumer products industry 2014

Executive summaryCash on the table is the latest in a series of working capital (WC) management reports based on EY research.For the consumer products (CP) industry, 2013 was a year of sharp improvement in WC performance. This reflects the accelerated impact of many of the actions taken to boost return on capital against a background of slowing sales growth, pressure on margins and intense scrutiny from shareholders.
Of the three selected segments within the CP industry, food and beverage (FB) reported the biggest improvement in WC in 2013, with a drop of as much as 15% in cash-to-cash (C2C). Household and personal care (HPC) saw a reduction of 5% in C2C, and Brewing’s C2C was a negative five days, three days lower than in the previous year.
These findings for 2013 mean that the CP industry has managed to achieve a substantial reduction in its level of C2C since 2007. However, a closer review reveals major differences in the degree and speed with which different companies in each segment have been able to deliver these increased efficiencies.
These differences are underlined by the fact that current WC performance continues to vary widely among companies in the various CP segments. While these performance gaps may partly be the result of variations in business models, they also highlight fundamental differences in the intensity of management focus on cash and the effectiveness of WC management processes. Overall, our research findings suggest that the leading 20 CP companies still have up to US$35 billion tied up unnecessarily in WC. This figure is equivalent to 5% of these businesses’ combined sales.
To capitalize on this opportunity, CP companies will need to drive continuous operational and structural improvements, addressing “root and branch” aspects of WC policies, processes and metrics. Key initiatives should include:
• Management of WC as a strategic initiative, including aligning executive compensation with appropriate performance measures
• Further streamlining of manufacturing and supply chains
• Closer collaboration and process alignment with customers and suppliers
• Better coordination among supply, planning, manufacturing, procurement and logistics functions and processes
• Improvements in billing and cash collections and more effective management of payment terms
• Intensification of spend consolidation and standardization
• Implementation of more robust supply chain risk management policies
Barring any further significant changes in commodity prices, our expectation for 2014 is that WC performance for the CP industry as a whole will continue to improve but probably at a more moderate pace. The results are also likely to show even wider divergences between individual companies within each CP segment as some embrace more substantial and sustainable operational and structural changes in the way they address WC.
ContentsExecutive summary 2
Sharply improved WC performance in 2013 3
Continuing reduction in C2C since 2007 5
Opportunities going forward 9
Case studies 10
Driving working capital excellence 11
How EY can help 12
Methodology 13
Glossary 13
Further reading 14
Contacts 15
Cash on the table: working capital management in the consumer products industry 20142
Cash on the table: working capital management in the consumer products industry 2014 3
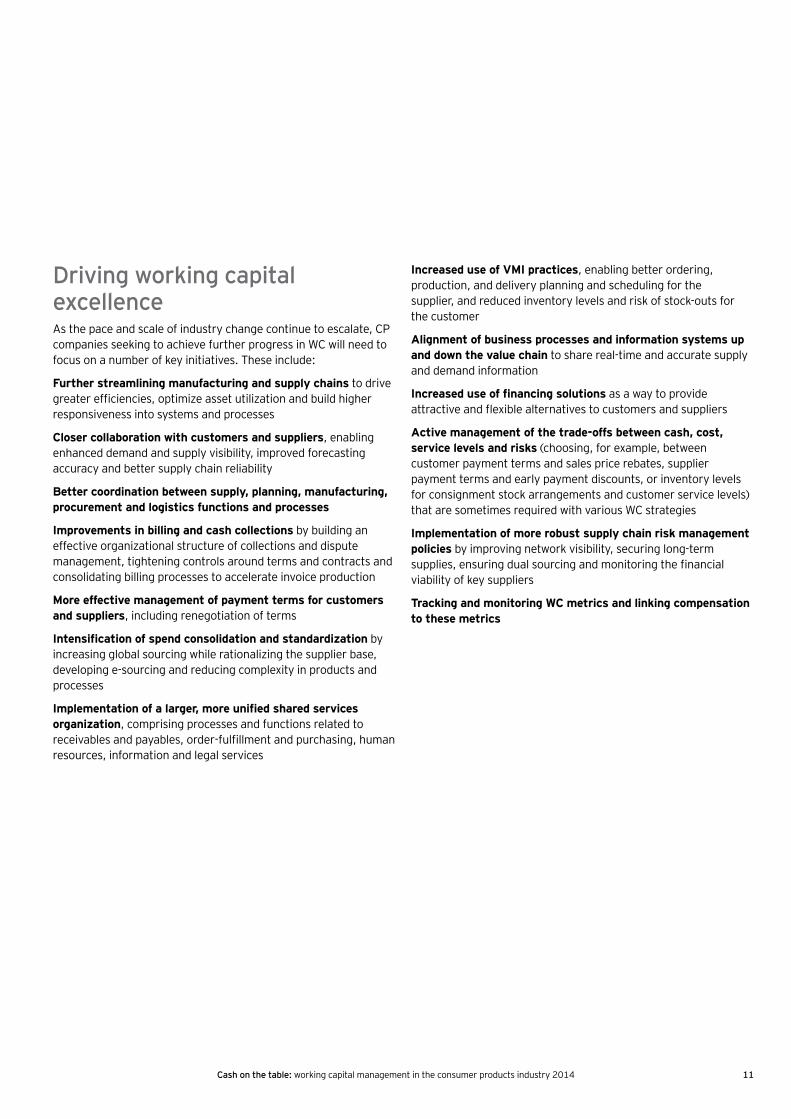
Chart 1. Change in C2C per company, 2012–13 (in days)
Note: DSO (days sales outstanding), DIO (days inventory outstanding), DPO (days payable outstanding) and C2C (cash-to-cash), with metrics calculated on a sales-weighted basis
Table 1. Change in WC metrics across the CP industry, 2012–13
Brewing FB HPC
2013 Change 13/12 2013 Change 13/12 2013 Change 13/12
DSO 30.1 -4% (down 1.3 day) 36.8 -3% (down 1.1 day) 33.2 -2% (down 0.5 day)
DIO 24.6 -1% (down 0.2 day) 29.0 -4% (down 1.2 day) 31.8 -2% (down 0.7 day)
DPO 60.2 3% (up 2.0 days) 36.0 10% (up 3.2 days) 41.4 0%
C2C -5.5 down 3.5 days 29.8 -15% (down 5.5 days) 23.6 -5% (down 1.3 days)
Source: EY analysis, based on publicly available annual financial statements
Sharply improved WC performance in 2013The results from our analysis of the top 20 CP companies in 2013 reveal sharply improved WC performance from the previous year in each of the selected segments.
These variations in reported WC performance may be due to a number of factors, each with different impacts on the CP segments. These factors include:
Slow and uneven global growth. 2013 was a challenging year for the CP industry, marked by sluggish consumer demand in developed countries, softer growth in rapid-growth markets, weak pricing (itself exacerbated by lower commodity prices), and adverse currency effects. Compared with 2012, the aggregate sales of our sample of CP companies were slightly down in 2013 (consisting of an increase of 3% for Brewing and a decrease of 2% and 1% for FB and HPC, respectively), in sharp contrast with the overall increase of 9% reported in the previous year. Disposals of underperforming brands and products also had a negative impact while growth through acquisitions was limited, except for brewers. For each selected CP segment, WC levels in absolute terms were significantly down year-on-year, dropping by 17% and 7% for FB and HPC, respectively, and a negative balance almost tripling for Brewing.
Persistent volatility in exchange rates. Variations in exchange rates also played a significant role in driving WC performance in 2013. For companies reporting in US dollars, the relative weakness of the US dollar against the euro at the end of 2013, compared with its average during the year, was a negative contributory factor to WC performance. In contrast, for those reporting in euros, the strength of this currency — against both the US dollar and Japanese yen and also against other currencies in rapidly growing economies — had a beneficial impact on WC performance.
Greater attention on WC management. A high proportion of CP companies have intensified their focus on cash and WC management to boost returns on capital and increase cash returns to shareholders, a trend partly prompted by increased pressures from shareholders (including from some activists). The heightened attention on WC has included actions related to lean manufacturing, billing and cash collection, spend consolidation, global and local sourcing optimization, renegotiation of payment terms, supply chain efficiency and simplification of structures.
-16-14-12-10
-8-6-4-20246
1 2 3 4 5 6 7 8 9 10 11 12 13 14 15 16 17 18 19 20
FB HPCBrewing
Of the three segments chosen for the analysis, FB reported the biggest improvement in 2013, with a drop of as much as 15% in C2C. HPC saw a reduction of 5% in C2C, and Brewing’s C2C was a negative five days, three days lower than in the previous year.

Cash on the table: working capital management in the consumer products industry 20144
Better receivables performance. Each CP segment and a majority of companies (12) reported improved results in receivables in 2013. This was primarily due to a continued focus on billing and cash collection. It is worth noting that there was no apparent material change in payment conditions from retailers in the US and Europe, with an analysis of their payables performance [based on Cost to Serve (COS)] showing a stable position overall and for each region. For CP companies, the reported variations in receivables may have also reflected changes in the trade-offs between improvements in WC performance and sales growth or margin expansion.
Broad inventory performance improvement. Each CP segment and a majority of companies (12) reported an improvement in inventory performance in 2013. Further progress was achieved through lean transformation and supply chain optimization, as well as through increased collaboration with retailers. Weaker prices for food, metals and plastics also resulted in lower inventory balances. The lag effect of changing commodity prices (smoothed by the use of hedging policies) means that the reported inventory performance generally improves in the short term when prices fall, and deteriorates when prices rise. However, in some cases, progress was hampered by the decision to build up inventory to grow sales and improve service levels.
Strong payables performance. Two CP segments and 14 companies posted a higher DPO in 2013 than in 2012. This improved performance reflects the combined impact of increased globalization of procurement and more effective management of supplier terms (notably via a further extension in payment terms). However, and in contrast with inventory, weaker commodity prices in 2013 probably had a depressing impact on performance. Furthermore, it is worth noting that the reported changes in payables also reflected companies’ varying strategies and tactics. For example, some companies chose to stretch terms with their main suppliers or reduced their supplier base to achieve greater leverage in negotiations. Others opted for faster payments in return for enhanced cash discounts.
More specifically, there were variations in the degree of change in C2C among CP segments.
Strong showing for FB. Of the three CP segments, FB reported the biggest reduction in C2C (down 15%, or 5.5 days). Each WC component contributed to this improved performance. DPO increased by as much as 10%, notably on the back of extension of payment terms. DSO and DIO were down 3% and 4%, respectively, with a reduction in DIO exacerbated by the impact of falling food prices. Seven out of nine FB companies reported improved WC results in 2013 compared with 2012. In particular, three of these companies achieved year-on-year reductions in C2C of 15 days, 8 days and 7 days, respectively. In contrast, two other FB companies saw increases of five days and two days, respectively.
Further improvement for Brewing. Brewing reported another solid improvement in WC performance in 2013 to reach a negative C2C of five days, three days lower than the year before. Each WC component also contributed to this improved performance, with DSO and DIO down 4% and 1%, respectively, and DPO up 3%. Three brewers out of four registered better WC performance.
Improved results for HPC. There was a further improvement in WC performance for HPC in 2013, with C2C down 5% from its levels of 2012. Progress was driven by a fall in both DIO and DSO (each down 2%). By contrast, payables performance remained unchanged. Five out of seven HPC companies reported improved WC results in 2013. Two of them in particular saw drops in C2C of six days and five days, respectively, while one scored particularly poorly, with an increase of six days.
Chart 2. Change in food price index, 2011–13
*Average of five food group price indices, rebased to 100 on Jan. 2011 Source: Food and Agriculture Organization, United Nations
80
90
100
110
Jan
Feb
Mar
Apr
il
May
June
July
Aug
Sept Oct
Nov De
c
2011 2012 2013
2011
2013
2012
Food price index*

Cash on the table: working capital management in the consumer products industry 2014 5
Continuing reduction in C2C since 2007
Variations in WC performance across the CP industry The CP industry has undergone a period of considerable change in recent years. These changes have been caused by a number of factors, including falling volumes in mature markets and an accelerating shift in demand to fast-growing but volatile emerging markets, rising costs and changes in consumer behavior driven by the new technologies. Competition has been more intense, consumers more focused on value for money, and retailers more demanding in terms of discounts, terms and service levels.
The findings for 2013 mean that the CP industry has managed to achieve a substantial and continuing reduction in its level of C2C since 2007. However, a closer review reveals major differences in the degree and speed with which different companies in each segment have been able to deliver these increased efficiencies.
Table 2. Change in WC metrics across the industry, 2007–13
Change 13/07
Brewing FB HPC
DSO -21% (down 8 days) -13% (down 5 days) -13% (down 5 days)
DIO -10% (down 3 days) -10% (down 3 days) -11% (down 4 days)
DPO 62% (up 23 days) 6% (up 2 days) 31% (up 10 days)
C2C down 34 days -26% (down 11 days) -44% (down 19 days)
Chart 3. Change in C2C per company, 2007–13 (in days)
Source: EY analysis, based on publicly available annual financial statements
-50
-40
-30
-20
-10
0
10
20
1 2 3 4 5 6 7 8 9 10 11 12 13 14 15 16 17 18 19 20
FB HPCBrewing
Against this highly challenging background, each CP segment has managed to reduce its C2C substantially and consistently since 2007. However, it is worth noting that our analysis is based on a selection of large CP companies. These businesses are likely to be in a stronger position than other companies in the same industry to resist pressure from retailers and leverage scale to extract better cash terms from suppliers.
BrewingBrewing reported the biggest improvement in WC performance among the three CP segments, with a drop in C2C of 34 days since 2007. Every brewer reported lower C2C, thanks to a much stronger focus on cash and WC management driven by the need to grow returns and repair balance sheets stretched by aggressive acquisition strategies. Two brewers were the best performers among the 20 CP companies, with reductions in C2C of 49 days and 43 days, respectively.
This rapid progress in WC has been driven by a much-improved payables and receivables performance (DPO up 62% and DSO down 21%), resulting in a DSO-DPO differential that fell from a positive 1 day in 2007 to a negative 30 days in 2013. A negative figure means that brewers are able to collect from customers much faster than they pay their suppliers. DIO was also down 10% over the period.
Overall payables performance benefited from increased centralization and globalization of procurement, as well as from further extension of payment terms.
Industry consolidation played a significant part in boosting WC progress in recent years. Scale provided brewers with the opportunity to achieve significant cash and cost savings by leveraging relationships with customers and suppliers and increasing supply chain efficiencies.
Another significant factor that has influenced WC performance has been the development of sales in fast-growing countries, which now account for half of the total. While fast-growing countries are typically seen as a potential drain on WC, the brewers have been able to grow investment in these markets, while also improving WC performance.

Cash on the table: working capital management in the consumer products industry 20146
Chart 5. DSO (based on sales)*Chart 4. C2C (based on sales)*
However, despite the efforts that have already been made, current WC performance continues to vary widely across the brewing industry. One of the brewers in particular exhibits a negative C2C of as much as 35 days, with most countries where the company is selling in negative territory. This great disparity of performance in
the brewing segment can be partly explained by variations in the way brewers manage their production and distribution models. For example, some are bound by a three-tier distribution system, while others may operate with or without in-house bottling operations.
Chart 7. DPO (based on sales)*
*Averages are sales-weighted Source: EY analysis, based on publicly available annual financial statements
-40
-30
-20
-10
0
10
20
30
40
Average2013
Days
32
23
-5 -8
-35 0
5
10
15
20
25
30
35
40
45
Average2013
Days
40
35 35
30
23
Chart 6. DIO (based on sales)*
0
5
10
15
20
25
30
Average2013
Days
29
25 2523 23
0
10
20
30
40
50
60
70
80
90
Average2013
Days
82
71
61
41
27

Cash on the table: working capital management in the consumer products industry 2014 7
Chart 8. C2C (based on sales)* Chart 9. DSO (based on sales)*
FBThe FB segment has managed to reduce its C2C levels by 26% (or by the equivalent of 11 days) since 2007. Seven out of nine FB companies reported lower C2C. However, a more detailed analysis shows that the segment’s WC performance has been more erratic since the global downturn of 2008, affected by increased volatility in trading conditions and commodity prices.
Each WC component contributed to this overall improvement, with DSO and DIO down 13% and 10%, respectively, and DPO up 6%.
By improving billing and cash collection and driving greater efficiency in supply chain operations, companies in this segment appear to have been relatively successful in mitigating the effects of input cost volatility and continued pressure from
retailers for higher discounts, together with enhanced payments terms and service.
However, it is worth noting that FB continues to exhibit a positive DSO-DPO differential of five days, in contrast with the negative figures reported by both brewing and HPC. This may suggest that the potential for improving both receivables and payables performance remains significant for most companies within that segment (see “Opportunities going forward”).
While significant progress has been achieved, current WC performance continues to vary widely among FB companies. However, the spread of WC metrics is lower than for brewers if we exclude one outlier that exhibits a C2C of just one day (and which boasts best-in-class performance in both payables and inventory).
Chart 11. DPO (based on sales)*
*Averages are sales-weighted Source: EY analysis, based on publicly available annual financial statements
0
10
20
30
40
50
60
Average2013
Days
5148
41
262730
39
2225
00
10
20
30
40
50
60
Average2013
Days
56
38 3734353537
30
21
33
Chart 10. DIO (based on sales)*
0
10
20
30
40
Average2013
Days
39 39
35
29313233
2119
26
0
10
20
30
40
50
60
Average2013
Days
56 55
43
29313536
23
15
27

Cash on the table: working capital management in the consumer products industry 20148
HPCHPC has reported a strong WC showing since 2007 (with C2C dropping by 44%, or by the equivalent of 19 days). Every HPC company but one reported an improvement in WC performance. Among our sample of CP companies, two HPC businesses were among the top four performers, with drops in C2C of 32 days and 30 days, respectively, over that period. However, one HPC company was also the worst performer, with a gain of 11 days.
As with Brewing and FB, progress has come primarily from payables, with DPO up 31% (equivalent to a gain of 19 days). Further increases in DPO can be expected as a number of large HPC companies further extend supplier payment terms, while offering supply chain financing through banks to help them mitigate part of this impact.
Chart 12. C2C (based on sales)*
HPC’s receivables and inventory performance has also improved since 2007, with DSO and DIO down 13% and 11%, respectively. Some HPC companies have pursued a deliberate policy of trading off WC improvements against sales growth by building up inventory to support capacity expansions and sourcing changes, while also improving service levels.
As with other CP segments, current WC performance continues to vary widely among HPC companies. One of these companies in particular exhibits a C2C of just 1 day, boasting best-in-class performance in receivables together with a top quartile performance in payables, while highlighting the potential for further improvement in inventory.
Chart 13. DSO (based on sales)*
Chart 14. DIO (based on sales)* Chart 15. DPO (based on sales)*
*Averages are sales-weighted Source: EY analysis, based on publicly available annual financial statements
-10
0
10
20
30
40
50
60
Average2013
Days
51
3633
24
32 3133
-20
10
20
30
40
50
60
70
Average2013
Days
65
52
41
3034 33
39
21
0
10
20
30
40
50
Average2013
Days
4339
34
2932
3032
27
0
10
20
30
40
50
60
70
Average2013
Days
5853 51
31
4136
45
28

Cash on the table: working capital management in the consumer products industry 2014 9
Pressure easing from retailers on payment terms, but with variations by regionAn analysis of the payables performance of the largest 14 retailers (by sales) in the US and Europe (based on COS) shows a drop in DPO overall (down 8%) since 2007, suggesting that they may have chosen to pay early or negotiate shorter terms.
Of this sample of retailers, those in Continental Europe (four companies) have seen the biggest fall in DPO (down 14%) since 2007, as they were especially hard hit by the regulatory decision to cap payment terms in a number of markets, such as France and Spain. However, their DPO levels remain substantially higher than in other regions.
Over the same period, retailers in the US also reported a drop in DPO, albeit more modest (-3%), with five out of the six companies in our analysis exhibiting a lower DPO in 2013 than in 2007.
In contrast, the DPO of the four UK retailers in our sample has remained almost unchanged since 2007, at levels that are still much lower than in Continental Europe.
Table 3. DPO retailers, 2007–2013
Source: EY analysis, based on publicly available annual financial statements
20
30
40
50
60
70
80
2007
2008
2009
2010
2011
2012
2013
Continental Europe UK US Overall
Opportunities going forwardThe wide variations that our research reveals in WC performance between different CP suppliers in each region point to significant potential for improvement — amounting to an aggregate US$35 billion of cash for the top 20 CP companies.
Part of the performance gap between companies within each region may be a result of differences in country and customer sales mix, manufacturing and supply chain infrastructure, the degree of vertical integration and the nature of supply contracts. Yet, on their own, these factors are not sufficient to explain the size of the gap. This suggests that there are fundamental differences in the degree of management focus on cash and process efficiency between companies within each region.
Our benchmarking analysis suggests that the leading 20 CP companies have between US$19 billion and US$35 billion of cash unnecessarily tied up in WC processes, equivalent to between 3% and 5% of their aggregate sales. Note that the range of cash opportunity overall and for each segment identified in 2013 is close to the level calculated a year before, meaning that the performance gap between leaders and laggards has not materially changed.
This gap has been calculated by comparing the WC performance of each company with that of the average (low estimate) and the upper quartile (high estimate) of its segment peer group. Even at the top of each range, our experience across many projects, industries and geographies shows that a dedicated focus on WC management can often realize results at or above this level.
Table 4. WC cash opportunity per segment, 2013
*WC scope = sum of trade receivables, inventories and accounts payable Source: EY analysis, based on publicly available annual financial statements
Cash opportunityValue (US$b) % WC scope* % sales
Average Upper quartile
Average Upper quartile
Average Upper quartile
Brewing 3 5 9% 17% 3% 5%F&B 10 17 8% 18% 2% 5%HPC 6 13 10% 19% 3% 5%Total 19 35 9% 18% 3% 5%

Case studiesA global FB company had pursued a number of initiatives to improve receivables management during the past few years, but still felt that its performance could be improved much further. An EY project team was engaged to review the existing processes and design an action plan to implement best practices in this area. The planned steps included setting up a collection and dispute management process; designing a receivables management organizational structure that clearly defines roles and responsibilities; introducing reports and metrics to monitor and assess progress; and putting in place the right incentives to motivate and change internal behaviors.
EY was also engaged by another large CP company to implement a global supplier payments extension program. This involved segmenting the supplier base by industry and country; implementing changes to payment terms, trigger and frequency, while ensuring compliance with the latest 2011 European payment directive (including understanding the accepted exceptions to the rules based on location and industry); and documenting the related policies and processes. Recommendations for new standard terms were based on a review of the main suppliers’ median and third-quartile receivables performance.
Cash on the table: working capital management in the consumer products industry 201410
Cash on the table: working capital management in the consumer products industry 2014 11
Driving working capital excellenceAs the pace and scale of industry change continue to escalate, CP companies seeking to achieve further progress in WC will need to focus on a number of key initiatives. These include:
Further streamlining manufacturing and supply chains to drive greater efficiencies, optimize asset utilization and build higher responsiveness into systems and processes
Closer collaboration with customers and suppliers, enabling enhanced demand and supply visibility, improved forecasting accuracy and better supply chain reliability
Better coordination between supply, planning, manufacturing, procurement and logistics functions and processes
Improvements in billing and cash collections by building an effective organizational structure of collections and dispute management, tightening controls around terms and contracts and consolidating billing processes to accelerate invoice production
More effective management of payment terms for customers and suppliers, including renegotiation of terms
Intensification of spend consolidation and standardization by increasing global sourcing while rationalizing the supplier base, developing e-sourcing and reducing complexity in products and processes
Implementation of a larger, more unified shared services organization, comprising processes and functions related to receivables and payables, order-fulfillment and purchasing, human resources, information and legal services
Increased use of VMI practices, enabling better ordering, production, and delivery planning and scheduling for the supplier, and reduced inventory levels and risk of stock-outs for the customer
Alignment of business processes and information systems up and down the value chain to share real-time and accurate supply and demand information
Increased use of financing solutions as a way to provide attractive and flexible alternatives to customers and suppliers
Active management of the trade-offs between cash, cost, service levels and risks (choosing, for example, between customer payment terms and sales price rebates, supplier payment terms and early payment discounts, or inventory levels for consignment stock arrangements and customer service levels) that are sometimes required with various WC strategies
Implementation of more robust supply chain risk management policies by improving network visibility, securing long-term supplies, ensuring dual sourcing and monitoring the financial viability of key suppliers
Tracking and monitoring WC metrics and linking compensation to these metrics

Cash on the table: working capital management in the consumer products industry 201412
EY’s global network of professionals helps clients to identify, evaluate and prioritize realizable improvements to liberate cash from WC through sustainable changes to policy, process, metrics and procedure adherence.We can assist organizations in their transition to a cash-focused culture and help implement the relevant metrics. We can also identify areas for improvement in cash flow forecasting practices and then assist in implementing processes to improve forecasting and frameworks to sustain those improvements.
Companies that undertake WC improvement initiatives often realize a high return on investment. In addition to increased levels of cash, significant cost benefits may also arise from process optimization, through reduced transactional and operational costs, and from lower levels of bad and doubtful debts and inventory obsolescence. Our WC professionals are there to help wherever you do business.
How EY can help
Cash on the table: working capital management in the consumer products industry 2014 13
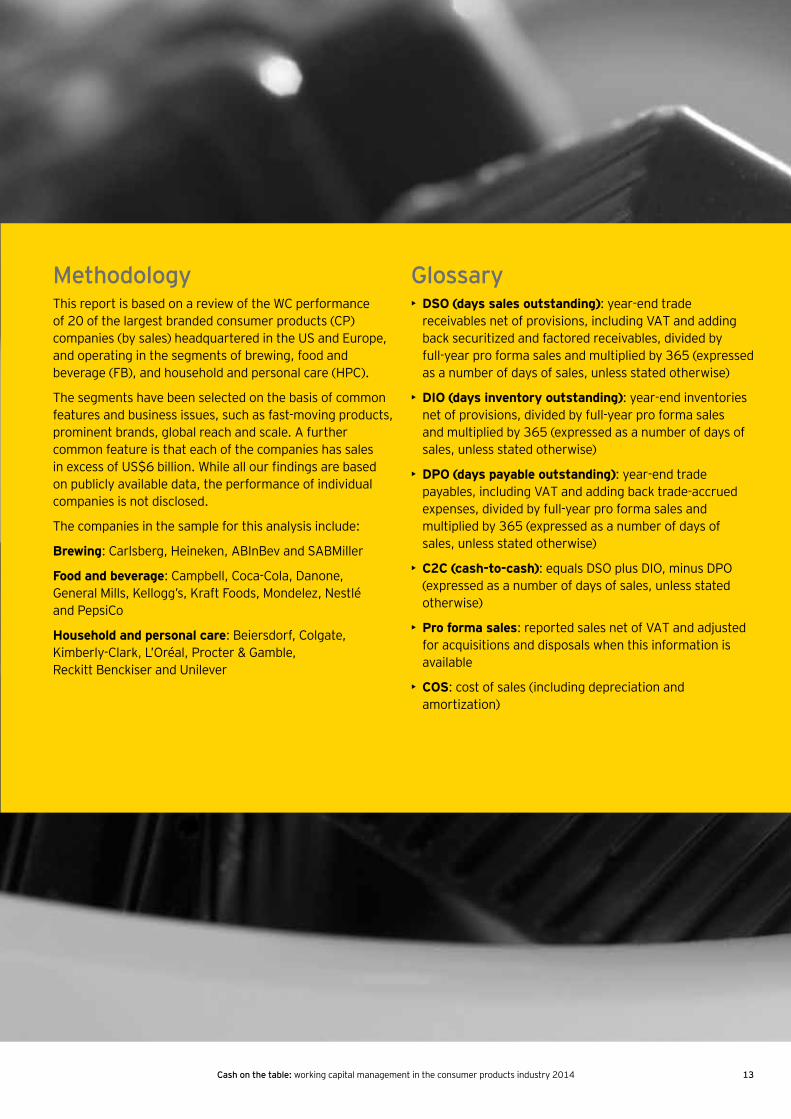
MethodologyThis report is based on a review of the WC performance of 20 of the largest branded consumer products (CP) companies (by sales) headquartered in the US and Europe, and operating in the segments of brewing, food and beverage (FB), and household and personal care (HPC).
The segments have been selected on the basis of common features and business issues, such as fast-moving products, prominent brands, global reach and scale. A further common feature is that each of the companies has sales in excess of US$6 billion. While all our findings are based on publicly available data, the performance of individual companies is not disclosed.
The companies in the sample for this analysis include:
Brewing: Carlsberg, Heineken, ABInBev and SABMiller
Food and beverage: Campbell, Coca-Cola, Danone, General Mills, Kellogg’s, Kraft Foods, Mondelez, Nestlé and PepsiCo
Household and personal care: Beiersdorf, Colgate, Kimberly-Clark, L’Oréal, Procter & Gamble, Reckitt Benckiser and Unilever
Glossary• DSO (days sales outstanding): year-end trade
receivables net of provisions, including VAT and adding back securitized and factored receivables, divided by full-year pro forma sales and multiplied by 365 (expressed as a number of days of sales, unless stated otherwise)
• DIO (days inventory outstanding): year-end inventories net of provisions, divided by full-year pro forma sales and multiplied by 365 (expressed as a number of days of sales, unless stated otherwise)
• DPO (days payable outstanding): year-end trade payables, including VAT and adding back trade-accrued expenses, divided by full-year pro forma sales and multiplied by 365 (expressed as a number of days of sales, unless stated otherwise)
• C2C (cash-to-cash): equals DSO plus DIO, minus DPO (expressed as a number of days of sales, unless stated otherwise)
• Pro forma sales: reported sales net of VAT and adjusted for acquisitions and disposals when this information is available
• COS: cost of sales (including depreciation and amortization)

Cash on the table: working capital management in the consumer products industry 201414
Consumer Products Deals Quarterly Margin unlockedIntegrated margin management to deliver breakthrough performance in consumer products.
Find out more at www.ey.com/cp-marginsFind out more at www.ey.com/consumerproducts
Global Capital Confidence Barometer
Our 10th Global Capital Confidence Barometer clearly illustrates the many complex challenges on today’s boardroom agenda. Leading corporates are focusing on striking a balance between growth and cost reduction.
Find out more at www.ey.com/ccb
Global Corporate Divestment Study: strategic divestments drive value
Find out more at www.ey.com/transactions
Selling assets and reshaping portfolios can help global companies navigate uncertainty, maximize growth opportunities and create value for their stakeholders. Learn how.
CPDQ focuses on the global transaction landscape in the four key CP subsectors (beverage, tobacco, food and household and personal care) and is produced on a quarterly basis. It includes an analysis of the deals over the last quarter, insights on the drivers behind them and views on what the future may hold.
Further reading
Cash on the table: working capital management in the consumer products industry 201414

Cash on the table: working capital management in the consumer products industry 2014 15
Contacts
Global Consumer Products Center contacts
Working Capital Services contacts
Cash on the table: working capital management in the consumer products industry 2014 15
Country Local contact Telephone/emailUK&I Jon Morris +44 20 7951 9869
Matthew Evans +44 20 7951 7704
Paul New +44 20 7951 0502
Marc Loneux +44 20 7951 3784
Americas Steve Payne +1 212 773 0562
US Edward Richards +1 212 773 6688
Peter Kingma +1 312 879 4305
Mark Tennant +1 212 773 3426
Eric Wright +1 408 947 5475
Australia Wayne Boulton +61 3 9288 8016
Canada Simon Rockcliffe +1 416 943 3958
[email protected] Stepanuik +1 416 943 2752
Asia Alvin Tan +65 6309 8030
France Benjamin Madjar +33 1 55 61 00 67
Germany Dirk Braun +49 6196 996 27586
[email protected] Wenders +49 211 9352 13851
[email protected] Danny Siemes +31 88 407 8834
Latin America Matias De San Pablo +5411 4318 1542
Sweden Johan Nordström +46 8 5205 9324
Peter Stenbrink +46 8 5205 [email protected]
Finland Gösta Holmqvist +358 207 280 [email protected]
Local contact Telephone/emailGlobal
Global Consumer Products Leader
Mark Beischel +1 513 612 [email protected]
Global Consumer Products Transaction Advisory Services Leader
Gregory J. Stemler +1 312 879 [email protected]
Global Consumer Products Emerging Markets Leader
Kristina Rogers +90 212 315 [email protected]
Global Consumer Products Lead Analyst
Andrew Cosgrove +44 20 7951 [email protected]

About EYEY is a global leader in assurance, tax, transaction and advisory services. The insights and quality services we deliver help build trust and confidence in the capital markets and in economies the world over. We develop outstanding leaders who team to deliver on our promises to all of our stakeholders. In so doing, we play a critical role in building a better working world for our people, for our clients and for our communities.
EY refers to the global organization, and may refer to one or more, of the member firms of Ernst & Young Global Limited, each of which is a separate legal entity. Ernst & Young Global Limited, a UK company limited by guarantee, does not provide services to clients. For more information about our organization please visit ey.com.
How EY’s Global Consumer Products Center can help your business Consumer products companies are operating in a brand new order, a challenging environment of spiraling complexity and unprecedented change. Demand is shifting to rapid-growth markets, costs are rising, consumer behavior and expectations are evolving, and stakeholders are becoming more demanding. To succeed, companies now need to be leaner and more agile, with a relentless focus on execution. Our Global Consumer Products Center enables our worldwide network of more than 16,000 sector-focused assurance, tax, transaction and advisory professionals to share powerful insights and deep sector knowledge with businesses like yours. This intelligence, combined with our technical experience, can assist you in making more informed strategic choices and help you execute better and faster.
© 2014 EYGM Limited. All Rights Reserved.
EYG no. EN0597CSG/GSC2014/1356035ED None
In line with EY’s commitment to minimize its impact on the environment, this document has been printed on paper with a high recycled content.
This material has been prepared for general informational purposes only and is not intended to be relied upon as accounting, tax, or other professional advice. Please refer to your advisors for specific advice.
ey.com
EY | Assurance | Tax | Transactions | Advisory