case study: the use of in-situ testing to optimize slope...
TRANSCRIPT

Proceedings of the 2005 Mid-Continent Transportation Research Symposium, Ames, Iowa, August 2005. © 2005 by Iowa State University. The contents of this paper reflect the views of the author(s), who are responsible for the facts and accuracy of the information presented herein.
Use of In Situ Testing to Optimize Slope Design in Highly Weathered Shale Emad Farouz CH2M HILL 13921 Park Center Road, Suite 600 Herndon, VA 20171 [email protected] Bhooshan Karnik CH2M HILL 6200 Aurora Ave., Suite 400W Des Moines, IA 50322 [email protected] Robert Stanley Iowa Department of Transportation 800 Lincoln Way Ames, IA 50010 [email protected] ABSTRACT
Slope stability of embankments bearing over highly weathered shale encountered at shallow depths is a major concern in roadway design. This condition was encountered at a bridge location in southeastern Iowa, where the proposed 120.5-meter x 12.0-meter creek crossing dual bridges are part of a four-lane state highway. The maximum height of the embankment at the north abutment location is approximately 12 meters and 8 meters at the south abutment location, with 3H:1V slopes in the longitudinal and transverse directions. Conventional soil borings with standard penetration testing indicated the presence of weathered shale at very shallow depths, in some cases as shallow as 0.9 meters. The subsurface profiles indicated the presence of sloping shale at both the north and south abutments overlain by sandy lean clay. The average slope ratio of the top of the shale is approximately 10H:1V at the north abutment location and 3H:1V at the south abutment location. As per Iowa DOT guidelines, a 0.3-meter-thick layer of highly weathered shale was assumed at the clay/weathered shale interface and assigned undrained shear strength of 10kPa. Slope stability analyses indicated global slope instability with failure surfaces propagating through the sloping and highly weathered shale layer. As a result, various ground improvement, retaining wall, and increased bridge length alternatives were evaluated. These alternatives were estimated to cost between $3,000,000 and $5,000,000. In view of these high costs, an additional comprehensive subsurface exploration and testing program was developed and executed at the site to verify that the shear strength parameters, especially with respect to the highly weathered shale, were reasonable. The supplemental program consisted of conducting 35 in situ Iowa borehole shear tests at various depths in the 10 boreholes, particularly at the shale-clay interface. Slope stability analyses were performed using SLIDE software, including probabilistic analyses to evaluate the probability of potential global slope instability. The analyses indicated the slopes to be stable under both short-term (end of construction) and long-term (drained) conditions. The judicious use of in situ testing in addition to conventional laboratory testing resulted in the elimination of potential high-cost alternatives and kept the project within budget limits.
Key words: highly weathered shale—in situ testing—shear strength of shale—slope stability

Farouz, Karnik, Stanley 2
INTRODUCTION
Dual 120.5-meter x 12.0-meter pretensioned prestressed concrete beam bridges spanning a creek have been proposed as part of a four-lane facility in southeastern Iowa. Approach embankment fills on both the north and south sides of the creek with pile-supported abutments were planned to support the bridges. However, slope stability analyses performed for the slopes in front of the abutments indicated potential global instability with failure surfaces propagating through the sloping and highly weathered shale, which was assigned a shear strength parameter, c, of 10kPa, in accordance with Iowa DOT guidelines. As a result, various alternatives were developed. These alternatives were evaluated and estimated to cost between $3,000,000 to over $5,000,000. In view if these high costs, a comprehensive supplemental subsurface exploration and testing program was developed and executed at the site to verify that the shear strength parameters utilized in the slope stability analyses, especially with respect to the highly weathered shale, were reasonable. The additional cost of this program was approximately $60,000. The program was also executed to develop more realistic, site-specific data to optimize the design and justify and/or possibly reduce proposed mitigation measures and its estimated cost.
This paper summarizes the subsurface exploration, in situ testing and laboratory testing performed at the site. The paper also discusses the interpretation of the field and laboratory results, recommended design parameters, slope stability analyses performed, the authors’ final design recommendations, and conclusions from the study.
GEOLOGY
The soils in the county where the project site is located are formed in glacial till, loess, and alluvium. The major glacial till deposits of the pre-Wisconsin age are the Nebraskan and Kansan glacial tills. Wisconsin-age loess covers most of the county and is an extensive parent material. Alluvium in this county is derived from loess and glacial till. In some areas, the streams are still cutting through shale and the flood plains are narrower and have a steeper gradient. The alluvium encountered in these areas is commonly coarser. Shale is the oldest parent material in the county. It comprises a series of beds deposited during the Des Moines sedimentary cycle in the Pennsylvanian period (USDA 1977).
At the bridge location, the drainage basin has incised through the glacial overburden down into the bedrock. Ridge tops are capped with loess-derived soils, and farther down the slopes, the paleosol- and till-derived soils are present. The soils formed on the paleosol consist of silty clays, clays, and clay loams that are characteristically poorly drained, have a low permeability, a high water capacity, a high seasonal water table, and high shrink-swell potential. Below the glacial materials, bedrock is exposed and/or mantled by a thin veneer of soil. The bedrock primarily consists of clay shale, with sandstone and thin limestone layers. The slopes on these soils are moderately to very steep and runoff is rapid. The bedrock surface closely parallels the existing ground surface. As a result, the thickness of the overburden does not increase appreciably as the ground rises in elevation, especially at the south side of the creek.
INITIAL SUBSURFACE EXPLORATION AND TESTING AND DESIGN ALTERNATIVES
The initial subsurface exploration program was completed in 2001. The program involved the drilling of 16 borings that were located based on the Iowa DOT guidelines for bridge borings. The borings were drilled using 2.25-inch inside diameter hollow stem augers. All borings were terminated in shale and cores were obtained from four borings. Representative disturbed samples of the materials encountered in the borings were obtained with a standard two-inch outside diameter split-spoon sampler. Standard penetration tests (SPTs) were performed at five-foot intervals for the depth of the borings. Relatively

Farouz, Karnik, Stanley 3
undisturbed Shelby tube samples were obtained from various representative soil and weathered shale layers. Unconfined shear strength of select soil samples was estimated by testing with a pocket penetrometer.
A typical subsurface profile is presented in Figure 1. The subsurface profile consisted of a layer of sandy lean clay overlying a layer consisting of a mix of sand and clayey sand with gravel. This sand-clay layer was underlain by a layer of highly weathered shale. In general, the top of the highly weathered shale paralleled the ground surface. At the south side of the creek, the highly weathered shale was encountered within one to two meters below the ground surface.
Initial Soil Parameters
The soil parameters to be used in the slope stability analyses were developed based on the results of the laboratory tests and generally accepted correlations with the SPT N-values. The highly weathered shale layer was assigned an undrained shear strength value of 10kPa based on Iowa DOT guidelines. The soil parameters used in the slope stability analyses are presented in Table 1.
Table 1. Initial shear strength parameters (undrained)
Layer UW Strength Type c (kPa) φ (deg) Remarks
Fill* 20 Mohr-Coulomb 29 12 Value as per Iowa DOT guidelines
Sandy Clay 20 Undrained 27 - Data from single test
h.w.sh. 20 Undrained 10 - Value as per Iowa DOT guidelines
m.w.sh. 22 Undrained 50 - Assumed s.w.sh. 23 Undrained 200 - Assumed
* Fill is assumed to be compacted and drained during installation. h.w.sh.= highly weathered shale, m.w.sh.= moderately weathered shale, s.w.sh.= slightly weathered shale Initial Slope Stability Analyses
Stability of the embankment slopes was evaluated using the computer program WinStabl. A total of four sections (two in transverse directions along the north abutment, one in the transverse direction at the south abutment, and one in the longitudinal direction along the south abutment) were analyzed for slope stability. Each section was analyzed for the undrained (end of construction) loading. A typical WinStabl output is presented in Figure 2 and a summary of the analysis results is presented in Table 2.
The analysis indicated potential global slope instability with failure surfaces propagating through the sloping and highly weathered shale.

Farouz, Karnik, Stanley 4
Figure 1. Subsurface profile, 2001 exploration (typical)
A
ll di
men
sion
s in
met
ers (
m).

Farouz, Karnik, Stanley 5
Figure 2. Typical WinStabl output (undrained analysis)
Table 2. Stability analyses results using initial shear strength parameters (undrained analysis)
Location of Slope Section Analyzed
Search Method Factor of Safety Remarks
Circular 0.7 North Abutment Transverse (Right) Sta.177+84 Block 0.7
Circular 0.7 North Abutment Transverse(Left) Sta.177+84 Block 0.6
Circular 0.9 South Abutment Profile (NBL) Block 0.7
Circular 1.5 South Abutment Transverse (Right) Sta.179+04 Block 1.0 Potential block failure
Conceptual Design Alternatives
As a result of the initial slope stability analyses, various ground improvement measures and retaining wall alternatives were evaluated. The evaluation included the feasibility and constructability, cost, and potential risks of the different alternatives. The total cost (TC) of each alternative included the entire support system, but excluded the cost of the bridge above the pile cap. This was done in order to provide a relevant comparison between some alternatives that provided foundations for the bridge abutments and support for the embankment, while others only provided embankment support to increase global stability.
Each alternative was assigned a risk factor (RF), ranging from 1 to 5, with 5 representing the highest risk. A suitability index (SI) was developed to compare the risk with the total cost using the following formula:
SI = 1/[(TC in million dollars)*SQRT(RF)]
Farouz, Karnik, Stanley 6
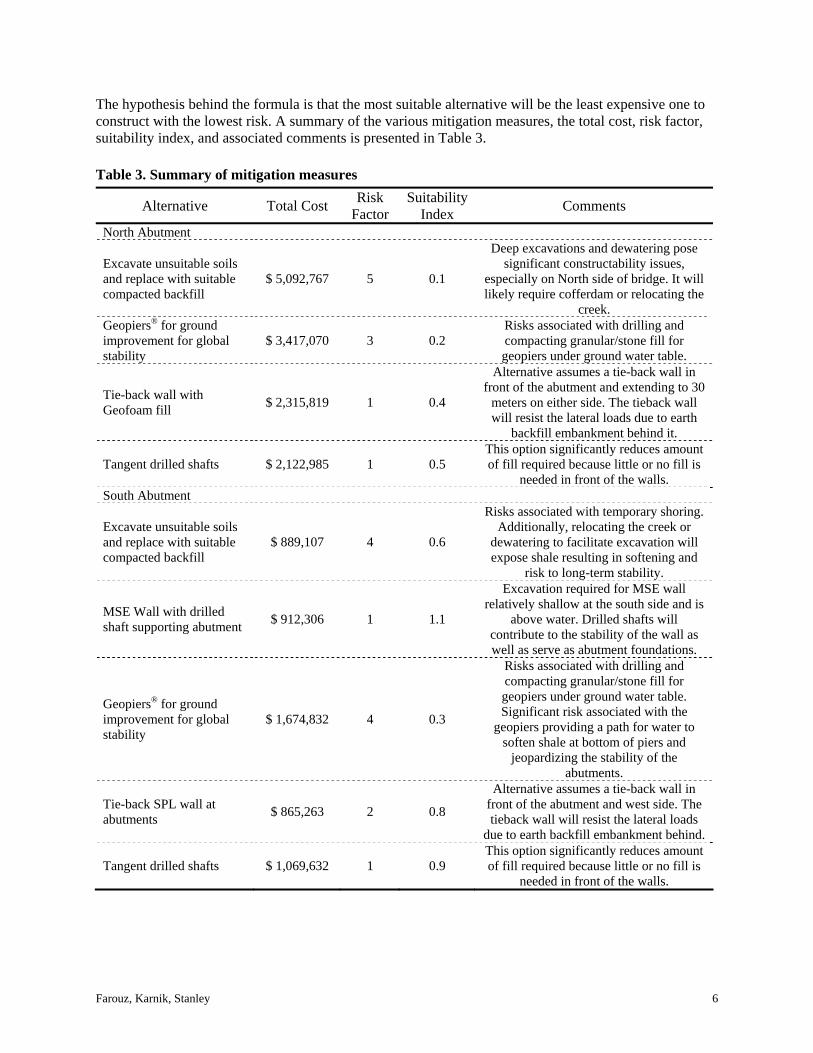
The hypothesis behind the formula is that the most suitable alternative will be the least expensive one to construct with the lowest risk. A summary of the various mitigation measures, the total cost, risk factor, suitability index, and associated comments is presented in Table 3.
Table 3. Summary of mitigation measures
Alternative Total Cost Risk Factor
Suitability Index Comments
North Abutment
Excavate unsuitable soils and replace with suitable compacted backfill
$ 5,092,767 5 0.1
Deep excavations and dewatering pose significant constructability issues,
especially on North side of bridge. It will likely require cofferdam or relocating the
creek. Geopiers® for ground improvement for global stability
$ 3,417,070 3 0.2 Risks associated with drilling and compacting granular/stone fill for geopiers under ground water table.
Tie-back wall with Geofoam fill $ 2,315,819 1 0.4
Alternative assumes a tie-back wall in front of the abutment and extending to 30
meters on either side. The tieback wall will resist the lateral loads due to earth
backfill embankment behind it.
Tangent drilled shafts $ 2,122,985 1 0.5 This option significantly reduces amount of fill required because little or no fill is
needed in front of the walls. South Abutment
Excavate unsuitable soils and replace with suitable compacted backfill
$ 889,107 4 0.6
Risks associated with temporary shoring. Additionally, relocating the creek or
dewatering to facilitate excavation will expose shale resulting in softening and
risk to long-term stability.
MSE Wall with drilled shaft supporting abutment $ 912,306 1 1.1
Excavation required for MSE wall relatively shallow at the south side and is
above water. Drilled shafts will contribute to the stability of the wall as well as serve as abutment foundations.
Geopiers® for ground improvement for global stability
$ 1,674,832 4 0.3
Risks associated with drilling and compacting granular/stone fill for geopiers under ground water table. Significant risk associated with the
geopiers providing a path for water to soften shale at bottom of piers and
jeopardizing the stability of the abutments.
Tie-back SPL wall at abutments $ 865,263 2 0.8
Alternative assumes a tie-back wall in front of the abutment and west side. The tieback wall will resist the lateral loads
due to earth backfill embankment behind.
Tangent drilled shafts $ 1,069,632 1 0.9 This option significantly reduces amount of fill required because little or no fill is
needed in front of the walls.

Farouz, Karnik, Stanley 7
ADDITIONAL SUBSURFACE INVESTIGATION PROGRAM
Due to the significant costs associated with the various mitigation measures presented in Table 3, a supplemental subsurface exploration program was executed in 2004 to verify the shear strength parameters of the highly weathered shale and to obtain the in situ shear strength parameters. The 2004 program involved the drilling of 10 borings in and around the creek location. The borings were located to maximize the possible coverage of the area likely to require remediation measures. In situ testing comprising the Iowa borehole shear test (BST) was conducted at various depths and in the different layers encountered, especially at or near the soil-highly weathered shale interface, to obtain the in situ drained shear strength parameters. The depths of the soil-highly weathered shale interface were estimated based on the 2001 subsurface profiles and by obtaining split-spoon samples. Each boring was terminated in slightly weathered shale after coring for 1.5 meters. BSTs with high pressure plates or rock BSTs were conducted to obtain the strength values in moderately and slightly weathered shale layers. A total of 35 soil and rock BSTs were performed as part of this field exploration. Water levels in the borings were recorded after at least 24 hours after the end of drilling. Relatively undisturbed Shelby tube samples were usually obtained immediately below the interface or at the interface by drilling in an adjacent location.
Iowa Borehole Shear Test
The Iowa BST was developed by Dr. R. L. Handy at Iowa State University in 1967 (Handy and Fox 1967). The test is a drained shear test where the soil is relatively free-draining, since the drainage path from the shear head serration is short, and when the test is performed in the displacement range of about 0.5 mm/min or less. The test is applicable for all fine-grained soils and may be done even where a trace of gravel is present (Bowles 1997). The BST is a staged test, repeatedly consolidating and shearing the soil in essentially the same position in the boring. Drainage times, therefore, are cumulative.
The philosophy of the test is to perform a shear test in situ on the sides of a three-inch–diameter borehole in order to obtain independent measurements of soil friction and cohesion. An expandable shear head with diametrically opposed serrated shear pressure plates is lowered into the borehole to the desired depth. The serrations on the plates are oriented perpendicular to the axis of the hole. A constant normal force is then applied to the plates, causing the plates to grip the sides of the borehole. After a 5- to 15-minute waiting period to allow the surrounding soil to consolidate, the soil is sheared by pulling the shear head upwards until a peak shear force is recorded (Lutenegger and Timian 1987). Thus, a single point on the Mohr-Coulomb failure surface is obtained. The test is repeated to obtain additional data points at successively higher normal stresses to obtain a Mohr-Coulomb failure surface. The standard pressure plates may be replaced by smaller, high-pressure plates if the test is to be conducted in stiff or firm soils or soft shale. The philosophy behind the rock BST is similar to the soil BST. The few notable differences being that the apparatus used is slightly differently and modified to fit the rock core hole and the shear stress is applied by means of a hydraulic jack. Unlike the soil BST, the rock BST is not a staged test. The shear head apparatus is retrieved after each test, cleaned, rotated about 45 degrees, and then re-inserted into the hole to obtain the next failure point at a higher normal stress than the previous point. The test is repeated until a failure surface is obtained.
Laboratory Testing
The 2004 testing program consisted of six consolidated-undrained (CIU) triaxial tests with pore pressure measurements, one consolidated-drained (CD) test, five direct shear (DS) tests, one consolidation test,

Farouz, Karnik, Stanley 8
and four unconfined compression (UC) tests on rock cores. All testing for the 2004 program was done as per applicable ASTM standards.
SUBSURFACE CONDITIONS
The final subsurface profiles developed for the bridges are based on the combined data available from the 2001 and 2004 exploration programs. The data were used to reevaluate and modify the 2001 subsurface profile. The final profiles indicate a substantial difference in the subsurface conditions between the north and south sides of the creek. The generalized subsurface profiles along the north and south sides of the creek are presented in Figures 3 and 4, respectively. A typical final profile is presented in Figure 5.
Figure 3. Generalized subsurface profile (north of creek)
Figure 4. Generalized subsurface profile (south of creek)

Farouz, Karnik, Stanley 9
Figure 5. Final subsurface profile (typical)
A
ll di
men
sion
s in
met
ers (
m)

Farouz, Karnik, Stanley 10
INTERPRETATION OF RESULTS AND RECOMMENDED DESIGN PARAMETERS
BSTs were performed to obtain the drained shear strength parameters of the various soil and shale layers to estimate the shear strength of the layers under long-term drained loading. The main advantage of performing the BST as compared to the conventional laboratory tests is testing the soil in its in situ state of stress, thereby minimizing the uncertainty in soil parameters associated with sampling disturbance.
Laboratory tests, such as the DS tests and the CD test, were performed on samples obtained at or near the BST locations to compare the results with the BST results. These results were sorted according to the various layers. For each layer, the average values of the cohesion and friction angles and their respective standard deviations were calculated. The standard deviation is a measure of how widely the values are dispersed from the average values. The test results from the layers that will be excavated and replaced with fill as part of a settlement mitigation measure were not included in the statistical calculations. Table 4 presents a summary of the strength parameters sorted according to the various layers.
Table 4. Summary of drained (effective stress) shear strengths (sorted per layer)
BST Results
CIU test results
DS test results
Soil Depth (m) φ'
(deg.) c'
(kPa)φ'
(deg.)c'
(kPa)φ'
(deg.)c'
(kPa)
Remarks
clay 0.9–6.80 18 39 25 7 S.D. 2 18
h.w.sh 0.6–10.30 16 42 24 7 S.D. 5 17
limestone /shale 2.92 21 0 Assume c'=0.
m.w.sh 3.20–10.50 20 82 20 19
S.D. 9 113 2 8
s.w.sh 7.80–12.50 23 675
S.D. 11 1254 S.D.= standard deviation h.w.sh.= highly weathered shale, m.w.sh.=moderately weathered shale, s.w.sh.=slightly weathered shale Table 5. Summary of undrained (total stress) shear strengths (sorted per layer)
CU/CIU test results1 UC test results Soil Depth (m) φ (deg) c (kPa) Su (kPa)
Remarks
clay 1.20-5.40 11 51 S.D. 7 51
h.w.sh. 5.80-6.40 15 19 s.w.sh. 7.40-11.80 605 S.D. 569
1 CU tests done on samples from 2001 exploration program

Farouz, Karnik, Stanley 11
CU, CIU, and UC tests were performed to obtain the undrained shear strength of the soil and shale under end-of-construction or short-term loading. The results were sorted according to the various soil layers. For each layer, the average values of cohesion and friction angle and their respective standard deviations, where applicable, were calculated. The test results from the layers that will be excavated and replaced with fill as part of a settlement mitigation measure were not included in the statistical calculations. Table 5 presents a summary of the strength parameters sorted according to the various layers. The recommended design parameters under drained and undrained conditions for each layer for use in the global slope stability analyses are presented in Tables 6 and 7, respectively. The authors feel that these values are appropriate, since they reflect the stress state of the soil at the creek location and are therefore more realistic. Table 6. Recommended design shear strength parameters (drained)
Layer UW Strength type
c’ (kPa)
φ’ (deg)
Std. dev.1 (c’/φ’)
Rel. min.2 (c’/φ’)
Rel. max.2 (c’/φ’) Remarks
Fill* 20.4 Mohr-Coulomb 29 12 Iowa DOT
guidelines
Clay w/ sand 20 Mohr-Coulomb 39 18 18/2 16/2 25/3
Sand and silt 19 Mohr-Coulomb - 30
h.w.sh. 21 Mohr-Coulomb 42 16 17/5 21/5 24/7
m.w.sh. 21 Mohr-Coulomb 82 20 113/9 76/9 252/18
s.w.sh.3 21 Mohr-Coulomb 675 23
Limestone** 22 Mohr-Coulomb - 21
BST at shale/Lst interface
Table 7. Recommended design shear strength parameters (undrained)
Layer UW Strength Type
c (kPa)
φ (deg)
Std. Dev.1 (c/φ)
Rel. Min.2 (c/φ)
Rel. Max.2 (c/φ) Remarks
Clay w/ sand 20 Mohr-Coulomb 51 11 51/7 37/8 59/12
Sand and silt 19 Mohr-Coulomb - 30 Assumed
h.w.sh. 21 Mohr-Coulomb 19 15 Data from
single test m.w.sh.3 21 Undrained 100 - Assumed
s.w.sh.3 21 Undrained 605 - Average
value from UC
Limestone** 22 Undrained 150 - Assumed 1 The standard deviation is a measure of how widely values are dispersed from the average value (the mean). 2 The relative minimum and maximum values are the difference between the average value and the minimum and maximum
values respectively. * Fill is assumed to be compacted and drained during installation. ** Limestone layer encountered at south abutment locations only. 3 Since the average shear strengths of moderately weathered shale and slightly weathered shale are either assumed as
indicated or dispersed over a high range, no statistical distribution is recommended for these layers.

Farouz, Karnik, Stanley 12
SLOPE STABILITY ANALYSES
Stability of the embankment slopes was evaluated using the computer program SLIDE. SLIDE is a 2D slope stability program for evaluating the stability of circular or non-circular failure surfaces in soil or rock slopes. SLIDE analyzes the stability of slip surfaces using vertical slice limit equilibrium methods. In a traditional slope stability analysis, it is assumed that the values of all model input parameters are known exactly, or average values are used. Hence, for a given slip surface, a single safety factor value is calculated. This type of analysis is referred to as a deterministic analysis.
In a probabilistic slope stability analysis, statistical distributions can be assigned to model input parameters, such as material properties, support properties, loads, water table location, etc. to account for the degree of uncertainty in the parameters. Input data samples are randomly generated based on the user-defined statistical distributions. A given slip surface may then have many different safety factor values calculated. The result is a distribution of safety factors from which a probability of failure (PF) for the slope can be calculated (Rocscience 2003).
Global Minimum Method
The global minimum probabilistic analysis in SLIDE is commonly used in slope stability analysis. With this method, the deterministic slope stability analysis is first carried out to determine the slip surface with the overall (global minimum) factor of safety for all the slip surfaces analyzed.
The probabilistic analysis is then carried out on the global minimum slip surface, using the samples generated for each random variable. This means that the slope stability calculation is repeated N times (where N = number of samples) for the global minimum slip surface. This will result in N calculated safety factors. The PF is then the number of analyses that result in a safety factor less than the minimum desired value, divided by the total number of samples. Each analysis method in SLIDE (e.g., Bishop, Janbu, etc.) can result in a different global minimum slip surface. Hence, the probabilistic analysis is carried out independently on each global minimum slip surface which may result from each analysis ethod.
The global minimum probabilistic analysis assumes that the PF calculated for the (deterministic) global minimum slip surface is representative of the PF for the entire slope.
A total of seven critical sections (one along each lane per abutment in the longitudinal direction, two in the transverse direction along the north abutment, and one in the transverse direction at the south abutment) were analyzed for global slope stability. Each section was analyzed for the undrained (end-of-construction) loading and the drained (long-term) loading case. For each case, each section was further analyzed for slope stability for circular and non-circular failure surfaces using modified Bishop and corrected Janbu methods. The sections at the south abutment locations were analyzed while assuming the existing soils and highly weathered shale would be excavated and replaced with fill as part of a settlement mitigation measure.
Undrained (End-of-Construction) Analyses
Global slope stability analyses for the undrained loading condition were performed on the seven sections as described in the preceding section using the recommended undrained design parameters for the various soil layers, as presented in Table 7. The analyses were performed assuming the water table to be static and

Farouz, Karnik, Stanley 13
as shown in the subsurface profiles. The 24-hour water levels were considered as the water table surface. For clayey soils, the increase in undrained shear strength due to consolidation under the embankment fill was ignored. The analyses were performed assuming a uniformly distributed load of 51kN/m to be acting on the roadway surface to account for the 2.5-meter–high temporary surcharge recommended as part of the settlement analysis. The results of the SLIDE analyses are presented in Table 8 and a typical graphical output is presented in Figure 6.
Table 8. Stability analyses results using recommended shear strength parameters (undrained analysis)
Location of slope section analyzed
Search method
FS with average measured shear
strength (deterministic)
Minimum FS with average
measured shear strength and
statistical distribution
Average FS with average
measured shear strength and
statistical distribution
PF with average
measured shear strength and
statistical distribution
(%)
Remarks
Circular 1.5 1.3 1.5 1.3 North abutment profile (NBL) Block 1.4 1.2 1.4 12.8
Circular 1.5 1.2 1.5 3.1 North abutment profile (SBL) Block 1.4 1.2 1.4 10.5
OK
Circular 1.8 1.3 1.8 <0.1 North abutment transverse (right)
Sta.177+82 Block 1.7 1.3 1.7 <0.1 Circular 1.7 1.5 1.8 <0.1 North abutment
transverse (left) Sta.177+82 Block 1.6 1.4 1.6 <0.1
Circular 1.7 1.7 1.7 <0.1 South abutment profile (NBL) Block 1.5 1.5 1.5 <0.1
Circular 1.7 1.7 1.7 <0.1 South abutment profile (SBL) Block 1.6 1.6 1.6 <0.1
Circular 2.2 2.2 2.2 <0.1 South abutment transverse (right)
Sta.179+04 Block 2.0 2.0 2.0 <0.1 Notes: 1. South Abutment analysis done assuming clay, sand, and h.w.sh. layer excavated and replaced with fill. 2. A UD dead load of 51kN/m due to 2.5-meter–high temporary surcharge was assumed to be acting on the embankment
fill at the north abutment location. 3. Error codes generated by SLIDE have been checked and found not to have any impact on the results.
As presented in Table 8, the slopes appear to be stable, with safety factors greater than the Iowa DOT minimum of 1.3 and with a P.F. less than 0.1 for all sections except the sections along the north abutment profile under both lanes. For these sections, the deterministic safety factor is greater than 1.3. However, the minimum safety factor is less than 1.3 for the probabilistic analysis, with the highest PF of 12.8% for the section at the northbound lane in block failure with a safety factor of 1.2. It is the authors’ opinion that these PFs are acceptable, especially since the deterministic safety factors are greater than 1.3 and the minimum safety factors are greater than 1.0. These PF values are also acceptable, since the analysis has been carried out assuming a temporary surcharge on the embankment fill, and the slopes should be stable with safety factors higher than 1.3 once the surcharge has been removed.

Farouz, Karnik, Stanley 14
Figure 6. Typical SLIDE output (undrained analysis)
Figure 7. Typical SLIDE output (drained analysis)

Farouz, Karnik, Stanley 15
Drained (Long-Term) Analyses
Global slope stability analyses for the drained loading case were performed on the seven sections using the recommended drained design parameters and statistical distributions for the various soil layers, as presented in Table 6. The drained case (long-term) loading condition was analyzed assuming a uniformly distributed live traffic load of 11.49kN/m acting on the roadway surface. Statistical distribution was assumed for the water table by assuming the water table to vary between the 24-hour levels recorded during the 2004 exploration as a minimum and the 500-year flood level as a maximum. An exponential distribution was used to simulate the occurrence of the 500-year flood level (i.e., the majority of samples would be generated closer to the minimum water table location, and the maximum water table location would only have a small probability of occurring).
A typical graphical output is presented in Figure 7 and the results of the analyses are presented in Table 9. As presented in Table 9, the slopes appear stable under the long-term conditions, with safety factors greater than 1.3 and PFs less than 0.1.
Table 9. Stability analyses results using recommended shear strength parameters (drained analysis)
Location of slope analyzed
Search method
FS with average
measured shear strength (deterministic)
Minimum FS with average
measured shear strength and statistical distribution
Average FS with average
measured shear strength and statistical distribution
PF with average
measured shear strength and
statistical distribution
(%)
Remarks
Circular 1.7 1.6 1.8 <0.1 North abutment arofile (NBL) Block 1.8 1.7 1.8 <0.1
Circular 1.8 1.7 1.9 <0.1 North abutment profile (SBL) Block 1.7 1.4 1.8 <0.1
Circular 2.2 2.1 2.2 <0.1 North abutment transverse (right)
Sta.177+82 Block 2.1 1.7 2.2 <0.1 Circular 2.0 2.0 2.0 <0.1 North abutment
transverse (left) Sta.177+82 Block 2.0 1.6 2.0 <0.1
Circular 1.7 1.6 1.7 <0.1 South abutment profile (NBL) Block 1.5 1.5 1.6 <0.1
Circular 1.7 1.6 1.7 <0.1 South abutment profile (SBL) Block 1.6 1.6 1.6 <0.1
Circular 2.1 2.1 2.1 <0.1 South abutment transverse (right)
Sta.179+04 Block 2.0 2.0 2.0 <0.1
See Note 1 below for
south abutment analysis
Notes: 1. South abutment analysis was performed assuming clay, sand, and h.w.sh. layer excavated and replaced with fill. 2. Water table was also used in probability analyses by assuming the existing water level as minimum and 500-yr
flood level (El. 210m) as max. 3. A UD live load of 11.49kN/m was assumed to be acting on the embankment fill. 4. Error codes generated by SLIDE have been checked and found not to have any impact on the results.

Farouz, Karnik, Stanley 16
CONCLUSIONS AND RECOMMENDATIONS
1. Slope stability analyses indicate the slopes at the north side of the creek to be stable under the additional embankment and 2.5-meter temporary surcharge in undrained loading and traffic loading and 500-yr flood conditions in a drained loading. Hence, no slope mitigation measures were required at either the north or south sides, from the slope stability perspective. However, at the south side, the highly weathered shale is encountered at very shallow depths below the ground surface. It was recommended that this shale be excavated and replaced by compacted fill to mitigate settlement and avoid downdrag on the piles supporting the abutments.
2. Additionally, it is recommended that inclinometers be installed during the construction of the embankment, scheduled to start sometime in 2006, so that the actual performance of the embankment can be monitored and the reliability of the analyses and design approach can be ascertained from the inclinometer readings.
3. The use of in situ testing was a cost-effective way of optimizing slope design. Roughly, for every $1 spent on in situ testing, the estimated construction cost savings are between $30 and $50.
4. The use of in situ testing, such as the borehole shear test, requires experienced personnel to perform the test. The quality of the results is greatly impacted by the operator’s skill.
5. In general, it is recommended that at any given location where highly weathered shale is likely to be encountered, the undrained slope stability analyses be performed using the Iowa DOT value of 10kPa. If the analysis indicates a high probability of failure with safety factors less than 1.0 and is likely to impact a large area and result in a significant cost to the project, additional subsurface investigation, including in situ testing, may be conducted to verify more realistic shear strength parameters. It is the authors’ opinion that such an approach would possibly result in optimal design and reduce the construction cost at a relatively minor additional expense during the design.

Farouz, Karnik, Stanley 17
ACKNOWLEDGMENTS
The authors would like to thank the project management teams at the Iowa Department of Transportation and CH2M HILL for providing financial and administrative assistance, Terracon for providing drilling and laboratory services, and In Situ Testing LLC for providing the BST equipment. The authors also express their thanks to Dr. Vernon Schaefer, Dr. David White, Dr. Muhannad Suleiman, and graduate students Mark Thompson and Hong Yang from Iowa State University for performing the in situ tests.
REFERENCES
Bowles, J. E.1997. Foundation Analysis and Design. 5th ed. New York: McGraw Hill. Handy, R. L., and N. S. Fox. 1967. A Soil Borehole Direct-Shear Test Device. Highway Research News
27, pp. 42–51. Lutengger, A. J., and D. A. Timian. 1987. Reproducibility of Borehole Shear Test Results in Marine Clay.
Geotechnical Testing Journal 10.1, pp.13–18. Rocscience, Inc. 2003. User’s Guide and Help files. SLIDE, Stability Analysis for Soil and Rock Slope. USDA, Soil Conservation Service. 1997. Soil Survey of Wapello County, Iowa. National Cooperative Soil
Survey.