case study the cqm system in refineries-1 · pdf filecase study the cqm system in refineries...
TRANSCRIPT

Case Study
The CQM System in Refineries
in Amine Treatment Plant
Udi Siboni [email protected]
CQM Chief Engineer CQM Trat-Yehuda 51 d.n. Hamerkaz 73175 Israel
www.cqm-tech.com

Table of Contents
1 DECISION MAKING PROCESS FOR THE INSTALLATION OF C.Q.M PRODUCT AT ASHDOD REFINERIES ............ 3
THE H2S CONDENSER WAS BLOCKED WITH MUD AND
SCALE, AND REQUIRED CLEANING TWICE A YEAR. 5
INSTALLATION OF THE C.Q.M SYSTEM ON THE H2S CONDENSER (C5) .........6
AFTER THE INSTALLATION OF THE CQM SYSTEM
........................8
5 ENERGY SAVINGS ...............................................................................9
1. General ...........................................................................................9
2. Software Programs used for Test runs and Computation..................9
3. Condenser geometrical and process data...........................................9
4. Software Run and Computation ........................................................10
5. Analysis and Comparison of Results .................................................11
6 ASHDOD REFINERIES H2S CONDENSER WATER SAVINGS FOLLOWING THE DISCONTINUATION OF THE EXTERNAL COOLING......13
7 SUMMARY: THE SAVINGS ACHIEVED BY THE INSTALLATION OF ATCS IN A H2S CONDENSER AT THE ASHDOD REFINERIES .............14
8 ATTACHMENT .....................................................................................15
I. Attachment 1 ..................................................................................15
II. Attachment 2 ..................................................................................17
III. Attachment 3 ..................................................................................19
IV. Attachment 4 ..................................................................................20
V. Attachment
...................................................................................21
VI. Attachment
...................................................................................23
VII. Attachment
....................................................................................24
VIII. Attachment
...................................................................................25
IX. Attachment
...................................................................................32

1. Decision Making Process for the Installation of C.Q.M
Product at Ashdod Refineries
The decision to build a refinery in Ashdod was taken in 1969. The modern refinery took around three years to build, and began operations in 1973. The Ashdod premises cover about 1,000 m2, and have the ability to process around 4 million tons of crude oil per year. (See more on the Refineries in Attachment 2)
The C.Q.M Automatic Tube Cleaning System (ATCS) was presented to Ashdod Refineries technical personnel (managers and maintenance) in a special conference on site. The system was demonstrated, the sponge balls cleaning process explained, then the potential savings in energy, manpower and out of pocket expenses were presented.
The Refineries management then decided to install one system as a pilot.
The management decided to install the ATCS on a very problematic heat exchanger (151 C5) which is critical in the MEA Amine gas cleaning process (see Attachment 3)
This heat exchanger is located in area B, in the Amine Unit, serving to condense the remainder water vapor in the H2S gas.
Originally, the heat exchanger would get clogged by scale and silt and the heat exchange capacity diminished to the point where external cooling, in the form of water spray over the condenser case, had to be used. The external water was only a partial remedy, however it added corrosion and mudded all surroundings.

The inadequacy of the condensation phase caused many malfunctions in the Sulfur recovery plant that is installed after the Amine Unit, and in extreme cases even disruption of production.
When the heat exchanger clogged, the effluent gas temperature climbed to above 70°C and some water penetrated the Sulfur recovery plant a forbidden situation thus causing more clogging by corrosion particles and discontinuation of the process. Cleaning the heat exchanger twice yearly did not correct the situation, it would get clogged again soon after each cleaning
Disruption of the Sulfur retrieval Plant costs tens of thousands of US $ per day. This cost is amplified when the crude oil is of high sulfur content.
Since C.Q.Ms ATCS was installed in October 2003, no additional cleaning was required, nor any external cooling by spray water. No more malfunctions were registered in the Sulfur Recovery plant. .
Attachment 1 describes the refining process Attachment 2 describes the Ashdod Refineries Attachment 3 describes the Amine Unit

2. The H2S condenser was blocked with mud and scale, and
required cleaning twice a year.
As a result of poor heat transfer, water would reach the sulfur recovery plant and cause serious clogging and corrosion problems. Sometimes on hot days additional external cooling was required, and water was sprayed onto the condenser case.
C5 In the amine plant: average temperature of 63° C Between 30 Dec. 2001 29 Feb. 2002
(The condenser was cleaned in January)

3. Installation of the C.Q.M System on the H2S Condenser (C5)
The C.Q.M ATCS system was installed in October 2003, during a period of renovation. At this time, the condenser was cleaned with acid and high-pressure water, as well as undergoing localized cleaning.

The installed C.Q.M ATCS

4. After the Installation of the CQM System
C5 In the amine plant: average temperature of 45° C Between 12 Jul. 2002 - 29 Dec. 2003
C5 In the Amine Unit: average temperature of 45° C Between 30 Oct. 2003 - 29 Dec. 2003
Following the Installation of C.Q.M ATCS.
Renovations 2003
Operation of the CQM system

5. Energy Savings
1. General
When observing the clogged condenser it is obvious that cleaning it will create big energy savings. However the complexity of the process made it difficult to compute exactly the amount of energy to be saved.
Condenser before and after cleaning
To overcome this complexity we hired Galil Engineering, experts in process design. (See more about Galil Engineering in Attachment 4)
2. Software Programs used for Test runs and Computation For the energy savings computations we used HYSYS a software program for modeling the process (see Attachment 5) and HTRI for the computation and design of condensers (see Attachment 6)
3. Condenser geometrical and process data The geometrical data was taken from condenser 131 C4 which is identical with 151 C5 (condenser) (see data in Attachment 7)
Cooling Tower: Temperature Differential 7 8 oC Tower Temp - oC
(checked on Aug 1, 2004 at 12 noon) Cooling water rate in tower
Condenser: Cooling water rate in condenser (estimate) Gas flow rate (variable) average for computation 1000
3 weeks per month 1500
1 week per month 200
Gas effluent Temp 56 oC Gas Influx Temp (estimate) 87 oC

4. Software Run and Computation
A process model was built with HYSYS and after several test runs with different conditions the data was fed to the HTRI S/W for the computation of the output and other condenser data.
One stage in the HTRI run
Full data from S/W program run for clogged condenser see Attachment 8 Full data from S/W program run for clean condenser see Attachment 9

5. Analysis and Comparison of Results
The test was made on 2 points, H2S effluent Temp from condenser:
70 oC Clogged Condenser 40 oC Clean Condenser
When the condenser is clogged, the fouling factor is 0.003 When the condenser is clean, the fouling factor is 0.0004
The heat transfer coefficient in a clogged condenser is T(h²s) 90 70 (°c)
U=123.27 (kcal/m2·h·0C) Q=309600 (kcal/h)
T(ln)=44.3 (°c)
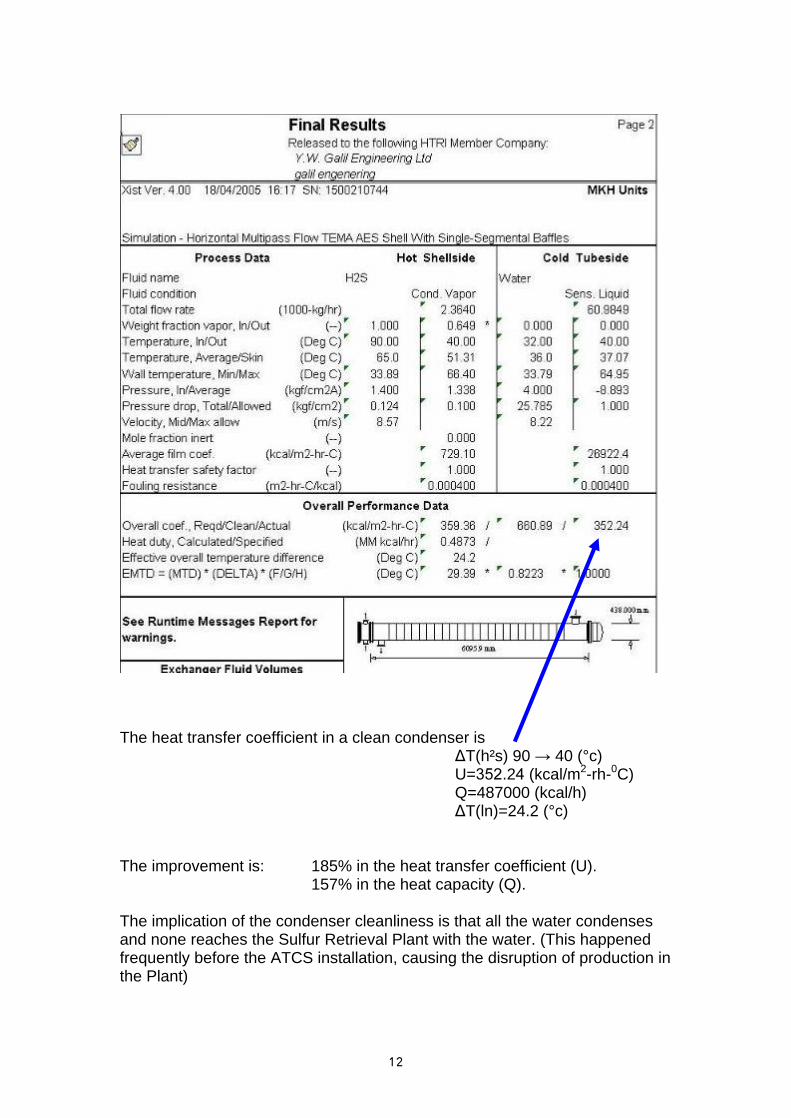
The heat transfer coefficient in a clean condenser is T(h²s) 90 40 (°c)
U= .2 (kcal/m2-rh-0C) Q=487000 (kcal/h)
T(ln)=24.2 (°c)
The improvement is: 185% in the heat transfer coefficient (U). 157% in the heat capacity (Q).
The implication of the condenser cleanliness is that all the water condenses and none reaches the Sulfur Retrieval Plant with the water. (This happened frequently before the ATCS installation, causing the disruption of production in the Plant)

6. Ashdod Refineries H2S condenser water savings following
the discontinuation of the external cooling
Data:
1. External cooling was used 5 months per year, 12 hours per day, total of 1,800 hours per year
2. Water pressure on line 2 BAR 3. Pipe caliber 2" 4. 26 holes, 3 mm diameter 5. Water flow from one hole (measured): 189 liter/hour
Spray water: 189 Liter X 26 X 1,800 = 8,845,200 Liter, Savings at US $ 1 / cubic meter = US $8,845 / year
The condenser is cooled by externally sprayed water

7. Summary: The savings achieved by the installation of ATCS
in a H2S condenser at the Ashdod Refineries
1. Energy Efficiency Improvement
185% U (kcal/m2-rh-0C) 157% Q (kcal/h)
2. Operating savings: a. Manual cleaning (manpower costs) ca. US $2,500 per year b. Sealing US $600 per year
3. Savings by continual operation of the Sulfur Retrieval Plant (no production disruption) US $40,000 50,000 per year
4. Savings of external water cooling US $8,845 per year
Total Savings US $ per year
Energy Efficiency Improvement 157%
Operating cleaning the condenser 2,500 Sealing 600 continual operation of the Sulfur Retrieval Plant 50,000 spray water 8,845
Total measurable water
61,945

8. Attachment
I. Attachment 1
The Source of Crude Oil and the Refinery Processes
Crude oil comes from the remains of plants and animals that sank to the seabed, layer upon layer. Their own weight and the weight of the seawater compressed the layers, creating heat and starting a process that continued for hundreds of millions of years. This process turned the remains of the organisms into oil.
Crude oil is a thick, blackish-brown liquid comprised of a mixture of organic materials that contain carbon and hydrogen. Oil is found in underground reservoirs, trapped in pockets between the layers of stone.
Refineries process the crude oil and separate it into its fractions (components). The separation process involves heating the oil to a temperature of 500° C. At this temperature, all the fractions vaporize.
The oil vapor is gradually cooled and channeled through pipes that collect the various components. The main fractions are: Natural gas boils at the low temperature of 20° C Petrol ether boils at 30-60° C Ligroin boils at 60-90° C Gasoline (car fuel) boils at 85-200° C Kerosene boils at 200-300° C Heavy gas oil boils at 300-400° C Lubricating oil, grease, wax and bitumen boil at temperatures above 400° C
The products distilled from crude oil are used as fuel and raw material for the petrochemical industry that produces plastics and chemicals.
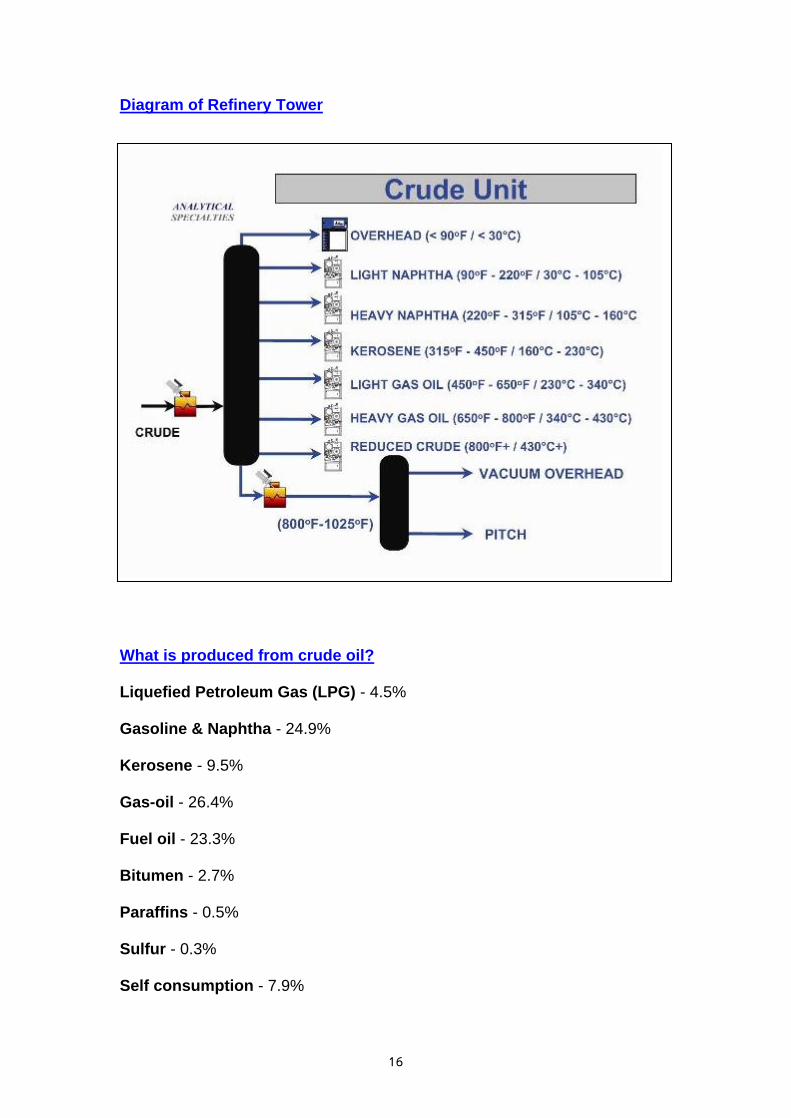
Diagram of Refinery Tower
What is produced from crude oil?
Liquefied Petroleum Gas (LPG) - 4.5%
Gasoline & Naphtha - 24.9%
Kerosene - 9.5%
Gas-oil - 26.4%
Fuel oil - 23.3%
Bitumen - 2.7%
Paraffins - 0.5%
Sulfur - 0.3%
Self consumption - 7.9%

II. Attachment 2
Ashdod Refinery
The decision to build a refinery in Ashdod was taken in 1969. The modern refinery took around three years to build, and began operating in 1973. The Ashdod premises cover about 1,000 m2, and have the ability to process around 4 million tons of crude oil per year.
Production Plant
Area A Refinery Plant
This area is the first station in the process of refining the crude oil. After being stored in the containers of the container depot, the oil arrives to be drained of water and for laboratory tests that check what kind of oil has been delivered. The oil is also tested to enable estimates to be made of the percentages of the components that will be derived from the refining process.
The oil is then pumped through a series of heat exchangers, rinsed with water to remove salts, and heated in enormous ovens to a temperature of around 370° C.
The refining process in Area A is divided into three stages: 1. Initial refining
the heated crude oil is channeled to the first distillation column that separates it into various fractions, according to the boiling temperature of each. These fractions are further processed in order to make them suitable for use. 2. Vacuum refining
the heavy oil undergoes further heating and is refined in a vacuum still that allows additional distillates to be obtained, among them heavy vacuum diesel that is used as fuel for the catalytic cracking. 3. Thermal cracking
the heavy part, the fuel oil that remains in the vacuum after the refining, undergoes thermal cracking at a high temperature. The thermal cracking reduces viscosity, thereby allowing additional light distillates to be obtained.
Area B Treating and Blending Plant
The products obtained in the initial refining are only at the first processing stage, and are not yet ready for use. These facilities improve the quality of the fractions by taking them through a two-stage process: 1. Sulfur cleaning and removal of other pollutants by catalytic processes 2. Further refining and distillation to obtain products that meet the required quality and standards
Sulfur Cleaning The sulfur is removed by reduction of the mercaptans (R-S-S-R, which are in the crude oil) with hydrogen, in order to obtain hydrogen sulfide. This reaction requires temperatures of 260° - 430° C.
The hydrogen sulfide gas H2S(g) obtained from the reaction is absorbed by passing the mixture through an amine solution.

Sulfur Recovery The sulfur is recovered by heating the solution to again release the hydrogen sulfide and then oxidizing it in the air to obtain clean sulfur.
In the catalytic cracker, the fuel is channeled with a stream of hydrogen over a platinum catalyst. During this process, the chemical structure of the fuel is changed and high-octane gasoline is obtained as required by modern engines.
Area C Service Facilities
In this area, the following facilities are found: 1. Water treatment plant this plant supplies high quality soft water for the production of steam. 2. Steam production plant this plant supplies steam at various pressures at temperatures of around 340° C as needed by the various production facilities. 3. Air compression plant this plant supplies dry air at a pressure of 6 atmospheres to the various facilities. 4. Cooling towers
these towers cool the water that flows through the heat exchangers to a temperature of 23° C. The cooling process is assisted by a stream of air from huge bellows. 5. Electricity system this system supplies high-voltage electricity to the various facilities.
Area D Catalytic Cracking
The catalytic cracker cracks the long hydrocarbon chains of the heavy diesel and turns it into high-octane gasoline.

III. Attachment 3
Area B the Amine Treatment Plant
The amine absorption process removes hydrogen sulfide or carbon dioxide from a gaseous mixture. The amine solution flows down through the absorber column where it makes contact with the gaseous mixture rising up through the tower. The amine solution, now contaminated with hydrogen sulfide or carbon dioxide, is discharged from the bottom of the tower to a steam stripper. Here it runs counter to the steam that strips away the hydrogen sulfide or carbon dioxide. The amine solution is then returned to the top of the absorption column for reuse.
Refinery amine treatment systems can be fine-tuned to increase reliability, lower operating costs, reduce corrosion and increase treating capacity.
MEA monoethanol amine is used at the Ashdod refinery.

IV. Attachment 4
Galil Engineering Ltd.
"Galil Engineering ", an Israeli company founded in 1984, is a multidisciplinary engineering organization which presently employs over 270 engineers,
technicians and administrative staff. Its personnel has substantial experience in design and construction management of large scale industrial projects
The Company provides most of its engineering services in various disciplines of engineering on E.P.C.M (Engineering, Procurement, Construction,
Management) basis, from the preliminary design stages through the detailed design, procurement, construction stages up to plant commissioning.
The Process Department specializes in the process design for the chemical, pharmaceutical, fine chemical, oil refining, petrochemical, food and textile industries. The department undertakes projects from the conceptual stage, up to commissioning and running in. The Process Department has developed expertise in a wide range of technological fields and has been involved in complex projects based on our own know-how or working in close collaboration with know-how suppliers.
As part of the process design, the Department is experienced in supplying creative and unconventional solutions in order to adapt the different technologies to client s specific needs. Our staff includes known leading process engineers with a vast experience in a broad range of industries and technologies. In order to assure the highest quality standards, the Process Department makes use of most advanced software like HYSYS for process simulation. Recently we have joined the HTRI consortium to supply heat exchange highest design standards.

V. Attachment
HYSIS Software program for models
The goal of program like HYSYS is, of course, to provide engineers with the capability to design an entire process as completely and accurately as possible.
HYSYS was created using an open architecture to enable industry-specific capabilities to be easily added by AspenTech or third-party vendors. These high-value add-ons fully integrate with HYSYS to provide additional capabilities, such as:
Acid gas treating using amines, blended amines and physical solvents
Crude oil characterization from laboratory assay data
Multiphase pipeline correlations for design and troubleshooting
Online or offline process monitoring and optimization
Detailed equipment selection and sizing

VI. Attachment
HTRI S/W Program for the design and computation of heat exchangers
Heat Transfer Research, Inc. (HTRI), the global leader in process heat transfer and heat exchanger technology, was founded in 1962. Today our industrial research and development consortium serves the engineering needs of nearly 600 companies in more than 45 countries. We conduct application-oriented research on pilot-scale equipment at our research facility. HTRI staff use this proprietary research data to develop methods and software for the thermal design and analysis of heat exchangers and fired heaters. In addition to research data and software, we provide technical support and offer training, consulting, and contract services to both members and non-member companies. Our expertise and dedication to excellence assure our customers of a distinct competitive advantage and a high level of operating confidence in equipment designed with our technology.
HTRI software, used successfully by industry for more than 35 years, is backed by extensive data collected on industrial-sized heat transfer equipment. Program methods documented in our technical publications are improved through on-going research. As a result of rigorous research analysis and our response to the changing needs of customers, HTRI software is regularly updated.
Heat Transfer Research, Inc. The premier provider of heat transfer technology
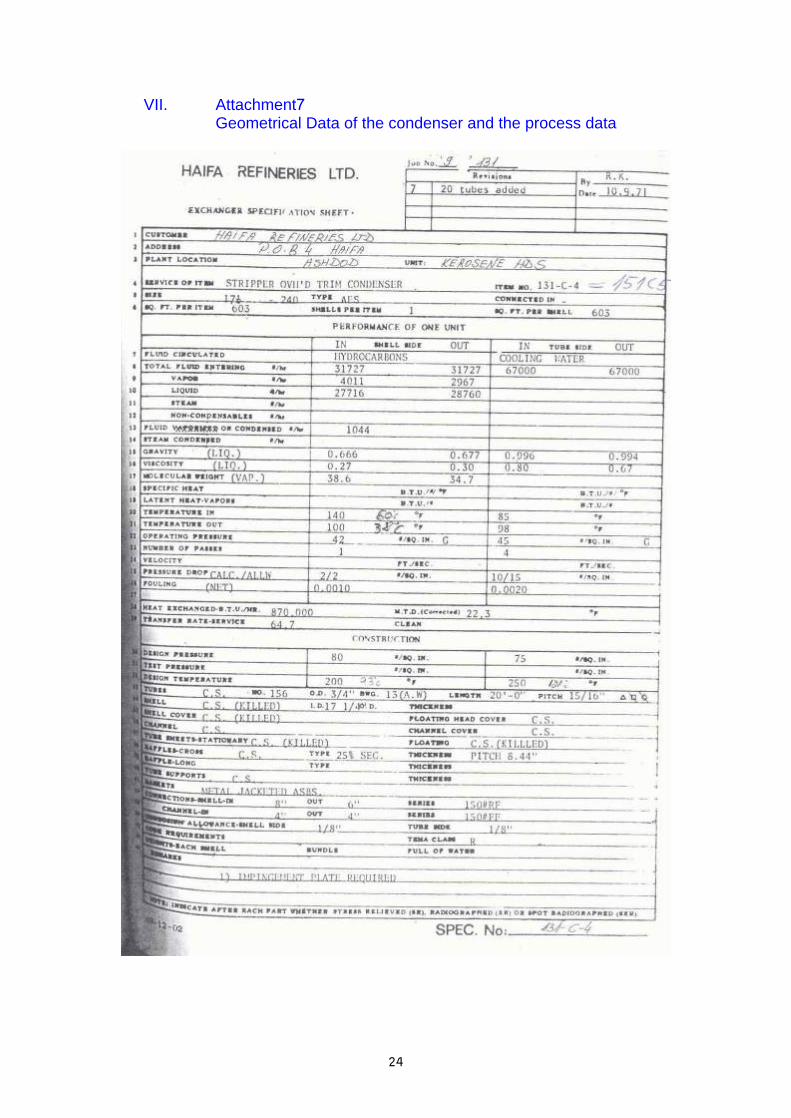
VII. Attachment
Geometrical Data of the condenser and the process data

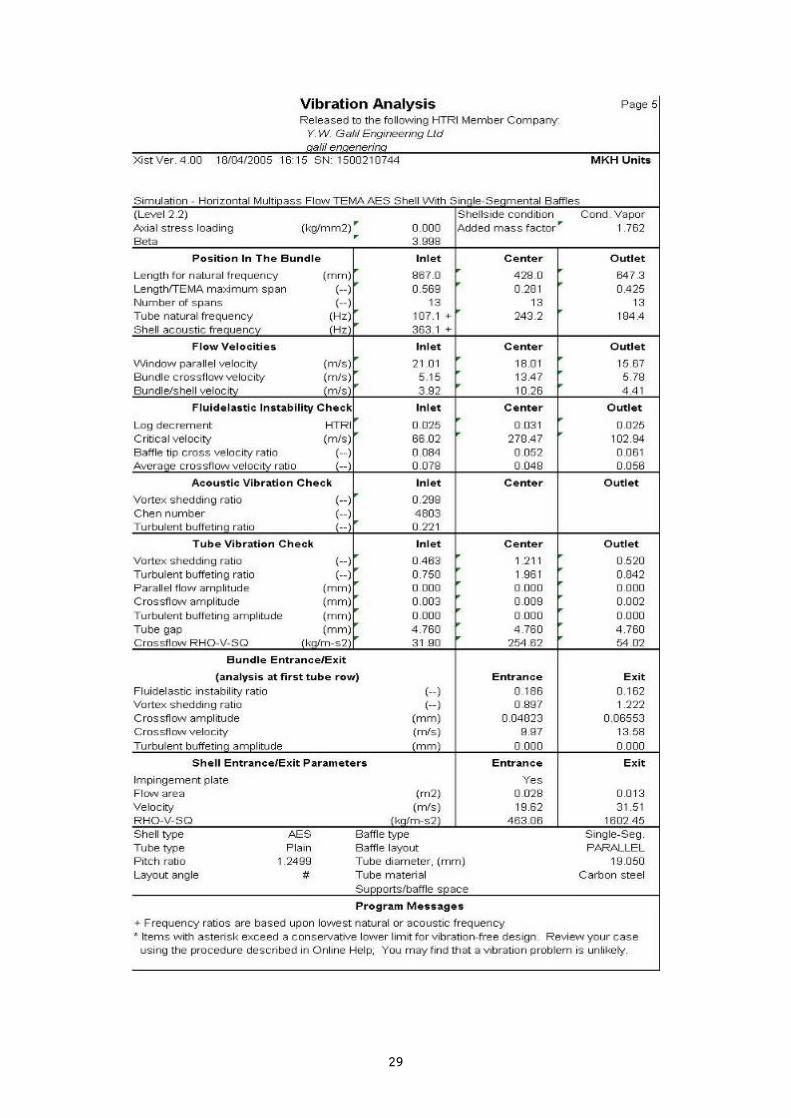
VIII. Attachment
Results when condenser is fouled


IX. Attachment
Results when condenser is clean


Attachment
Results when condenser is clean


This document was created with Win2PDF available at http://www.daneprairie.com.The unregistered version of Win2PDF is for evaluation or non-commercial use only.