case study sap bi: acelerating sale force performance
DESCRIPTION
TRANSCRIPT

Acelerating Sales force PerformanceGroup 11
: Irma Bejarano González: Maria Avraleva
04.01.2013

Agenda1.- Company Profile
2.- Business Case
3.- KPI’s
4.- Data Model
5.- SAP Implementation
6.- Reports
7.- Project Management

1. Company Profile

Smart Interiors is the leading comapny in USA in:
⁞ Sales/consultancy
⁞ Supply
⁞ Instalation of interior coating products.
More than 20 years of experience in the market.
Heartquarters in Houston, 6 Subsidiaries: North, Center, South
300 employees
€5 Million sales/year
1.1 Company Profile

1.2 Product Line
RUGS
VYNYL AND CONDUCTIVE FLOORS
BLINDS WOOD/LAMINATES WALLPAPERS
PORCELAIN AND CERAMIC TILES
POLISHED CONCRET FLOORS

1.3 Market
InstitutionalResidential
⁞ Arquitects
⁞ Construction
companies
⁞ Headquarters
⁞Project design offices
⁞Design Studios
⁞House builders
⁞Gyms and sport club.

2.- Business Case

Not a sustainable revenue growth.
Lack of clear definition of market segments and product competitivenes.
Low performance of the sales force.
Doubt in the correct organization of the sales force.
2.1 Problem Statement

2.2 Historical Sales and Sales Objective
€ Total Sales /year

2.3 Sales Analysis
Total sales € by segment-May 2011

2.3 Sales Analysis Sales € by Product 2010

2.4 Proposed Solution
To treat sepperately the segments identified as most
important:
≡ Institutional
⁞Construction companies
⁞Project developers
⁞Arquitectes and design studios
⁞Headquarters
Promote the sales of most profitable products and
segments.
Introduction of KPI’s :
≡Monitoring/impulse sales force performance
≡Sales force compensation system.
≡Residenti
al

2.5 Proposed Organizational Structure

3.-Performance Measurement and KPI’s

3.1 KPI’s
Identification Description Formula, unitPeriodicit
yTarget
% sales by products /month
Compare the volume of sales between different products from month to month;
the aim is to increase the % of sales of more profitable products
= sales of the identified product, EUR / Total sales of products *100%
MonthlyWeekly
At least 50% of overall sales should be in profitable products
Sales by products /sales people/month
Define the level of sales of certain products by certain sellers;
the aim is to force salespeople to increase their sales of more profitable products
= sales of the identified product by the identified seller, EUR
MonthlyWeekly
30,000 EUR
% sales of profitable products/sales people/month
Define the level of contribution of each seller to sales of profitable products
= sales of the identified product by the identified seller/general sales of the identified product * 100%
MonthlyWeekly
min. 50%
1
2
3
Product Analysis

3.1 KPI’s
Identification Description Formula, unitPeriodicit
yTarget
% sales by segment/month
Compare the volume of sales between different segments from month to month;
the aim is to increase the % of sales in more profitable segments
= sales of identified segment, EUR / Total sales month *100%
MonthlyWeekly
At least 50% of overall sales should be in profitable segments
Sales /segment/sales people/month
Define the level of sales by certain sellers in certain segments;
the aim is to force salespeople to increase their sales in more profitable segments
= sales of the identified seller in the identified segment, EUR
MonthlyWeekly
30,000 EUR
% sales of identified segments/sales people/month
Define the level of contribution of each seller to sales in profitable segments
= sales per salesperson in the identified segment /general sales in the identified segment* 100%
MonthlyWeekly
min. 50%
4
5
6
Market Segment Analysis

3.2 Key Figures
Key Figure ExplanationRevenue Sales from a certain order;
=price of the product (m2) * amount sold (m2)
% Revenue Percentage of revenue of a certain order from total of orders.
Price Price Per Product (EUR/m2)Amount Units (m2) product sold/orderProducts_per_Order Number of products sold/order.

4.-Data Model

4.1 Star Schema
Seller_ID
Seller_NameBirth_DateGender
Seller_ID
Time_ID
DateMonthWeek
Time_ID Product_ID
Product_NameProduct/Service
Product_ID
Segment_ID
Segment_Name
Segment_ID
Filial_ID
RegionStateFilial Name
Filial_ID

4.2 Transactional Data

4.3 Master Data
PRODUCT SELLER
SEGMENT FILIAL

5.-SAP Implementation
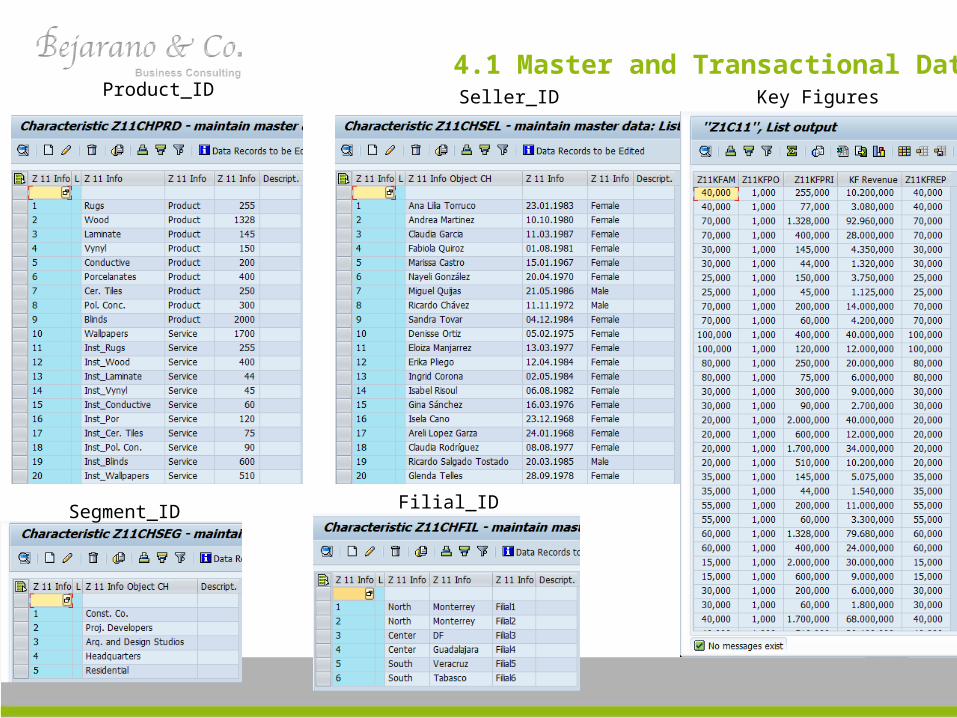
4.1 Master and Transactional DataProduct_ID
Segment_ID Filial_ID
Seller_ID Key Figures

5.1 Info Area, InfoCatalogs, InfoObjects

5.2 InfoCube

5.3 InfoCube Transformation

5.4 Formula

5.5 Data Flow

5.5 InfoCube Output

6. Reports

6.1 Query design

6.1 Query design

6.2 Bex Analyzer-Reports

6.2 Bex Analyzer-Reports
REPORT “Revenue by Product and Seller” November 2012

REPORT “Revenue by Segment and Seller” November 2012
6.2 Bex Analyzer-Reports

6.3 Bex Analyzer-Dashboards

6.3 Bex Analyzer-Dashboards

6.4 Bex Analyzer-Results
KP1: % sales by products /month

6.4 Bex Analyzer-Results
KP2: Sales by products/sales people/month
KP3: % sales of profitable products/sales people/month

6.4 Bex Analyzer-Results
KP2: Sales by products/sales people/month
KP3: % sales of profitable products/sales people/month

6.4 Bex Analyzer-Results

6.4 Bex Analyzer-Results

7. Project Management

7.1 Work Breakdown Structure

D: Römerstraße #50 Floor 1 Suite 1070180 Stuttgart, Germany
T: (+49)17653937691 W: http://about.me/irmabejarano M: [email protected]
Bejarano & Co. Bejarano & Co.