case network studies and analyses 398 - social security driven tax wedge and its effects on...
TRANSCRIPT


CASE Network Studies & Analyses No.398 Social security driven Tax wedge and its effects…
Materials published here have a working paper character. They can be subject to further
publication. The views and opinions expressed here reflect the author(s) point of view and
not necessarily those of CASE Network.
The report was prepared within a project on Economic and Social Consequences of
Industrial Restructuring in Russia and Ukraine (ESCIRRU) carried out under the FP6 (Sixth
Framework Program) and financed by DG Research. The project was led by the German
Institute for Economic Research (DIW Berlin – German Institute for Economic Research) and
partners from across the EU as well as Russia and the Ukraine. The report summarizes the
results of the Workpackage WP8 – DP3 on Social security driven Tax wedge and its effects
on employment and shadow employment coordinated by CASE – Center for Social and
Economic Research. The content of this publication is the sole responsibility of the authors
and can in no way be taken to reflect the views of the European Union or any other
institutions the authors may be affiliated to.
Publication was financed from the CASE Academic Excellence Program.
Keywords: tax wedge, employment, shadow employment, transition economies JEL: E24, J3, H21, O17
© CASE – Center for Social and Economic Research, Warsaw, 2009
Graphic Design: Agnieszka Natalia Bury
EAN 9788371785054
Publisher:
CASE-Center for Social and Economic Research on behalf of CASE Network
12 Sienkiewicza, 00-010 Warsaw, Poland
tel.: (48 22) 622 66 27, 828 61 33, fax: (48 22) 828 60 69
e-mail: [email protected]
http://www.case-research.eu

CASE Network Studies & Analyses No.398 Social security driven Tax wedge and its effects…
1
The CASE Network is a group of economic and social research centers in Poland,
Kyrgyzstan, Ukraine, Georgia, Moldova, and Belarus. Organizations in the network regularly
conduct joint research and advisory projects. The research covers a wide spectrum of
economic and social issues, including economic effects of the European integration process,
economic relations between the EU and CIS, monetary policy and euro-accession,
innovation and competitiveness, and labour markets and social policy. The network aims to
increase the range and quality of economic research and information available to policy-
makers and civil society, and takes an active role in on-going debates on how to meet the
economic challenges facing the EU, post-transition countries and the global economy.
The CASE Network consists of:
• CASE – Center for Social and Economic Research, Warsaw, est. 1991,
www.case-research.eu
• CASE – Center for Social and Economic Research – Kyrgyzstan, est.
1998, www.case.elcat.kg
• Center for Social and Economic Research - CASE Ukraine, est. 1999,
www.case-ukraine.kiev.ua
• CASE –Transcaucasus Center for Social and Economic Research, est.
2000, www.case-transcaucasus.org.ge
• Foundation for Social and Economic Research CASE Moldova, est.
2003, www.case.com.md
• CASE Belarus - Center for Social and Economic Research Belarus, est.
2007.

CASE Network Studies & Analyses No.398 Social security driven Tax wedge and its effects…
2
Contents
Abstract...................................................................................................................................5 1. Introduction .....................................................................................................................6 2. Social security and taxes in Russia and Ukraine – general review of current situation and last reforms .....................................................................................................8
2.1 Social and Economic Background – general situation in CIS countries .............8 2.2 Financing social security expenditure in CIS and changes driven by the financial problem..............................................................................................................10 2.3 Recent reforms of tax and social contributions system and current situation in Russia and Ukraine ..........................................................................................................12
2.3.1 Payroll taxes in Ukraine. ..................................................................................12 2.3.2 Payroll taxes in Russia. ...................................................................................14
3. The relationship between the social security net, taxes, employment and the shadow employment............................................................................................................16
3.1 Theoretical model....................................................................................................16 3.2 Effect on employment.............................................................................................19 3.3. Effect on shadow economy...................................................................................21
4. Tax wedge and employment – estimation of possible results of tax wedge shift for employment in Russia and Ukraine....................................................................................23 5. Tax wedge and shadow employment – estimations for Ukraine ..........................28 6. Shadow employment, wages and access to social security in Ukraine and Russia...............................................................................................................................................34
6.1 Some assessments of the size of the informal employment ..............................34 6.2 Informal employment and wages...........................................................................37 6.3 Impact of being informally employed on access to social security benefits and EPL .............................................................................................................................39
7. Conclusions...................................................................................................................44 References:...........................................................................................................................46
CASE Network Studies & Analyses No.398 Social security driven Tax wedge and its effects…
3
Marek Góra is a professor of economics at the Warsaw School of Economics (SGH), where
he got his Ph.D. and habilitation. He has been lecturing and conducting research at SGH
since 1984. Currently, Marek Góra teaches macroeconomics, pension economics, labour
economics, and economic policy for graduate and Ph.D. students. Previously, he also taught
econometrics and economic forecasting. During his academic carrier, Marek Góra completed
research at the London School of Economics, Erasmus University Rotterdam and Ifo Institute
for Economic Research in Munich. Marek Góra is a Research Fellow at the William Davidson
Institute, University of Michigan and a Research Fellow at Institute for the Study of Labor
(IZA), Bonn. Marek Góra is an author of various articles in the fields of pension economics,
labour economics, unemployment, labour market policies. Marek Góra is the co-author of the
design of the pension reform called Security through Diversity and the leader of a team of
experts who worked on the reform.
Oleksandr Rohozynsky, Ph.D. in Policy Analysis (2007, Dissertation on Social Safety Net
Reform in Ukraine), holds masters degrees in Applied Mathematics, Economics, Policy
Analysis, and Business Administration. He is an economist and researcher with over nine
year experience working in Ukraine and the US, including: leading and managing projects for
Ukrainian think-tank; working with various international organizations, including World Bank,
Soros International Economic Advisory Group, HIID/CASE; and providing support and advise
to decision-makers in Ministry of Economy, Ministry of Finance, and Prime-Minister of
Ukraine. Oleksandr Rohozynsky has been working with CASE Ukraine since 1999.
Irina Sinitsina, Ph.D., is a leading researcher at the Institute of Economics, Russian
Academy of Sciences (Moscow, Russia) and CASE's permanent representative in Russia, as
well as a member of the Board of Directors of CASE - Transcaucasus in Tbilisi, Georgia. She
specializes in the analysis of social policy, including social security systems, social services,
labour market, income and employment policies in Russia, Poland, Georgia, Ukraine and
other FSU and CEE countries. She has also carried out extensive comparative
macroeconomic studies of the economies in transition in these countries. Irina has
participated in many international advisory projects on fiscal and social policy in Georgia and
Ukraine. Since 1992, she has advised Russian ministries, governmental agencies, and the
Central Bank of the Russian Federation on various social and employment policy issues

CASE Network Studies & Analyses No.398 Social security driven Tax wedge and its effects…
4
Mateusz Walewski graduated from the Department of Economics at the University of
Sussex in the UK (1997) and at the Warsaw University (MA in 1998), where he participated
in an MA programme organised in cooperation wit Columbia University in New York. He
works as a researcher at the CASE Foundation since 1997. He is an author of numerous
publications and unpublished reports concerning labour market, poverty, inflation,
restructuring of the economy and taxation policy but labour market is his main area of
interest. He is among authors of the Polish Economic Outlook Quarterly (PEO) responsible
for labour market issues. He has participated in several advisory projects for central and local
authorities of Poland. He has worked also as an advisor or a researcher in Georgia, Kosovo,
Armenia, Belarus, Montenegro and Yemen.

CASE Network Studies & Analyses No.398 Social security driven Tax wedge and its effects…
5
Abstract The aim of this paper was to analyse possible directions and magnitudes of the relationship
between the social security driven tax wedge, employment and shadow employment in
Russia and Ukraine. Previous results suggest a limited positive relationship between the size
of the tax wedge and shadow employment and in recent years both analysed countries
undertook serious steps in order to reform and to simplify their payroll tax system and
consequently to reduce shadow employment.
Our result suggest that the unskilled persons engaged in unregistered jobs in Ukraine and
Russia are not “rewarded” with higher net earnings. It seems that, in their case, shadow
employment is the way to escape unemployment and resulting poverty, rather than to evade
taxes. Hence, it seems that, in this case, broadening of general employment opportunities for
this group would result in a decrease in shadow employment.
We also found that the effect of the SSN benefits on shadow employment was rather low in
both countries. One of the explanations is the fact that SSN benefits remain largely universal,
and are not sufficiently tied to former employment history and social security contribution
paid.

CASE Network Studies & Analyses No.398 Social security driven Tax wedge and its effects…
6
1. Introduction
The aim of this paper is to analyse possible directions and magnitudes of the relationship
between the social security driven tax wedge, employment and shadow employment in
Russia and Ukraine. These subjects have been studied earlier both for these two countries
and for a broader set of CIS (Commonwealth of Independent States) countries by a number
of researchers (Johnson et al 1999, Kaufman&Kaliberda 1997, Mel’ota et all 2001a, 2001b,
Rutkowski 2006, World Bank 2000 and 2006). Most of the results suggest a limited positive
relationship between the size of the tax wedge and shadow employment.
The first specific feature of this paper, however, is that it draws heavily on earlier, particularly
local, literature on the subject that is probably not familiar to the international reader. It
discusses the relationship between the shape of social security systems in these countries
and the resulting tax wedge. It provides a reader with an up-to-date review of current payroll
tax systems in both countries and provides in-depth analyses of the social and institutional
background for the development of the tax wedge driven shadow employment in the
analysed countries. Last but not least, it also discusses the possible negative social
consequences of being engaged in shadow employment for employees as such.
A separate feature of the paper is that it puts significant pressure on the heterogeneity of the
labor force from the point of view of education (skills) and hence, expected productivity. Most
of the analyses below (if only applicable) differentiate between high-skilled and low-skilled
workers in order to take into account the tax wedge effects on employment levels and that
the fact that shadow employment can vary for different educational (skills) strata of the
population. It seems that the results of our analyses strongly support such a view.
On the other hand, however, the broad coverage of the analysis provided has been achieved
at the expense of its depth. Therefore, if answering the questions of interest is not possible
(mostly due to insufficient data), we try to open areas for further research.
The paper is organised as follows: the first section presents a summary of the economic and
institutional background for development of the current size and structure of the socially
driven tax wedge in both countries. The second section presents some theoretical
considerations on the relationship between the social protection system, tax wedge, non-
employment and finally, shadow employment. The third section contains an attempt to

CASE Network Studies & Analyses No.398 Social security driven Tax wedge and its effects…
7
econometrically estimate the magnitude of the possible relationship between the tax wedge
and total employment rates in both countries. In the fourth section, the authors try to discover
the mechanism of influence of the last reform of the Ukrainian payroll tax system on the
structure and size of shadow employment in the country. The last analytical section closes
the circle leading the reader back from shadow employment to wages and finally to the issue
of access to social security institutions. The last section concludes.

CASE Network Studies & Analyses No.398 Social security driven Tax wedge and its effects…
8
2. Social security and taxes in Russia and Ukraine – general review of current situation and last reforms
2.1 Social and Economic Background – general situation in CIS countries
By the end of the 1980’s, the countries of the “Soviet Block” (Eastern European countries
and the Soviet Union) had Social Safety Nets (SSN hereafter) with the most extensive
coverage and costs. For example, the SSN in the United States consists of about 80 mean-
tested federal programs that provide some cash (TAFT program), in-kind (housing and food),
and healthcare assistance (Medicaid) to low-income individuals and households (Lindert
2005), in addition to the government pension program. The total cost of welfare programs in
the US is only about 16% of GDP (UNECE 2005). Western Europe has a more generous and
expensive SSN system that includes government-funded or obligatory health insurance,
higher pension and unemployment benefits, early retirement, and government assistance for
education. This system is more expensive, and European counties spend about 24% of GDP
on the safety net. The SSN of the former Soviet Block countries provided free healthcare and
education (including higher education) to everyone, and the costs of other services, such as
childcare, vacations, etc. were greatly reduced by price equalization mechanisms. B.
Milanovic (1997) showed, in his book, that social transfer constituted about 19% of personal
income in a typical socialist economy, while it accounted for only 14% in a typical market
economy. This difference may be even larger because some benefits provided in-kind or
through discounts by the state enterprises to their workers can not be captured by such a
simple comparison. The pensions were relatively generous and the retirement age was
around 55 for females and 60 for males; in addition, retirees received a package of
discounted or free services, such as housing, phone, and other necessities. Because there
was no unemployment, unemployment benefits were non-existent in these countries. The
cost of the SSN was huge, but was largely carried by the state-owned enterprises and not by
the state budgets.
At the end of 1980’s and beginning of the 1990’s, the Soviet Block countries began
transitioning their economies from the planned to the market economy system. It was
obvious that it would be impossible to make the transition without transforming the SSN
because price controls and the heavy SSN burden on enterprises were not compatible with
the market economy. However, even when the SSN became the government’s responsibility,

CASE Network Studies & Analyses No.398 Social security driven Tax wedge and its effects…
9
it had to be reformed because (1) it did not match new tasks and poverty profiles, and (2) the
economic slowdown accompanying the transition put constraints on government
expenditures.
The countries of the FSU (Former Soviet Union) took the path of slow reform. They
experienced a longer (more than 6 years) and deeper (60-80% of GDP cumulative decline)
economic slowdown. Due to this slowdown, the average tax revenues in the CIS countries
fell from 28% of GDP in 1992 to 22% of GDP in 1998, and some countries with a slower
transition such as Georgia, Kyrgyzstan or Tajikistan experienced a drop in revenues to less
than 15% of GDP (World Bank 2000). The transition to the market economy forced
governments to reduce some budget functions such as direct subsidies to the national
economy, but the SSN systems remained almost unchanged. It seems that FSU countries
were caught in the political lock-up that did not allow cutting any social benefits that are
provided to the whole population. Most of the countries (except Russia and Kazakhstan,
which have significant incomes from crude oil extraction)1 constantly run significant budget
deficits in order to finance government obligations.
The labor market transformation in CIS countries differed from the transformation in countries
of Eastern Europe (current “new” EU states). Despite massive drops in GDP, unemployment
in CIS countries remained at relatively low levels. During the period 1990-1994, average
decline of GDP in the CIS countries was around -11%, while decline in employment was only
-1% (compare to the -3% and -4% respectively in CEE (Central and Eastern Europe)
countries) (Nesporova 2002). During the periods of 1994-1998 and 1998-2004, the figures
were (-0.2%, -0.3%) and (+4.5%,+0.3%) respectively. Only countries involved in armed
conflict, such as Armenia, Georgia, and Moldova, experienced a sharp decline in
employment. The real adjustment was felt through the large drop of real wages, which
declined dramatically in the CIS region during the transition. On average, they still remain
lower than in the pre-transition period.
Because of the reluctance to extensively reduce labor during transition in the CIS countries,
a drop in unemployment was not the major precondition to reduce poverty in these countries.
The problem, however, was that low-income employees were first to experience the onset of
massive arrears in wages, pensions and other benefits. (World Bank 2000). By the end of the
1990’s, there emerged new social groups prone to poverty: families of officially employed
persons on unpaid or partially paid leave, public workers, small farmers and rural business
1 This is true only for the period after 2000. As concerns the early and mid-1990’s - vast deficits in SSN budgets and unpaid benefit mandates were typical in these countries as well.
CASE Network Studies & Analyses No.398 Social security driven Tax wedge and its effects…
10
owners (Ackland&Falkingham 1997). The working poor accounted for about half of the poor
in Russia where about 87% of poor lived in families where one or several members were
employed (Ovcharova 2003). In Ukraine, about 78% of poor families had at least one
working member in 1999 (Libanova 2001).
The economic decline during the initial stage of transition sharply affected the more educated
groups. A World Bank study of poverty in the CIS region in 2000 (World Bank 2000) showed
that contrary to OECD countries, the competitive advantages of higher education in the CIS
were fairly low: not all the qualified workers in the CIS could find positions adequate to their
qualifications. However, later studies found that poverty is negatively correlated with
education. Buitano (2000) showed that in Ukraine, a higher level of education of the head of
the household was significantly and negatively correlated with poverty incidence.
The highest risk of becoming poor in CIS countries is faced by families with a large number
of dependents (children, disabled and pensioners), supported by one working member. The
World Bank study (2000) found that children are especially vulnerable to poverty in Central
Asian CIS, and having a child dramatically reduces the chances of escaping poverty in
European CIS.
Despite common perceptions, the elderly and pensioners are not at a higher risk for falling
into poverty than the rest of the CIS population. Only pensioners unable to work and living in
a single-person household would almost certainly fall into poverty. The low pension age
prevailing in most CIS countries explains this phenomenon. Many pensioners continue to
work after retirement and the pension acts as a supplementary payment sufficient to bring
their income above the poverty line. The World Bank (2000) found that the risk of poverty for
working pensioners is only about one third of the average poverty risk in Russia.
2.2 Financing social security expenditure in CIS and changes driven by the financial problem
The social welfare system in the CIS countries did not change significantly from the universal
social welfare system inherited from the USSR. The system remains very poorly oriented
towards supporting the poor. Social assistance programs remain aimed at providing services
or supplementary payments to certain groups of the population (elderly, children, disabled),
and poverty reduction, an urgent task, is not at the top of the policy agenda. Inflation, growth,
and the budget deficit have higher priority. Additionally, programs aiming at poverty
alleviation are poorly addressed and the task of poverty reduction is of least importance.
CASE Network Studies & Analyses No.398 Social security driven Tax wedge and its effects…
11
Reacting to the dramatic change in the structure of expenditures, and in order to retain the
Soviet era system of special rates, the governments of the CIS countries introduced a large
number of subsidies or discounts, often provided in-kind. For example, until 2005, Russia
kept 156 types of subsidies and social payments that were directed to 236 different
population groups. Almost 70% of the Russian population received at least one of the welfare
benefits (CSR 2000). At the end of the 1990’s, about 3% of GDP in Moldova was distributed
among more than 100 different subsidies and discounts. Armenia and Ukraine had the same
situation (Fox 2003). As a result, the number of beneficiaries of these assistance programs
became enormously high, while the size of the benefits gradually decreased due to lack of
financing.
Despite the significant expenditures on subsidies and discounts, these programs were very
severely underfinanced. It was estimated by the researchers at the Center of Strategic
Research (Russia) that the financing needed for the subsidies established by federal law in
Russia exceeded 15% of GDP in 1999. In order to improve monitoring and targeting of these
social benefits, Russia monetized the in-kind benefits in 2005 (Federal Law #122). However,
the monetization of the benefits triggered a strong negative social reaction and the reform of
these social benefits in order to reduce their cost did not begin.
The apparent problem of non-payment of social benefits, resulting from the huge difference
between the required expenditures and available revenues, was partially resolved by a
decrease in the real amounts of the payments due to high inflation. Until the beginning of the
21st century, the payments were not automatically indexed with inflation, but rather revised
on irregular bases. As a result, by 2003-2004, the welfare payment became merely symbolic
in most of the countries. For example, the social benefits in Russia amounted to about 6% of
the average wage, and in Ukraine and Azerbaijan to about 3-4% of the average wage.
The largest social welfare item outside the state budget in FSU countries is pensions,
reaching 7-12% of GDP. Despite being the largest expenditure item, due to lack of funding,
the actual pension benefits paid were considered only valuable additional income for working
pensioners, and alone were not able to provide income sufficient to stay out of poverty. For
example, the universal pension in Georgia in 2000 was only 23% of the living wage, and in
Ukraine the average pension was only 36% of the living wage in 2003. Following the
example of CEE countries, the CIS countries began pension reform, introducing a multi-tier
(mandatory and voluntary funds) pension system. However, these countries are still at the

CASE Network Studies & Analyses No.398 Social security driven Tax wedge and its effects…
12
beginning of the process and the new systems’ are only expected to have an impact in 15-20
years.
2.3 Recent reforms of tax and social contributions system and current situation in Russia and Ukraine
2.3.1 Payroll taxes in Ukraine. Currently, Ukraine has a rather complex system of four separate social insurance programs
that collect payroll taxes. Each program has its own tax rates, its own independent
administration and operation, and its own regulation. The list is comprised of: pension
insurance, unemployment insurance, temporary disability insurance, and industrial accident
insurance. The payroll taxes collected by these insurance funds are all imposed on the same
base (payrolls) but they have an income ceiling. Thus, rates are levied only on up to seven
times the average wage in the country.2 In total, the combined tax rate for all programs often
exceeds 40%, depending on the risk of industrial accidents, and as Table 2.1 shows, the vast
bulk is the employer’s share. The single largest contribution is to the pension insurance fund
(33.2%). Table 2.1: Tax Rates of Social Insurance Programs in Ukraine (as a Percentage of Employee Wage Income) Contributions(*) Pension
Insurance Unemployment
Insurance Temporary Disability Insurance
(2)
Industrial Accident
Insurance.
Total
Employer 31.8 1.3 2.9 1.5 (4) 37.5
Employee 1.0 /2.0 (1) 0.5 0.5 / 1.0 (3) --- 2-3.5
Total 32.8 – 33.8 1.8 3.4 – 3.9 1.6 39.5- 41
(*) Rates as established in the 2006 budget of Ukraine. (1) Includes sickness, maternity and funeral insurance. The average total rate for the pension fund alone is 33.8 % of wages. (2) An average weighted rate. The rate the employer pays varies from 0.66% to 13.6% depending on the degree of hazardous risk level. Overall, there are 67 different risk categories and some 30 rates. Moreover, there is more variety in alternatives for companies that employ the disabled, working pensioners, and farmers. Thus, there is a wide range of variations in individual liability even within a single company. This type of complexity adds an extra burden to the withholders (and taxpayers) and makes collection monitoring and control more difficult. (3) 1.0% of gross taxable income under UAH 150; 2.0% of gross taxable income over UAH 150. (4) 0.5% for wages below the subsistence threshold; 0.1% for wages above the subsistence threshold. Sources: MoF, MoL, Budget 2006, Ukraine: Creating Fiscal Space for Growth: A Public Finance Review. World Bank Report No. 36671 – UA. September 14, 2006 Above that, there exists a system of simplified taxation (STS) for small business that
substitutes the general payroll taxation. The idea behind having such a system in Ukraine 2 The cap is established as seven times the average wage in the country. The monthly average wage in 2005 was UAH 806, so the ceiling in that year was UAH 5,642. This ceiling is set in the annual Budget Law.

CASE Network Studies & Analyses No.398 Social security driven Tax wedge and its effects…
13
was to bring to light the small businesses operating in the shadow economy. The STS was
instituted by the Presidential Decree in July 1998. The small businesses falling under the
Decree include the following:
• physical persons or individual entrepreneurs with annual gross turnover not
exceeding UAH 500,000 and employing not more than ten persons, including family
members;
• legal entities (firms) with an average annual number of employees not exceeding 50
persons and with annual gross turnover not exceeding UAH 1,000,000.
Under STS, the taxpayer (either individual or a firm) is to choose one of the following rates
for the unified tax:
• 6 % of the gross turnover (less excise taxes) plus VAT, or
• 10 % of the gross turnover (less excise taxes) with VAT included into the unified tax
(see Table1.2 )
The tax collected from individual entrepreneurs is distributed according to the following
scheme:
• to local government budgets - 43%;
• to the pension fund - 42%;
• to social insurance funds -15% (including 4% to the employment fund).
• Taxes collected from firms are distributed in a similar way, with the exception of local
budgets receiving 23%, and the remaining 20% going to the central government
budget.
Table 2.2 The Simplified Tax System (STS) in Ukraine Options Subject of
taxation Eligibility criteria Base Tax Rate
6%; but not exempt from VAT.
Legal entities (firms)
Annual gross (last 12 months) turnover does not exceed UAH 1,000,000; firm does not have more than 50 employees.
Gross Turnover
10%; exempt from VAT.
6%; but not exempt from VAT
The unified Tax
Physical persons or “individual entrepreneurs” (individuals)
Annual gross turnover (last 12 months) does not exceed UAH 500,000; entrepreneur does not have more than 10 employees.
Gross Turnover
10%; exempt from VAT.
Fixed Tax Physical persons (individuals)
Annual turnover (last 12 months) does not exceed UAH 119,000; do not have more than 5 employees.
--------
Patents vary from UAH 20-200 per month.
Other (Trade patents, fees and permits)
Levied on legal entities and individuals.
Small firms as assed by local governments (LG) --------
Various amounts (assessed by LG).

CASE Network Studies & Analyses No.398 Social security driven Tax wedge and its effects…
14
The employees of the firms that opted for STS pay the same payroll taxes as those working
under a general tax scheme:
• 1-2% to the pension fund;
• 0,5% to the employment fund;
• 0,5-1% to the social insurance fund;
• 13% PIT (flat rate).
There is evidence, albeit mixed, that the STS has encouraged SMEs registration and entry.
However, the current system design has led to substantial abuses, inefficiencies, and an
erosion of the regular tax base in the following ways (World Bank 2006):
• it created incentives for legal and illegal migration from the regular tax system, which
generated revenue losses for the budget in all major taxes (payroll taxes, the PIT, the
VAT, and, more marginally, the CIT);
• it distorted taxpayer behavior in inefficient ways for the economy, potentially lowering
productivity in the economy (e.g., firms fragment their operations into smaller firms to
meet the threshold3, losing economies of scale; and production and sales are kept below
thresholds hampering output growth); and
• it introduced substantial horizontal (and vertical) inequalities to the system (e.g., an
individual working as a “consultant” under the STS may pay significantly lower taxes than
an individual with the same type of job description at a firm and the same level of income
under the regular income tax system).
2.3.2 Payroll taxes in Russia. The Unified Social Tax (UST) was introduced in Russia in December 2001, replacing
insurance contributions paid by employers to four separate insurance funds – the pension
fund, the social insurance fund, the federal obligatory medical insurance fund, and the
territorial medical insurance funds. Later, the UST was included into Chapter 24 of the Tax
Code.
Initially, the UST basic rate for legal entities was set at 35.6%, and its effective rate – at 29%.
Beginning in 2005, these were reduced to 26% and 24% accordingly. UST is a regressive
tax: the rates are significantly lower for annual salaries exceeding RUR 600,000 (see Table
3 Anecdotal evidence suggests that businesses break their operation into pieces and use other schemes to fit the requirements of the system (Creating Fiscal Space for Growth, p.17).

CASE Network Studies & Analyses No.398 Social security driven Tax wedge and its effects…
15
1.3). The whole of the UST is paid by the employer. In 2007, the UST was distributed
according to the following scheme:
• 20% - to the federal budget for pension financing;
• 2.9 % - for social insurance;
• 3.1 % - for medical insurance.
For individual entrepreneurs, the UST rate is set at 10% of the tax base (7.3% to the federal
budget for pension financing and 2.7% for medical insurance).
Table 2.3 The Unified Social Tax (UST) system in Russia. UST rates since January 1st, 2007
Legal entities Obligatory medical insurance funds Tax base,
annual, for each employee
Federal budget (pensions)
Social insurance fund (federal budget) Federal (federal
budget) Territorial
Total
Less than RUR 28,0000
20,0 % 2,9 % 1,1 % 2,0 % 26,0 %
RUR 28,0001 – RUR 600,000
RUR 56,000 + 7,9 % of the sum exceeding
RUR 280,000
RUR 8,120 + 1,0 % of the sum exceeding
RUR 280,000
RUR 3,080 + 0,6 % of the sum exceeding
RUR 280,000
RUR 5,600 + 0,5 % of the sum exceeding
RUR 280,000
RUR 72800 + 10,0 % of the sum exceeding
RUR 280,000 Over RUR 600,000
RUR 81,280 + 2,0 % of the sum exceeding
RUR 600,000
RUR 11,320 RUR 5,000 RUR 7,200 RUR 104,800 + 2,0 % of the sum exceeding
RUR 600,000 Individual entrepreneurs
Obligatory medical insurance funds Tax base, annual Federal budget (pensions) Federal Territorial
Total
Less than RUR 28,0000
7,3 % 0,8 % 1,9 % 10,0 %
RUR 28,0001 – RUR 600,000
RUR 20,440 + 2,7 % of the sum exceeding RUR 280,000
RUR 2,240 + 0,5 % of the sum exceeding
RUR 280000
RUR 5,320 + 0,4 % of the sum exceeding
RUR 280,000
28,000 + 3,6 % of the sum exceeding RUR 280,000
Over RUR 600,000
RUR 29,080 + 2,0 % of the sum exceeding RUR 600,000
RUR 3840 RUR 6600 RUR 39,520 + 2,0 % of the sum exceeding RUR 600,000
The major difference between Ukraine and Russia is not in the sizes of the tax wedge (in
fact, these are very close), rather the difference between the two countries is that in Ukraine,
‘social insurance contributions’ are insurance premiums (insuring against risks) rather than
taxes as such and are not included in the tax base, while in Russia, these payments are
taxes paid directly to the government that administers the corresponding funds.
For Russian SMEs, there exists a simplified taxation regime (either STS or unified tax on
imputed income) established in 1998 and introduced into Part 2 of the Tax Code. The unified
tax replaced most of the taxes (with the exception of the PIT) levied on SMEs. Generally,
SMEs pay taxes using the following rates:
• 6% of total earnings, or
• 15% of total earnings less expenses, or
• 15% of imputed income.

CASE Network Studies & Analyses No.398 Social security driven Tax wedge and its effects…
16
Individual entrepreneurs not using hired labor make a fixed-size payment to the pension
fund. The size of this payment is determined annually by the government. Currently, its
minimal monthly size is RUR 150.
The results of several entrepreneur opinion surveys indicate that the STS, in general, is not
totally rejected by small businesses. Moreover, a survey conducted in three regions in 2001
by the Resource Center for Small Entrepreneurship shows that the STS is somewhat more
acceptable for the small business as compared to the general taxation system.
3. The relationship between the social security net, taxes, employment and the shadow employment
3.1 Theoretical model In order to run the analysis of the relationship between social safety nets, the tax wedge and
employment, we would like to introduce a simple econometric model. Let us assume that we
have an economy with N individuals, and:
(1) Every individual in the country can consume either goods c or leisure l.
(2) Every individual has the same concave and twice differentiable utility function U(c,l)
that this individual tries to maximize.
(3) Every individual has an income I, which consists of government transfers and the
labor income, and is equal to the time the person works, multiplied by his/her wage:
i=b+w*(T-l).
(4) Each individual maximizes his/her utility given this budget constraint. Assuming there
is no savings and the whole income is consumed, the constraint is c=i. The general
solution to this problem is to choose the level of work at the point where marginal rate
of substitution is equal to the wage rate. Assuming for simplicity that utility is linear in
consumption, the utility-maximizing amount of work is given by: ∂U(c,l)/ ∂l = -w.
In order to introduce a social welfare system into this economy, we have to make at least two
critical assumptions about individuals in the country.

CASE Network Studies & Analyses No.398 Social security driven Tax wedge and its effects…
17
(5) The individuals in the country have different abilities. For simplicity, we can assume
that λ percent of population has high abilities, able to earn wage aH, and (1- λ) has
low abilities and earns the wage aL.
(6) The individuals with low ability can not generate labor income sufficient to bring their
consumption to some minimum acceptable social standard of consumption
(subsistence level) M.
Therefore, the government has to step in and supplement the income of the low-ability
individuals to the level Z (which may be equal to or different from M, depending on the
generosity of the system), developing a simple safety net.
Finally, we assume that the government is interested in minimizing expenditures on the
social safety net given the necessity to bring the income of all individuals in the country to a
level at or above Z. We also assume that an individual does not consider this government
goal when making his/her decision. In this case, the total cost of the Social Security Net in
equilibrium is determined by the government’s ability to monitor individual abilities and
earnings.
If the government is able to clearly observe individual abilities and earnings, the total
expenditures for the social safety net will be minimized at the level E= N*λ*(Z- aL*(T-l(aL)).
Coate and Besley (1992) show in their article that under such conditions, the government will
have to pay only Z- aL*(T-l(aL)) in social benefits to the low ability individuals and will not pay
any social benefits to the individuals with high abilities.
If the government is not able to observe abilities, even if it is able to perfectly observe the
level of wage earnings, the theory leads to the conclusion that high-ability individuals may
modify their working behavior in order to receive the benefit Z- aL*(T-l(aL)). Since the high-
ability people are more productive, it will take them less time to work for the wage-income
generated by low-ability people, (only aL*(T-l(aL))/ aH hours). The high ability people will alter
their income if their utility from working less with total income at level Z will be higher than
utility from higher consumption and higher work U(Z,[( aH- 1)T+ l(aL)]/ aH) ≥ U(aH*(T-l(aH)),
l(aH)).
Coate and Besley (1992) show that in this situation, the government has two choices that
minimize the expenditures for the welfare system. First, they can offer the benefits of Z-
aL*(T-l(aL)) to people with wage income aL*(T-l(aL)) and smaller benefit B that will satisfy
CASE Network Studies & Analyses No.398 Social security driven Tax wedge and its effects…
18
criteria U(B,[( aH- 1)T+ l(aL)]/ aH)= U(aH*(T-l(aH)), T-l(aH)) to the population with income above
Z. The total cost of the welfare system will go up to E2= N*(λ* (Z- aL*(T-l(aL))) +(1-λ)*B).
The second possibility is to offer the social security benefit only to people who identified
themselves as low ability, but require them to work R hours at government organized work in
exchange for this benefit. Given this solution, the low-ability individuals will lower their work
for wage to the level of T-l(aL)-R, therefore, the size of the welfare benefit will rise to Z- aL*(T-
l(aL)-R). However, the R is chosen so that U(aH*(T-l(aH))≥ U(Z,[( aH- 1)T+ l(aL)-R]/ aH). In other
words, with the work requirement, the high-ability individuals will not take this solution
because working R hours in the private market for a higher wage will generate more utility for
them than participating in the government program. This solution to the failure of the social
programs due to the behavioral response in called “workfare”. The workfare expenditures of
E= N*λ* (Z- aL*(T-l(aL)-R)) will be cheaper for the government than the first solution if there is
sufficient difference between the wages of high and low income groups (the difference must
be such that aL<(1-λ) aH ) (Besley& Coate 1992).
Most countries finance their social security programs by payroll taxes or other taxes on wage
income. The tax as the source of funding for the SSN can be introduced into the model.
Under the assumptions of the model, it is reasonable to tax income of high-ability individuals
only, because the social system will have to return to the low-ability individuals all the taxes
that they paid. It also does not matter if the tax is a payroll tax (tax on enterprise) or income
tax (tax on a person), because in any case, in a competitive labor market, the tax will result in
decreased wage income of the workers.
If the government imposes the tax of τ on the income of high ability people, the wage that
they receive will become (1- τ) aH. Given the concave utility function, the high ability people
will work less and their wage income will become (1- τ) aH*(T-l((1- τ) aH)). According to the
model, in this case the total expenditures of the welfare system will increase. If the
government is not able to observe individual’s abilities, the government will have to
implement a more costly system that provides benefits to everyone, but the benefit provided
to the high-ability population will rise. If the government implements the “workfare” system,
this task may become impossible if the tax is significantly high because the “workfare”
system is only able to be implemented if the following condition holds: aL<(1-λ)(1- τ) aH.. The
government will also have to increase the work requirement Rτ > R, since the difference in
the cost of leisure for high ability people will be lowered.

CASE Network Studies & Analyses No.398 Social security driven Tax wedge and its effects…
19
If the welfare system is fully financed by the taxes on wages, the government faces an
additional constraint in terms of our model. The total expenditures of the system can not
exceed the total amount of taxes collected E=N(1-λ) τ aH (T-l((1- τ) aH)), and the tax rate must
be limited so that the condition U(Z,R)<U(aH (T-l((1- τ) aH), T-l((1- τ) aH) holds, otherwise the
high-ability people will exit labor market. The highest benefit that can be offered to poor
people in this case can not exceed (1-λ) τ aH (T-l((1- τ) aH))/ λ, and this benefit will not alter
behavior of high-ability people only if the “workfare” system is used in the country.
Increased taxes or a government deficit can crowd out investment; increased payroll taxes
can decrease labor demand; additional income of the poor population can increase demand
for some goods and, given limited supply, cause inflation. There is a wide array of literature
about the macroeconomic impact of an increase in government spending and social welfare
benefits in particular. The empirical evidence in these publications suggests that the negative
effect of the increase in social benefits on investment and labor supply likely outweighs its
positive impact on private consumption. The literature discusses three major channels for the
impact of benefits on an economy: decrease in employment, growth of the shadow economy,
and the direct impact on the GDP growth, which combines all factors together. Below we
discuss the empirical findings and the estimates of the size of the effect for all these
channels.
3.2 Effect on employment Our model assumes that every individual in the country can consume either goods c or
leisure l. The simplest models assume that every individual has the same concave and twice
differentiable utility function U(c,l) which this individual tries to maximize subject to a budget
constraint c=b+(1-τ)*w*(T-l). The model implies that the larger benefit b received by an
individual, the less he/she will work, since he/she can afford larger consumption of both
goods and leisure. This effect also leads to the change in behavior for some people, who
prefer to work less (or cease to work) in order to qualify for the benefit. These effects are
widely observed at the individual level and they result in larger costs of welfare programs.
However, the effect of the increased benefits on total labor supply is relatively small because
only a small fraction of the labor force is affected.
A larger effect on the labor supply and employment is observed when the government
imposes or increases taxes on wages in order to finance the social benefits. Since the tax is
imposed on all workers, the effect is easier to observe at the macroeconomic level.

CASE Network Studies & Analyses No.398 Social security driven Tax wedge and its effects…
20
The microeconomic model implies that a decrease in wages as the result of the tax will have
two effects: it will decrease the income of the person and stimulate him/her to work more in
order to achieve their former, pre-tax consumption level; and it will decrease the “price of
leisure”, causing the person to consume more leisure in order to increase their level of utility.
If the income effect dominates the substitution effect, the workers will work more after the
increase in the tax rate. However, most empirical estimates suggest that the substitution
effect likely dominates the income effect, and the elasticity of labor supply to an increase in
taxes is negative. The report of the Congressional Budget Office of the USA in 1996 (1996)
reviewed a number of studies and concluded that labor supply elasticity to a change in
wages ranges from 0 to 0.3 for the whole population.
An increase in taxes on wages does not necessarily result in a change of the net-of-tax wage
or is not fully translated into such a change. The effect of taxes on wages is better observed
at the macroeconomic level. For macroeconomic analysis, individual labor preferences are
aggregated into the labor supply function. Enterprise demand for labor is also aggregated
into the labor demand function. The conventional market economy model suggests that
employment and wages are set by the intersection of these two curves. A tax on workers’
wages shifts the labor supply curve up and the new wage is larger than in the previous
equilibrium, meaning that some portion of the tax shifted to the enterprise. If the tax is
imposed on the enterprise, it shifts the labor demand curve down resulting in a lower
equilibrium wage, and shifting some portion of the tax on workers.
The possibility to shift taxes on employees (in the form of reduced post-tax wages) depends
on the elasticity of labor supply. Less elastic labor supply allows wages to be decreased
without a significant loss in hours worked. A perfectly inelastic supply of labor allows for
shifting payroll taxes to employees. Kugler (2003) and then Góra et al. (2006) argued that
blue-collar (low-skilled) workers have a higher elasticity of wages than white-collar (high-
skilled) workers, and show empirical evidence that a payroll tax decrease(increase) causes a
larger employment gain(loss) for low-paid workers than for high-paid workers. The high
elasticity of labor supply of the low-paid workers in the country where this effect was studied
was attributed by the authors to the relatively generous system of non-employment benefits,
the large shadow economy and a binding minimum wage.
By design, social security contributions (payroll taxes) are social insurance for workers and
can be viewed as savings. If workers believe in the system they have to treat their payroll
taxes as part of their income (with some discount perhaps), and be indifferent between
packages of higher wages and no-taxes, and lower wages with payroll taxes. In this case,

CASE Network Studies & Analyses No.398 Social security driven Tax wedge and its effects…
21
any change in payroll taxes could be passed through to employees without a change in
employment (Gruber 1997). However, there is little evidence of this intertemporal substitution
effect (Gwartney et al 1998).
Instead, a number of studies find a significant effect of changes in payroll taxes on
employment. Kugler (2003) estimated that a 10% increase in payroll taxes resulted in a 4-5%
reduction in employment in Columbia; Gora et al. (2006) estimate that the same increase
could result in a 5% reduction of employment in Poland, and Gwartney et al. (1998) suggest
that a 10% increase in the after-tax wage will result in a 3% increase in employment in the
USA. From the review of results found in the literature, we can expect similar results for
Russia and Ukraine.
3.3. Effect on shadow economy
The effect of welfare programs on the shadow economy drew a lot of attention in CIS
countries (Kaufman, Kaliberda 1998) because of the large shadow economies in the
countries of the region and because of the recent experience of the country. The shadow
economy in Ukraine was estimated to be around 40% of the official economy in 1996, about
20-39% in 2000 (Mel’ota et al. 2001a, 2001b) and above 50% of GDP (41.2% of the working
age population) in 2000/2001 (Schneider, 2003), which was the highest level in Europe; in
Russia in 2000/2001, the share of the shadow economy in GDP was above 45% (40.9% of
the working age population) (Schneider, 2003).
The shadow economy in a country can be influenced by the social security net in two ways. If
the social security benefits, such as pensions, unemployment insurance, or health insurance,
are linked to employment (for example, as in the continental social security system model),
then the workers in shadow economy are not eligible for these benefits. If the workers trust
the social security system to deliver insurance when they need it, then larger amounts of
possible benefits will stimulate workers to find official employment or put pressure on
enterprises to hire them officially. There is evidence (Johnson et al 1999, Belev 2003) that
larger government expenditures are associated with a reduction of the shadow economy.
However, the positive effect of increased social security benefits on the reduction of the
shadow economy is only observable if it is separated from the effect of increased social
security contributions or other taxes that finance the SSN. Taxes are found to be one of the

CASE Network Studies & Analyses No.398 Social security driven Tax wedge and its effects…
22
major causes of the existence of the unofficial economy by all studies reviewed. Large
payroll taxes increase incentives for employers to pay their employees off the record. A large
personal income tax stimulates employees to agree to receive payments off-the-book. If
other taxes are relatively low, large taxes on labor may result in hiding full salaries, which
lowers the tax base for labor taxes but does not necessarily result in a large shadow
economy because all the output remains in official economy. However, if other taxes are also
high, then both workers and enterprises are better off conducting part of their business in the
shadow economy. In the first several years of transition, most of the CIS countries had
payroll taxes of around 50%, progressive personal income tax rates up to 50%, and profit
taxes around 30-40%. This resulted in the development of massive unofficial economies and
shadow employment in these countries.
Both tax rates and the complexity of the tax system are important determinants of the size of
the shadow economy. Schneider (2003) and Johnson et al. (1999) showed that the
complexity of the tax system measured by the propensity of tax exemptions is a more
important determinant of the size of the shadow economy than the tax rates. A similar result
was described for Ukraine by U. Mel’ota et al. (2001a), who showed that the complexity of
regulations, including the tax system, is the most important determinant of the shadow
economy in Ukraine.
The tax burden, measured either as the tax rates or as tax revenues as a share of GDP, is
the most commonly discussed cause of the shadow economy. Different studies show that an
additional 1% of government tax revenues could result in a 0.3-0.9% increase in the share of
the shadow economy Studies that made distinctions between different taxes found that
indirect taxes are a less significant determinant of the size of shadow economy, while direct
taxes on wages and profits had a significant impact on the size of the unofficial activity. In
Ukraine, a combination of personal income tax and social security contributions were found
to be important determinants of the size of the shadow economy before the personal income
tax reform in 2004. Mel’ota et al. (2001b) estimated that if the taxes in Ukraine remained at
the level of 1993-1994, the share of the shadow economy in 2000 would be about 20%
higher than it was historically observed.
CASE Network Studies & Analyses No.398 Social security driven Tax wedge and its effects…
23
4. Tax wedge and employment – estimation of possible results of tax wedge shift for employment in Russia and Ukraine
Let us begin with some simple theoretical considerations, explaining our research strategy.
Figure 4.1 (panel (a)) presents the theoretical relationship between productivity and (net)
wages. Let us assume this relationship is convex. This means that for high productivity
levels, the productivity-wage elasticity is very high and it decreases as the productivity level
goes down. For very low productivity levels, the wages are “rigid” – i.e. they do not react, or
react insignificantly, to productivity changes.
On our schedule (Figure 4.1 panel (a)), an exogenous increase of labour costs, such as an
increased tax wedge, results in a shift of the productivity-wage curve to the right. This means
that the productivity of an individual has to increase in order to earn the same (net) wage, or
that the wage must be reduced if productivity can not adjust. Essentially, the worker’s value
for the employer must increase as the exogenous costs of her/his employment go up. If the
productivity-wage relationship is convex, as on our schedule, substantial wage reductions
are possible only in the case of highly productive workers.
The rightward shift of the productivity-wage schedule is equivalent to the downward shift of
the labour demand curve for a given productivity level as on Figure 4.1 panel (b). Rigid
wages of workers with low productivity will result in large employment reductions and flexible
wages of high-productivity workers will result in smaller employment reductions. This leads
us to the concave productivity-employment relationship from Figure 4.1 panel (c). This
explicitly illustrates the effect of a tax-wedge increase on employment for the labour force
strata characterised by varying productivity levels.

CASE Network Studies & Analyses No.398 Social security driven Tax wedge and its effects…
24
Figure 4.1 Illustration of theoretical relationship between productivity, wages and employment consequences of a tax wedge increase.
Below we try to estimate the results of such a tax wedge increase on employment depending
on the productivity levels for both countries analysed. The calculations for Russia have been
run on the RLMS dataset for 2005 and the calculations for Ukraine on the ULMS dataset for
2003.
We have estimated the log linear wage model for both Ukraine and Russia. The model
specification in both cases included: age, age square, gender, region of residence and
education level of an individual. In both cases the model has been estimated only for full-time
p-high
employment
flexible wage case p-high
employment
rigid wage case p-low
p-high
wage
productivity p-low
(a) wage
(b)
productivity p-low
(c)

CASE Network Studies & Analyses No.398 Social security driven Tax wedge and its effects…
25
employees. In order to exclude outliers, the observations from the lowest and highest wage
percentiles have been excluded.
The next step of our analysis was to calculate the fitted values from the model (expected
wages) for the entire working age population (15-74). These would serve as the proxies for
individual productivity levels. Actual employment rates have been calculated for each
percentile of the expected wage distribution. A simple bivariate model has been estimated for
both countries relating the employment rate for each percentile of expected wage distribution
to the respective average log-expected wage. Log wage has been used as the explanatory
variable in order to take into account the concavity of the expected wage (productivity) –
employment relationship as is clearly visible on Chart 4.1. As a result, we have obtained two
functions of the employment rate to expected wage level as presented on Chart 4.1. This
function mimics the theoretical relationship presented in Figure 4.1 panel (c).
Using the estimated functions one can now calibrate the expected employment effect of a
proportional tax wedge change in Russia and in Ukraine for various labour force groups
defined by their expected wage levels. This has been done, and the results of a 10% tax
wedge cut for both countries are presented in Chart 4.2 where, for the sake of comparability,
the expected wage levels on the horizontal axis have been replaced by the respective
percentiles. The percentage change of employment has been placed on the vertical axis of
Chart 4.2.
Chart 4.1. The actual and fitted relationship between estimated expected monthly wage and employment rates for Russia (2005) and Ukraine (2003). Russia
0%
10%
20%
30%
40%
50%
60%
70%
80%
90%
100%
0 2000 4000 6000 8000 10000 12000 14000 16000
Expected w age
Empl
oym
ent r
ate
Actual wages and em ploym ent rates Estim ated function (from logwage)

CASE Network Studies & Analyses No.398 Social security driven Tax wedge and its effects…
26
Ukraine
0%
10%
20%
30%
40%
50%
60%
70%
80%
90%
100%
0 50 100 150 200 250 300 350 400 450 500
Expected wage
Empl
oym
ent r
ate
Actual wages and employment rates Estimated function (from logwage)
Source: Own calculations based on RLMS 2005 for Russia and ULMS 2003 for Ukraine. Chart 4.2 The calibrated percentage changes in employment for percentiles of estimated expected wage in Russia and Ukraine.
0%
10%
20%
30%
40%
50%
60%
70%
80%
0 10 20 30 40 50 60 70 80 90 100
Percentiles of expected wages
Perc
enta
ge E
mpl
oym
ent g
row
th a
fter 1
0% p
ropo
rtio
nal r
educ
tion
in
tax
wed
ge
Employment growth % - Russia Employment growth % - Ukraine Source: Own calculations based on RLMS 2005 for Russia and ULMS 2003 for Ukraine. As one can see, the total employment effects of the tax wedge cut have been calibrated to
be much higher in Ukraine than in Russia. The total employment result of the 10% tax cut

CASE Network Studies & Analyses No.398 Social security driven Tax wedge and its effects…
27
increase according to our results would be 6% employment growth in Russia and as much as
15% employment growth in Ukraine.
There are also (and this is the most important result from our point of view) pronounced
differences between the employment effects for more productive workers (with higher
expected wages) and less productive workers (with lower expected wages) in both countries.
The number of employed with expected wages below the median would grow in Russia by
11% and in Ukraine by 24%. For those above the median, the respective changes would
reach 4% in Russia and 11% in Ukraine.
The results of this simple econometric exercise are only illustrative. They should not be
treated as point estimates of effects of any real processes. They shed some light, however,
on possible differences between the tax wedge influence on employment levels of
unproductive, unskilled workers characterised by low and rigid wages, and highly productive
skilled workers with high and flexible wages. The difference in results between countries
analysed is also very interesting. They obviously result from differences in the starting levels
of both total and relative employment rates for various groups of the labour force in Russia
and Ukraine.

CASE Network Studies & Analyses No.398 Social security driven Tax wedge and its effects…
28
5. Tax wedge and shadow employment – estimations for Ukraine
The next point of our analysis is to estimate the effect of a tax wedge change on shadow
employment. We tried to run such an exercise on the basis of the Ukrainian tax reform of
2005. One of the crucial points in studying shadow employment is the ability to identify
shadow activities, shadow income, or the simple fact of shadow employment. Unfortunately,
none of the data sources at our disposal provided the possibility to observe shadow
employment directly when the tax wedge changed in Ukraine.
The ULMS has attempted to ask for shadow employment directly. The survey questionnaire
contained the question, “Are you officially registered at this job, that is, on a work roster, work
agreement, or contract?”. Unfortunately, this question is related only to the current (or most
recent) job, which for the first wave of the ULMS was 2002 or 2003. We can observe the
distribution of the low-skilled and high-skilled workers who self-reported being officially
registered or not registered at their current job. However, because we do not have
longitudinal data over the time period when the tax wedge changed, we are unable to make
any statistical arguments about the effect of social security taxes on this distribution. Even if
we had the longitudinal data, we could not capture the entire phenomenon of unofficial
employment with the ULMS data. The question cited above allows capturing only fully
unofficial (unregistered) employment. However, conversations with Ukrainian employees and
employers suggest that, in some cases, shadow employment results from underreporting
hours of work or wages rather than non-registered employment. Nevertheless, we use this
information later to estimate the income effect of being employed in the shadow economy.
The UHES does not have an indicator for a person who has unofficial employment. However,
it has data on personal and family expenditures and, therefore, we can try to estimate
unofficial employment income as the difference between incomes and expenditures of a
family. Because expenditures are reported at the level of the household, we can not
determine if a specific member of the household is involved in the shadow economy. We can
determine only that the household has shadow (unreported) income, if the amount of
household expenditures exceeds the amount of household income. Because UHES is a
special tool to study household expenditures, it has more accurate and detailed information
about the expenditures than the revenues. One of the peculiarities of the survey is that it
allows for the estimation of the amount of household self-production consumed by the same

CASE Network Studies & Analyses No.398 Social security driven Tax wedge and its effects…
29
household. This amount is not reported by the household as a source of income. However,
this amount is included in the total household expenditures. Therefore, own production of
food for own household consumption is considered as “shadow income” according to our
definition. Unfortunately, the dataset available for this study was a reduced version of the
original UHES data. It excluded detailed information about expenditures, and contains only
information about total household income. Therefore, we were unable to calculate the
household expenditures without consumption of self-produced food.
In order to reduce disparities from inclusion of the production of food for personal
consumption into the total expenditures, and since even without this disparity it is unlikely
that income and expenditures in a given month or three-month period match exactly, we
mark the household as “receiving shadow income” only if the per-capita (difference divided
by number of members of the household) difference between expenditures and income
exceeds 100 UAH (approximately $20 in 2005).
The UHES data reports income from the same source at both the family and individual
member levels. In 1999-2002, these numbers do not always match. Because of this
discrepancy, we created three possible indicators of the shadow economy: one based on the
household-level income reported in UHES, another is based on the sum of individual
incomes reported by the household members (plus incomes from sources that are reported
only at the household level), and the third assuming that there is a shadow income if
individual and household level incomes do not match. All of these are based on the simple
assumption that, speaking about their individual incomes, the respondents are likely to report
only their official incomes, while when reporting on total incomes or expenditures they are
more likely to reveal actual income levels.
The distribution of households by education level of the head of the household (used as a
proxy for skills in this case) is significantly different for families that are identified as receiving
shadow income and families without shadow income. Table 5.1 presents the distribution for
the shadow income defined as total income reported in the household-level data and total
household expenditures. Because household-level data for 2003 available for this study
contained limited information, we are unable to report this distribution for 2003. However, this
problem was fixed by using individual-level income data in Table 5.2. Table 5.2 presents the
distribution of families by education level of the head of household in families with and
without shadow income. In this table the shadow income is identified as the difference
between total household expenditures (reported in household level data) and the sum of
incomes of household members (reported at the individual level in a separate dataset).

CASE Network Studies & Analyses No.398 Social security driven Tax wedge and its effects…
30
Table 5.1 Distribution of households with and without shadow income by education level of the head of household (shadow indicator: difference between sum of incomes and sum of expenditures reported at household level)
No shadow income 1999 2000 2001 2002 2003 2004 q1 2004 q4 2005
Higher 16.08 14.43 14.44 16.08 19.80 18.30 20.15Bachelor 1.11 2.32 0.51 0.57 1.11 1.11 0.64Unfinished higher 23.73 19.50 20.84 22.83 21.23 20.40 20.90High school 31.31 34.19 34.50 34.10 35.95 36.31 37.25Middle school 11.02 13.32 14.10 13.98 12.88 13.55 12.61Junior school 11.78 11.33 11.23 9.24 6.95 7.53 6.65Does not have junior 3.99 3.27 3.34 2.23 1.44 1.63 1.32Can not read 0.90 1.44 0.76 0.50 0.11 0.24 0.20No answer 0.08 0.18 0.28 0.48 0.53 0.94 0.28
Shadow income Higher 16.02 16.37 15.35 5.29 5.44 2.32 5.08Bachelor 1.30 2.36 1.34 0.00 0.47 0.00 0.73Unfinished higher 23.72 21.19 22.76 28.37 13.95 17.50 16.67High school 29.54 32.78 33.69 33.61 40.55 53.46 53.59Middle school 11.97 13.23 14.13 22.43 19.94 14.60 14.51Junior school 13.12 10.20 9.64 5.47 13.96 6.77 6.77Does not have junior 3.33 2.93 2.07 3.16 3.90 2.99 2.08Can not read 0.83 0.67 0.55 1.67 1.26 0.51 0.00No answer 0.18 0.27 0.48 0.00 0.51 1.85 0.57
Table 5.2. Distribution of households with and without shadow income by education level of the head of household (shadow indicator: difference between sum of members’ incomes and total household expenditures)
No shadow income 1999 2000 2001 2002 2003 2004 q1 2004 q4 2005
Higher 28.84 21.50 19.27 16.33 18.31 19.80 18.30 20.15Bachelor 1.21 4.43 0.54 0.55 1.05 1.11 1.11 0.64Unfinished higher 24.70 22.24 26.05 22.88 20.04 21.23 20.40 20.90High school 26.09 33.57 34.68 33.60 35.39 35.95 36.31 37.25Middle school 7.92 7.76 9.03 14.03 14.24 12.88 13.55 12.61Junior school 7.61 8.14 8.21 9.41 8.23 6.95 7.53 6.65Does not have junior 3.25 1.02 1.65 2.20 2.00 1.44 1.63 1.32Can not read 0.38 1.34 0.17 0.51 0.41 0.11 0.24 0.20No answer 0.00 0.00 0.40 0.48 0.32 0.53 0.94 0.28
Shadow income Higher 15.45 15.80 14.78 8.98 8.54 8.01 6.46 7.57Bachelor 1.28 2.26 1.20 0.80 1.60 0.68 0.94 0.75Unfinished higher 23.67 20.86 22.00 22.18 14.94 15.73 16.50 16.73High school 29.94 32.98 33.80 45.84 45.41 39.79 49.00 51.54Middle school 12.02 13.50 14.56 13.54 16.69 18.69 16.40 14.55Junior school 13.18 10.49 10.16 4.81 8.45 12.56 7.68 7.05Does not have junior 3.42 3.08 2.42 2.97 3.25 3.39 1.59 1.21Can not read 0.86 0.77 0.63 0.45 0.40 0.60 0.14 0.17No answer 0.17 0.26 0.43 0.43 0.72 0.56 1.28 0.44

CASE Network Studies & Analyses No.398 Social security driven Tax wedge and its effects…
31
The results of Table 5.1 and Table 5.2 are similar. As we approach the most recent years,
particularly 2004-2005, we observe that the proportion of households headed by high-school
graduates in the group with shadow income increases, while the proportion of people with
higher education significantly decreases.
One of the possible explanations for that is that new payroll taxes introduced in 2004
significantly reduced the tax wedge for salaries exceeding the “payroll tax maximum”
(incomes over 2400 UAH a month at the beginning). The reduction of the tax wedge reduced
the stimulus for engaging in shadow employment. The most educated (high-skilled) people
are most likely to receive high wages. It is also likely that working members of households
headed by a person with higher education have similar education levels. Therefore, once the
tax wedge on high wages is reduced, these people are most likely to stay out of shadow
employment. The category of the most educated persons may also include people with
incomplete higher education, since a university diploma is not a prerequisite of success at
work, but study at a university is a potential indicator of the high abilities of the individual.
The next category, people with completed high school education, should be affected by the
payroll tax maximum in the opposite direction. This category of people is sufficiently
educated (“semi-skilled”); therefore, they are likely to work for wages that are higher than
minimum wage. However, their wages are likely to be lower than wages of people with higher
education, and are lower than the maximum taxable by payroll taxes. Therefore, paying
payroll taxes on employees with complete higher education is most costly for an employer on
a per-employee basis. An employer might be interested in officially registering and paying an
extremely high official wage to a person with a high education, simultaneously decreasing
the wage or number of registered employees with high school diplomas. The increase in
wages for people with higher education is not taxed by the payroll tax since it is above the
maximum. This increase then can be unofficially re-distributed by the employer to the non-
registered employees with high-school diplomas. The overall tax obligation of the enterprise
will decrease. At the same time, it is less likely that such a tax evasion scheme will be used
for low-skilled (with education below high school) employees. These employees are working
at wages close to the minimum wage and the gain from unofficially employing such people is
smaller, while the risk for the employer of being caught by tax inspection remains the same.
In order to investigate this hypothesis, we combined our household-level UHES data into a
single file and ran a simple regression to determine if a reduction of the tax wage has an
impact on the probability of participating in the shadow economy. Combining the UHES
CASE Network Studies & Analyses No.398 Social security driven Tax wedge and its effects…
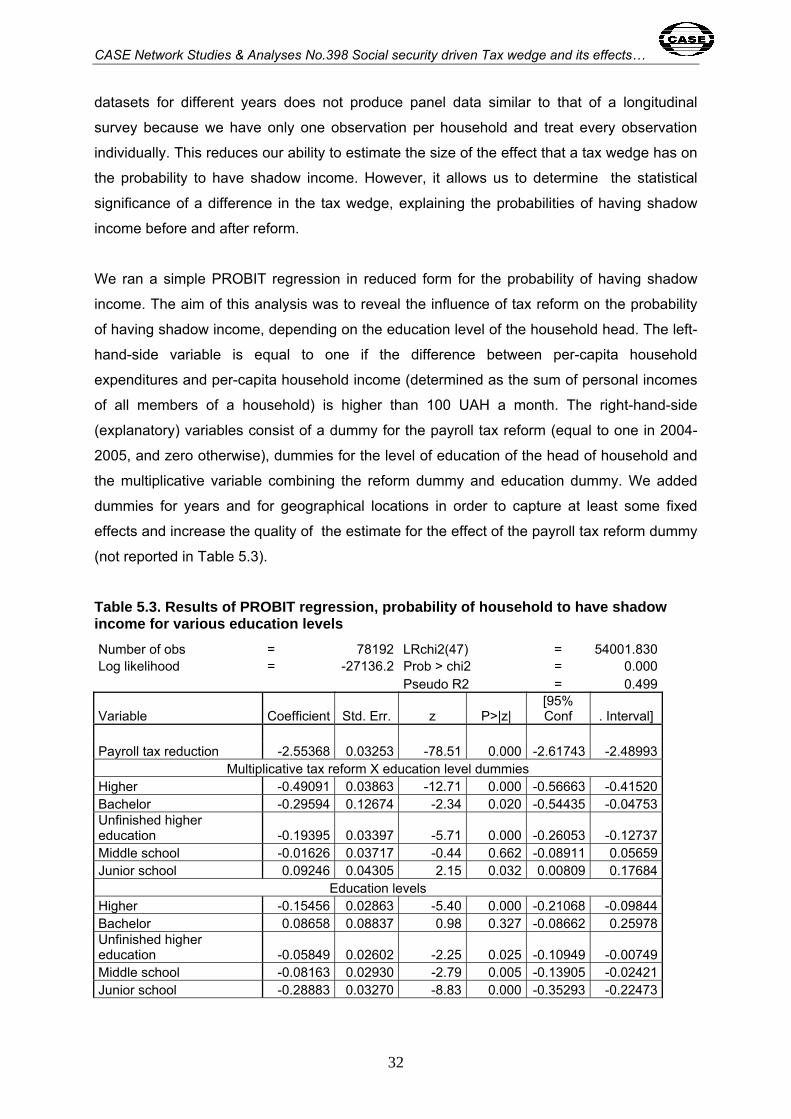
32
datasets for different years does not produce panel data similar to that of a longitudinal
survey because we have only one observation per household and treat every observation
individually. This reduces our ability to estimate the size of the effect that a tax wedge has on
the probability to have shadow income. However, it allows us to determine the statistical
significance of a difference in the tax wedge, explaining the probabilities of having shadow
income before and after reform.
We ran a simple PROBIT regression in reduced form for the probability of having shadow
income. The aim of this analysis was to reveal the influence of tax reform on the probability
of having shadow income, depending on the education level of the household head. The left-
hand-side variable is equal to one if the difference between per-capita household
expenditures and per-capita household income (determined as the sum of personal incomes
of all members of a household) is higher than 100 UAH a month. The right-hand-side
(explanatory) variables consist of a dummy for the payroll tax reform (equal to one in 2004-
2005, and zero otherwise), dummies for the level of education of the head of household and
the multiplicative variable combining the reform dummy and education dummy. We added
dummies for years and for geographical locations in order to capture at least some fixed
effects and increase the quality of the estimate for the effect of the payroll tax reform dummy
(not reported in Table 5.3).
Table 5.3. Results of PROBIT regression, probability of household to have shadow income for various education levels Number of obs = 78192 LRchi2(47) = 54001.830Log likelihood = -27136.2 Prob > chi2 = 0.000 Pseudo R2 = 0.499
Variable Coefficient Std. Err. z P>|z| [95% Conf . Interval]
Payroll tax reduction -2.55368 0.03253 -78.51 0.000 -2.61743 -2.48993
Multiplicative tax reform X education level dummies Higher -0.49091 0.03863 -12.71 0.000 -0.56663 -0.41520Bachelor -0.29594 0.12674 -2.34 0.020 -0.54435 -0.04753Unfinished higher education -0.19395 0.03397 -5.71 0.000 -0.26053 -0.12737Middle school -0.01626 0.03717 -0.44 0.662 -0.08911 0.05659Junior school 0.09246 0.04305 2.15 0.032 0.00809 0.17684
Education levels Higher -0.15456 0.02863 -5.40 0.000 -0.21068 -0.09844Bachelor 0.08658 0.08837 0.98 0.327 -0.08662 0.25978Unfinished higher education -0.05849 0.02602 -2.25 0.025 -0.10949 -0.00749Middle school -0.08163 0.02930 -2.79 0.005 -0.13905 -0.02421Junior school -0.28883 0.03270 -8.83 0.000 -0.35293 -0.22473

CASE Network Studies & Analyses No.398 Social security driven Tax wedge and its effects…
33
Source: Own calculations based on UHES data for years 2000-2005. High school is the base category for education levels.
The results of the regression seem to partially support our hypothesis of a much stronger
effect of the most recent tax reforms on the probability of having shadow income in the case
of households headed by a person with finished higher education. The coefficient for the
reform period, as such, is negative and significant, indicating the overall expected negative
influence of tax reform for the probability of having shadow income. The coefficients on the
multiplicative dummies indicate that the result of the reform was much stronger for those with
at least unfinished higher education. It seems, therefore, that the most recent tax reform in
Ukraine could lead to an overall reduction of shadow employment. It proves implicitly that
there exists a significant interdependence between tax wedge levels and shadow
employment, this being the most important result from the point of view of our analysis. On
the other hand, our findings indicate that the reform was not able to target those groups who
are expected to engage in the shadow economy most often, i.e. low-skilled persons.

CASE Network Studies & Analyses No.398 Social security driven Tax wedge and its effects…
34
6. Shadow employment, wages and access to social security in Ukraine and Russia
6.1 Some assessments of the size of the informal employment According to existing evidence, the current scale of informal employment in Russia is
significant, albeit not as high as e.g. in less developed countries. The combined share of
non-agricultural, informal employment among the urban population is about 14% – 16%.
About two-thirds of the urban, non-agricultural, informal workers are not actually
unregistered; they do work legally but a significant part of their wage is paid off-the-record, by
so-called “envelope payments”. At the same time, persons working in enterprises of the
formal sector account for over half of the total informal employment headcount (Sinavskaya
2005).
Migration to informal employment is clearly stimulated by an excessive level of taxation.
According to the results of the survey of 1,000 SMEs in five Russian regions performed by
the National Institute of Systemic Studies of Entrepreneurship in 2002, small businesses
during 1999 – 2002 had not officially registered up to 30% of their payroll. Informal interviews
with business infrastructure representatives have shown that unofficial cash payments
amounted to 30% – 60% of the total SME payrolls (note that the lower limit of these
estimates coincides with SMEs’ self-assessment). The survey results confirmed that the UST
level is the major reason behind ‘migration to shadow’. (Liberal Hosting 2000) Moreover, the
larger the proportion of labor costs in production cost, the higher the share of the shadow
employment in SMEs, since high current rates of social insurance contributions induce small
businesses to understate their official wage figures.
The ILO bureau in Moscow reported that in the late 1990s, even in officially registered
enterprises, actual wage figures were substantially higher compared to those fixed in labor
contracts, with differences varying from two to twenty times. Informal cash payments are
largely a result of a flight from high social payroll taxes. According to minimal estimates, 12%
to 15% of the employees’ working time is actually ‘in the shadow’, which enables employers
to increase their wages by 13% on average. (Kosals 1999) Overall, the informal sector is
responsible for generating from 25% (Rosstat estimate) to 50% (Ministry of Internal Affairs
estimate) of the total wage bill. That is the reason why Rosstat publishes two estimates of the
households’ income structure: one figure corrected for the hidden payroll fund, and another

CASE Network Studies & Analyses No.398 Social security driven Tax wedge and its effects…
35
one without such a correction. If we analyse the corrected income structure, we find out that
the proportion of wages in total incomes increases almost twice as compared to the
uncorrected one.
According to more recent data, the reduction of the UST rate has not turned the trend
towards informal employment growth and has not noticeably affected the scope of shadow
cash payments. (Development Centre 2006) The survey performed by Rosstat in February
2006 has demonstrated that informal employment in Russia continued to increase. In 2005,
the number of employed in the informal sector of the Russian economy increased by 0.1
million people to a total of 11.6 million, or 17% of the total number of employed. Importantly,
the number of employed exclusively in the informal sector has grown by 0.3 million, while the
number of those who combined formal and informal employment has decreased. Hence,
despite the reduction of informal employment growth rates in 2005, it has still accounted for
about a half of the total employment growth. This means that the reduction of the UST rate in
2005 was not radical enough to induce the legalisation of labor relations.
The growth of informal employment in 2005 has affected the majority of economic sectors. In
industry and construction, it was accompanied by a continuing reduction of the official
employment at large and medium-sized enterprises. This is most probably due to the fact
that in the situation of the growing demand for labor, its use is still being ‘optimized’ by
transferring it into the informal sphere.
A noticeable reduction of informal employment in transportation and agriculture could hardly
be attributed to employment legalization since it was accompanied by a decline in official
employment as well, which is indicative of a general reduction of demand for labor in these
sectors. It is only in the retail trade that the growth of official employment comparable in scale
to a reduction of its informal component could indicate the flow of employment into organised
forms. The reason behind this is that small retail outlets traditionally practicing “grey” turnover
and informal employment are being driven out by large retail networks. The latter, especially
those with foreign capital participation, as a rule tend to comply with existing legislation,
including employment regulations.
The available data on Ukraine is not so detailed, although accessible information
demonstrates largely similar results. The Institute of Competitive Society performed several
surveys of focus groups in order to identify entrepreneurs’ expectations regarding the STS
reform. Seven focus groups were organized in Khmelnitsky, Belaya Tserkov,
Dneprodzerzhinsk, Lutsk, Chernovtsy, and two focus groups in Kiev containing

CASE Network Studies & Analyses No.398 Social security driven Tax wedge and its effects…
36
representatives from all over Ukraine. The surveys have identified the following trends
regarding employment:
• registration of employees as entrepreneurs and replacement of labor relations by
economic ones;
• retention of the number of employees accompanied by a formal reduction of working
hours paid for officially (use of unofficial ‘envelope’ cash payments);
• a real reduction of the number of workers (accompanied by production decline);
• a reduction of the number of officially employed workers and use of informal employment
with illegal payments.
As could be seen, any of the employment options induces a concealment of labor relations,
with the third option (legal behavior) leading to a reduction of entrepreneurial activities.
Available data indicate that the informal economy is common in Ukraine as well. However, it
is more often related to episodic or short-term activities, unofficial activities in the household
sector, and self-employment activities, for example, which are more oriented towards survival
(last resort providing subsistence income). Most likely, this is one of the substantial
differences between informal employment in Ukraine versus in Russia.
Ukraine presents a lot of opportunities for informal activities and unregistered employment,
often incidental and very short-term. According to information provided by Mel'ota and
Gregory (2001a), unofficial activities in the Ukrainian household sector are estimated at 16%
of official GDP and are a major source of the shadow economy in the country. In the situation
of a relatively low demand for labor and due to the very small size of unemployment benefits,
many people undertake various self-employment activities in order to survive; other people
leave the official labor market, preferring to engage in informal activities or at a household
plot; others are leaving the labor market completely, seeking additional income sources such
as a stipend, pension, child care allowance, etc. Many unemployed are occasionally involved
in unofficial labor or entrepreneurial activities which, to some extent, provide a means of
subsistence. The most popular types of incidental unregistered activities in Ukraine include
transportation services, construction and repair works, tutoring and writing of control tests
and term papers, tailor services and handicrafts, welding services and car repair, low-skilled
agricultural labor for private households and other personal services.
One of the explanations of existing differences between Ukraine and Russia in terms of
informal employment could be different levels of minimum wages. As distinct from Russia,

CASE Network Studies & Analyses No.398 Social security driven Tax wedge and its effects…
37
where this level is extremely low (less than 10% of the average wage), in Ukraine it has been
increased to 44% of the average wage in 2002. This has clearly served as an incentive for
entrepreneurs to legalize wages, as well as implied that the minimum wage has regained its
role as a tool for limiting wage inequalities and protecting wages of workers with weak
bargaining power (Rutkowski 2006).
Payroll taxes in Ukraine are likely to both dampen labor demand by raising labor costs
(particularly given the relatively high minimum wage which limits the scope for passing the
tax to labor) and to reduce labor supply by reducing the take-home pay. Moreover, they are
most probably an important factor behind the growth in the informal sector (Ukraine Jobs
Study 2005).
On the whole, as concerns illegal hiring of the labor force, the authors of the cited report on
Russia stress that factors affecting the probability of migrating into shadow employment are
not yet adequately studied due to the limited representation of this workers’ group in
sampling surveys (Sinavskaya 2005).
6.2 Informal employment and wages The next step of our analysis was to assess the results of being employed in the shadow
economy for wages and access to social services provided by companies and public social
security. We have estimated the net incomes model in which shadow employment has been
used as one of the explanatory variables. Similar models have been estimated for Russia
using RLMS data for 2005 and for Ukraine using ULMS data for 2003. In both cases we have
run simple OLS regressions with the log of income from the main job used as the dependent
variable. The set of explanatory variables, apart from the dummy for unregistered activity,
included: age, gender, education, tenure, working hours, code of economic activity of the
enterprise and regional dummies.
As we have already mentioned, using the direct responses to the question about current job
of the respondent being registered or not either in RLMS or in ULMS does not result in full
coverage of shadow employment in either case. We are able to identify only those
performing fully unregistered jobs and not those employed legally for minimum wage or for a
wage close to the minimum and receiving the rest of their remuneration in the form of
additional, unregistered cash payments – “envelope payments”. Hence, any results we
describe below in this section relate to this specific kind of “clear” shadow employment.

CASE Network Studies & Analyses No.398 Social security driven Tax wedge and its effects…
38
The results of our analysis indicate a negative, but only a marginally significant negative,
influence of the shadow employment on net incomes from the main job, as the coefficients of
the shadow employment variable are significant only at 5% confidence level in both
countries.
Table 6.1 Influence of shadow employment on net incomes from main job in Russia and Ukraine. Results of econometric estimations.
Russia Ukraine Education Education
Secondary vocational
-0.33 Tertiary-Vocational -0.26
Vocational -0.47 Secondary general -0.36
Below vocational -0.48 Vocational -0.37
Below vocational -0.43
Female -0.34 Female -0.28
age -0.005 Age -0.005
tenure 0.008 Tenure 0.005
Hours worked 0.007 -
Shadow Employment
-0.12* Shadow Employment
-0.08*
Observations 4356 Observations 3357
R-squared 0.36 R-squared 0.31 * - Significant at 5% confidence level only.
In the case of Russia, work in shadow employment decreases the net wage by about 12%
and in Ukraine by 8%. This means that working in the shadow economy should not be
treated as a way to increase wages. Those taking unregistered jobs must accept lower
wages. It suggests that shadow employment in these countries is primarily a way to escape
unemployment and poverty and not a way of simple tax evasion.
One must take into account, however, that our results concern only those whose jobs are not
registered at all. In the case of those employed legally and receiving part of their wage off-
the-record, the motivation of income enhancement is an obvious one.

CASE Network Studies & Analyses No.398 Social security driven Tax wedge and its effects…
39
6.3 Impact of being informally employed on access to social security benefits and EPL
Both theory and common sense suggest that unregistered employment is an unequivocally
negative phenomenon for an employee because of a lack of guarantees, formal rights,
grounds for court proceedings, etc. However, among 279 respondents from Moscow,
Novosibirsk, Perm and Nadym engaged in unregistered (without a written contract)
employment, 19% responded that “it is profitable for myself, employer has nothing to do with
it”, and 42% considered the situation as profitable for both employer and employee (NISP
2003).
All categories of workers think that losses from EPL non-compliance outweigh the respective
gains. However, those in an admittedly illegal situation (employed without a written contract)
regard this balance of gains and losses more optimistically. For instance, the opinion that
EPL non-compliance brings more losses than gains to workers, and they tolerate it only
because they are unable to change the situation, is characteristic for public sector employees
(75%) and industrial workers (64%). At the same time, this opinion is shared by only 43% of
those employed without a written contract and by 44% of SME workers, whereas EPL non-
compliance is widespread.
Research on Russia based on RLMS indicates that there are “enclaves” where labor rights of
workers in the informal sector are protected even to a greater extent than in the formal one.
(Sinavskaya 2005) RLMS data indicate that wage arrears and forced administrative leave are
more widespread in enterprises of the formal sector. According to a Moscow Carnegie
Center survey, 86% of respondents with primary, nonagricultural, informal employment
replied that their wages are paid in due time and only 7% mentioned wage arrears, while for
respondents employed formally, these proportions constitute 78% and 23% respectively.
According to RLMS data, 18% of respondents with primary informal employment and 23% of
those employed officially mentioned wage arrears. Thus, apart from higher remuneration,
informal employment generally ensures more stable current income, but is accompanied by a
lack of social guarantees and a higher level of instability.
The majority of workers cannot see any difference between formal (‘white’) and informal
(‘black’) wages. Since the size of most government guarantees (minimum wage,
unemployment benefits, pensions) is miserable, and they are not ‘insured’ against various
‘contingencies’ (lack of indexation mechanism, no guarantees of payments regularity), many
workers prefer to agree to informal cash payments, not thinking about contributions to the

CASE Network Studies & Analyses No.398 Social security driven Tax wedge and its effects…
40
funds that they would “probably” need later in their lives. The situation of widespread EPL
non-compliance to some extent equalizes the positions of the formally and informally
employed from the viewpoint of their labor rights protection. The situation of social protection
of workers also looks similar (Barsukova 2003).
On the other hand, in both countries, the status of being formally employed provides access
to a number of benefits financed through the system of obligatory government social
insurance – labor pensions, unemployment benefits, temporary disability benefits, benefits to
compensate the costs related to childbirths and funerals, and industrial accident benefits.
In Russia, informal employment deprives employees of the right for labor pension insurance. However, in practice, individual motivation to comply is rather weak. Individuals
do not expect to get any return on paid taxes, for example, in the form of public good
provision or social security provision from the present unreformed PAYG system.
This is primarily connected with very low pension benefits: the ratio of average pensions to
average wages (pension replacement ratio) is about 23% and tends to fall further; in addition,
an average pension represents only 96% of a subsistence minimum. As a result, incentives
to contribute to the tax system are low. Moreover, unregistered workers mostly belong to the
younger generation who are not really thinking about future pensions, while those closer to
retirement age try to locate themselves within the formal sector.
The World Bank studies on Ukraine indicate a similar picture. Currently, the link between
social insurance contributions and pension benefits is weak and almost nonexistent, lowering
the incentives for individuals to comply. Despite some changes made in the legislation and
the benefit formula, the benefits are currently almost flat. Thus, the only significant link
between payments and benefits is to be a participant in the system and, consequently, to
receive a pension payment, almost regardless of the amount contributed. Clearly, this does
not create an incentive for contributors to report their “real” income to the system, particularly
contributors in the mid-range and higher income brackets (Public Finance Review 2006).
In Ukraine, the increase in the minimum pension currently occurs automatically up to the
level of the “subsistence minimum.” The subsistence minimum is a national amount set by
the government each year in the annual budget. This link between the “subsistence
minimum” and pension insurance blurs the distinction between social insurance and poverty-
targeted social assistance, confuses the pension dialogue, and leads to wasteful transfers
which poorly target poverty. More importantly, from the viewpoint of the current study, the

CASE Network Studies & Analyses No.398 Social security driven Tax wedge and its effects…
41
difference in accessibility of pension benefits between the “legally” and “illegally” employed
becomes blurred.
In Ukraine, the overall construction of the law "On obligatory state social insurance in case of
unemployment" does not stimulate participation in the system and the payment of
contributions. Moreover, the fact that the respective security benefits are missing is often of
minor importance.
Social benefits for the unemployed in Ukraine are also, on average, extremely low and
cannot be regarded as a significant factor affecting the duration of unemployment. (Kupets
2005) Their size, although related to the number of years for which social security payments
were paid, is in general rather low (58% of the minimum wage and 26% of an average wage
in 2003). In addition, the number of years of security payments adds very little to the overall
unemployment benefit. In fact, only a small proportion of those unemployed rely on benefits
as a means of subsistence. As regards sickness benefits, their size varies from 60 to 100%
of an average employee wage depending on the continuity of employment. It is only after
eight years of continuous employment that a worker becomes entitled to be paid 100% of its
wage as a temporary disability benefit.
Similarly, in Russia, the impact of being informally employed on access to social security
and social protection schemes is of rather marginal importance.
For Russian SMEs or other firms using STS or imputed income tax, the size of temporary disability benefits is determined by the Federal Law No. 190-FZ of December 31st 2002 “On
the provision of social security benefits to citizens employed by organizations or by individual
entrepreneurs using special taxation regimes”. According to the law, temporary disability
benefits are paid from two sources:
• the Federal Social Security Fund refunds, to the employer, a part of his expenses
related to the payment of a temporary disability benefit to a sick employee, not
exceeding one minimum wage (MROT) per month;
• from the enterprise’s own funds as regards amounts exceeding one minimum, wage.
In other words, firms using STS could obtain directly from the Social Security Fund only RUR
1,100 (or somewhat more where regional coefficients are applied) for a full calendar month.
The remaining part would have to be paid by the entrepreneur from his own funds. This

CASE Network Studies & Analyses No.398 Social security driven Tax wedge and its effects…
42
refers both to sickness benefits (including those related to industrial accidents or work-
related disease) and maternity benefits.
Importantly, even when employer funds are used for paying sickness benefits, their
maximum size is limited in all taxation systems. For example, in 2006, the threshold for
monthly temporary disability payments was set at RUR 15,000 (about 120% of the average
wage across Russia, but just 78% of the average wage in Moscow). The existence of such
legal limitations in access to sickness benefits further contributes to a relative equalization of
access to these benefits between the formally and informally employed.
According to RLMS data, more than 90% of the officially employed replied that they had an
opportunity to draw on such social guarantees as a sickness benefit and maternity benefit.
The Moscow Carnegie Center survey demonstrated that 89% of formally employed had an
opportunity to use their right to draw on temporary disability benefits. Among the informally
employed, the proportion of workers enjoying similar rights is, naturally, considerably lower.
(Sinavskaya 2005)
Other social guarantees (coverage of medical insurance, education, lodging, transportation,
etc.) are offered to a substantially fewer number of workers – both formally and informally
employed.
The very definition of informal employment chosen for the current analysis assumes that the
absence of registration of labor relations should lead to the exclusion of the informally
employed from the domain of social and employment protection legislation. Hence, limited
access of the informally employed to social guarantees is not surprising. More surprising is
the fact that informal workers have mentioned these guarantees at all as their rights
connected with current employment. For example, according to RLMS, the right for an
annual paid vacation was mentioned by 93% of contractually employed and by 15% of those
who were employed without a written contract. Even more surprising are the results of the
Moscow Carnegie Center survey, according to which 40% of the informally employed
enjoyed the right for an annual paid leave, but only 21% have made use of such an
opportunity.
Having discovered this, we have tried to run an econometric exercise in order to assess the
access of those informally employed to some social services provided by employers as
compared to those formally employed. We have run a similar model similar for wages and
access to social services as has been defined as the number of services such as (paid leave,

CASE Network Studies & Analyses No.398 Social security driven Tax wedge and its effects…
43
access to preschool, sickness leave, paid holidays etc.) an employee is entitled to in her/his
main job. Once again, RLMS data for 2005 and ULMS data for 2003 were used for the
calculations.
Our results indicate that engaging in shadow employment limits the access to social services
of the employed in both countries. The respective significant coefficients are -2,34 in Russia
(with the average number of services available of 3.6 and the maximum number of 11) and -
1,12 in Ukraine (with average number of services available of 3.2 and the maximum number
of 13). The interpretation of these coefficients is straightforward – as the expected number of
services lost by those in shadow employment. It would mean that Ukrainian shadow
employees loose much less of their rights in the case of shadow employment than their
Russian counterparts.

CASE Network Studies & Analyses No.398 Social security driven Tax wedge and its effects…
44
7. Conclusions
In recent years both countries undertook serious steps in order to reform their payroll tax
system. The reduction of shadow employment was one of the main objectives declared by
both reforms. On the other hand, however, the main result of both reforms was to simplify the
tax system from the point of view of entrepreneurs and lower taxes paid by this category of
the labor force. Taxes paid by employees, especially by those with lower wages, did not
change significantly. It seems that both reforms were partially successful in encouraging
some entrepreneurs to disclose their activities. The Ukrainian reform could also lead to
partial success in legalizing wages of workers earning higher wages. It seems, however, that
it did not affect the behavior of low-wage workers in the shadow economy and, in some
specific cases, the effect could even be perverse.
Our results indicate a serious reduction of the size of the tax wedge for less-skilled (low-
wage) workers could have significant effects on employment levels of this group. It seems
also that it could limit the size of the shadow economy; however, our results do not show this
explicitly. We show that unskilled persons engaged in unregistered jobs in Ukraine and
Russia are not “rewarded” with higher net earnings. It seems that, in their case, shadow
employment is the way to escape unemployment and resulting poverty, rather than to evade
taxes. Hence, it seems that, in this case, broadening of general employment opportunities for
this group would result in a decrease in shadow employment.
These results also indicate that there is no immediate effect of the expansion of the tax base
for social contributions and personal income taxes. We observe some growth in the number
of jobs and amount of wages at both ends of the wage distribution. However, the
governments implementing the tax cuts should not expect compensating growth of the tax
base for at least two years (probably more, but our study was able to observe effects of
change in tax rates only in the short-term due to the lack of data).
Being employed illegally limits access to a series of social benefits and services, particularly
those provided by legal employers. On the other hand, however, the size of benefits and
quality of services is very low and it is not enough to encourage those employed in the
shadow economy to legalize their work. Additionally, part of the existing benefits and
services are also accessible for those engaged in shadow employment, due to their general
coverage, creating a free rider problem. Better targeting of social benefits and services,

CASE Network Studies & Analyses No.398 Social security driven Tax wedge and its effects…
45
resulting in quality improvement and limiting free riding, could reduce the incentive to go into
the shadow economy.
The size of the benefits is not the only factor determining its effect on shadow employment.
In this work, we compared two countries, Russia in Ukraine. In recent years, Russia (and the
Russian budget) significantly benefited from favorable conditions on the world oil market,
while Ukraine experienced negative effects of the increased energy prices. This difference
allowed Russia to maintain higher social benefits compared to Ukraine. However, we found
that effect of the SSN benefits on shadow employment was low in both countries. One of the
explanations, discussed in the paper, is the fact that current SSN benefits remain largely
universal, and are not sufficiently tied to former employment history and size of SSN
contributions (or, in other words, most SSN recipients belong to the group who were at the
low wage level and their SSN benefits are not significantly different from the benefit levels of
people who were officially unemployed).

CASE Network Studies & Analyses No.398 Social security driven Tax wedge and its effects…
46
References:
Ackland, R., Falkingham, J. (1997): "A Profile of Poverty in Kyrgyzstan" in Household
Welfare in Central Asia, ed. by F. J. e. al. Basingstoke: Macmillan Press
Belev, B. (2003): The Informal Economy in the EU Accession Countries: Size, Scope,
Trends and Challenges to the Process of EU Enlargement. Center for the Study of
Democracy, http://www.csd.bg/publications/infeconseeaccession/PART01.pdf
Besley, T., Coate, S. (1992): "Workfare Versus Welfare: Incentive Arguments for Work
Requirements in Poverty Alleviation Programs," American Economic Review, Vol. 82:1,
249-26
Barsukova (2003) Теневая занятость: проблемы легализации // Проблемы
прогнозирования. 2003. № 1. С. 136-147. (Shadow Economy: legalization Problems)
Buitano, M. (2000): "Note on Poverty in Ukraine", CAS Background Notes, World Bank,
http://wbln0018.worldbank.org/ECA/ECC11/UkraineCAS/AR/DocLib.nsf/0/.
CBO (1996): "Labor Supply and Taxes", C. B. office
Development Centre (2006) 2ЦЕНТР РАЗВИТИЯ. ОБОЗРЕНИЕ РОССИЙСКОЙ
ЭКОНОМИКИ (за период с 6 по 19 июня 2006 г.)
http://www.vedi.ru/macro_r/macro3406_r.doc (Russian Economy outlook)
CSR (2000): "Osnovnye Napravleniya Sotsial’no-Ekonomicheskoi Politiki Pravitel’stva
Rossiiskoi Federatsii Na Dolgosrochnuyu Perspektivu ", Center of Strategic Research,
http://www.csr.ru/about-publications/plan2010.html
Fox, L. (2003): "Safety Nets in Transition Economies: A Primer ", The World Bank Social
Protection Discussion Paper Series, World Bank
Góra, M., Radziwiłł, A., Sowa, A., and Walewski, M. (2006): "Tax Wedge and Skills: Case
of Poland in International Perspective", CASE Reports #64/2006, CASE,
www.case.com.pl
Gruber, J. (1997): "The Incidence of Payroll Taxation: Evidence from Chile," Journal of
Labour Economics, Vol. 15:3

CASE Network Studies & Analyses No.398 Social security driven Tax wedge and its effects…
47
Gwartney, J., Lawson,R. and Holcombe, R.G., (1998): "The Size and Functions of
Government and Economic Growth", Report to US Joint Economic Committee
ICS (2004) Материал подготовлен Институтом конкурентного общества,
www.ics.org.ua (газета "Частный предприниматель", № 11, июнь 2004 г.) (Material of
Institute of Competitive Society from journal „Private entrepreneur” No. 11, June 2004)
ILO (2001) Из доклада: Предложения к стратегии содействия сокращения бедности
в России: анализ и рекомендации. М.: Московское Бюро МОТ, 2001.
(http://195.16.46.2/publications/files/REP_RUSEdit.pdf) (From lecture: Proposition on
how to reduce poverty in Russia”)
Johnson, S. H., Kaufmann, D. and Zoido, P., (1999): "Corruption, Public Finances, and
the Unofficial Economy", Policy Research Working Paper No. 2169, World Bank,
http://ssrn.com/abstract=192569
Kaufmann, D., Kaliberda, A. (1997): "Integrating the Unofficial Economy into the
Dynamics of Post-Socialist Economies: A Framework of Analysis and Evidence", Policy
Research Working Paper No. 1691, World Bank, http://ssrn.com/abstract=620508
Kosals (1999) Л. Косалс. Между хаосом и социальным порядком. Теневая
экономика. - Pro et Contra, Т. 4. №1, c.41. (Between chaos and social order. Shadow
Economy).
Kupets (2001) О.В. Купец Определяющие факторы продолжительности
безработицы в Украине Консорциум экономических исследований и образования
"Научные доклады" № 05/01 (Selected factors influencing unemployment in Ukraine”)
Kugler, A., Kugler, M. (2003): "The Labor Market Effects of Payroll Taxes in a Middle-
Income Country: Evidence from Columbia", Discussion paper No. 852, IZA
Lindert, K. (2005): "Implementing Means-Tested Welfare Systems in the United States",
Discussion paper, World Bank
Libanova, E. (2001): "Bednost’ V Ukraine: Diagnoz Postavlen — Budem Lechit’?" Zerkalo
nedeli, Vol. 337, http://www.zerkalo-nedeli.com/ie/archiv/337/.
Liberal Hosting (2000) «Коммерческий пролетариат» или малое
предпринимательство? Горизонты россий-ского малого бизнеса http://liberal-
1.hosting.parking.ru/sitan.asp?Num=403 Налоговые проблемы глазами субъектов

CASE Network Studies & Analyses No.398 Social security driven Tax wedge and its effects…
48
малого предпринимательства (“Market Proletariat” or small business? Horizons of
Russian small business”)
Mel’ota, I., Gregory, P. (2001): "New Insights into Ukrainian Shadow Economy: Has It
Already Been Counted?" Institute for Economic Research and Policy Consulting,
http://www.ier.kiev.ua/
Mel’ota, I., Tiessen,U., Vakhnenko, T. (2001): "Fiscal and Regulatory Causes of Shadow
Economies in Transition Countries: Case of Ukraine", Institute for Economic Research
and Policy Consulting, http://www.ier.kiev.ua/
Milanovic, B. (1997): Income, Inequality, and Poverty During the Transition from Planned
to Market Economy. World Bank
Nesporova, A. (2002): "Unemployment in the Transition Economies," Economic Survey of
Europe, Vol. 2
NISP (2003) Project «Illegal labor practices and social transformations in Russia». См.
Барсукова С.Ю. Теневая занятость: проблемы легализации//Проблемы
прогнозирования. 2003. № 1. С. 136-147.
Ovcharova, L. (2002): "Bednost’ V Stranakh S Perekhodnoi Ekonomikoi", Regional
conference “Sotsial’naya politika realii XXI veka: regional’nyi aspekt”, Barnaul
Public Finance Review (2006) Report No. 36671 – UA Ukraine Creating Fiscal Space for
Growth: A Public Finance Review. September 14, 2006, p. 26. (World Bank)
Rutkowski J. (2006) . Labor Market Developments During Economic Transition. World
Bank Policy Research Working Paper 3894, April 2006. p. 36
Sinavskaya (2005) О.В. Синявская НЕФОРМАЛЬНАЯ ЗАНЯТОСТЬ В
СОВРЕМЕННОЙ РОССИИ: ИЗМЕРЕНИЕ, МАСШТАБЫ, ДИНАМИКА. (Non-formal
employment in Russia – measures, size and dynamics”) Научные проекты НИСП —
IISP Working Papers. WP5/2005/01.
Schneider, F. (2003): "The Size and Development of the Shadow Economies and
Shadow Economy Labor Force of 22 Transition and 21 OECD Countries: What Do We
Really Know?" in The Informal Economy in the EU Accession Countries: Size, Scope,
Trends and Challenges to the Process of EU Enlargement, ed. by B. Belev: Center for
the Study of Democracy,

CASE Network Studies & Analyses No.398 Social security driven Tax wedge and its effects…
49
http://www.csd.bg/publications/infeconseeaccession/PART01.pdf.
Ukraine Jobs Study (2005). Fostering Productivity and Job Creation. (In Two Volumes)
Volume II: Technical Chapters. Report No. 32721-UA. November 30, (World Bank)
UNECE (2005): "Towards a New European Model of a Reformed Welfare State: An
Alternative to the United States Model," Economic Survey of Europe, Vol.:1, 105-114
World Bank (2000): "Making Transition Work for Everyone: Poverty and Inequality in
Europe and Central Asia," The World Bank
World Bank (2006) “Ukraine: Creating Fiscal Space for Growth: A Public Finance
Review”. World Bank Report No. 36671 – UA. September 14, 2006