cartographical data treatment analysis for real time three...
TRANSCRIPT
Cartographical Data Treatment Analysis for Real Time Three-Dimensional Terrain Visualization
Flávio L. Mello1, Luiz Felipe C. Ferreira da Silva2
1Divisão de Tecnologia da Informação – Centro Tecnológico do Exército Av. das Américas 28.705, D13, Guaratiba – 23020-470 – Rio de Janeiro – RJ – Brazil
2Seção de Engenharia Cartográfica Instituto Militar de Engenharia – Rio de Janeiro – RJ – Brazil
[email protected], [email protected]
Abstract. The real time three-dimensional terrain visualization is associated to several characteristics, such as the video board exhibition. Moreover, the representation of a virtual scene is carried out through compositions of triangles that together confer a three-dimensional aspect to the scene. The available details in this scene are directly related to the number of triangles amount used in its representation, what may become impeditive to applications like computer visualization. This article presents techniques for cartographic data processing, in order to use them these data in a real time three-dimensional terrain visualization system.
Resumo. A visualização tridimensional de terrenos em tempo real está associada a diversas características, entre elas, a capacidade de exibição das placas de vídeo. Além disto, a representação de um cenário virtual é realizada através de composições de triângulos que juntos conferem um aspecto tridimensional à cena. A riqueza de detalhes presentes neste cenário está diretamente relacionada à quantidade de triângulos utilizados em sua representação, o que muitas vezes torna impeditivo seu emprego em aplicações desta natureza. Este artigo apresenta técnicas de processamento de dados cartográficos, de modo a empregá-los em um sistema de visualização tridimensional de terrenos em tempo real.
1. Introduction This article presents an alternative solution for the triangulation problem of altimetric data of cartographic features. This triangulation corresponds to one of the phases of the methodology to be presented. The proposed mechanism helps to enhance the performance of the graphic hardware by reducing the number of primitives to be processed during the exploration of the environment. The main goal of this method is to allow data management obtain real time three-dimensional (3D) terrain visualization from 2D topographic charts. This application is supposed to be executed on low performance computers embedded on military tanks and vehicles. Thus, the methodology is constrained by this obsolete hardware.
The goal of the altimetric data triangulation is to generate a 3D terrain mesh that is associated to a given region. This mesh, composed by triangles geometrically

organized, provides the 3D terrain aspect. Besides this conceptual representation, there is a technological constrain related to the number of triangles used for the same representation. The relation between the terrain levels of detail, and its associated data, can easily exceed the video board processing capabilities, which usually makes impossible a real time application. Thus, the terrain models data must be processed in order to allow its usage.
Under an interactive three-dimensional environment, the animation becomes an important characteristic. It is supposed to be continuous and smooth, that is, the user must not notice the frame transition between different images. In computer systems, the responsibility for the scenes transition delay is given by the quantity of objects on the scene [Lasseter 1987]. If this scene contains many objects, the video board will take too long to reproduce them on computer screen, delaying the next scene visualization.
Consequently, assuming one video board model, the terrain flyover interactivity, or any other user movement over the terrain, depends indirectly on the quantity of triangles used on the scene representation. In order to ensure an acceptable screen refresh rate, a strategic terrain vision (wide area of interest) may be represented using low levels of detail, while a tactical vision (narrow area of interest) can be represented by a greater quantity of data. The computer refresh rate is kept under acceptable performance according to system requirements by combining the width of the region of interest and its resolution degree. The term “acceptable performance” does not describe deterministically this measure feature. However, it is used so because the performance values vary according to the video board used on the system visualization. Therefore, it is important to understand the real time concept; to define evaluation quality parameters; and to evaluate the cartographic data pre-processing methodology according to several video boards.
2. Real Time Systems The altimetry pre-processing main goal is to structure data to meet the 3D visualization application needs. In this article, the refresh rate of the scene drawing will be the metric used for analyzing the system performance. These measured values are associated to system ability to handle real time operations, and for this reason it is important to comprehend the systems dedicated to this kind of application.
A system is a connected element set which can be considered as a unique component [Fregosi 1980]. A process corresponds to a time sequence state that a system assumes, according to the transformations that take place inside of it [Costa 1992]. Thus, a scheme managing of a given process can be considered as a real time system if it’s processing time, and its corresponding feedbacks, are compatible with the process dynamics [Allworth 1981].
Consequently, the characterization of a real time system environment is related to its execution time, where each application has its own constrains. A real time system label is usually attributed to those responsible for supervising and controlling time response systems, such as industrial plants, electrical and atomic plants, and intensive therapy units.
On the other hand, one could consider systems like maritime traffic control, or cosmic probes navigation. At the first case, a possible unit measure might be nautical

miles per hour, while at the second case, it might be used light years per year. By superficially analyzing this study cases, one might consider strange to classify those systems as real time environments due to its elastic time response. However, this is not a sustainable argument because the real time environment definition is not associated to the elapsed time, but it is related to an opportune problem treatment. According to Martin [1987], real time systems might have more elastic response time if the answer delay does not compromise the application correct functioning.
In the military environment, a terrain three-dimensional visualization system must also allow real time answers. In the Brazilian Army, the equipment project for military systems [Brasil 1994] is defined by the Basic Operational Specifications that establish the desired characteristics to be attended by the system. Usually, the specifications demands oppose the commercial off-the-shelf technological restrictions like weight limitation, batteries autonomy and processing capacity. For example, the current military batteries can provide energy for displays, radios, electronic sensors and other equipment for a continued 12 hours mission [Flynn 2004]. Fast Action Troops, such as a Parachuting Brigade or an Air Transportable Brigade, need electric energy for at least 72 continuous hours [Brasil 1998]. According to Future Force Warrior [Copeland 2004a, 2004b], a United States Army research project, a soldier equipped with wireless communication helmet, night vision camera, PDA (Personal Digital Assistant) and GPS (Global Positioning System) would need to carry 15 kilograms extra combat equipment just for the batteries.
In order to reduce the equipment weight, soldiers can use lighter materials, use new technologies, or even eliminate superfluity. However, the batteries are necessary heavy elements, which cannot be simply discarded. The current problem solution adopted by military forces has been the reduction of the quantity of batteries. In order to preserve the system autonomy time it is necessary to reduce the electronic components energy consumption. This energy cutback is made possible by decreasing the system processing capacity.
In this context, the development of applications for three-dimensional terrain visualization becomes a challenge. First, because the nature of this kind of application involves a great quantity of data to be processed. Second, because the available computational resources tend to be exiguous. The direct implication of these two factors is that the application becomes incapable to provide data in real time. Therefore, it is recommended to smartly prepare the cartographical data before its use by the visualization system, as described in the following sections.
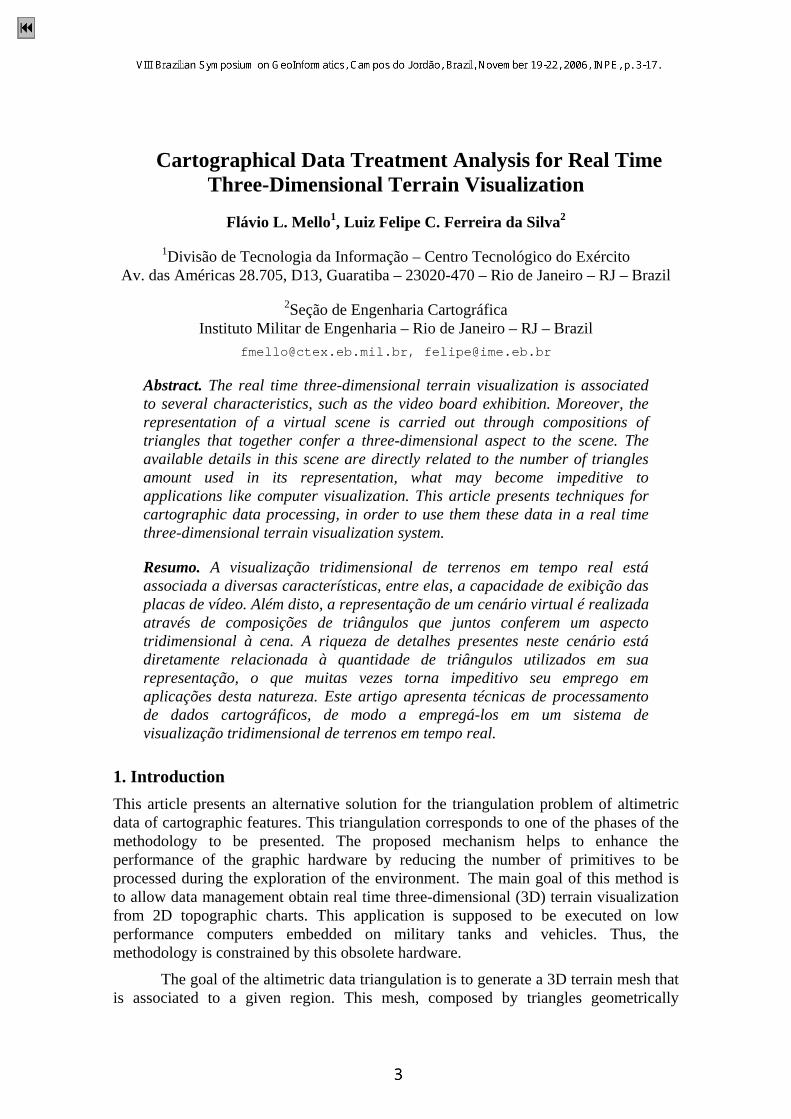
3. The Terrain Mesh A mesh is a discrete representation from a geometric domain using primitive shapes. In Figure 1, the geometric domain represented by a real terrain model is composed by triangular geometric primitives. Each triangle vertex corresponds to a measurement point on the object surface.
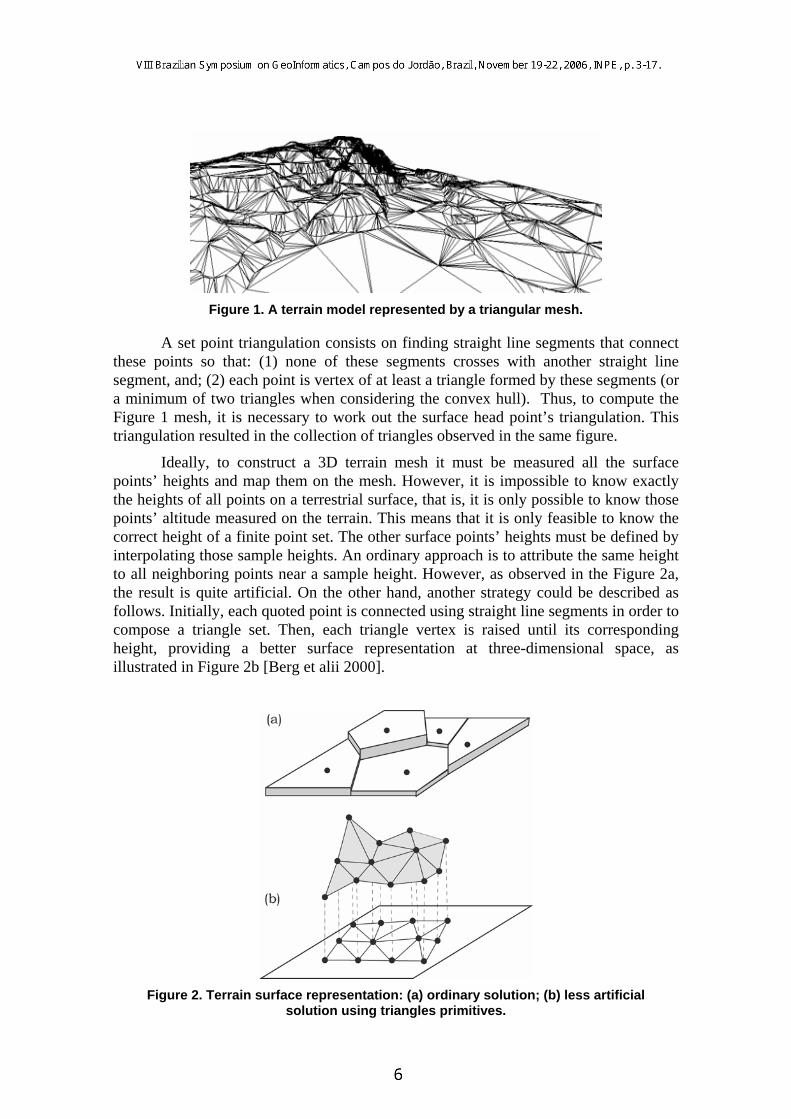
Figure 1. A terrain model represented by a triangular mesh.
A set point triangulation consists on finding straight line segments that connect these points so that: (1) none of these segments crosses with another straight line segment, and; (2) each point is vertex of at least a triangle formed by these segments (or a minimum of two triangles when considering the convex hull). Thus, to compute the Figure 1 mesh, it is necessary to work out the surface head point’s triangulation. This triangulation resulted in the collection of triangles observed in the same figure.
Ideally, to construct a 3D terrain mesh it must be measured all the surface points’ heights and map them on the mesh. However, it is impossible to know exactly the heights of all points on a terrestrial surface, that is, it is only possible to know those points’ altitude measured on the terrain. This means that it is only feasible to know the correct height of a finite point set. The other surface points’ heights must be defined by interpolating those sample heights. An ordinary approach is to attribute the same height to all neighboring points near a sample height. However, as observed in the Figure 2a, the result is quite artificial. On the other hand, another strategy could be described as follows. Initially, each quoted point is connected using straight line segments in order to compose a triangle set. Then, each triangle vertex is raised until its corresponding height, providing a better surface representation at three-dimensional space, as illustrated in Figure 2b [Berg et alii 2000].
Figure 2. Terrain surface representation: (a) ordinary solution; (b) less artificial solution using triangles primitives.
It must be observed that, given a point set, it is impossible to be certain about the terrain shape, but just the height of the quoted points. Thus, since no other information is provided, it is correct to state that all possible triangulations are equally good. However, some triangulations seem more natural than others. Usually, meshes with strong acute triangles seem to be visually more pleasant than the ones with less acute angles. As a result, the visually better meshes are those that maximize the minimum triangle angles, and known by Delaunay triangulations [Dwyer 1989, Shewchuk 1996]. An important characteristic from Delaunay triangulation is that, for each sample set, there is a unique triangulation associated to it.
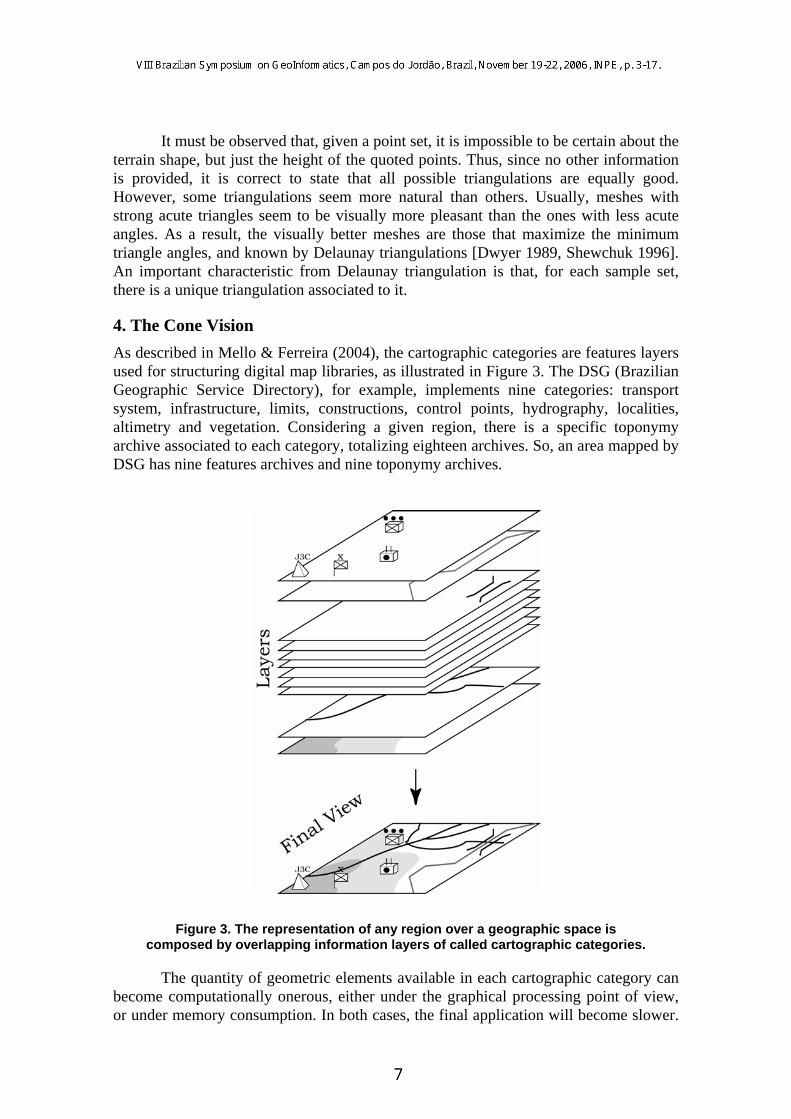
4. The Cone Vision As described in Mello & Ferreira (2004), the cartographic categories are features layers used for structuring digital map libraries, as illustrated in Figure 3. The DSG (Brazilian Geographic Service Directory), for example, implements nine categories: transport system, infrastructure, limits, constructions, control points, hydrography, localities, altimetry and vegetation. Considering a given region, there is a specific toponymy archive associated to each category, totalizing eighteen archives. So, an area mapped by DSG has nine features archives and nine toponymy archives.
Figure 3. The representation of any region over a geographic space is composed by overlapping information layers of called cartographic categories.
The quantity of geometric elements available in each cartographic category can become computationally onerous, either under the graphical processing point of view, or under memory consumption. In both cases, the final application will become slower.

It is easy to notice that just a fraction of geometries of the virtual environment is effectively visible at a given moment [Mello et alii 2003], as illustrated in Figure 4. It must be observed that in the instant described in the figure, the soldier can only see the tank and a road stretch. The helicopter is not visible in this situation. In order to reproduce on computers the image observed by the soldier, the video board would not need to draw the whole scene. It would only be necessary to display the tank and the road objects. In this situation, the helicopter would be discarded from the exhibition. Hence, if it is possible to determine the invisible geometries before being drawn, it would be possible simply to ignore them, thus preventing the unnecessary data processing for the application. This clipping procedure is known as frustum culling [Astle et alii 2002].
Figure 4. Object visibility at a given instant: the road and the tank are visible under the soldier point of view, but the helicopter is not.
The virtual environment visible geometries are defined as the intersection between the observer vision cone and the cartographic categories. For the next study case, consider only the altimetry layer of a given region. The common region between the cone vision and the data layer is illustrated in the Figure 5a. In computerized systems it is common to represent the observer vision cone as vision pyramid [Lamothe 1995], as presented in the Figure 5b. The overall computations related to pyramids vision tend to be significantly faster than the calculations associated to cones vision, and for this reason, the pyramids vision are used the most.
The region of interest is divided into an indexed cells space [Mello & Ferreira 2004] in order to allow a unique identification of the areas intercepted by the pyramid vision. This indexation is illustrated in the Figure 5c. Finally, an intersection test is performed with the intention of determining cell totally, or partially, contained in the pyramid vision. Considering the case described on Figure 5d, it can be observed that cells 0-4-5-10-15 had been discarded during the frustum culling procedure, meaning that all the geometries contained in its interior would not be sent for the video board, avoiding unnecessary computer video processing.

Figure 5. (a) A vision cone delimiting the visible area of an altimetry layer; (b) A pyramid vision delimiting the visible area of an altimetry layer; (c) the subdivision of the region of interest into an indexed cells space; (d)
Identification of the visible cells in the pyramid vision.
5. The Triangulation Construction Study Case Applications that demand overall triangles appearance to be more regular, as terrain visualization, usually use Delaunay triangulation. The Figure 6a presents an extract of the altimetry archive related to Piraquara region (adjacent to Curitiba) at 1:25,000 scale. It corresponds to the MI-2842-4 chart, where contour lines had been generalized with a three meters tolerance by using Douglas-Peucker algorithm. After the generalization, this altimetry archive contains 2,478 points, against the 8,791 original ones. The Figure 6b presents the Delaunay triangulation containing 4,922 triangles.

Figure 6. Extract of the Piraquara chart of (MI-2842-4), next to Curitiba: (a) contour lines representation after the generalization process; (b) Delaunay
triangulation of the same region.
The geometries, contained in each cartographic category, can be classified in sets of points, lines and areas. The point geometries constitute a trivial case of geometric intersection since it can only belong to a single cell. However, the lines and areas shapes are more complex cases. A line, for example, may have its initial and final vertex into distinct cells. Therefore, it is necessary to break the line into segments, each one of them belonging to a single cell [Mello & Ferreira 2004].
Considering the region of the Figure 6a, for example, it could be divided into a 4x4 grid as illustrated in the Figure 7a. It should be noticed that this division implies in cutting several contour lines, forcing the curves segmentation in the cells frontier. Then, each cell could be triangulated using its own level curves, and the resulting mesh is

presented in the Figure 7b. It can be observed the existence of holes at the grid corners, indicating that no triangulation covers those areas.
Figure 7. Extract of the region of Piraquara: (a) the cartographic category of altimetry is divided according to a grating 4x4; (b) it is carried out the
triangulation of the contour lines in each cell individually.
Despite the triangulation presents holes, it is known that the real terrain does not have them. Consequently, it is desirable to create some artifice that allows to extend the triangulation for empty regions. An important property of Delaunay triangulation is that the sum, or combination, of a Delaunay triangulation set is a Delaunay triangulation too. So, the solution is to add four extra points to each cells point set, coincident to the delimited cells quadrilaterals vertices. These particular points are known as Steiner points [Berg et alii 2000].
The calculation of x and y Steiner points coordinates can be easily automated since the 4x4 grid divides the region of interest into equal areas. However, it is necessary to compute a value for Steiner point z coordinate in order to provide a soft

and continuous aspect for terrain. It can be accomplished by using an interpolation technique such as the least square method.
The least square method uses, as inference function, points located in the neighborhood from the point to be determined. However, the volume of altimetry layer data can be too high, becoming computational prohibitive to locate those points for each point to be interpolated.
On the other hand, the indexing cell data structure can be used to perform an initial point set filtering. For each (x, y) Steiner point coordinate, it is possible to find out the adjacent cells. Subsequently, the search for neighboring points is performed only into the located cells, reducing the algorithm computational complexity. Figure 8 presents an altimetry layer scheme and its respective level curves. This layer was divided into a 4x4 grid, represented by the dashed lines. The black circle (Steiner points) represents a grid corner, which has quoted points into its neighboring cells. Therefore, the desired point z coordinate can be computed.
Figure 8. The black points indicate the existence of sample points in its immediate neighboring cells, whereas the points designated with a x are
surrounded by empty cells.
However, the cells that share Steiner points marked with x do not own any points to be used in z coordinate determination, that is, they are empty cells. In these cases, it is necessary to locate the empty cells neighboring patches, known as Steiner point second neighbors. Then, it is performed a new search for quoted coordinates using the new point set. In the worst case, this procedure may be repeated until it is necessary to execute a point search over the whole original altimetry layer. However, in the average case, this procedure tends to be better than a full search over the complete cartographic category.
After calculating the Steiner point’s z coordinates, it is possible to compute a new triangulation for each cell. Thus, returning to the example from the Figure 7a, it is achievable to get the triangulation presented in Figure 9, containing 5,141 triangles. In this figure, the terrain mesh is subdivided according to a 4x4 grid, in which there are no emptiness regions, and the visual aspect looks continuous and soft allover.
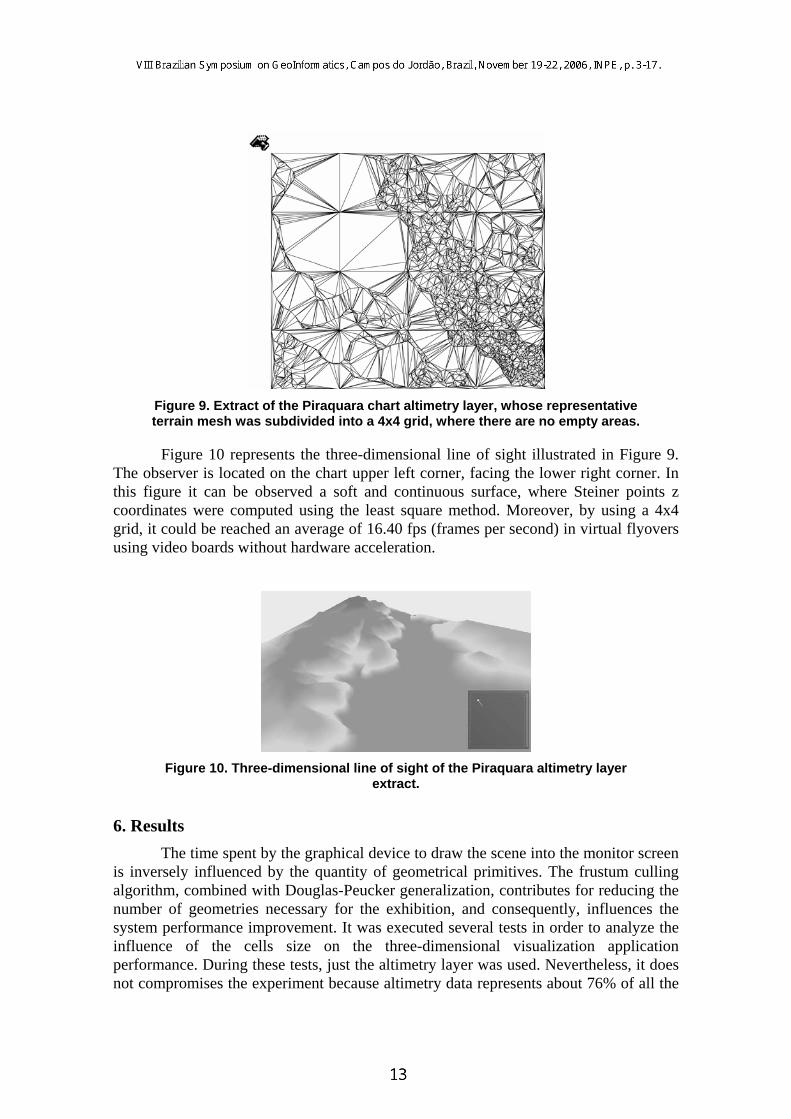
Figure 9. Extract of the Piraquara chart altimetry layer, whose representative terrain mesh was subdivided into a 4x4 grid, where there are no empty areas.
Figure 10 represents the three-dimensional line of sight illustrated in Figure 9. The observer is located on the chart upper left corner, facing the lower right corner. In this figure it can be observed a soft and continuous surface, where Steiner points z coordinates were computed using the least square method. Moreover, by using a 4x4 grid, it could be reached an average of 16.40 fps (frames per second) in virtual flyovers using video boards without hardware acceleration.
Figure 10. Three-dimensional line of sight of the Piraquara altimetry layer
extract.
6. Results The time spent by the graphical device to draw the scene into the monitor screen is inversely influenced by the quantity of geometrical primitives. The frustum culling algorithm, combined with Douglas-Peucker generalization, contributes for reducing the number of geometries necessary for the exhibition, and consequently, influences the system performance improvement. It was executed several tests in order to analyze the influence of the cells size on the three-dimensional visualization application performance. During these tests, just the altimetry layer was used. Nevertheless, it does not compromises the experiment because altimetry data represents about 76% of all the

map data [Anciães 2003], that is, it contributes with great part of the geometric primitive of a scene.
During the carried out tests, it was used the complete MI-2842-4 chart (Piraquara), generalized with three meters tolerance, containing 137,841 triangles to be drawn. Two personal computers have been used. The first one had 256MB of RAM memory, 1GHz Pentium III processor, and the second equipped with 256MB of RAM memory and 233MHz Pentium I processor. The video boards used on the tests were: an S3 Virge of 1MB with PCI bus, an NVidia GeForce 2 of 64MB PCI bus and an NVidia GeForce 2 of 64MB AGP bus.
The S3 Virge video board does not implement any hardware accelerated instruction, whereas the GeForce 2 video boards do so. The video boards had been exchanged between the two computers, except the GeForce 2 AGP device which was not possible to install in the Pentium 233MHz computer because no AGB bus was available.
The region of interest was subdivided into 1x1, 2x2, 4x4, 8x8, 16x16, 32x32, 64x64, 128x128 grids, that is, 2xx2x grids, where x = 0,…, 7. Each one of these grids divides the chart into 1, 4, 8, 16, 64, 256, 1,024, 4,096, and 16,384 indexed cells. For each 3-tupla configuration <computer, video board, grid>, the same region of interest flyover was executed. This flyover performed random trajectories, passing through locations on edge and on the center of the chart. A complete description of these random trajectories can be found on Mello & Ferreira [2006].
Figure 11. Average values for video board refresh rate, without using cells
culling, according to a 2xx2x grid subdivision.

The average values for video board refresh rate are illustrated on Figures 11 and 12. Figure 11 illustrates the results obtained by performing a flyover without the frustum culling algorithm, that is, all the geometries (triangles) had been drawn on each animation frame. On the other hand, Figure 12 represents the results associated to the invisible cells discard, that is, when only visible geometries were drawn.
Figure 12. Average values for video board refresh rate, using cells culling,
according to a 2xx2x grid subdivision.
It can be observed that the use of a culling algorithm allows the configurations to upgrade from a non-real time performance zone to a real time one (except the configuration <233MHz Pentium, S3 Virge, *>), in accordance with the values defined by Lasseter [1987].
The Figure 12 curves negative concavity also illustrates the relation between the increase of cells quantity and the video board refresh rate. Initially, the increase of grid divisions helps to enhance the video board drawing capacity. This occurs because the cost of the cells visibility test is compensated by the profit gotten with the invisible geometric primitive discarding in the scene. This situation is kept until an inflection point is reached, characterizing a state where the relation becomes the best. After that, a new situation is initiated, when it is observed video board frame rate depreciation. In this case, the computational cost to test all the discarding cells increases more quickly than the computational benefit of the discarding itself.

7. Conclusion As previously mentioned, the relation between the terrain resolution and its associated data can easily exceed the video board processing capacity. In many cases, it becomes impossible to achieve a real time application. This problem becomes even more evident when trying to construct 3D terrain visualization applications based on data provided by national systematic mapping agencies. Also, it is a challenging task to implement 3D terrain visualization applications, based on real cartographical data, in a low processing availability environment.
Initially, the 3D visualization application was incapable to provide a video board refresh rate compatible to a real time system, in spite of the equipment used. Through the use of the clipping algorithm, it was possible to improve the application performance to higher values than the lower limits defined by classic animation literature. The results analysis suggests that it is possible to create a real time 3D terrain visualization application based on the current available cartographic data. The methodology for pre-processing cartographic data, proposed by Mello & Ferreira (2004), proved to be useful to accomplish this goal.
References Allworth, S. T., “Introduction to Real Time Software Design”. The MacMillan Press,
New York, 1981.
Anciães, C. L. C., “Transformação entre redes Geodésicas: uso de coordenadas 3D, 3D com restrição, e 2D”. Dissertação de Mestrado, IME, p.48, 2003.
Astle, D., Hawkins, K., LaMothe, A. “OpenGL Game Programming”. Premier, California, 2002.
Berg, M., Kreveld, M., Overmars, M., Schwarzkopf, O. “Computational Geometry: Algorithms and Applications” New York, Springer, 2ed., c.9, 2000.
Brasil. Exército Brasileiro. IG 20-12: “Sistema de Ciência e Tecnologia do Exército”. 1994
Brasil. Exército Brasileiro. C 7-1: “Emprego da Infantaria”. 1998
Copeland (a), P., “Power Sources For Future Infantry Suite”, Defence Update, SSC Public Affairs Office Press Releases, 2004. no.1
Copeland (b), P., “Future Warrior: New Concepts for Uniform Systems”, The Warrior Magazine, US Soldier System Center, Washington, 2004. November-December.
Costa, R. S. N, “Sistemas Baseados em Conhecimento em Engenharia de Processos”. Dissertação de Mestrado, Instituto Militar de Engenharia, IME, Rio de Janeiro, 1992.
Dwyer, R. “A faster divide and conquer algorithm for constructing Delaunay triangulations” Algorithmica 2: p.137-151, 1989.
Flynn, Patrick, “Powering Up the High-Tech Soldier of the Future”. InFocus, The National Academies, Washington, pp.7-8, 2004. v.4, no.2.
Fregosi, A. E., et alii, “Enfoque Clássico da Teoria de Controle”. Campus, São Paulo, 1980.
LaMothe, A. “Black Art of 3D Game Programming”. California, Waite Group, pp.813-816, 1995.
Lasseter, John, “Principles of Traditional Animation Applied to 3D Computer Animation”, Computer Graphics, pp. 35-44, 1987. v.21, no.4.
Martin, J., “Design of Real Time Computer Systems”, Prentice Hall, 1987.
Mello, F. L., Ferreira, L. F. C. , Strauss, E., “Um Sistema de Visualização Tridimensional do Teatro de Guerra”. Revista Militar de Ciência e Tecnologia, pp. 40-49, 2003. v.20, no.3.
Mello, F. L., Ferreira, L. F. C., “Visualização Tridimensional de Teatros de Guerra: o Pré-Processamento dos Dados”. Revista Militar de Ciência e Tecnologia, pp. 35-47 , 2004. v.21, no.3.
Mello, F. L., Ferreira, L. F. C., “Análise de Desempenho de uma Metodologia de Tratamento de Dados Altimétricos Aplicada à Visualização Tridimensional de Terrenos”. Revista Brasileira de Cartografia, 2006. (submitted)
Shewchuk, J. R. “Triangle: Engineering a 2D Quality Mesh Generator and Delaunay Triangulator”, First Workshop on Applied Computational Geometry, ACM, Philadelphia, p.124-133, 1996.