cartesis whitepaper xbrl bob eccles _liv watson copy
TRANSCRIPT

NEW FORMAT AND TECHNOLOGY DRIVES ENHANCED BUSINESS REPORTING
Authors: Robert G. Eccles, James A. Fisher, Liv A. Watson

CONTENTS
2 NEW FORMAT AND TECHNOLOGY DRIVES ENHANCED BUSINESS REPORTING | CONTENTS
Executive Overview ............................................................................................................ 3
XBRL – Frontline in a Reporting Revolution ....................................................................... 4
What Is XBRL?..................................................................................................................... 6
The Challenge of Enhanced Business Reporting (EBR) ....................................................... 8
Closing the Gaps Through Better Performance Management .......................................... 12
How to Combine Performance Management and XBRL ................................................... 15
Summary ........................................................................................................................... 18
About ............................................................................................................................... 19
the Authors ........................................................................................................................................19
Cartesis .............................................................................................................................................19
EDGAR Online, Inc. ............................................................................................................................19
Perception Partners ............................................................................................................................19

EXECUTIVE OVERVIEWThe eXtensible Business Reporting Language (XBRL) is a technology that corporate ex-ecutives need to recognize and understand, and something they should not leave ex-clusively to their IT departments to assess in terms of its benefits. That’s because XBRL is more than just an XML-based financial reporting language to help companies comply with regulatory burdens, and more than just a fad or a burden in itself. XBRL represents a potential gateway to competitive advantage and something that business leaders should evaluate for its strategic value.
Today’s business arena requires participants to be more complete and transparent in the reporting of their business and financial performance in order to meet the needs of investors, shareholders and regulators. XBRL provides the format for doing this, of-fering the perfect technological fit for the enhanced business reporting requirements of an increasingly complex global market. Financial and business reporting requires a mix of speed, accuracy and flexibility, and XBRL acts like the “bar code” for business and financial information, enabling corporations to prepare information quickly, publish it in a variety of formats, tag it for structure and context and make it available for a variety of systems and applications.
XBRL also figures significantly in the quest to close the gap between what information organizations want to report or access, and what they actually can report and access. This gap can be related to the quality of data as well as its completeness. By standardizing fi-nancial and non-financial information in terms of structure, content and meaning, XBRL provides more accurate and flexible comparison and communication of information. It provides unified reporting in a single environment to increase data accuracy and keep maintenance and other costs down. A compliance reporting software solution based on XBRL enables users to support a wider variety of global regulations and taxonomies and bridge the gap between systems, accounting standards and global financial reporting, while providing full transparency and auditability from source to disclosure.
XBRL also allows organizations to pull in external data so they can benchmark their actual and forecast figures against competitive and peer groups in real time, enabling agile and externally focused business performance management. Using XBRL, business analysts can more easily calculate growth trends, drivers and metrics and run a wide range of simulations, including M&A scenario analysis, to help their organizations im-prove business performance and optimize the financial forecast process.
However, organizations need to recognize that implementing and getting the full range of benefits from XBRL, including return on investment, isn’t an overnight process — nor is it something that can be accomplished without a performance management system that integrates XBRL and enables users to extend XBRL’s benefits across applications.
In addition, XBRL adoption, while growing, is still far from universal, and technical sup-port issues such as development and maintenance will likely need some special atten-tion. But as this paper will show, XBRL is moving rapidly (as far as new technologies go) toward becoming the standard and a valuable component in the financial and business reporting supply chain, with hundreds of XBRL initiatives in progress.
NEW FORMAT AND NEW TECHNOLOGY DRIVES ENHANCED BUSINESS REPORTING | EXECUTIVE OVERVIEW 3

XBRL – FRONTLINE IN A REPORTING REVOLUTIONIn the spring of 1998, a CPA by the name of Charlie Hoffman began experimenting with emerging Internet-based technologies to solve what he thought of as a manually intensive, error-prone and inefficient method of analyzing and organizing his clients’ financial information. A few months later, Charlie took his idea to the American Institute of Certified Public Accountants’ High Tech Task Force and the remainder, as they say, is history. Charlie’s idea has evolved into an XML-defined financial and business reporting data standard called the eXtensible Business Reporting Language (XBRL).
Today XBRL is governed by an International Consortium that represents more than 490 organizations and governments across the financial and business reporting supply chain (www.xbrl.org). One of the biggest supporters of XBRL is Chairman Christopher Cox of the U.S. Securities and Exchange Commission (SEC). Chairman Cox, believing that the name “XBRL” did not do justice to explaining the power of this global open-source-driven framework, has coined the term “interactive data” for XBRL. He also said that the real reason behind the SEC’s interest in “interactive data” is “to protect investors.”
As seen in the 1997-1998 Asian market crises, investors flee when capital markets are viewed as risky or uncertain, and markets are viewed as safe and stable only if poten-tial investors trust and understand the underlying financial reporting structure. For the capital markets to operate most efficiently, information about public companies must be understandable, accessible and accurate.
Chairman Cox is not the only one paying attention to the importance of financial trans-parency. In March of 2006, U.S. Representative Richard H. Baker’s House Financial Services Subcommittee on “Capital Markets, Insurance and Government Sponsored Enterprises to Advocate Transparency in Financial Reporting” held a hearing entitled “Fostering Accuracy and Transparency in Financial Reporting.” Mr. Baker said, “If U.S. markets are to remain on top in an increasingly competitive global marketplace, we need to move away from the complex and cumbersome and explore technological and other methods of enhancing the clarity, accuracy, and efficiency of our accounting system.”
Mr. Baker’s thoughts were recently echoed in an unprecedented move by the six heads of the world’s largest accounting firms when they published their vision for global re-porting calling for a radical overhaul of how companies report. The six accounting firm leaders claim corporate reporting has been largely untouched by the Internet and digiti-zation, both of which have revolutionized the way companies operate, and they see the need for real-time Internet-based reporting to encompass a wider range of performance measures including more non-financial information.
The implementation of laws like the European Union Accounts Modernisation Directive and the United Kingdom’s Companies Bill 2006 add to this, introducing formal require-ments around non-financials, narrative and forward-looking information that will im-pact financial reporting for all but the smallest companies.
However, while the arguments are sound, developing a new standard such as XBRL is a tremendous undertaking and XBRL is not without challengers. The media in particu-lar have been quick to criticize the standard for being yet another regulatory burden and rightly demand that those responsible for its development put more focus on the real life ”usability” issues that will face many users. The development and maintenance model for taxonomies, rendering of human-readability of XBRL documents, and change management issues are all significant and critically important to a large-scale implemen-tation of XBRL and areas which require more effort.
4 NEW FORMAT AND TECHNOLOGY DRIVES ENHANCED BUSINESS REPORTING XBRL – FRONTLINE IN A REPORTING REVOLUTION

XBRL – FRONTLINE IN A REPORTING REVOLUTION
That said, adoption of XBRL is rapidly increasing and many governments and regula-tors worldwide are now accepting and requiring the submission of financial statements and reports via XBRL. Companies are increasingly looking to define their approach to XBRL and there are now hundreds of active XBRL projects globally in different stages of development. Over the past 12 months a number of developments have reinforced this growth including:
Federal Deposit Insurance Corporation (FDIC) adoption and publication of hard-dollar benefits from its XBRL call report initiative
Increased endorsement and lobbying by the SEC despite the initial poor response to its voluntary XBRL-filing program
Continuing initiatives by numerous professional organizations, such as the Interna-tional Accounting Standards Committee Foundation (IASCF), which created an XBRL Website and launched an XBRL Lab to prototype XBRL for International Financial Reporting Standards (IFRS), and the Committee of European Bank Supervisors, which released the first version of a Common Reporting (COREP) Framework which requires XBRL submission
Continuing adoption of XBRL by stock exchanges (for example, the Korean and Shanghai stock exchanges), other financial services firms (such as the Bank of Tokyo) and government agencies (for example, the U.K. Tax Authority and the Korean Finan-cial Supervisory Service) for data gathering, analysis and reporting
Increased leverage and support of XBRL by corporate performance management, re-porting, and content management software and services vendors, including Cartesis
The commercial availability of a growing global body of XBRL-tagged public financial statements such as those offered by EDGAR Online, Inc.
Forecast to be “transformational” over the next two years in the most recent XML Tech-nology Hype Cycle 2006 published by Gartner Research, XBRL now holds an important and unique opportunity to become an integral and highly value-added part of the busi-ness reporting supply chain.
In this paper, we will examine how Web-based technologies like XBRL can be combined with modern performance management frameworks to help meet the demands of fi-nancial reporting stakeholders and at the same time create greater value for those for-ward-looking organizations which position themselves to best take advantage of this new information standard.
Our vision, in response to the changing regulatory landscape, is to define how immedi-ate access to more accurate, cleaner, less costly and more transparent data will lead to competitive advantage and greater shareholder engagement through more enhanced business and performance management reporting.
NEW FORMAT AND TECHNOLOGY DRIVES ENHANCED BUSINESS REPORTING 5XBRL – FRONTLINE IN A REPORTING REVOLUTION

WHAT IS XBRL?XBRL is an XML-defined financial and business reporting supply chain data standard that provides a method for tagging financial information using agreed-upon business terms to enable it to be understood by different computer applications and business us-ers alike. XML, or Extensible Markup Language, is for documents containing structured information. A “markup language” is a mechanism to identify structures in a document and the XML specification defines a standard way to add markups to documents.
Besides identifying the individual financial items, XBRL also provides the functionality for those terms to carry with them additional information, including short-hand names, longer descriptions, translations of business terms in any language used by the organi-zation and links to other sources of authoritative reference — in the case of IFRS, the International Accounting Standards themselves.
The two main components of XBRL are the Specification and the Taxonomies.
Specifications provide the fundamental technical definition of how XBRL actually works. The documentation of the Specifications is published by XBRL International. The XBRL Specification design was formed from the beginning to satisfy three distinct kinds of requirements:
Business requirements
Technology requirements
Political requirements
The documentation of the XBRL Specification is the primary building block for ensuring that XBRL exists as a non-proprietary and interoperable format. The XBRL Specification Documentation sets out the technical rules for XBRL and is aimed primarily at advanced software professionals who are seeking to build tools that will directly consume or cre-ate XBRL documents.
A taxonomy is simply a systematic way of naming and organizing data and information into groups that share similar characteristics. XBRL Taxonomies aim to build a unified and homogeneous view of financial and business reporting information by developing a large set of taxonomies to classify financial and business reporting information.
The word “taxonomy” is derived from the ancient Greek words “taxis,” meaning ar-rangement or division, and “nomos,” meaning law. XBRL Taxonomies are dictionaries of business terms and their corresponding tags, e.g., U.S. GAAP and FDIC taxonomies. By separating structure (or content) from presentation, you get interactive data: smarter, better quality data. Once data are made interactive, the numbers in financial reports are easier to locate. These data will not only be instantly searchable and retrievable, but the user will also be able to immediately download them into spreadsheets and an unlimited number of XBRL-enabled software applications, including Cartesis 10.
6 NEW FORMAT AND TECHNOLOGY DRIVES ENHANCED BUSINESS REPORTING | WHAT IS XBRL?

WHAT IS XBRL?
XBRL Taxonomies are basically “knowledge classifications” or “vocabularies” purpose-fully created to exchange information. Taxonomies are developed in much the same way that librarians choose to categorize and shelve books about similar topics, making it easier for others to find them. However, most books are about more than one idea or subject. Many books cover a number of different subjects in equal depth or sometimes a book is about an entirely new subject. But when it comes to placing the book on the shelf, the librarian must choose just one of the subjects and classify the book under that single subject or make a decision to extend the classification to include a new sub-ject. The decision the librarian makes will have implications for the person looking for the book. The same rules apply for developing XBRL financial and business reporting data. At some point someone has to make the decision of categorizing and classifying financial statements. Someone must first decide (provide expert taxonomy mapping) what data should be mapped to what data element in XBRL-standardized taxonomies or make the decision to extend the classification or category (standardized taxonomy) to represent a company’s unique reporting concepts.
The XBRL framework therefore maximizes the benefits to all stakeholders in the finan-cial and business reporting supply chain. Its role is also significant in helping to level the playing field between individual and institutional investors thus contributing to the democratization and greater liquidity of the capital markets.
NEW FORMAT AND TECHNOLOGY DRIVES ENHANCED BUSINESS REPORTING | WHAT IS XBRL? 7

THE CHALLENGE OF ENHANCED BUSINESS REPORTING (EBR)Today, a very real constraint prevents organizations from taking full advantage of the real-time delivery of performance information to executives who need it for making decisions. This constraint is based on the fact that financial information (i.e., what is re-ported in the income statement, balance sheet and footnotes), while being critically im-portant to investment decisions (both internally and externally) and recommendations, is incomplete. It needs to be supplemented with non-GAAP financial information (e.g., pro forma earnings) and non-financial information (e.g., on key performance indicators and intangible assets) to help managers and then investors take a longer-term view of value creation. Furthermore, this non-GAAP, non-financial information often provides leading indicators of financial results. For example, an improvement in customer reten-tion levels can increase revenue while lowering costs since less money needs to be spent on replacing customers who have been lost.
The frequency with which this information needs to be reported can vary substantially. Measuring market share may need to be done only once a year whereas it might be useful to measure Internet-based sales on a daily or even hourly basis. The frequency of measurement and the frequency of reporting can also vary, with management get-ting data on the most frequent basis and the board and investors less so. Whatever the frequency, having current information is important. The longer the time lag in getting the information, the less out of date, and thus the less useful, the information is. For example, quarterly financial information that takes six weeks to compile is already out of date by the time it has been received.
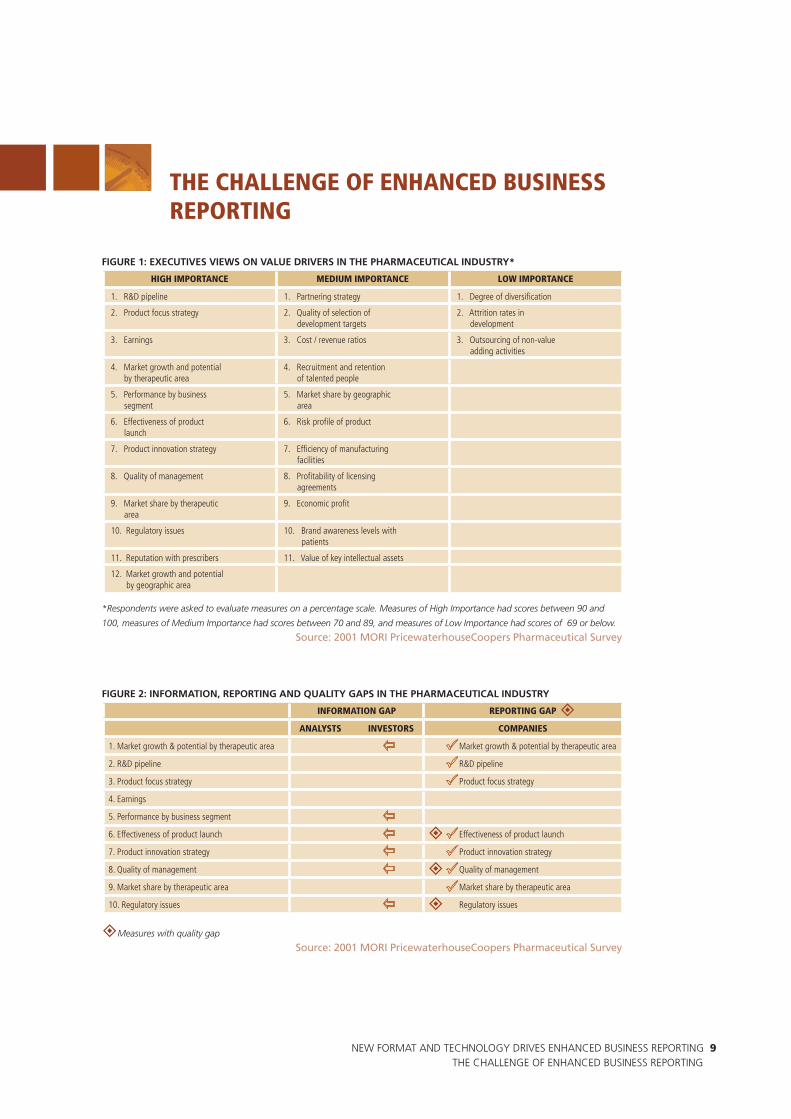
Research by PricewaterhouseCoopers on the pharmaceutical industry can be used to illustrate the importance of supplementing financial performance measures with other key metrics. However, it should be emphasized that the patterns found here exist in each of the 17 industries in which PwC has conducted these studies. This suggests that these patterns apply across virtually every industry. Figure 1 provides data on how pharma-ceutical industry executives (primarily CFOs and heads of investor relations) view the im-portance of various “value drivers” in making internal investment decisions. The classic “bottom-line” measures of earnings is certainly important but it ranks third after what is in the company’s R&D pipeline and its product focus strategy. Only one other measure would be financial in nature: performance by business segment if this is measured in revenue or profits. Some of these other “value drivers” concern external conditions, such as market growth and potential by therapeutic area; some concern the effectiveness of internal processes, such as effectiveness of product launch; and some concern factors that would be difficult to quantify like quality of management and reputation with prescribers. However, in all cases it is easy to see that these are important value drivers for a pharmaceutical company.
8 NEW FORMAT AND TECHNOLOGY DRIVES ENHANCED BUSINESS REPORTINGTHE CHALLENGE OF ENHANCED BUSINESS REPORTING (EBR)
THE CHALLENGE OF ENHANCED BUSINESS REPORTING
FIGURE 1: EXECUTIVES VIEWS ON VALUE DRIVERS IN THE PHARMACEUTICAL INDUSTRY*
HIGH IMPORTANCE MEDIUM IMPORTANCE LOW IMPORTANCE
1. R&D pipeline 1. Partnering strategy 1. Degree of diversification
2. Product focus strategy 2. Quality of selection of development targets
2. Attrition rates in development
3. Earnings 3. Cost / revenue ratios 3. Outsourcing of non-value adding activities
4. Market growth and potential by therapeutic area
4. Recruitment and retention of talented people
5. Performance by business segment
5. Market share by geographic area
6. Effectiveness of product launch
6. Risk profile of product
7. Product innovation strategy 7. Efficiency of manufacturing facilities
8. Quality of management 8. Profitability of licensing agreements
9. Market share by therapeutic area
9. Economic profit
10. Regulatory issues 10. Brand awareness levels with patients
11. Reputation with prescribers 11. Value of key intellectual assets
12. Market growth and potential by geographic area
*Respondents were asked to evaluate measures on a percentage scale. Measures of High Importance had scores between 90 and
100, measures of Medium Importance had scores between 70 and 89, and measures of Low Importance had scores of 69 or below.
Source: 2001 MORI PricewaterhouseCoopers Pharmaceutical Survey
FIGURE 2: INFORMATION, REPORTING AND QUALITY GAPS IN THE PHARMACEUTICAL INDUSTRY
INFORMATION GAP REPORTING GAP
ANALYSTS INVESTORS COMPANIES
1. Market growth & potential by therapeutic area Market growth & potential by therapeutic area
2. R&D pipeline R&D pipeline
3. Product focus strategy Product focus strategy
4. Earnings
5. Performance by business segment
6. Effectiveness of product launch Effectiveness of product launch
7. Product innovation strategy Product innovation strategy
8. Quality of management Quality of management
9. Market share by therapeutic area Market share by therapeutic area
10. Regulatory issues Regulatory issues
±Measures with quality gap
Source: 2001 MORI PricewaterhouseCoopers Pharmaceutical Survey
NEW FORMAT AND TECHNOLOGY DRIVES ENHANCED BUSINESS REPORTING 9THE CHALLENGE OF ENHANCED BUSINESS REPORTING
ÁÁÁÁÁÁ
Ô
ÔÔÔÔ
Ô
¸¸¸
¸¸¸¸
±
±
±
±

THE CHALLENGE OF ENHANCED BUSINESS REPORTING
Is agreement about what are the key value drivers matched by the extent to which man-agement is providing performance information on them to the market? The answer is largely “no.” An “information gap” exists when there is disparity between how impor-tant the market perceives a value driver to be and how satisfied it is with the informa-tion it is getting from companies on it. Figure 2 shows that analysts and investors see an information gap on six of the top 10 value drivers.
To some extent, management admits responsibility for these “reporting gaps,” which occur when management views a value driver as important but readily admits it is not providing the market with enough information on that value driver. This is the case when it comes to reporting the effectiveness of a product launch, quality of manage-ment and regulatory issues. However, it should be noted that the market isn’t happy with the information it is getting on things like product innovation strategy and market share by therapeutic area, even though management thinks it is doing a good job of providing this information.
Executives give many reasons for not reporting information. Two common and some-what dubious ones are that the information will be useful to competitors (there are many ways for competitors to get information) and that they’ll be sued (they can also be sued for withholding information). A more valid reason is that the information isn’t sufficiently reliable for external reporting. A “quality gap” exists when management believes that its internal systems cannot produce reliable information for measuring a value driver. Figure 2 shows that there are quality gaps on seven of the top 10 value drivers, including the top three. Not surprisingly, these also include the three for which there is a reporting gap but there are also quality gaps on the top three value drivers from management’s perspective: market growth and potential by therapeutic area, R&D pipeline, and product focus strategy. Thus, we have the curious situation of companies reporting on something for which they’re unsure of the validity of the underlying data.
As already stated, this pattern of pervasive information, reporting and quality gaps is not unique to the pharmaceutical industry. The fundamental reason for this is that the current external reporting model is largely a financial one, based on accounting standards. While these standards have increased in number and complexity over time, the basic underlying model which largely ignores non-financial performance met-rics and intangible assets hasn’t changed. As a result, what companies are required to report externally is incomplete relative to the information needs of all users, start-ing with the companies themselves and their boards and extending to analysts, in-vestors and other stakeholders. Figure 3 illustrates this point. Using data from the 17 PricewaterhouseCoopers “ValueReporting Capital Market Surveys,” EDGAR Online, Inc. determined that on average only about one-third (32%) of the value drivers of interest are contained in regulatory filings. The range is from a low of 13% for the pharmaceutical and investment management industries to a high of 50% for diversified manufacturing. The pharmaceutical industry is probably the prototype for the importance of intangible assets. Manufacturing was the dominant industry when accounting standards were developed and thus the better fit with this tangible-asset-intensive industry.
10 NEW FORMAT AND NEW TECHNOLOGY DRIVES ENHANCED BUSINESS REPORTINGTHE CHALLENGE OF ENHANCED BUSINESS REPORTING

THE CHALLENGE OF ENHANCED BUSINESS REPORTING
FIGURE 3: DISCLOSURE OF KEY VALUE DRIVERS THROUGH COMPANY FILINGS BY INDUSTRY
0%
10%
20%
30%
40%
50%
60%
50%
Diversi
fied M
kg
Bank
ing
Chemica
ls
Enter
tainm
ent
High Te
ch
Insur
ance
Retai
l
Autom
otive
Petro
leum
Consu
mer Goo
ds
Utilitie
s
Mini
ng
Telec
omM
etals
Real
Estat
e
Pharm
a
Inves
tmen
t Mng
t
45%42%
40% 40% 39% 39%36% 35%
33%30%
25% 25%22%
18%13% 13%
Average: 32%
Source: PricewaterhouseCoopers ValueReporting Capital Markets Survey, Analysis of data EDGAR Online, Inc.
Of course, companies are free to report any performance information they think is rel-evant. Some are starting to do so to meet the requests of analysts and investors who are demanding more information. Groups consisting of all elements of the financial and business reporting supply chain, including both the users and providers of capital, are being formed to help improve corporate reporting. One example is the Enhanced Busi-ness Reporting Consortium (www.ebr360.org), which has issued an “Enhanced Business Reporting Framework” (currently in Version 2.1) that suggests that standards be devel-oped along industry lines for key value drivers. These standards would be voluntarily adopted by companies.
While such standards would certainly improve the comparability of information across companies — one of the major objectives of accounting standards — they are not a necessary condition for improving financial and business reporting. Each individual com-pany can take significant steps on its own and reap the benefits of doing so, primarily in terms of a stock price based on real performance information rather than rumors, speculation, and the myriad market inefficiencies which emerge from an incomplete picture of a company’s performance and prospects. Recent research from PwC indicates that investment analysts do rate the stock of companies that disclose contextual, non-fi-nancial information more highly than those that do not. But, as the above discussion on the quality gap illustrates, this can be done only if the company has quality information in the first place.
NEW FORMAT AND TECHNOLOGY DRIVES ENHANCED BUSINESS REPORTING 11THE CHALLENGE OF ENHANCED BUSINESS REPORTING

CLOSING THE GAPS THROUGH BETTER PERFORMANCE MANAGEMENTOne of the primary constraints on the internal application of enhanced business reporting is the lack of the requisite information for producing reliable performance measures on the key value drivers.
Fortunately, performance management solutions are being developed that directly address this problem. By creating a management cycle that draws on a wide set of inter-related specialized applications and processes, these solutions help to identify, produce and communicate secure, trustworthy and auditable information to stakeholders.
Solutions such as the Cartesis 10 performance management suite integrate data into a single source across reporting processes (e.g., financial consolidation and management reporting, planning and modeling, and analysis), across functions (e.g., marketing rather than finance is the best source of data on things like market share and sales is the best source for data on customer retention and customer satisfaction), and from sources out-side the company for benchmarking (e.g., third-party estimates of market size, market growth and the market shares of competitors). Such a solution also provides an analytical framework for developing methodologies to measure things like product innovation effectiveness, capacity and quality of the R&D pipeline, and for determining whether some value drivers, such as quality of management and corporate reputation, can be measured or not.
FIGURE 4: CARTESIS BPM SUITE
12 NEW FORMAT AND TECHNOLOGY DRIVES ENHANCED BUSINESS REPORTINGCLOSING THE GAPS THROUGH BETTER PERFORMANCE MANAGEMENT

CLOSING THE GAPS THROUGH BETTER PERFORMANCE MANAGEMENT
The importance of performance management applications cannot be underestimated. They play a vital role in closing the “quality gap” by providing the starting point for bet-ter management and better reporting. By leveraging these applications, companies are able to embrace best practices throughout the business to create an environment for sustainable and manageable change over time.
By linking all performance management processes and data, companies are able to use applications like the Cartesis Finance statutory consolidation and management report-ing solution to collect data from a broad range of sources both financial and non-finan-cial, supplement this with additional narrative and commentary to both meet regulatory reporting requirements and provide business managers with up-to-date information to make important business decisions. This information can then be communicated to ex-ternal stakeholders, thereby closing the reporting and information gaps as well, and XBRL provides a format for this.
This is only the start of increasing the value of the business reporting supply chain as the exploitation of the accumulated knowledge base that XBRL helps to create goes way beyond the traditional ways financial analysts and investors use this information. By bringing in additional data for benchmarking purposes, management can get a much more realistic view of its performance in a market context rather than simply comparing actual performance to internally focused budget projections.
At the most simplistic level, the external data can be used to supplement internal manage-ment information by benchmarking and analyzing financials alongside competitors and peer groups. Concepts from EBR can then be applied to help to identify what value drivers for a business need to be improved, optimize the forecast process and support advanced modeling and scenario analysis. This can all be done through analytical and planning ap-plications such as Cartesis Analytics and Cartesis Planning. Put simply, benchmarking finan-cial information gives companies a sense of where they need to improve vis-à-vis competi-tors and EBR-type information gives them insights into what improvements they need to make on the value drivers that determine future financial performance.
Executives require this information and the supporting financial analytics to understand their company’s performance, how they are performing against their plan, which prod-ucts or regions are most profitable and how best to improve the business. As companies make progress in enhancing their internal and external business reporting by including key non-financial value drivers, they will then be able to take further advantage of the power of XBRL by “extending” their taxonomy to cover these other performance mea-sures. This then provides an even broader platform to communicate how the company is creating value for its key stakeholders internally and externally, thereby creating greater stakeholder engagement. The more accurate, cleaner, less costly and more transparent data provided by this platform will also contribute to helping the company achieve a competitive advantage.
NEW FORMAT AND TECHNOLOGY DRIVES ENHANCED BUSINESS REPORTING 13CLOSING THE GAPS THROUGH BETTER PERFORMANCE MANAGEMENT

CLOSING THE GAPS THROUGH BETTER PERFORMANCE MANAGEMENT
The benefit this brings to the executive team is just the beginning. It is critical for the board as well, which requires this performance information to fulfill its fiduciary respon-sibility to shareholders and, especially in Europe, to other stakeholders. Through this process it is the board’s responsibility to define the “optimal degree of transparency” for these stakeholders. Management likes to argue that there is competitive disadvantage in providing this information but the reality is that there are many perfectly legal ways for this information to be obtained, such as hiring strategy consulting firms or senior ex-ecutives from competitors. The board must determine the relative benefits and costs of greater transparency to the people they represent — the shareholders. One of the most legitimate reasons for not disclosing this broader range of financial and non-financial performance information is that often it is not sufficiently reliable, but solutions like Cartesis 10 directly address this problem. In doing so, these performance management applications force the issue of what should and should not be disclosed, thereby raising the bar on better corporate governance.
The methodology that companies can use to implement this approach and leverage this technology is remarkably straightforward in design and it creates a cycle of continuous value creation and improvement:
Leverage performance management to create and collect management information and content
Leverage performance management and XBRL to report, communicate, drive trans-parency and create greater stakeholder engagement
Leverage performance management, XBRL, benchmarking and EBR to refine value drivers, improve analysis and drive competitive advantage which leads back to phase one.
1)
2)
3)
14 NEW FORMAT AND TECHNOLOGY DRIVES ENHANCED BUSINESS REPORTINGCLOSING THE GAPS THROUGH BETTER PERFORMANCE MANAGEMENT

HOW TO COMBINE PERFORMANCE MANAGEMENT AND XBRLThe ability of performance management applications to exploit the power of XBRL is vital to both creating and communicating EBR value drivers. However until very recently, even the earliest part of this cycle — the publishing of financial reporting via XBRL — was being offered by only a handful of applications.
Based on Cartesis Finance, the Cartesis XBRL Publishing module uses a reporting defini-tion (taxonomy) to compose a report based on secure and trusted data extracted from Cartesis Finance. Companies can automate report production on a monthly, quarterly or yearly basis, based on defined mappings and any number of available taxonomies.
FIGURE 5: XBRL PUBLISHING THROUGH CARTESIS FINANCE
To comply with rules defined in the various taxonomies, the Cartesis XBRL Publishing module enables the collection of additional data that may be required to supplement what is automatically retrieved from Cartesis Finance, thereby providing a full editing and audit history. The reporting process, including data changes and importing data sets, is all recorded for later auditing. This ensures full transparency and auditability from source to digital disclosure.
NEW FORMAT AND TECHNOLOGY DRIVES ENHANCED BUSINESS REPORTING 15HOW TO COMBINE PERFORMANCE MANAGEMENT AND XBRL

HOW TO COMBINE PERFORMANCE MANAGEMENT AND XBRL
With an increasing resource of XBRL published information, EDGAR Online, the first and leading financial data aggregator to integrate XBRL-enabled data and solutions into its core products, provides the gateway to the third stage of the improvement cycle pre-sented in the previous section. Through its mapping and parsing engine, EDGAR Online has converted more than 10,000 public companies with over eight years of history into XBRL data. This is offered through EDGAR Online’s I-Metrix platform and through other strategic partnerships such as the one with Cartesis. The interactive data is tagged according to the XBRL global standard that enhances the transparency and usability of information that executives, investors, analysts and regulators employ for decision making.
EDGAR Online’s I-Metrix provides this financial statement data in the XBRL format along with earnings estimates, revisions and trends, analysts’ recommendations, sales estimates, expected dividends information, historical earnings-per-share perspective, and estimated long-term growth rates for a company, its industry and the S&P 500. In addition, I-Metrix Professional includes the ability to screen for companies by industry, sector, Standard Industrial Classification code or trading exchange and to open XBRL documents from other sources.
FIGURE 6: CARTESIS BPM APPLICATIONS LEVERAGE EXTERNAL DATA
16 NEW FORMAT AND TECHNOLOGY DRIVES ENHANCED BUSINESS REPORTINGHOW TO COMBINE PERFORMANCE MANAGEMENT AND XBRL

HOW TO COMBINE PERFORMANCE MANAGEMENT AND XBRL
It is this new resource of data that performance management applications such as Cartesis 10 can uniquely take advantage of. Tagging financial information not only enables a standard structure and provides context but also delivers direct comparability of internal and external financial information for reporting and analysis purposes. All of this is an essential part of making U.S.-GAAP and IFRS data globally accessible. The stra-tegic value is built on the reduced costs due to automation, increased data accuracy and improved financial communication and transparency, both internally and externally.
Based on this, Cartesis can deliver EDGAR Online’s XBRL-tagged data on publicly traded companies to the Cartesis XBRL Benchmarking module. As Figure 6 illustrates, users then have the power to analyze actual and forecast data directly alongside their peers and competitors to create externally focused business performance manage-ment, and ultimately conduct the type of analysis (drill down, slice-and-dice, analyze and ad-hoc comparisons) needed to identify areas requiring further inquiry directly in their Cartesis application. By using solutions such as Cartesis 10 that leverage XBRL to collect, analyze and report internal and external data on the business landscape, strat-egy, resources, key processes and performance, businesses can enhance their reporting and gain insight into what improvements they need to make on value drivers that deter-mine future financial performance.
NEW FORMAT AND TECHNOLOGY DRIVES ENHANCED BUSINESS REPORTING 17HOW TO COMBINE PERFORMANCE MANAGEMENT AND XBRL
SUMMARYBusinesses, tired of a never-ending list of increasing regulatory requirements, need to address the demand for real-time Internet-based reporting in a way that they can sus-tain. The key therefore to creating greater business value from this new wave of business reporting demands is to seek ways to embrace best practices throughout the business and create an environment for broader change. This broader change should include a wider range of performance measures, including narrative and non-financial informa-tion, from which businesses can ultimately derive competitive advantage.
XBRL provides not only a format for reporting financial information that benefits inves-tors and analysts, but when proactively leveraged by performance management applica-tions, XBRL is transformed from what many companies see as a regulatory burden into something which brings value to the business and thus all of its stakeholders.
XBRL, EBR and performance management processes and applications, which must in-clude external benchmarking, need to be viewed as inseparable from one another. To-gether they provide a solution capable of improving the business reporting supply chain, which will lead to more value being created for shareholders and other stakeholders.
18 | NEW FORMAT AND TECHNOLOGY DRIVES ENHANCED BUSINESS REPORTING | SUMMARY

ABOUT the Authors
Dr. Robert G. Eccles is a founder and Managing Director of Perception Partners. Prior to that he was a tenured professor at the Harvard Business School where he served on the faculty for 14 years. Dr. Eccles is an internationally recognized expert on corporate re-porting and the author of The ValueReporting Revolution: Moving Beyond the Earnings Game (with Robert H. Herz, E. Mary Keegan and David M. H. Phillips) and Building Public Trust: The Future of Corporate Reporting (with Samuel A. DiPiazza Jr.). He received an S.B. in Mathematics and an S.B. in Humanities and Science from the Massachusetts Insti-tute of Technology and an A.M. and Ph.D. in Sociology from Harvard University.
James A. Fisher is Product Marketing Director at Cartesis with responsibility for Car-tesis Finance, the company’s market-leading statutory consolidation and management reporting application. With over 10 years experience in the enterprise group reporting and performance management industry, Mr. Fisher held previous EMEA marketing and consulting roles at PricewaterhouseCoopers and KPMG.
Liv A. Watson is the Vice President of Global Strategy at EDGAR Online Inc, where she is responsible for developing EDGAR Online’s international business development strategy. Ms. Watson is also the Vice-Chair of XBRL United States and has spent the past 15 years finding new ways to apply her financial and business reporting expertise to technology and her technical expertise to accounting.
Cartesis
Cartesis is the world’s leading specialist in finance and performance management soft-ware with more than 1,300 corporate customers, 600 employees and 200 consultants worldwide. Created in 1990, Cartesis provides insight, control and confidence by unify-ing information, people and processes at demanding multinationals such as Air France KLM, Cargill, Danone, Diageo, Nissan, Société Générale and Standard Life. One in four Fortune Global 100 companies rely on Cartesis’ deep financial expertise and standards-based technology for compliance, financial consolidation, management reporting, plan-ning, budgeting, forecasting, and intercompany reconciliation; all unified in a single data model that can be leveraged by internal and external users. Cartesis’ partners include Accenture, BearingPoint, Ernst & Young, KPMG, Microsoft and PricewaterhouseCoopers. Cartesis has customers in 44 different countries and offices in Brussels, Frankfurt, London, Norwalk (CT), Paris, Tokyo, Toronto and Utrecht. For more information, go to www.cartesis.com.
EDGAR Online, Inc.
EDGAR Online, Inc. (Nasdaq: EDGR) is a leading provider of value-added business and financial information on global companies to financial, corporate and advisory profes-sionals. The company makes its information and a variety of analysis tools available via online subscriptions and licensing agreements to a large user base. For more informa-tion, go to www.edgar-online.com.
Perception Partners
Perception Partners provides advice to companies, boards and investors on corporate reporting, corporate governance and managing reputational risk. It also works with insurance companies and accounting firms on the implications of these topics for their own business models. An affiliate company, The Perception Group, provides specialized brokerage services for human-capital-based insurance such as D&O and professional liability. For more information, go to www.perceptioncos.com.
NEW FORMAT AND TECHNOLOGY DRIVES ENHANCED BUSINESS REPORTING | ABOUT THE AUTHORS 19

This material is protected by national legislation and international treaties regarding copyright. The name CARTESIS, its logo, names of software products published by CARTESIS and their logos are registered trademarks of CARTESIS S.A. whose head office is located at 23-25 rue de Berri 75008 PARIS - FRANCE. This document is delivered for information purposes only.
© 2006 CARTESIS – All rights reserved
www.cartesis.com