carraway - norwood community report draft 04-27-2012 . 2 ... residents of the carraway - norwood...
TRANSCRIPT

Carraway - Norwood Community
Redevelopment Market Report
DRAFT 04-27-2012

2
Carraway - Norwood Community Retail Development
Table of Contents 1. Community Overview
Map: Aerial View of Carraway - Norwood Trade Area
Overview of Carraway – Norwood trade Area
2. Carraway – Norwood Trade Area: One-Mile Radius of Carraway Hospital
Map: A One-Mile Radius Centered on Carraway Blvd. Makes Up the Potential TOD Area
Key Demographic and Economic Indicators for Carraway - Norwood Community Potential TOD
Area
3. Potential Community Centers and Convenience Retail: Drive-Time Polygons
Map: 1, 3, and 5 Minute Drive-Time Polygons Centered on Carraway – Norwood trade Area
Key Demographic and Economic Indicators for Carraway - Norwood Trade Area Drive Time
Polygons
4. Trade Area Redevelopment Opportunity Sites
5. Summary of Findings

3
1. Carraway – Norwood Overview The heart of the Carraway - Norwood Community exists roughly along Carraway Boulevard between 12th Avenue North and 22nd Avenue North, as well as along 12th Avenue North between 21st and 31st Streets North. The 12th Avenue North corridor provides the best opportunity for additional retail development, primarily because of the existing retailers within the ten (10) block area. Carraway Boulevard opens up the best opportunity for a transit hub and new residential development and office space pending the new plans for the former Carraway Hospital Building. The map below illustrates the extent of Carraway – Norwood Community.

4
2. Potential Transit-Oriented Development (TOD) Area Residents of the Carraway - Norwood Community have expressed interest in having more retail and better transit in their neighborhood. As a result of this community need, the possibility of implementing transit-oriented development within the Carraway - Norwood Community is being considered. A study of the potential TOD area will use economic and demographic information that relates to a one-mile radius surrounding the Carraway – Norwood Trade Area. Below is a map of a one-mile radius (shown in blue) centered on Carraway Boulevard. The area within the one-mile radius makes up the Carraway – Norwood Trade Area.
The pages that follow examine the economic and demographic characteristics of the one-mile trade area. Sources for this information are as follows:
STDB, Esri 2010, a national consumer research organization, is the source of the Trade Area demographic information.
U.S. Census Bureau, American Community Survey 2010 is the source of data for the United States and the City of Birmingham.
5
Below is a summary of key economic and demographic information as it relates to the area within a one-
mile radius of Carraway - Norwood. Following the summary is a more in-depth study of demographic
and economic statistics for the potential trade area. These statistics compare the trade area to the City
of Birmingham and the United States in order to provide context for the statistics.
I. Dwelling Units / Housing Units (2010)
4,510 housing units
2.24 housing units/acre
II. Households (2010)
3,077 households
1.53 households/acre
III. Total Population (2010)
9,419 persons in one-mile area
4.68 persons/acre
IV. Current Jobs (2010)
14,797 Jobs/Employees
7.36 jobs/acre
671 businesses
V. Estimated Income Levels (2010)
Median household income: $18,237
Average household income: $26,059
Per capita income: $11,175
VI. Estimated Purchasing Power (2010)
Average consumer spending: $25,471
Average consumer spending on retail goods: $9,136
Average disposable income: $23,342
6
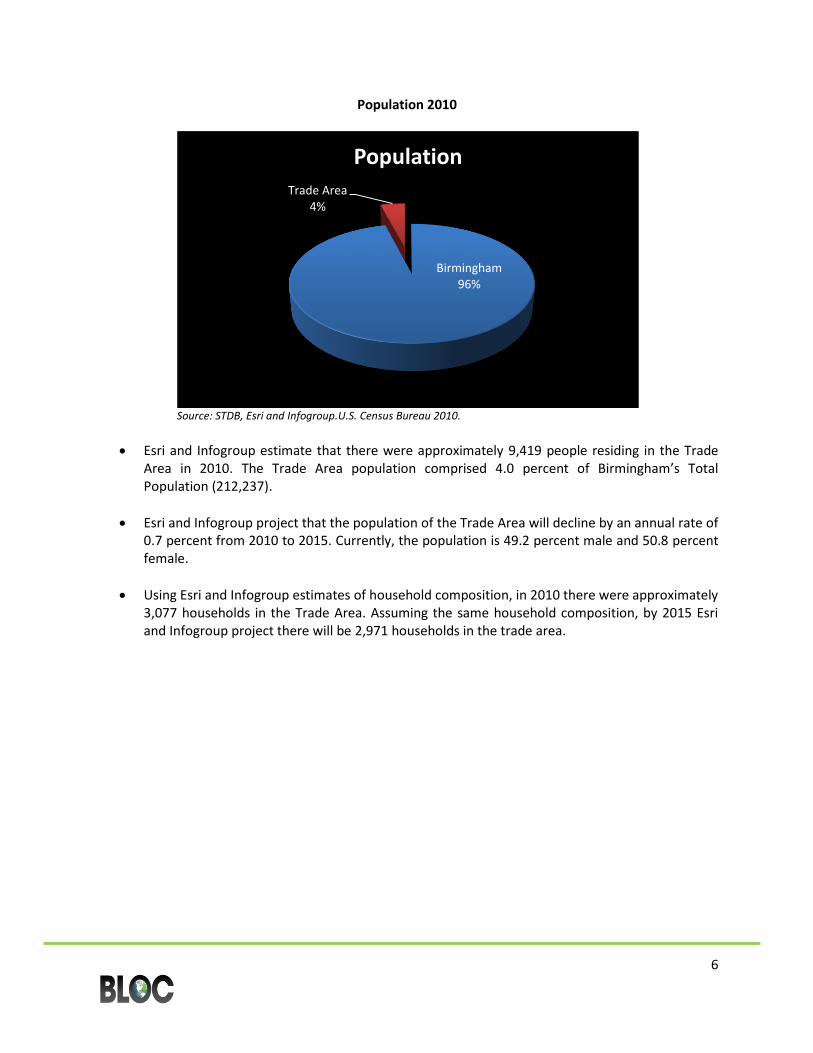
Population 2010
Source: STDB, Esri and Infogroup.U.S. Census Bureau 2010.
Esri and Infogroup estimate that there were approximately 9,419 people residing in the Trade Area in 2010. The Trade Area population comprised 4.0 percent of Birmingham’s Total Population (212,237).
Esri and Infogroup project that the population of the Trade Area will decline by an annual rate of 0.7 percent from 2010 to 2015. Currently, the population is 49.2 percent male and 50.8 percent female.
Using Esri and Infogroup estimates of household composition, in 2010 there were approximately 3,077 households in the Trade Area. Assuming the same household composition, by 2015 Esri and Infogroup project there will be 2,971 households in the trade area.
Birmingham 96%
Trade Area 4%
Population

7
Race in the Trade Area 2010
Source: Esri and Infogroup
According to Esri and Infogroup, in 2010 the Trade Area’s population was 94.6 percent Black/African American.
The Trade Area’s population was 4.7 percent White.
The Trade Area’s population was 0.1 percent American Indian, 0.1 percent Asian, and 0.1 percent Pacific Islander.
0.1 percent of the Trade Area’s population was reported Some Other Race, and 0.4 percent of the Trade Area’s population reported Two or More Races.
White 4.7%
Black 94.6%
Other 0.8%
Race
8
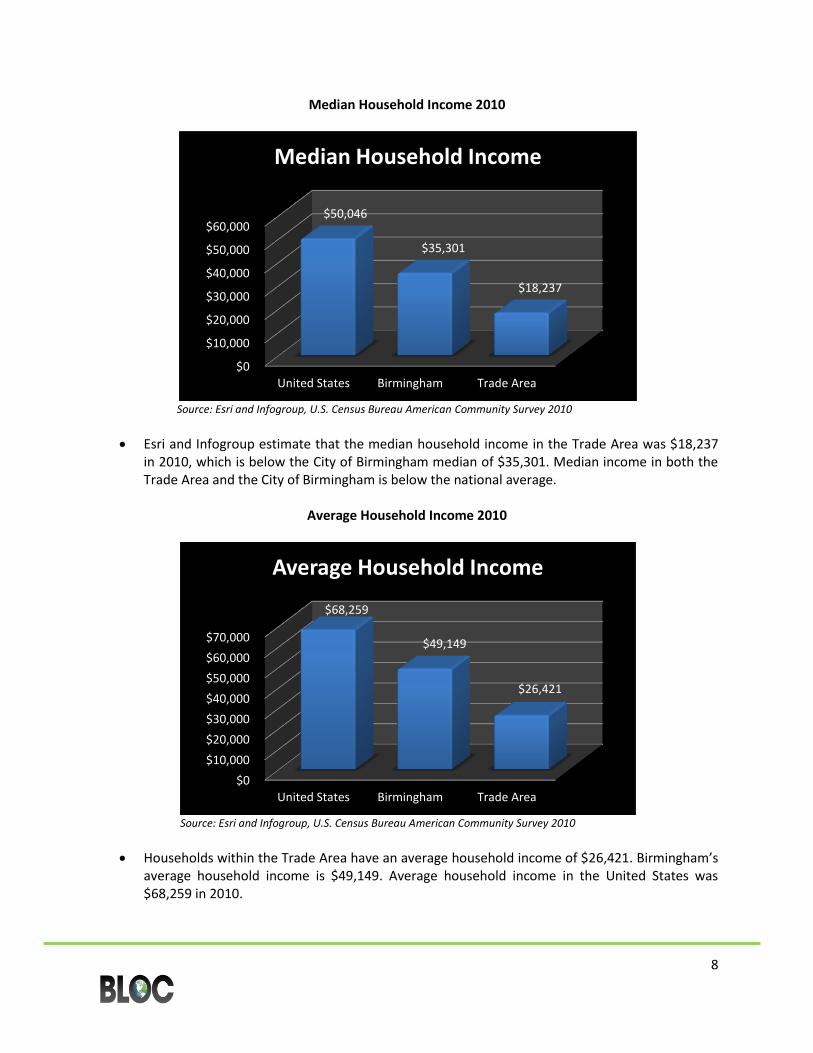
Median Household Income 2010
Source: Esri and Infogroup, U.S. Census Bureau American Community Survey 2010
Esri and Infogroup estimate that the median household income in the Trade Area was $18,237 in 2010, which is below the City of Birmingham median of $35,301. Median income in both the Trade Area and the City of Birmingham is below the national average.
Average Household Income 2010
Source: Esri and Infogroup, U.S. Census Bureau American Community Survey 2010
Households within the Trade Area have an average household income of $26,421. Birmingham’s average household income is $49,149. Average household income in the United States was $68,259 in 2010.
$0
$10,000
$20,000
$30,000
$40,000
$50,000
$60,000
United States Birmingham Trade Area
$50,046
$35,301
$18,237
Median Household Income
$0
$10,000
$20,000
$30,000
$40,000
$50,000
$60,000
$70,000
United States Birmingham Trade Area
$68,259
$49,149
$26,421
Average Household Income

9
Per Capita Income 2010
Source: Esri and Infogroup, U.S. Census Bureau American Community Survey
The Trade Area’s 2010 per capita income of $11,175 was below the Birmingham per capita income of $21,184. The average household in the Trade Area contained 2.47 people, and the average household size in Birmingham was estimated to be 2.21 people.
Income Distribution 2010
Source: Esri and Infogroup, U.S. Census Bureau American Community Survey 2010
Most of the households (58.4%) in the Trade Area have incomes below $25,000. The Trade Area has a lower share of its households (40.4%) in the middle income brackets (earning between $25,000 - $99,000 per year).
$0
$5,000
$10,000
$15,000
$20,000
$25,000
$30,000
United States Birmingham Trade Area
$26,059
$21,184
$11,175
Per Capita Income
0%
10%
20%
30%
40%
50%
60%
Less than $25,000 $25,000 - $99,000 $100,000 - Plus
43% 49%
8%
58.40%
40.40%
1.20%
Income Distribution
Birmingham Trade Area
10
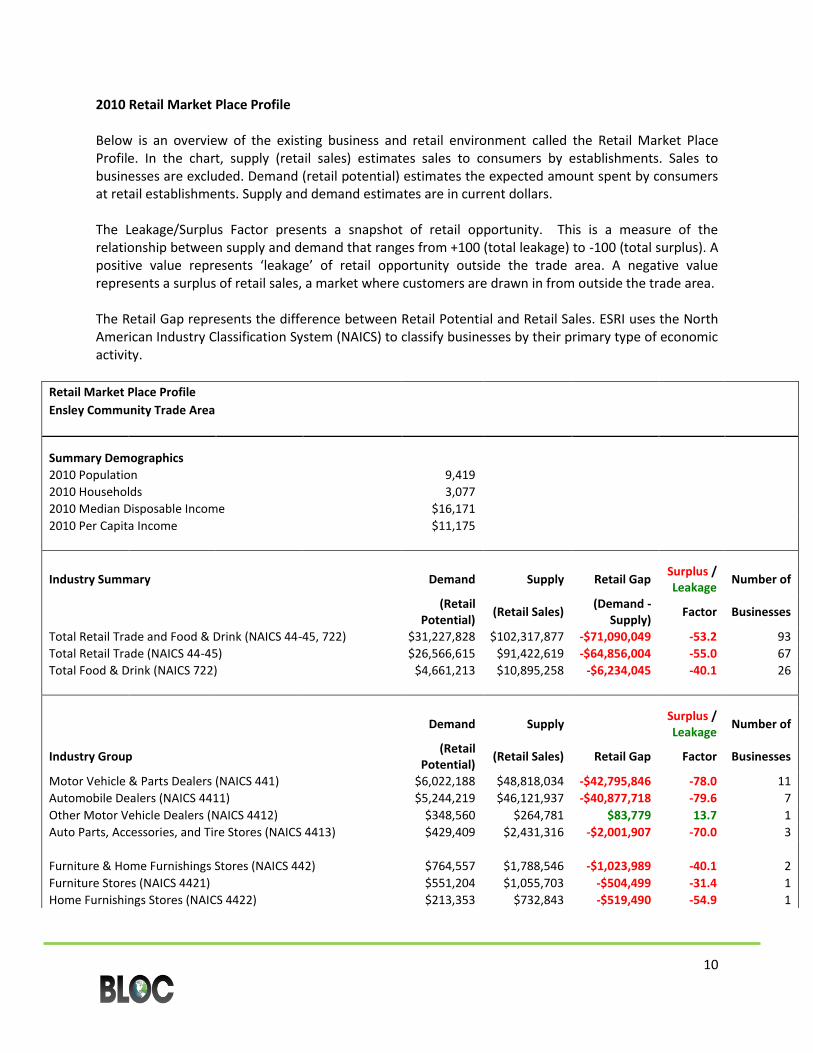
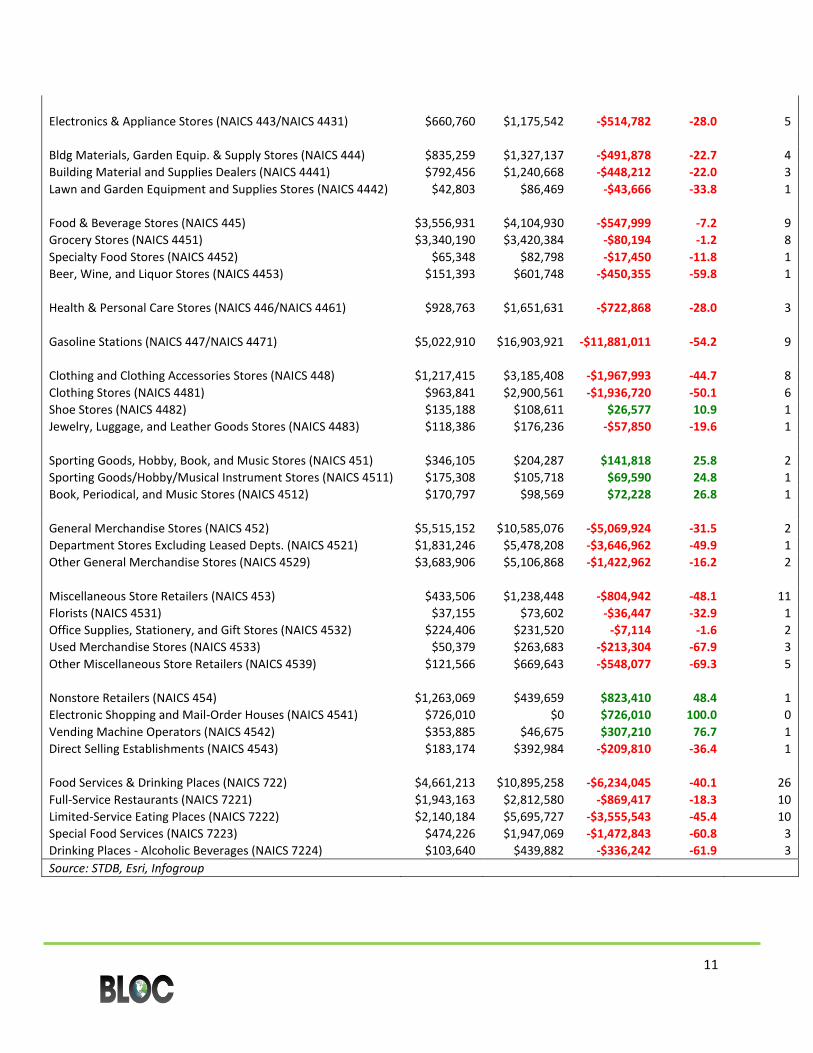
2010 Retail Market Place Profile Below is an overview of the existing business and retail environment called the Retail Market Place Profile. In the chart, supply (retail sales) estimates sales to consumers by establishments. Sales to businesses are excluded. Demand (retail potential) estimates the expected amount spent by consumers at retail establishments. Supply and demand estimates are in current dollars. The Leakage/Surplus Factor presents a snapshot of retail opportunity. This is a measure of the relationship between supply and demand that ranges from +100 (total leakage) to -100 (total surplus). A positive value represents ‘leakage’ of retail opportunity outside the trade area. A negative value represents a surplus of retail sales, a market where customers are drawn in from outside the trade area. The Retail Gap represents the difference between Retail Potential and Retail Sales. ESRI uses the North American Industry Classification System (NAICS) to classify businesses by their primary type of economic activity.
Retail Market Place Profile
Ensley Community Trade Area
Summary Demographics
2010 Population
9,419
2010 Households
3,077
2010 Median Disposable Income $16,171
2010 Per Capita Income $11,175
Industry Summary
Demand Supply Retail Gap
Surplus / Leakage
Number of
(Retail
Potential) (Retail Sales)
(Demand - Supply)
Factor Businesses
Total Retail Trade and Food & Drink (NAICS 44-45, 722) $31,227,828 $102,317,877 -$71,090,049 -53.2 93
Total Retail Trade (NAICS 44-45) $26,566,615 $91,422,619 -$64,856,004 -55.0 67
Total Food & Drink (NAICS 722) $4,661,213 $10,895,258 -$6,234,045 -40.1 26
Demand Supply
Surplus / Leakage
Number of
Industry Group
(Retail Potential)
(Retail Sales) Retail Gap Factor Businesses
Motor Vehicle & Parts Dealers (NAICS 441) $6,022,188 $48,818,034 -$42,795,846 -78.0 11
Automobile Dealers (NAICS 4411) $5,244,219 $46,121,937 -$40,877,718 -79.6 7
Other Motor Vehicle Dealers (NAICS 4412) $348,560 $264,781 $83,779 13.7 1
Auto Parts, Accessories, and Tire Stores (NAICS 4413) $429,409 $2,431,316 -$2,001,907 -70.0 3
Furniture & Home Furnishings Stores (NAICS 442) $764,557 $1,788,546 -$1,023,989 -40.1 2
Furniture Stores (NAICS 4421) $551,204 $1,055,703 -$504,499 -31.4 1
Home Furnishings Stores (NAICS 4422) $213,353 $732,843 -$519,490 -54.9 1
11
Electronics & Appliance Stores (NAICS 443/NAICS 4431) $660,760 $1,175,542 -$514,782 -28.0 5
Bldg Materials, Garden Equip. & Supply Stores (NAICS 444) $835,259 $1,327,137 -$491,878 -22.7 4
Building Material and Supplies Dealers (NAICS 4441) $792,456 $1,240,668 -$448,212 -22.0 3
Lawn and Garden Equipment and Supplies Stores (NAICS 4442) $42,803 $86,469 -$43,666 -33.8 1
Food & Beverage Stores (NAICS 445) $3,556,931 $4,104,930 -$547,999 -7.2 9
Grocery Stores (NAICS 4451) $3,340,190 $3,420,384 -$80,194 -1.2 8
Specialty Food Stores (NAICS 4452) $65,348 $82,798 -$17,450 -11.8 1
Beer, Wine, and Liquor Stores (NAICS 4453) $151,393 $601,748 -$450,355 -59.8 1
Health & Personal Care Stores (NAICS 446/NAICS 4461) $928,763 $1,651,631 -$722,868 -28.0 3
Gasoline Stations (NAICS 447/NAICS 4471) $5,022,910 $16,903,921 -$11,881,011 -54.2 9
Clothing and Clothing Accessories Stores (NAICS 448) $1,217,415 $3,185,408 -$1,967,993 -44.7 8
Clothing Stores (NAICS 4481) $963,841 $2,900,561 -$1,936,720 -50.1 6
Shoe Stores (NAICS 4482) $135,188 $108,611 $26,577 10.9 1
Jewelry, Luggage, and Leather Goods Stores (NAICS 4483) $118,386 $176,236 -$57,850 -19.6 1
Sporting Goods, Hobby, Book, and Music Stores (NAICS 451) $346,105 $204,287 $141,818 25.8 2
Sporting Goods/Hobby/Musical Instrument Stores (NAICS 4511) $175,308 $105,718 $69,590 24.8 1
Book, Periodical, and Music Stores (NAICS 4512) $170,797 $98,569 $72,228 26.8 1
General Merchandise Stores (NAICS 452) $5,515,152 $10,585,076 -$5,069,924 -31.5 2
Department Stores Excluding Leased Depts. (NAICS 4521) $1,831,246 $5,478,208 -$3,646,962 -49.9 1
Other General Merchandise Stores (NAICS 4529) $3,683,906 $5,106,868 -$1,422,962 -16.2 2
Miscellaneous Store Retailers (NAICS 453) $433,506 $1,238,448 -$804,942 -48.1 11
Florists (NAICS 4531) $37,155 $73,602 -$36,447 -32.9 1
Office Supplies, Stationery, and Gift Stores (NAICS 4532) $224,406 $231,520 -$7,114 -1.6 2
Used Merchandise Stores (NAICS 4533) $50,379 $263,683 -$213,304 -67.9 3
Other Miscellaneous Store Retailers (NAICS 4539) $121,566 $669,643 -$548,077 -69.3 5
Nonstore Retailers (NAICS 454) $1,263,069 $439,659 $823,410 48.4 1
Electronic Shopping and Mail-Order Houses (NAICS 4541) $726,010 $0 $726,010 100.0 0
Vending Machine Operators (NAICS 4542) $353,885 $46,675 $307,210 76.7 1
Direct Selling Establishments (NAICS 4543) $183,174 $392,984 -$209,810 -36.4 1
Food Services & Drinking Places (NAICS 722) $4,661,213 $10,895,258 -$6,234,045 -40.1 26
Full-Service Restaurants (NAICS 7221) $1,943,163 $2,812,580 -$869,417 -18.3 10
Limited-Service Eating Places (NAICS 7222) $2,140,184 $5,695,727 -$3,555,543 -45.4 10
Special Food Services (NAICS 7223) $474,226 $1,947,069 -$1,472,843 -60.8 3
Drinking Places - Alcoholic Beverages (NAICS 7224) $103,640 $439,882 -$336,242 -61.9 3
Source: STDB, Esri, Infogroup

12
2015 Retail Market Place Forecast
Below is an overview of the projected future business and retail environment called the Retail Market Place Forecast. As in the Market Place Profile above, the source of this information is STDB, Esri, and Infogroup. The same definitions of Supply, Demand, Lakeage/Surplus Factor, and Retail Gap that apply to the Retail Market Place Profile also apply to the Retail Market Place Forecast.
Retail Market Place Forecast - 2015
Ensley Community Trade Area
Summary Demographics
2010 Population
9,109
2010 Households
2,971
2010 Per Capita Income $11,818
Industry Summary
Demand Supply Retail Gap
Surplus / Leakage
Number of
(Retail
Potential) (Retail Sales)
(Demand - Supply)
Factor Businesses
Total Retail Trade and Food & Drink (NAICS 44-45, 722) $30,972,273 $116,134,748 -$85,162,475 -57.9 92
Total Retail Trade (NAICS 44-45) $26,329,388 $103,737,389 -$77,408,002 -59.5 66
Total Food & Drink (NAICS 722) $4,642,885 $12,397,359 -$7,754,474 -45.5 26
Demand Supply
Surplus / Leakage
Number of
Industry Group
(Retail Potential)
(Retail Sales) Retail Gap Factor Businesses
Motor Vehicle & Parts Dealers (NAICS 441) $6,043,924 $55,645,561 -$49,601,637 -80.4 10
Automobile Dealers (NAICS 4411) $5,280,746 $52,563,554 -$47,282,808 -81.7 7
Other Motor Vehicle Dealers (NAICS 4412) $363,059 $302,155 $60,904 9.2 1
Auto Parts, Accessories, and Tire Stores (NAICS 4413) $400,119 $2,779,852 -$2,379,733 -74.8 3
Furniture & Home Furnishings Stores (NAICS 442) $859,175 $2,146,000 -$1,286,825 -42.8 3
Furniture Stores (NAICS 4421) $611,473 $1,276,027 -$664,554 -35.2 1
Home Furnishings Stores (NAICS 4422) $247,702 $869,973 -$622,271 -55.7 1
Electronics & Appliance Stores (NAICS 443/NAICS 4431) $747,854 $1,396,020 -$648,166 -30.2 5
Bldg Materials, Garden Equip. & Supply Stores (NAICS 444) $888,904 $1,539,859 -$650,956 -26.8 4
Building Material and Supplies Dealers (NAICS 4441) $834,810 $1,439,340 -$604,529 -26.6 3
Lawn and Garden Equipment and Supplies Stores (NAICS 4442) $54,093 $100,519 -$46,426 -30.0 1
Food & Beverage Stores (NAICS 445) $4,097,410 $4,749,435 -$652,025 -7.4 9
Grocery Stores (NAICS 4451) $3,899,741 $4,030,470 -$130,729 -1.6 8
Specialty Food Stores (NAICS 4452) $79,619 $94,657 -$15,038 -8.6 0

13
Beer, Wine, and Liquor Stores (NAICS 4453) $118,050 $624,308 -$506,259 -68.2 1
Health & Personal Care Stores (NAICS 446/NAICS 4461) $809,199 $1,605,426 -$796,227 -33.0 3
Gasoline Stations (NAICS 447/NAICS 4471) $5,425,998 $19,760,908 -$14,334,910 -56.9 9
Clothing and Clothing Accessories Stores (NAICS 448) $1,112,779 $3,454,015 -$2,341,236 -51.3 8
Clothing Stores (NAICS 4481) $893,886 $3,162,403 -$2,268,517 -55.9 6
Shoe Stores (NAICS 4482) $116,898 $110,591 $6,308 2.8 1
Jewelry, Luggage, and Leather Goods Stores (NAICS 4483) $101,995 $181,021 -$79,027 -27.9 1
Sporting Goods, Hobby, Book, and Music Stores (NAICS 451) $313,373 $211,869 $101,504 19.3 1
Sporting Goods/Hobby/Musical Instrument Stores (NAICS 4511) $119,136 $94,371 $24,765 11.6 1
Book, Periodical, and Music Stores (NAICS 4512) $194,237 $117,498 $76,739 24.6 1
General Merchandise Stores (NAICS 452) $4,547,765 $11,441,617 -$6,893,852 -43.1 2
Department Stores Excluding Leased Depts. (NAICS 4521) $1,886,617 $6,286,011 -$4,399,394 -53.8 0
Other General Merchandise Stores (NAICS 4529) $2,661,148 $5,155,606 -$2,494,458 -31.9 2
Miscellaneous Store Retailers (NAICS 453) $420,923 $1,320,155 -$899,232 -51.6 11
Florists (NAICS 4531) $43,473 $87,083 -$43,611 -33.4 1
Office Supplies, Stationery, and Gift Stores (NAICS 4532) $217,785 $268,927 -$51,142 -10.5 2
Used Merchandise Stores (NAICS 4533) $40,401 $258,852 -$218,450 -73.0 3
Other Miscellaneous Store Retailers (NAICS 4539) $119,264 $705,292 -$586,029 -71.1 5
Nonstore Retailers (NAICS 454) $1,062,085 $466,525 $595,560 39.0 1
Electronic Shopping and Mail-Order Houses (NAICS 4541) $538,896 $0 $538,896 100.0 0
Vending Machine Operators (NAICS 4542) $348,270 $55,724 $292,546 72.4 0
Direct Selling Establishments (NAICS 4543) $174,920 $410,801 -$235,882 -40.3 1
Food Services & Drinking Places (NAICS 722) $4,642,885 $12,397,359 -$7,754,474 -45.5 26
Full-Service Restaurants (NAICS 7221) $1,969,904 $3,246,869 -$1,276,966 -24.5 10
Limited-Service Eating Places (NAICS 7222) $2,140,173 $6,505,259 -$4,365,086 -50.5 10
Special Food Services (NAICS 7223) $457,431 $2,216,907 -$1,759,475 -65.8 3
Drinking Places - Alcoholic Beverages (NAICS 7224) $75,377 $428,324 -$352,947 -70.1 3
Source: STDB, Esri, Infogroup
14
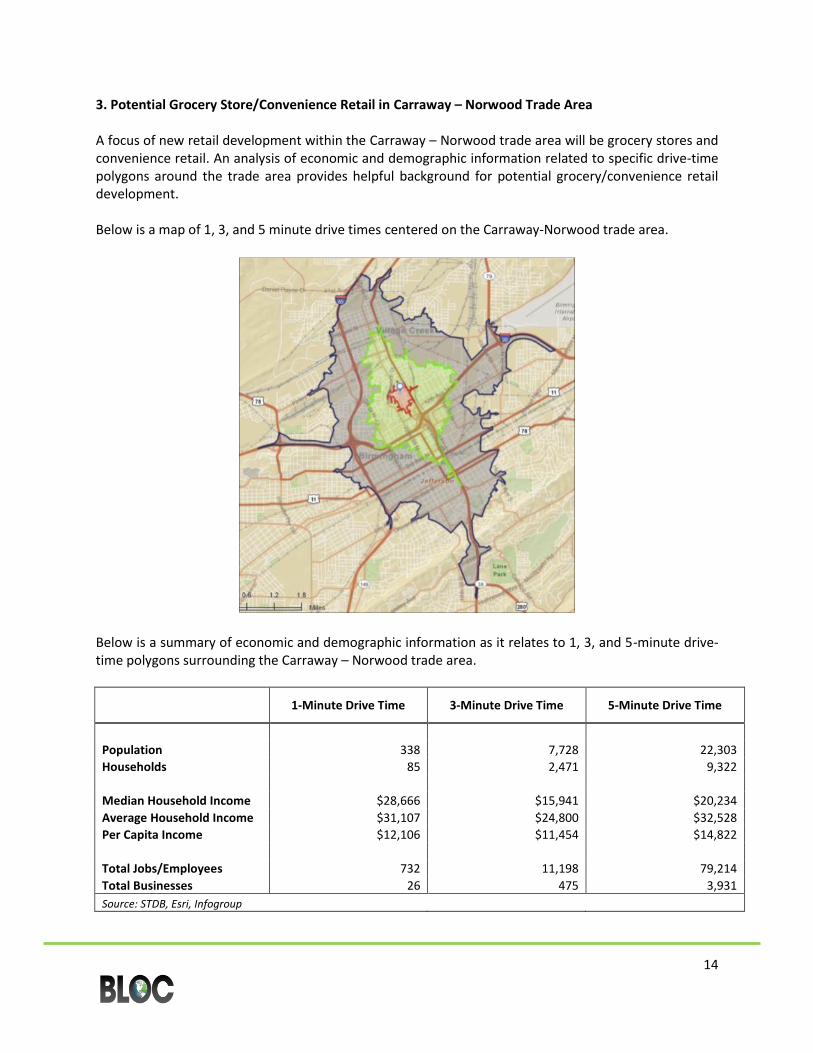
3. Potential Grocery Store/Convenience Retail in Carraway – Norwood Trade Area A focus of new retail development within the Carraway – Norwood trade area will be grocery stores and convenience retail. An analysis of economic and demographic information related to specific drive-time polygons around the trade area provides helpful background for potential grocery/convenience retail development. Below is a map of 1, 3, and 5 minute drive times centered on the Carraway-Norwood trade area.
Below is a summary of economic and demographic information as it relates to 1, 3, and 5-minute drive-time polygons surrounding the Carraway – Norwood trade area.
1-Minute Drive Time 3-Minute Drive Time 5-Minute Drive Time
Population 338 7,728 22,303
Households 85 2,471 9,322
Median Household Income $28,666 $15,941 $20,234
Average Household Income $31,107 $24,800 $32,528
Per Capita Income $12,106 $11,454 $14,822
Total Jobs/Employees 732 11,198 79,214
Total Businesses 26 475 3,931
Source: STDB, Esri, Infogroup

15
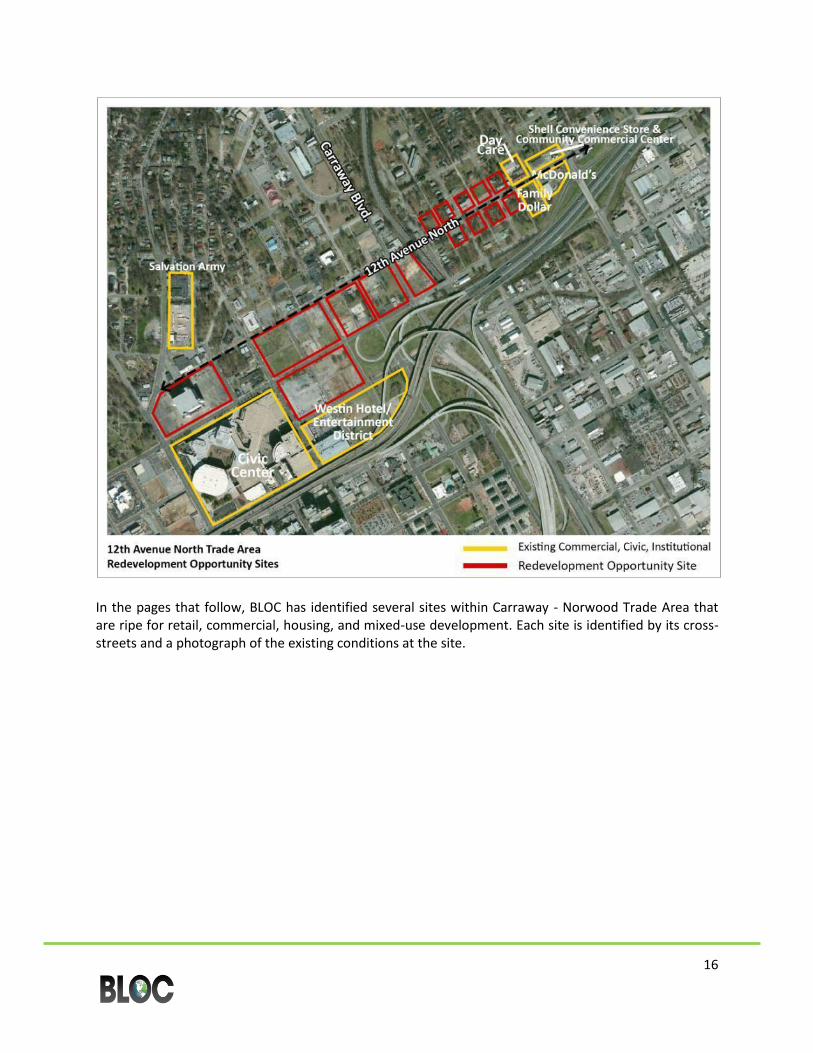
4. Trade Area Redevelopment Opportunity Sites The planning team identified several large “opportunity sites” across the trade area that could support significant redevelopment. Located along existing or proposed transit routes, these vacant or underutilized light-industrial, residential, and commercial areas offer the Carraway - Norwood Trade Area a unique opportunity to build vibrant, contemporary, transit-oriented neighborhood, main streets, and commercial centers. Of varying densities, these new developments would incorporate the best qualities of existing, historic neighborhoods. Housing and commercial market analysis suggests that sufficient demand will exist to assure the success of redevelopment on these sites. The results of the market analysis shaped the recommendations for each of these sites, which collectively would bring the Carraway - Norwood Trade Area broadened housing choices, expanded retail offerings, increased sales tax revenues, and new jobs. Below are maps of the Carraway Boulevard Trade Area and 12th Avenue North Trade Area with existing retail, residential, civic, and institutional space highlighted in yellow and redevelopment opportunity sites highlighted in red.
16
In the pages that follow, BLOC has identified several sites within Carraway - Norwood Trade Area that are ripe for retail, commercial, housing, and mixed-use development. Each site is identified by its cross-streets and a photograph of the existing conditions at the site.
17
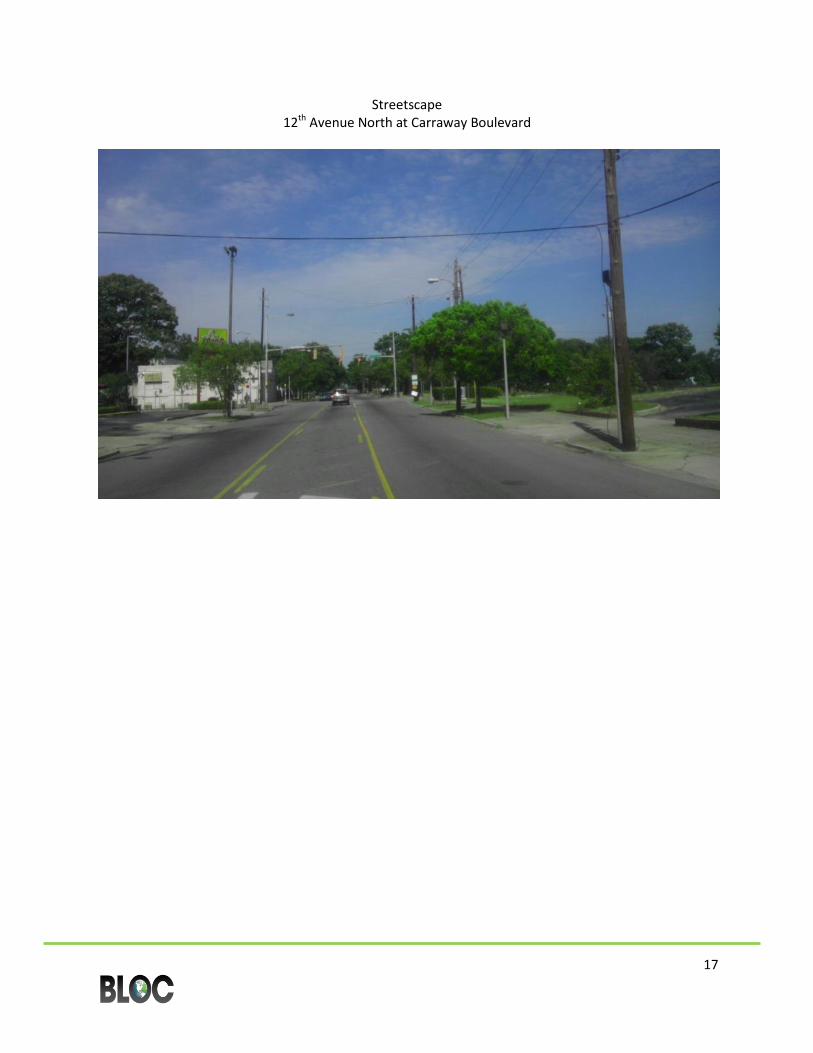
Streetscape 12th Avenue North at Carraway Boulevard
18
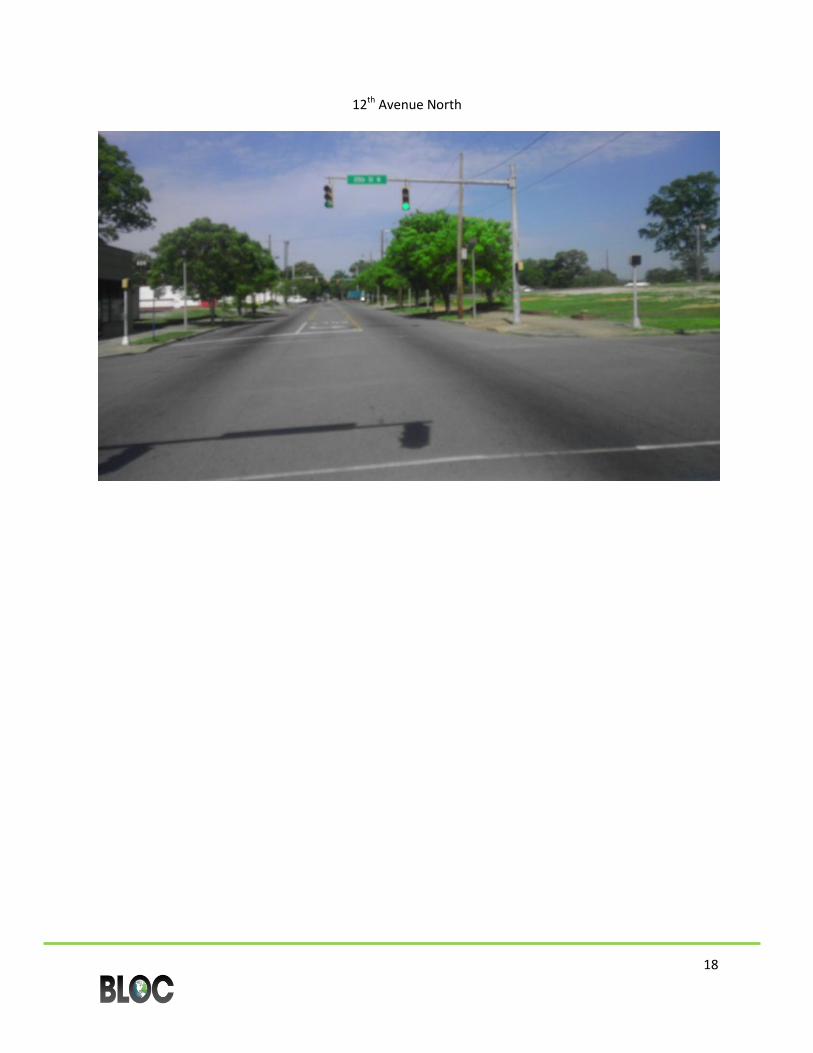
12th Avenue North

19
Rally’s and Adjacent Vacant Land Available for New Development 12th Avenue North at Carraway Boulevard
20
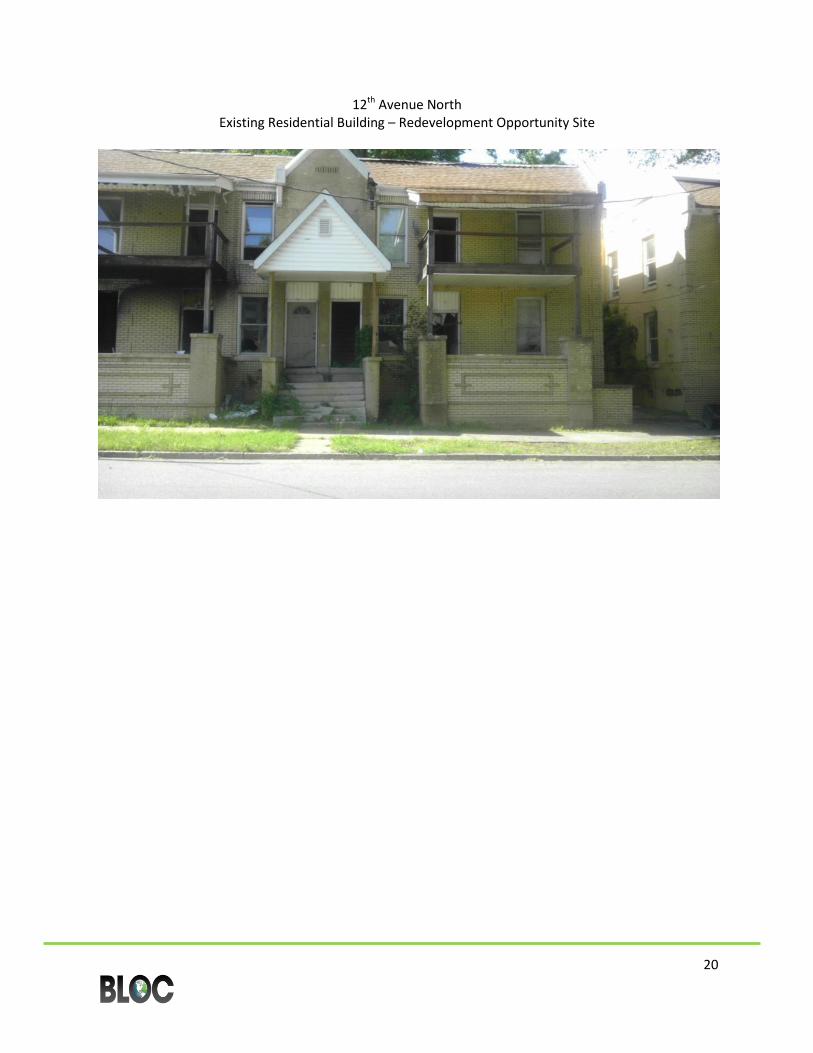
12th Avenue North Existing Residential Building – Redevelopment Opportunity Site

21
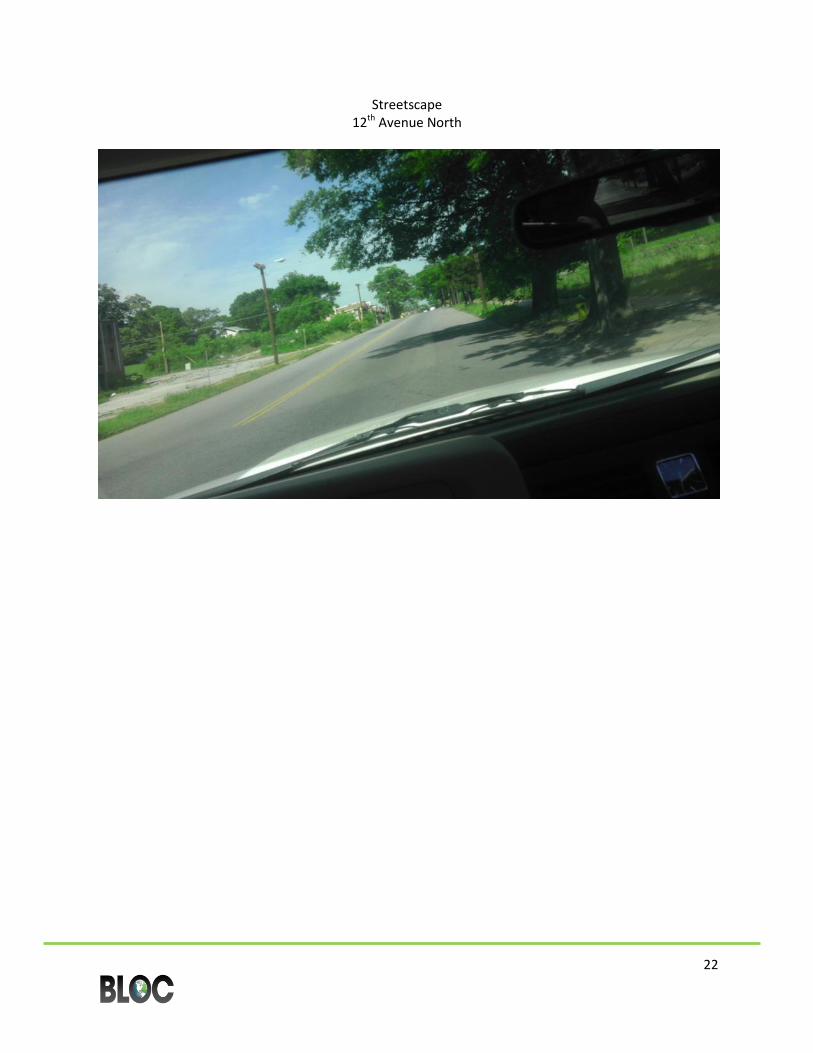
Streetscape 12th Avenue North
22
Streetscape 12th Avenue North

23
Board of Education Building 12th Avenue North

24
Potential Redevelopment Opportunity Site 12th Avenue North
25
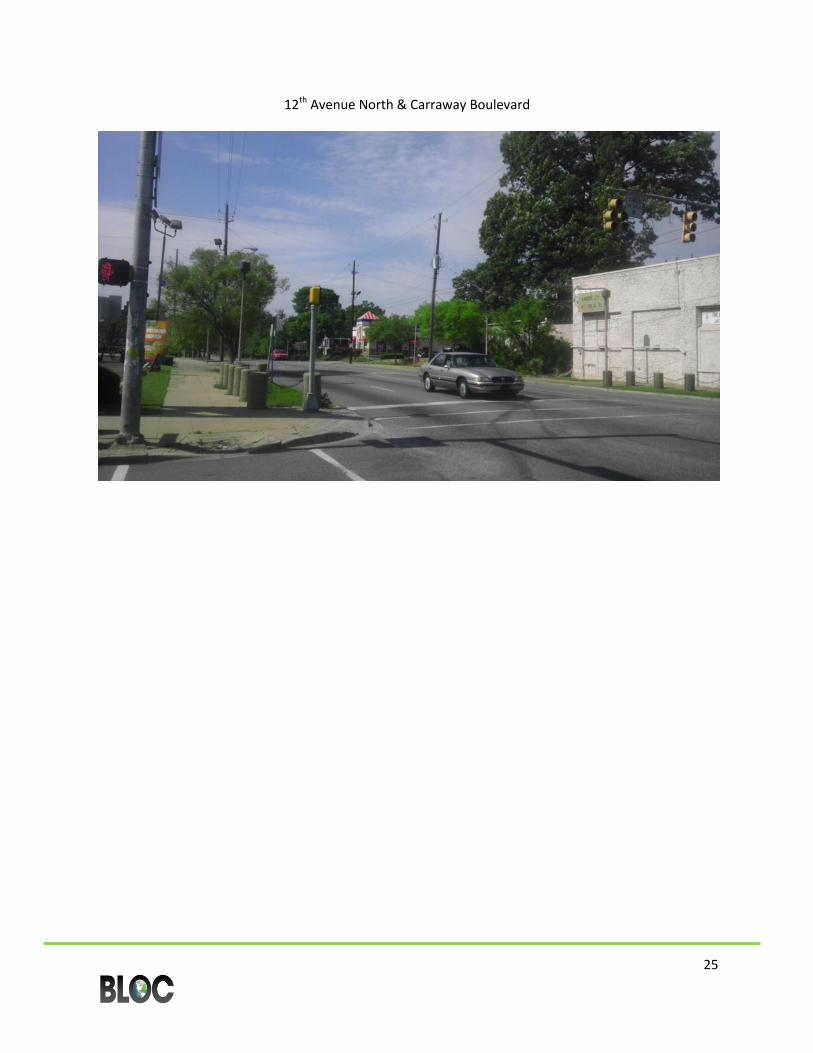
12th Avenue North & Carraway Boulevard

26
Food Mart F.L. Shuttlesworth Drive

27
Potential Redevelopment Opportunity Site 12th Avenue North

28
12th Avenue North

29
Streetscape 12th Avenue North & 23rd Street

30
5. Summary of Findings A retail market analysis prepared by BLOC Global for the City of Birmingham’s Carraway – Norwood Trade Area concluded that by 2015:
Residents will hold approximately $30,972,273 in retail potential.
Given the target market, the retail in the Carraway – Norwood Community along Carraway Boulevard between 12th Avenue North and 22nd Avenue North, as well as 12th Avenue North between 21st Street and 31st Street, has the potential to be pedestrian friendly and incorporated into a mixed-use environment.
Retail should target local customers and not serve as a regional destination.
The amount of retail developed will largely depend on obtaining an anchor, such as a grocery store and/or commercial community center establishments.
Near term retail development prospects are limited at this location.
Neighborhood serving retail including a grocery store, electronic shopping and mail-order houses, vending machine operators, and sporting goods, hobby, book, and music stores offer the greatest opportunity at these locations.