carla cardinali and sean healy research department
TRANSCRIPT

714
Impact of GPS radio occultation measurements in the
ECMWF system using adjoint based diagnostics
Carla Cardinali and Sean Healy
Research Department
Accepted for publication in Q.J. Royal Meteorological Society
November 2013

Series: ECMWF Technical Memoranda A full list of ECMWF Publications can be found on our web site under: http://www.ecmwf.int/publications/ Contact: [email protected] © Copyright 2013 European Centre for Medium Range Weather Forecasts Shinfield Park, Reading, Berkshire RG2 9AX, England Literary and scientific copyrights belong to ECMWF and are reserved in all countries. This publication is not to be reprinted or translated in whole or in part without the written permission of the Director General. Appropriate non-commercial use will normally be granted under the condition that reference is made to ECMWF. The information within this publication is given in good faith and considered to be true, but ECMWF accepts no liability for error, omission and for loss or damage arising from its use.

Impact of GPS radio occultation measurements…
Technical Memorandum No.714 1
Summary
In this paper, a comprehensive assessment of the impact of radio occultation observations in the operational ECMWF assimilation and forecast system is presented using different diagnostic tools. In particular, the observation influence in the assimilation process and the related contribution on the short-range forecast error of radio occultation observations is evaluated with recently developed diagnostic tools based on the adjoint version of the assimilation and forecast model. The sensitivity with respect to observation error variances is also evaluated for the assimilated observations. GPS-RO results to have the largest mean influence among satellite observations in the analysis. It is the 4th satellite system for analysis information content and the 2nd largest satellite contributor together with IASI and AIRS to decrease the 24-hour forecast error. For the whole observing system, with the exception of radiosondes and polar atmospheric motion vectors, the forecast error sensitivity to the observation error variance indicates that a deflation of the assumed observation errors would improve the forecast skill. For radio occultation observations at all vertical levels, but predominantly between 10 and 20 km, a deflation of the observation error variance is suggested. Interestingly, the sensitivity computation recommends reducing the assumed errors mostly in layers where the weight given to GPS-RO data is quite large.
keywords: Radio occultation observations, observation impact, observation error variance, diagnostic tools
1 Introduction The ECMWF four-dimensional variational system (4D-Var, Rabier et al. 2000) handles a large variety of both space and surface-based meteorological observations (more than 30 million a day) and combines the observations with the prior (or background) information on the atmospheric state. A comprehensive linearized and non-linear forecast model is used with more than 108 degrees of freedom.
The assessment of the contribution of each observation to the analysis is among one of the most challenging diagnostics in data assimilation and numerical weather prediction. Furthermore, it has become increasingly difficult to demonstrate the impact of new observation types as the skill of NWP systems has improved. This study applies 4D-Var information content and adjoint-based diagnostic tools to focus on the impact of GPS radio occultation (GPSRO) measurements in the ECMWF NWP system. GPSRO measurements are now routinely assimilated at the operational NWP centres (e.g., Healy and Thépaut 2006; Cucurull et al. 2007; Aparicio and Deblonde 2008; Poli et al. 2009; Rennie 2010). It has been demonstrated that they have a particularly good impact on upper-tropospheric and lower/middle stratospheric temperatures, even though the observation numbers are low compared with satellite radiances, accounting for only around ~3 % of the measurements assimilated. The present work complements recent ECMWF observing system experiments (Bauer et al. 2013), and simulations designed to investigate how the impact of GPS-RO scales with observation number (Harnisch et al. 2013). The diagnostics used here quantify the influence of the GPS-RO on the 4D-Var analysis, and how these measurements subsequently reduce the errors in short-range forecasts.
The methods developed to quantify the observational influence (Purser and Huang 1993, Cardinali et al. 2004, Chapnick et al. 2004, Lupu et al. 2011, Cardinali 2013) show which part of the analysis is given by the observations and which is given by the background or pseudo-observations. They therefore provide an indication of the robustness of the fit between model and observations and allow some tuning of the weights assigned in the assimilation system. Measures of the observational

Impact of GPS radio occultation measurements…
2 Technical Memorandum No.714
influence are useful for understanding the Data Assimilation (DA) scheme itself: the influence of the newest data assimilated, the influence of the background on the fit, the analysis change if one single influential observation is removed and the total amount of information extracted from the available data. It is therefore necessary to consider the diagnostic methods that have been developed for monitoring statistical multiple regression analyses (Tukey 1972; Wabba et al.1995); 4D-Var is, in fact, a special case of the Generalized Least Square (GLS) problem (Talagrand, 1997) for weighted regression thoroughly investigated in the statistical literature.
For the forecast, the assessment of the forecast performance can be achieved by adjoint-based observation sensitivity techniques that characterize the forecast impact of every measurement (Baker and Daley 2000, Langland and Baker 2004, Cardinali and Buizza, 2004, Morneau et al., 2006, Xu and Langland, 2006, Zhu and Gelaro 2008, Cardinali 2009). The technique computes the variation in the forecast error due to the assimilated data. In particular, the forecast error is measured by a scalar function of the model parameters, namely wind, temperature, humidity and surface pressure that are more or less directly related to the observable quantities. The observation impact therefore depends on the metric used to compute the global forecast error. In this study the energy metric has been used.
In general, the adjoint methodology can be used to estimate the sensitivity of the forecast with respect to any parameters of the assimilation system. For example, Daescu (2008) derived a sensitivity equation of an unconstrained variational data assimilation system from the first-order necessary condition with respect to the main input parameters: observation, background, observation and background error covariance matrices. In particular, the sensitivity with respect to the observation error variance offers guidance for tuning the variances. Recently, Daescu and Todling (2010) and Daescu and Langland (2013 (a) and (b)) have shown how the forecast sensitivity to the observation error variance can be computed and variances accordingly tuned.
A general description of the tools used on the estimation of the observations performance is given in Section 2. Results on the observations impact in the ECMWF assimilation and forecast system is shown in Section 3, with particular attention on the impact of GPS-RO (radio occultation). The conclusions are provided in Section 4.
2 Data Assimilation Diagnostic tools DA systems for NWP provide estimates of the atmospheric state x by combining meteorological observations y with prior (or background) information xb. A simple Bayesian Normal model provides the solution as the posterior expectation for x, given y and xb. The same solution can be achieved from a classical frequentist approach, based on a statistical linear analysis scheme providing the Best Linear Unbiased Estimate (Talagrand, 1997) of x, given y and xb. The optimal GLS solution to the analysis problem (see Lorenc, 1986) can be written
a n bx = Ky + (I - KH)x 2.1
The vector xa is the ‘analysis’. The gain matrix K (n × p) takes into account the respective accuracies of the background vector xb and the observation vector y as defined by the n × n covariance matrix B and the p × p covariance matrix R, with
1 1 1 1T T− − − −K = (B + H R H) H R 2.2

Impact of GPS radio occultation measurements…
Technical Memorandum No.714 3
Here, H is a p × n matrix interpolating the background fields to the observation locations, and transforming the model variables to observed quantities (e.g. radiative transfer calculations transforming the models temperature, humidity and ozone into brightness temperatures as observed by several satellite instruments). In the 4D-Var context introduced below, H is defined to include also the propagation in time of the atmospheric state vector to the observation times using a forecast model.
The analysis state is hence defined as a sum of the background and the observations y, weighted by matrices I - HK and HK , respectively. For each unknown component of x, there are two sources of information: real observations and ‘pseudo’ observations, representing prior knowledge provided by the background xb.
The analysis sensitivity with respect to the observations is a function of KT (Cardinali et al 2004, Cardinali 2013). In particular, the sensitivity trace is the Degree of Freedom for Signal (DFS) and the complementary one is the Degree of Freedom for Background (DFB). The total observation influence in the analysis is provided by the DFS. The DFS is hence modulated also by the observations number.
In 2000, Baker and Daley derived the sensitivity of the forecast error to the assimilated observations. Langland and Baker (2004) complemented the equations with a measure of the forecast error reduction due to the assimilated observations. The Forecast Error Reduction (FER) depends on the forecast error, KT , the innovations vector (y-Hxb, H is the non-linear operator) and the observations number. Since the forecast error is computed as the difference between the 24-hour forecast and the analysis valid at the same time, some important considerations must be done: The verifying analysis is only a proxy of the truth, thus, sub-optimal verifying analysis can under-estimate the observation impact. Moreover, the impact can be under-estimated in presence of forecast model errors. The forecast error sensitivity depends on the metric used for the global forecast error computation (all model levels are included in the calculation). The DFS is metric independent.
Recently, Daescu (2008), Daescu and Todling (2010) and Daescu and Langland (2013 (a) and (b)) have derived and computed the sensitivity of the forecast error to the observation error variance. This measure depends on the forecast error, KT , the residuals (y-Hxa) and the observations number. Observation error variance tuning in an operational assimilation system was also exploited by Chapnik et al. 2006.
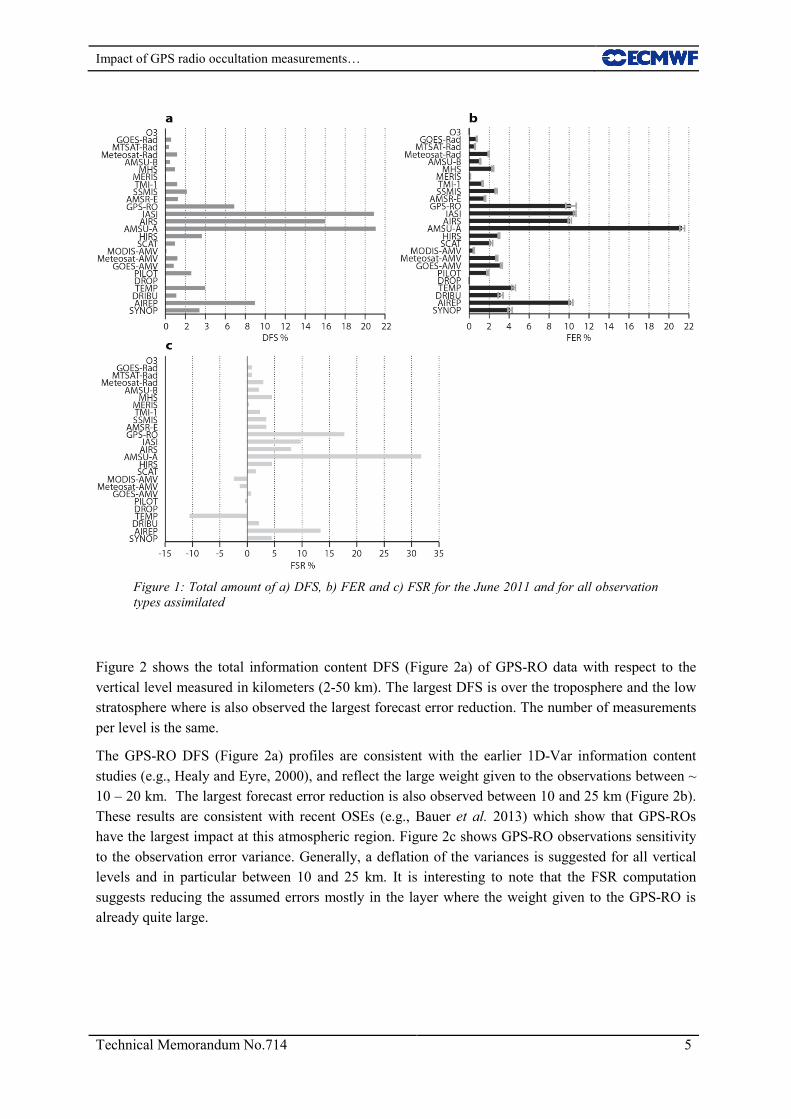
3 Results Analysis and forecast experiments using the ECMWF 4D-Var system (Rabier et al 2000; Janisková et al. 2002; Lopez and Moreau, 2005, Janisková and Lopez, 2013) have been performed for June 2011 to assess the observations impact on the analysis and the forecast. All the observation types assimilated operationally at ECMWF for this period are included in Figure 1 in order to place the impact of GPS-RO in context. Figure 1a shows the DFS of all the observations assimilated. It can be seen that AMSU-A together with IASI radiances are the most informative data type, providing 21% of the total observational information; AIRS follows with 16%. The information content of Aircraft (9%) is the largest among conventional observations, followed by (TEMP radiosonde) and the in situ surface pressure SYNOP observations (~4%). Noticeable is the 7% of GPS-RO (4th in the satellite DFS ranking). In general, the importance of the observations as defined by the DFS agrees well with the recent data impact studies by Radnoti et al, (2010).

Impact of GPS radio occultation measurements…
4 Technical Memorandum No.714
The 24-hour forecast error reduction (FER: Forecast Error Reduction) of all the observing system components is shown in Figure 1b. The largest contribution in decreasing the forecast error is provided by AMSU-A (~21%); IASI, AIRS, GPS-RO and Aircraft provide 10% of the forecast error reduction followed by TEMP and SYNOP data (5%). All the other observations contribute up to 3%. AMV observations from all the different platforms (MODIS, Meteosat and GOES) also contribute well to the 24 hour error reduction (6%).
Comparing Figure 1a with Figure 1b is clear that the impact of the observations (by observation type) on the analysis (DFS) is quite similar to their impact on the forecast as measured by the forecast error (FER) reduction. Both measures depend on the transpose of the gain matrix KT, but the FER also depends on the forecast error and on the innovation vector. The amount of error reduction is modulated by the percentage of forecast error that projects on KT. For some observation types the DFS is larger than the reduction of the forecast error. The impact loss, noticed for some observation type e.g. IASI and AIRS, can depend on the observation quality or can be due to biases in the model that will prevent the analysis changes to affect the short-range forecast which will reflect on the 24 hour forecast error increase.
In Figure 1c, the sensitivity with respect to the observations error variance (FSR, Forecast Sensitivity to R) is shown for the same observation types. The positive sensitivities indicate that error variance deflation should be beneficial to reduce the 24 hour forecast error whilst inflation should be applied on observation error variance with negative sensitivity. According to Figure 1c all the variances should be deflated, apart from TEMP and AMV from MODIS and Meteosat. From Figure 1c, it is accurate to say that a larger assumed error for the background would potentially improve the short range forecast. It is worth to notice that the globally estimated mean observation influence is ~0.2 (DFS devided by the total observation number) being therefore the mean Degree of Freedom for Background (1-DFB) equal to ~0.8. These values identify the background leverage on the fitting and suggest as well some potential for background error variances tuning (see also Cardinali 2013).
In the ECMWF system, GPS-RO provides the 7% of DFS (Fig1a) and 10% of forecast reduction (Fig 1b). The statistical significance of the measure is expressed by the error bars. The GPS-RO measurements mainly provide temperature information in the upper-troposphere and lower/middle stratosphere. They are assimilated as bending anglesα , as a function impact parameter a , which is a height co-ordinate using the one dimensional observation operator described by Healy and Thépaut (2006). The GPS-RO measurements complement the information provided by satellite radiances because they have better vertical resolution, and they can be assimilated without bias correction. The assumed GPS-RO observation error statistics used in the assimilation of the data at ECMWF vary as a function of impact height z which is defined as the impact parameter minus the “radius of curvature”, where the radius of curvature is the radius of the best spherical fit to the earth at the observation location. The assumed standard deviation of the bending angle errors ),(zασ is 20 % of
the observed value at z = 0 km, falling linearly with the impact height to 1 % at 10 km. Above 10 km, the errors are assumed to be 1 % of the observed value, until this reaches a lower limit of 3 micro-radians. Vertical error correlations are neglected. This error statistic model is applied globally. Given the high observation accuracy, the mean GPS-RO observation influence in the analysis is also high (not shown), contributing to half of the DFS, the other half contribution comes from the relatively high measurements number assimilated.
Impact of GPS radio occultation measurements…
Technical Memorandum No.714 5
Figure 1: Total amount of a) DFS, b) FER and c) FSR for the June 2011 and for all observation types assimilated
Figure 2 shows the total information content DFS (Figure 2a) of GPS-RO data with respect to the vertical level measured in kilometers (2-50 km). The largest DFS is over the troposphere and the low stratosphere where is also observed the largest forecast error reduction. The number of measurements per level is the same.
The GPS-RO DFS (Figure 2a) profiles are consistent with the earlier 1D-Var information content studies (e.g., Healy and Eyre, 2000), and reflect the large weight given to the observations between ~ 10 – 20 km. The largest forecast error reduction is also observed between 10 and 25 km (Figure 2b). These results are consistent with recent OSEs (e.g., Bauer et al. 2013) which show that GPS-ROs have the largest impact at this atmospheric region. Figure 2c shows GPS-RO observations sensitivity to the observation error variance. Generally, a deflation of the variances is suggested for all vertical levels and in particular between 10 and 25 km. It is interesting to note that the FSR computation suggests reducing the assumed errors mostly in the layer where the weight given to the GPS-RO is already quite large.

Impact of GPS radio occultation measurements…
6 Technical Memorandum No.714
Figure 2: a) Total observation influence (DFS), b) total FER and c) FSR for June 2011 and for GPS-RO observations as a function of vertical levels
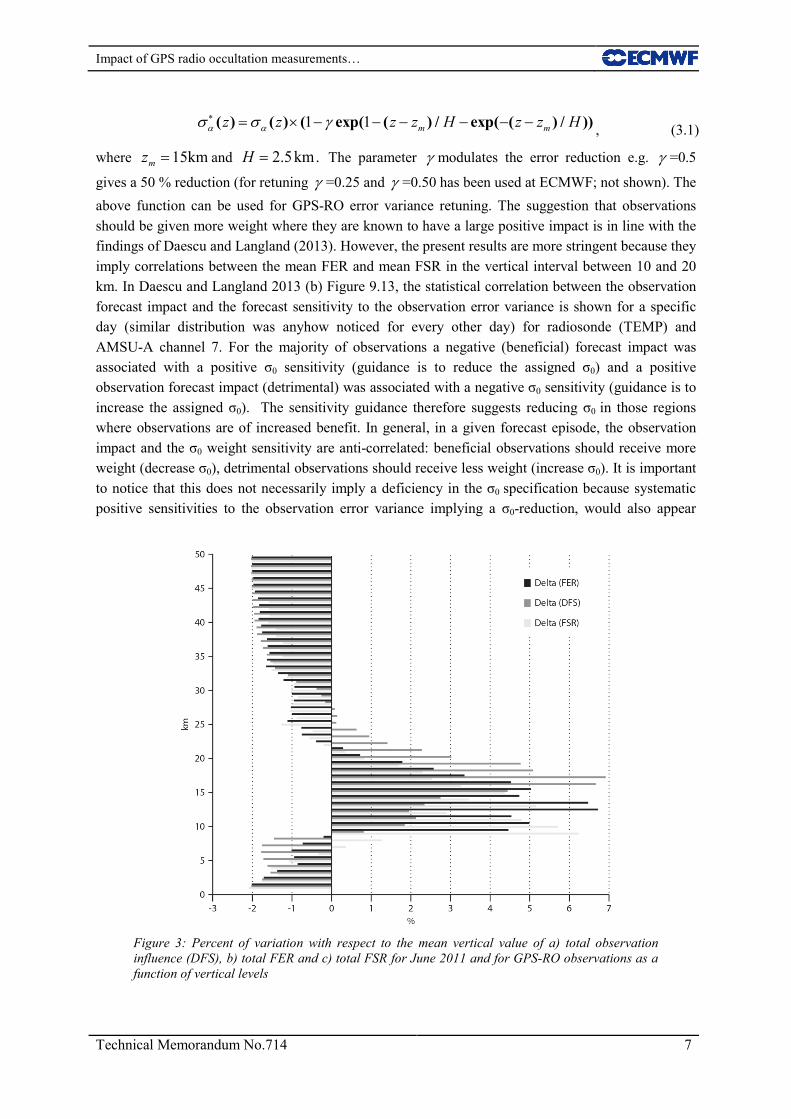
A closer comparison of the three sources of information on the GPS-RO impact is provided in Figure3, where the vertical levels mean variation for June 2011 of DFS, FER and FSR is shown, respectively. In the middle to the upper stratosphere from 25 to 50 km, the information provided by the observations is less than the mean of all levels and a smaller (with respect of its mean) forecast error reduction is also noticed. Interestingly, there is a very small indication that a deflation of the observation variances on those levels would improve the impact in the forecast. Between 25 and 20 km, whilst the GPS-RO contribution in the analysis is larger than the mean, only an average forecast impact is achieved and it is suggested (by FSR) that it would not change if the observation variances are deflated. A larger (than the mean) DFS contribution and larger forecast error reduction is obtained in the upper troposphere/lower stratosphere between 10 to 20 km. It is only in these layers that the FSR diagnostic tool strongly suggests that reducing the observation variances will increase the DFS and produce a forecast improvement. Below 10 km, the observation impact is very similar to the one on the top atmospheric layers. In conclusion, the FSR suggests that a larger forecast impact of GPS-RO can be achieved by reducing the assumed error variances between 10 and 20 km, in layers where the observation weight is already quite large. This is somewhat surprising because ECMWF currently assumes a 1% observation error standard deviation in this vertical interval which is generally lower than the error statistics used at the other operational NWP centres and close to the instrumental implied error. An approximation to GPS-RO error variance deflation as a function of height suggested by the FSR computation is
Impact of GPS radio occultation measurements…
Technical Memorandum No.714 7
1 1( ) ( ) ( exp( ( ) / exp( ( ) / ))m mz z z z H z z Hα ασ σ γ∗ = × − − − − − − , (3.1)
where km15=mz and .km5.2=H The parameter γ modulates the error reduction e.g. γ =0.5
gives a 50 % reduction (for retuning γ =0.25 and γ =0.50 has been used at ECMWF; not shown). The above function can be used for GPS-RO error variance retuning. The suggestion that observations should be given more weight where they are known to have a large positive impact is in line with the findings of Daescu and Langland (2013). However, the present results are more stringent because they imply correlations between the mean FER and mean FSR in the vertical interval between 10 and 20 km. In Daescu and Langland 2013 (b) Figure 9.13, the statistical correlation between the observation forecast impact and the forecast sensitivity to the observation error variance is shown for a specific day (similar distribution was anyhow noticed for every other day) for radiosonde (TEMP) and AMSU-A channel 7. For the majority of observations a negative (beneficial) forecast impact was associated with a positive σ0 sensitivity (guidance is to reduce the assigned σ0) and a positive observation forecast impact (detrimental) was associated with a negative σ0 sensitivity (guidance is to increase the assigned σ0). The sensitivity guidance therefore suggests reducing σ0 in those regions where observations are of increased benefit. In general, in a given forecast episode, the observation impact and the σ0 weight sensitivity are anti-correlated: beneficial observations should receive more weight (decrease σ0), detrimental observations should receive less weight (increase σ0). It is important to notice that this does not necessarily imply a deficiency in the σ0 specification because systematic positive sensitivities to the observation error variance implying a σ0-reduction, would also appear
Figure 3: Percent of variation with respect to the mean vertical value of a) total observation influence (DFS), b) total FER and c) total FSR for June 2011 and for GPS-RO observations as a function of vertical levels

Impact of GPS radio occultation measurements…
8 Technical Memorandum No.714
when the assigned B-weight is too large, that is, background error covariance inflation would be of benefit. In addition, the σ0 sensitivity computed here assumes a bias free perfect NWP model, and ignores vertical correlations in the GPS-RO error statistics. However, previous studies have demonstrated that this is probably not a realistic assumption (Poli et al., 2008).
Figure 4 shows the geographical distribution of the forecast error reduction due to GPS-RO data (Figure4a) and the forecast sensitivity to the GPS-RO observation error variance (Figure 4b), averaged between 12 and 20 km and for June 2011. The average mean forecast impact of GPS-RO is larger over the Tropics area than in the extra-tropic (Fig 4a blue contour) but in general, apart from a few areas of degradation close to the poles, the GPS-RO observations decrease the 24 hour forecast error everywhere. As can be seen from Figure4b, the largest signal for observation error variance reduction is also in the tropical area (yellow-red contours).
Figure 4: GPS-RO a) mean FER and b) mean FSR for June 2011 from 12 to 20 km. (a) Positive (negative) values mean increase (decrease) of forecast error; units are J kg-1(b) Positive (negative) values mean that deflation (inflation) of the observation error variances would decrease the 24 hour forecast error; units are J kg-1

Impact of GPS radio occultation measurements…
Technical Memorandum No.714 9
4 Conclusions Over the last few years, the potential of using derived adjoint-based diagnostic tools has been increasingly exploited: these tools have been used to assess the impact of GPS-RO measurements in the ECMWF 4D-Var system.
The observation influence is a well-known concept in multi-variate linear regression, where it is used to identify influential data and to predict the impact on the initial condition estimates of removing individual data from the regression. It provides a quantitative measure of the observation contribution in the analysis. In the context of 4D-Var there are many components that together determine the influence given to any one particular observation. First there is the specified observation error covariance R, which is obtained simply from tabulated values. Second, there is the background error covariance B (which at the time of the investigation was statistically computed from a month of background fields produced by the ten member’s ensemble data assimilation). And third, the dynamics and the physics of the forecast model which propagate in time, along the 4DVar window, the covariance and accordingly modify to take into account for local error growth in the prediction. The total influence is further modulated by data density.
Forecast sensitivity to observations can be used to diagnose the impact on the short-range forecast, (24 hours), given the use of the adjoint of the data assimilation (DA) system and the implied linearity assumption. This sensitivity is as well as the observation influence a function of the DA adjoint but it also depends on the forecast error and the innovations. Therefore, large DFS is expected to produce large forecast error reduction.
The global impact of observations is found to be positive and the forecast errors decrease for all data types. The largest contribution in the analysis, as measured by the DFS, and in the forecast, as measured by FER, is provided by the microwave sounder radiances (AMSU-A) followed by the infrared sounder radiances (IASI and AIRS) from instruments that mainly provide information on temperature and humidity. For microwave satellite humidity information, SSMIS (microwave imager), MHS (microwave sounder) and AMSR-E (microwave imager) instruments are in this order contributing to forecast error decrease. For conventional observations, Aircraft and TEMP provide the largest contribution. The forecast sensitivity to the observation variance suggests that if the observation error variances for all observation type, but TEMP and polar AMV, are deflated, the 24 hour forecast error will reduce.
The 5thlargest impact either in the analysis or in the forecast is provided by GPS-RO data, despite only contributing ~3 % of the observations assimilated in the system. The diagnostic tools show that largest contribution comes from the vertical levels between 10 and 20 km, and this is consistent with previous information content studies (Healy and Eyre, 2000) and OSEs (Bauer et al, 2013). The forecast sensitivity to the observation error variances suggests that an increase of DFS can be achieved by increasing the observation weight, in the layers with the largest DFS. The systematic positive observation error variance sensitivity (for GPS-RO and all the other observation types) does not necessarily imply a deficiency in the σ0 specification but, mainly points towards a too large assigned B-weight, suggesting that background error covariance inflation would benefit the data forecast impact. Suboptimal information provided by the representation of the statistical properties of the errors either model (background) or observation is a well-known problem; too small background error covariance matrix is also found by the DA a posteriori diagnostic (Desroziers et al. 2005) and

Impact of GPS radio occultation measurements…
10 Technical Memorandum No.714
different attempt of covariance retuning has been exploited in the past (Desroziers and Ivanov, 2001; Chapnick et al 2005; Chapnick et al 2006)..
Acknowledgements Many thanks are given to Dacian Daescu for useful discussion on the subject. The authors thank also Mohamed Dahoui, Anne Fouilloux and Els Kooij-Connally for their technical support. Sean Healy is a member of the Radio Occultation Meteorology Satellite Applications Facility (ROM SAF) which is a decentralized EUMETSAT facility.
References
Aparicio J.M. and G. Deblonde, 2009: Impact of the assimilation of CHAMP refractivity profiles in Environment Canada global forecasts. Mon. Wea. Rev. 136: 257—275.
Baker N.L. and R. Daley, 2000: Observation and background adjoint sensitivity in the adaptive observation targeting problem. Q. J. R. Meteorol. Soc, 126, 1431—1454
Barkmeijer J., R. Buizza, T. N. Palmer, K. Puri and J.-F. Mahfouf, 2001: Tropical singular vectors computed with linearized diabatic physics. Q. J. R. Meteorol. Soc., 127, 685—708
Bauer, P., A. J. Geer, P. Lopez, and D. Salmond, 2010: Direct 4D-Var assimilation of all-sky radiances: Part I. implementation. Q. J. R. Meteorol. Soc., 136, 1868—1885
Bauer, P., G. Radnoti, S.B. Healy, and C. Cardinali, 2013: GNSS radio occultation observing system experiment, Mon. Wea. Rev. Revised.
Cardinali, C., and R. Buizza: 2004. Observation sensitivity to the analysis and the forecast: a case study during ATreC targeting campaign. Proceedings of the First THORPEX International Science Symposium, 6-10 December 2004, Montreal, Canada, WMO TD 1237 WWRP/THORPEX N. 6.
Cardinali, C., S. Pezzulli and E. Andersson, 2004: Influence matrix dagnostics of a data assimilation system. Q. J. R. Meteorol. Soc., 130, 2767—2786
Cardinali, C, 2009: Monitoring the forecast impact on the short-range forecast. Q. J. R. Meteorol. Soc., 135, 239—250.
Cardinali C., 2013: Observation influence diagnostic of a Data Assimilation System. Data assimilation for Atmospheric, Oceanic and Hydrology applications Vol. II, Chapter 4, Springer-Verlag Berlin Heidelberg
Chapnik, B., G. Desrozier, F. Rabier and O. Talagrand, 2004: Property and first application of an error-statistics tuning method in variational assimilation. Q. J. R. Meteorol. Soc., 130, 2253—2275.
Chapnik, B., G. Desrozier, F. Rabier and O. Talagrand, 2006: Diagnosis and tuning of observation error in a quasi-operational data assimilation setting. Q. J. R. Meteorol. Soc., 132, 543—565.

Impact of GPS radio occultation measurements…
Technical Memorandum No.714 11
Cucurull L, J.C Derber, R. Treadon and R.J Purser, 2007: Assimilation of Global Positioning System Radio Occultation Observations into NCEP's Global Data Assimilation System. Mon. Wea. Rev., 135, 3174--3193.
Daescu, D.N., 2008: On the sensitivity equations of four-dimensional variational (4D-Var) data assimilation. Mon. Wea. Rev., 136, 3050-3065.
Daescu, D. N. and Todling, R., 2010: Adjoint sensitivity of the model forecast to data assimilation system error covariance parameters. Q.J.R. Meteorol. Soc., 136: 2000–2012.
Daescu, D. N. and Langland, R. H., 2013 (a): Error covariance sensitivity and impact estimation with adjoint 4D-Var: theoretical aspects and first applications to NAVDAS-AR. Q. J. R. Meteorol. Soc., 139, 226—241.
Daescu, D. N. and Langland, R. H., 2013 (b): The adjoint sensitivity guidance to diagnosis and tuning error covariance parameters. Data assimilation for Atmospheric, Oceanic and Hydrology applications Vol. II, Chapter 9, Springer-Verlag Berlin Heidelberg
Desroziers G., S. Ivanov, 2001: Diagnosis and adapting tuning of observation-error parameters in a variational assimilation error statistics in observation space. Q. J. R. Meteorol. Soc., 127, 1433—1452.
Desroziers, G., L. Berre, B. Chapnik, P. Poli, 2005: Diagnosis of observation, background and analysis error statistics in observation space. Q. J. R. Meteorol. Soc., 131, 3385—3396.
F. Harnisch, S. B. Healy, P. Bauer, S. J. English, 2013: Scaling of GNSS radio occultation impact with observation number using an ensemble of data assimilations. Mon. Wea. Rev., In press.
Healy, S.B. and J.R. Eyre, 2000: Retrieving temperature, water vapor and surface pressure information from refractive–index profiles derived by radio occultation: A simulation study. Q.J. R. Meteorol. Soc., 126, 1661—1683.
Healy, S.B. and J.-N. Thépaut, 2006: Assimilation experiments with CHAMP GPS radio occultation measurements. Q.J. R. Meteorol. Soc., 132, 605—623.
Janiskova, M., J.-J. M. J.-F. Mahfouf, and F. Chevallier, 2002: Linearized radiation and cloud schemes in the ECMWF model: Development and evaluation, Q. J. R. Meteorol. Soc., 128, 1505—1527.
Janisková M. and P. Lopez, 2013: Linearized physics for Data Assimilation at ECMWF. Data assimilation for Atmospheric, Oceanic and Hydrology applications Vol. II, Chapter 11, Springer-Verlag Berlin Heidelberg
Langland R. and N.L Baker., 2004: Estimation of observation impact using the NRL atmospheric variational data assimilation adjoint system. Tellus, 56A, 189—201.

Impact of GPS radio occultation measurements…
12 Technical Memorandum No.714
Lorenc, A., 1986: Analysis methods for numerical weather prediction. Q. J. R. Meteorol. Soc., 112, 1177—1194.
Lopez, P. and E. Moreau, 2005: A convection scheme for data assimilation: Description and initial tests. Q.J.R.Meteorol.Soc., 131, 409—436
Morneau J, S. Pellerin, S. Laroche, and M. Tanguay, 2006: Estimation of the adjoint sensitivity gradient in observation space using the dual (PSAS) formulation of the Enviroment Canada operational 4DVar. Proc. Second THORPEX international science symposium, 4-8 Dec 2006, Landshut Germany. WMO TD N.1355 WWRP/THORPEX No.7
Poli, P., P. Moll, D. Puech, F. Rabier, S.B. Healy, 2009: Quality control, error analysis, and impact assessment of FORMOSAT-3/COSMIC in numerical weather prediction, Terr. Atmos. Ocean, 20, 101—113.
Poli, P., G. Beyerle, T.Schmidt, J.Wickert, 2008: The assimilation of GPS radio occultation measurements at Météo-France. GRAS SAF Workshop Proceedings on Applications of GPS radio occultation measurements, 73—82. Available from the ECMWF library or http://www.ecmwf.int/publications/library/do/references/list/11122008
Purser, R. J. and H.-L. Huang,1993: Estimating Effective Data Density in a Satellite Retrieval or an Objective Analysis. J. Appl. Meteorol., 32, 1092—1107.
Rabier, F., H. Järvinen, E. Klinker, J.F. Mahfouf, and A. Simmons, 2000: The ECMWF operational implementation of four-dimensional variational assimilation. Part I: experimental results with simplified physics. Q. J. R. Meteorol. Soc. 126, 1143—1170.
Radnóti G., P. Bauer, A. McNally, C. Cardinali, S. Healy and P. de Rosnay, 2010: ECMWF study on the impact of future developments of the space-based observing system on Numerical Weather Prediction. ECMWF Technical Memo 638, 1—115.
Rennie M.P., 2010: The impact of GPS radio occultation assimilation at the Met Office, Q. J. R. Meteorol. Soc. 136: 116—131.
Talagrand, O., 1997: Assimilation of observations, an Introduction. J. Meteorol. Soc. Japan, Vol 75, N.1B, 191—209.
Zhu, Y. and R. Gelaro, 2008: Observation Sensitivity Calculations Using the Adjoint of the Gridpoint Statistical Interpolation (GSI) Analysis System. Mon. Wea. Rev., 136, 335—3
Xu, L., R. Langland, N. Baker and T. Rosmond, 2006: Development of the NRL 4D-Var data assimilation adjoint system. Operational Numerical Weather Prediction and Data Assimilation, European Geosciences Union, General Assembly 2006, Vienna, Austria, 02 – 07 April 2006.