carl d. perkins career and technical education act of … year 2010–11 ... if you have difficulty...
TRANSCRIPT

2010–11

THIS PAGE INTENTIONALLY LEFT BLANK

Carl D. Perkins Career and Technical Education Act of 2006
Report to Congress on State Performance Program Year 2010–11
U.S. Department of Education Office of Career, Technical, and Adult Education Division of Academic and Technical Education
2014

This report was produced under U.S. Department of Education Contract No. ED-04-CO 0121/007 with RTI International. Jay Savage served as the contractor’s officer representative. The views expressed herein do not necessarily represent the positions or policies of the Department of Education. No official endorsement by the U.S. Department of Education of any product, commodity, service or enterprise mentioned in this publication is intended or should be inferred.
U.S. Department of Education Arne Duncan Secretary
Office of Career, Technical, and Adult Education (formerly Office of Vocational and Adult Education)* Brenda Dann-Messier Assistant Secretary
Division of Academic and Technical Education Sharon Lee Miller Director
April 2014
*On Jan. 18, 2014, the name of the Office of Vocational and Adult Education (OVAE) was officially changed to the Office of Career, Technical, and Adult Education (OCTAE).
This report is in the public domain. Authorization to reproduce it in whole or in part is granted. While permission to reprint this publication is not necessary, the citation should be: U.S. Department of Education, Office of Vocational and Adult Education, Carl D. Perkins Career and Technical Education Act of 2006, Report to Congress on State Performance, Program Year 2010–11, Washington, D.C., 2014.
To order copies of this report (disc or hard copy),
write to: José Figueroa, U.S. Department of Education, Office of Career, Technical, and Adult Education, 550 12th St. S.W., Potomac Center Plaza, Rm. 11019, Washington, DC 20202-7240; or fax your request to: 202-245-7839; or e-mail your request to: [email protected].
Those who use a telecommunications device for the deaf (TDD) or teletypewriter (TTY) should call 1-877-576-7734. If 877 service is not yet available in your area, call 1-800-872-5327 (1-800-USA-LEARN); TTY: 1-800-437-0833.
This report is available on the Department’s website at: http://cte.ed.gov/accountability/reports/reportstocongress.cfm.
Requests for Alternate Format documents such as Braille or large print should be submitted to the Alternate Format Center by calling 202-260-0852 or by contacting the 504 coordinator via email at: [email protected].
If you have difficulty understanding English, you may request language assistance services for Department information that is available to the public. These language assistance services are available free of charge. If you need more information about interpretation or translation services, please call 1-800-USA-LEARN (1-800-872-5327) (TTY: 1-800-4370833), or email us at [email protected]. Or write to U.S. Department of Education, Information Resource Center, 400 Maryland Ave., SW, Washington, DC 20202.
Content Contact: Jose Figueroa at [email protected]; or at 202-245-6054.

i i i
Contents
PAGE
List of Figures ........................................................................................................... v
List of Tables ............................................................................................................ vii
Abbreviations............................................................................................................ ix
Executive Summary ................................................................................................. xi
Introduction .............................................................................................................. 1
A. Accountability for Results ....................................................................... 1
B. Establishing Measures and Setting Performance Levels ..................... 8
C. Efforts to Help States Build and Improve Their Perkins Accountability Systems ............................................................................ 9
State Performance Data .......................................................................................... 11
A. Enrollment in Career and Technical Education Programs ................ 11
B. States’ Progress in Meeting Their PY 2010–11 Performance Levels for the Perkins IV Sec. 113(b) Core Indicators..................................... 30
Data Quality Issues .................................................................................................. 51

i v CONTENTS
PAGE
Conclusion ................................................................................................................ 53
Appendixes ............................................................................................................... 57
Appendix A States’ Definitions of Career and Technical Education (CTE) Concentrator and Participant for the Carl D. Perkins Career and Technical Education Act of 2006 (Perkins IV) Secondary and Postsecondary Levels .......... 57
Appendix B Individual State Performance Profiles, Program Year 2010–11 ........................................................................ 79
Glossary of Terms ................................................................................................... 311
1. Definitions of Special Populations and Other Student Categories ... 311
2. Glossary of Race/Ethnicity Categories ................................................. 313

v
Figures
PAGE
Figure 1. Career and technical education student enrollment: Program years 2001–02 to 2010–11.............................................................. 12
Figure 2. Enrollment comparison of secondary CTE concentrators in CTE programs, by career cluster area: Program years 2009–10 and 2010–11 .......................................... 20
Figure 3. Enrollment comparison of postsecondary CTE concentrators in CTE programs, by career cluster area: Program years 2009–10 and 2010–11 .......................................... 21
Figure 4. Enrollment comparison of adult CTE concentrators in CTE programs, by career cluster area: Program years 2009–10 and 2010–11 ............................................................................................ 23
Figure 5. Enrollment of CTE concentrators in CTE programs, by gender and career cluster area: Program year 2010–11 ............ 24
Figure 6. Number of states that met or exceeded the secondary performance levels, by Perkins IV Sec. 113(b) core indicator: Program year 2010–11 .................................................................... 36
Figure 7. Number of states that met the secondary performance levels by at least 90 percent, by Perkins IV Sec. 113(b) core indicator: Program year 2010–11 ................................................. 38
v i F IGURES
PAGE
Figure 8. Comparison of secondary graduation rates for all students and CTE concentrators, by state: Program year 2010–11 ....... 41
Figure 9. Number of states that met or exceeded the postsecondary performance levels, by Perkins IV Sec. 113(b) core indicator: Program year 2010–11 .................................................................... 47
Figure 10. Number of states that met the postsecondary performance levels by at least 90 percent, by Perkins IV Sec. 113(b) core indicator: Program year 2010–11 ................................................. 48

v i i
Tables
PAGE
Table ES-1. Perkins IV Sec. 113(b) core indicators for career and technical education students at secondary and postsecondary levels ....... xiv
Table ES-2. Perkins IV Sec. 203(e) indicators of performance for tech prep students at secondary and postsecondary levels ................ xvi
Table 1. Perkins IV Sec. 113(b) core indicators for career and technical education students at secondary and postsecondary levels ....... 5
Table 2. Perkins IV Sec. 203(e) indicators of performance for tech prep students at secondary and postsecondary levels ................ 8
Table 3. Enrollment comparison of CTE students in CTE programs, by state: Program years 2009–10 and 2010–11 .......................... 13
Table 4. Enrollment of CTE students in CTE programs, by disaggregated student category: Program year 2010–11 ........... 16
Table 5. Enrollment of CTE concentrators in CTE programs, by career cluster area: Program year 2010–11 ................................. 19
Table 6. Enrollment comparison of CTE concentrators in CTE programs, by career cluster area: Program years 2009–10 and 2010–11 ............................................................................................ 26

v i i i TABLES
PAGE
Table 7. Enrollment in tech prep programs funded under Title II of Perkins IV, by disaggregated student category: Program year 2010–11 ............................................................................................ 28
Table 8. Number of states that met by at least 90 percent, or met or exceeded, their secondary performance levels, by Perkins IV Sec. 113(b) core indicator: Program year 2010–11 .................... 33
Table 9. Comparison of secondary graduation rates for all students and CTE concentrators, by state: Program year 2010–11 ....... 39
Table 10. Number of states that met by at least 90 percent, or met or exceeded, their postsecondary performance levels, by Perkins IV Sec. 113(b) core indicator: Program year 2010–11 .................................................................... 44
Table 11. Perkins IV Sec. 203(e) indicators for tech prep concentrators at secondary and postsecondary levels ......................................... 50
Table A-1. States’ definitions of CTE concentrator in CTE programs at the secondary and postsecondary levels: Program year 2010–11 .................................................................... 60
Table A-2. States’ definitions of CTE participant in CTE programs at the secondary and postsecondary levels: Program year 2010–11 .................................................................... 72

i x
Abbreviations
ADA Americans with Disabilities Act of 1990
AYP adequate yearly progress
CAR Consolidated Annual Report
core indicators core indicators of performance
CTE career and technical education
Department U.S. Department of Education
DQI Data Quality Institute
EDEN Education Data Exchange Network
ESEA Elementary and Secondary Education Act of 1965, as amended
FERPA Family Education Rights and Privacy Act
FY federal fiscal year
GED General Education Development (test and credential)
GPA grade point average
IDEA Individuals with Disabilities Education Act
LEA local educational agency

x ABBREVIATIONS
NASDCTEc National Association of State Directors of Career Technical Education Consortium
NATPL National Association for Tech Prep Leadership
NCES National Center for Education Statistics
NCLB No Child Left Behind Act of 2001
NSWG Next Steps Work Group
OCTAE Office of Career, Technical, and Adult Education
OMB Office of Management and Budget
OVAE Office of Vocational and Adult Education
PCRN Peer Collaborative Resource Network
Perkins I Carl D. Perkins Vocational Education Act
Perkins II Carl D. Perkins Vocational and Applied Technology Education Act
Perkins III Carl D. Perkins Vocational and Technical Education Act of 1998
Perkins IV Carl D. Perkins Career and Technical Education Act of 2006
PIN personal identification number
PY program year (July 1–June 30)
SLDS State Longitudinal Data Systems
WRIS Wage Record Interchange System
x i
Executive Summary
The Carl D. Perkins Career and Technical Education Act of 2006 (Perkins IV) requires, in Sec. 113(c)(5)(C), that the secretary of education provide the appropriate committees of Congress copies of the annual reports received by the U.S. Department of Education (Department),1 from each eligible agency that receives an allotment2 under Title I (Career and Technical Education [CTE]3 Assistance to the States4) of Perkins IV. Sec. 113(c)(5)(A) of Perkins IV further requires the secretary to make the information contained in such reports available to the general public through a variety of formats, including electronically
1 On Jan. 18, 2014, the name of the Department’s Office of Vocational and Adult Education (OVAE) was officially changed to the Office of Career, Technical, and Adult Education (OCTAE). This was the office that received these reports. 2 The United States Virgin Islands received its allotted Perkins IV funds consolidated with funds allotted under other formula grant programs and used some of the funds in the consolidated grant for Perkins IV, Title I, purposes. American Samoa and the Commonwealth of the Northern Mariana Islands consolidated their Perkins IV, Title I, funds with funds under other formula programs and used these funds for other allowable program purposes rather than for career and technical education. 3 The term “career and technical education” (CTE) in Sec. 3(5) of Perkins IV means “organized educational activities that—(A) offer a sequence of courses that—(i) provides individuals with coherent and rigorous content aligned with challenging academic standards and relevant technical knowledge and skills needed to prepare for further education and careers in current or emerging professions; (ii) provides technical skill proficiency, an industry-recognized credential, a certificate, or an associate degree; and (iii) may include prerequisite courses (other than a remedial course) that meet the requirements of this subparagraph; and (B) include competency-based applied learning that contributes to the academic knowledge, higher-order reasoning and problem-solving skills, work attitudes, general employability skills, technical skills, occupation-specific skills, and knowledge of all aspects of an industry, including entrepreneurship, of an individual.” 4 The term “state” in Sec. 3(30) of Perkins IV means, unless otherwise specified, each of the 50 states of the United States, the District of Columbia, the Commonwealth of Puerto Rico, and each outlying area. The term “state” as it is used in this report consists of each jurisdiction of the United States, including the 50 states of the United States, the District of Columbia, the Commonwealth of Puerto Rico; and the outlying areas of the United States Virgin Islands, Guam, American Samoa, the Commonwealth of the Northern Mariana Islands, and the Republic of Palau. Each of these 57 states was allotted funds under Perkins IV Title I. Of the 57 states, 54 submitted CTE data to the Department for this report. The Republic of Palau did not submit data because it did not a fully approved state plan. American Samoa and the Commonwealth of the Northern Mariana Islands were not required to report data because they consolidated their Perkins IV, Title I, funds with funds under other formula programs and used these funds for other allowable program purposes rather than for CTE.
x i i EXECUTIVE SUMMARY
through the Internet. The Department is meeting this requirement by providing the data in (1) digital formats on discs and on the Department website at http://cte.ed.gov/accountability/reports/reportstocongress.cfm and (2) in hard copy text format, on request.
Perkins IV requires states to report to the Department each year on their progress in achieving their adjusted performance levels5—negotiated with and approved by the Department—on the core indicators of performance (core indicators) described in Sec. 113(b)(2)(A) and (B) of Perkins IV.6 The Perkins IV Sec. 113(b)(2)(A) core indicators for CTE students at the secondary level7 include measures of each of the following:
“(i) Student attainment of challenging academic content standards and student academic achievement standards, as adopted by a State in accordance with section 1111(b)(1) of the Elementary and Secondary Education Act of 19658 and measured by the State determined proficient levels on the academic assessments described in section 1111(b)(3) of such Act.
(ii) Student attainment of career and technical skill proficiencies, including student achievement on technical assessments that are aligned with industry-recognized standards, if available and appropriate.
(iii) Student rates of attainment of each of the following:
(I) A secondary school diploma.
(II) A General Education Development (GED) credential, or other State-recognized equivalent (including recognized alternative standards for individuals with disabilities).
(III) A proficiency credential, certificate, or degree, in conjunction with a secondary school diploma (if such credential, certificate, or degree is offered by the State in conjunction with a secondary school diploma).
(iv) Student graduation rates (as described in section 1111(b)(2)(C)(vi) of the Elementary and Secondary Education Act of 1965).
5 Performance levels for the Perkins IV Sec. 113(b) core indicators are referred to as “adjusted” after a state and the Department have negotiated and reached agreement on them per the requirements in Sec. 113(b)(3) of Perkins IV. 6 The core indicators of performance described in Sec. 113(b)(2)(A) and (B) of Perkins IV are hereinafter referred to as the “Perkins IV Sec. 113(b) core indicators” or “core indicators.” 7 Perkins IV Sec. 113(b)(2)(A) indicates that each eligible agency shall identify in the state plan “core indicators of performance for career and technical education students at the secondary level” that are valid and reliable. 8 The Elementary and Secondary Education Act of 1965, as amended by the No Child Left Behind Act of 2001 (NCLB), is hereinafter referred to as ESEA.

EXE CUTIVE SUMMARY x i i i
(v) Student placement in postsecondary education or advanced training, in military service, or in employment.
(vi) Student participation in and completion of career and technical education programs that lead to nontraditional fields.”
The Perkins IV Sec. 113(b)(2)(B) core indicators for CTE students at the postsecondary level9 include, at a minimum, a measurement of each of the following:
“(i) Student attainment of challenging career and technical skill proficiencies, including student achievement on technical assessments, that are aligned with industry-recognized standards, if available and appropriate.
(ii) Student attainment of an industry-recognized credential, a certificate, or a degree.
(iii) Student retention in postsecondary education or transfer to a baccalaureate degree program.
(iv) Student placement in military service or apprenticeship programs or placement or retention in employment, including placement in high skill, high wage, or high-demand occupations or professions.
(v) Student participation in, and completion of, career and technical education programs that lead to employment in nontraditional fields.”
Some states operate separate adult-level programs that are not included in community college settings. Six states—Florida, Louisiana, Missouri, Ohio, Oklahoma, and Tennessee—negotiate separate performance levels and report data for their adult-level CTE students using the Perkins IV Sec. 113(b)(2)(B) postsecondary core indicators.
For data collection and reporting purposes, the Department divides the Perkins IV Sec. 113(b) core indicators into eight core indicators at the secondary level and six core indicators at the postsecondary level. The Department labels the Perkins IV Sec. 113(b) core indicators as shown in table ES-1.10 Program year (PY)11 2010–11 (which corresponds to funds appropriated for federal fiscal year [FY] 2010), the fourth PY of Perkins IV,12 was the third year of five-year plans, submitted to the secretary, pursuant to Sec. 122(a)(1) of
9 Perkins IV Sec. 113(b)(2)(B) indicates that each eligible agency shall identify in the state plan “core indicators of performance for career and technical education students at the postsecondary level” that are valid and reliable. 10 The eight secondary core indicators reflect the language of Sec. 113(b)(2)(A) of Perkins IV, and the six postsecondary core indicators reflect the language of Sec. 113(b)(2)(B) of Perkins IV. 11 The PY generally operates July 1–June 30. 12 PY 2010–11, the fourth PY of Perkins IV, also is referred to as “PY four” of Perkins IV.

x i v EXECUTIVE SUMMARY
Perkins IV, and each state was required by the secretary to report student data on all the core indicators of performance under Sec. 113(b) of Perkins IV. Each state defines CTE students as CTE participants13 and CTE concentrators,14 and annually submits CTE student data to the Department15 based on its definitions of CTE concentrators and CTE participants.
Table ES-1. Perkins IV Sec. 113(b) core indicators for career and technical education students at secondary and postsecondary levels
Perkins IV Sec. 113(b)(2)(A) Secondary core indicators
Perkins IV Sec. 113(b)(2)(B) Postsecondary core indicators
Academic attainment–reading/language arts Technical skill attainment
Academic attainment–mathematics Credential, certificate, or degree
Technical skill attainment Student retention or transfer
Secondary school completion Student placement
Student graduation rates Nontraditional participation
Secondary placement Nontraditional completion
Nontraditional participation
Nontraditional completion
NOTE: Each state reports data on CTE students based on the state’s definitions of CTE concentrators or CTE participants. See Appendix A, table A-1, for each state’s definition of CTE concentrator and table A-2 for each state’s definition of CTE participant. Perkins IV means the Carl D. Perkins Career and Technical Education Act of 2006. PY 2010–11, the fourth PY of Perkins IV, is the third year states are required to report on all of the core indicators of performance under Sec. 113(b) of Perkins IV.
Sec. 113(c)(2)(A) of Perkins IV further requires states to provide disaggregated data on the progress of CTE students in each of the special population categories16 listed in Sec. 3(29) of Perkins IV 17 and in each of the student categories listed in Sec. 1111(h)(1)(C)(i) of ESEA.18
13 Although the definitions of CTE participants vary among states, generally states define CTE participants as students who have completed one or more CTE courses at the secondary level or one or more credits at the postsecondary level. See Appendix A, table A-2, for each state’s definition of CTE participant. 14 See Appendix A, table A-1, for each state’s definition of CTE concentrator. 15 See Consolidated Annual Report (CAR) for the Carl D. Perkins Career and Technical Education Act of 2006 (Perkins IV), at http://cte.ed.gov/perkinsimplementation/nrg.cfm. 16 See the Glossary of Terms in this report for the definitions of each special population category. 17 Sec. 3(29) of Perkins IV defines the term “special populations” as meaning—‘‘(A) individuals with disabilities; (B) individuals from economically disadvantaged families, including foster children; (C) individuals preparing for non-traditional fields; (D) single parents, including single pregnant women; (E) displaced homemakers; and (F) individuals with limited English proficiency.” 18 Sec. 1111(h)(1)(C)(i) of ESEA requires that “The State shall include in its annual State report card—(i) information, in the aggregate, on student achievement at each proficiency level on the State academic assessments described in subsection (b)(3) (disaggregated by race, ethnicity, gender, disability status, migrant status, English proficiency, and status as economically disadvantaged).”

EXE CUTIVE SUMMARY xv
To avoid states reporting duplicative data, the secretary requires states to disaggregate data only in the following categories:19
• Race/ethnicity;
• Gender;
• Individuals with disabilities (American with Disabilities Act of 1990 [ADA]);
• Individuals with disabilities (ESEA and the Individuals with Disabilities Education Act [IDEA]; secondary level only);
• Individuals from economically disadvantaged families, including foster children;
• Individuals preparing for nontraditional fields;
• Single parents, including single pregnant women;
• Displaced homemakers;
• Individuals with limited English proficiency; and
• Migrant students (secondary level only).
Sec. 205 of Title II of Perkins IV (Tech Prep20 Education)21 requires states that do not consolidate all of their Perkins IV funds22 for purposes authorized under Sec. 203(c) of Perkins IV to report to the secretary on the effectiveness of their tech prep programs.23 Therefore, the secretary requires each of such states to report disaggregated data for its tech prep concentrators for each of the Perkins IV Sec. 113(b) core indicators separately in
19 The categories in which states must report disaggregated data reflect the requirement of Sec. 113(c)(3) of Perkins IV that the secretary ensures that states do not report duplicative data under Sec. 113(c) of Perkins IV. 20 The term “tech prep program” in Sec. 3(32) of Perkins IV means a tech prep program described in Sec. 203(c) of Perkins IV. Sec. 203(c)(2)(A) and (B) of Perkins IV indicates that a tech prep program, among other things, shall consist of a program of study that (i) combines a minimum of two years of secondary education with a minimum of two years of postsecondary education in a nonduplicative, sequential course of study, or an apprenticeship program of not less than two years following secondary education instruction; and that (ii) integrates academic with career and technical education. 21 FY 2010 is the last year for which funds were appropriated under Title II of Perkins IV for tech prep programs. 22 Sec. 202(a) of Perkins IV enables states to consolidate all or a portion of their Perkins IV, Title II, funds with their Perkins IV, Title I, funds, but Sec. 202(c) of Perkins IV requires a state to consider its consolidated funds as if these funds were allotted under Title I of Perkins IV and to distribute these funds in accordance with the within-state allocations as required by Sec. 112 of Perkins IV. Except for the United States Virgin Islands, the outlying areas are not eligible for Title II, tech prep allotments under secs. 111(a) and 201(a) of Perkins IV. 23 The states that did not consolidate their Perkins IV, Title II, funds with their Perkins IV, Title I, funds and operated Tech Prep programs were: Alaska, Arizona, California, Delaware, Illinois, Indiana, Iowa, Massachusetts, Michigan, Mississippi, Missouri, Montana, New Mexico, New York, North Carolina, Ohio, Oklahoma, Pennsylvania, South Dakota, Texas, Virginia, Washington, West Virginia, and Wisconsin. In addition, Alabama operated a Tech Prep program because it consolidated a portion of its Perkins IV, Title II, funds with its Perkins IV, Title I, funds.

xv i EXECUTIVE SUMMARY
addition to the 11 other indicators of performance listed in Sec. 203(e) of Perkins IV.24 For data collection and reporting purposes, the Department divides Perkins IV Sec. 203(e) indicators of performance into six indicators of performance at the secondary level and five indicators of performance at the postsecondary level.25 The Department labels the Perkins IV Sec. 203(e) indicators of performance as shown in table ES-2. Data for PY 2010–11, the third year of each state’s five-year plan, were submitted to the secretary, pursuant to Sec. 122(a)(1) of Perkins IV. Note that FY 2010 was the last year for which funds were appropriated for Tech Prep programs.
Table ES-2. Perkins IV Sec. 203(e) indicators of performance for tech prep students at secondary and postsecondary levels
Perkins IV Sec. 203(e) Secondary indicators of performance
Perkins IV Sec. 203(e) Postsecondary indicators of performance
Number of tech prepa studentsb served Number of tech prep students served
Postsecondary enrollment Placement in related field of employment
Postsecondary enrollment in same field or major
Completion of state- or industry-recognized certificate or licensure
Completion of statec or industry-recognized certificate or licensure
Completion of two-year degree or certificate
Completion of postsecondary course offering postsecondary credits
Completion of baccalaureate degree program
Enrollment in remedial courses in postsecondary education
a The term “tech prep program” in Sec. 3(32) of Perkins IV means a tech prep program described in Sec. 203(c) of Perkins IV, regarding the contents of the tech prep program. Sec. 203(c)(2)(A) and (B) of Perkins IV indicates that a tech prep program, among other things, shall consist of a program of study that (i) combines a minimum of two years of secondary education with a minimum of two years of postsecondary education in a nonduplicative, sequential course of study, or an apprenticeship program of not less than two years following secondary education instruction; and that (ii) integrates academic with career and technical education. b A tech prep student is identified by the same set of criteria (Appendix A, table A-1) as a CTE concentrator and is in a tech prep program. c The term “state” in Sec. 3(30) of Perkins IV means, unless otherwise specified, each of the 50 states of the United States, the District of Columbia, the Commonwealth of Puerto Rico, and each outlying area. The term “state” as it is used in this report consists of each jurisdiction of the United States, including the 50 states of the United States, the District of Columbia, the Commonwealth of Puerto Rico; and the outlying areas of the United States Virgin Islands, Guam, American Samoa, the Commonwealth of the Northern Mariana Islands, and the Republic of Palau. However, under secs. 111(a) and (d) and 201(a) of Perkins IV, the 50 states of the United States, the District of Columbia, the Commonwealth of Puerto Rico, and the United States Virgin Islands are eligible for tech prep allotments, but a state does not have to report data on the Perkins IV Sec. 203(e) indicators if the state consolidates all of its Title II funds with its Title I funds as permitted by Sec. 202(a) of Perkins IV.
NOTE: Perkins IV means the Carl D. Perkins Career and Technical Education Act of 2006. PY 2010–11, program year four of Perkins IV, is the third year states are required to report on all of the Perkins IV indicators of performance. The 25 states that elected to offer tech programs in PY 2010–11 were Alabama, Alaska, Arizona, California, Delaware, Illinois, Indiana, Iowa, Massachusetts, Michigan, Mississippi, Missouri, Montana, New Mexico, New York, North Carolina, Ohio, Oklahoma, Pennsylvania, South Dakota, Texas, Virginia, Washington, West Virginia, and Wisconsin.
24 The 11 indicators of performance listed in Sec. 203(e) of Perkins IV are hereinafter referred to as the “Perkins IV Sec. 203(e) indicators of performance.” 25 The six secondary indicators reflect the language of Sec. 203(e)(1)(A) and (B) of Perkins IV, and the five postsecondary indicators reflect the language of Sec. 203(e)(1)(A) and (C) of Perkins IV.

EXE CUTIVE SUMMARY xv i i
This report is the Department’s fourth annual report to Congress under Perkins IV. It presents data that states submitted to the Department for PY 2010–11. State directors submitted their data electronically to the Department and certified the accuracy and completeness of their data using an electronic personal identification number (PIN).
For PY 2010–11, each state, operating under the third year of its five-year plan pursuant to Sec. 122(a)(1) of Perkins IV, was also required by the secretary to report the following, as instructed in the Consolidated Annual Report (CAR) for the Carl D. Perkins Career and Technical Education Act of 2006 for PY 2010–1126—
• Enrollment data for CTE participants27 in CTE programs, including disaggregated data for CTE students by gender, race/ethnicity, and special population and other student categories.
• Enrollment data for CTE concentrators28in CTE programs, including disaggregated data for CTE students by gender, educational level, and the career clusters29 recognized by the Department.
• Enrollment data for CTE participants in tech prep programs funded under Title II of Perkins IV, including disaggregated data for CTE students by gender, race/ethnicity, and special population and other student categories, and participation in a tech prep program if the state implemented such a program under Perkins IV, Title II, tech prep.
• Performance data for CTE concentrators on the Perkins IV Sec. 113(b)(2)(A) and (B) core indicators.
26 When completing the CAR enrollment and accountability forms, a state must use its definitions for a CTE participant and CTE concentrator at the secondary and postsecondary levels. Unless otherwise specified, the data in this report are for CTE concentrators. 27 See Appendix A, table A-2, for each state’s definition of CTE participant. 28 See Appendix A, table A-1, for each state’s definition of CTE concentrator. 29 The Department recognizes career clusters in the National Career Clusters Framework (http://www.careertech.org/career-clusters/glance/clusters.html). Each career cluster represents a distinct grouping of occupations and industries based on the knowledge and skills CTE students require.

xv i i i EXECUTIVE SUMMARY
Among the highlights of this report are the following:
• States reported a reduction in the number of students enrolled in career and technical education courses in PY 2010–11 from the previous program year. Enrollment figures for PY 2010–11 reflect a 3.74 percent decrease from the previous year.30 CTE student enrollment in PY 2010–11 was 8.1 percent lower than it was in the year with highest enrollment (PY 2006–07) during the past nine years (PYs 2001–02 through 2009–10) of Perkins III31 and Perkins IV implementation (figure 1).
• Eighty-seven percent, or 45 of the 52 states32 that reported complete data on statewide and CTE graduation rates,33 reported having higher secondary graduation rates for CTE students (i.e., CTE concentrators) than for all students in their respective states (table 9).34
• The three highest enrollment percentages for secondary CTE concentrators were in the following career cluster areas: (1) business management and administration; (2) human services; and (3) health science (table 5).
• Secondary career and technical education student enrollment decreased by approximately 2 percent in PY 2010–11 when compared to PY 2009–10 (table 3).
• Postsecondary career and technical education student enrollment decreased 6 percent in PY 2010–11, when compared to PY 2009–10 (table 3).35
• Adult36 career and technical education student enrollment decreased in excess of 16.59 percent in PY 2010–11, when compared to PY 2009–1037 (table 4).
30 States report data based on their definitions of CTE participant and CTE concentrator. See Appendix A, table A-2, for each state’s definition of CTE participant and table A-1 for each state’s definition of CTE concentrator. 31 The Carl D. Perkins Vocational and Technical Education Act of 1998 (Perkins III). 32 Only the 50 U.S. states, the District of Columbia, and the Commonwealth of Puerto Rico were required to and did report on academic achievement and general statewide graduation rates under the Elementary and Secondary Education Act (ESEA) to the Office of Elementary and Secondary Education in the Education Data Exchange Network (EDEN). 33 Guam and United States Virgin Islands were not required to submit secondary gradation data under the ESEA. 34 For general information related to states’ secondary performance levels for the Perkins IV Sec. 113(b) core indicators, see figures 6 through 8 and tables 8 and 9 of this report and the related information for each of the figures and tables. For specific data for each state, see Appendix B of this report. 35 For general information related to states’ postsecondary performance levels for the Perkins IV Sec. 113(b) core indicators, see figures 9 and 10 and table 10 of this report and the related information for each of the figures and the table. For specific data for each state, see Appendix B of this report. 36 Florida, Louisiana, Missouri, Ohio, Oklahoma, and Tennessee provided performance levels and report data for their adult-level CTE concentrators using the Perkins IV Sec. 113(b)(2)(B) postsecondary core indicators and performance levels. 37 For PY 2009–10, the adult career and technical education student enrollment was 175,399.

EXE CUTIVE SUMMARY x i x
• Eighty-five percent, or 46 of 54 states38 that reported data on their Perkins Sec. 113(b) core indicators of performance, reported that they met or exceeded their performance levels for secondary student graduation rates (table 8).
• Eighty-one percent, or 44 of 54 states that reported on secondary school completion, met or exceeded their performance levels (table 8).
• Sixty-seven percent, or 36 of 54 states that reported data on secondary technical skill attainment, met or exceeded their performance levels (table 8).
• Sixty-nine percent, or 37 of 54 states that reported data on academic attainment in reading and language arts, met or exceeded their performance levels (table 8).
• Forty-four percent, or 24 of 54 states, met or exceeded all of their secondary performance levels by at least 90 percent (table 8).
• The three highest enrollment percentages for CTE postsecondary concentrators were in the following career cluster areas: (1) health science; (2) business management and administration; and (3) law, public safety, and security (table 5).
• Seventy-eight percent, or 42 of the 54 states that reported data on postsecondary technical skill attainment, met or exceeded their performance levels (table 10).
• Seventy-four percent, or 40 of the 54 states that reported data on postsecondary student retention or transfer, met or exceeded their performance levels (table 10).
• Seventy-four percent, or 40 of the 54 states that reported postsecondary nontraditional participation, met or exceeded their performance levels (table 10).
• Sixty-three percent, or 34 of 54 states, met or exceeded all of their postsecondary performance levels by at least 90 percent (table 10).
This report to Congress contains four sections. The introduction section describes the Perkins IV accountability requirements and describes efforts by the Department to help states establish valid and reliable measures, and rigorous performance levels for the Perkins IV Sec. 113(b) core indicators. The state performance data section discusses states’ progress in meeting their performance levels for the required Perkins IV Sec. 113(b) core
38 The 50 U.S. states, the District of Columbia, the Commonwealth of Puerto Rico, and three of the outlying areas—the United States Virgin Islands, Guam, and the Republic of Palau—were required to report data on the Perkins IV Sec. 113(b) core indicators for PY 2010–11. The Republic of Palau did not submit data because it did not have a fully approved state plan. American Samoa and the Commonwealth of the Northern Mariana Islands do not submit data for CTE programs because they consolidated their Perkins IV, Title I, allotments with funds under other formula programs and used these funds for allowable program purposes rather than for career and technical education. Fifty-four states in this report refer to the 50 U.S. states, the District of Columbia, the Commonwealth of Puerto Rico, the United States Virgin Islands, and the outlying area of Guam.

xx EXECUTIVE SUMMARY
indicators for PY 2010–11. The data quality section discusses issues pertaining to the validity, quality, and comparability of states’ Perkins IV performance data. The final section offers conclusions regarding the implementation of CTE under Perkins IV. Individual state data profiles are provided in Appendix B of this report.

1
Introduction
A. Accountability for Results
The Carl D. Perkins Career and Technical Education Act of 2006 (Perkins IV), which was enacted on Aug. 12, 2006, is the principal source of federal funding to states39 for the improvement of secondary and postsecondary career and technical education (CTE)40 programs.41 For
39 The term “state” in Sec. 3(30) of Perkins IV means, unless otherwise specified, each of the 50 states of the United States, the District of Columbia, the Commonwealth of Puerto Rico, and each outlying area. The term “state” as it is used in this report consists of each jurisdiction of the United States, including the 50 states of the United States, the District of Columbia, the Commonwealth of Puerto Rico; and the outlying areas of the United States Virgin Islands, Guam, American Samoa, the Commonwealth of the Northern Mariana Islands, and the Republic of Palau. Each of these 57 states was allotted funds under Perkins IV Title I. Of the 57 states, 54 submitted CTE data to the Department for this report. The Republic of Palau did not submit data because it did not a fully approved state plan. American Samoa and the Commonwealth of the Northern Mariana Islands were not required to report data because they consolidated their Perkins IV, Title I, funds with funds under other formula programs and used these funds for other allowable program purposes rather than for CTE. 40 The term “career and technical education” (CTE) in Sec. 3(5) of Perkins IV means, “organized educational activities that—(A) offer a sequence of courses that—(i) provides individuals with coherent and rigorous content aligned with challenging academic standards and relevant technical knowledge and skills needed to prepare for further education and careers in current or emerging professions; (ii) provides technical skill proficiency, an industry-recognized credential, a certificate, or an associate degree; and (iii) may include prerequisite courses (other than a remedial course) that meet the requirements of this subparagraph; and (B) include competency-based applied learning that contributes to the academic knowledge, higher-order reasoning and problem-solving skills, work attitudes, general employability skills, technical skills, occupation-specific skills, and knowledge of all aspects of an industry, including entrepreneurship, of an individual.” 41 The Smith-Hughes Act of 1917 was the first authorization for the federal funding of vocational education (now called career and technical education). Subsequent legislation that authorized federal funding of career and technical education included: The Vocational Act of 1963 and the Carl D. Perkins Vocational and Education Act (Perkins I). Perkins I was reauthorized as the Carl D. Perkins Vocational and Applied Technology Education Act (Perkins II) in 1990, the Carl D. Perkins Vocational and Technical Education Act of 1998 (Perkins III), and the Carl D. Perkins Career and Technical Education Act of 2006 (Perkins IV).

2 INTRODUCTION
program year (PY) 2010–11,42 which was the fourth program year43 under Perkins IV and which corresponds to the U.S. Department of Education’s (Department’s) fiscal year (FY) 2010 appropriation, Congress appropriated just over $1.26 billion for Perkins IV programs that provide funding to states, including approximately $1.16 billion under Title I (Career and Technical Education Assistance to the States) of Perkins IV 44 and approximately $102.92 million under Title II (Tech Prep45 Education) of Perkins IV.46 Sec. 202(a) of Perkins IV enables states to consolidate all or a portion of their Perkins IV, Title II, funds with their Perkins IV, Title I, funds and to use the consolidated funds for allowable purposes under Title I of Perkins IV. For PY 2010–11, 27 states47 chose to consolidate all Perkins IV, Title II, funds with their Perkins IV, Title I, funds, and one state48 chose to consolidate 75 percent of these funds.
Each state determines what share of its Perkins IV, Title I, funds should be allocated to secondary and postsecondary CTE programs in its state. Consistent with past years, for PY 2010–11, states allocated 61 percent of their funds to secondary CTE programs and
42 Each of these 57 states was allotted funds under Perkins IV Title I. Of the 57 states, 54 submitted CTE data to the Department for this report. The Republic of Palau did not have a fully approved state plan and therefore did not submit data. American Samoa and the Commonwealth of the Northern Mariana Islands did not submit data for CTE programs because they consolidated their Perkins IV, Title I, allotments with funds under other formula programs and used these funds for allowable program purposes rather than for career and technical education. 43 The fourth program year under Perkins IV is also referred to as “PY four.” 44 Under Title I of Perkins IV, the Department made grants from FY 2010 funds to each of the 50 U.S. states; the District of Columbia; the Commonwealth of Puerto Rico; the United States Virgin Islands, which received its allotted Perkins IV funds consolidated with other formula grant programs and used some of the funds in the consolidated grant for Perkins IV, Title I purposes; and the two outlying areas of Guam and the Republic of Palau. The other two outlying areas of American Samoa and the Commonwealth of the Northern Mariana Islands consolidated their Perkins IV, Title I, allotments with funds under other formula programs and used these funds for allowable program purposes other than CTE. The Republic of Palau does not have a fully approved Perkins IV state plan and has not submitted any data to the Department on the Perkins IV Sec. 113(b) core indicators. 45 The term “tech prep program” in Sec. 3(32) of Perkins IV means a tech prep program described in Sec. 203(c) of Perkins IV, regarding the contents of the tech prep program. Sec. 203(c)(2)(A) and (B) of Perkins IV indicates that a tech prep program, among other things, shall consist of a program of study that (i) combines a minimum of two years of secondary education with a minimum of two years of postsecondary education in a nonduplicative, sequential course of study, or an apprenticeship program of not less than two years following secondary education instruction; and that (ii) integrates academic and career and technical education. 46 Under Title II of Perkins IV, the Department made 52 grants to each of the 50 U.S. states, the District of Columbia, and the Commonwealth of Puerto Rico. The United States Virgin Islands received its allotted Perkins IV, Title II, funds, which it consolidated with other formula grant programs but did not use any funds in its consolidated grant for Perkins IV, Title II, purposes. The other outlying areas of Guam, American Samoa, the Commonwealth of the Northern Mariana Islands, and the Republic of Palau are not eligible for a Perkins IV, Title II, tech prep allotment under secs. 111(a) and 201(a) of Perkins IV. 47 The states that consolidated all their Perkins IV, Title II, funds with their Perkins IV, Title I, funds were Arkansas, Colorado, Connecticut, District of Columbia, Florida, Georgia, Hawaii, Idaho, Kansas, Kentucky, Louisiana, Maine, Maryland, Minnesota, Nebraska, Nevada, New Hampshire, New Jersey, North Dakota, Oregon, Puerto Rico, Rhode Island, South Carolina, Tennessee, Utah, Vermont, and Wyoming. 48 Alabama.

INTRODUCTION 3
39 percent to postsecondary CTE programs. States distribute their Perkins IV, Title I, funds by statutory formula to local education agencies, area career and technical schools, community colleges, and other public or private nonprofit institutions that offer CTE programs that meet the requirements of Perkins IV.
States distribute their Perkins IV, Title II, tech prep funds, either competitively or by a formula each state devises, to local consortia comprising secondary entities, such as local education agencies, and postsecondary entities, such as institutions of higher education, as required by Sec. 203(a)(1) of Perkins IV. Local consortia also may include employers, business intermediaries, or labor organizations.
Consistent with the previous statute, the Carl D. Perkins Vocational and Technical Education Act of 1998 (Perkins III), Congress made accountability for results a central focus of Perkins IV, refining the performance accountability requirements for states and local recipients of funds. These requirements were established “to assess the effectiveness of the state in achieving statewide progress in career and technical education, and to optimize the return of investment of Federal funds in career and technical education activities,” pursuant to Sec. 113(a) of Perkins IV.
Perkins IV requires states to report to the Department each year on their progress in achieving their adjusted performance levels49—negotiated with states and approved by the Department—on the core indicators of performance (core indicators) described in Sec. 113(b)(2)(A) and (B) of Perkins IV.50 The Perkins IV Sec. 113(b)(2)(A) core indicators for CTE students at the secondary level51 include, at a minimum, measures of each of the following:
“(i) Student attainment of challenging academic content standards and student academic achievement standards, as adopted by a State in accordance with section 1111(b)(1) of the Elementary and Secondary Education Act of 196552 and measured by the State determined proficient levels on the academic assessments described in section 1111(b)(3) of such Act.
49 Performance levels for the Perkins IV Sec. 113(b) core indicators are referred to as “adjusted” after a state and the Department have negotiated and reached agreement on them per the requirements in Sec. 113(b)(3) of Perkins IV. 50 The core indicators of performance, described in Sec. 113(b)(2)(A) and (B) of Perkins IV, are hereinafter referred to as the “Perkins IV Sec. 113(b) core indicators” or “core indicators.” 51 Perkins IV Sec. 113(b)(2)(A) indicates that each eligible agency shall identify in the state plan “core indicators of performance for career and technical education students at the secondary level” that are valid and reliable. 52 The Elementary and Secondary Education Act of 1965, as amended by the No Child Left Behind Act of 2001 (NCLB), is hereinafter referred to as ESEA.

4 INTRODUCTION
(ii) Student attainment of career and technical skill proficiencies, including student achievement on technical assessments that are aligned with industry-recognized standards, if available and appropriate.
(iii) Student rates of attainment of each of the following:
(I) A secondary school diploma.
(II) A General Education Development (GED) credential, or other State-recognized equivalent (including recognized alternative standards for individuals with disabilities).
(III) A proficiency credential, certificate, or degree, in conjunction with a secondary school diploma (if such credential, certificate, or degree is offered by the state in conjunction with a secondary school diploma).
(iv) Student graduation rates (as described in section 1111(b)(2)(C)(vi) of the Elementary and Secondary Education Act of 1965).
(v) Student placement in postsecondary education or advanced training, in military service, or in employment.
(vi) Student participation in and completion of career and technical education programs that lead to nontraditional fields.”
The Perkins IV Sec. 113(b)(2)(B) core indicators for CTE students at the postsecondary level53 include, at a minimum, measures on each of the following:
“(i) Student attainment of challenging career and technical skill proficiencies, including student achievement on technical assessments that are aligned with industry-recognized standards, if available and appropriate.
(ii) Student attainment of an industry-recognized credential, a certificate, or a degree.
(iii) Student retention in postsecondary education or transfer to a baccalaureate degree program.
(iv) Student placement in military service or apprenticeship programs or placement or retention in employment, including placement in high skill, high wage, or high demand occupations or professions.
(v) Student participation in, and completion of, career and technical education programs that lead to employment in nontraditional fields.”
53 Perkins IV Sec. 113(b)(2)(B) indicates that each eligible agency shall identify in the state plan “core indicators of performance for career and technical education students at the postsecondary level” that are valid and reliable.

INTRODUCTION 5
Some states operate separate adult-level programs that are not included in community college settings. Six states—Florida, Louisiana, Missouri, Ohio, Oklahoma, and Tennessee—provided performance levels and report data for their adult-level CTE students using the Perkins IV Sec. 113(b)(2)(B) postsecondary core indicators and performance levels.
For data collection and reporting purposes, the Department divides the Perkins IV Sec. 113(b) core indicators into eight core indicators at the secondary level and six core indicators at the postsecondary level. The Department labels the Perkins IV Sec. 113(b) core indicators as shown in table 1.54 For PY 2010–11, each state was required by the secretary to report student data on each of the Perkins IV indicators of performance. The student data are reported by each state per the instructions in the Consolidated Annual Report (CAR) for the Carl D. Perkins Career and Technical Education Act of 2006 for PY 2010–11.55 PY 2010–11 was the third year of each state’s five-year plan, submitted to the secretary, pursuant to Sec. 122(a)(1) of Perkins IV.
Table 1. Perkins IV Sec. 113(b) core indicators for career and technical education students at secondary and postsecondary levels
Perkins IV Sec. 113(b)(2)(A) Secondary core indicators
Perkins IV Sec. 113(b)(2)(B) Postsecondary core indicators
Academic attainment–reading/language arts Technical skill attainment
Academic attainment–mathematics Credential, certificate, or degree
Technical skill attainment Student retention or transfer
Secondary school completion Student placement
Student graduation rates Nontraditional participation
Secondary placement Nontraditional completion
Nontraditional participation
Nontraditional completion
NOTE: Each state reports data on CTE students based on their definitions of CTE concentrators or CTE participants. See Appendix A, table A-1, for each state’s definition of CTE concentrator and table A-2 for each state’s definition of CTE participant. Perkins IV means the Carl D. Perkins Career and Technical Education Act of 2006. PY 2010–11, program year four of Perkins IV, is the third year states are required to report on all of the indicators of performance under Sec. 113(b) of Perkins IV.
54 The eight secondary core indicators reflect the language of Sec. 113(b)(2)(A) of Perkins IV, and the six postsecondary core indicators reflect the language of Sec. 113(b)(2)(B) of Perkins IV. 55 When completing the CAR enrollment and accountability forms, a state must use its definitions for a CTE participant and CTE concentrator at the secondary and postsecondary levels. Unless otherwise specified, the data in this report are for CTE concentrators.

6 INTRODUCTION
Sec. 113(c)(2) of Perkins IV also requires states to provide disaggregated data on the progress of CTE students on each indicator of performance in each of the special population categories56 listed in Sec. 3(29) of Perkins IV 57 and in each of the categories listed in Sec. 1111(h)(1)(C)(i) of ESEA.58 To avoid states reporting duplicative data, the secretary requires states to disaggregate data only in the following categories:59
• Race/ethnicity;
• Gender;
• Individuals with disabilities (American with Disabilities Act of 1990 [ADA]);
• Individuals with disabilities (ESEA and the Individuals with Disabilities Education Act [IDEA]) (secondary level only);
• Individuals from economically disadvantaged families, including foster children;
• Individuals preparing for nontraditional fields;
• Single parents, including single pregnant women;
• Displaced homemakers;
• Individuals with limited English proficiency; and
• Migrant students (secondary level only).
Sec. 205 of Title II of Perkins IV (Tech Prep60 Education)61 requires states that do not consolidate all of their Perkins IV funds62 for purposes authorized under Sec. 203(c) of
56 See the Glossary of Terms in this report for definitions of each special population category. 57 Sec. 3(29) of Perkins IV defines the term “special populations” as meaning—‘‘(A) individuals with disabilities; (B) individuals from economically disadvantaged families, including foster children; (C) individuals preparing for non-traditional fields; (D) single parents, including single pregnant women; (E) displaced homemakers; and (F) individuals with limited English proficiency.” 58 Sec. 1111(h)(1)(C)(i) of ESEA requires that “The State shall include in its annual State report card—(i) information, in the aggregate, on student achievement at each proficiency level on the State academic assessments described in subsection (b)(3) (disaggregated by race, ethnicity, gender, disability status, migrant status, English proficiency, and status as economically disadvantaged).” 59 The categories in which states must report disaggregated data reflect the requirement of Sec. 113(c)(3) of Perkins IV that the secretary ensures that states do not report duplicative data under Sec. 113(c) of Perkins IV. 60 The term “tech prep program” in Sec. 3(32) of Perkins IV means a tech prep program described in Sec. 203(c) of Perkins IV. Sec. 203(c)(2)(A) and (B) of Perkins IV indicates that a tech prep program, among other things, shall consist of a program of study that (i) combines a minimum of two years of secondary education with a minimum of two years of postsecondary education in a nonduplicative, sequential course of study, or an apprenticeship program of not less than two years following secondary education instruction; and that (ii) integrates academic and career and technical education. 61 FY 2010 is the last year for which funds were appropriated under Title II of Perkins IV for tech prep programs.

INTRODUCTION 7
Perkins IV to report to the secretary on the effectiveness of their tech prep programs. Therefore, the secretary requires each of such state to report disaggregated data for tech prep students by each of the Perkins IV Sec. 113(b) core indicators separately in addition to the 11 other indicators of performance listed in Sec. 203(e) of Perkins IV.63 For data collection and reporting purposes, the Department divides Perkins IV Sec. 203(e) indicators of performance into six indicators of performance at the secondary level and five indicators of performance at the postsecondary level. The Department labels the Perkins IV Sec. 203(e) indicators of performance as shown in table 2.64
62 Sec. 202(a) of Perkins IV enables states to consolidate all or a portion of their Perkins IV, Title II, funds with their Perkins IV, Title I, funds, but Sec. 202(c) of Perkins IV requires a state to consider its consolidated funds as if these funds were allotted under Title I of Perkins IV and to distribute these funds in accordance with the within-state allocations as required by Sec. 112 of Perkins IV. Except for the United States Virgin Islands, the outlying areas are not eligible for Title II, tech prep allotments under secs. 111(a) and 201(a) of Perkins IV. 63 The 11 indicators of performance listed in Sec. 203(e) of Perkins IV are hereinafter referred to as the “Perkins IV Sec. 203(e) indicators of performance.” 64 The six secondary indicators reflect the language of Sec. 203(e)(1)(A) and (B) of Perkins IV, and the five postsecondary indicators reflect the language of Sec. 203(e)(1)(A) and (C) of Perkins IV.

8 INTRODUCTION
Table 2. Perkins IV Sec. 203(e) indicators of performance for tech prep students at secondary and postsecondary levels
Perkins IV Sec. 203(e) Secondary indicators of performance
Perkins IV Sec. 203(e) Postsecondary indicators of performance
Number of tech prepa studentsb served Number of tech prep students served
Postsecondary enrollment Placement in related field of employment
Postsecondary enrollment in same field or major
Completion of state- or industry-recognized certificate or licensure
Completion of statec or industry-recognized certificate or licensure
Completion of two-year degree or certificate
Completion of postsecondary course offering postsecondary credits
Completion of baccalaureate degree program
Enrollment in remedial courses in postsecondary education
a The term “tech prep program” in Sec. 3(32) of Perkins IV means a tech prep program described in Sec. 203(c) of Perkins IV, regarding the contents of the tech prep program. Sec. 203(c)(2)(A) and (B) of Perkins IV indicates that a tech prep program, among other things, shall consist of a program of study that (i) combines a minimum of two years of secondary education with a minimum of two years of postsecondary education in a nonduplicative, sequential course of study, or an apprenticeship program of not less than two years following secondary education instruction; and that (ii) integrates academic and career and technical education. b A tech prep student is identified by the same set of criteria (Appendix A, table A-1) as a CTE concentrator and is in a tech prep program. c The term “state” in Sec. 3(30) of Perkins IV means, unless otherwise specified, each of the 50 states of the United States, the District of Columbia, the Commonwealth of Puerto Rico, and each outlying area. The term “state” as it is used in this report consists of each jurisdiction of the United States, including the 50 states of the United States, the District of Columbia, the Commonwealth of Puerto Rico; and the outlying areas of the United States Virgin Islands, Guam, American Samoa, the Commonwealth of the Northern Mariana Islands, and the Republic of Palau. However, under secs. 111(a) and (d) and 201(a) of Perkins IV, the 50 states of the United States, the District of Columbia, the Commonwealth of Puerto Rico, and the United States Virgin Islands are eligible for tech prep allotments, but a state does not have to report data on the Perkins IV Sec. 203(e) indicators if the state consolidates all of its Title II funds with its Title I funds as permitted by Sec. 202(a) of Perkins IV.
NOTE: Perkins IV means the Carl D. Perkins Career and Technical Education Act of 2006. PY 2010–11, program year four of Perkins IV, is the third year states are required to report on all of the Perkins IV indicators of performance.
Consistent with the Department’s Oct. 19, 2007, memorandum titled “Final Guidance on Maintaining, Collecting, and Reporting Racial and Ethnic Data” (see 72 Federal Register 59266), beginning in PY 2010–11, states were required to report data disaggregated by race/ethnicity according to “Revision to the Standards for the Classification of Federal Data on Race and Ethnicity” that was issued by OMB in 1997.
B. Establishing Measures and Setting Performance Levels
Perkins IV allows states, with input from their eligible recipients, to establish their own measures solely for the Perkins IV Sec. 113(b) core indicators—except for the ESEA indicators in Sec. 113(b)(2)(A)(i) and (iv) that are based on ESEA data for which Perkins IV requires states to use their standards, assessments, and graduation rates under Title I of

INTRODUCTION 9
ESEA as measures of academic achievement and graduation rates of CTE students. Although states may solely establish their measures for the Perkins IV Sec. 113(b) core indicators, Sec. 122(e)(1) of Perkins IV allows the secretary to disapprove a state plan if it does not meet the requirements of Perkins IV, including the requirement in Sec. 113(b)(2)(A) and (B) of Perkins IV that states identify measures of their core indicators at the secondary and postsecondary levels that are valid and reliable. States also identify, as part of their measures, the student populations on which they will report performance data. These populations are referred to as CTE participants65 and CTE concentrators.66 Therefore, the data in this report specifies whether the data relate to CTE participants or CTE concentrators.
Despite some notable differences among state definitions and measures, states have generally achieved greater validity, reliability, and comparability in their definitions and measures. The greatest differences among states remain their definitions of CTE concentrators at the secondary level (see Appendix A, table A-1).
In accordance with the requirements of Perkins IV, the Department negotiates annual performance levels on each of the core indicators with each state. Each state identifies its performance levels for the Perkins IV Sec. 113(b) core indicators in its state plan submitted under Sec. 122 of Perkins IV. Levels of performance for each of the core indicators of performance must be expressed in a percentage or numerical form, so that they are objective, quantifiable, and measurable. Further, the performance levels must be set such that the state is required to continually make progress toward improving the performance of career and technical education students (see Sec. 113(b)(3)(A)(i) of Perkins IV).
C. Efforts to Help States Build and Improve Their Perkins Accountability Systems
The Department undertook a variety of efforts during PY 2010–11 to help states develop and implement their Perkins accountability systems and meet their Perkins IV performance levels. The Department provided customized technical assistance to states on Perkins IV accountability issues. Twelve states—Alabama, Iowa, Maryland, Massachusetts, Montana, Nebraska, Nevada, New Mexico, New York, Pennsylvania, Rhode Island, and Texas—requested technical assistance for PY 2010–11, bringing to 44 the total number of states that have received such assistance since it was first offered in 2005. Those that requested
65 See Appendix A, table A-2, for each state’s definition of CTE participant. 66 See Appendix A, table A-1, for each state’s definition of CTE concentrator.

10 INTRODUCTION
technical assistance in PY 2010–11 received departmental assistance on ways to implement a performance-based funding system.
The Department hosted monthly Next Steps Work Group (NSWG) conference calls. The NSWG, comprising state CTE directors and their accountability staff, tackles common issues and challenges across states regarding Perkins IV accountability systems. Among the issues addressed during PY 2010–11 were (1) how to connect the National Center for Education Statistics (NCES) data and Wage Record Interchange System (WRIS) data to existing career and technical education data; (2) integrating State Longitudinal Data Systems (SLDS) with state career and technical education data exchange databases; and (3) alternative models of assessing Programs of Study (POS). Also, in order to address these topics, as well as other topics related to the Perkins IV accountability system, during PY 2010–11, the Department hosted a Data Quality Institute (DQI) for CTE directors and their accountability staff.
The Department reviewed states’ Perkins accountability systems as part of its Perkins IV monitoring site visits. As in previous years, and consistent with the grant monitoring practices of the Department, the following issues were addressed during these visits: (1) policies and procedures states used to gather data from local grantees; (2) efforts states employed to use performance data in funding local grantees; (3) use of data to identify CTE program strengths and weaknesses as a basis for CTE program reform; and (4) procedures states used to ensure that data received from local grantees are accurate, reliable, and complete.
Finally, the Department continued to upgrade its Peer Collaborative Resource Network (PCRN) website67 based on issues identified by the field and by the states in order to provide current, relevant information. Relevant technical assistance materials are provided in the form of virtual learning modules and PowerPoint presentations in accordance with the needs and interests of the field. Through the PCRN website, individuals can run customized reports on the progress of states in achieving their performance levels on the Perkins IV Sec. 113(b) core indicators for all CTE concentrators or by disaggregated categories of students. This information can help states benchmark their progress against other similar states and, in so doing, identify states with which they can share promising practices for improving the performance of CTE concentrators.
67 The Department’s Peer Collaborative Resource Network (PCRN) website is located at http://cte.ed.gov.

11
State Performance Data
A. Enrollment in Career and Technical Education Programs
States reported in PY 2010–11 that over 12 million students enrolled in secondary, postsecondary and adult-level CTE programs, a decrease (457,137 students) from PY 2009–10. Nevertheless, the number of participating CTE students is similar to the past nine years of Perkins III and IV implementation (figure 1). Enrollment data reflect unduplicated counts of all students reported by each state as having completed one or more CTE courses at the secondary, postsecondary, and adult levels. These courses may or may not be funded with federal Perkins IV funds. It is important to note that CTE student 68 enrollment in the PY 2009–10 and PY 2010–11 reports to Congress differ from earlier (PY 2001–02 to PY 2008–09) reports in that tech prep students are not reported as a separate student population. Data from previous years were inflated due to the reporting of duplicated enrollment. Figure 1 illustrates the corrected, unduplicated CTE student enrollment for PY 2001–02 to PY 2010–11. This figure shows the enrollment of CTE students over the past nine years remains steadily above 12 million students per year enrolled in CTE programs per year at the secondary, postsecondary, and adult levels.
68 The data reflects unduplicated counts of all CTE students (CTE participants and CTE concentrators) reported by each state as having taken one or more CTE courses or credits at the secondary, postsecondary, and adult levels. States report data based on their definitions of CTE participant and CTE concentrator. Although the definitions of CTE participants vary among states, most states define CTE participants as students who have completed one CTE course at the secondary level or one credit at the postsecondary level. See Appendix A, table A-2, for each state’s definition of CTE participant and table A-1 for each state’s definition of CTE concentrator. Although definitions of CTE concentrators vary among states, most states define CTE concentrators as those who have completed three courses at the secondary level and 12 credits at the postsecondary level (see Appendix A, table A-1, for each state’s definition of CTE concentrators).

12 STATE PERFORMANCE DATA
Figure 1. Career and technical education student enrollment: Program years 2001–02 to 2010–11
10,587,010
12,484,418 12,891,714
12,667,865 12,892,042 13,024,562
12,062,263 12,418,188 12,509,354 12,052,217
0
5,000,000
10,000,000
15,000,000
2001–02 2002–03 2003–04 2004–05 2005–06 2006–07 2007–08 2008–09 2009–10 2010–11
Number of CTE studentsa,b
Program years and Perkins Acts
Perkins III Perkins IV
a States report data based on their definitions of CTE participant and CTE concentrator. See Appendix A, table A-2, for each state’s definition of CTE participant and table A-1 for each state’s definition of CTE concentrator. b Reflects unduplicated counts of all CTE students (CTE participants and CTE concentrators) as reported by each state as having taken one or more CTE courses or credits at the secondary, postsecondary, and adult levels. See Appendix A, table A-2, for each state’s definition of CTE participant and table A-1 for each state’s definition of CTE concentrator.
NOTE: Perkins III means the Carl D. Perkins Career and Technical Education Act of 1998 and Perkins IV means the Carl D. Perkins Career and Technical Education Act of 2006. The 50 U.S. states, the District of Columbia, the Commonwealth of Puerto Rico, and three of the outlying areas—the United States Virgin Islands, Guam, and Republic of Palau—were required to report data and information under Perkins IV for PY 2010–11. The Republic of Palau did not submit data or information because it did not have a fully approved state plan. The United States Virgin Islands received its allotted Perkins IV funds consolidated with funds allotted under other formula grant programs and used some of the funds in the consolidated grant for Perkins IV, Title I, purposes. American Samoa and the Commonwealth of the Northern Mariana Islands did not submit data or information for CTE programs because they consolidated their Perkins IV, Title I, allotments with funds under other formula programs and used these funds for allowable program purposes rather than for career and technical education. Thus, the CTE data reported for PY 2010–11 represent 54 of the 57 states that were allotted funds under Perkins IV.
SOURCE: U.S. Department of Education, Office of Vocational and Adult Education, Consolidated Annual Report (CAR) for the Carl D. Perkins Career and Technical Education Act of 1998 for PY 2001–02 through PY 2006–07 (OMB Number 1830-0503) and the Consolidated Annual Report (CAR) for the Carl D. Perkins Career and Technical Education Act of 2006 for PY 2007–08 through PY 2010–11 (OMB Number 1830-0569).
Table 3 lists the enrollment data for the CTE students69 for PY 2009–10 and PY 2010–11 by state. Twenty-three states reported an increase in their secondary CTE student enrollment, and 36 states reported such increases at the postsecondary level. The percentage of change in the comparisons of the state totals reveals that secondary CTE student enrollment decreased 1.83 percent from the previous year, while postsecondary CTE student enrollment decreased 6.14 percent from the previous year.
69 States report data based on their definitions of CTE participant and CTE concentrator. See Appendix A, table A-2, for each state’s definition of CTE participant and table A-1 for each state’s definition of CTE concentrator.

STATE PERFORMANCE DATA 13
Table 3. Enrollment comparison of CTE students in CTE programs, by state: Program years 2009–10 and 2010–11
aSecondary CTE students aPostsecondary CTE studentsIncrease or Increase or
decreaseb in decreaseb inStates PY 2009–10 PY 2010–11 enrollment PY 2009–10 PY 2010–11 enrollment
Total 7,633,468 7,494,042 † 4,700,487 4,411,875 †Percent Difference † † -1.83% † † -6.14%
Alabama 176,061 184,960 5.05% 84,226 79,146 -6.03%Alaska 16,336 15,632 -4.31% 6,499 7,002 7.74%
Arizona 105,333 82,650 -21.53% 140,227 146,441 4.43%
Arkansas 99,006 97,515 -1.51% 32,445 35,060 8.06%
California 990,970 996,305 0.54% 1,411,072 1,070,175 -24.16%Colorado 90,600 89,145 -1.61% 48,432 50,397 4.06%
Connecticut 110,896 103,643 -6.54% 30,577 32,538 6.41%
Delaware 25,544 26,067 2.05% 11,272 11,298 0.23%
District of Columbia 4,072 3,322 -18.42% 3,920 4,090 4.34%
Florida 423,086 429,097 1.42% 95,318 102,036 7.05%
Georgia 323,412 319,900 -1.09% 158,823 155,835 -1.88%Guam 2,289 2,263 -1.14% 2,181 2,293 5.14%
Hawaii 27,469 27,401 -0.25% 9,773 10,230 4.68%
Idaho 89,322 87,256 -2.31% 9,929 9,034 -9.01%Illinois 308,184 309,722 0.50% 205,718 200,643 -2.47%Indiana 121,925 62,345 -48.87% 87,768 35,693 -59.33%Iowa 95,250 93,528 -1.81% 50,442 52,710 4.50%
Kansas 52,522 45,817 -12.77% 21,059 35,007 66.23%
Kentucky 150,350 153,223 1.91% 35,333 44,621 26.29%
Louisiana 140,350 145,788 3.87% 23,658 39,011 64.90%
Maine 8,459 8,343 -1.37% 7,559 8,760 15.89%
Maryland 111,366 117,339 5.36% 67,835 65,315 -3.71%Massachusetts 58,701 58,861 0.27% 54,209 59,291 9.37%
Michigan 122,826 118,583 -3.45% 135,633 152,466 12.41%
Minnesota 108,705 102,178 -6.00% 58,620 62,113 5.96%
Mississippi 139,782 127,181 -9.01% 26,676 27,524 3.18%
Missouri 134,995 129,093 -4.37% 58,524 65,715 12.29%
Montana 11,571 11,263 -2.66% 6,749 7,100 5.20%
Nebraska 88,945 89,843 1.01% 52,381 52,653 0.52%
Nevada 52,614 49,881 -5.19% 33,465 30,073 -10.14%New Hampshire 11,510 11,427 -0.72% 13,545 9,630 -28.90%New Jersey 102,142 97,554 -4.49% 79,316 76,821 -3.15%New Mexico 42,394 49,131 15.89% 43,747 48,656 11.22%
New York 153,574 180,393 17.46% 188,489 161,197 -14.48%North Carolina 550,061 513,397 -6.67% 150,866 156,258 3.57%
North Dakota 21,323 20,983 -1.59% 9,430 9,551 1.28%See notes at end of table.

14 STATE PERFORMANCE DATA
Table 3. Enrollment comparison of CTE students in CTE programs, by state: Program years 2009–10 and 2010–11—Continued
aSecondary CTE students aPostsecondary CTE studentsIncrease or Increase or
decreaseb in decreaseb inStates PY 2009–10 PY 2010–11 enrollment PY 2009-10 PY 2010-11 enrollmentOhio 129,679 126,347 -2.57% 118,343 125,049 5.67%
Oklahoma 17,037 17,621 3.43% 34,235 37,937 10.81%
Oregon 101,133 36,501 -63.91% 80,140 80,243 0.13%
Pennsylvania 64,913 63,092 -2.81% 82,542 83,825 1.55%
Puerto Rico 27,478 28,692 4.42% 3,215 2,888 -10.17%cRepublic of Palau NP NP NP NP NP NP
Rhode Island 6,659 19,548 193.56% 2,174 1,185 -45.49%South Carolina 188,701 184,801 -2.07% 61,452 61,740 0.47%
South Dakota 30,810 33,305 8.10% 4,192 5,417 29.22%
Tennessee 159,378 170,280 6.84% 28,890 34,760 20.32%
Texas 1,027,435 1,033,875 0.63% 269,380 266,766 -0.97%
United States Virgin Islandsd 3,124 5,949 90.43% † 288 †
Utah 87,003 102,163 17.42% 36,709 66,534 81.25%
Vermont 4,720 5,023 6.42% 4,120 4,438 7.72%
Virginia 260,464 262,584 0.81% 104,433 117,430 12.45%
Washington 299,089 298,724 -0.12% 220,891 212,692 -3.71%West Virginia 48,844 40,429 -17.23% 24,636 25,509 3.54%
Wisconsin 90,612 89,101 -1.67% 158,910 158,902 -0.01%Wyoming 14,444 14,978 3.70% 10,509 9,889 -5.90%
† No data applicable to the cell.
NP Data not provided. a Reflects unduplicated counts of all CTE students (CTE participants and CTE concentrators) reported by each state as having taken one or more CTE courses or credits at the secondary, postsecondary, and adult levels. States report data based on their definitions of CTE participant and CTE concentrator. See Appendix A, table A-2, for each state’s definition of CTE participant and table A-1 for each state’s definition of CTE concentrator. b Negative percentages (shown in bold) indicate a decrease in secondary or postsecondary CTE participant enrollment in the state. c The Republic of Palau did not have a fully approved state plan under Perkins IV for PY 2010–11; therefore, it did not report enrollment data for PY 2010–11. d The United States Virgin Islands received its allotted Perkins IV funds consolidated with funds allotted under other formula grant programs and used some of the funds in the consolidated grant for Perkins IV, Title I, purposes.
NOTE: The term “state” in Sec. 3(30) of Perkins IV means, unless otherwise specified, each of the 50 states of the United States, the District of Columbia, the Commonwealth of Puerto Rico, and each outlying area. The term “state” as it is used in this report consists of each jurisdiction of the United States, including the 50 states of the United States, the District of Columbia, the Commonwealth of Puerto Rico; and the outlying areas of the United States Virgin Islands, Guam, American Samoa, the Commonwealth of the Northern Mariana Islands, and the Republic of Palau. CTE means career and technical education. Perkins IV means the Carl D. Perkins Career and Technical Education Act of 2006. PY means program year. The 50 U.S. states, the District of Columbia, the Commonwealth of Puerto Rico, and three of the outlying areas—the United States Virgin Islands, Guam, and Republic of Palau—were required to report data and information under Perkins IV for PY 2010–11. Of the 57 states that received Perkins IV, state grants for PY 2010–11, the CTE data reported above represent 54. American Samoa and the Commonwealth of the Northern Mariana Islands do not submit data or information for CTE programs because they consolidated their Perkins IV, Title I, allotments with funds under other formula programs and used these funds for allowable program purposes rather than for career and technical education.
SOURCE: U.S. Department of Education, Office of Vocational and Adult Education, Consolidated Annual Report (CAR) for the Carl D. Perkins Career and Technical Education Act of 2006 for PY 2010–11 (OMB Number 1830-0569).

STATE PERFORMANCE DATA 15
Table 4 presents states’ CTE student data by gender, race/ethnicity, and special populations and other student categories. These data include duplicate counts. For example, a student may be not only have disabilities but also may be economically disadvantaged, and either male or female, and a member of a specified racial or ethnic group. Moreover, totals for disaggregated categories of gender and race/ethnicity in table 4 do not correspond to the total CTE students in figure 1, because a few states did not submit disaggregated data for CTE students in one or more categories.

16 STATE PERFORMANCE DATA
Table 4. Enrollment of CTE students in CTE programs, by disaggregated student category: Program year 2010–11
Secondary Postsecondary Adult
CTE studenta
characteristicsDisaggregated student category
Number of
students
Percent-age of
students
Number of
students
Percent-age of
students
Number of
students
Percent-age of
studentsGenderb (unduplicated count)
Total 7,494,042 100.00% 4,411,875 100.00% 146,300 100.00%Male 3,980,357 53.11% 2,035,339 46.13% 74,492 50.92%Female 3,513,685 46.89% 2,376,536 53.87% 71,808 49.08%
Race/Ethnicityc (duplicated count) Totald 7,501,366 100.00% 4,410,663 100.00% 148,610 100.00%
American Indian or Alaska Native 80,745 1.08% 60,645 1.37% 2571 1.73%
AsianBlack or African AmericanHispanic/LatinoNative Hawaiian or Other Pacific Islander
288,5751,306,5691,661,064
34,498
3.85%17.42%22.14%
0.46%
258,273625,465644,465
55,853
5.86%14.18%14.61%
1.27%
198935,48015512
143
1.34%23.87%10.44%
0.10%
WhiteTwo or More Races
3,950,199179,716
52.66%2.40%
2,369,75448,995
53.73%1.11%
89,9871105
60.55%0.74%
Unknown e— † 347,213 7.87% 1,823 1.23%
Special Populations and Other Student Categories (duplicated count)Totald 6,471,359 100.00% 3,066,113 100.00% 113,663 100.00%
Individuals with disabilities (ADA f)
g— † 152,872 4.99% 4,363 3.84%
Individuals with disabilities (ESEA /IDEA ) 797,869 12.33% h— † h— †
Economically disadvantaged students 3,317,572 51.27% 1,668,686 54.42% 74,186 65.27%
Single parents 32,780 0.51% 263,868 8.61% 11,984 10.54%Displaced homemakers 2,038 0.03% 110,196 3.59% 4,356 3.83%Limited English proficient 383,800 5.93% 177,584 5.79% 7,176 6.31%Migrant students 53,733 0.83% i— † i— †Students in nontraditional programs 1,883,567 29.11% 692,907 22.60% 11,598 10.20%
† No data applicable to the cell. — Data not applicable. a Reflects unduplicated counts of all students (CTE participants and CTE concentrators) reported by each state as having taken one or more CTE courses or credits at the secondary, postsecondary, and adult levels. States report data based on their definitions of CTE participant and CTE concentrator. See Appendix A, table A-2, for each state’s definition of CTE participant and table A-1 for each state’s definition of CTE concentrator. b The sum of the totals for gender corresponds to the total for career and technical education student enrollment for PY 2010–11 in figure 1. c According to the Department’s Oct. 19, 2007, memorandum titled “Final Guidance on Maintaining, Collecting, and Reporting Racial and Ethnic Data” (see 72 Federal Register 59266), states were required beginning in PY 2010–11 to report data disaggregated by race/ethnicity using the “Revisions to the Standards for the Classification of Federal Data on Race and Ethnicity” that was issued by OMB in 1997. See the Glossary of Race/Ethnicity Categories section in the Glossary of Terms of this report for the meaning of each racial/ethnic disaggregated category in this table. d The totals for race/ethnicity standards and special populations and other student categories are based on data and information reported by CTE students or their parents. The sum of the totals for disaggregated categories of race/ethnicity and other special populations and other student categories do not correspond to each other or to the career and technical education student enrollment for PY 2010–11 in figure 1 because (1) a few states did not submit disaggregated data on CTE students for one or more categories; and (2) students can be included in more than one race/ethnicity category, special population category, and/or other student category. e Secondary Education reports are based on the 1997 Race/Ethnicity categories. The Department does not include a ‘‘race and/or ethnicity unknown’’ category for its aggregate elementary and secondary reporting of racial and ethnic data for the 1997 Race/Ethnicity categories.
Notes continued on next page.

STATE PERFORMANCE DATA 17
Table 4. Enrollment of CTE students in CTE programs, by disaggregated student category: Program year 2010–11—Continued
f The Americans with Disabilities Act of 1990 (ADA) was amended by the ADA Amendments Act of 2008 (Public Law 110-325), which became effective on Jan. 1, 2009. g While ADA is applicable to individuals with disabilities in secondary and postsecondary education, for reporting purposes, the states reported ADA data only for the postsecondary and adult populations. h ESEA and the Individuals with Disabilities Education Act (IDEA are applicable to only those students at the secondary level. “Individuals with disability” in ESEA refers to “disability status,” as used in Sec. 1111(h)(1)(C)(i) of ESEA, and refers to a “child with a disability,” which under Sec. 9101(5) of ESEA has the same meaning as the term is used in Sec. 602 of IDEA. The term an “individual with a disability” as defined in Sec. 602(3)(A) of IDEA, refers to a “child with a disability,” which means a child “(i) with mental retardation, hearing impairments (including deafness), speech or language impairments, visual impairments (including blindness), serious emotional disturbance (referred to in this title as ‘emotional disturbance’), orthopedic impairments, autism, traumatic brain injury, other health impairments, or specific learning disabilities; and (ii) who, by reason thereof, needs special education and related service. i The category “migrant students” is applicable only to students in the migrant status category under ESEA and, therefore, does not include students at the postsecondary and adult levels.
NOTE: CTE means career and technical education. Perkins IV means the Carl D. Perkins Career and Technical Education Act of 2006. There is no variation of total value of the cells in the gender section compared with the total for CTE student enrollment for PY 2010–11 in figure 1. However, the total value of the cells in the race/ethnicity and special populations and other categories sections do vary because a few states did not submit disaggregated data on CTE participants for one or more categories and the data for these categories are duplicated counts. The percentage of students is by disaggregated category at the secondary, postsecondary, and adult levels. Therefore, the percentage totals are not summative horizontally.
The 50 U.S. states, the District of Columbia, the Commonwealth of Puerto Rico, and three of the outlying areas—the United States Virgin Islands, Guam, and Republic of Palau—were required to report data and information under Perkins IV for PY 2010–11. The Republic of Palau did not submit data or information because it did not have a fully approved state plan. The United States Virgin Islands received its allotted Perkins IV funds consolidated with funds allotted under other formula grant programs and used some of the funds in the consolidated grant for Perkins IV, Title I purposes. American Samoa and the Commonwealth of the Northern Mariana Islands did not submit data or information for CTE programs because they consolidated their Perkins IV, Title I, allotments with funds under other formula programs and used these funds for allowable program purposes rather than for career and technical education. Thus, the CTE data reported for PY 2010–11 represent 54 of the 57 states that received Perkins IV, state grants. Florida, Louisiana, Missouri, Ohio, Oklahoma, and Tennessee provided performance levels and report data for their adult-level CTE concentrators using the Perkins IV Sec. 113(b)(2)(B) postsecondary core indicators.
SOURCE: U.S. Department of Education, Office of Vocational and Adult Education, Consolidated Annual Report (CAR) for the Carl D. Perkins Career and Technical Education Act of 2006 for PY 2010–11 (OMB Number 1830-0569).
States also reported in PY 2010–11 that in excess of 3 million secondary students and in excess of 2 million postsecondary students concentrated in CTE (CTE concentrators70) in one of 16 career cluster areas that are recognized by the Department and the National Association of State Directors of Career Technical Education Consortium (NASDCTEc) (table 5).71 The National Career Clusters Framework72 is comprised of 16 Career Clusters and related Career Pathways to help students of all ages explore different career options and provides a preparatory framework of instruction for college and career. Each career cluster represents a distinct grouping of occupations and industries based on required knowledge and skills. Each state has the flexibility to define CTE concentrator. Appendix A, table A-1, of this report provides the definitions for CTE concentrator for each state.
70 See Appendix A, table A-1, for each state’s definition of CTE secondary and postsecondary concentrators. 71 Founded in 1920, the National Association of State Directors of Career Technical Education Consortium (NASDCTEc) is the Washington, D.C.-based professional society of the state and territory agency heads responsible for career and technical education. 72 The National Career Clusters Framework (http://www.careertech.org/career-clusters/glance/clusters.html).

18 STATE PERFORMANCE DATA
Table 5 presents the percentage distribution of secondary and postsecondary CTE concentrators for PY 2010–11 in each of the 16 career cluster areas. The three highest enrollment percentages for secondary CTE concentrators were in the following career cluster areas: (1) business management and administration; (2) human services; and (3) health science. The three highest postsecondary enrollments were in the following career cluster areas: (1) health science; (2) business management and administration; and (3) law, public safety, and security.

STATE PERFORMANCE DATA 19
Table 5. Enrollment of CTE concentrators in CTE programs, by career cluster area: Program year 2010–11
Secondary Postsecondary
Career cluster areasa
Number of CTE con-
centratorsb
Percentage of CTE
concentrators
Number of CTE con-
centratorsb
Percentage of CTE
concentrators
Total 3,020,163 100.00% 2,255,055 100.00%
Agriculture, food, and natural resources 287,242 9.51% 31,368 1.39%
Architecture and construction 187,809 6.22% 125,944 5.58%
Arts, audio-visual technology, and communication 288,168 9.54% 86,619 3.84%
Business management and administration 510,191 16.89% 378,567 16.79%
Education and training 84,711 2.80% 93,515 4.15%
Finance 61,893 2.05% 13,832 0.61%
Government and public administration 30,232 1.00% 22,783 1.01%
Health science 288,932 9.57% 615,603 27.30%
Hospitality and tourism 144,438 4.78% 70,741 3.14%
Human services 289,643 9.59% 158,500 7.03%
Information technology 196,114 6.49% 140,759 6.24%
Law, public safety, and security 74,561 2.47% 213,552 9.47%
Manufacturing 126,988 4.20% 120,537 5.35%
Market sales and service 140,764 4.66% 36,115 1.60%
Science, technology, engineering, and mathematics 175,323 5.81% 56,893 2.52%
Transportation, distribution, and logistics 133,154 4.41% 89,727 3.98%
a Based on the National Career Clusters Framework (http://www.careertech.org/career-clusters/glance/clusters.html). Each career cluster represents a distinct grouping of occupations and industries based on the knowledge and skills CTE students require. b See Appendix A, table A-1, for each state’s definition of CTE concentrator.
NOTE: CTE means career and technical education. Perkins IV means the Carl D. Perkins Career and Technical Education Act of 2006. The percentages in the boxed cells indicate the career cluster areas with the three highest enrollment percentages for secondary and postsecondary CTE concentrators. The 50 U.S. states, the District of Columbia, the Commonwealth of Puerto Rico, and three of the outlying areas—the United States Virgin Islands, Guam, and Republic of Palau—were required to report data and information under Perkins IV for PY 2010–11. The Republic of Palau did not submit data or information because it did not have a fully approved state plan. The United States Virgin Islands consolidated its Perkins IV, Title I allotment with funds under other formula programs and used some of the funds in a consolidation grant for Perkins IV, Title I, purposes. American Samoa and the Commonwealth of the Northern Mariana Islands did not submit data or information for CTE programs because they consolidated their Perkins IV, Title I, allotments with funds under other formula programs and used these funds for allowable program purposes rather than for career and technical education. Thus, the CTE data reported for PY 2010–11 represent 54 of the 57 states that received Perkins IV state grants.
SOURCE: U.S. Department of Education, Office of Vocational and Adult Education, Consolidated Annual Report (CAR) for the Carl D. Perkins Career and Technical Education Act of 2006 for PY 2010–11 (OMB Number 1830-0569).

20 STATE PERFORMANCE DATA
Figure 2 illustrates the changes in the enrollment of CTE concentrators from PY 2009–10 to PY 2010–11 at the secondary level. States reported lower enrollments of CTE concentrators at the secondary level in PY 2010–11 compared to last year (PY 2009–10), with decreases in their enrollments in the agriculture, food and natural resources; architecture and construction; education and training; human services; information technology; market sales and service; and transportation, distribution, and logistics. However, the states reported increases in enrollment in nine of the career clusters at the secondary level.
Figure 2. Enrollment comparison of secondary CTE concentrators in CTE programs, by career cluster area: Program years 2009–10 and 2010–11
0
100,000
200,000
300,000
400,000
500,000
600,000
700,000
800,000
Number of CTE concentratorsa
Career cluster areasb and enrollment
PY 2009–10
PY 2010–11
Agriculture, Food, and
Natural Resources
Arch-itecture
and Construc-
tion
Arts, Audio-Visual Tech-
nology, and
Commun-ication
Business Manage-
ment and
Admin-istration
Education and
Training Finance
Govern- ment and
Public Admin-istration
Health Science
Hospitality and
Tourism Human
Services
Infor-mation Tech-nology
Law, Public Safety,
and Security
Manu-facturing
Market Sales and
Service
Science, Tech-
nology, Engin-eering,
and Math-
ematics
Trans-portation,
Distri-bution,
and Logistics
2007–08
2008–09
336,746
365,487
190,867
206,618
262,184
272,921
415,748
512,304
99,641
101,344
54,513
49,359
24,331
18,863
271,291
260,430
126,956
128,769
305,163
358,968
320,726
325,238
68,781
61,011
124,105
153,761
144,652
160,637
148,808
154,985
138,212
162,772
Agriculture, Food, and
Natural Resources
Archi-tecture
and Construc-
tion
Arts, Audio-Visual Tech-
nology, and
Commun-ication
Business Manage-
ment and
Admin-istration
Education and
Training Finance
Govern- ment and
Public Admin-istration
Health Science
Hospitality and
Tourism Human
Services
Infor-mation Tech-nology
Law, Public Safety,
and Security
Manu-facturing
Market Sales and
Service
Science, Tech-
nology, Engi-
neering, and
Math-ematics
Trans-portation,
Distri-bution,
and Logistics
2009–10
2010–11
336,746
287,242
190,867
187,809
262,184
288,168
415,748
510,191
99,641
84,711
54,513
61,893
24,331
30,232
271,291
288,932
126,956
144,438
305,163
289,643
320,726
196,114
68,781
74,561
124,105
126,988
144,652
140,764
148,808
175,323
138,212
133,154
a See Appendix A, table A-1, for each state’s definition of secondary CTE concentrator. b Based on the National Career Clusters Framework (http://www.careertech.org/career-clusters/glance/clusters.html). Each career cluster represents a distinct grouping of occupations and industries based on the knowledge and skills CTE students require.
NOTE: CTE means career and technical education. Perkins IV means the Carl D. Perkins Career and Technical Education Act of 2006. PY means program year. The 50 U.S. states, the District of Columbia, the Commonwealth of Puerto Rico, and three of the outlying areas—the United States Virgin Islands, Guam, and Republic of Palau—were required to report data and information under Perkins IV for PY 2010–11. The Republic of Palau did not submit data or information because it did not have a fully approved state plan. The United States Virgin Islands consolidated its Perkins IV, Title I, allotment with funds under other formula programs and used some of the funds in a consolidation grant for Perkins IV, Title I, purposes. American Samoa and the Commonwealth of the Northern Mariana Islands did not submit data or information for CTE programs because they consolidated their Perkins IV, Title I, allotments with funds under other formula programs and used these funds for allowable program purposes rather than for career and technical education. Thus, the CTE data reported for PY 2010–11 represent 54 of the 57 states that received Perkins IV state grants.
SOURCE: U.S. Department of Education, Office of Vocational and Adult Education, Consolidated Annual Report (CAR) for the Carl D. Perkins Career and Technical Education Act of 2006 for PY 2010–11 (OMB Number 1830-0569).

STATE PERFORMANCE DATA 21
Figure 3 illustrates the changes in the enrollment of CTE concentrators from PY 2009–10 to PY 2010–11 at the postsecondary level. States reported higher enrollments of CTE concentrators at the postsecondary level in PY 2010–11 compared to last year (PY 2009–10) (see table 6). They reported increases in 11 of the career clusters at the postsecondary level. However, the architecture and construction; arts, audio-visual technology, and communication; education and training; finance; and health science career clusters experienced decreased enrollments.
Figure 3. Enrollment comparison of postsecondary CTE concentrators in CTE programs, by career cluster area: Program years 2009–10 and 2010–11
0
100,000
200,000
300,000
400,000
500,000
600,000
700,000
800,000
Number of CTE concentratorsa
Career cluster areasb and enrollment
PY 2009–10
PY 2010–11
Agriculture, Food, and
Natural Resources
Archi-tecture
and Construc-
tion
Arts, Audio-Visual Tech-
nology, and
Commun-ication
Business Manage-
ment and
Admin-istration
Education and
Training Finance
Govern- ment and
Public Admin-istration
Health Science
Hospitality and
Tourism Human
Services
Infor-mation Tech-nology
Law, Public Safety,
and Security
Manu-facturing
Market Sales and
Service
Science, Tech-
nology, Engi-
neering, and
Math-ematics
Trans-portation,
Distri-bution,
and Logistics
2009–10
2010–11
29,761
31,368
129,987
125,944
89,289
86,619
351,918
378,567
102,466
93,515
14,378
13,832
2,372
2,499
634,246
633,120
54,842
68,842
146,992
157,351
130,802
141,954
193,517
210,125
125,413
127,809
33,880
36,393
51,166
53,163
84,223
90,095
a See Appendix A, table A-1, for each state’s definition of postsecondary CTE concentrator. b Based on the National Career Clusters Framework (http://www.careertech.org/career-clusters/glance/clusters.html). Each career cluster represents a distinct grouping of occupations and industries based on the knowledge and skills CTE students require.
NOTE: CTE means career and technical education. Perkins IV means the Carl D. Perkins Career and Technical Education Act of 2006. PY means program year. The 50 U.S. states, the District of Columbia, the Commonwealth of Puerto Rico, and three of the outlying areas—the United States Virgin Islands, Guam, and Republic of Palau—were required to report data and information under Perkins IV for PY 2010–11. The Republic of Palau did not submit data or information because it did not have a fully approved state plan. The United States Virgin Islands consolidated its Perkins IV, Title I, allotment with funds under other formula programs and used some of the funds in a consolidation grant for Perkins IV, Title I, purposes. American Samoa and the Commonwealth of the Northern Mariana Islands did not submit data or information for CTE programs because they consolidated their Perkins IV, Title I, allotments with funds under other formula programs and used these funds for allowable program purposes rather than for career and technical education. Thus, the CTE data reported for PY 2010–11 represent 54 of the 57 states that received Perkins IV state grants.
SOURCE: U.S. Department of Education, Office of Vocational and Adult Education, Consolidated Annual Report (CAR) for the Carl D. Perkins Career and Technical Education Act of 2006 for PY 2010–11 (OMB Number 1830-0569).

22 STATE PERFORMANCE DATA
Figure 4 illustrates the changes in adult CTE concentrator enrollment in CTE programs from PY 2009–10 to PY 2010–11. States reported lower enrollments of CTE concentrators at the adult level in PY 2010–11 compared to last year (PY 2009–10) (see table 6). They reported decreases in enrollment in the agriculture, food, and natural resources; architecture and construction; arts, audio-visual technology, and communication; business management and administration; government and public administration; health science; hospitality and tourism; information technology; manufacturing; and transportation, distribution, and logistics career clusters. However, the states reported increases in six of the career clusters at the adult level. Enrollment in the health science career cluster continues to excel in comparison to other program areas.

STATE PERFORMANCE DATA 23
Figure 4. Enrollment comparison of adult CTE concentrators in CTE programs, by career cluster area: Program years 2009–10 and 2010–11
0
10,000
20,000
30,000
40,000
50,000
Number of CTE concentratorsa
Career cluster areasb and enrollment
PY 2009–10
PY 2010–11
Agriculture, Food, and
Natural Resources
Archi-tecture
and Construc-
tion
Arts, Audio-Visual Tech-
nology, and
Commun-ication
Business Manage-
ment and
Admin-istration
Education and
Training Finance
Govern- ment and
Public Admin-istration
Health Science
Hospitality and
Tourism Human
Services
Infor-mation Tech-nology
Law, Public Safety,
and Security
Manu-facturing
Market Sales and
Service
Science, Tech-
nology, Engi-
neering, and
Math-ematics
Trans-portation,
Distri-bution,
and Logistics
2009–10
2010–11
2,004
1,004
12,863
10,155
1,599
1,279
10,401
9,926
1,699
6,693
363
629
107
85
48,611
39,779
2,816
2,455
7,473
7,935
4,209
3,540
10,816
11,195
12,190
9,861
1,138
5,131
614
2,810
16,210
10,612
a See Appendix A, table A-1, for each state’s definition of CTE concentrator. Florida, Louisiana, Missouri, Ohio, Oklahoma, and Tennessee provided performance levels and report data for their adult-level CTE concentrators using the Perkins IV Sec. 113(b)(2)(B) postsecondary core indicators. b Based on the National Career Clusters Framework (http://www.careertech.org/career-clusters/glance/clusters.html). Each career cluster represents a distinct grouping of occupations and industries based on the knowledge and skills CTE students require.
NOTE: CTE means career and technical education. Perkins IV means the Carl D. Perkins Career and Technical Education Act of 2006. PY means program year. The 50 U.S. states, the District of Columbia, the Commonwealth of Puerto Rico, and three of the outlying areas—the United States Virgin Islands, Guam, and Republic of Palau—were required to report data and information under Perkins IV for PY 2010–11. The Republic of Palau did not submit data or information because it did not have a fully approved state plan. The United States Virgin Islands consolidated its Perkins IV, Title I, allotment with funds under other formula programs and used some of the funds in a consolidation grant for Perkins IV, Title I, purposes. American Samoa and the Commonwealth of the Northern Mariana Islands did not submit data or information for CTE programs because they consolidated their Perkins IV, Title I, allotments with funds under other formula programs and used these funds for allowable program purposes rather than for career and technical education. Thus, the CTE data reported for PY 2010–11 represent 54 of the 57 states that received Perkins IV state grants. SOURCE: U.S. Department of Education, Office of Vocational and Adult Education, Consolidated Annual Report (CAR) for the Carl D. Perkins Career and Technical Education Act of 2006 for PY 2010–11 (OMB Number 1830-0569).

24 STATE PERFORMANCE DATA
Figure 5 illustrates the enrollment of CTE concentrators in CTE programs for PY 2010–11, by career cluster areas and gender. The highest female enrollment was in the health science career cluster, followed by the business management and administration cluster, and the human services career cluster. The highest male enrollment was in the business management and administration career cluster, followed by the architecture and construction career cluster, and the information technology career cluster. As in previous years, the greatest difference in male and female enrollment is in the health science career cluster.
Figure 5. Enrollment of CTE concentrators in CTE programs, by gender and career cluster area: Program year 2010–11
0
100,000
200,000
300,000
400,000
500,000
600,000
700,000
800,000
Number of CTE concentratorsa
Career cluster areasb and enrollment
Male
Female
Agriculture, Food, and
Natural Resources
Archi-tecture
and Construc-
tion
Arts, Audio-Visual Tech-
nology, and
Commun-ication
Business Manage-
ment and
Admin-istration
Education and
Training Finance
Govern- ment and
Public Admin-istration
Health Science
Hospitality and
Tourism Human
Services
Infor-mation Tech-nology
Law, Public Safety,
and Security
Manu-facturing
Market Sales and
Service
Science, Tech-
nology, Engi-
neering, and
Math-ematics
Trans-portation,
Distri-bution,
and Logistics
Male
Female
194,143
125,663
282,793
41,115
189,874
186,192
406,125
492,559
37,639
147,280
36,513
39,841
22,192
30,908
200,944
743,370
96,625
121,009
105,234
350,844
232,409
108,004
180,831
118,477
218,681
38,705
88,372
93,638
181,033
53,993
214,361
19,132
a See Appendix A, table A-1, for each state’s definition of CTE concentrator. b Based on the National Career Clusters Framework (http://www.careertech.org/career-clusters/glance/clusters.html). Each career cluster represents a distinct grouping of occupations and industries based on the knowledge and skills CTE students require.
NOTE: CTE means career and technical education. Perkins IV means the Carl D. Perkins Career and Technical Education Act of 2006. The 50 U.S. states, the District of Columbia, the Commonwealth of Puerto Rico, and three of the outlying areas—the United States Virgin Islands, Guam, and Republic of Palau—were required to report data and information under Perkins IV for PY 2010–11. The Republic of Palau did not submit data or information because it did not have a fully approved state plan. The United States Virgin Islands consolidated its Perkins IV, Title I allotment with funds under other formula programs and used some of the funds in a consolidation grant for Perkins IV, Title I, purposes. American Samoa and the Commonwealth of the Northern Mariana Islands did not submit data or information for CTE programs because they consolidated their Perkins IV, Title I, allotments with funds under other formula programs and used these funds for allowable program purposes rather than for career and technical education. Thus, the CTE data reported for PY 2010–11 represent 54 of the 57 states that received Perkins IV state grants.
SOURCE: U.S. Department of Education, Office of Vocational and Adult Education, Consolidated Annual Report (CAR) for the Carl D. Perkins Career and Technical Education Act of 2006 for PY 2010–11 (OMB Number 1830-0569).

STATE PERFORMANCE DATA 25
Table 6 provides a two-year comparison of CTE secondary, postsecondary, and adult concentrator enrollment for PY 2009–10 and PY 2010–11, by career cluster area. Nine secondary CTE career cluster areas experienced an increase in enrollment from PY 2009–10 to PY 2010–11. The largest enrollment increases at the secondary level were reported in the government and public administration career cluster (24.25 percent), and the business management and administration career cluster (22.72 percent) as compared to the previous program year. Seven of the 16 secondary career clusters experienced decreases in their enrollments, as compared to the previous program year. The largest declines were in the information technology career cluster (38.85 percent), the education and training career cluster (14.98 percent), and the agriculture, food, and natural resources career cluster (14.70 percent).
Eleven CTE career clusters at the postsecondary level experienced increases in their enrollments from PY 2009–10 to PY 2010–11. The largest enrollment increases at the postsecondary level were in the hospitality and tourism career cluster (25.53 percent); the law, public safety, and security career cluster (8.58 percent); and the information technology career cluster (8.53 percent). As evidenced by the data reported in table 6, postsecondary enrollment in the education and training career cluster experienced the largest decline over the two programs years (8.74 percent); whereas the finance career cluster and architecture and construction career cluster experienced declines of 3.80 percent and 3.11 percent, respectively.
Six CTE career clusters at the adult level experienced increased enrollment in PY 2010–11, as compared to the previous program year. The largest increases in enrollment for the adult level program were reported in the science, technology, engineering and mathematics career cluster (357.65 percent); the market sales and service career cluster (350.88 percent); and the education and training career cluster (293.94 percent). Ten career clusters at the adult level reported declines in enrollment. The largest declines were in the agriculture, food and natural resources career cluster (49.90 percent); the transportation, distribution and logistics career cluster (34.53 percent); and the architecture and construction career cluster (21.05 percent).

26 STATE PERFORMANCE DATA
Table 6. Enrollment comparison of CTE concentrators in CTE programs, by career cluster area: Program years 2009–10 and 2010–11
PY PY Percentage PY PY Percentage PY PY Percentage2009–10 2010–11 difference 2009–10 2010–11 difference 2009–10 2010–11 difference
TOTAL 3,032,724 3,020,163 † 2,175,252 2,251,196 † 133,113 123,089 †Percent Difference † † -0.41% † † 3.49% † † -7.53%
Agriculture, food, and natural resources 336,746 287,242 -14.70% 29,761 31,368 5.40% 2,004 1,004 -49.90%
Architecture and construction 190,867 187,809 -1.60% 129,987 125,944 -3.11% 12,863 10,155 -21.05%
Arts, audio-visual technology, and communication
262,184 288,168 9.91% 89,289 86,619 -2.99% 1,599 1,279 -20.01%
Business management and administration
415,748 510,191 22.72% 351,918 378,567 7.57% 10,401 9,926 -4.57%
Education and training 99,641 84,711 -14.98% 102,466 93,515 -8.74% 1,699 6,693 293.94%
Finance 54,513 61,893 13.54% 14,378 13,832 -3.80% 363 629 73.28%
Government and public administration 24,331 30,232 24.25% 2,372 2,499 5.35% 107 85 -20.56%
Health science 271,291 288,932 6.50% 634,246 633,120 -0.18% 48,611 39,779 -18.17%
Hospitality and tourism 126,956 144,438 13.77% 54,842 68,842 25.53% 2,816 2,455 -12.82%
Human services 305,163 289,643 -5.09% 146,992 157,351 7.05% 7,473 7,935 6.18%
Information technology 320,726 196,114 -38.85% 130,802 141,954 8.53% 4,209 3,540 -15.89%
Law, public safety, and security 68,781 74,561 8.40% 193,517 210,125 8.58% 10,816 11,195 3.50%
Manufacturing 124,105 126,988 2.32% 125,413 127,809 1.91% 12,190 9,861 -19.11%
Market sales and service 144,652 140,764 -2.69% 33,880 36,393 7.42% 1,138 5,131 350.88%
Science, technology, engineering, and mathematics
148,808 175,323 17.82% 51,166 53,163 3.90% 614 2,810 357.65%
Transportation, distribution, and logistics
138,212 133,154 -3.66% 84,223 90,095 6.97% 16,210 10,612 -34.53%
Career cluster areasb
Secondary CTE concentratorsa Postsecondary CTE concentratorsa Adult CTE concentratorsa
† No data applicable to the cell. a See Appendix A, table A-1, for each state’s definition of CTE concentrator in CTE programs at the secondary and postsecondary levels for PY 2010–11. Florida, Louisiana, Missouri, Ohio, Oklahoma, and Tennessee provided performance levels and report data for their adult-level CTE concentrators using the Perkins IV Sec. 113(b)(2)(B) postsecondary core indicators and performance levels. b Based on the National Career Clusters Framework (http://www.careertech.org/career-clusters/glance/clusters.html). Each career cluster represents a distinct grouping of occupations and industries based on the knowledge and skills CTE students require. NOTE: CTE means career and technical education. Perkins IV means the Carl D. Perkins Career and Technical Education Act of 2006. PY means program year. All negative percentages (shown in bold font) indicate a decrease from PY 2009–10 to PY 2010–11 in the enrollment of CTE concentrators. The percent figures in the total row for the secondary, postsecondary, and adult percentage difference columns represent the percentage decrease. The enrollment amounts in each of the other columns are summative in the total row.
Notes continued on next page.

STATE PERFORMANCE DATA 27
Table 6. Enrollment comparison of CTE concentrators in CTE programs, by career cluster area: Program years 2009–10 and 2010–11—Continued
The 50 U.S. states, the District of Columbia, the Commonwealth of Puerto Rico, and three of the outlying areas—the United States Virgin Islands, Guam, and Republic of Palau—were required to report data and information under Perkins IV for PY 2010–11. The Republic of Palau did not submit data or information because it did not have a fully approved state plan. The United States Virgin Islands consolidated its Perkins IV, Title I, allotment with funds under other formula programs and used some of the funds in a consolidation grant for Perkins IV, Title I, purposes. American Samoa and the Commonwealth of the Northern Mariana Islands did not submit data or information for CTE programs because they consolidated their Perkins IV, Title I, allotments with funds under other formula programs and used these funds for allowable program purposes rather than for career and technical education. Thus, the CTE data reported for PY 2010–11 represent 54 of the 57 states that received Perkins IV state grants.
SOURCE: U.S. Department of Education, Office of Vocational and Adult Education, Consolidated Annual Report (CAR) for the Carl D. Perkins Career and Technical Education Act of 2006 for PY 2010–11 (OMB Number 1830-0569).
Finally, states reported in PY 2010–11 that 920,195 participants at the secondary level and 208,429 participants at the postsecondary level were enrolled in tech prep programs funded under Title II of Perkins IV as indicated in table 7.73 Comparisons to tech prep enrollment in pre-2009–10 reports to Congress are not possible because 28 states74 used the provision under Sec. 202(a) of Perkins IV that allows them to consolidate all or a portion of their Perkins IV, Title II, funds with their Perkins IV, Title I, funds and no longer administer or report data on separate tech prep programs.
Table 7 presents states’ tech prep enrollment data by gender, race/ethnicity, and special populations and other student categories for the 24 states75 that operated tech prep programs during PY 2010-11. Enrollments by disaggregated categories include duplicate counts. For example, a student may not only have disabilities but also be economically disadvantaged, in addition to being either male or female and a member of a racial or ethnic group.
73 The enrollment totals stated here reference the approximated totals under the gender category for secondary and postsecondary education, respectively, in table 7. The enrollment totals for disaggregated categories of gender and race/ethnicity do not correspond to each other in this table because a few states did not submit disaggregated data on CTE participants for one or more categories. 74 The states that consolidated all their Perkins IV, Title II, funds with their Perkins IV, Title I, funds were Arkansas, Colorado, Connecticut, District of Columbia, Florida, Georgia, Hawaii, Idaho, Kansas, Kentucky, Louisiana, Maine, Maryland, Minnesota, Nebraska, Nevada, New Hampshire, New Jersey, North Dakota, Oregon, Puerto Rico, Rhode Island, South Carolina, Tennessee, Utah, Vermont, and Wyoming. Alabama consolidated a portion of its Perkins IV, Title II, funds with its Perkins IV, Title I, funds. 75 The states that did not consolidate their Perkins IV, Title II, funds with their Perkins IV, Title I, funds and operated Tech Prep programs were: Alaska, Arizona, California, Delaware, Illinois, Indiana, Iowa, Massachusetts, Michigan, Mississippi, Missouri, Montana, New Mexico, New York, North Carolina, Ohio, Oklahoma, Pennsylvania, South Dakota, Texas, Virginia, Washington, West Virginia, and Wisconsin. In addition, Alabama operated a Tech Prep program because it consolidated a portion of its Perkins IV, Title II, funds with its Perkins IV, Title I, funds.
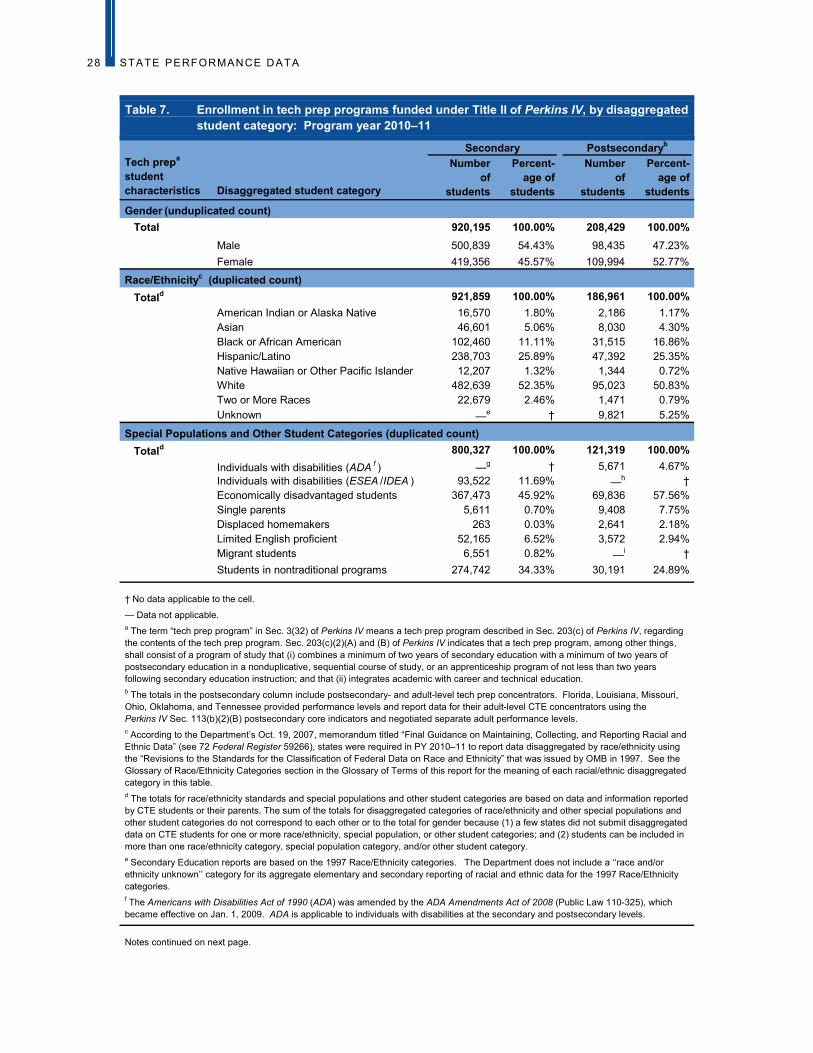
28 STATE PERFORMANCE DATA
Table 7. Enrollment in tech prep programs funded under Title II of Perkins IV, by disaggregated student category: Program year 2010–11
Secondary Postsecondaryb
Tech prepa
student characteristics Disaggregated student category
Number of
students
Percent-age of
students
Number of
students
Percent-age of
students
Gender (unduplicated count)Total 920,195 100.00% 208,429 100.00%
Male 500,839 54.43% 98,435 47.23%Female 419,356 45.57% 109,994 52.77%
Race/Ethnicityc (duplicated count)Totald 921,859 100.00% 186,961 100.00%
American Indian or Alaska Native 16,570 1.80% 2,186 1.17%Asian 46,601 5.06% 8,030 4.30%Black or African American 102,460 11.11% 31,515 16.86%Hispanic/Latino 238,703 25.89% 47,392 25.35%Native Hawaiian or Other Pacific Islander 12,207 1.32% 1,344 0.72%White 482,639 52.35% 95,023 50.83%Two or More Races 22,679 2.46% 1,471 0.79%Unknown e— † 9,821 5.25%
Special Populations and Other Student Categories (duplicated count)Totald 800,327 100.00% 121,319 100.00%
Individuals with disabilities (ADA f ) g— † 5,671 4.67%Individuals with disabilities (ESEA /IDEA ) 93,522 11.69% h— †Economically disadvantaged students 367,473 45.92% 69,836 57.56%Single parents 5,611 0.70% 9,408 7.75%Displaced homemakers 263 0.03% 2,641 2.18%Limited English proficient 52,165 6.52% 3,572 2.94%Migrant students 6,551 0.82% i— †Students in nontraditional programs 274,742 34.33% 30,191 24.89%
† No data applicable to the cell.
— Data not applicable. a The term “tech prep program” in Sec. 3(32) of Perkins IV means a tech prep program described in Sec. 203(c) of Perkins IV, regarding the contents of the tech prep program. Sec. 203(c)(2)(A) and (B) of Perkins IV indicates that a tech prep program, among other things, shall consist of a program of study that (i) combines a minimum of two years of secondary education with a minimum of two years of postsecondary education in a nonduplicative, sequential course of study, or an apprenticeship program of not less than two years following secondary education instruction; and that (ii) integrates academic with career and technical education. b The totals in the postsecondary column include postsecondary- and adult-level tech prep concentrators. Florida, Louisiana, Missouri, Ohio, Oklahoma, and Tennessee provided performance levels and report data for their adult-level CTE concentrators using the Perkins IV Sec. 113(b)(2)(B) postsecondary core indicators and negotiated separate adult performance levels. c According to the Department’s Oct. 19, 2007, memorandum titled “Final Guidance on Maintaining, Collecting, and Reporting Racial and Ethnic Data” (see 72 Federal Register 59266), states were required in PY 2010–11 to report data disaggregated by race/ethnicity using the “Revisions to the Standards for the Classification of Federal Data on Race and Ethnicity” that was issued by OMB in 1997. See the Glossary of Race/Ethnicity Categories section in the Glossary of Terms of this report for the meaning of each racial/ethnic disaggregated category in this table. d The totals for race/ethnicity standards and special populations and other student categories are based on data and information reported by CTE students or their parents. The sum of the totals for disaggregated categories of race/ethnicity and other special populations and other student categories do not correspond to each other or to the total for gender because (1) a few states did not submit disaggregated data on CTE students for one or more race/ethnicity, special population, or other student categories; and (2) students can be included in more than one race/ethnicity category, special population category, and/or other student category. e Secondary Education reports are based on the 1997 Race/Ethnicity categories. The Department does not include a ‘‘race and/or ethnicity unknown’’ category for its aggregate elementary and secondary reporting of racial and ethnic data for the 1997 Race/Ethnicity categories. f The Americans with Disabilities Act of 1990 (ADA) was amended by the ADA Amendments Act of 2008 (Public Law 110-325), which became effective on Jan. 1, 2009. ADA is applicable to individuals with disabilities at the secondary and postsecondary levels.
Notes continued on next page.

STATE PERFORMANCE DATA 29
Table 7. Enrollment in tech prep programs funded under Title II of Perkins IV, by disaggregated student category: Program year 2010–11—Continued
g While ADA is applicable to individuals with disabilities in secondary and postsecondary education, for reporting purposes, the states reported ADA data only for the postsecondary populations. h ESEA and the Individuals with Disabilities Education Act (IDEA) are applicable to only those students at the secondary level. “Individuals with disability” in ESEA refers to “disability status,” as used in Sec. 1111(h)(1)(C)(i) of ESEA, and refers to a “child with a disability,” which under Sec. 9101(5) of ESEA has the same meaning as the term is used in Sec. 602 of IDEA. The term an “individual with a disability” as defined in Sec. 602(3)(A) of IDEA, refers to a “child with a disability,” which means a child “(i) with mental retardation, hearing impairments (including deafness), speech or language impairments, visual impairments (including blindness), serious emotional disturbance (referred to in this title as ‘emotional disturbance’), orthopedic impairments, autism, traumatic brain injury, other health impairments, or specific learning disabilities; and (ii) who, by reason thereof, needs special education and related services.” i The category “migrant students” is applicable only to students in the migrant status category under ESEA and therefore does not include students at the postsecondary level.
NOTE: Perkins IV means the Carl D. Perkins Career and Technical Education Act of 2006. There is a variation of total value of the cells in the gender section compared with the total value of the cells in the race/ethnicity sections because of states’ varying abilities to track race/ethnicity data compared with gender data. The percentage of students is by disaggregated category at the secondary and postsecondary levels. Therefore, the percentage totals are not summative horizontally.
The 50 U.S. states, the District of Columbia, the Commonwealth of Puerto Rico, and three of the outlying areas—the United States Virgin Islands, Guam, and Republic of Palau—were required to report data and information under Perkins IV for PY 2010–11. The Republic of Palau did not submit data or information because it did not have a fully approved state plan. The Virgin Islands consolidated its Perkins IV, Title I, allotment with funds under other formula programs and used some of the funds in a consolidation grant for Perkins IV, Title I, purposes. American Samoa and the Commonwealth of the Northern Mariana Islands did not submit data or information for CTE programs because they consolidated their Perkins IV, Title I, allotments with funds under other formula programs and used these funds for allowable program purposes rather than for career and technical education. The 25 states that elected to offer tech programs in PY 2010–11 were Alabama, Alaska, Arizona, California, Delaware, Illinois, Indiana, Iowa, Massachusetts, Michigan, Mississippi, Missouri, Montana, New Mexico, New York, North Carolina, Ohio, Oklahoma, Pennsylvania, South Dakota, Texas, Virginia, Washington, West Virginia, and Wisconsin.
SOURCE: U.S. Department of Education, Office of Vocational and Adult Education, Consolidated Annual Report (CAR) for the Carl D. Perkins Career and Technical Education Act of 2006 for PY 2010–11 (OMB Number 1830-0569).

30 STATE PERFORMANCE DATA
B. States’ Progress in Meeting Their PY 2010–11 Performance Levels for the Perkins IV Sec. 113(b) Core Indicators
Appendix B provides individual state profiles containing performance data on each of the secondary and postsecondary Perkins IV Sec. 113(b) core indicators that states76 were required to report to the Department for PY 201077–11. Each state provides disaggregated data by gender; race/ethnicity; and special population and other student categories. States that chose not to consolidate all of their Perkins IV, Title II, tech prep funds, also submitted disaggregated data for their tech prep concentrators. Each special population and other student category is defined in the Glossary of Terms section of this report.
This report presents data that states submitted to the Department for PY 2010–11. State directors were required to certify the accuracy and completeness of their state data by signing their state data submissions. State directors who submitted their state data electronically to the Department certified the accuracy and completeness of their data using an electronic personal identification number (PIN).
Each state reports data on the Perkins IV Sec. 113(b) core indicators for students identified by the state as CTE concentrators at the secondary and postsecondary levels (see Appendix A, table A-1). Although the definition varies among states, generally states define a CTE concentrator as a student who has completed three or more CTE courses at the secondary level or at least 12 units of credit at the postsecondary level.
Differences across states in definitions of CTE concentrators and in the size of student populations could make the small number of students in a category of disaggregated data provided by states personally identifiable or insufficient to yield statistically reliable information. Therefore, in the state profiles in Appendix B, the Department masked data in certain cells. Specifically, where a state reported actual performance data above 95 percent or below 10 percent, the cell was coded as > 95 percent or < 10 percent, respectively. The Department continues to examine whether this action appropriately makes data available to the public, as
76 Of the 57 states that received grants under Perkins IV, Title I, for PY 2010–11, three did not submit CTE data. The Republic of Palau did not have a fully approved state plan under Perkins IV and therefore did not submit any data to the Department under Perkins IV. American Samoa and the Commonwealth of the Northern Mariana Islands did not submit data for CTE programs because they consolidated their Perkins IV, Title I, allotments with funds under other formula programs and used these funds for allowable program purposes rather than for CTE. 77 Six states—Florida, Louisiana, Missouri, Ohio, Oklahoma, and Tennessee—negotiate separate performance levels for reporting data for their adult-level CTE students using the Perkins IV Sec. 113(b)(2)(B) postsecondary core indicators.
STATE PERFORMANCE DATA 31
required by Sec. 113(c)(5) of Perkins IV, while ensuring that the available data are neither personally identifiable nor statistically unreliable as required by Sec. 113(c) of Perkins IV.
Secondary
In PY 2010–11, secondary career and technical education concentrator enrollment was 0.41 percent lower under Title I of Perkins IV, compared to PY 2009–10 (table 6).
Thirteen of 54 or 24 percent of the states that reported CTE data met or exceeded all of their secondary performance levels on the required Perkins IV Sec. 113(b) core indicators for PY 2010–11 (table 8). During PY 2010–11, 44 of 54 states that reported CTE data met or exceeded their performance levels for secondary completion, and 36 of 54 states that reported CTE data met or exceeded their performance levels for secondary technical skill attainment (table 8). Figure 6 provides the number of states that met or exceeded their secondary performance levels for the Perkins IV Sec. 113(b) core indicators for CTE students. Finally, 49 of the 52 states that reported secondary graduation rates for all students and CTE concentrators,78 or 94 percent of states, reported an 80 percent or higher secondary graduation rate for CTE students (table 9).
Forty-four percent or 24 of 54 states that reported data met their performance levels by at least 90 percent79 for all of their secondary core indicators in PY 2010–11 (table 8). The other 56 percent or 30 states failed to meet one or more of their secondary performance levels by at least 90 percent and were required to develop and implement a program improvement plan during the succeeding program year, pursuant to Sec. 123(a)(1) of Perkins IV (table 8). The range of core indicators missed by states was from zero to five indicators of the eight secondary core indicators. Figure 7 provides the total number of states that met their performance levels by at least 90 percent for the Perkins IV Sec. 113(b) core indicators for secondary CTE students.
78 Only the 50 U.S. states, the District of Columbia, and the Commonwealth of Puerto Rico were required to and did report on academic achievement and general statewide graduation rates under the Elementary and Secondary Education Act (ESEA) to the Office of Elementary and Secondary Education in the Education Data Exchange Network (EDEN). Guam and the United States Virgin Islands were not required to submit secondary school graduation data under ESEA. Thus, 52 states reported data on statewide graduation rates. 79 Sec. 123(a)(1) of the Carl D. Perkins Career and Technical Education Act of 2006 states: “If a State fails to meet at least 90 percent of an agreed upon State adjusted level of performance for any of the core indicators of performance described in section 113(b)(3), the eligible agency shall develop and implement a program improvement plan (with special consideration to performance gaps identified under section 113(c)(2)) in consultation with the appropriate agencies, individuals, and organizations during the first program year succeeding the program year for which the eligible agency failed to so meet the State adjusted level of performance for any of the core indicators of performance.”

32 STATE PERFORMANCE DATA
Table 8 identifies those states that met or exceeded their secondary performance levels and those states that met their secondary performance levels by at least 90 percent. The table designates those states that met or exceeded their performance levels with the letter “E,” and those states that met their performance levels by at least 90 percent with the letter “M.”
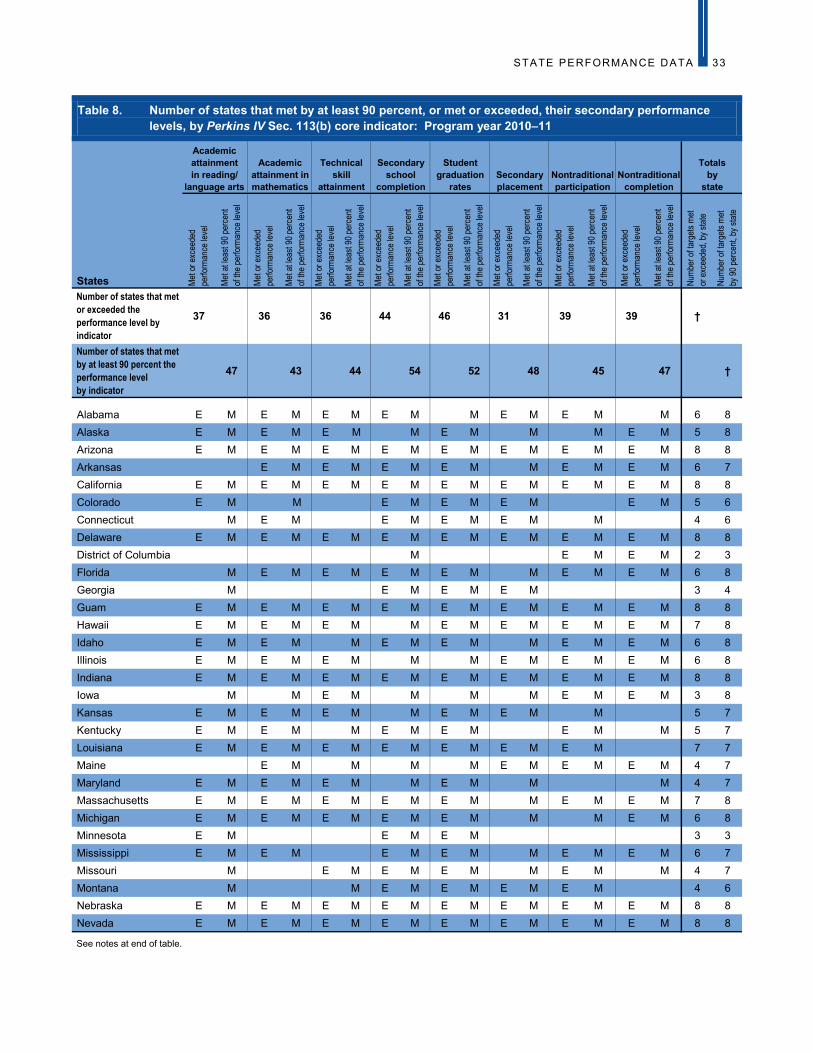
STATE PERFORMANCE DATA 33
Table 8. Number of states that met by at least 90 percent, or met or exceeded, their secondary performance levels, by Perkins IV Sec. 113(b) core indicator: Program year 2010–11
States
Academic attainment in reading/
language arts
Academicattainment inmathematics
Technicalskill
attainment
Secondaryschool
completion
Studentgraduation
ratesSecondaryplacement
Nontraditional Nontraditionalparticipation completion
Totalsby
stateMe
t or e
xcee
ded
perfo
rman
ce le
vel
Met a
t leas
t 90 p
erce
nt of
the pe
rform
ance
leve
l
Met o
r exc
eede
d pe
rform
ance
leve
l
Met a
t leas
t 90 p
erce
nt of
the pe
rform
ance
leve
l
Met o
r exc
eede
d pe
rform
ance
leve
l
Met a
t leas
t 90 p
erce
nt of
the pe
rform
ance
leve
l
Met o
r exc
eede
d pe
rform
ance
leve
l
Met a
t leas
t 90 p
erce
nt of
the pe
rform
ance
leve
l
Met o
r exc
eede
d pe
rform
ance
leve
l
Met a
t leas
t 90 p
erce
nt of
the pe
rform
ance
leve
l
Met o
r exc
eede
d pe
rform
ance
leve
l
Met a
t leas
t 90 p
erce
nt of
the pe
rform
ance
leve
l
Met o
r exc
eede
d pe
rform
ance
leve
l
Met a
t leas
t 90 p
erce
nt of
the pe
rform
ance
leve
l
Met o
r exc
eede
d pe
rform
ance
leve
l
Met a
t leas
t 90 p
erce
nt of
the pe
rform
ance
leve
l
Numb
er of
targ
ets m
et or
exce
eded
, by s
tate
Numb
er of
targ
ets m
et by
90 pe
rcent,
by st
ate
Number of states that met or exceeded the performance level by indicator
37 36 36 44 46 31 39 39 †
Number of states that met by at least 90 percent the performance level by indicator
47 43 44 54 52 48 45 47 †
Alabama E M E M E M E M M E M E M M 6 8Alaska E M E M E M M E M M M E M 5 8Arizona E M E M E M E M E M E M E M E M 8 8Arkansas E M E M E M E M M E M E M 6 7California E M E M E M E M E M E M E M E M 8 8Colorado E M M E M E M E M E M 5 6Connecticut M E M E M E M E M M 4 6Delaware E M E M E M E M E M E M E M E M 8 8District of Columbia M E M E M 2 3Florida M E M E M E M E M M E M E M 6 8Georgia M E M E M E M 3 4Guam E M E M E M E M E M E M E M E M 8 8Hawaii E M E M E M M E M E M E M E M 7 8Idaho E M E M M E M E M M E M E M 6 8Illinois E M E M E M M M E M E M E M 6 8Indiana E M E M E M E M E M E M E M E M 8 8Iowa M M E M M M M E M E M 3 8Kansas E M E M E M M E M E M M 5 7Kentucky E M E M M E M E M E M M 5 7Louisiana E M E M E M E M E M E M E M 7 7Maine E M M M M E M E M E M 4 7Maryland E M E M E M M E M M M 4 7Massachusetts E M E M E M E M E M M E M E M 7 8Michigan E M E M E M E M E M M M E M 6 8Minnesota E M E M E M 3 3Mississippi E M E M E M E M M E M E M 6 7Missouri M E M E M E M M E M M 4 7MontanaNebraska E
MM E M E
MM
EE
MM
EE
MM
EE
MM
EE
MM E M
48
68
Nevada E M E M E M E M E M E M E M E M 8 8
See notes at end of table.

34 STATE PERFORMANCE DATA
Table 8. Number of states that met by at least 90 percent, or met or exceeded, their secondary performance levels, by Perkins IV Sec. 113(b) core indicator: Program year 2010–11—Continued
† No data applicable to the cell. E State met or exceeded their performance level. M State met their performance level by at least 90 percent. NP Data not provided. Blank space means that the state did not meet the performance level. a The Republic of Palau did not have a fully approved state plan under Perkins IV for PY 2010–11; therefore, it did not report enrollment data for PY 2010–11. b The United States Virgin Islands received its allotted Perkins IV funds consolidated with funds allotted under other formula grant programs and used some of the funds in the consolidated grant for Perkins IV, Title I, purposes. NOTE: The term “state” in Sec. 3(30) of Perkins IV means, unless otherwise specified, each of the 50 states of the United States, the District of Columbia, the Commonwealth of Puerto Rico, and each outlying area. The term “state” as it is used in this report consists of each jurisdiction of the United States, including the 50 states of the United States, the District of Columbia, the Commonwealth of Puerto Rico; and the outlying areas of the United States Virgin Islands, Guam, American Samoa, the Commonwealth of the Northern Mariana Islands, and the Republic of Palau. The core indicators of performance are as specified in Sec. 113(b)(2)(A) of Perkins IV. Perkins IV means the Carl D. Perkins Career and Technical Education Act of 2006. The 50 U.S. states, the District of Columbia, the Commonwealth of Puerto Rico, and three of the outlying areas—the United States Virgin Islands, Guam, and the Republic of Palau—were required to report data and information under Perkins IV for PY 2010–11. American Samoa and the Commonwealth of the Northern Mariana Islands did not submit data or information for CTE programs because they consolidated their Perkins IV, Title I, allotments with funds under other formula programs and used these funds for allowable program purposes rather than for career and technical education. Of the 57 states that received Perkins IV state grants for PY 2010–11, the CTE data reported above represent 54 states. SOURCE: U.S. Department of Education, Office of Vocational and Adult Education, Consolidated Annual Report (CAR) for the Carl D. Perkins Career and Technical Education Act of 2006 for PY 2010–11 (OMB Number 1830-0569).
States
Academic attainment in reading/
language arts
Academicattainment inmathematics
Technicalskill
attainment
Secondaryschool
completion
Studentgraduation
ratesSecondaryplacement
Nontraditionalparticipation
Nontraditionalcompletion
Totalsby
stateMe
t or e
xcee
ded
perfo
rman
ce le
vel
Met a
t leas
t 90 p
erce
nt of
the pe
rform
ance
leve
l
Met o
r exc
eede
d pe
rform
ance
leve
l
Met a
t leas
t 90 p
erce
nt of
the pe
rform
ance
leve
l
Met o
r exc
eede
d pe
rform
ance
leve
l
Met a
t leas
t 90 p
erce
nt of
the pe
rform
ance
leve
l
Met o
r exc
eede
d pe
rform
ance
leve
l
Met a
t leas
t 90 p
erce
nt of
the pe
rform
ance
leve
l
Met o
r exc
eede
d pe
rform
ance
leve
l
Met a
t leas
t 90 p
erce
nt of
the pe
rform
ance
leve
l
Met o
r exc
eede
d pe
rform
ance
leve
l
Met a
t leas
t 90 p
erce
nt of
the pe
rform
ance
leve
l
Met o
r exc
eede
d pe
rform
ance
leve
l
Met a
t leas
t 90 p
erce
nt of
the pe
rform
ance
leve
l
Met o
r exc
eede
d pe
rform
ance
leve
l
Met a
t leas
t 90 p
erce
nt of
the pe
rform
ance
leve
l
Numb
er of
targ
ets m
et or
exce
eded
, by s
tate
Numb
er of
targ
ets m
et by
90 pe
rcent,
by st
ate
New Hampshire E M M E M E M E M E M E M 6 7New Jersey E M M M E M E M E M E M E M 6 8New Mexico M E M M M M E M E M E M 4 8New York E M E M E M E M E M E M E M E M 8 8North Carolina E M M E M E M M E M E M 5 7North Dakota M E M E M E M E M E M E M 6 7Ohio E M E M E M E M E M E M E M E M 8 8Oklahoma E M E M M E M E M E M 5 6Oregon E M M E M M E M E M E M 5 7Pennsylvania E M E M E M E M E M M M 5 7Puerto Rico M E M E M M E M E M 4 6
aRepublic of Palau NP NP NP NP NP NP NP NP NP NP NP NP NP NP NP NP NP NPRhode Island E M E M E M E M E M E M E M E M 8 8South Carolina M E M E M E M E M M M 4 7South Dakota E M E M E M E M E M E M E M 7 7Tennessee E M E M E M E M E M E M E M E M 8 8Texas E M E M E M E M M E M E M 6 7United States Virgin Islandsb E M E M E M E M E M E M 6 6
Utah E M E M E M E M M M 4 6Vermont E M E M E M M E M M 4 6Virginia E M E M E M E M E M E M E M E M 8 8Washington E M E M M E M E M 4 5West Virginia E M E M E M E M M E M 5 6Wisconsin M M E M E M E M M E M 4 7Wyoming E M E M E M E M E M E M E M E M 8 8

STATE PERFORMANCE DATA 35
Figure 6 presents the total number of states out of 54 states that met or exceeded their agreed-upon secondary performance levels, by indicator, for PY 2010–11. The four most frequently met secondary core indicators were: (1) student graduation rates, with 46 states (including Guam and the United States Virgin Islands); (2) secondary school completion, with 44 states (including Guam, the Commonwealth of Puerto Rico, and the United States Virgin Islands); (3) nontraditional participation, with 39 states (including the District of Columbia, Guam, the Commonwealth of Puerto Rico, and the United States Virgin Islands), and nontraditional completion, with 39 states (including the District of Columbia, Guam, the Commonwealth of Puerto Rico, and the United States Virgin Islands); and (4) academic attainment in reading and language arts, with 37 states (including Guam).

36 STATE PERFORMANCE DATA
Figure 6. Number of states that met or exceeded secondary performance levels, by Perkins IV Sec. 113(b) secondary core indicator: Program year 2010–11
37 36 36
44 46
31
39 39
0
20
40
60
Academicattainmentin reading/
language arts
Academicattainment
inmathematics
Technicalskill
attainment
Secondaryschool
completion
Studentgraduation
rates
Secondaryplacement
Nontraditionalparticipation
Nontraditionalcompletion
Number of states
Secondary core indicators*
Number of states that met or exceeded the performance level by indicator
* The core indicators of performance as specified in Sec. 113(b)(2)(A) of Perkins IV.
NOTE: The term “state” in Sec. 3(30) of Perkins IV means, unless otherwise specified, each of the 50 states of the United States, the District of Columbia, the Commonwealth of Puerto Rico, and each outlying area. The term “state” as it is used in this report consists of each jurisdiction of the United States, including the 50 states of the United States, the District of Columbia, the Commonwealth of Puerto Rico; and the outlying areas of the United States Virgin Islands, Guam, American Samoa, the Commonwealth of the Northern Mariana Islands, and the Republic of Palau. Perkins IV means the Carl D. Perkins Career and Technical Education Act of 2006. The 50 U.S. states, the District of Columbia, the Commonwealth of Puerto Rico, and three of the outlying areas—the United States Virgin Islands, Guam, and Republic of Palau—were required to report data and information under Perkins IV for PY 2010–11. The Republic of Palau did not submit data or information because it did not have a fully approved state plan. The Virgin Islands consolidated its Perkins IV, Title I, allotment with funds under other formula programs and used some of the funds in a consolidation grant for Perkins IV, Title I, purposes. American Samoa and the Commonwealth of the Northern Mariana Islands do not submit data or information for CTE programs because they consolidated their Perkins IV, Title I, allotments with funds under other formula programs and used these funds for allowable program purposes rather than for career and technical education. Thus, the CTE data reported for PY 2010–11 represent 54 of the 57 states that received Perkins IV state grants.
The number of states meeting or exceeding their secondary performance levels are as follows: (1) academic attainment in reading/language arts—37 states (including Guam); (2) academic attainment in mathematics—36 states (including Guam and the United States Virgin Islands); (3) technical skill attainment—36 states (including the Guam, the Commonwealth of Puerto Rico, and the United States Virgin Islands); (4) secondary school completion—44 states (including Guam, the Commonwealth of Puerto Rico, and the United States Virgin Islands); (5) student graduation rates—46 states (including Guam and the United States Virgin Islands); (6) secondary placement—31 states (including Guam); (7) nontraditional participation—39 states (including the District of Columbia, Guam, the Commonwealth of Puerto Rico, and the United States Virgin Islands); and (8) nontraditional completion—39 states (including the District of Columbia, Guam, the Commonwealth of Puerto Rico, and the United States Virgin Islands) (table 8).
SOURCE: U.S. Department of Education, Office of Vocational and Adult Education, Consolidated Annual Report (CAR) for the Carl D. Perkins Career and Technical Education Act of 2006 for PY 2010–11 (OMB Number 1830-0569).
STATE PERFORMANCE DATA 37
Figure 7 presents the total number of states out of 54 states that met their secondary performance levels by at least 90 percent, by indicator, for PY 2010–11. The secondary core indicators most frequently met by at least 90 percent were (1) secondary school completion, with 54 states (including the District of Columbia, Guam, the Commonwealth of Puerto Rico, and the United States Virgin Islands); (2) student graduation rates, with 52 states (including Guam, the Commonwealth of Puerto Rico, and the United States Virgin Islands); (3) secondary placement, with 48 states (including Guam); and (4) academic attainment in reading and language arts, with 47 states (including Guam and the Commonwealth of Puerto Rico), and nontraditional completion, with 47 states (including the District of Columbia, Guam, the Commonwealth of Puerto Rico, and the United States Virgin Islands).
Table 9 and Figure 8 provide comparisons of secondary graduation rates for all students and CTE students, by state, for PY 2010–11. As evidenced by the data, 87 percent, or 45 of the 52 states that reported complete data on statewide and CTE graduation data, reported having higher graduation rates for CTE students, as compared to the overall state graduation rate of all students in their respective states.

38 STATE PERFORMANCE DATA
Figure 7. Number of states that met the secondary performance levels by at least 90 percent, by Perkins IV Sec. 113(b) core indicator: Program year 2010–11
47 43 44
54 52 48
45 47
0
20
40
60
Academicattainmentin reading/
language arts
Academicattainment
inmathematics
Technicalskill
attainment
Secondaryschool
completion
Studentgraduation
rates
Secondaryplacement
Nontraditionalparticipation
Nontraditionalcompletion
Number of states
Secondary core indicators*
Number of states that met the performance levels by at least 90 percent by indicator
* The core indicators of performance as specified in Sec. 113(b)(2)(A) of Perkins IV.
NOTE: The term “state” in Sec. 3(30) of Perkins IV means, unless otherwise specified, each of the 50 states of the United States, the District of Columbia, the Commonwealth of Puerto Rico, and each outlying area. The term “state” as it is used in this report consists of each jurisdiction of the United States, including the 50 states of the United States, the District of Columbia, the Commonwealth of Puerto Rico; and the outlying areas of the United States Virgin Islands, Guam, American Samoa, the Commonwealth of the Northern Mariana Islands, and the Republic of Palau. Perkins IV means the Carl D. Perkins Career and Technical Education Act of 2006. The 50 U.S. states, the District of Columbia, the Commonwealth of Puerto Rico, and three of the outlying areas—the United States Virgin Islands, Guam, and Republic of Palau—were required to report data and information under Perkins IV for PY 2010–11. The Republic of Palau did not submit data or information because it did not have a fully approved state plan. The Virgin Islands consolidated its Perkins IV, Title I allotment with funds under other formula programs and used some of the funds in a consolidation grant for Perkins IV, Title I, purposes. American Samoa and the Commonwealth of the Northern Mariana Islands do not submit data or information for CTE programs because they consolidated their Perkins IV, Title I, allotments with funds under other formula programs and used these funds for allowable program purposes rather than for career and technical education. Thus, the CTE data reported for PY 2010–11 represent 54 of the 57 states that received Perkins IV state grants.
The number of states that met their secondary performance levels by at least 90 percent are as follows: (1) academic attainment in reading/language arts—47 states (including Guam and the Commonwealth of Puerto Rico); (2) academic attainment in mathematics—43 states (including Guam and the United States Virgin Islands); (3) technical skill attainment—44 states (including Guam, the Commonwealth of Puerto Rico, and the United States Virgin Islands); (4) secondary school completion—54 states (including the District of Columbia, Guam, the Commonwealth of Puerto Rico, and the United States Virgin Islands); (5) student graduation rates—52 states (including Guam, the Commonwealth of Puerto Rico, and the United States Virgin Islands); (6) secondary placement—48 states (including Guam); (7) nontraditional participation—45 states (including the District of Columbia, Guam, the Commonwealth of Puerto Rico, and the United States Virgin Islands); and (8) nontraditional completion—47 states (including the District of Columbia, Guam, the Commonwealth of Puerto Rico, and the United States Virgin Islands) (table 8).
SOURCE: U.S. Department of Education, Office of Vocational and Adult Education, Consolidated Annual Report (CAR) for the Carl D. Perkins Career and Technical Education Act of 2006 for PY 2010–11 (OMB Number 1830-0569).

STATE PERFORMANCE DATA 39
Table 9. Comparison of secondary graduation rates for all students and CTE concentrators, by state: Program year 2010–11
State
State graduation rate for all students
State graduation rate
a for CTE concentrators
Difference between CTE concentrators
and all students graduation rates
Alabama 88 84 -4
Alaska 68 90 23
Arizona 78 98 21
Arkansas 85 94 9
California 81 92 11
Colorado 73 84 12
Connecticut 91 90 -1
Delaware 87 97 11
District of Columbia 76 47 -29
Florida 78 94 15
Georgia 81 90 10
Guam b— 83 †
Hawaii 80 98 19
Idaho 92 98 6
Illinois 88 91 4
Indiana 84 92 8
Iowa 89 91 2
Kansas 80 99 18
Kentucky 77 97 20
Louisiana 67 89 22
Maine 82 93 11
Maryland 87 99 12
Massachusetts 82 89 7
Michigan 76 94 18
Minnesota 92 97 5
Mississippi 73 94 21
Missouri 86 95 9
Montana 81 96 16
Nebraska 89 99 10
Nevada 70 68 -2
New Hampshire 85 95 10
New Jersey 95 100 5
New Mexico 67 87 20
New York 76 85 9
North Carolina 74 90 15
North Dakota 88 92 5
Ohio 84 99 14
Oklahoma 82 86 5
Oregon 85 85 0
Pennsylvania 91 98 7
See notes at end of table.

40 STATE PERFORMANCE DATA
Table 9. Comparison of secondary graduation rates for all students and CTE concentrators, by state: Program year 2010–11—Continued
State
State graduation rate for all students
State graduation rate
a for CTE concentrators
Difference between CTE concentrators
and all students graduation rates
Puerto Rico 98 93 -5
Republic of Palau NP NP †
Rhode Island 76 94 18
South Carolina 72 97 25
South Dakota 89 97 8
Tennessee 89 96 7
Texas 84 96 11
United States Virgin Islands b— 93 †
Utah 90 95 5
Vermont 88 97 9
Virginia 80 99 19
Washington 83 44 -38
West Virginia 84 97 13
Wisconsin 90 96 6
Wyoming 80 95 15 † No data applicable to the cell.
NP Data not provided
— Data not applicable. a See Appendix A, table A-1, for each state’s definition of CTE concentrator. b Guam and the United States Virgin Islands were not required to submit secondary graduation data under the Elementary and Secondary Education Act (ESEA).
NOTE: The term “state” in Sec. 3(30) of Perkins IV means, unless otherwise specified, each of the 50 states of the United States, the District of Columbia, the Commonwealth of Puerto Rico, and each outlying area. The term “state” as it is used in this report consists of each jurisdiction of the United States, including the 50 states of the United States, the District of Columbia, the Commonwealth of Puerto Rico; and the outlying areas of the United States Virgin Islands, Guam, American Samoa, the Commonwealth of the Northern Mariana Islands, and the Republic of Palau. CTE means career and technical education. The 50 U.S. states, the District of Columbia, the Commonwealth of Puerto Rico, and three of the outlying areas—the United States Virgin Islands, Guam, and Republic of Palau—were required to report data and information under Perkins IV for PY 2010–11. The United States Virgin Islands consolidated its Perkins IV, Title I, allotment with funds under other formula programs and used some of the funds in a consolidation grant for Perkins IV, Title I, purposes. The Republic of Palau did not submit data or information because it did not have a fully approved state plan. American Samoa and the Commonwealth of the Northern Mariana Islands did not submit data or information for CTE programs because they consolidated their Perkins IV, Title I, allotments with funds under other formula programs and used these funds for allowable program purposes rather than for career and technical education. Of the 57 states that received Perkins IV state grants for PY 2010–11, the CTE data reported above represent 54 states.
Statewide graduation data represent the actual school year 2010–11 and the Consolidated State Performance Report school year 2010–11. Of the states that reported graduation data for CTE students under Perkins IV, the 50 U.S. states, the District of Columbia, and the Commonwealth of Puerto Rico were required to and did report on general statewide graduation rates under the ESEA to the Office of Elementary and Secondary Education in the Education Data Exchange Network (EDEN).
SOURCE: U.S. Department of Education, Consolidated State Performance Report for PY 2010–11, and Office of Vocational and Adult Education, Consolidated Annual Report (CAR) for the Carl D. Perkins Career and Technical Education Act of 2006 for PY 2010–11 (OMB Number 1830-0569).

STATE PERFORMANCE DATA 41
Figure 8. Comparison of secondary graduation rates for all students and CTE concentrators, by state: Program year 2010–11
95
68
99
96
95
94
97
94
89
99
93
89
97
99
91
92
91
98
98
83
90
94
47
97
90
84
92
94
98
90
84
85
70
89
81
86
73
92
76
82
87
82
67
77
80
89
84
88
92
80
81
78
76
87
91
73
81
85
78
68
88
0 20 40 60 80 100
New Hampshire
Nevada
Nebraska
Montana
Missouri
Mississippi
Minnesota
Michigan
Massachusetts
Maryland
Maine
Louisiana
Kentucky
Kansas
Iowa
Indiana
Illinois
Idaho
Hawaii
Guamᵇ
Georgia
Florida
District ofColumbia
Delaware
Connecticut
Colorado
California
Arkansas
Arizona
Alaska
Alabama
Percent
State
State graduation rate forall students
State graduation rate for CTE concentratorsᵃ
See notes at end of figure.

42 STATE PERFORMANCE DATA
Figure 8. Comparison of secondary graduation rates for all students and CTE concentrators, by state: Program year 2010–11—Continued
95
96
97
44
99
97
95
93
96
96
97
97
94
93
98
85
86
99
92
90
85
87
100
80
90
84
83
80
88
90
84
89
89
72
76
98
91
85
82
84
88
74
76
67
95
0 20 40 60 80 100
Wyoming
Wisconsin
West Virginia
Washington
Virginia
Vermont
Utah
United States Virgin Islandsᵇ
Texas
Tennessee
South Dakota
South Carolina
Rhode Island
Republic of Palau
Puerto Rico
Pennsylvania
Oregon
Oklahoma
Ohio
North Dakota
North Carolina
New York
New Mexico
New Jersey
Percent
State
State graduation rate forall students
State graduation rate for CTE concentratorsᵃ
NP NP
NP Data not provided a See Appendix A, table A-1 for each state’s definition of CTE concentrator. b Guam and the United States Virgin Islands were not required to submit secondary graduation data under the Elementary and Secondary Education Act (ESEA). NOTE: The term “state” in Sec. 3(30) of Perkins IV means, unless otherwise specified, each of the 50 states of the United States, the District of Columbia, the Commonwealth of Puerto Rico, and each outlying area. The term “state” as it is used in this report consists of each jurisdiction of the United States, including the 50 states of the United States, the District of Columbia, the Commonwealth of Puerto Rico; and the outlying areas of the United States Virgin Islands, Guam, American Samoa, the Commonwealth of the Northern Mariana Islands, and the Republic of Palau. CTE means career and technical education. The 50 U.S. states, the District of Columbia, the Commonwealth of Puerto Rico, and three of the outlying areas—the United States Virgin Islands, Guam, and Republic of Palau—were required to report data and information under Perkins IV for PY 2010–11. The United States Virgin Islands consolidated its Perkins IV, Title I, allotment with funds under other formula programs and used some of the funds in a consolidation grant for Perkins IV, Title I, purposes. The Republic of Palau did not submit data or information because it did not have a fully approved state plan. American Samoa and the Commonwealth of the Northern Mariana Islands did not submit data or information for CTE programs because they consolidated their Perkins IV, Title I, allotments with funds under other formula programs and used these funds for allowable program purposes rather than for career and technical education. Of the 57 states that received Perkins IV state grants for PY 2010–11, the CTE data reported above represent 54 states.
See notes at end of figure.

STATE PERFORMANCE DATA 43
Figure 8. Comparison of secondary graduation rates for all students and CTE concentrators, by state: Program year 2010–11—Continued
Statewide graduation data represent the actual school year 2010–11 and the Consolidated State Performance Report school year 2010–11. Of the states that reported graduation data for CTE students under Perkins IV, the 50 U.S. states, the District of Columbia, and the Commonwealth of Puerto Rico were required to and did report on general statewide graduation rates under the ESEA to the Office of Elementary and Secondary Education in the Education Data Exchange Network (EDEN). (Also see table 9.)
SOURCE: U.S. Department of Education, Consolidated State Performance Report for PY 2010–11, and Office of Vocational and Adult Education, Consolidated Annual Report (CAR) for the Carl D. Perkins Career and Technical Education Act of 2006 for PY 2010–11 (OMB Number 1830-0569).
Postsecondary
Postsecondary career and technical education concentrator enrollment experienced a 3.67 percent increase under Title I of Perkins IV in PY 2010–11, when compared to PY 2009–10 (table 6).
Ten of 54 or 19 percent of the states that reported data met or exceeded all of their performance levels for the required Perkins IV Sec. 113(b) postsecondary core indicators in PY 2010–11 (table 10). In terms of state performance: (1) 78 percent, or 42 of 54 states, met or exceeded their postsecondary performance levels for technical skill attainment; (2) 74 percent, or 40 of 54 states, met or exceeded their postsecondary performance levels for student retention or transfer; and (3) 74 percent, or 40 of 54 states, met or exceeded their performance levels for nontraditional participation.
Thirty-four states met all their postsecondary performance levels set at the threshold of 90 percent, and the other states that missed the 90 percent threshold for one or more indicators were required to develop and implement a program improvement plan during the succeeding program year, pursuant to Sec. 123(a)(1) of Perkins IV (table 10). Ten states failed to meet one postsecondary performance level set at the 90 percent threshold, seven states failed to meet two performance levels set at the 90 percent threshold, and three states failed to meet three or four performance levels set at the 90 percent threshold.
Table 10 identifies those states that met or exceeded their performance levels and those states that met by at least 90 percent their postsecondary performance levels. States that met or exceeded their performance levels are indicated by the letter E, whereas states that met their performance levels by at least 90 percent are indicated by the letter M.

44 STATE PERFORMANCE DATA
Table 10. Number of states that met by at least 90 percent, or met or exceeded, their postsecondary performance levels, by Perkins IV Sec. 113(b) core indicator: Program year 2010–11
Technical Credential, Student Totalsskill certificate, retention Student Nontraditional Nontraditional by
attainment
el
90ce
nt pe
r
e lev
el
or degree
el
90ce
nt pe
r
e lev
el
or transfer
el
90ce
nt pe
r
e lev
el
placement
el
90ce
nt pe
r
e lev
el
participation
el
90ce
nt pe
r
e lev
el
completion
el
90ce
nt pe
r
e lev
el
gs m
etet
state
b st
atey g
s met
et
by st
ate
States
eed
Met o
r exc
ed
perfo
rman
ce le
v
Met a
t leas
tof
the pe
rform
anc
eed
Met o
r exc
ed
perfo
rman
ce le
v
Met a
t leas
tof
the pe
rform
anc
eed
Met o
r exc
ed
perfo
rman
ce le
v
Met a
t leas
tof
the pe
rform
anc
eed
Met o
r exc
ed
perfo
rman
ce le
v
Met a
t leas
tof
the pe
rform
anc
eed
Met o
r exc
ed
perfo
rman
ce le
v
Met a
t leas
tof
the pe
rform
anc
eed
Met o
r exc
ed
perfo
rman
ce le
v
Met a
t leas
tof
the pe
rform
anc
Numb
er of
tar
or ex
ceed
ed,
Numb
er of
tar
by 90
perce
nt,
Number of states that met or exceeded the performance 42 30 40 22 40 40 †level by indicator
Number of states that met by at least 90 percent the performance level 53 44 51 44 50 48 †
by indicator
Alabama E M E M E M E M 4 4Alaska E M M M E M E M 3 5Arizona E M M E M E M E M E M 5 6Arkansas E M M E M E M E M E M 5 6California E M M M E M E M E M 4 6Colorado E M E M M M E M E M 4 6Connecticut E M E M E M M M E M 4 6Delaware E M E M E M E M E M E M 6 6District of Columbia M E M E M E M E M E M 5 6Florida M E M M M M E M 2 6Georgia M M E M M E M M 2 6Guam E M E M E M E M 4 4Hawaii E M E M E M E M E M E M 6 6Idaho E M M E M M E M M 3 6Illinois E M E M E M M M E M 4 6Indiana E M M E M E M 3 4Iowa E M M 1 2Kansas E M E M E M E M E M E M 6 6Kentucky E M E M E M E M E M E M 6 6Louisiana E M E M M E M 3 4Maine E M E M M M M 2 5Maryland E M E M E M M E M M 4 6Massachusetts E M E M E M M E M E M 5 6Michigan M M E M E M E M E M 4 6Minnesota E M M E M E M E M E M 5 6Mississippi M E M E M E M E M E M 5 6Missouri E M M E M E M E M E M 5 6Montana E M M E M M E M M 3 6Nebraska E M E M E M E M E M E M 6 6Nevada E M E M E M E M E M E M 6 6
See notes at end of table.

STATE PERFORMANCE DATA 45
Table 10. Number of states that met by at least 90 percent, or met or exceeded, their postsecondary school performance levels, by Perkins IV Sec. 113(b) core indicator: Program year 2010–11—Continued
Technical Credential, Student Totalsskill certificate, retention Student Nontraditional Nontraditional by
attainment
el
90ce
nt pe
r
e lev
el
or degree
el
90ce
nt pe
r
e lev
el
or transfer
el
90ce
nt pe
r
e lev
el
placement
el
90ce
nt pe
r
e lev
el
participation
el
90ce
nt pe
r
e lev
el
completion
el
90ce
nt pe
r
e lev
el
gs m
etet
state
b st
atey g
s met
et
by st
ate
States
eed
Met o
r exc
ed
perfo
rman
ce le
v
Met a
t leas
tof
the pe
rform
anc
eed
Met o
r exc
ed
perfo
rman
ce le
v
Met a
t leas
tof
the pe
rform
anc
eed
Met o
r exc
ed
perfo
rman
ce le
v
Met a
t leas
tof
the pe
rform
anc
eed
Met o
r exc
ed
perfo
rman
ce le
v
Met a
t leas
tof
the pe
rform
anc
eed
Met o
r exc
ed
perfo
rman
ce le
v
Met a
t leas
tof
the pe
rform
anc
eed
Met o
r exc
ed
perfo
rman
ce le
v
Met a
t leas
tof
the pe
rform
anc
Numb
er of
tar
or ex
ceed
ed,
Numb
er of
tar
by 90
perce
nt,
New Hampshire E M M E M E M E M 4 5New Jersey E M E M E M E M E M E M 6 6New Mexico E M E M M E M E M 4 5New York E M E M M E M 3 4North Carolina M M E M E M M 2 5North Dakota M E M E M E 3 3Ohio M E M E M M E M E M 4 6Oklahoma E M E M E M M M E M 4 6Oregon E M E M E M M E M 4 5Pennsylvania E M E M E M M E M M 4 6Puerto Rico M M E M E M E M E M 4 6
aRepublic of Palau NP NP NP NP NP NP NP NP NP NP NP NP 0 0Rhode Island E M M E M M E M 3 5South Carolina E M E M E M E M E M E M 6 6South Dakota E M E M E M E M 4 4Tennessee E M E M E M E M E M E M 6 6Texas E M M M M E M 2 5United States Virgin Islandsb M E M E M 2 3
Utah E M M E M E M M 3 5Vermont E M E M M M 2 4Virginia E M M E M M M 2 5Washington E M E M E M M M M 3 6West Virginia E M E M M M E M E M 4 6Wisconsin M M E M E M E M E M 4 6Wyoming E M E M E M E M E M E M 6 6
† No data applicable to the cell. E State met or exceeded their performance level. M State met their performance level by at least 90 percent NP Data not provided. Blank space means that the state did not meet the performance level. a The Republic of Palau does not have a fully approved state plan under Perkins IV for PY 2010–11; therefore, it did not report enrollment data for PY 2010–11. b The United States Virgin Islands received its allotted Perkins IV funds consolidated with funds allotted under other formula grant programs and used some of the funds in the consolidated grant for Perkins IV, Title I, purposes. NOTE: The term “state” in Sec. 3(30) of Perkins IV means, unless otherwise specified, each of the 50 states of the United States, the District of Columbia, the Commonwealth of Puerto Rico, and each outlying area. The term “state” as it is used in this report consists of each jurisdiction of the United States, including the 50 states of the United States, the District of Columbia, the Commonwealth of Puerto Rico; and the outlying areas of the United States Virgin Islands, Guam, American Samoa, the Commonwealth of the Northern Mariana Islands, and the Republic of Palau. The core indicators of performance as specified in Sec. 113(b)(2)(B) of Perkins IV. Perkins IV means the Carl D. Perkins Career and Technical Education Act of 2006. This table does not include performance data from all states because the Republic of Palau did not have a fully approved state plan for program year 2010–11 and so did not report data. The 50 U.S. states, the District of Columbia, the Commonwealth of Puerto Rico, and three of the outlying areas—the United States Virgin Islands, Guam, and Republic of Palau—were required to report data and information under Perkins IV for PY 2010–11. American Samoa and the Commonwealth of the Northern Mariana Islands did not submit data or information for CTE programs because they consolidated their Perkins IV, Title I, allotments with funds under other formula programs and used these funds for allowable program purposes rather than for career and technical education. Of the 57 states that received Perkins IV, state grants for PY 2010–11, the CTE data reported above represent 54 states. SOURCE: U.S. Department of Education, Office of Vocational and Adult Education, Consolidated Annual Report (CAR) for the Carl D. Perkins Career and Technical Education Act of 2006 for PY 2010–11 (OMB Number 1830-0569).

46 STATE PERFORMANCE DATA
Figure 9 presents the total number of states out of 54 states that met or exceeded their postsecondary performance levels, by indicator, for PY 2010–11. The three most frequently met postecondary core indicators were: (1) technical skill attainment, with 42 states; (2) student retention or transfer, with 40 states (including the District of Columbia, Guam, the Commonwealth of Puerto Rico, and the United States Virgin Islands); and (3) nontraditional participation and nontraditional completion, with 40 states each (including the District of Columbia, Guam, and the Commonwealth of Puerto Rico).

STATE PERFORMANCE DATA 47
Figure 9. Number of states that met or exceeded the postsecondary performance levels, by Perkins IV Sec. 113(b) core indicator: Program year 2010–11
42
30
40
22
40 40
0
20
40
60
Technicalskill
attainment
Credential,certificate,or degree
Studentretention
or transfer
Studentplacement
Nontraditionalparticipation
Nontraditionalcompletion
Number of states
Postsecondary core indicators*
Number of states that met or exceeded the performance level by indicator
* The core indicators of performance as specified in Sec. 113(b)(2)(B) of Perkins IV.
NOTE: The term “state” in Sec. 3(30) of Perkins IV means, unless otherwise specified, each of the 50 states of the United States, the District of Columbia, the Commonwealth of Puerto Rico, and each outlying area. The term “state” as it is used in this report consists of each jurisdiction of the United States, including the 50 states of the United States, the District of Columbia, the Commonwealth of Puerto Rico; and the outlying areas of the United States Virgin Islands, Guam, American Samoa, the Commonwealth of the Northern Mariana Islands, and the Republic of Palau. Perkins IV means the Carl D. Perkins Career and Technical Education Act of 2006. The 50 U.S. states, the District of Columbia, the Commonwealth of Puerto Rico, and three of the outlying areas—the United States Virgin Islands, Guam, and Republic of Palau—were required to report data and information under Perkins IV for PY 2010–11. The Republic of Palau did not submit data or information because it did not have a fully approved state plan. The United States Virgin Islands consolidated its Perkins IV, Title I, allotment with funds under other formula programs and used some of the funds in a consolidation grant for Perkins IV, Title I, purposes. American Samoa and the Commonwealth of the Northern Mariana Islands do not submit data or information for CTE programs because they consolidated their Perkins IV, Title I, allotments with funds under other formula programs and used these funds for allowable program purposes rather than for career and technical education. Thus, the CTE data reported for PY 2010–11 represent 54 of the 57 states that received Perkins IV state grants.
The number of states that met or exceeded their postsecondary performance levels are as follows: (1) technical skill attainment—42 states; (2) credential, certificate, or degree—30 states (including the District of Columbia, Guam, and the United States Virgin Islands); (3) student retention or transfer—40 states (including the District of Columbia, Guam, the Commonwealth of Puerto Rico, and the United States Virgin Islands); (4) student placement—22 states (including the District of Columbia and the Commonwealth of Puerto Rico); (5) nontraditional participation—40 states (including the District of Columbia, Guam, and the Commonwealth of Puerto Rico); and (6) nontraditional completion—40 states (including the District of Columbia, Guam, and the Commonwealth of Puerto Rico) (table 10).
SOURCE: U.S. Department of Education, Office of Vocational and Adult Education, Consolidated Annual Report (CAR) for the Carl D. Perkins Career and Technical Education Act of 2006 for PY 2010–11 (OMB Number 1830-0569).
Figure 10 presents the total number of states out of 54 states that met their postsecondary performance levels by at least 90 percent, by indicator, for PY 2010–11. The postsecondary core indicators most frequently met by at least 90 percent were (1) technical skill attainment, with 53 states (including the District of Columbia, the Commonwealth of Puerto Rico, and the United States Virgin Islands); (2) student retention and transfer, with 51 states (including the District of Columbia, Guam, the Commonwealth of Puerto Rico, and the United States

48 STATE PERFORMANCE DATA
Virgin Islands); and (3) nontraditional participation, with 50 states (including the District of Columbia, Guam, and the Commonwealth of Puerto Rico).
Figure 10. Number of states that met the postsecondary performance levels by at least 90 percent, by Perkins IV Sec. 113(b) core indicator: Program year 2010–11
53
44
51
44
50 48
0
20
40
60
Technicalskill
attainment
Credential,certificate,or degree
Studentretention
or transfer
Studentplacement
Nontraditionalparticipation
Nontraditionalcompletion
Number of states
Postsecondary core indicators*
Number of states that met the performance levels by at least 90 percent by indicator
* The core indicators of performance as specified in Sec. 113(b)(2)(B) of Perkins IV.
NOTE: The term “state” in Sec. 3(30) of Perkins IV means, unless otherwise specified, each of the 50 states of the United States, the District of Columbia, the Commonwealth of Puerto Rico, and each outlying area. The term “state” as it is used in this report consists of each jurisdiction of the United States, including the 50 states of the United States, the District of Columbia, the Commonwealth of Puerto Rico; and the outlying areas of the United States Virgin Islands, Guam, American Samoa, the Commonwealth of the Northern Mariana Islands, and the Republic of Palau. Perkins IV means the Carl D. Perkins Career and Technical Education Act of 2006. The 50 U.S. states, the District of Columbia, the Commonwealth of Puerto Rico, and three of the outlying areas—the United States Virgin Islands, Guam, and Republic of Palau—were required to report data and information under Perkins IV for PY 2010–11. The Republic of Palau did not submit data or information because it did not have a fully approved state plan. The United States Virgin Islands consolidated its Perkins IV, Title I, allotment with funds under other formula programs and used some of the funds in a consolidation grant for Perkins IV, Title I, purposes. American Samoa and the Commonwealth of the Northern Mariana Islands do not submit data or information for CTE programs because they consolidated their Perkins IV, Title I, allotments with funds under other formula programs and used these funds for allowable program purposes rather than for career and technical education. Thus, the CTE data reported for PY 2010–11 represent 54 of the 57 states that received Perkins IV state grants.
The number of states that met their postsecondary performance levels by at least 90 percent are as follows: (1) technical skill attainment—53 states (including the District of Columbia, the Commonwealth of Puerto Rico, and the United States Virgin Islands); (2) credential, certificate or degree—44 states (including the District of Columbia, Guam, the Commonwealth of Puerto Rico, and the United States Virgin Islands); (3) student retention or transfer—51 states (including the District of Columbia, Guam, the Commonwealth of Puerto Rico, and the United States Virgin Islands); (4) student placement—44 states (including the District of Columbia and the Commonwealth of Puerto Rico); (5) nontraditional participation—50 states (including the District of Columbia, Guam, and the Commonwealth of Puerto Rico); and (6) nontraditional completion—48 states (including the District of Columbia, Guam, and the Commonwealth of Puerto Rico) (table 10).
SOURCE: U.S. Department of Education, Office of Vocational and Adult Education, Consolidated Annual Report (CAR) for the Carl D. Perkins Career and Technical Education Act of 2006 for PY 2010–11 (OMB Number 1830-0569).

STATE PERFORMANCE DATA 49
Tech Prep
The 25 states that elected to offer tech programs in PY 2010–11 were Alabama, Alaska, Arizona, California, Delaware, Illinois, Indiana, Iowa, Massachusetts, Michigan, Mississippi, Missouri, Montana, New Mexico, New York, North Carolina, Ohio, Oklahoma, Pennsylvania, South Dakota, Texas, Virginia, Washington, West Virginia, and Wisconsin. Each of those states reported on Sec. 203 tech prep indicators, as defined in table 11. States with tech prep programs only needed to report on the progress of their programs and are not required to negotiate with the Department of Education on the performance levels for each of their tech prep programs. The tech prep states agreed to define the indicators in a standard manner following the National Association for Tech Prep Leadership (NATPL) guidelines. The Perkins IV Sec. 203 indicators are included in the table. Note that FY 2010 was the last year for which funds were appropriated for Tech Prep programs.

50 STATE PERFORMANCE DATA
Table 11. Perkins IV Sec. 203(e) indicators for tech prep concentrators at secondary and postsecondary levels
Secondary education indicators
1. Number and percent of secondary education tech prep concentrators enrolled in the tech prep program who enroll in postsecondary education
2. Number and percent of secondary education tech prep concentrators enrolled in the tech prep program who enroll in postsecondary education in the same field or major as the secondary education tech prep concentrators were enrolled at the secondary level
3. Number and percent of secondary education tech prep concentrators enrolled in the tech prep program who complete a state or industry-recognized certification or licensure
4. Number and percent of secondary education tech prep concentrators enrolled in the tech prep program who successfully complete, as a secondary school student, courses that award postsecondary credit at the secondary level
5. Number and percent of secondary education tech prep concentrators enrolled in the tech prep program who enroll in remedial mathematics, writing, or reading courses upon entering postsecondary education
Postsecondary education indicators
1. Number and percent of postsecondary education tech prep concentrators enrolled in the tech prep program who are placed in a related field of employment not later than 12 months after graduation from the tech prep program
2. Number and percent of secondary education tech prep concentrators enrolled in the tech prep program who complete a state or industry-recognized certification or licensure
3. Number and percent of secondary education tech prep concentrators enrolled in the tech prep program who complete a two-year degree or certificate program within the normal time for completion of such program
4. Number and percent of secondary education tech prep concentrators enrolled in the tech prep program who complete a baccalaureate degree program within the normal time for completion of such program
NOTE: Perkins IV means the Carl D. Perkins Career and Technical Education Act of 2006. PY 2010–11, the fourth PY of Perkins IV, is the third year states are required to report on all of the tech prep indicators of performance under Sec. 203(e) of Perkins IV. The 25 states that elected to offer tech programs in PY 2010–11 were Alabama, Alaska, Arizona, California, Delaware, Illinois, Indiana, Iowa, Massachusetts, Michigan, Mississippi, Missouri, Montana, New Mexico, New York, North Carolina, Ohio, Oklahoma, Pennsylvania, South Dakota, Texas, Virginia, Washington, West Virginia, and Wisconsin.
51
Data Quality Issues
States have made considerable strides in improving the validity, reliability, and consistency of their Perkins data and have addressed many concerns about data quality raised in previous reports to Congress. Improvements are likely due to two factors. First, Sec. 113(b)(2)(A)(i) and (iv) of Perkins IV defines the measure that states must use for the Perkins IV Sec. 113(b) core indicators of academic attainment and student graduation rates, and align these measures to academic standards and assessments, and graduation rates required under Title I of ESEA. This action not only guarantees that states will use valid and reliable measures for these core indicators but also ensures that states will hold CTE students to the same academic standards as all students.80
Secondly, states continue to have discussions and workgroups to reach consensus on valid and reliable student definitions and measurement approaches for the Perkins IV Sec. 113(b) core indicators. Through Next Step Working Groups (NSWGs), states have formed workgroups to develop products that include checklists to assess the validity and reliability of the various measurement approaches for the core indicators.81
Two major areas of concern remain regarding the validity, reliability, and comparability of states’ Perkins IV data. First, states have yet to adopt common definitions for CTE concentrators for reporting their data on their Perkins IV Sec. 113(b) core indicators, particularly at the secondary level (see Appendix A, table A-1). Differences in student
80 Sec. 122(c)(7)(C) of Perkins IV requires each state to include information in its state plan that ensures that students who participate in CTE programs are taught to the same level of challenging academic proficiencies as are taught to all other students. 81 These checklists include some of the factors that the Department may consider in deciding whether to approve a state’s request for changes to its measurement approaches for the Perkins IV Sec. 113(b) core indicators in response to a state’s methods for collecting data, natural catastrophe, significant change in economic conditions, or significant change in demographics.

52 DATA QUALITY ISSUES
definitions (i.e., of CTE participants82 and CTE concentrators83) are also problematic because some states report data on students shortly after CTE program enrollment (having taken as little as one course), while other states report on students nearing CTE program completion. Expectations for student attainment on the Perkins IV Sec. 113(b) core indicators between these two groups of students are vastly different, thus rendering it impossible to make comparisons of student performance across states or over time.
Second, a multitude of limiting socioeconomic factors has contributed to the challenge of collecting complete, accurate, and reliable data. Limited resources, funding, and student mobility make it difficult for states to collect and report data accurately. For instance, states are facing significant reductions in state and federal funding of programs. In many instances, it becomes difficult for a state to counteract the rising costs of program evaluation efforts, data collection systems, and technical assistance to eligible recipients participating in CTE programs. Hiring freezes and consolidation of services and offices resulted in reduced staff responsible for ensuring the collection and validation of data. In some instances, state legislation may prohibit the use of a single student identifier to track students into postsecondary education or employment. Post-graduation data, such as placement, also becomes a challenge as it becomes difficult for states to track students successfully once they graduate or move to another state. Although great strides have been made in the development of state-wide longitudinal databases, there still remains much to do. The lack of effective state-wide and cross-state databases significantly limits the state’s ability to collect and analyze data.
82 Although the definitions of CTE participants vary among states, generally states define CTE participants as students who have completed one or more CTE courses at the secondary level or one or more credits at the postsecondary level (see Appendix A, table A-2, for each state’s definition of CTE participants). 83 See Appendix A, table A-1, for each state’s definition of CTE concentrators.

53
Conclusion
States84 have made progress85 in adopting comparable definitions and measures that have strengthened the validity and reliability of the data reported under the Carl D. Perkins Career and Technical Education Act of 2006 (Perkins IV) Sec. 113(b) core indicators and in meeting their performance levels for the Perkins IV Sec. 113(b) core indicators for program year (PY) 2010–11. The student data are reported by each state per the instructions in the Consolidated Annual Report (CAR) for the Carl D. Perkins Career and Technical Education Act of 2006 for PY 2010–11.86 Progress was due to a combination of factors described in this report:
• The Perkins IV provisions that defined measurement approaches for the Perkins IV Sec. 113(b) core indicators of academic attainment and graduation rates.
• The national and customized technical assistance that was offered to the states by the Department.
• The states’ own efforts to reach consensus on more rigorous definitions and measures for the Perkins IV Sec. 113(b) core indicators and Perkins IV Sec. 203(e) indicators of performance.
84 The term “state” in Sec. 3(30) of Perkins IV means, unless otherwise specified, each of the 50 states of the United States, the District of Columbia, the Commonwealth of Puerto Rico, and each outlying area. The term “state” as it is used in this report consists of each jurisdiction of the United States, including the 50 states of the United States, the District of Columbia, the Commonwealth of Puerto Rico; and the outlying areas of the United States Virgin Islands, Guam, American Samoa, the Commonwealth of the Northern Mariana Islands, and the Republic of Palau. 85 This report does not include performance data from all states because the Republic of Palau did not have a fully approved state plan, and American Samoa and the Commonwealth of the Northern Mariana Islands consolidated their Perkins IV, Title I, allotments with funds under other formula programs, and used these funds for allowable program purposes rather than CTE. 86 When completing the CAR enrollment and accountability forms, a state must use its definitions for a CTE participant and CTE concentrator at the secondary and postsecondary levels. Unless otherwise specified, the data reported are for CTE concentrators.

54 CONCLUSION
For PY 2010–11, states reported the following outcomes for their career and technical education programs:
• States reported a reduction in the number of students enrolled in career and technical education courses in PY 2010–11 from the previous program year. Enrollment figures for PY 2010–11 reflect a 3.74 percent decrease from the previous year.87 CTE student enrollment in PY 2010–11 was 8.1 percent lower than it was in the year with highest enrollment (PY 2006–07) during the past nine years (PYs 2001–02 through 2009–10) of Perkins III88 and Perkins IV implementation (figure 1).
• Eighty-seven percent, or 45 of the 52 states89 that reported complete data on statewide and CTE graduation rates,90 reported having higher secondary graduation rates for CTE students (i.e., CTE concentrators) than for all students in their respective states (table 9).91
• The three highest enrollment percentages for secondary CTE concentrators were in the following career cluster areas: (1) business management and administration; (2) human services; and (3) health science (table 5).
• Secondary career and technical education student enrollment decreased by approximately 2 percent in PY 2010–11, when compared to PY 2009–10 (table 3).
• Postsecondary career and technical education student enrollment decreased 6 percent in PY 2010–11, when compared to PY 2009–10 (table 3).92
• Adult93 career and technical education student enrollment decreased in excess of 16.59 percent in PY 2010–11, when compared to PY 2009–1094 (table 4).
87 States report data based on their definitions of CTE participant and CTE concentrator. See Appendix A, table A-2, for each state’s definition of CTE participant and table A-1 for each state’s definition of CTE concentrator. 88 The Carl D. Perkins Vocational and Technical Education Act of 1998 (Perkins III). 89 Only the 50 U.S. states, the District of Columbia, and the Commonwealth of Puerto Rico were required to and did report on academic achievement and general statewide graduation rates under the Elementary and Secondary Education Act as amended (ESEA) to the Office of Elementary and Secondary Education in the Education Data Exchange Network (EDEN). 90 Guam and United States Virgin Islands were not required to submit secondary gradation data under the ESEA. 91 For general information related to states’ secondary performance levels for the Perkins IV Sec. 113(b) core indicators, see figures 6 through 8 and tables 8 and 9 of this report and the related information for each of the figures and tables. For specific data for each state, see Appendix B of this report. 92 For general information related to states’ postsecondary performance levels for the Perkins IV Sec. 113(b) core indicators, see figures 9 and 10 and table 10 of this report and the related information for each of the figures and the table. For specific data for each state, see Appendix B of this report. 93 Florida, Louisiana, Missouri, Ohio, Oklahoma, and Tennessee provided performance levels and report data for their adult-level CTE concentrators using the Perkins IV Sec. 113(b)(2)(B) postsecondary core indicators and performance levels. 94 For PY 2009–10, the adult career and technical education student enrollment was 175,399.

CONCLUSION 55
• Eighty-five percent, or 46 of 54 states95 that reported data on their Perkins Sec. 113(b) core indicators of performance, reported that they met or exceeded their performance levels for secondary student graduation rates (table 8).
• Eighty-one percent, or 44 of 54 states that reported on secondary school completion, met or exceeded their performance levels (table 8).
• Sixty-seven percent, or 36 of 54 states that reported data on secondary technical skill attainment, met or exceeded their performance levels (table 8).
• Sixty-nine percent, or 37 of 54 states that reported data on academic attainment in reading and language arts, met or exceeded their performance levels (table 8).
• Forty-four percent, or 24 of 54 states, met or exceeded all of their secondary performance levels by at least 90 percent (table 8).
• The three highest enrollment percentages for CTE postsecondary concentrators were in the following career cluster areas: (1) health science; (2) business management and administration; and (3) law, public safety, and security (table 5).
• Seventy-eight percent, or 42 of the 54 states that reported data on postsecondary technical skill attainment, met or exceeded their performance levels (table 10).
• Seventy-four percent, or 40 of the 54 states that reported data on postsecondary student retention or transfer, met or exceeded their performance levels (table 10).
• Seventy-four percent, or 40 of the 54 states that reported postsecondary nontraditional participation, met or exceeded their performance levels (table 10).
• Sixty-three percent, or 34 of 54 states, met or exceeded all of their postsecondary performance levels by at least 90 percent (table 10).
Considerable work lies ahead for the Department in assisting states to effectively use their Perkins accountability data, in addition to ensuring that the data submitted by states and local recipients are valid, reliable, and complete. To this end, the Department will continue to host Data Quality Institutes (DQIs) and quarterly Next Steps Work Group (NSWG) conference calls, and to offer opportunities for more states to receive customized technical
95 The 50 U.S. states, the District of Columbia, the Commonwealth of Puerto Rico, and three of the outlying areas—the United States Virgin Islands, Guam, and the Republic of Palau—were required to report data on the Perkins IV Sec. 113(b) core indicators for PY 2010–11. The Republic of Palau did not submit data because it did not have a fully approved state plan. American Samoa and the Commonwealth of the Northern Mariana Islands do not submit data for CTE programs because they consolidated their Perkins IV, Title I, allotments with funds under other formula programs and used these funds for allowable program purposes rather than for career and technical education. Fifty-four states in this report refer to the 50 U.S. states, the District of Columbia, the Commonwealth of Puerto Rico, the United States Virgin Islands, and the outlying area of Guam.
56 CONCLUSION
assistance. Some of the future topics identified for continued discussion include: (1) the alignment of annual Perkins Consolidated Annual Report (CAR) reporting with the Elementary and Secondary Education Act (ESEA) annual reporting through the Education Data Exchange Network (EDEN), (2) state and local education agency performance negotiations, and (3) disaggregating core indicator results for analysis.
The Department will continue to explore areas where additional guidance would assist states in improving the quality and implementation of their CTE programs. The Department has (1) undertaken increased training efforts targeted to improving data on specific indicators; and (2) established specialized online and virtual training to help both state and local systems yield valid, reliable, and complete data on the performance of CTE students across the nation. And the Department will continue to pursue opportunities for enhancing its guidance and technical assistance to the states.

57
Appendixes
Appendix A States’96 Definitions of Career and Technical Education (CTE) Concentrator97 and Participant for the Carl D. Perkins Career and Technical Education Act of 2006 (Perkins IV) Secondary and Postsecondary Levels
The Carl D. Perkins Career and Technical Education Act of 2006 (Perkins IV) in Sec. (3)(5) provides a definition of the term “career and technical education” as meaning “organized educational activities that—(A) offer a sequence of courses that—(i) provides individuals with coherent and rigorous content aligned with challenging academic standards and relevant technical knowledge and skills needed to prepare for further education and careers in current or emerging professions; (ii) provides technical skill proficiency, an industry-recognized credential, a certificate, or an associate degree; and (iii) may include prerequisite courses (other than a remedial course) that meet the requirements of this subparagraph; and (B) include competency-based applied learning that contributes to the academic knowledge, higher-order reasoning and problem-solving skills, work attitudes, general employability
96 The term “state” in Sec. 3(30) of Perkins IV means, unless otherwise specified, each of the 50 states of the United States, the District of Columbia, the Commonwealth of Puerto Rico, and each outlying area. The term “state” as it is used in this report consists of each jurisdiction of the United States, including the 50 states of the United States, the District of Columbia, the Commonwealth of Puerto Rico; and the outlying areas of the United States Virgin Islands, Guam, American Samoa, the Commonwealth of the Northern Mariana Islands, and the Republic of Palau. 97 A CTE concentrator is a student who enrolled in a threshold level of career and technical education as defined in the state’s Perkins IV state plan.

58 APPENDI X A . STATES’ DEFINIT IONS OF CTE CONCENTRATOR AND PARTICI PANT
skills, technical skills, and occupation-specific skills, and knowledge of all aspects of an industry, including entrepreneurship, of an individual.”
However, Perkins IV does not define a career and technical education (CTE) concentrator98 or participant.99 The Department has indicated in its past reports to Congress on the Carl D. Perkins Vocational and Technical Education Act of 1998 (Perkins III) that it was difficult to compare state data100 because there was a variety of definitions for CTE concentrator used by states that made an impact on whom they were counting in their CTE accountability system. To provide states with guidance in developing their definitions in their final Perkins IV state plan for a secondary CTE concentrator and participant and a postsecondary CTE concentrator and participant, and in an attempt to increase consistency of CTE concentrator and participant definitions across the states, the U.S. Department of Education issued nonregulatory guidance on student definitions101 on March 13, 2007, as follows:
Secondary Level
CTE Participant: A secondary student who has earned one or more credits in any career and technical education (CTE) program area.
CTE Concentrator: A secondary student who has earned three or more credits in a single CTE program area (e.g., health care or business services), or two credits in a single CTE program area, but only in those program areas where two-credit sequences at the secondary level are recognized by the state and/or its local eligible recipients.
Postsecondary or Adult Level
CTE Participant: A postsecondary or adult student who has earned one or more credits in any CTE program area.
98 See Appendix A, table A-1, for each state’s definition of CTE concentrators. 99 Although the definitions of CTE participants vary among states, generally states define CTE participants as students who have completed one or more CTE courses at the secondary level or one or more credits at the postsecondary level (see Appendix A, table A-2, for each state’s definition of CTE participants). Unless otherwise indicated, the data in this report are for CTE concentrators. 100 This report does not include definitions of CTE concentrators for American Samoa and the Commonwealth of the Northern Mariana Islands because they consolidated their Perkins IV, Title I, allotments with funds under other formula programs, and used these funds for allowable program purposes rather than for CTE. 101 See http://cte.ed.gov/docs/nonregulatory/studentdef.pdf.
APPENDI X A . STATES’ DEFINIT IONS OF CTE CONCENTRATOR AND PARTICI PANT 59
CTE Concentrator: A postsecondary or adult student who: (1) completes at least 12 academic or CTE credits within a single program area sequence that is comprised of 12 or more academic and technical credits and terminates in the award of an industry-recognized credential, a certificate, or a degree; or (2) completes a short-term CTE program sequence of less than 12 credit units that terminates in an industry-recognized credential, a certificate, or a degree.
Each state provided its definitions for a secondary CTE concentrator and participant and a postsecondary CTE concentrator and participant in its final Perkins IV state plan. Table A-1 lists definitions of CTE concentrator in CTE programs at the secondary and postsecondary levels, and table A-2 lists definitions of CTE participants in CTE programs at the secondary and postsecondary levels, for program year (PY) 2010–11 for each of the 50 U.S. states, the District of Columbia, Guam, the Commonwealth of Puerto Rico, and the United States Virgin Islands.102 Tables A-1 and A-2 include each state’s definitions for secondary and postsecondary CTE concentrator and participant as submitted in their state plan.
102 The Republic of Palau does not have a fully approved Perkins IV state plan and, thus, does not have definitions for CTE concentrators.
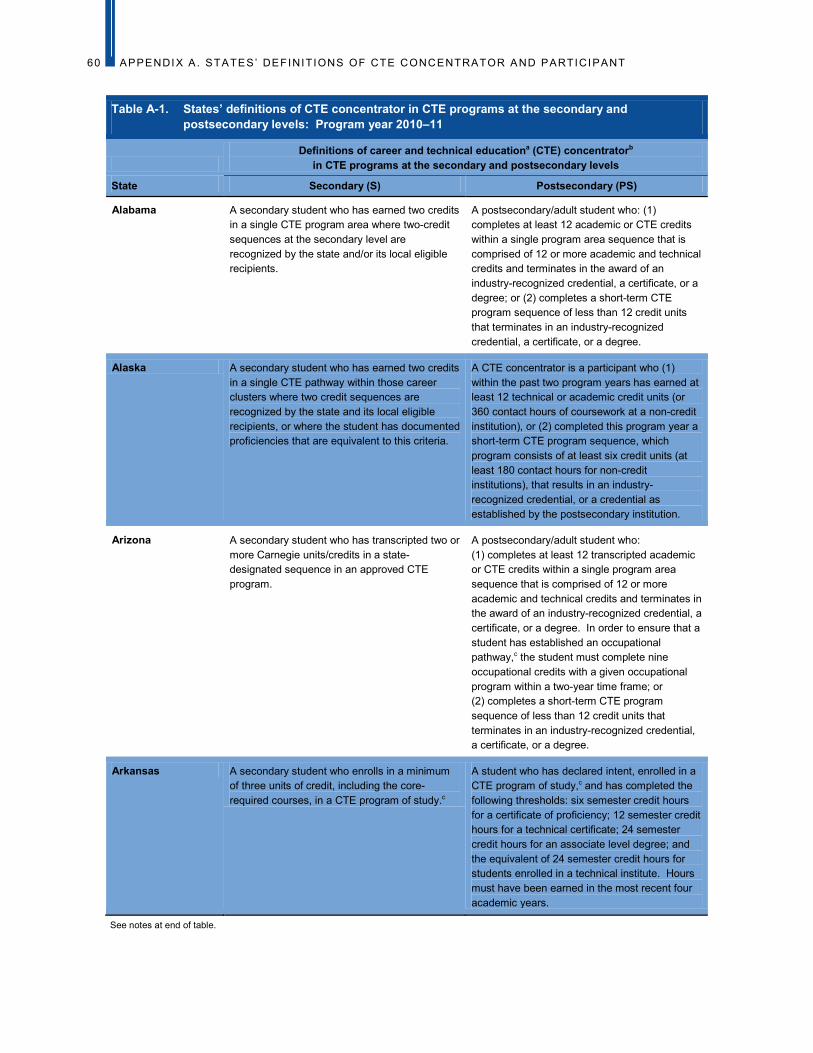
60 APPENDI X A . STATES’ DEFINIT IONS OF CTE CONCENTRATOR AND PARTICI PANT
Table A-1. States’ definitions of CTE concentrator in CTE programs at the secondary and postsecondary levels: Program year 2010–11
Definitions of career and technical educationa (CTE) concentratorb
in CTE programs at the secondary and postsecondary levels
State Secondary (S) Postsecondary (PS)
Alabama A secondary student who has earned two credits in a single CTE program area where two-credit sequences at the secondary level are recognized by the state and/or its local eligible recipients.
A postsecondary/adult student who: (1) completes at least 12 academic or CTE credits within a single program area sequence that is comprised of 12 or more academic and technical credits and terminates in the award of an industry-recognized credential, a certificate, or a degree; or (2) completes a short-term CTE program sequence of less than 12 credit units that terminates in an industry-recognized credential, a certificate, or a degree.
Alaska A secondary student who has earned two credits in a single CTE pathway within those career clusters where two credit sequences are recognized by the state and its local eligible recipients, or where the student has documented proficiencies that are equivalent to this criteria.
A CTE concentrator is a participant who (1) within the past two program years has earned at least 12 technical or academic credit units (or 360 contact hours of coursework at a non-credit institution), or (2) completed this program year a short-term CTE program sequence, which program consists of at least six credit units (at least 180 contact hours for non-credit institutions), that results in an industry-recognized credential, or a credential as established by the postsecondary institution.
Arizona A secondary student who has transcripted two or more Carnegie units/credits in a state-designated sequence in an approved CTE program.
A postsecondary/adult student who: (1) completes at least 12 transcripted academic or CTE credits within a single program area sequence that is comprised of 12 or more academic and technical credits and terminates in the award of an industry-recognized credential, a certificate, or a degree. In order to ensure that a student has established an occupational pathway,c the student must complete nine occupational credits with a given occupational program within a two-year time frame; or (2) completes a short-term CTE program sequence of less than 12 credit units that terminates in an industry-recognized credential, a certificate, or a degree.
Arkansas A secondary student who enrolls in a minimum of three units of credit, including the core-required courses, in a CTE program of study.c
A student who has declared intent, enrolled in a CTE program of study,c and has completed the following thresholds: six semester credit hours for a certificate of proficiency; 12 semester credit hours for a technical certificate; 24 semester credit hours for an associate level degree; and the equivalent of 24 semester credit hours for students enrolled in a technical institute. Hours must have been earned in the most recent four academic years.
See notes at end of table.

APPENDI X A . STATES’ DEFINIT IONS OF CTE CONCENTRATOR AND PARTICI PANT 61
Table A-1. States’ definitions of CTE concentrator in CTE programs at the secondary and postsecondary levels: Program year 2010–11—Continued
Definitions of career and technical educationa b (CTE) concentrator
in CTE programs at the secondary and postsecondary levels
State Secondary (S) Postsecondary (PS)
California A secondary CTE concentrator is a student who has completed 50 percent of a planned program sequence (in hours or credits) in a state-recognized CTE sequence and is enrolled in the next course in that sequence, or has completed 50 percent of a single, state-recognized, multi-hour course and is enrolled in the second half of that course.
For Perkins accountability purposes, a higher education CTE program “Concentrator” is defined as a student who has, within the previous three years, completed a minimum threshold of 12 or more units of related coursework in a CTE program area (defined as a two-digit TOPd code) with at least one of those courses teaching job-specific skills.
Colorado A secondary student who completed at least one-half of the credits required within any CTE program where credit, course(s), and academic term are defined in the CTE program approval documentation.
A postsecondary student who completed at least 50 percent of the minimum CTE credit hours required within a single CTE program area that terminates in a certificate or degree within the reporting year.
Connecticut A concentrator is a CTE student who is enrolled in a final course of a two-credit sequence of courses that specifically provides instruction in the state performance standards and competencies in one of Connecticut’s 20 CTE areas of concentration. To address the acquisition of competencies, courses included in a sequence may be academic and/or from different CTE programs. A student may be a concentrator for more than one year if that student continues to take courses that address the performance standards and competencies in one of the areas of concentration. A student may become a concentrator in more than one area of concentration in a given school year. To be considered a concentrator a student must be assessed in the State CTE Assessment program.
A concentrator is defined as any student in a given year who is enrolled in a program of study leading to an occupational degree or certificate (excludes all liberal arts and general studies students) and has completed at least 15 semester hours worth of course work.
Delaware A secondary student who successfully completed at least 50 percent of the credits required to complete a state-approved CTE pathway of sequenced courses and is enrolled in a course at the next level in the same pathway.
A postsecondary student who completed (1) at least 12 academic or CTE credits within a single CTE program area sequence that is comprised of 12 or more academic and technical credits and terminates in the award of an industry-recognized credential, a certificate, or a degree; or (2) a short-term CTE program sequence of less than 12 credit units that terminates in an industry-recognized credential, a certificate, or a degree.
District of Columbia A secondary student who is enrolled in a public or public charter high school in grades 9–12 and earned at least three credits or CUs in a recognized CTE program sequence of four CUs or more.
University of the District of Columbia students who have earned at least 12 credits in a CTE major requiring 12 credits or more (typically 48 credits), or who have completed a CTE program of studyc requiring less than 12 credits.

62 APPENDI X A . STATES’ DEFINIT IONS OF CTE CONCENTRATOR AND PARTICI PANT
Table A-1. States’ definitions of CTE concentrator in CTE programs at the secondary and postsecondary levels: Program year 2010–11—Continued
Definitions of career and technical educationa (CTE) concentratorb
in CTE programs at the secondary and postsecondary levels
State Secondary (S) Postsecondary (PS)
Florida A secondary student who has earned three or more credits in a single CTE program or two credits in a single CTE program, but only in those programs where two credit sequences at the secondary level are recognized by the state and/or its local eligible recipients.
A postsecondary student who completes at least one-third of the academic and/or technical hours in a college credit CTE program that terminates in the award of an industry-recognized credential, a certificate, or a degree.
Georgia A secondary student who earned three or more credits in a single CTE program area.
A student who had at least 12 credit hours in their enrollment history and is in a CTE-credit program.
Guam A secondary student who has earned two or more credits in a single CTE program during the reporting year.
A student who has declared a CTE program: (1) completes at least 12 academic or CTE credits within a single program area sequence that is comprised of 12 or more academic and technical credits and terminates in the award of an industry-recognized credential, a certificate, or a degree; or (2) completes a short-term CTE program sequence of less than 12 credit units that terminates in an industry-recognized credential, a certificate, or a degree.
Hawaii A twelfth grade student who has completed the requirements for her or his selected State Certified Career and Technical Education Program of Study.c A Program of Study includes two Carnegie units in the proper sequence in a single career pathway program area plus one required academic course.
A student in a declared CTE program who has completed at least 12 credits or the equivalent in a CTE program.
Idaho Any secondary junior or senior student who (1) completed three state-approved CTE courses in a program sequence and is enrolled in a capstone* course; (2) enrolled in a professional-technical school, and is in a capstone course; or (3) completed all of the CTE courses in a program sequence if less than three.
*A capstone course is a culminating course in a sequence of courses.
A postsecondary matriculated student who completed (1) at least the 12 technical-credit requirement within a single CTE program area or within CTE program requirements; or (2) a CTE program sequence with less than 12 technical credits that terminates in an industry-recognized credential, certificate, or degree.
Illinois A secondary student who earned three or more credits in a single CTE program area (e.g., health care or business services), or two credits in a single CTE program area, but only in those CTE program areas where two credit sequences at the secondary level are recognized by the state.
A postsecondary student who completed (1) at least 12 academic or CTE credits within a single program area sequence that is composed of 12 or more academic and technical credits and terminates in the award of an industry-recognized credential, a certificate, or a degree; or (2) a short-term CTE program sequence with a credential, certificate, or degree.

APPENDI X A . STATES’ DEFINIT IONS OF CTE CONCENTRATOR AND PARTICI PANT 63
Table A-1. States’ definitions of CTE concentrator in CTE programs at the secondary and postsecondary levels: Program year 2010–11—Continued
Definitions of career and technical educationa (CTE) concentratorb
in CTE programs at the secondary and postsecondary levels
State Secondary (S) Postsecondary (PS)
Indiana A secondary student who earned six or more Indiana credits in a single CTE career cluster or four Indiana credits in a single CTE career cluster in those program areas where four Indiana-credit sequences at the secondary level are recognized by the Indiana Department of Education. For one-credit courses, a student must earn credits in a sequence of at least four one-credit courses for those one-credit courses to be counted toward the student meeting the definition of a secondary CTE concentrator.
A postsecondary student who completed (1) at least 12 academic or CTE credits within a single program area sequence that is comprised of 12 or more academic and technical credits and terminates in the award of an industry-recognized credential, a certificate, or a degree; or (2) a short-term CTE program sequence of less than 12 credit units that terminates in an industry-recognized credential, a certificate, or a degree.
Iowa A secondary student who earned one and one-half or more units in a CTE program area.
A student who has earned one (1) or more credits in a CTE program area. A CTE concentrator is defined as a student who: (1) completes at least twelve (12) academic or technical credits within a single career and technical education program sequence that is comprised of 12 or more academic or technical credits that terminates in the award of an industry-recognized credential, a certificate, diploma, or a degree; or (2) completes a short-term CTE program sequence of less than 12 credits that terminates with an award of an industry-recognized credential, or a certificate.
Kansas A secondary student who has earned three or more CTE credits in a single CTE program area.
A postsecondary/adult student who: (1) earns at least 12 technical credits within a single CTE program area sequence that is comprised of 16 or more academic and technical credits and terminates in the award of an industry-recognized credential, a certificate, or a degree; or (2) completes a short-term CTE program sequence of less than 16-credit hours that terminates in an industry-recognized credential, a certificate, or associate degree.
Kentucky A secondary student who successfully completed 50 percent of the four credits and is enrolled in the third course, in a sequence of at least four-credit course sequence of a CTE program that requires at least four credits to complete the program.
A postsecondary student who completed 12 hours in a sequence of courses in a program of studyc and is enrolled in at least the thirteenth credit-hour course in the program of study leading to a certificate, diploma, or associate degree.
Louisiana A secondary student who has earned three or more credits in a single CTE program area (e.g., health care or business services), or two credits in a single CTE program area, but only in those program areas where two credit sequences at the secondary level are recognized by the state and/or its local eligible recipients.
A postsecondary/adult student who completes at least 12 academic or CTE credits within a single sequence of courses/pathway that is comprised of 12 or more academic and technical credits and terminates in the award of an industry-recognized credential, a certificate, or a degree.

64 APPENDI X A . STATES’ DEFINIT IONS OF CTE CONCENTRATOR AND PARTICI PANT
Table A-1. States’ definitions of CTE concentrator in CTE programs at the secondary and postsecondary levels: Program year 2010–11—Continued
Definitions of career and technical educationa (CTE) concentratorb
in CTE programs at the secondary and postsecondary levels
State Secondary (S) Postsecondary (PS)
Maine A secondary student who completed at least 50 percent of the standards in a state-approved CTE program.
A postsecondary student who, as of the fall term of the measurement year, completed (1) at least 12 academic or CTE credits within a single CTE program area sequence that is comprised of 12 or more academic and technical credits and terminates in the award of an industry-recognized credential, a certificate, or a degree; or (2) a short-term CTE program sequence of less than 12 credit units that terminates in an industry-recognized credential, a certificate, or a degree.
Maryland A secondary student who enrolls in a CTE course within a state-recognized sequence or program after completing earned credits in 50 percent of the total number of credits within the state-recognized sequence or CTE program.
A postsecondary student who completed at least 12 academic or CTE credits within a single CTE program area sequence that is comprised of 12 or more academic and technical credits and terminates in the award of an industry-recognized credential, a certificate, or a degree.
Massachusetts A secondary student who was enrolled in a CTE program for two years.
A student who is a CTE participant who earned 12 or more college CTE credits.
Michigan A secondary student who has completed a minimum of 50 percent of state-approved standards, plus enrolled in more credits, courses, hours, or units in a single program area to meet additional standards.
A postsecondary/adult student who: 1. Completes at least 12 academic or CTE credits within a single CTE program area sequence that is comprised of 12 or more academic and technical credits and terminates in the award of an industry-recognized credential, a certificate, or a degree. These credits must have been earned as of the beginning of the reporting year. 2. Completes a short-term CTE program sequence of less than 12 credits that terminates in an industry-recognized credential, a certificate, or a degree.
Minnesota A secondary student who has earned two credits in a single CTE career field.
A two-year college student in the Minnesota State Colleges and Universities System who belongs in a particular fiscal year cohort, and is enrolled in a long-term CTE program, and declared as their degree intent (major) a CTE award
OR
A two-year college student in the Minnesota State Colleges and Universities who belongs in a particular fiscal year cohort, and is enrolled in a short-term CTE program, and declared as their degree intent (major) a CTE award, and completed and received the award in which they declared their intent.

APPENDI X A . STATES’ DEFINIT IONS OF CTE CONCENTRATOR AND PARTICI PANT 65
Table A-1. States’ definitions of CTE concentrator in CTE programs at the secondary and postsecondary levels: Program year 2010–11—Continued
Definitions of career and technical educationa (CTE) concentratorb
in CTE programs at the secondary and postsecondary levels
State Secondary (S) Postsecondary (PS)
Mississippi A vocational student who completed the first year of a two-year CTE program and enrolled in the second year of the CTE program.
A postsecondary student who completed (1) at least 12 state-approved CTE credits within a single program sequence that is comprised of 12 or more academic and technical credits and terminates in the award of an industry-recognized credential, a certificate, or a degree; or (2) a short-term CTE program sequence of less than 12 CTE credit units that terminates in an industry-recognized credential, a certificate, or degree.
Missouri A secondary student who has earned three or more units of credit in a sequence in a Department-approved CTE program area.
A postsecondary student who completes a minimum of 12 CTE credits in a Department-approved CTE program area that terminates in a degree, certificate, or industry-recognized credential.
Montana A secondary student who earned three or more credits in any CTE program area.
A postsecondary student who completed (1) at least 12 academic or CTE credits within a single CTE program area sequence that is comprised of 12 or more academic and technical credits and terminates in the award of an industry-recognized credential, or a degree; or (2) a short term CTE program sequence of less than 12 credit units that terminates in an industry-recognized credential, a certificate or a degree.
Nebraska A secondary student who earned three or more credits in a single CTE program of studyc area (e.g., health sciences or business administration) or two credits in a single CTE program area, but only in those CTE program areas where two-credit sequences at the secondary level are recognized by the state.
A postsecondary student who completed (1) at least 12 academic or CTE credits within a single CTE program area sequence that is comprised of 12 or more academic and technical credits and terminates in the award of an industry-recognized credential, a certificate, or a degree; or (2) a short-term CTE program sequence of less than 12 credit units that terminates in an industry-recognized credential, a certificate, or a degree.
Nevada A secondary student enrolled who has earned a minimum of two credits in any CTE program area.
A postsecondary student who: (1) completes at least 12 CTE credits within a CTE program area that is comprised of 12 or more technical credits and terminates in the award of an industry-recognized credential, a state or locally recognized certificate, or a degree; or (2) completes a short-term CTE program of less than 12 credit units that terminates in an industry-recognized credential, a state or locally recognized degree or certificate.
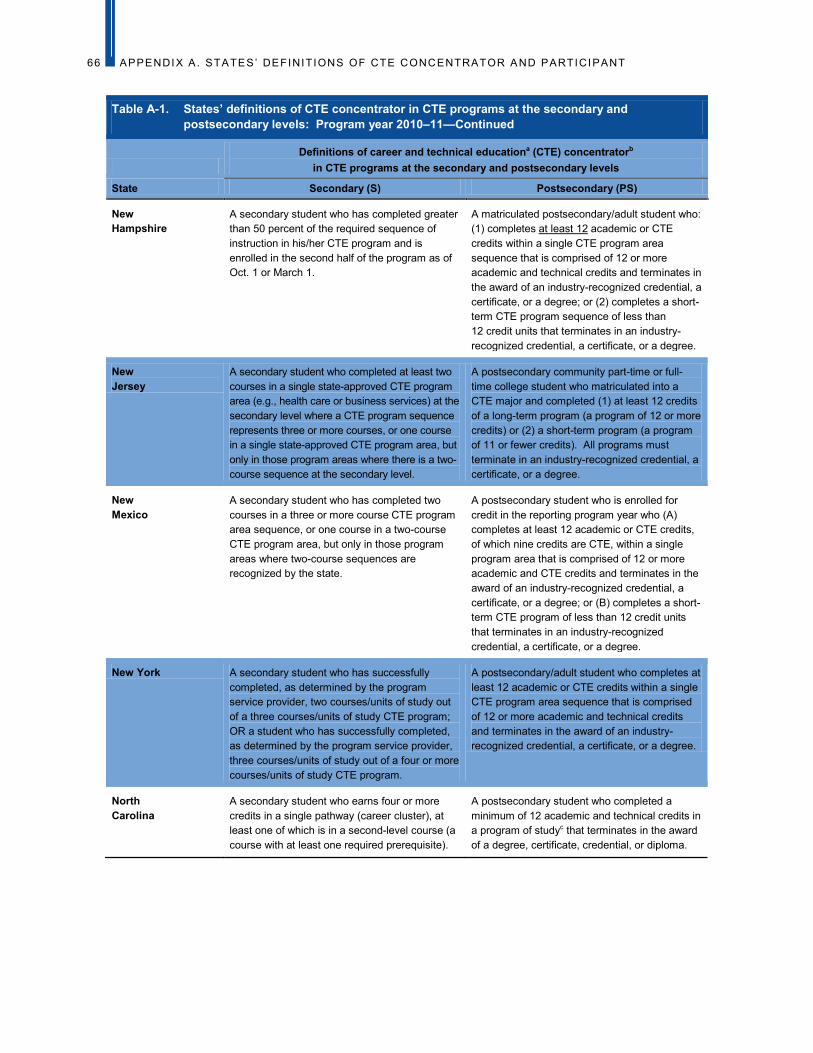
66 APPENDI X A . STATES’ DEFINIT IONS OF CTE CONCENTRATOR AND PARTICI PANT
Table A-1. States’ definitions of CTE concentrator in CTE programs at the secondary and postsecondary levels: Program year 2010–11—Continued
Definitions of career and technical educationa (CTE) concentratorb
in CTE programs at the secondary and postsecondary levels
State Secondary (S) Postsecondary (PS)
New Hampshire
A secondary student who has completed greater than 50 percent of the required sequence of instruction in his/her CTE program and is enrolled in the second half of the program as of Oct. 1 or March 1.
A matriculated postsecondary/adult student who: (1) completes at least 12 academic or CTE credits within a single CTE program area sequence that is comprised of 12 or more academic and technical credits and terminates in the award of an industry-recognized credential, a certificate, or a degree; or (2) completes a short-term CTE program sequence of less than 12 credit units that terminates in an industry-recognized credential, a certificate, or a degree.
New Jersey
A secondary student who completed at least two courses in a single state-approved CTE program area (e.g., health care or business services) at the secondary level where a CTE program sequence represents three or more courses, or one course in a single state-approved CTE program area, but only in those program areas where there is a two-course sequence at the secondary level.
A postsecondary community part-time or full-time college student who matriculated into a CTE major and completed (1) at least 12 credits of a long-term program (a program of 12 or more credits) or (2) a short-term program (a program of 11 or fewer credits). All programs must terminate in an industry-recognized credential, a certificate, or a degree.
New Mexico
A secondary student who has completed two courses in a three or more course CTE program area sequence, or one course in a two-course CTE program area, but only in those program areas where two-course sequences are recognized by the state.
A postsecondary student who is enrolled for credit in the reporting program year who (A) completes at least 12 academic or CTE credits, of which nine credits are CTE, within a single program area that is comprised of 12 or more academic and CTE credits and terminates in the award of an industry-recognized credential, a certificate, or a degree; or (B) completes a short-term CTE program of less than 12 credit units that terminates in an industry-recognized credential, a certificate, or a degree.
New York A secondary student who has successfully completed, as determined by the program service provider, two courses/units of study out of a three courses/units of study CTE program; OR a student who has successfully completed, as determined by the program service provider, three courses/units of study out of a four or more courses/units of study CTE program.
A postsecondary/adult student who completes at least 12 academic or CTE credits within a single CTE program area sequence that is comprised of 12 or more academic and technical credits and terminates in the award of an industry-recognized credential, a certificate, or a degree.
North Carolina
A secondary student who earns four or more credits in a single pathway (career cluster), at least one of which is in a second-level course (a course with at least one required prerequisite).
A postsecondary student who completed a minimum of 12 academic and technical credits in a program of studyc that terminates in the award of a degree, certificate, credential, or diploma.

APPENDI X A . STATES’ DEFINIT IONS OF CTE CONCENTRATOR AND PARTICI PANT 67
Table A-1. States’ definitions of CTE concentrator in CTE programs at the secondary and postsecondary levels: Program year 2010–11—Continued
Definitions of career and technical educationa (CTE) concentratorb
in CTE programs at the secondary and postsecondary levels
State Secondary (S) Postsecondary (PS)
North Dakota
A secondary student who has earned two or more credits in a single CTE program area (e.g., health care or business services) recognized by the state.
A postsecondary/adult student who: (1) completes at least 12 academic or CTE credits within a single program area sequence that is comprised of 12 or more academic and technical credits and terminates in the award of an industry-recognized credential, a certificate, or a degree; or (2) completes a short-term CTE program sequence of less than 12 credit units that terminates in an industry-recognized credential, a certificate, or a degree.
Ohio A secondary student who completed a minimum of 50 percent of the high school credits allowed for a single CTE workforce development program (e.g., health sciences or marketing), and enrolled for additional credit at the secondary level.
A postsecondary or adult student who completed (1) at least 12 CTE credits within a single CTE program area sequence that is comprised of 12 or more academic and technical credits and terminates in the award of an industry-recognized credential, a certificate, or a degree; or (2) a short-term CTE program sequence of less than 12 credit units that terminates in an industry-recognized credential, a certificate, or a degree.
Oklahoma A secondary student who has enrolled in three or more credits in a single CTE pathway.
A postsecondary student who (1) completes at least 30 academic or CTE credit hours toward a certificate or associate in applied science degree program that is comprised of 30 or more academic and technical credit hours; or (2) completes a short-term CTE program sequence of less than 30 credit hours that terminates in an industry-recognized credential, a certificate, or a degree.
Oregon Any secondary student who has earned one or more credits in a technical skill course(s) part of an Oregon state-approved CTE Program of Study, of which at least one-half (.5) credit must be designated as a “required” CTE course for program completion.
A postsecondary student who is enrolled for credit in the current academic year who has completed 18 or more program credits, of which nine credits are CTE, within a single CTE Program of Study that terminates in the award of a degree, a certificate of completion, or an industry-recognized credential.
Pennsylvania A secondary student, who, by the end of the reporting school year, was reported as having earned at least 50 percent of the minimum technical instructional hours required for Pennsylvania Department of Education program approval.
A postsecondary student, who, by the end of the reporting school year, was reported as having been enrolled in an approved occupational program and completed at least 12 academic or CTE credits within a single program area sequence that is comprised of 12 or more academic and technical credits and terminates in the award of an industry-recognized credential, a certificate, or a degree.
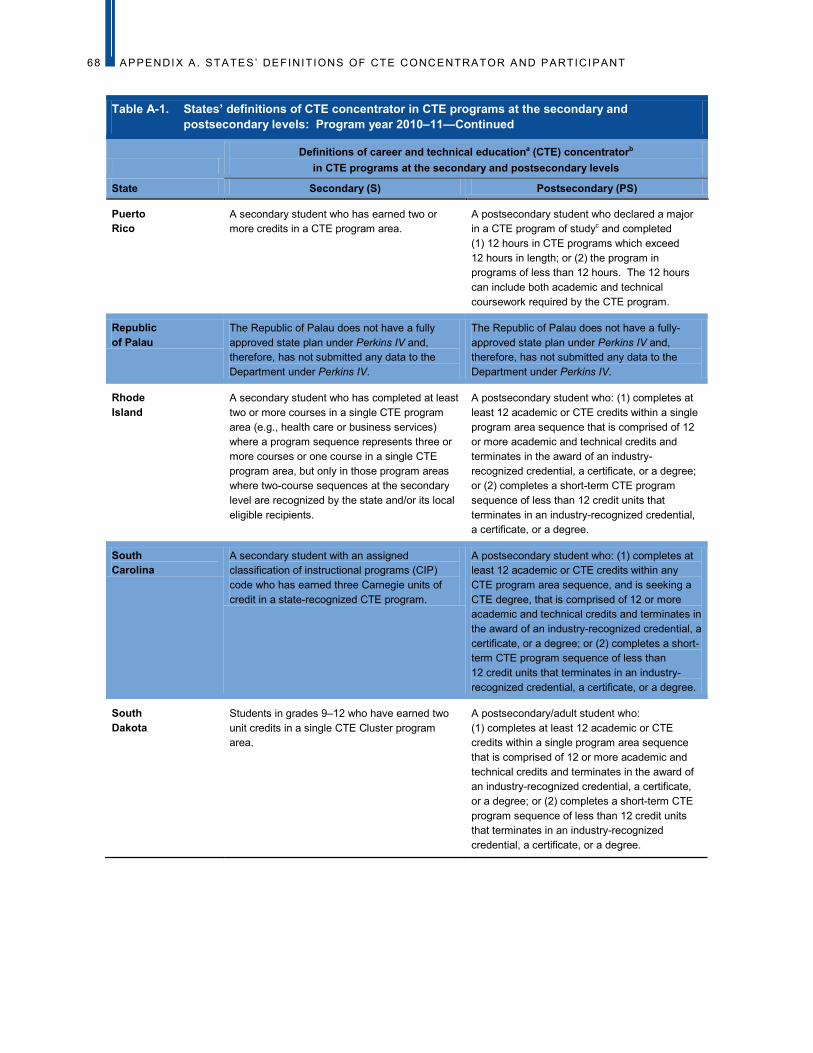
68 APPENDI X A . STATES’ DEFINIT IONS OF CTE CONCENTRATOR AND PARTICI PANT
Table A-1. States’ definitions of CTE concentrator in CTE programs at the secondary and postsecondary levels: Program year 2010–11—Continued
Definitions of career and technical educationa (CTE) concentratorb
in CTE programs at the secondary and postsecondary levels
State Secondary (S) Postsecondary (PS)
Puerto Rico
A secondary student who has earned two or more credits in a CTE program area.
A postsecondary student who declared a major in a CTE program of studyc and completed (1) 12 hours in CTE programs which exceed 12 hours in length; or (2) the program in programs of less than 12 hours. The 12 hours can include both academic and technical coursework required by the CTE program.
Republic of Palau
The Republic of Palau does not have a fully approved state plan under Perkins IV and, therefore, has not submitted any data to the Department under Perkins IV.
The Republic of Palau does not have a fully-approved state plan under Perkins IV and, therefore, has not submitted any data to the Department under Perkins IV.
Rhode Island
A secondary student who has completed at least two or more courses in a single CTE program area (e.g., health care or business services) where a program sequence represents three or more courses or one course in a single CTE program area, but only in those program areas where two-course sequences at the secondary level are recognized by the state and/or its local eligible recipients.
A postsecondary student who: (1) completes at least 12 academic or CTE credits within a single program area sequence that is comprised of 12 or more academic and technical credits and terminates in the award of an industry-recognized credential, a certificate, or a degree; or (2) completes a short-term CTE program sequence of less than 12 credit units that terminates in an industry-recognized credential, a certificate, or a degree.
South Carolina
A secondary student with an assigned classification of instructional programs (CIP) code who has earned three Carnegie units of credit in a state-recognized CTE program.
A postsecondary student who: (1) completes at least 12 academic or CTE credits within any CTE program area sequence, and is seeking a CTE degree, that is comprised of 12 or more academic and technical credits and terminates in the award of an industry-recognized credential, a certificate, or a degree; or (2) completes a short-term CTE program sequence of less than 12 credit units that terminates in an industry-recognized credential, a certificate, or a degree.
South Dakota
Students in grades 9–12 who have earned two unit credits in a single CTE Cluster program area.
A postsecondary/adult student who: (1) completes at least 12 academic or CTE credits within a single program area sequence that is comprised of 12 or more academic and technical credits and terminates in the award of an industry-recognized credential, a certificate, or a degree; or (2) completes a short-term CTE program sequence of less than 12 credit units that terminates in an industry-recognized credential, a certificate, or a degree.
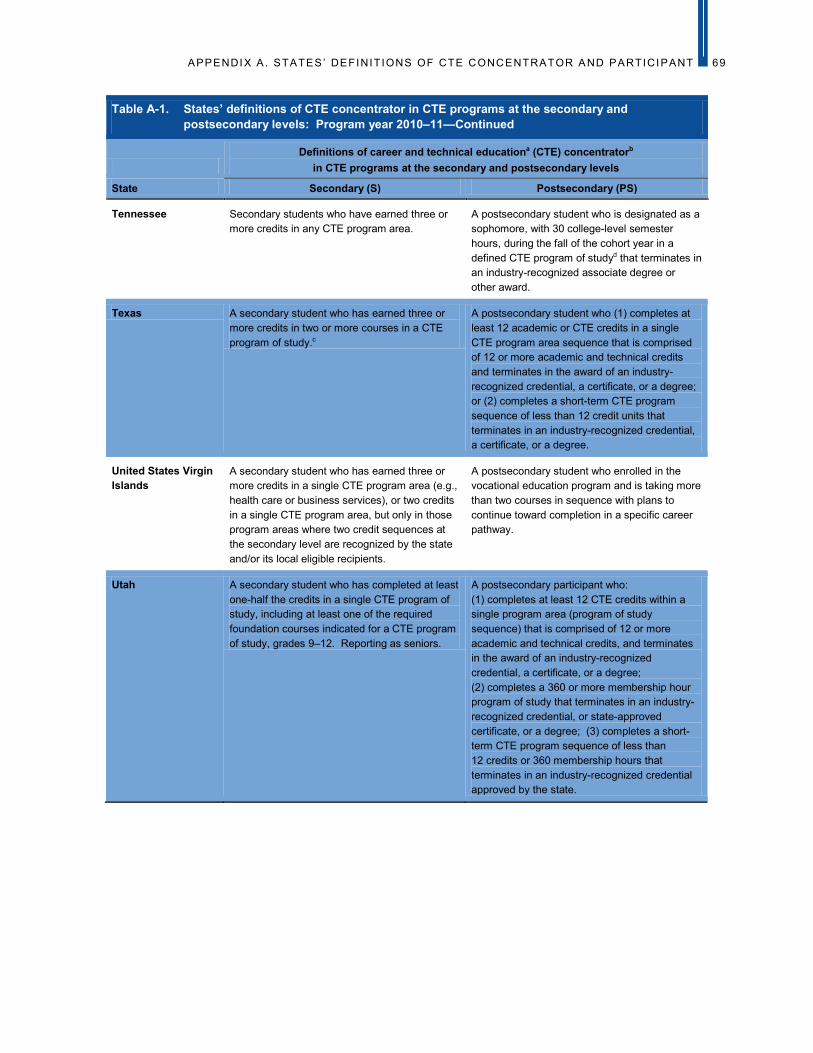
APPENDI X A . STATES’ DEFINIT IONS OF CTE CONCENTRATOR AND PARTICI PANT 69
Table A-1. States’ definitions of CTE concentrator in CTE programs at the secondary and postsecondary levels: Program year 2010–11—Continued
Definitions of career and technical educationa (CTE) concentratorb
in CTE programs at the secondary and postsecondary levels
State Secondary (S) Postsecondary (PS)
Tennessee Secondary students who have earned three or more credits in any CTE program area.
A postsecondary student who is designated as a sophomore, with 30 college-level semester hours, during the fall of the cohort year in a defined CTE program of studyd that terminates in an industry-recognized associate degree or other award.
Texas A secondary student who has earned three or more credits in two or more courses in a CTE program of study.c
A postsecondary student who (1) completes at least 12 academic or CTE credits in a single CTE program area sequence that is comprised of 12 or more academic and technical credits and terminates in the award of an industry-recognized credential, a certificate, or a degree; or (2) completes a short-term CTE program sequence of less than 12 credit units that terminates in an industry-recognized credential, a certificate, or a degree.
United States Virgin Islands
A secondary student who has earned three or more credits in a single CTE program area (e.g., health care or business services), or two credits in a single CTE program area, but only in those program areas where two credit sequences at the secondary level are recognized by the state and/or its local eligible recipients.
A postsecondary student who enrolled in the vocational education program and is taking more than two courses in sequence with plans to continue toward completion in a specific career pathway.
Utah A secondary student who has completed at least one-half the credits in a single CTE program of study, including at least one of the required foundation courses indicated for a CTE program of study, grades 9–12. Reporting as seniors.
A postsecondary participant who: (1) completes at least 12 CTE credits within a single program area (program of study sequence) that is comprised of 12 or more academic and technical credits, and terminates in the award of an industry-recognized credential, a certificate, or a degree; (2) completes a 360 or more membership hour program of study that terminates in an industry-recognized credential, or state-approved certificate, or a degree; (3) completes a short-term CTE program sequence of less than 12 credits or 360 membership hours that terminates in an industry-recognized credential approved by the state.

70 APPENDI X A . STATES’ DEFINIT IONS OF CTE CONCENTRATOR AND PARTICI PANT
Table A-1. States’ definitions of CTE concentrator in CTE programs at the secondary and postsecondary levels: Program year 2010–11—Continued
Definitions of career and technical educationa (CTE) concentratorb
in CTE programs at the secondary and postsecondary levels
State Secondary (S) Postsecondary (PS)
Vermont A secondary student enrolled in a state approved CTE program who has completed greater than 50 percent of the required sequence of instruction in his/her CTE program and is enrolled in the second half of the program or who has completed half of the program’s required skill assessments.
A postsecondary student who has completed 50 percent of the credits required for earning the program’s degree or certificate.
Virginia A secondary student who earned three or more credits in a single CTE program area (e.g., health care or business services) or two credits in a single CTE program area, but only in those CTE program areas where two-credit sequences at the secondary level are recognized by the state.
A postsecondary student who completed (1) at least 12 CTE credits within a single CTE program area sequence that is comprised of 12 or more academic and technical credits and terminates in the award of an industry-recognized credential, a certificate, or a degree; or (2) a short-term CTE program sequence of less than 12 credit units that terminates in an industry-recognized credential, a certificate, or a degree.
Washington A secondary student who has enrolled in two or more CTE courses above the exploratory level in a single career cluster.
A postsecondary CTE participant who has completed at least 12 CTE credits or completed an industry-recognized credential or formal award.
West Virginia
Concentrators will be those secondary students who successfully complete the four required courses in an occupational CTE concentration as approved by the Division of Technical and Adult Education.
A postsecondary student who: (1) completes at least 12 academic or CTE credits within a single program area sequence that is comprised of 12 or more academic and technical credits and terminates in the award of an industry-recognized credential, a certificate, or a degree; or (2) completes a short-term CTE program sequence of less than 12 credit units that terminates in an industry-recognized credential, a certificate, or a degree.
Wisconsin A secondary student who completed a minimum of two CTE courses within the student’s chosen pathway and is enrolled in continuing CTE courses in that pathway for the current reporting year.
A postsecondary student who (1) is reported as enrolled in a one-year diploma, two-year diploma, associate degree or apprenticeship program and has completed, in three years, 12 credits applicable to that program or (2) completed eight credits in an apprenticeship program.
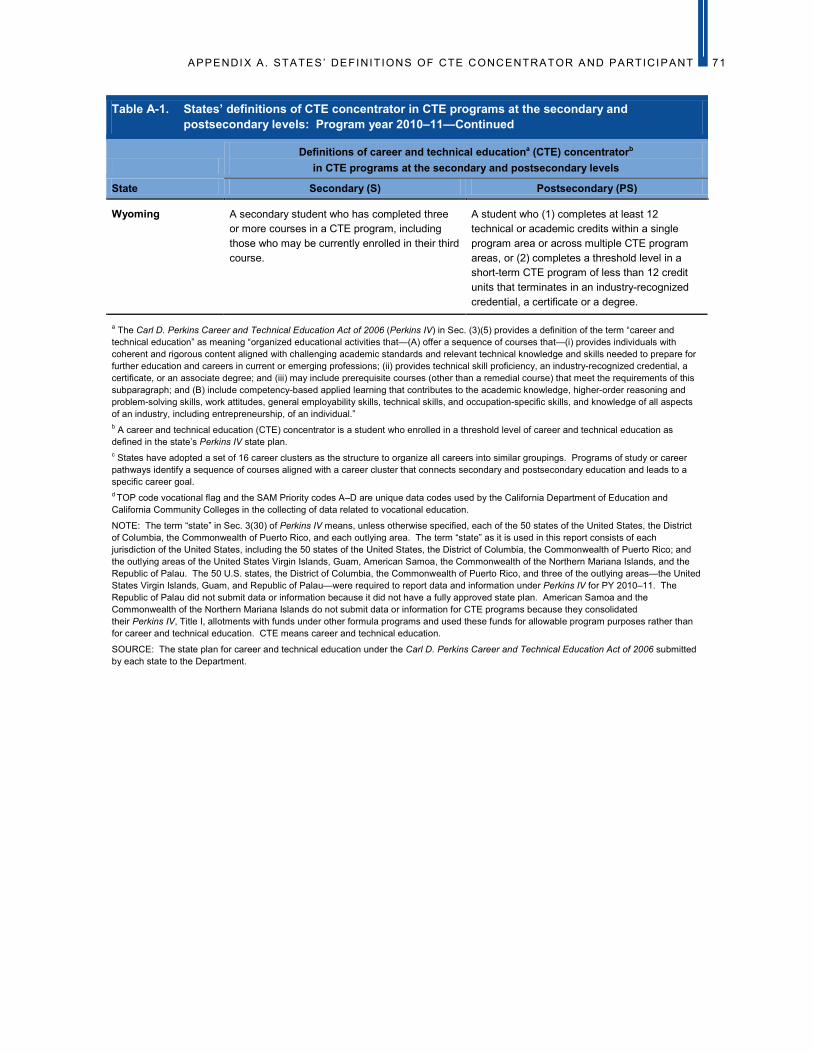
APPENDI X A . STATES’ DEFINIT IONS OF CTE CONCENTRATOR AND PARTICI PANT 71
Table A-1. States’ definitions of CTE concentrator in CTE programs at the secondary and postsecondary levels: Program year 2010–11—Continued
Definitions of career and technical educationa (CTE) concentratorb
in CTE programs at the secondary and postsecondary levels
State Secondary (S) Postsecondary (PS)
Wyoming A secondary student who has completed three or more courses in a CTE program, including those who may be currently enrolled in their third course.
A student who (1) completes at least 12 technical or academic credits within a single program area or across multiple CTE program areas, or (2) completes a threshold level in a short-term CTE program of less than 12 credit units that terminates in an industry-recognized credential, a certificate or a degree.
a The Carl D. Perkins Career and Technical Education Act of 2006 (Perkins IV) in Sec. (3)(5) provides a definition of the term “career and technical education” as meaning “organized educational activities that—(A) offer a sequence of courses that—(i) provides individuals with coherent and rigorous content aligned with challenging academic standards and relevant technical knowledge and skills needed to prepare for further education and careers in current or emerging professions; (ii) provides technical skill proficiency, an industry-recognized credential, a certificate, or an associate degree; and (iii) may include prerequisite courses (other than a remedial course) that meet the requirements of this subparagraph; and (B) include competency-based applied learning that contributes to the academic knowledge, higher-order reasoning and problem-solving skills, work attitudes, general employability skills, technical skills, and occupation-specific skills, and knowledge of all aspects of an industry, including entrepreneurship, of an individual.” b A career and technical education (CTE) concentrator is a student who enrolled in a threshold level of career and technical education as defined in the state’s Perkins IV state plan. c States have adopted a set of 16 career clusters as the structure to organize all careers into similar groupings. Programs of study or career pathways identify a sequence of courses aligned with a career cluster that connects secondary and postsecondary education and leads to a specific career goal. d TOP code vocational flag and the SAM Priority codes A–D are unique data codes used by the California Department of Education and California Community Colleges in the collecting of data related to vocational education.
NOTE: The term “state” in Sec. 3(30) of Perkins IV means, unless otherwise specified, each of the 50 states of the United States, the District of Columbia, the Commonwealth of Puerto Rico, and each outlying area. The term “state” as it is used in this report consists of each jurisdiction of the United States, including the 50 states of the United States, the District of Columbia, the Commonwealth of Puerto Rico; and the outlying areas of the United States Virgin Islands, Guam, American Samoa, the Commonwealth of the Northern Mariana Islands, and the Republic of Palau. The 50 U.S. states, the District of Columbia, the Commonwealth of Puerto Rico, and three of the outlying areas—the United States Virgin Islands, Guam, and Republic of Palau—were required to report data and information under Perkins IV for PY 2010–11. The Republic of Palau did not submit data or information because it did not have a fully approved state plan. American Samoa and the Commonwealth of the Northern Mariana Islands do not submit data or information for CTE programs because they consolidated their Perkins IV, Title I, allotments with funds under other formula programs and used these funds for allowable program purposes rather than for career and technical education. CTE means career and technical education.
SOURCE: The state plan for career and technical education under the Carl D. Perkins Career and Technical Education Act of 2006 submitted by each state to the Department.

72 APPENDI X A . STATES’ DEFINIT IONS OF CTE CONCENTRATOR AND PARTICI PANT
Table A-2. States’ definitions of CTE participant in CTE programs at the secondary and postsecondary levels: Program year 2010–11
Definitions of career and technical educationa (CTE) participantb in CTE programs at the
secondary and postsecondary levels
State Secondary (S) Postsecondary (PS)
Alabama Students who have earned one or more credits in any career and technical education (CTE) program area.
Students who have earned one or more credits in any CTE program area.
Alaska A secondary student who has earned credit in one or more approved course(s) in any CTE program area.
A student admitted to a postsecondary CTE program, which program consists of at least six credits for credit bearing institutions or at least 180 contact hours for a non-credit institution, and who takes a CTE course during the program year.
Arizona A secondary student who has earned one or more transcripted Carnegie units/credits in any CTE program area in the reporting year.
A postsecondary/adult student who has earned one or more transcripted credits in any CTE program area in the reporting year.
Arkansas Students who enroll in one unit of credit in CTE. Students who have declared intent, enrolled in a CTE program area, and earned a minimum of 3 semester credit hours.
California A secondary CTE participant is a student who has completed the equivalent of a conventional 50-minute class taken five times per week for 180 school days or approximately 150 hours of instruction in a state-recognized CTE sequence or program.
Participation does not use any “threshold of enrollments” to determine if a student is vocational. Any enrollment in a course determined to be vocational, as indicated by the TOP code vocational flag and the SAM Priority codes A–D,c qualifies the student as a participant. This definition was put in place to comply with requirements set by OVAE103 for 2002–03 Nontraditional Participation reporting.
Colorado A secondary student who has completed one or more credits or courses within any CTE program where credit, course(s), and academic term are defined in the program approval documentation.
A postsecondary student who has completed six CTE credit hours within any CTE program area (defined by CIPd code) within the reporting year.
Connecticut A student who takes at least one CTE course. A student who is enrolled in a program of study leading to an occupational degree or certificate (excludes all liberal arts and general studies students).
Delaware A secondary student who has completed one course in any CTE program area.
A postsecondary/adult student who has earned one or more credits in any CTE program area.
See notes at end of table.
103 On Jan. 18, 2014, the name of the Office of Vocational and Adult Education (OVAE) was officially changed to the Office of Career, Technical, and Adult Education (OCTAE).

APPENDI X A . STATES’ DEFINIT IONS OF CTE CONCENTRATOR AND PARTICI PANT 73
Table A-2. States’ definitions of CTE participant in CTE programs at the secondary and postsecondary levels: Program year 2010–11—Continued
Definitions of career and technical educationa (CTE) participantb in CTE programs at the
secondary and postsecondary levels
State Secondary (S) Postsecondary (PS)
District of Columbia Students enrolled in DC public or public charter high schools in grades 9–12 who have earned at least one credit (Carnegie Unit) in a recognized CTE program sequence of four CUs or more.
Students enrolled at the University of the District of Columbia who have earned at least one credit in a recognized CTE program of study/major leading to the award of an industry-recognized credential and/or a degree or certificate.
Florida A secondary student who has earned one or more credits in any CTE program.
A postsecondary/adult student who has earned one or more credits in any college credit CTE program.
Georgia A student who has earned one or more credits in any CTE program area.
Students having taken at least one CTE course.
Guam A student who has earned half or more credits in any CTE program during the reporting year.
A student who has earned one or more credits in a CTE program area during the reporting year.
Hawaii A student who has earned one or more credits in any CTE program area.
A student in a declared CTE program who has completed at least one credit or the equivalent in a CTE program.
Idaho Any secondary student who has earned one or more credits in any professional-technical state-approved program.
A postsecondary matriculated student who has earned one or more credits in any state approved professional-technical program. (A matriculated student is defined as a student enrolled in courses at a college who has applied for admission and has been accepted in a certificate or degree program.)
Illinois A secondary student who has earned one or more credits in any CTE program area.
A postsecondary/adult student who has earned one or more credits in any CTE program area.
Indiana A secondary student who has earned one or more credits in any CTE program area.
A postsecondary/adult student who has earned one or more credits in any CTE program area.
Iowa A secondary student who has earned one-half or more units in any CTE program area.
A postsecondary student who has earned one or more credits in a CTE program.
Kansas A secondary student who has earned one or more CTE credits in any CTE program area.
A postsecondary/adult student who has earned one or more CTE credits in any CTE program area.
Kentucky Students enrolled in the beginning sequence of courses leading to two credits in a CTE program that requires at least four credits to complete the program.
Students who are enrolled in a sequence of courses in a CTE major (program of study) and have completed 12 hours or less for credit toward a certificate, diploma, or associate degree.

74 APPENDI X A . STATES’ DEFINIT IONS OF CTE CONCENTRATOR AND PARTICI PANT
Table A-2. States’ definitions of CTE participant in CTE programs at the secondary and postsecondary levels: Program year 2010–11—Continued
Definitions of career and technical educationa (CTE) participantb in CTE programs at the
secondary and postsecondary levels
State Secondary (S) Postsecondary (PS)
Louisiana A secondary student who enrolled in a vocational education course. The threshold level to be a participant is defined by the state, with most states defining a CTE participant as a student who has completed at least one course (or a substantial portion of it), and may be enrolled in another course. This definition includes students who have reached the threshold level of concentrator.
A postsecondary/adult student who has earned one or more credits in any CTE program area.
Maine A secondary student who has earned one or more credits in any CTE program area.
A postsecondary/adult student who has earned one or more credits in any CTE program area.
Maryland A secondary student who enrolls in a course or unit of instruction within a state-recognized sequence or program.
A postsecondary/adult student who enrolls in one or more credits in a state-recognized CTE program that terminates in an industry-recognized credential, certificate, or degree.
Massachusetts A student at the secondary level who was enrolled for one year in any CTE program. In Massachusetts, the Student Information Management System (SIMS) is used to capture data on participants on the secondary level. The students reported in SIMS as enrolled in a CTE program in October and June of the same school year are participants.
A student who has been formally admitted (matriculated) into a specific CTE program and is enrolled in at least one for-credit course for the fall semester.
Michigan A secondary student who has completed a minimum of 10 percent of state approved standards in any CTE program area.
A postsecondary/adult student who has one or more credits in any CTE program area.
Minnesota A secondary student who earns one or more credits in any CTE field.
A two-year college student in the Minnesota State Colleges and Universities System who belongs to a particular fiscal year cohort, and is enrolled in a CTE program, and declared as their degree intent (major) a CTE award OR A two-year college student in the Minnesota State Colleges and Universities System who belongs to a particular fiscal year cohort, and enrolls in a CTE course.
Mississippi A student enrolled in a vocational and technical program.
A postsecondary/adult student who has earned one or more Perkins credits in any CTE program area.

APPENDI X A . STATES’ DEFINIT IONS OF CTE CONCENTRATOR AND PARTICI PANT 75
Table A-2. States’ definitions of CTE participant in CTE programs at the secondary and postsecondary levels: Program year 2010–11—Continued
Definitions of career and technical educationa (CTE) participantb in CTE programs at the
secondary and postsecondary levels
State Secondary (S) Postsecondary (PS)
Missouri A secondary student who has earned one or more credits in any Department-approved CTE program area.
A postsecondary student who has earned one or more credits in any Department-approved CTE program area.
Montana A secondary student who has earned one or more credits in any CTE program area.
A postsecondary student who has enrolled in a CTE program.
Nebraska A secondary student who has earned one or more credits in any CTE program area.
A postsecondary student who has earned one or more credits in any CTE program area.
Nevada A secondary student who has earned a minimum of one credit in any CTE program area.
A postsecondary student who has earned a minimum of one credit in any CTE program area.
New Hampshire
A secondary student who has earned one or more credits in any CTE program area.
A postsecondary/adult student who has earned one or more credits in any CTE program area.
New Jersey
A secondary student who has earned at least one CTE course in any state-approved CTE program area.
A postsecondary community college student (part-time or full-time) who has completed at least one CTE course in any CTE program area.
New Mexico
A secondary student who has completed one or more courses in any CTE program area.
A postsecondary student who has completed at least one CTE course in any CTE program area.
New York A student who has successfully completed, as determined by the program service provider, at least one course or unit of study in a CTE program.
A postsecondary/adult student who has earned one or more credits in any CTE program area.
North Carolina
Secondary student enrolled in one or more CTE course(s).
A postsecondary student who has earned one or more credits in any CTE program area.
North Dakota
A secondary student who has completed one or more course(s) in any CTE program area.
A postsecondary/adult student who has earned one or more credits in any CTE program area.
Ohio A secondary student who has earned credit in one or more courses in any CTE workforce development program area.
A postsecondary/adult student who has earned one or more credits in any CTE program area.
Oklahoma A secondary student who has enrolled in less than 360 course hours (3 Carnegie units of credit) in a single CTE pathway.
• A secondary credit is the secondary instructional time required to earn a standard Carnegie unit for high school credit in Oklahoma.
A postsecondary student who has earned one or more semester credit hours in any CTE program area.

76 APPENDI X A . STATES’ DEFINIT IONS OF CTE CONCENTRATOR AND PARTICI PANT
Table A-2. States’ definitions of CTE participant in CTE programs at the secondary and postsecondary levels: Program year 2010–11—Continued
Definitions of career and technical educationa (CTE) participantb in CTE programs at the
secondary and postsecondary levels
State Secondary (S) Postsecondary (PS)
Oregon Any secondary student who has earned one-half or more credits in any technical skill course part of an Oregon state-approved CTE Program of Study.
A postsecondary student who has earned one or more CTE credits in any CTE Program of Study within the reporting year.
Pennsylvania A student, who by the end of the reporting school year, was reported as having earned at least 10 percent of the minimum technical instructional hours required for Pennsylvania Department of Education program approval.
A postsecondary student, who by the end of the reporting school year, was reported as having earned more than one academic or CTE credits required by an approved occupational program.
Puerto Rico
A secondary student who has enrolled in one or more credits in any CTE program area.
A postsecondary student who has enrolled in one or more credits in a CTE program area.
Republic of Palau
The Republic of Palau does not have a fully approved state plan under Perkins IV and, therefore, has not submitted any data to the Department under Perkins IV.
The Republic of Palau does not have a fully-approved state plan under Perkins IV and, therefore, has not submitted any data to the Department under Perkins IV.
Rhode Island
A student enrolled in any one or more nonsequential CTE courses.
A postsecondary student who has earned one or more credits in any CTE program area.
South Carolina
A secondary student enrolled in a state-approved CTE course.
A postsecondary student who has earned one or more credits in any CTE program area.
South Dakota
A secondary student who has enrolled in any CTE program.
A postsecondary/adult student who has earned one or more credits in any CTE program area.
Tennessee Secondary students who have earned one or more CTE credits.
A postsecondary student who is enrolled on the 14th day of the beginning of the fall term in any CTE program area.
Texas A secondary student who has earned credit in any CTE course.
A postsecondary student who has earned one or more credits in any CTE program area.
United States Virgin Islands
A secondary student who has earned one or more credits in any CTE program area.
A postsecondary/adult student who has earned one or more credits in any CTE program area.
Utah A secondary student who has earned one or more semester credits in any CTE program area, grades 9–12. Reporting as seniors.
A postsecondary student who has earned one or more credits in any CTE program area.
Vermont A secondary student who is enrolled in a state approved technical education program that addresses the core academic and technical competencies identified as needed for employment and/or further education in a career cluster.
A postsecondary student who has earned at least six credits required by their degree/certificate program and is enrolled in at least one academic or CTE three-credit course in their degree/certificate program during the fall semester of the reporting year.
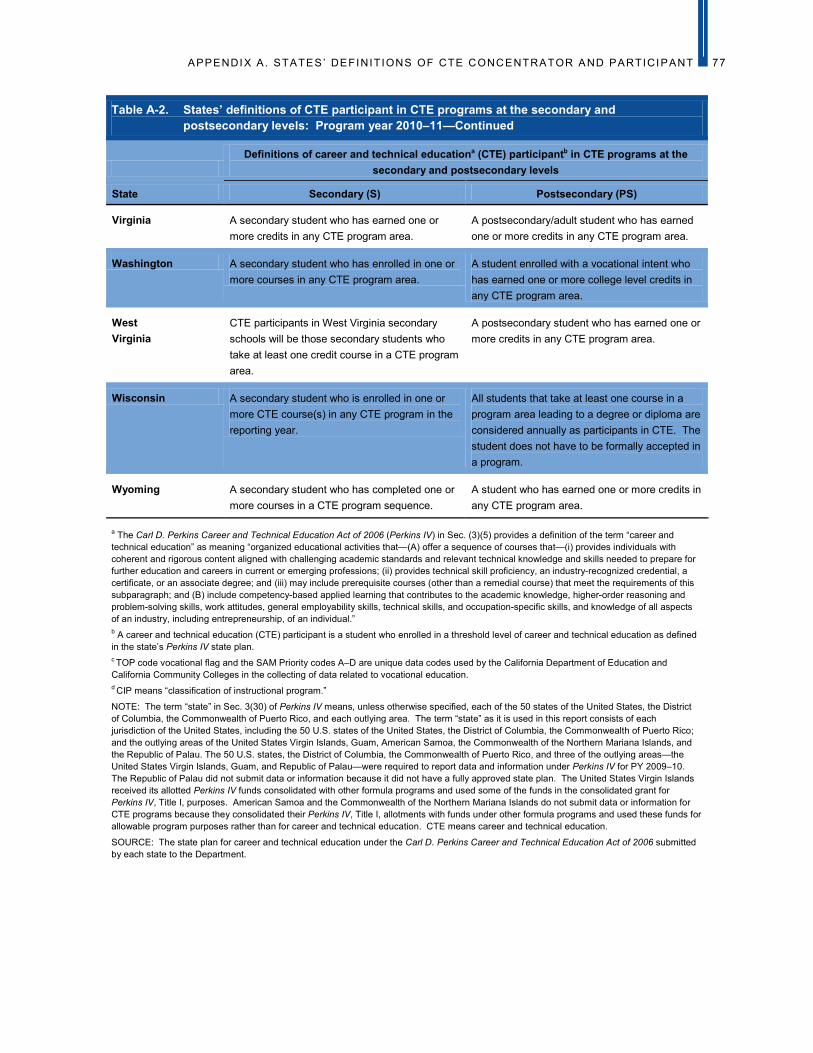
APPENDI X A . STATES’ DEFINIT IONS OF CTE CONCENTRATOR AND PARTICI PANT 77
Table A-2. States’ definitions of CTE participant in CTE programs at the secondary and postsecondary levels: Program year 2010–11—Continued
Definitions of career and technical educationa (CTE) participantb in CTE programs at the
secondary and postsecondary levels
State Secondary (S) Postsecondary (PS)
Virginia A secondary student who has earned one or more credits in any CTE program area.
A postsecondary/adult student who has earned one or more credits in any CTE program area.
Washington A secondary student who has enrolled in one or more courses in any CTE program area.
A student enrolled with a vocational intent who has earned one or more college level credits in any CTE program area.
West Virginia
CTE participants in West Virginia secondary schools will be those secondary students who take at least one credit course in a CTE program area.
A postsecondary student who has earned one or more credits in any CTE program area.
Wisconsin A secondary student who is enrolled in one or more CTE course(s) in any CTE program in the reporting year.
All students that take at least one course in a program area leading to a degree or diploma are considered annually as participants in CTE. The student does not have to be formally accepted in a program.
Wyoming A secondary student who has completed one or more courses in a CTE program sequence.
A student who has earned one or more credits in any CTE program area.
a The Carl D. Perkins Career and Technical Education Act of 2006 (Perkins IV) in Sec. (3)(5) provides a definition of the term “career and technical education” as meaning “organized educational activities that—(A) offer a sequence of courses that—(i) provides individuals with coherent and rigorous content aligned with challenging academic standards and relevant technical knowledge and skills needed to prepare for further education and careers in current or emerging professions; (ii) provides technical skill proficiency, an industry-recognized credential, a certificate, or an associate degree; and (iii) may include prerequisite courses (other than a remedial course) that meet the requirements of this subparagraph; and (B) include competency-based applied learning that contributes to the academic knowledge, higher-order reasoning and problem-solving skills, work attitudes, general employability skills, technical skills, and occupation-specific skills, and knowledge of all aspects of an industry, including entrepreneurship, of an individual.” b A career and technical education (CTE) participant is a student who enrolled in a threshold level of career and technical education as defined in the state’s Perkins IV state plan. c TOP code vocational flag and the SAM Priority codes A–D are unique data codes used by the California Department of Education and California Community Colleges in the collecting of data related to vocational education. d CIP means “classification of instructional program.”
NOTE: The term “state” in Sec. 3(30) of Perkins IV means, unless otherwise specified, each of the 50 states of the United States, the District of Columbia, the Commonwealth of Puerto Rico, and each outlying area. The term “state” as it is used in this report consists of each jurisdiction of the United States, including the 50 U.S. states of the United States, the District of Columbia, the Commonwealth of Puerto Rico; and the outlying areas of the United States Virgin Islands, Guam, American Samoa, the Commonwealth of the Northern Mariana Islands, and the Republic of Palau. The 50 U.S. states, the District of Columbia, the Commonwealth of Puerto Rico, and three of the outlying areas—the United States Virgin Islands, Guam, and Republic of Palau—were required to report data and information under Perkins IV for PY 2009–10. The Republic of Palau did not submit data or information because it did not have a fully approved state plan. The United States Virgin Islands received its allotted Perkins IV funds consolidated with other formula programs and used some of the funds in the consolidated grant for Perkins IV, Title I, purposes. American Samoa and the Commonwealth of the Northern Mariana Islands do not submit data or information for CTE programs because they consolidated their Perkins IV, Title I, allotments with funds under other formula programs and used these funds for allowable program purposes rather than for career and technical education. CTE means career and technical education.
SOURCE: The state plan for career and technical education under the Carl D. Perkins Career and Technical Education Act of 2006 submitted by each state to the Department.

THIS PAGE INTENTIONALLY LEFT BLANK

79
Appendix B Individual State104 Performance Profiles, Program Year 2010–11
Appendix B provides state profiles containing performance data105 on the Carl D. Perkins Career and Technical Education Act of 2006 (Perkins IV) Sec. 113(b) core indicators that states were required to submit to the U.S. Department of Education (Department) for program year (PY) 2010–11. States reported student data on the Sec. 113(b)(2)(A) and (B) of Perkins IV core indicators of performance. The student data are reported by each state per the instructions in the Consolidated Annual Report (CAR) for the Carl D. Perkins Career and Technical Education Act of 2006 for PY 2010–11.106
For PY 2010–11, the fourth PY of Perkins IV, each state operating under the third year of its five-year plan, pursuant to 122(a)(1) of Perkins IV, was required to report to the secretary student performance data on all of the Sec. 113(b) core indicators of performance. The states must disaggregate data by gender, race/ethnicity,107 and special populations and other student categories. If the state did not consolidate all of its Perkins IV, Title II, tech prep108 funds, it also must report disaggregated data for its tech prep students.
104 The term “state” in Sec. 3(30) of Perkins IV means, unless otherwise specified, each of the 50 states of the United States, the District of Columbia, the Commonwealth of Puerto Rico, and each outlying area. The term “state” as it is used in this report consists of each jurisdiction of the United States, including the 50 states of the United States, the District of Columbia, the Commonwealth of Puerto Rico; and the outlying areas of the United States Virgin Islands, Guam, American Samoa, the Commonwealth of the Northern Mariana Islands, and the Republic of Palau. 105 This report does not include Perkins IV, Title I, performance data from all states because the Republic of Palau does not have a fully approved state plan; and American Samoa and the Commonwealth of the Northern Mariana Islands consolidated their Perkins IV, Title I, allotments with funds under other formula programs and used these funds for allowable program purposes rather than for CTE. 106 When completing the CAR enrollment and accountability forms, a state must use its definitions for a CTE participant and CTE concentrator at the secondary and postsecondary levels. Unless otherwise specified, the data in this report are for CTE concentrators. 107 Consistent with the Department’s Oct. 19, 2007, memorandum titled “Final Guidance on Maintaining, Collecting, and Reporting Racial and Ethnic Data” (see 72 Federal Register 59266), states were required in PY 2010–11 to report data disaggregated by race/ethnicity using the “Revisions to the Standards for the Classification of Federal Data on Race and Ethnicity” that was issued by OMB in 1997. 108 The term “tech prep program” in Sec. 3(32) of Perkins IV means a tech prep program described in Sec. 203(c) of Perkins IV. Sec. 203(c)(2)(A) and (B) of Perkins IV indicates that a tech prep program, among other things, shall consist of a program of study that (i) combines a minimum of two years of secondary education with a minimum of two years of postsecondary education in a nonduplicative, sequential course of study, or an apprenticeship program of not less than two years following secondary education instruction; and that (ii) integrates academic with career and technical education.

80 APPENDI X B . INDIVIDUAL STATE PERFORMANCE PROFILES, PY 2010–11
Each special population or other student category and each race/ethnicity category is defined in the Glossary of Terms section of this report. Beginning in PY 2010–11, states were required to use the 1997 OMB-issued standards for reporting race/ethnicity data, the “Revisions to the Standards for the Classification of Federal Data on Race and Ethnicity.”
Some states operate separate adult-level programs that are not included in the states’ community college settings. Therefore, such states reported data for those programs operated outside of community college settings as adult-level programs. Six states—Florida, Louisiana, Missouri, Ohio, Oklahoma, and Tennessee—negotiate separate performance levels for reporting data for their adult-level CTE students using the Perkins IV Sec. 113(b)(2)(B) postsecondary core indicators.
In summary, Appendix B profiles include the student data related to all of the Perkins IV Sec. 113(b) core indicators at the secondary, postsecondary, and adult109 levels. The data are disaggregated for each state by gender, race/ethnicity, special populations and other student categories, and by tech prep, if the state did not consolidate all of its Perkins IV, Title II, funds (Tech Prep).110 The measurement definitions for the secondary, postsecondary, and adult levels are included in Appendix B, as reported by each state.
Further Clarification to the State Profiles
In accordance with the requirements of Perkins IV, the Department negotiates annual performance levels on each of the core indicators with each state. Each state identifies its performance levels for the Perkins IV Sec. 113(b) core indicators in its state plan submitted under Sec. 122 of Perkins IV. Levels of performance for each of the core indicators of performance must be expressed in a percentage or numerical form, so that they are objective, quantifiable, and measurable. Further, the performance levels must be set such that the state is required to continually make progress toward improving the performance of career and technical education students (see Sec. 113(b)(3)(A)(i) of Perkins IV).
The Department annually provides instructions to states regarding the submission of their data through instructions for the Consolidated Annual Report (CAR) for The Carl D. Perkins Career and Technical Education Act of 2006. The instructions contain specific reporting
109 When reporting on adult-level programs, each of the six states used its definition of CTE concentrator at the adult and/or postsecondary level. 110 The states that did not consolidate their Perkins IV, Title II, funds with their Perkins IV, Title I, funds and operated Tech Prep programs were: Alaska, Arizona, California, Delaware, Illinois, Indiana, Iowa, Massachusetts, Michigan, Mississippi, Missouri, Montana, New Mexico, New York, North Carolina, Ohio, Oklahoma, Pennsylvania, South Dakota, Texas, Virginia, Washington, West Virginia, and Wisconsin. In addition, Alabama operated a Tech Prep program because it consolidated a portion of its Perkins IV, Title II, funds with its Perkins IV, Title I, funds.

APPENDI X B . INDIVIDUAL STATE PERFORMANCE PROFILES, PY 2010–11 81
requirements for each state’s CAR submission. State directors submitted their state CAR reports electronically to the Department and certified the accuracy and completeness of their data using an electronic personal identification number (PIN).
Since the data in the state tables in this appendix are state-specific, additional information related to the state tables may be found for each state in the CAR narratives at: http://cte.ed.gov/accountability/reports/carnarratives.cfm. Additional clarification regarding aspects of the state data in the state tables may be provided by the state. Contact information for each state is available through the state profiles at: http://cte.ed.gov/stategrants/stateprofiles.cfm.

APPENDIX B. INDIVIDUAL STATE PERFORMANCE PROFILES, PY 2010–11 | 82
Alabama Secondary Level
Core indicators
Academic attainment: Reading/
language arts Academic attainment:
Mathematics T echnical skill
attainment School
completion Student
graduation rates Placement Nontraditional participation
Nontraditional completion
Measurement definitions
Percentage of CTE concentrators who have met the proficient or advanced level on the statewide high school reading and language arts assessment administered by the state under ESEA and who, in the reporting year, left secondary education.
Percentage of CTE concentrators who have met the proficient or advanced level on the statewide high school mathematics assessment administered by the state under ESEA and who, in the reporting year, left secondary education.
Percentage of CTE concentrators who passed technical skill assessments that are aligned with industry-recognized standards, if available and appropriate, during the reporting year.
Percentage of CTE concentrators who earned a regular secondary school diploma, earned a General Education Development (GED) credential as a state-recognized equivalent to a regular high school diploma (if offered by the state) or other state-recognized equivalent (including recognized alternative standards for individuals with disabilities), or earned a proficiency credential, certificate, or degree, in conjunction with a secondary school diploma (if offered by the state) during the reporting year.
Percentage of CTE concentrators who, in the reporting year, were included as graduated in the state's computation of its graduation rate as described in ESEA .
Percentage of CTE concentrators who left secondary education and were placed in postsecondary education or advanced training, in the military service, or employment in the second quarter following the program year in which they left secondary education (i.e., unduplicated placement status for CTE concentrators who graduated by June 30, 2007 would be assessed between Oct. 1, 2007 and Dec. 31, 2007).
Percentage of CTE participants from underrepresented gender groups who participated in a program that leads to employment in nontraditional fields during the reporting year.
Percentage of CTE concentrators from underrepresented gender groups who completed a program that leads to employment in nontraditional fields during the reporting year.
PY 2010–11 Performance levels 86.00% 77.00% 60.00% 86.00% 90.00% 92.25% 17.50% 12.50%
PY 2010–11 Results >95.00% 93.13% 87.54% 90.14% 84.42% 94.94% 18.94% 11.82%
Special populations
Individuals with disabilities (ADA )
Individuals with disabilities (ESEA /IDEA )
Economically disadvantaged students
Single parents
Displaced homemakers
Limited English proficient students
Migrant students
Students in nontraditional programs
NP
62.36%
92.32%
76.58%
NP
93.14%
>95.00%
94.68%
NP
86.64%
90.76%
76.98%
NP
72.79%
83.00%
91.14%
NP
87.40%
93.97%
>95.00%
NP
94.35%
93.10%
94.26%
NP
<10.00%
12.34%
NP
NP
<10.00%
<10.00%
NP
NP NP NP NP
92.41% 78.92% 79.71% 11.65%
>95.00% 85.36% 83.93% 20.14%
>95.00% 78.30% 63.69% 19.09%
NP NP NP NP
>95.00% 86.01% 62.06% 12.94%
>95.00% 86.97% 74.36% 16.59%
>95.00% 92.17% 86.07% NP Tech prep >95.00% 93.06% 83.95% 87.20% 80.66% 94.72% 11.04% 11.20% NOTE: This table contains the results for students whom the state has identified as concentrators or participants (participants are only indicated by the state under the nontraditional participation core indicator) in career and technical education (CTE). See Appendix A, Table A-1 for the state’s definition of CTE concentrators and Table A-2 for the state’s definition of CTE participants. Definitions for special populations are provided in the Glossary of Terms in this report. Actual performance data above 95 percent and below 10 percent have been masked to protect student confidentiality. NE—state reported no enrollment; NP—data not provided; PNO—state reported program not offered; NA—data not applicable ADA—Americans with Disabilities Act; ESEA—Elementary and Secondary Education Act of 1965, as amended; IDEA—Individuals with Disabilities Education Act

APPENDIX B. INDIVIDUAL STATE PERFORMANCE PROFILES, PY 2010–11 | 83
Alabama Secondary Level—continued
Core indicators
Academic attainment: Reading/
language arts Academic attainment:
Mathematics T echnical skill
attainment School
completion Student
graduation rates Placement Nontraditional participation
Nontraditional completion
Gender
Male
Female
92.03%
94.43%
89.88%
90.44%
94.28%
>95.00%
<10.00%
42.43%
>95.00% 85.12% 83.20% <10.00%
>95.00% 90.24% 85.91% 65.44%
Race/ethnicity
American Indian or Alaska Native
Asian
Black or African American
Hispanic or Latino Native Hawaiian or Other Pacific Islander White
Two or more races
>95.00%
>95.00%
91.46%
>95.00%
>95.00%
93.91%
91.23%
92.86%
88.18%
89.37%
84.15%
>95.00%
90.89%
67.19%
>95.00%
>95.00%
94.81%
>95.00%
NE
94.96%
NE
10.78%
23.63%
14.56%
<10.00%
NP
10.62%
25.00%
>95.00% 92.57% 85.38% 18.17%
>95.00% 92.23% 77.49% 28.81%
>95.00% 80.99% 84.62% 22.41%
>95.00% 89.53% 76.32% 13.63%
>95.00% >95.00% >95.00% 78.57%
>95.00% 91.35% 84.80% 17.22%
>95.00% 86.78% 67.19% 26.79%

APPENDIX B. INDIVIDUAL STATE PERFORMANCE PROFILES, PY 2010–11 | 84
Alabama Postsecondary Level
Core indicators T echnical skill
attainment Credential,
certificate, or degree Student retention
or transfer Student
placement Nontraditional participation
Nontraditional completion
Measurement definitions
Percentage of CTE concentrators who passed technical skill assessments that are aligned with industry-recognized standards, if available and appropriate, during the reporting year.
Percentage of CTE concentrators who received an industry-recognized credential, a certificate, or a degree during the reporting year.
Percentage of CTE concentrators who remained enrolled in their original postsecondary institution or transferred to another two- or four-year postsecondary institution during the reporting year and who were enrolled in postsecondary education in the fall of the previous reporting year.
Percentage of CTE concentrators who were placed or retained in employment, or placed in military service or apprenticeship programs in the second quarter following the program year in which they left postsecondary education (i.e., unduplicated placement status for CTE concentrators who graduated by June 30, 2007 would be assessed between Oct. 1, 2007 and Dec. 31, 2007).
Percentage of CTE participants from underrepresented gender groups who participated in a program that leads to employment in nontraditional fields during the reporting year.
Percentage of CTE concentrators from underrepresented gender groups who completed a program that leads to employment in nontraditional fields during the reporting year.
PY 2010–11 Performance levels 80.44% 58.00% 69.50% 84.44% 12.50% 12.00%
PY 2010–11 Results 89.21% 47.43% 72.29% 66.31% 15.77% 19.08%
Special populations
Individuals with disabilities (ADA )
Economically disadvantaged students
Single parents
Displaced homemakers
Limited English proficient students
Students in nontraditional programs
45.12%
42.36%
40.43%
35.42%
50.00%
41.93%
45.00%
60.50%
44.67%
22.58%
20.00%
65.29%
<10.00%
18.74%
<10.00%
54.17%
16.67%
NP
70.59% 73.77% 22.89%
92.63% 75.47% 16.02%
89.53% 94.81% <10.00%
>95.00% 85.42% 12.68%
83.33% 46.88% 26.92%
92.61% 71.10% NP
T ech prep 13.03% 13.03% 40.00% 39.09% <10.00% <10.00% NOTE: This table contains the results for students whom the state has identified as concentrators or participants (participants are only indicated by the state under the nontraditional participation core indicator) in career and technical education (CTE). See Appendix A, Table A-1 for the state’s definition of CTE concentrators and Table A-2 for the state’s definition of CTE participants. Definitions for special populations are provided in the Glossary of Terms in this report. Actual performance data above 95 percent and below 10 percent have been masked to protect student confidentiality. NE—state reported no enrollment; NP—data not provided; PNO—state reported program not offered; NA—data not applicable ADA—Americans with Disabilities Act

APPENDIX B. INDIVIDUAL STATE PERFORMANCE PROFILES, PY 2010–11 | 85
Alabama Postsecondary Level—continued
Core indicators T echnical skill
attainment Credential,
certificate, or degree Student retention
or transfer Student
placement Nontraditional participation
Nontraditional completion
Gender
Male
Female
41.84%
52.18%
64.67%
67.23%
17.65%
20.28%
88.74% 69.02% 12.17%
89.52% 74.70% 19.29%
Race/ethnicity
American Indian or Alaska Native
Asian
Black or African American
Hispanic or Latino Native Hawaiian or Other Pacific Islander White
Two or more races
50.98%
30.95%
39.70%
50.22%
NE
46.07%
NE
62.86%
41.67%
61.97%
42.35%
NE
67.82%
NE
21.84%
18.74%
17.86%
<10.00%
NE
19.53%
NE
94.44% 78.31% 18.26%
59.62% 70.99% 24.55%
86.86% 73.85% 16.62%
84.71% 77.47% 16.24%
NE NE NE
94.33% 72.07% 15.42%
NE NE NE

APPENDIX B. INDIVIDUAL STATE PERFORMANCE PROFILES, PY 2010–11 | 86
Alaska Secondary Level
Core indicators
Academic attainment: Reading/
language arts Academic attainment:
Mathematics T echnical skill
attainment School
completion Student
graduation rates Placement Nontraditional participation
Nontraditional completion
Measurement definitions
Percentage of CTE concentrators who have met the proficient or advanced level on the statewide high school reading and language arts assessment administered by the state under ESEA and who, in the reporting year, left secondary education.
Percentage of CTE concentrators who have met the proficient or advanced level on the statewide high school mathematics assessment administered by the state under ESEA and who, in the reporting year, left secondary education.
Percentage of CTE concentrators who passed technical skill assessments that are aligned with industry-recognized standards, if available and appropriate, during the reporting year.
Percentage of CTE concentrators who earned a regular secondary school diploma, earned a General Education Development (GED) credential as a state-recognized equivalent to a regular high school diploma or a certificate of achievement (i.e. other state-recognized equivalent including recognized alternative standards for individuals with disabilities).
Percentage of CTE concentrators who, in the reporting year, were included as graduated in the state's computation of its graduation rate as described in ESEA .
Percentage of unduplicated CTE concentrators who leave secondary school in the reporting year and were placed in postsecondary education, or advanced training, or in military service, or employment in the first and second quarter following the program year in which they left secondary education.
Percentage of CTE participants from the underrepresented gender group who participated in a program that leads to employment in a nontraditional field during the reporting year.
Percentage of CTE concentrators from the underrepresented gender group who completed a program that leads to employment in nontraditional fields during the reporting year.
PY 2010–11 Performance levels 82.88% 74.57% 67.00% 92.17% 55.58% 88.07% 37.43% 29.78%
PY 2010–11 Results 85.61% 75.00% 87.72% 89.90% 90.21% 81.21% 36.69% 30.23%
Special populations
Individuals with disabilities (ADA )
Individuals with disabilities (ESEA /IDEA )
Economically disadvantaged students
Single parents
Displaced homemakers
Limited English proficient students
Migrant students
Students in nontraditional programs
NP
36.44%
62.44%
60.00%
NE
23.44%
58.42%
75.32%
NP
76.32%
85.68%
85.71%
NE
75.95%
89.09%
91.50%
NP
80.87%
>95.00%
33.33%
>95.00%
69.01%
57.58%
82.20%
NP
23.00%
31.13%
25.00%
NE
23.40%
20.93%
NP
NP NP NP NP
44.07% 76.00% 79.55% 31.37%
75.91% 88.20% 84.38% 37.06%
80.00% >95.00% 75.00% 22.86%
NE NE NE NE
25.00% 76.47% 70.83% 36.85%
77.23% 88.89% 90.10% 32.50%
90.06% 91.67% 91.49% NP T ech prep 92.59% 82.96% 93.58% >95.00% >95.00% 85.75% 34.14% 27.59% NOTE: This table contains the results for students whom the state has identified as concentrators or participants (participants are only indicated by the state under the nontraditional participation core indicator) in career and technical education (CTE). See Appendix A, Table A-1 for the state’s definition of CTE concentrators and Table A-2 for the state’s definition of CTE participants. Definitions for special populations are provided in the Glossary of Terms in this report. Actual performance data above 95 percent and below 10 percent have been masked to protect student confidentiality. NE—state reported no enrollment; NP—data not provided; PNO—state reported program not offered; NA—data not applicable ADA—Americans with Disabilities Act; ESEA—Elementary and Secondary Education Act of 1965, as amended; IDEA—Individuals with Disabilities Education Act

APPENDIX B. INDIVIDUAL STATE PERFORMANCE PROFILES, PY 2010–11 | 87
Alaska Secondary Level—continued
Core indicators
Academic attainment: Reading/
language arts Academic attainment:
Mathematics T echnical skill
attainment School
completion Student
graduation rates Placement Nontraditional participation
Nontraditional completion
Gender
Male
Female
75.59%
74.01%
88.15%
92.76%
80.31%
82.31%
20.20%
49.32%
83.41% 85.60% 88.23% 34.79%
89.29% 92.06% 93.43% 39.74%
Race/ethnicity
American Indian or Alaska Native
Asian
Black or African American
Hispanic or Latino Native Hawaiian or Other Pacific Islander White
Two or more races
62.50%
73.12%
77.42%
70.93%
38.46%
79.43%
66.67%
86.13%
93.14%
76.60%
85.42%
43.75%
92.99%
78.57%
73.60%
87.18%
95.00%
80.00%
82.35%
82.24%
79.25%
26.74%
33.82%
27.27%
38.33%
NP
29.87%
38.89%
71.15% 92.44% 84.30% 35.82%
83.87% 80.00% 94.79% 38.24%
87.10% 90.00% 76.74% 34.64%
81.40% 80.00% 83.87% 37.43%
53.85% <10.00% 50.00% 37.60%
89.83% 87.50% 93.70% 36.19%
90.48% 93.33% 78.00% 42.90%

APPENDIX B. INDIVIDUAL STATE PERFORMANCE PROFILES, PY 2010–11 | 88
Alaska Postsecondary Level
Core indicators T echnical skill
attainment Credential,
certificate, or degree Student retention
or transfer Student
placement Nontraditional participation
Nontraditional completion
Measurement definitions
Percentage of concentrators who have achieved a 2.5 GPA during the reporting year in technical courses that are aligned with industry-recognized standards, in a CTE program of at least six credit hours, or a certificate or a degree.
Percentage of exiting concentrators who have earned an industry-recognized credential, in a CTE program of at least six credit hours, or a certificate or degree.
Percentage of concentrators from the prior year who re-enroll, or transfer to another postsecondary institution.
Percentage of concentrators from the prior year's report who have exited and are identified as working or in the military at any time between July 1 and Dec. 31 of the reporting year.
Percentage of CTE participants from underrepresented gender groups who participated in a program that leads to employment in nontraditional fields during the reporting year.
Percentage of CTE concentrators from underrepresented gender groups who during the reporting year completed a program that leads to employment in nontraditional fields as evidenced by receipt of an industry-recognized credential, a certificate or degree; program must be at least six credit hours.
PY 2010–11 Performance levels 67.75% 25.75% 56.00% 75.56% 14.22% 2.83%
PY 2010–11 Results 82.94% <10.00% 51.02% 73.33% 14.98% <10.00%
Special populations
Individuals with disabilities (ADA )
Economically disadvantaged students
Single parents
Displaced homemakers
Limited English proficient students
Students in nontraditional programs
10.00%
<10.00%
<10.00%
<10.00%
<10.00%
<10.00%
51.72%
72.57%
71.51%
69.39%
83.33%
72.82%
11.11%
<10.00%
<10.00%
14.29%
<10.00%
NP
79.17% 53.21% 15.38%
83.43% 52.69% 16.49%
79.10% 56.79% 18.29%
88.24% 47.83% 40.00%
>95.00% 50.00% 25.00%
84.43% 93.94% NP
T ech prep 65.22% <10.00% 55.26% 69.27% 12.67% <10.00% NOTE: This table contains the results for students whom the state has identified as concentrators or participants (participants are only indicated by the state under the nontraditional participation core indicator) in career and technical education (CTE). See Appendix A, Table A-1 for the state’s definition of CTE concentrators and Table A-2 for the state’s definition of CTE participants. Definitions for special populations are provided in the Glossary of Terms in this report. Actual performance data above 95 percent and below 10 percent have been masked to protect student confidentiality. NE—state reported no enrollment; NP—data not provided; PNO—state reported program not offered; NA—data not applicable ADA—Americans with Disabilities Act

APPENDIX B. INDIVIDUAL STATE PERFORMANCE PROFILES, PY 2010–11 | 89
Alaska Postsecondary Level—continued
Core indicators T echnical skill
attainment Credential,
certificate, or degree Student retention
or transfer Student
placement Nontraditional participation
Nontraditional completion
Gender
Male
Female
<10.00%
<10.00%
73.13%
73.47%
<10.00%
<10.00%
81.82% 50.96% 10.76%
83.77% 51.06% 19.68%
Race/ethnicity
American Indian or Alaska Native
Asian
Black or African American
Hispanic or Latino Native Hawaiian or Other Pacific Islander White
Two or more races
<10.00%
<10.00%
<10.00%
<10.00%
<10.00%
<10.00%
<10.00%
76.48%
80.77%
64.62%
65.99%
81.82%
72.49%
74.68%
<10.00%
<10.00%
12.50%
<10.00%
<10.00%
<10.00%
<10.00%
72.31% 53.87% 15.48%
82.43% 61.73% 12.82%
68.66% 48.15% 20.45%
84.91% 56.73% 17.32%
58.33% 57.14% <10.00%
86.04% 49.70% 14.41%
84.62% 49.50% 10.53%
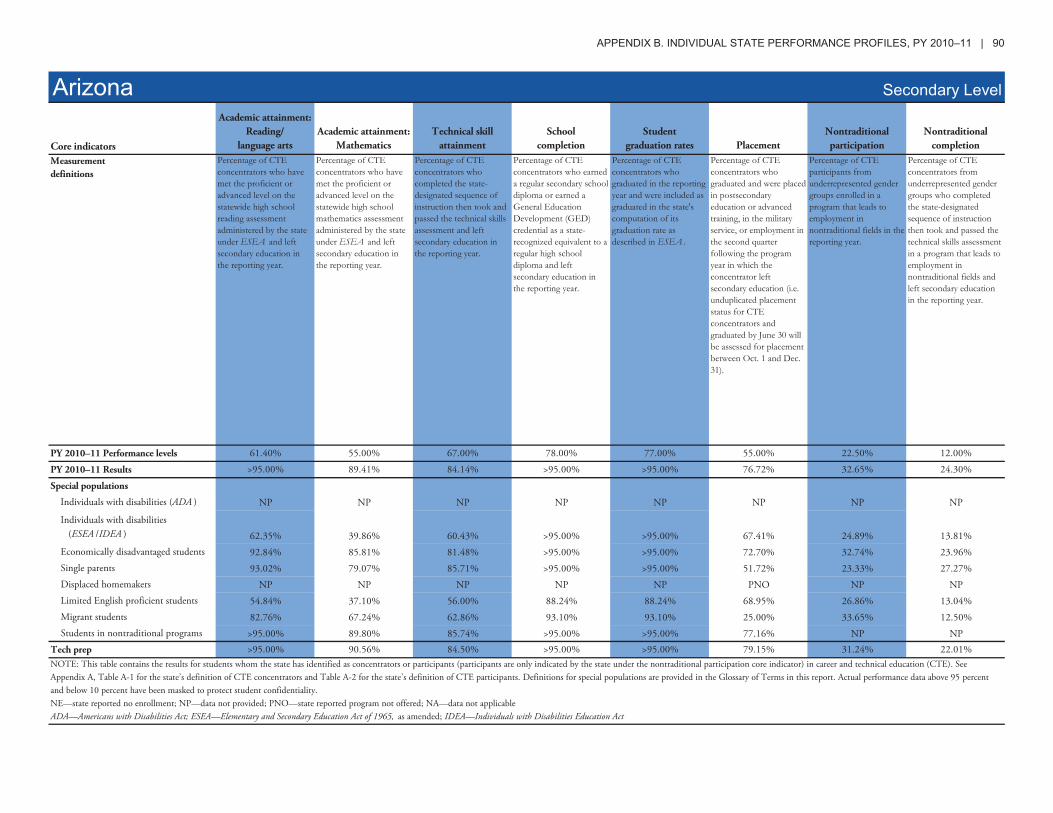
APPENDIX B. INDIVIDUAL STATE PERFORMANCE PROFILES, PY 2010–11 | 90
Arizona Secondary Level
Core indicators
Academic attainment: Reading/
language arts Academic attainment:
Mathematics T echnical skill
attainment School
completion Student
graduation rates Placement Nontraditional participation
Nontraditional completion
Measurement definitions
Percentage of CTE concentrators who have met the proficient or advanced level on the statewide high school reading assessment administered by the state under ESEA and left secondary education in the reporting year.
Percentage of CTE concentrators who have met the proficient or advanced level on the statewide high school mathematics assessment administered by the state under ESEA and left secondary education in the reporting year.
Percentage of CTE concentrators who completed the state-designated sequence of instruction then took and passed the technical skills assessment and left secondary education in the reporting year.
Percentage of CTE concentrators who earned a regular secondary school diploma or earned a General Education Development (GED) credential as a state-recognized equivalent to a regular high school diploma and left secondary education in the reporting year.
Percentage of CTE concentrators who graduated in the reporting year and were included as graduated in the state's computation of its graduation rate as described in ESEA .
Percentage of CTE concentrators who graduated and were placed in postsecondary education or advanced training, in the military service, or employment in the second quarter following the program year in which the concentrator left secondary education (i.e. unduplicated placement status for CTE concentrators and graduated by June 30 will be assessed for placement between Oct. 1 and Dec. 31).
Percentage of CTE participants from underrepresented gender groups enrolled in a program that leads to employment in nontraditional fields in the reporting year.
Percentage of CTE concentrators from underrepresented gender groups who completed the state-designated sequence of instruction then took and passed the technical skills assessment in a program that leads to employment in nontraditional fields and left secondary education in the reporting year.
PY 2010–11 Performance levels 61.40% 55.00% 67.00% 78.00% 77.00% 55.00% 22.50% 12.00%
PY 2010–11 Results >95.00% 89.41% 84.14% >95.00% >95.00% 76.72% 32.65% 24.30%
Special populations
Individuals with disabilities (ADA )
Individuals with disabilities (ESEA /IDEA )
Economically disadvantaged students
Single parents
Displaced homemakers
Limited English proficient students
Migrant students
Students in nontraditional programs
NP
39.86%
85.81%
79.07%
NP
37.10%
67.24%
89.80%
NP
>95.00%
>95.00%
>95.00%
NP
88.24%
93.10%
>95.00%
NP
67.41%
72.70%
51.72%
PNO
68.95%
25.00%
77.16%
NP
13.81%
23.96%
27.27%
NP
13.04%
12.50%
NP
NP NP NP NP
62.35% 60.43% >95.00% 24.89%
92.84% 81.48% >95.00% 32.74%
93.02% 85.71% >95.00% 23.33%
NP NP NP NP
54.84% 56.00% 88.24% 26.86%
82.76% 62.86% 93.10% 33.65%
>95.00% 85.74% >95.00% NP Tech prep >95.00% 90.56% 84.50% >95.00% >95.00% 79.15% 31.24% 22.01% NOTE: This table contains the results for students whom the state has identified as concentrators or participants (participants are only indicated by the state under the nontraditional participation core indicator) in career and technical education (CTE). See Appendix A, Table A-1 for the state’s definition of CTE concentrators and Table A-2 for the state’s definition of CTE participants. Definitions for special populations are provided in the Glossary of Terms in this report. Actual performance data above 95 percent and below 10 percent have been masked to protect student confidentiality. NE—state reported no enrollment; NP—data not provided; PNO—state reported program not offered; NA—data not applicable ADA—Americans with Disabilities Act; ESEA—Elementary and Secondary Education Act of 1965, as amended; IDEA—Individuals with Disabilities Education Act

APPENDIX B. INDIVIDUAL STATE PERFORMANCE PROFILES, PY 2010–11 | 91
Arizona Secondary Level—continued
Core indicators
Academic attainment: Reading/
language arts Academic attainment:
Mathematics T echnical skill
attainment School
completion Student
graduation rates Placement Nontraditional participation
Nontraditional completion
Gender
Male
Female
88.96%
89.89%
>95.00%
>95.00%
74.93%
78.62%
11.28%
35.81%
94.25% 83.14% >95.00% 14.33%
>95.00% 85.10% >95.00% 51.91%
Race/ethnicity
American Indian or Alaska Native
Asian
Black or African American
Hispanic or Latino Native Hawaiian or Other Pacific Islander White
Two or more races
75.67%
>95.00%
82.39%
87.06%
92.59%
93.41%
87.22%
>95.00%
>95.00%
>95.00%
>95.00%
>95.00%
>95.00%
>95.00%
62.83%
82.91%
77.74%
72.67%
PNO
81.28%
PNO
17.79%
28.00%
31.60%
22.70%
25.00%
25.66%
37.93%
86.11% 75.45% >95.00% 31.30%
>95.00% 89.32% >95.00% 38.15%
94.27% 80.73% >95.00% 37.00%
94.23% 79.20% >95.00% 31.90%
>95.00% 84.62% >95.00% 47.52%
>95.00% 89.41% >95.00% 32.50%
94.74% 85.92% >95.00% 38.04%

APPENDIX B. INDIVIDUAL STATE PERFORMANCE PROFILES, PY 2010–11 | 92
Arizona Postsecondary Level
Core indicators T echnical skill
attainment Credential,
certificate, or degree Student retention
or transfer Student
placement Nontraditional participation
Nontraditional completion
Measurement definitions
Percentage of CTE concentrators who passed technical skill or end of program assessments that are aligned with industry-recognized standards during the reporting year.
Percentage of CTE concentrators who received an industry-recognized credential, a certificate, or a degree during the reporting year.
Percentage of CTE concentrators who remained enrolled in their original postsecondary institution or transferred to another two-year or four-year postsecondary institution during the reporting year and who were enrolled in postsecondary education in the fall of the previous reporting year.
Percentage of CTE concentrators who were placed or retained in employment, or placed in military service or apprenticeship programs in the second quarter following the program year in which they left postsecondary education (i.e., unduplicated placement status for CTE concentrators who graduated by June 30 will be assessed between Oct. 1 and Dec. 31).
Percentage of CTE participants from underrepresented gender groups who participated in a program that leads to employment in nontraditional fields during the reporting year.
Percentage of CTE concentrators from underrepresented gender groups who completed a program that leads to employment in nontraditional fields during the reporting year.
PY 2010–11 Performance levels 68.00% 41.00% 49.00% 37.00% 21.50% 17.00%
PY 2010–11 Results 91.92% 40.88% 67.88% 53.82% 27.50% 20.50%
Special populations
Individuals with disabilities (ADA )
Economically disadvantaged students
Single parents
Displaced homemakers
Limited English proficient students
Students in nontraditional programs
38.65%
39.69%
33.56%
72.73%
28.48%
44.49%
41.46%
51.21%
68.46%
22.22%
23.84%
52.39%
26.67%
18.37%
12.50%
16.67%
15.56%
NP
92.00% 73.97% 30.74%
85.84% 73.08% 28.13%
>95.00% 83.29% 26.20%
>95.00% 92.31% 45.98%
25.88% 65.08% 29.04%
88.56% 71.65% NP
T ech prep 90.24% 35.37% 70.77% 56.29% 27.65% 19.27% NOTE: This table contains the results for students whom the state has identified as concentrators or participants (participants are only indicated by the state under the nontraditional participation core indicator) in career and technical education (CTE). See Appendix A, Table A-1 for the state’s definition of CTE concentrators and Table A-2 for the state’s definition of CTE participants. Definitions for special populations are provided in the Glossary of Terms in this report. Actual performance data above 95 percent and below 10 percent have been masked to protect student confidentiality. NE—state reported no enrollment; NP—data not provided; PNO—state reported program not offered; NA—data not applicable ADA—Americans with Disabilities Act

APPENDIX B. INDIVIDUAL STATE PERFORMANCE PROFILES, PY 2010–11 | 93
Arizona Postsecondary Level—continued
Core indicators T echnical skill
attainment Credential,
certificate, or degree Student retention
or transfer Student
placement Nontraditional participation
Nontraditional completion
Gender
Male
Female
36.31%
45.41%
53.19%
54.44%
19.37%
21.56%
90.66% 63.93% 29.90%
92.80% 71.48% 25.38%
Race/ethnicity
American Indian or Alaska Native
Asian
Black or African American
Hispanic or Latino Native Hawaiian or Other Pacific Islander White
Two or more races
30.00%
41.47%
33.50%
40.62%
25.71%
41.39%
30.00%
48.21%
47.26%
48.18%
59.20%
48.57%
55.52%
57.14%
21.57%
25.00%
25.57%
20.95%
38.46%
19.83%
25.81%
91.89% 65.90% 22.98%
93.02% 68.45% 29.73%
84.62% 70.97% 32.92%
86.99% 68.19% 28.94%
>95.00% 52.38% 32.28%
94.28% 68.16% 26.69%
88.89% 82.86% 28.50%

APPENDIX B. INDIVIDUAL STATE PERFORMANCE PROFILES, PY 2010–11 | 94
Arkansas Secondary Level
Core indicators
Academic attainment: Reading/
language arts Academic attainment:
Mathematics T echnical skill
attainment School
completion Student
graduation rates Placement Nontraditional participation
Nontraditional completion
Measurement definitions
Percentage of CTE concentrators who have met the proficient or advanced level on the statewide high school reading and language arts assessment administered by the state under ESEA and who, in the reporting year, left secondary education.
Percentage of CTE concentrators who have met the proficient or advanced level on the statewide high school mathematics assessment administered by the state under ESEA and who, in the reporting year left secondary education.
Percentage of CTE concentrators leaving the secondary system during the reporting year who have an average score of proficient on all end-of-course skill assessments taken in grades 9-12 within their program of study area or who have received an industry-recognized credential or certificate within their program of study area.
Percentage of CTE concentrators that graduate or receive a General Education Development (GED) during the reporting year.
Percentage of CTE concentrators who, in the reporting year, were included as graduated in the state's computation of its graduation rate as described in ESEA .
Percentage of CTE concentrators who successfully completed the program of study and graduated from high school and who were employed , enrolled in postsecondary, or in the military six months following graduation.
Percentage of nontraditional gender students enrolled in one or more units within a program of study that is nontraditional for their gender during the reporting year.
Percentage of nontraditional gender concentrators who successfully complete programs of study designated nontraditional and graduate for high school during the reporting year.
PY 2010–11 Performance levels 67.75% 55.75% 65.00% 92.30% 87.00% 94.96% 25.01% 20.04%
PY 2010–11 Results 57.13% 67.57% 76.30% 94.69% 93.69% 94.90% 25.35% 26.30%
Special populations
Individuals with disabilities (ADA )
Individuals with disabilities (ESEA /IDEA )
Economically disadvantaged students
Single parents
Displaced homemakers
Limited English proficient students
Migrant students
Students in nontraditional programs
NP
26.98%
58.71%
NP
NP
50.54%
60.98%
68.12%
NP
93.20%
93.33%
NP
NP
94.17%
>95.00%
>95.00%
NP
86.94%
92.25%
NE
NE
91.57%
84.38%
94.78%
NP
16.60%
26.70%
NP
NP
14.84%
19.05%
NP
NP NP NP NP
<10.00% 45.16% 92.94% 15.59%
46.24% 70.70% 92.16% 25.18%
NP NP NP NP
NP NP NP NP
18.00% 51.25% 94.17% 16.84%
37.78% 67.44% >95.00% 23.74%
62.53% 81.19% 94.92% NP Tech prep NP NP NP NP NP NE NP NP NOTE: This table contains the results for students whom the state has identified as concentrators or participants (participants are only indicated by the state under the nontraditional participation core indicator) in career and technical education (CTE). See Appendix A, Table A-1 for the state’s definition of CTE concentrators and Table A-2 for the state’s definition of CTE participants. Definitions for special populations are provided in the Glossary of Terms in this report. Actual performance data above 95 percent and below 10 percent have been masked to protect student confidentiality. NE—state reported no enrollment; NP—data not provided; PNO—state reported program not offered; NA—data not applicable ADA—Americans with Disabilities Act; ESEA—Elementary and Secondary Education Act of 1965, as amended; IDEA—Individuals with Disabilities Education Act

APPENDIX B. INDIVIDUAL STATE PERFORMANCE PROFILES, PY 2010–11 | 95
Arkansas Secondary Level—continued
Core indicators
Academic attainment: Reading/
language arts Academic attainment:
Mathematics T echnical skill
attainment School
completion Student
graduation rates Placement Nontraditional participation
Nontraditional completion
Gender
Male
Female
70.23%
65.03%
94.41%
94.97%
>95.00%
94.69%
<10.00%
46.67%
51.00% 74.71% 93.34% <10.00%
63.18% 77.69% 94.04% 56.96%
Race/ethnicity
American Indian or Alaska Native
Asian
Black or African American
Hispanic or Latino Native Hawaiian or Other Pacific Islander White
Two or more races
73.68%
79.44%
40.78%
64.64%
44.44%
75.69%
79.22%
94.94%
>95.00%
91.87%
>95.00%
>95.00%
>95.00%
>95.00%
91.38%
>95.00%
93.98%
93.45%
89.47%
>95.00%
>95.00%
36.36%
33.33%
28.19%
21.45%
40.00%
26.14%
15.79%
60.26% 72.88% 94.94% 27.45%
56.52% 75.00% >95.00% 27.54%
36.20% 62.23% 91.47% 24.25%
48.54% 66.61% >95.00% 22.01%
27.27% 60.00% >95.00% 27.71%
64.35% 81.57% 94.20% 25.86%
65.38% 79.71% 92.68% 26.71%

APPENDIX B. INDIVIDUAL STATE PERFORMANCE PROFILES, PY 2010–11 | 96
Arkansas Postsecondary Level
Core indicators T echnical skill
attainment Credential,
certificate, or degree Student retention
or transfer Student
placement Nontraditional participation
Nontraditional completion
Measurement definitions
Percentage of CTE concentrators who passed technical skill assessments.
Percentage of CTE concentrators who received an industry-recognized credential, certificate or degree during the reporting year.
Percentage of CTE concentrators who remained enrolled in their original postsecondary institution or transferred to another two- or four-year postsecondary institution during the reporting year and who were enrolled in postsecondary education in the fall of the previous reporting year.
Percentage of CTE concentrators who were placed or retained in employment, or placed in military service or apprenticeship programs in the second quarter following the program year in which they left postsecondary education.
Percentage of CTE participants from underrepresented gender groups who participated in a program that leads to employment in nontraditional fields during the reporting year.
Percentage of CTE concentrators from underrepresented gender groups who completed a program that leads to employment in nontraditional fields during the reporting year.
PY 2010–11 Performance levels 64.67% 63.78% 64.07% 62.12% 22.00% 18.48%
PY 2010–11 Results 73.01% 57.95% 80.72% 66.84% 22.63% 21.92%
Special populations
Individuals with disabilities (ADA )
Economically disadvantaged students
Single parents
Displaced homemakers
Limited English proficient students
Students in nontraditional programs
58.60%
52.83%
58.27%
56.52%
51.38%
55.21%
53.50%
67.78%
67.97%
57.39%
62.45%
65.02%
25.71%
23.50%
25.54%
28.28%
21.59%
NP
66.80% 80.68% 25.50%
70.31% 80.72% 24.11%
68.50% 80.77% 26.19%
76.11% 81.12% 28.72%
70.81% 77.45% 23.58%
73.24% 81.53% NP
T ech prep PNO PNO PNO PNO PNO PNO NOTE: This table contains the results for students whom the state has identified as concentrators or participants (participants are only indicated by the state under the nontraditional participation core indicator) in career and technical education (CTE). See Appendix A, Table A-1 for the state’s definition of CTE concentrators and Table A-2 for the state’s definition of CTE participants. Definitions for special populations are provided in the Glossary of Terms in this report. Actual performance data above 95 percent and below 10 percent have been masked to protect student confidentiality. NE—state reported no enrollment; NP—data not provided; PNO—state reported program not offered; NA—data not applicable ADA—Americans with Disabilities Act

APPENDIX B. INDIVIDUAL STATE PERFORMANCE PROFILES, PY 2010–11 | 97
Arkansas Postsecondary Level—continued
Core indicators T echnical skill
attainment Credential,
certificate, or degree Student retention
or transfer Student
placement Nontraditional participation
Nontraditional completion
Gender
Male
Female
58.31%
57.69%
66.40%
67.15%
20.63%
22.73%
71.25% 77.15% 20.47%
73.93% 82.51% 24.01%
Race/ethnicity
American Indian or Alaska Native
Asian
Black or African American
Hispanic or Latino Native Hawaiian or Other Pacific Islander White
Two or more races
55.71%
51.19%
49.00%
49.07%
40.00%
60.36%
54.55%
64.29%
48.81%
60.00%
67.59%
70.00%
69.13%
60.23%
22.14%
27.32%
23.30%
26.94%
25.00%
21.97%
22.11%
77.21% 80.11% 22.16%
76.58% 79.25% 26.36%
59.75% 81.13% 23.49%
69.52% 79.22% 28.20%
88.00% 70.00% 21.43%
76.79% 81.05% 22.56%
75.68% 81.05% 24.68%

APPENDIX B. INDIVIDUAL STATE PERFORMANCE PROFILES, PY 2010–11 | 98
California Secondary Level
Core indicators
Academic attainment: Reading/
language arts Academic attainment:
Mathematics T echnical skill
attainment School
completion Student
graduation rates Placement Nontraditional participation
Nontraditional completion
Measurement definitions
Percentage of grade 12 CTE concentrators with valid scores who have met the proficient or advanced level on the reading and language arts portion of the California High School Exit Exam (CAHSEE).
Percentage of grade 12 CTE concentrators with valid scores who have met the proficient or advanced level on the mathematics portion of the CAHSEE.
Percentage of CTE concentrators enrolled in a capstone CTE course who received an "A", "B", or "C" grade in the course, or received an industry-recognized certification, or passed an end of program assessment aligned with industry-recognized standards.
Percentage of grade 12 CTE concentrators who earned a high school diploma, or other state-recognized equivalent (including recognized alternative standards for individuals with disabilities).
Percentage of grade 12 CTE concentrators who, in the reporting year, were included as graduated in the state's computation of its graduation rate as described in ESEA .
Percentage of grade 12 CTE concentrators who left secondary education during the reporting year and entered postsecondary education or advanced training, military service, or employment as reported on a survey six months following graduation.
Percentage of CTE participants from underrepresented gender groups who were enrolled in a program sequence that leads to employment in nontraditional fields.
Percentage of CTE concentrators from underrepresented gender groups enrolled in a capstone CTE course that leads to employment in a nontraditional field who received an "A", "B", or "C" grade in the course, or received an industry-recognized certification, or passed an end of program assessment aligned with industry-recognized standards.
PY 2010–11 Performance levels 44.50% 32.20% 63.44% 89.11% 84.60% 83.33% 27.00% 19.00%
PY 2010–11 Results 51.93% 52.46% 89.37% 91.59% 91.59% 86.99% 37.72% 89.57%
Special populations
Individuals with disabilities (ADA )
Individuals with disabilities (ESEA /IDEA )
Economically disadvantaged students
Single parents
Displaced homemakers
Limited English proficient students
Migrant students
Students in nontraditional programs
NP
22.53%
43.76%
39.13%
NP
34.00%
43.01%
51.16%
NP
85.65%
88.71%
86.10%
NP
86.50%
89.61%
40.67%
NP
82.77%
86.12%
82.59%
PNO
84.77%
89.19%
89.30%
NP
82.55%
88.08%
83.95%
NP
85.36%
90.61%
NP
NP NP NP NP
20.96% 82.16% 85.70% 32.94%
41.35% 87.58% 89.33% 38.40%
41.99% 83.65% 94.44% 35.97%
NP NP NP NP
28.70% 84.73% 86.91% 36.49%
36.79% 45.48% 90.24% 35.57%
52.83% 89.57% 92.59% NP T ech prep 54.46% 55.41% 90.93% 90.71% 90.71% 88.28% 36.15% 91.46% NOTE: This table contains the results for students whom the state has identified as concentrators or participants (participants are only indicated by the state under the nontraditional participation core indicator) in career and technical education (CTE). See Appendix A, Table A-1 for the state’s definition of CTE concentrators and Table A-2 for the state’s definition of CTE participants. Definitions for special populations are provided in the Glossary of Terms in this report. Actual performance data above 95 percent and below 10 percent have been masked to protect student confidentiality. NE—state reported no enrollment; NP—data not provided; PNO—state reported program not offered; NA—data not applicable ADA—Americans with Disabilities Act; ESEA—Elementary and Secondary Education Act of 1965, as amended; IDEA—Individuals with Disabilities Education Act

APPENDIX B. INDIVIDUAL STATE PERFORMANCE PROFILES, PY 2010–11 | 99
California Secondary Level—continued
Core indicators
Academic attainment: Reading/
language arts Academic attainment:
Mathematics T echnical skill
attainment School
completion Student
graduation rates Placement Nontraditional participation
Nontraditional completion
Gender
Male
Female
55.56%
48.83%
90.88%
92.42%
86.80%
87.21%
86.73%
90.80%
50.11% 87.89% 90.88% 45.48%
54.06% 91.22% 92.42% 34.81%
Race/ethnicity
American Indian or Alaska Native
Asian
Black or African American
Hispanic or Latino Native Hawaiian or Other Pacific Islander White
Two or more races
53.22%
74.82%
35.67%
41.11%
58.36%
66.09%
50.05%
93.65%
>95.00%
87.50%
89.25%
91.43%
94.69%
93.38%
82.94%
89.83%
85.32%
85.74%
90.19%
87.91%
87.26%
88.39%
94.55%
85.02%
87.67%
90.39%
92.46%
90.24%
52.71% 88.80% 93.65% 37.87%
64.31% 94.46% >95.00% 39.52%
40.59% 85.75% 87.50% 40.94%
40.93% 86.95% 89.25% 38.42%
57.39% 91.06% 91.43% 40.36%
68.03% 92.38% 94.69% 35.29%
41.62% 90.07% 93.38% 36.51%

APPENDIX B. INDIVIDUAL STATE PERFORMANCE PROFILES, PY 2010–11 | 100
California Postsecondary Level
Core indicators T echnical skill
attainment Credential,
certificate, or degree Student retention
or transfer Student
placement Nontraditional participation
Nontraditional completion
Measurement definitions
Percentage of students enrolled in Student Accountability Model (SAM) priority A-C courses who have earned a GPA of 2.0 or above in those SAM A-C courses only.
Percentage of CTE concentrators in the denominator who earned an industry-recognized credential, a certificate, a degree, or who completed the transfer program and were classified as transfer prepared.
Percentage of CTE concentrators in the denominator who persisted in the California community college system or transferred to another two- or four-year institution.
Percentage of CTE concentrators in the denominator who were found during one of the four quarters following the cohort year in Unemployment Insurance (UI)-covered employment, or an apprenticeship program, the federal government, or the military in the year following the cohort year.
Percentage of CTE concentrators in the denominator who were of the underrepresented gender.
Percentage of nontraditional concentrators in nontraditional programs earning a certificate or degree or completed a transfer program.
PY 2010–11 Performance levels 88.81% 82.05% 85.96% 82.21% 20.37% 22.10%
PY 2010–11 Results 89.10% 81.22% 85.92% 86.60% 22.43% 26.66%
Special populations
Individuals with disabilities (ADA )
Economically disadvantaged students
Single parents
Displaced homemakers
Limited English proficient students
Students in nontraditional programs
88.80%
86.00%
84.50%
83.32%
89.46%
86.48%
80.72%
84.38%
84.43%
77.75%
87.94%
85.84%
26.16%
26.68%
24.72%
22.44%
29.63%
NP
85.47% 91.41% 23.88%
89.49% 90.32% 23.82%
88.76% 89.76% 23.21%
90.99% 88.63% 19.84%
87.21% 87.61% 23.69%
88.06% 88.87% NP
T ech prep 88.84% 83.18% 85.35% 87.26% 20.46% 23.63% NOTE: This table contains the results for students whom the state has identified as concentrators or participants (participants are only indicated by the state under the nontraditional participation core indicator) in career and technical education (CTE). See Appendix A, Table A-1 for the state’s definition of CTE concentrators and Table A-2 for the state’s definition of CTE participants. Definitions for special populations are provided in the Glossary of Terms in this report. Actual performance data above 95 percent and below 10 percent have been masked to protect student confidentiality. NE—state reported no enrollment; NP—data not provided; PNO—state reported program not offered; NA—data not applicable ADA—Americans with Disabilities Act

APPENDIX B. INDIVIDUAL STATE PERFORMANCE PROFILES, PY 2010–11 | 101
California Postsecondary Level—continued
Core indicators T echnical skill
attainment Credential,
certificate, or degree Student retention
or transfer Student
placement Nontraditional participation
Nontraditional completion
Gender
Male
Female
75.93%
85.58%
87.28%
86.03%
27.19%
26.24%
88.89% 84.42% 17.65%
89.28% 87.44% 26.91%
Race/ethnicity
American Indian or Alaska Native
Asian
Black or African American
Hispanic or Latino Native Hawaiian or Other Pacific Islander White
Two or more races
77.03%
88.86%
77.31%
77.79%
82.78%
81.25%
87.50%
86.16%
85.31%
81.39%
88.93%
87.13%
86.56%
>95.00%
26.95%
30.86%
30.11%
24.63%
28.12%
25.06%
13.04%
87.68% 85.56% 24.12%
90.97% 86.70% 26.22%
84.77% 86.41% 25.94%
87.70% 85.87% 19.89%
89.21% 88.77% 23.87%
90.11% 85.48% 21.76%
>95.00% 84.38% 21.62%

APPENDIX B. INDIVIDUAL STATE PERFORMANCE PROFILES, PY 2010–11 | 102
Colorado Secondary Level
Core indicators
Academic attainment: Reading/
language arts Academic attainment:
Mathematics T echnical skill
attainment School
completion Student
graduation rates Placement Nontraditional participation
Nontraditional completion
Measurement definitions
Percentage of CTE concentrators and completers in their fourth or greater high school year who have met the proficient or advanced level on the statewide high school reading and language arts assessment administered by the state under ESEA and who in the reporting year, have met locally-defined requirements for a high school diploma.
Percentage of CTE concentrators and completers in their fourth or greater high school year who have met the proficient or advanced level on the statewide high school mathematics assessment administered by the state under ESEA and who in the reporting year, have met locally-defined requirements for a high school diploma.
Percentage of CTE concentrators who completed their program and who met state-recognized CTE standards in Colorado Community College System-approved programs.
Percentage of CTE concentrators and completers in their fourth or greater high school year who have met locally defined requirements for a high school diploma in the reporting year.
Percentage of CTE concentrators and completers who, in the reporting year, were included as graduated in the state's computation of its graduation rate as described in ESEA .
Percentage of previous year CTE completers placed in advanced postsecondary education or training, military service, or employment two quarters after the end of the academic reporting year (i.e., CTE completers who graduated by June 30, 2009 would be assessed between Oct. 1, 2009 and Dec. 31, 2009).
Percentage of CTE participants from underrepresented gender groups enrolled in nontraditional programs.
Percentage of CTE completers from underrepresented gender groups in nontraditional programs.
PY 2010–11 Performance levels 90.00% 74.00% 62.00% 80.00% 63.00% 91.50% 50.70% 44.75%
PY 2010–11 Results 94.84% 70.66% 55.06% 86.93% 84.27% >95.00% NE 46.57%
Special populations
Individuals with disabilities (ADA )
Individuals with disabilities (ESEA /IDEA )
Economically disadvantaged students
Single parents
Displaced homemakers
Limited English proficient students
Migrant students
Students in nontraditional programs
NP
25.45%
54.18%
NP
NP
34.06%
40.00%
71.99%
NP
71.37%
80.04%
NP
NP
73.95%
73.03%
88.24%
NP
91.56%
>95.00%
NP
NP
94.29%
94.74%
42.22%
NP
45.23%
45.64%
NP
NP
44.60%
48.31%
NP
NP NP NP NP
70.62% 60.53% 65.95% NP
90.00% 55.81% 73.48% NP
NP NP NP NP
NP NP NP NP
76.72% 51.40% 68.87% NP
75.56% 43.63% 71.83% NP
94.91% 55.23% 85.13% NP Tech prep NP NP NP NP NP NP NP NP NOTE: This table contains the results for students whom the state has identified as concentrators or participants (participants are only indicated by the state under the nontraditional participation core indicator) in career and technical education (CTE). See Appendix A, Table A-1 for the state’s definition of CTE concentrators and Table A-2 for the state’s definition of CTE participants. Definitions for special populations are provided in the Glossary of Terms in this report. Actual performance data above 95 percent and below 10 percent have been masked to protect student confidentiality. NE—state reported no enrollment; NP—data not provided; PNO—state reported program not offered; NA—data not applicable ADA—Americans with Disabilities Act; ESEA—Elementary and Secondary Education Act of 1965, as amended; IDEA—Individuals with Disabilities Education Act

APPENDIX B. INDIVIDUAL STATE PERFORMANCE PROFILES, PY 2010–11 | 103
Colorado Secondary Level—continued
Core indicators
Academic attainment: Reading/
language arts Academic attainment:
Mathematics T echnical skill
attainment School
completion Student
graduation rates Placement Nontraditional participation
Nontraditional completion
Gender
Male
Female
72.11%
69.10%
85.09%
88.96%
>95.00%
>95.00%
57.87%
28.97%
92.80% 56.92% 81.76% NP
>95.00% 52.95% 86.98% NP
Race/ethnicity
American Indian or Alaska Native
Asian
Black or African American
Hispanic or Latino Native Hawaiian or Other Pacific Islander White
Two or more races
62.34%
75.52%
46.48%
53.15%
66.67%
78.91%
74.42%
83.81%
87.21%
82.44%
81.38%
79.59%
89.70%
87.58%
92.37%
>95.00%
>95.00%
>95.00%
NE
>95.00%
NE
42.45%
50.92%
45.86%
43.98%
42.65%
47.66%
44.46%
92.86% 57.80% 72.60% NP
92.94% 50.78% 89.48% NP
87.39% 55.65% 79.95% NP
90.63% 55.53% 75.43% NP
>95.00% 55.03% 81.01% NP
>95.00% 55.10% 88.26% NP
94.87% 51.95% 87.31% NP

APPENDIX B. INDIVIDUAL STATE PERFORMANCE PROFILES, PY 2010–11 | 104
Colorado Postsecondary Level
Core indicators T echnical skill
attainment Credential,
certificate, or degree Student retention
or transfer Student
placement Nontraditional participation
Nontraditional completion
Measurement definitions
Percentage of CTE concentrators who completed an approved CTE program during the reporting year.
Percentage of CTE concentrators who completed an approved CTE program during the reporting year.
Percentage of CTE participants within the current reporting year who were participants in postsecondary education in the previous year and did not earn a certificate or degree in the previous reporting year.
Percentage of previous year CTE completers who were placed in employment, continuing education, or placed in military service or apprenticeship programs two quarters after the end of the academic reporting year (i.e., CTE completers who graduated by June 30, 2009 would be assessed between Oct. 1, 2009 and Dec. 31, 2009).
Percentage of all enrolled CTE participants from underrepresented gender groups who participated in a program that leads to employment in nontraditional fields during the reporting year.
Percentage of CTE completers from underrepresented gender groups who completed a program that leads to employment in nontraditional fields during the reporting year.
PY 2010–11 Performance levels 58.00% 58.00% 43.00% 95.70% 15.60% 12.50%
PY 2010–11 Results 58.75% 58.75% 42.45% >95.00% 17.78% 14.51%
Special populations
Individuals with disabilities (ADA )
Economically disadvantaged students
Single parents
Displaced homemakers
Limited English proficient students
Students in nontraditional programs
54.14%
37.97%
12.85%
13.47%
56.33%
50.94%
>95.00%
>95.00%
90.70%
87.50%
92.55%
93.04%
19.57%
16.77%
10.67%
<10.00%
<10.00%
NP
54.14% 63.92% 23.33%
37.97% NP 20.83%
12.85% 31.00% 25.00%
13.47% 16.21% 24.16%
56.33% 11.02% 13.79%
50.94% 52.53% NP
T ech prep NP NP NP NP NP NP NOTE: This table contains the results for students whom the state has identified as concentrators or participants (participants are only indicated by the state under the nontraditional participation core indicator) in career and technical education (CTE). See Appendix A, Table A-1 for the state’s definition of CTE concentrators and Table A-2 for the state’s definition of CTE participants. Definitions for special populations are provided in the Glossary of Terms in this report. Actual performance data above 95 percent and below 10 percent have been masked to protect student confidentiality. NE—state reported no enrollment; NP—data not provided; PNO—state reported program not offered; NA—data not applicable ADA—Americans with Disabilities Act

APPENDIX B. INDIVIDUAL STATE PERFORMANCE PROFILES, PY 2010–11 | 105
Colorado Postsecondary Level—continued
Core indicators T echnical skill
attainment Credential,
certificate, or degree Student retention
or transfer Student
placement Nontraditional participation
Nontraditional completion
Gender
Male
Female
54.35%
63.28%
>95.00%
>95.00%
14.08%
14.88%
54.35% 40.65% 11.27%
63.28% 44.20% 23.89%
Race/ethnicity
American Indian or Alaska Native
Asian
Black or African American
Hispanic or Latino Native Hawaiian or Other Pacific Islander White
Two or more races
45.02%
60.95%
51.42%
63.69%
39.53%
58.73%
38.49%
93.18%
93.98%
92.39%
94.88%
NE
>95.00%
NE
16.05%
19.88%
16.77%
14.41%
25.00%
15.71%
18.97%
45.02% 29.96% 19.70%
60.95% 40.32% 21.87%
51.42% 34.69% 24.67%
63.69% 32.70% 16.64%
39.53% NE 17.58%
58.73% 40.73% 18.12%
38.49% NE 22.88%

APPENDIX B. INDIVIDUAL STATE PERFORMANCE PROFILES, PY 2010–11 | 106
Connecticut Secondary Level
Core indicators
Academic attainment: Reading/
language arts Academic attainment:
Mathematics T echnical skill
attainment School
completion Student
graduation rates Placement Nontraditional participation
Nontraditional completion
Measurement definitions
Percentage of concentrators who have met the proficient or advanced level on the statewide high school reading and language arts assessment administered by the state under ESEA .
Percentage of concentrators who have met the proficient or advanced level on the statewide high school mathematics assessment administered by the state under ESEA .
Percentage of CTE student concentrators meeting assessment goal on the CTE assessment tests.
Percentage of concentrators reported as graduated using the state's approved calculation for graduation rate as defined in the state's ESEA accountability workbook.
Percentage of concentrators reported as graduated using the state's approved calculation for graduation rate as defined in the state's ESEA accountability workbook.
Percentage of CTE concentrators who left secondary education and were placed in postsecondary education or advanced training in the military service, or employment in the second quarter following the program year in which they left secondary education.
Percentage of CTE participants from underrepresented gender groups who participated in a program that leads to employment in nontraditional fields during the reporting year.
Percentage of CTE concentrators from underrepresented gender groups who completed a program that leads to employment in nontraditional fields during the reporting year.
PY 2010–11 Performance levels 91.00% 80.00% 46.00% 70.10% 70.00% 50.00% 39.25% 35.50%
PY 2010–11 Results 90.33% 88.00% 40.62% 90.42% 90.42% 93.69% 37.99% 31.37%
Special populations
Individuals with disabilities (ADA )
Individuals with disabilities (ESEA /IDEA )
Economically disadvantaged students
Single parents
Displaced homemakers
Limited English proficient students
Migrant students
Students in nontraditional programs
NP
63.57%
74.59%
80.00%
NP
57.51%
84.62%
NP
NP
90.31%
86.37%
80.92%
NP
75.51%
NP
87.73%
NP
56.30%
56.84%
15.38%
NE
21.55%
NE
NE
NP
>95.00%
>95.00%
>95.00%
NP
>95.00%
NE
NP
NP NP NP NP
68.97% 21.73% 90.31% 37.93%
80.03% 27.63% 86.37% 37.87%
75.00% 42.86% 80.92% 36.07%
NP 50.00% NP NP
57.73% 16.53% 75.51% 35.78%
84.62% 38.89% NP NP
NP NP 87.73% NP Tech prep 93.26% 89.53% NP >95.00% >95.00% NE 37.66% NP NOTE: This table contains the results for students whom the state has identified as concentrators or participants (participants are only indicated by the state under the nontraditional participation core indicator) in career and technical education (CTE). See Appendix A, Table A-1 for the state’s definition of CTE concentrators and Table A-2 for the state’s definition of CTE participants. Definitions for special populations are provided in the Glossary of Terms in this report. Actual performance data above 95 percent and below 10 percent have been masked to protect student confidentiality. NE—state reported no enrollment; NP—data not provided; PNO—state reported program not offered; NA—data not applicable ADA—Americans with Disabilities Act; ESEA—Elementary and Secondary Education Act of 1965, as amended; IDEA—Individuals with Disabilities Education Act

APPENDIX B. INDIVIDUAL STATE PERFORMANCE PROFILES, PY 2010–11 | 107
Connecticut Secondary Level—continued
Core indicators
Academic attainment: Reading/
language arts Academic attainment:
Mathematics T echnical skill
attainment School
completion Student
graduation rates Placement Nontraditional participation
Nontraditional completion
Gender
Male
Female
90.94%
83.94%
88.77%
92.46%
94.07%
93.22%
29.07%
34.61%
89.61% 34.89% 88.77% 39.75%
91.31% 47.57% 92.46% 35.65%
Race/ethnicity
American Indian or Alaska Native
Asian
Black or African American
Hispanic or Latino Native Hawaiian or Other Pacific Islander White
Two or more races
83.33%
92.24%
68.11%
76.31%
<10.00%
93.94%
85.71%
85.29%
93.29%
85.89%
86.86%
95.00%
92.49%
>95.00%
71.88%
55.35%
58.08%
58.62%
NE
72.79%
NE
20.33%
35.76%
33.36%
30.12%
67.86%
31.28%
27.23%
93.55% 38.46% 85.29% 32.62%
92.22% 40.22% 93.29% 39.92%
79.67% 24.94% 85.89% 38.38%
80.37% 28.41% 86.86% 38.07%
>95.00% NP 95.00% 35.85%
94.28% 45.97% 92.49% 37.84%
78.57% 31.88% >95.00% 37.54%

APPENDIX B. INDIVIDUAL STATE PERFORMANCE PROFILES, PY 2010–11 | 108
Connecticut Postsecondary Level
Core indicators T echnical skill
attainment Credential,
certificate, or degree Student retention
or transfer Student
placement Nontraditional participation
Nontraditional completion
Measurement definitions
Percentage of CTE concentrators who graduate during the reporting year with a GPA of 2.5 or higher.
Percentage of CTE concentrators who received an industry-recognized credential, a certificate, or a degree during the reporting year.
Percentage of CTE concentrators who remained enrolled in their original postsecondary institution or transferred to another two- or four-year postsecondary institution during the reporting year and who were enrolled in postsecondary education in the fall of the previous reporting year.
Percentage of CTE concentrators who were placed in employment, or placed in military service or apprenticeship programs in the second quarter following the program year in which they graduated from postsecondary education (i.e., unduplicated placement status for CTE concentrators who graduate by June 30, 2007 would be assessed between Oct. 1, 2007 and Dec. 31, 2007).
Percentage of CTE nontraditional participants in all programs that have been defined as occupations where one gender comprises less than 25 percent of employment.
Percentage of nontraditional CTE graduates in all programs that have been defined as occupations where one gender comprises less than 25 percent of employment.
PY 2010–11 Performance levels 91.68% 28.00% 65.24% 70.80% 33.08% 25.27%
PY 2010–11 Results 92.76% 36.17% 78.27% 70.09% 32.89% 26.22%
Special populations
Individuals with disabilities (ADA )
Economically disadvantaged students
Single parents
Displaced homemakers
Limited English proficient students
Students in nontraditional programs
38.74%
51.02%
46.81%
55.56%
40.08%
28.83%
70.40%
70.63%
70.67%
70.55%
70.70%
68.81%
20.27%
22.58%
12.43%
<10.00%
21.21%
NP
83.78% 84.95% 21.47%
92.60% 80.73% 24.59%
93.49% 78.68% 13.30%
93.33% 81.82% <10.00%
87.88% 90.00% 26.72%
89.82% 76.23% NP
T ech prep 94.23% 37.68% 77.22% 76.00% 31.29% 30.77% NOTE: This table contains the results for students whom the state has identified as concentrators or participants (participants are only indicated by the state under the nontraditional participation core indicator) in career and technical education (CTE). See Appendix A, Table A-1 for the state’s definition of CTE concentrators and Table A-2 for the state’s definition of CTE participants. Definitions for special populations are provided in the Glossary of Terms in this report. Actual performance data above 95 percent and below 10 percent have been masked to protect student confidentiality. NE—state reported no enrollment; NP—data not provided; PNO—state reported program not offered; NA—data not applicable ADA—Americans with Disabilities Act

APPENDIX B. INDIVIDUAL STATE PERFORMANCE PROFILES, PY 2010–11 | 109
Connecticut Postsecondary Level—continued
Core indicators T echnical skill
attainment Credential,
certificate, or degree Student retention
or transfer Student
placement Nontraditional participation
Nontraditional completion
Gender
Male
Female
28.04%
43.83%
66.44%
72.33%
63.60%
<10.00%
90.45% 77.53% 61.87%
94.15% 79.14% <10.00%
Race/ethnicity
American Indian or Alaska Native
Asian
Black or African American
Hispanic or Latino Native Hawaiian or Other Pacific Islander White
Two or more races
28.57%
43.72%
33.80%
32.05%
33.33%
35.16%
25.53%
<10.00%
44.44%
71.54%
69.53%
<10.00%
71.72%
17.65%
<10.00%
27.72%
26.52%
50.00%
27.01%
27.02%
33.33%
>95.00% 73.33% 42.86%
91.09% 85.34% 35.50%
86.62% 79.10% 32.07%
90.94% 76.24% 33.00%
>95.00% 57.14% 75.00%
94.39% 78.41% 33.57%
94.44% 70.42% 32.62%

APPENDIX B. INDIVIDUAL STATE PERFORMANCE PROFILES, PY 2010–11 | 110
Delaware Secondary Level
Core indicators
Academic attainment: Reading/
language arts Academic attainment:
Mathematics T echnical skill
attainment School
completion Student
graduation rates Placement Nontraditional participation
Nontraditional completion
Measurement definitions
Percentage of CTE concentrators who have met the proficient or advanced level on the statewide high school reading assessment administered by the state under ESEA and who, in the reporting year, left secondary education.
Percentage of CTE concentrators who have met the proficient or advanced level on the statewide high school mathematics assessment administered by the state under ESEA and who, in the reporting year, left secondary education.
Percentage of CTE concentrators who passed technical skill assessments that are aligned with industry-recognized standards, if available and appropriate, during the reporting year.
Percentage of CTE concentrators who completed a CTE career pathway and earned a regular secondary school diploma or other state-recognized equivalent during the reporting year.
Percentage of CTE concentrators who, in the reporting year, were included as graduated in the state's computation of its graduation rate as described in ESEA .
Percentage of CTE concentrators who left secondary education and were placed in postsecondary education or advanced training, in the military service, or employment in the second quarter following the program year in which they left secondary education (i.e., unduplicated placement status for CTE concentrators who graduated by June 30, 2007 would be assessed between Oct. 1, 2007 and Dec. 31, 2007).
Percentage of CTE participants from underrepresented gender groups who participated in a program that leads to employment in nontraditional fields during the reporting year.
Percentage of CTE concentrators from underrepresented gender groups who completed a pathway that leads to employment in nontraditional fields during the reporting year.
PY 2010–11 Performance levels 73.00% 58.00% 73.00% 72.00% 85.50% 55.00% 33.00% 17.00%
PY 2010–11 Results 73.80% 61.15% >95.00% >95.00% >95.00% 60.71% 37.06% 27.75%
Special populations
Individuals with disabilities (ADA )
Individuals with disabilities (ESEA /IDEA )
Economically disadvantaged students
Single parents
Displaced homemakers
Limited English proficient students
Migrant students
Students in nontraditional programs
NP
17.60%
51.48%
23.08%
>95.00%
13.33%
NE
60.85%
NP
90.63%
94.87%
93.75%
>95.00%
>95.00%
NE
>95.00%
NP
31.13%
53.57%
58.33%
60.00%
38.64%
NE
58.80%
NP
34.48%
25.70%
30.00%
<10.00%
40.00%
NE
NP
NP NP NP NP
25.60% >95.00% 91.54% 37.07%
65.05% >95.00% >95.00% 36.95%
53.85% 93.75% 93.75% 26.83%
>95.00% >95.00% >95.00% <10.00%
<10.00% >95.00% >95.00% 43.33%
NE NE NE <10.00%
73.46% >95.00% >95.00% NP Tech prep 74.63% 60.91% >95.00% >95.00% >95.00% 64.77% 33.40% 30.04% NOTE: This table contains the results for students whom the state has identified as concentrators or participants (participants are only indicated by the state under the nontraditional participation core indicator) in career and technical education (CTE). See Appendix A, Table A-1 for the state’s definition of CTE concentrators and Table A-2 for the state’s definition of CTE participants. Definitions for special populations are provided in the Glossary of Terms in this report. Actual performance data above 95 percent and below 10 percent have been masked to protect student confidentiality. NE—state reported no enrollment; NP—data not provided; PNO—state reported program not offered; NA—data not applicable ADA—Americans with Disabilities Act; ESEA—Elementary and Secondary Education Act of 1965, as amended; IDEA—Individuals with Disabilities Education Act

APPENDIX B. INDIVIDUAL STATE PERFORMANCE PROFILES, PY 2010–11 | 111
Delaware Secondary Level—continued
Core indicators
Academic attainment: Reading/
language arts Academic attainment:
Mathematics T echnical skill
attainment School
completion Student
graduation rates Placement Nontraditional participation
Nontraditional completion
Gender
Male
Female
63.37%
58.69%
94.30%
>95.00%
55.72%
65.96%
25.00%
31.06%
72.17% >95.00% >95.00% 39.38%
75.61% >95.00% >95.00% 34.20%
Race/ethnicity
American Indian or Alaska Native
Asian
Black or African American
Hispanic or Latino Native Hawaiian or Other Pacific Islander White
Two or more races
65.22%
79.07%
45.60%
57.48%
>95.00%
69.18%
66.67%
>95.00%
>95.00%
94.12%
>95.00%
>95.00%
>95.00%
>95.00%
50.00%
81.33%
58.34%
53.74%
NE
62.16%
NE
40.00%
33.82%
26.25%
27.44%
>95.00%
28.35%
<10.00%
73.91% >95.00% >95.00% 38.59%
81.93% >95.00% >95.00% 43.48%
63.14% >95.00% >95.00% 39.35%
66.55% >95.00% >95.00% 37.13%
<10.00% >95.00% >95.00% 62.50%
80.15% >95.00% >95.00% 35.25%
91.67% >95.00% >95.00% 36.54%

APPENDIX B. INDIVIDUAL STATE PERFORMANCE PROFILES, PY 2010–11 | 112
Delaware Postsecondary Level
Core indicators T echnical skill
attainment Credential,
certificate, or degree Student retention
or transfer Student
placement Nontraditional participation
Nontraditional completion
Measurement definitions
Percentage of CTE concentrators who passed technical skill assessments that are aligned with industry-recognized standards, if available and appropriate, during the reporting year.
Percentage of CTE concentrators who received an industry-recognized credential, a certificate, or a degree during the reporting year.
Percentage of CTE concentrators who remained enrolled in their original postsecondary institution or transferred to another two- or four-year postsecondary institution during the reporting year and who were enrolled in postsecondary education in the fall of the previous reporting year.
Percentage of CTE concentrators who were placed or retained in employment, or placed in military service or apprenticeship programs in the second quarter following the program year in which they left postsecondary education (i.e., unduplicated placement status for CTE concentrators who graduated by June 30, 2007 would be assessed between June 30, 2007 and Dec. 31, 2007).
Percentage of CTE participants from underrepresented gender groups who participated in a program that leads to employment in nontraditional fields during the reporting year.
Percentage of CTE concentrators from underrepresented gender groups who completed a program that leads to employment in nontraditional fields during the reporting year.
PY 2010–11 Performance levels 75.00% 49.00% 39.00% 79.00% 12.50% 12.00%
PY 2010–11 Results 91.96% 73.81% 77.46% 83.63% 14.26% 15.48%
Special populations
Individuals with disabilities (ADA )
Economically disadvantaged students
Single parents
Displaced homemakers
Limited English proficient students
Students in nontraditional programs
62.07%
71.87%
87.84%
86.05%
77.19%
67.31%
93.33%
85.11%
85.07%
74.29%
64.71%
82.54%
30.43%
14.23%
10.81%
17.65%
25.00%
NP
>95.00% 80.00% 18.00%
92.14% 76.65% 13.13%
92.11% 88.51% <10.00%
>95.00% 83.64% 18.33%
>95.00% 86.67% 10.53%
<10.00% 78.31% NP
T ech prep >95.00% 75.37% 67.14% 74.75% 16.30% 18.42% NOTE: This table contains the results for students whom the state has identified as concentrators or participants (participants are only indicated by the state under the nontraditional participation core indicator) in career and technical education (CTE). See Appendix A, Table A-1 for the state’s definition of CTE concentrators and Table A-2 for the state’s definition of CTE participants. Definitions for special populations are provided in the Glossary of Terms in this report. Actual performance data above 95 percent and below 10 percent have been masked to protect student confidentiality. NE—state reported no enrollment; NP—data not provided; PNO—state reported program not offered; NA—data not applicable ADA—Americans with Disabilities Act

APPENDIX B. INDIVIDUAL STATE PERFORMANCE PROFILES, PY 2010–11 | 113
Delaware Postsecondary Level—continued
Core indicators T echnical skill
attainment Credential,
certificate, or degree Student retention
or transfer Student
placement Nontraditional participation
Nontraditional completion
Gender
Male
Female
76.08%
71.89%
85.06%
82.30%
21.57%
10.32%
93.48% 81.64% 17.94%
90.37% 73.83% 10.71%
Race/ethnicity
American Indian or Alaska Native
Asian
Black or African American
Hispanic or Latino Native Hawaiian or Other Pacific Islander White
Two or more races
<10.00%
63.41%
59.45%
74.58%
NE
77.64%
65.22%
>95.00%
69.23%
73.60%
87.23%
<10.00%
85.30%
92.86%
>95.00%
15.00%
20.00%
16.67%
NE
14.37%
38.46%
>95.00% 50.00% 33.33%
>95.00% 81.25% 30.19%
86.49% 76.88% 19.67%
>95.00% 75.47% 14.85%
NE >95.00% >95.00%
92.29% 77.86% 12.39%
>95.00% 54.55% 28.12%

APPENDIX B. INDIVIDUAL STATE PERFORMANCE PROFILES, PY 2010–11 | 114
District of Columbia Secondary Level
Core indicators
Academic attainment: Reading/
language arts Academic attainment:
Mathematics T echnical skill
attainment School
completion Student
graduation rates Placement Nontraditional participation
Nontraditional completion
Measurement definitions
Percentage of CTE concentrators who scored proficient or advanced in reading and language arts on the District of Columbia Comprehensive Assessment System (DC-CAS).
Percentage of CTE concentrators who scored proficient or advanced in mathematics on the DC-CAS.
Percentage of CTE completers who passed industry-based technical skill assessments. Proxy Measure: Percentage of grade 12 CTE concentrators who attained a GPA of 2.0 or greater in their program of study.
Percentage of grade 12 CTE concentrators who received a high school diploma, General Education Development (GED), or certificate of Individualized Education Program completion.
Percentage of CTE concentrators who were counted as graduated in the state's graduation rate computation for the reporting year.
Percentage of grade 12 CTE concentrators who were reported placed in postsecondary education or advanced training, military service, or employment, in the second quarter following graduation.
Percentage of CTE participants in programs preparing students for occupations that are identified as nontraditional (i.e., that reflect a labor market gender imbalance of 75/25 or greater) who were members of the underrepresented gender.
Percentage of grade 12 CTE concentrators in programs preparing students for occupations that are identified as nontraditional who were members of the underrepresented gender.
PY 2010–11 Performance levels 71.00% 70.00% 85.00% 96.00% 80.00% 89.00% 36.75% 42.00%
PY 2010–11 Results 53.33% 50.36% 73.68% 91.45% 46.97% NP 45.49% 43.20%
Special populations
Individuals with disabilities (ADA )
Individuals with disabilities (ESEA /IDEA )
Economically disadvantaged students
Single parents
Displaced homemakers
Limited English proficient students
Migrant students
Students in nontraditional programs
NE
17.27%
39.94%
NE
NE
33.33%
NE
40.91%
NE
79.55%
88.24%
NE
NE
80.00%
NE
90.51%
NP
NP
NP
NP
NP
NP
NP
NP
NE
50.00%
48.25%
NE
NE
33.33%
NE
NP
NE NE 35.25% NE
19.47% 79.17% NP 43.11%
44.51% 86.91% 43.37% 49.95%
NE NE 47.37% NE
NE NE NE NE
11.11% 80.00% 57.14% 32.47%
NE NE NE NE
50.19% 84.71% >95.00% NP Tech prep NP NP NP NP >95.00% PNO NP NP NOTE: This table contains the results for students whom the state has identified as concentrators or participants (participants are only indicated by the state under the nontraditional participation core indicator) in career and technical education (CTE). See Appendix A, Table A-1 for the state’s definition of CTE concentrators and Table A-2 for the state’s definition of CTE participants. Definitions for special populations are provided in the Glossary of Terms in this report. Actual performance data above 95 percent and below 10 percent have been masked to protect student confidentiality. NE—state reported no enrollment; NP—data not provided; PNO—state reported program not offered; NA—data not applicable ADA—Americans with Disabilities Act; ESEA—Elementary and Secondary Education Act of 1965, as amended; IDEA—Individuals with Disabilities Education Act

APPENDIX B. INDIVIDUAL STATE PERFORMANCE PROFILES, PY 2010–11 | 115
District of Columbia Secondary Level—continued
Core indicators
Academic attainment: Reading/
language arts Academic attainment:
Mathematics T echnical skill
attainment School
completion Student
graduation rates Placement Nontraditional participation
Nontraditional completion
Gender
Male
Female
51.59%
49.44%
88.61%
93.62%
NP
NP
<10.00%
87.39%
47.91% 73.84% 43.91% 16.23%
57.39% 73.55% 50.61% 74.94%
Race/ethnicity
American Indian or Alaska Native
Asian
Black or African American
Hispanic or Latino Native Hawaiian or Other Pacific Islander White
Two or more races
>95.00%
88.89%
46.53%
69.09%
NE
87.34%
NE
>95.00%
>95.00%
91.45%
86.49%
NE
93.33%
NE
NP
NP
NP
NP
NP
NP
NP
NE
33.33%
45.26%
<10.00%
NE
20.00%
NE
>95.00% >95.00% 33.33% NE
61.11% 85.71% <10.00% 36.84%
49.76% 71.58% 47.53% 48.13%
73.21% 83.78% NE 32.07%
NE NE <10.00% NE
92.41% 91.67% 40.00% 21.62%
NE NE 33.33% NE

APPENDIX B. INDIVIDUAL STATE PERFORMANCE PROFILES, PY 2010–11 | 116
District of Columbia Postsecondary Level
Core indicators T echnical skill
attainment Credential,
certificate, or degree Student retention
or transfer Student
placement Nontraditional participation
Nontraditional completion
Measurement definitions
Percentage of CTE concentrators who passed industry-based technical skill assessments. Proxy Measure: Percentage of CTE concentrators who attained a GPA of 3.0 or greater in their major.
Percentage of CTE concentrators who received an industry-recognized credential or a certificate or degree.
Percentage of second-year or higher CTE concentrators who remained enrolled or transferred to another postsecondary institution.
Percentage of CTE concentrators who were reported placed in employment, military service, or a registered apprenticeship, in the second quarter following graduation.
Percentage of CTE participants in programs preparing students for occupations that are identified as "nontraditional" (i.e., that reflect a labor market gender imbalance of 75/25 or greater) who were members of the underrepresented gender.
Percentage of CTE concentrators in programs preparing students for occupations that are identified as "nontraditional" who were members of the underrepresented gender.
PY 2010–11 Performance levels 56.50% 77.00% 51.00% 96.00% 26.00% 28.00%
PY 2010–11 Results 53.99% >95.00% 62.88% >95.00% 63.41% >95.00%
Special populations
Individuals with disabilities (ADA )
Economically disadvantaged students
Single parents
Displaced homemakers
Limited English proficient students
Students in nontraditional programs
>95.00%
>95.00%
>95.00%
>95.00%
>95.00%
>95.00%
>95.00%
>95.00%
>95.00%
>95.00%
>95.00%
>95.00%
NE
>95.00%
>95.00%
>95.00%
>95.00%
NP
57.14% 64.29% >95.00%
48.06% 56.42% 42.93%
55.32% 68.09% >95.00%
50.00% 66.67% >95.00%
74.08% 67.02% 40.00%
54.78% 56.52% NP
T ech prep PNO PNO PNO PNO PNO PNO NOTE: This table contains the results for students whom the state has identified as concentrators or participants (participants are only indicated by the state under the nontraditional participation core indicator) in career and technical education (CTE). See Appendix A, Table A-1 for the state’s definition of CTE concentrators and Table A-2 for the state’s definition of CTE participants. Definitions for special populations are provided in the Glossary of Terms in this report. Actual performance data above 95 percent and below 10 percent have been masked to protect student confidentiality. NE—state reported no enrollment; NP—data not provided; PNO—state reported program not offered; NA—data not applicable ADA—Americans with Disabilities Act
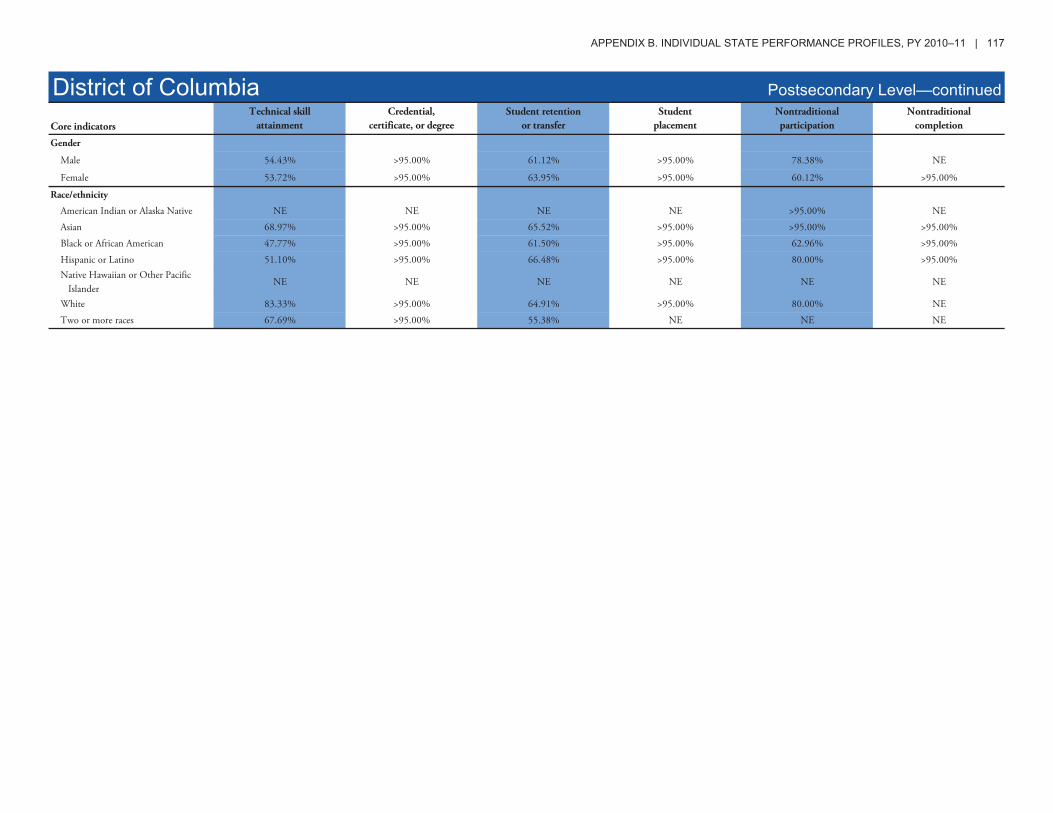
APPENDIX B. INDIVIDUAL STATE PERFORMANCE PROFILES, PY 2010–11 | 117
District of Columbia Postsecondary Level—continued
Core indicators T echnical skill
attainment Credential,
certificate, or degree Student retention
or transfer Student
placement Nontraditional participation
Nontraditional completion
Gender
Male
Female
>95.00%
>95.00%
>95.00%
>95.00%
NE
>95.00%
54.43% 61.12% 78.38%
53.72% 63.95% 60.12%
Race/ethnicity
American Indian or Alaska Native
Asian
Black or African American
Hispanic or Latino Native Hawaiian or Other Pacific Islander White
Two or more races
NE
>95.00%
>95.00%
>95.00%
NE
>95.00%
>95.00%
NE
>95.00%
>95.00%
>95.00%
NE
>95.00%
NE
NE
>95.00%
>95.00%
>95.00%
NE
NE
NE
NE NE >95.00%
68.97% 65.52% >95.00%
47.77% 61.50% 62.96%
51.10% 66.48% 80.00%
NE NE NE
83.33% 64.91% 80.00%
67.69% 55.38% NE

APPENDIX B. INDIVIDUAL STATE PERFORMANCE PROFILES, PY 2010–11 | 118
Florida Secondary Level
Core indicators
Academic attainment: Reading/
language arts Academic attainment:
Mathematics T echnical skill
attainment School
completion Student
graduation rates Placement Nontraditional participation
Nontraditional completion
Measurement definitions
Percentage of CTE concentrators who have met the proficient or advanced level on the statewide high school reading and language arts assessment administered by the state under ESEA and who, in the reporting year, left secondary education.
Percentage of CTE concentrators who have met the proficient or advanced level on the statewide high school mathematics assessment administered by the state under ESEA and who, in the reporting year, left secondary education.
Percentage of senior CTE concentrators who earned an industry-certified credential through a third party assessment, or successfully passed a state-approved end-of-course or end-of program assessment as demonstrated by an Occupational Completion Point.
Percentage of senior CTE concentrators who attained a standard high school diploma, General Education Development (GED) credential or adult high school diploma, or a proficiency credential, certificate or degree, in conjunction with a secondary school diploma.
Percentage of CTE concentrators who, in the reporting year, were included as graduated in the state's computation of its graduation rate as described in ESEA .
Percentage of CTE concentrators from the prior year who completed secondary school and who were placed in postsecondary education, employment, or military service in the second quarter (Oct.-Dec.) after leaving secondary education during the report year.
Percentage of CTE participants from underrepresented gender groups who participated in a program that leads to employment in nontraditional fields during the reporting year.
Percentage of senior CTE concentrators in programs identified as nontraditional for their gender who attained a standard high school diploma, GED credential or adult high school diploma, or a proficiency credential, certificate or degree, in conjunction with a secondary school diploma.
PY 2010–11 Performance levels 65.00% 62.00% 76.00% 88.00% 73.00% 87.00% 17.00% 90.00%
PY 2010–11 Results 62.66% 86.86% 89.29% 94.33% 93.69% 79.46% 27.31% 94.74%
Special populations
Individuals with disabilities (ADA )
Individuals with disabilities (ESEA /IDEA )
Economically disadvantaged students
Single parents
Displaced homemakers
Limited English proficient students
Migrant students
Students in nontraditional programs
NP
58.49%
81.68%
73.28%
NP
43.75%
82.70%
87.09%
NP
81.18%
91.52%
88.32%
NP
53.69%
92.23%
94.74%
NP
68.15%
75.78%
69.37%
NE
71.94%
71.23%
82.41%
NP
80.67%
92.04%
87.50%
NP
54.55%
91.30%
NP
NP NP NP NP
30.93% 86.42% 83.51% 20.67%
51.98% 89.43% 90.85% 27.46%
35.90% 91.04% 85.95% 24.86%
NP NP NP NP
<10.00% 87.03% 52.80% 23.86%
36.02% 87.13% 91.15% 20.40%
64.40% 90.88% 93.87% NP T ech prep NP NP NP NP NP NP NP NP NOTE: This table contains the results for students whom the state has identified as concentrators or participants (participants are only indicated by the state under the nontraditional participation core indicator) in career and technical education (CTE). See Appendix A, Table A-1 for the state’s definition of CTE concentrators and Table A-2 for the state’s definition of CTE participants. Definitions for special populations are provided in the Glossary of Terms in this report. Actual performance data above 95 percent and below 10 percent have been masked to protect student confidentiality. NE—state reported no enrollment; NP—data not provided; PNO—state reported program not offered; NA—data not applicable ADA—Americans with Disabilities Act; ESEA—Elementary and Secondary Education Act of 1965, as amended; IDEA—Individuals with Disabilities Education Act

APPENDIX B. INDIVIDUAL STATE PERFORMANCE PROFILES, PY 2010–11 | 119
Florida Secondary Level—continued
Core indicators
Academic attainment: Reading/
language arts Academic attainment:
Mathematics T echnical skill
attainment School
completion Student
graduation rates Placement Nontraditional participation
Nontraditional completion
Gender
Male
Female
89.35%
84.45%
94.16%
94.51%
77.84%
81.04%
>95.00%
93.46%
64.43% 88.59% 93.25% 13.80%
60.95% 89.87% 94.11% 40.95%
Race/ethnicity
American Indian or Alaska Native
Asian
Black or African American
Hispanic or Latino Native Hawaiian or Other Pacific Islander White
Two or more races
92.37%
93.47%
76.45%
84.71%
80.00%
91.30%
90.39%
>95.00%
>95.00%
90.70%
92.49%
87.50%
>95.00%
>95.00%
72.92%
80.33%
74.97%
80.05%
NE
80.64%
80.38%
>95.00%
>95.00%
91.39%
94.06%
>95.00%
>95.00%
>95.00%
65.83% 90.35% 94.40% 26.20%
69.80% 89.67% 94.99% 30.95%
46.78% 89.23% 90.24% 28.86%
56.76% 90.05% 92.41% 27.95%
42.86% 85.71% >95.00% 29.49%
70.84% 89.05% >95.00% 25.97%
67.31% 87.36% 94.35% 28.55%

APPENDIX B. INDIVIDUAL STATE PERFORMANCE PROFILES, PY 2010–11 | 120
Florida Postsecondary Level
Core indicators T echnical skill
attainment Credential,
certificate, or degree Student retention
or transfer Student
placement Nontraditional participation
Nontraditional completion
Measurement definitions
Percentage of CTE concentrators who earned an industry certified credential through a third party assessment or earned 75 percent of the program hours required with a GPA of 2.5 or higher.
Percentage of CTE concentrators who received an industry-recognized credential, a certificate, or a degree during the reporting year.
Percentage of CTE concentrators who remained enrolled in their original postsecondary institution or transferred to another two- or four-year postsecondary institution during the reporting year and who were enrolled in postsecondary education in the previous reporting year.
Percentage of CTE concentrators from the prior year who received a credential, degree or certificate who were placed in postsecondary education, employment or military service in the second quarter (Oct.-Dec.) after leaving postsecondary education.
Percentage of CTE participants from underrepresented gender groups in college credit programs that lead to employment in nontraditional fields during the reporting year.
Percentage of CTE concentrators who received an industry-recognized credential, certificate, or degree in college credit programs identified as nontraditional for their gender.
PY 2010–11 Performance levels 46.00% 39.00% 76.00% 88.00% 15.00% 23.00%
PY 2010–11 Results 43.36% 46.15% 71.66% 85.61% 14.11% 34.20%
Special populations
Individuals with disabilities (ADA )
Economically disadvantaged students
Single parents
Displaced homemakers
Limited English proficient students
Students in nontraditional programs
43.02%
45.08%
NE
NE
47.47%
57.05%
78.58%
85.36%
NE
NE
84.73%
86.86%
26.84%
31.12%
NE
NE
29.55%
NP
40.10% 71.29% 16.37%
41.04% 76.43% 13.32%
NE NE NE
NE NE NE
43.28% 74.65% 12.58%
47.50% 72.32% NP
T ech prep NP NP NP NP NP NP NOTE: This table contains the results for students whom the state has identified as concentrators or participants (participants are only indicated by the state under the nontraditional participation core indicator) in career and technical education (CTE). See Appendix A, Table A-1 for the state’s definition of CTE concentrators and Table A-2 for the state’s definition of CTE participants. Definitions for special populations are provided in the Glossary of Terms in this report. Actual performance data above 95 percent and below 10 percent have been masked to protect student confidentiality. NE—state reported no enrollment; NP—data not provided; PNO—state reported program not offered; NA—data not applicable ADA—Americans with Disabilities Act

APPENDIX B. INDIVIDUAL STATE PERFORMANCE PROFILES, PY 2010–11 | 121
Florida Postsecondary Level—continued
Core indicators T echnical skill
attainment Credential,
certificate, or degree Student retention
or transfer Student
placement Nontraditional participation
Nontraditional completion
Gender
Male
Female
44.56%
47.34%
86.76%
84.81%
28.01%
45.48%
42.49% 69.58% 24.75%
43.96% 73.03% <10.00%
Race/ethnicity
American Indian or Alaska Native
Asian
Black or African American
Hispanic or Latino Native Hawaiian or Other Pacific Islander White
Two or more races
37.82%
50.31%
37.20%
46.33%
54.17%
48.65%
41.10%
82.89%
80.00%
86.56%
87.42%
NE
85.16%
NE
31.03%
31.82%
28.82%
33.91%
25.00%
36.13%
33.96%
43.88% 74.52% 20.20%
45.55% 71.59% 19.09%
35.38% 69.84% 13.03%
43.53% 73.74% 15.18%
47.78% NE 24.44%
45.81% 71.51% 13.85%
31.92% NE 17.11%

APPENDIX B. INDIVIDUAL STATE PERFORMANCE PROFILES, PY 2010–11 | 122
Florida Adult Level
Core indicators T echnical skill
attainment Credential,
certificate, or degree Student retention
or transfer Student
placement Nontraditional participation
Nontraditional completion
Measurement definitions
Percentage of CTE concentrators who achieved at least one occupational completion point in a vocational certificate (PSAV) program or earned an industry-certified credential through a third party assessment.
Percentage of CTE concentrators who received an industry-recognized credential or a certificate during the reporting year.
Percentage of CTE concentrators who remained enrolled in their original postsecondary institution or transferred to two- or four-year postsecondary institution during the reporting year and who were enrolled in postsecondary education in the previous reporting year.
Percentage of CTE concentrators from the prior year who received a credential, degree or certificate who were placed in postsecondary education, employment or military service in the second quarter (Oct.-Dec.) after leaving postsecondary education.
Percentage of CTE participants from underrepresented gender groups in clock hour programs that lead to employment in nontraditional fields during the reporting year.
Percentage of CTE concentrators who received an industry-recognized credential, or a certificate programs identified as nontraditional for their gender.
PY 2010–11 Performance levels 75.00% 58.00% 59.00% 84.50% 10.00% 14.00%
PY 2010–11 Results 86.22% 60.73% 54.65% 76.26% 10.58% 49.95%
Special populations
Individuals with disabilities (ADA )
Economically disadvantaged students
Single parents
Displaced homemakers
Limited English proficient students
Students in nontraditional programs
40.33%
56.75%
58.26%
63.17%
39.66%
55.80%
64.67%
73.48%
73.82%
69.67%
70.47%
78.04%
34.21%
45.25%
44.19%
56.25%
37.12%
NP
85.30% 56.08% 10.04%
86.47% 57.59% 10.07%
91.65% 49.17% <10.00%
93.22% 52.65% <10.00%
91.22% 48.90% <10.00%
85.32% 57.81% NP
T ech prep NP NP NP NP NP NP NOTE: This table contains the results for students whom the state has identified as concentrators or participants (participants are only indicated by the state under the nontraditional participation core indicator) in career and technical education (CTE). See Appendix A, Table A-1 for the state’s definition of CTE concentrators and Table A-2 for the state’s definition of CTE participants. Definitions for special populations are provided in the Glossary of Terms in this report. Actual performance data above 95 percent and below 10 percent have been masked to protect student confidentiality. NE—state reported no enrollment; NP—data not provided; PNO—state reported program not offered; NA—data not applicable ADA—Americans with Disabilities Act

APPENDIX B. INDIVIDUAL STATE PERFORMANCE PROFILES, PY 2010–11 | 123
Florida Adult Level—continued
Core indicators T echnical skill
attainment Credential,
certificate, or degree Student retention
or transfer Student
placement Nontraditional participation
Nontraditional completion
Gender
Male
Female
57.42%
64.16%
78.52%
74.21%
49.46%
50.82%
85.21% 54.37% 13.48%
87.26% 54.97% <10.00%
Race/ethnicity
American Indian or Alaska Native
Asian
Black or African American
Hispanic or Latino Native Hawaiian or Other Pacific Islander White
Two or more races
59.84%
69.47%
52.33%
51.81%
50.00%
68.13%
57.23%
80.88%
71.53%
75.15%
75.67%
NE
77.04%
70.25%
50.00%
53.70%
42.92%
42.99%
75.00%
55.40%
45.71%
85.71% 60.18% 11.83%
88.90% 56.90% 14.43%
85.47% 51.72% 10.51%
87.85% 53.32% 10.17%
81.61% NE <10.00%
86.12% 56.73% 10.60%
88.30% 60.68% 12.62%

APPENDIX B. INDIVIDUAL STATE PERFORMANCE PROFILES, PY 2010–11 | 124
Georgia Secondary Level
Core indicators
Academic attainment: Reading/
language arts Academic attainment:
Mathematics T echnical skill
attainment School
completion Student
graduation rates Placement Nontraditional participation
Nontraditional completion
Measurement definitions
Percentage of CTE concentrators who have met the proficient or advanced level on the statewide high school reading and language arts assessment administered by the state under ESEA and who, in the reporting year, left secondary education.
Percentage of CTE concentrators who have met the proficient or advanced level on the statewide high school mathematics assessment administered by the state under ESEA and who, in the reporting year, left secondary education.
Percentage of CTE concentrators who passed technical skill assessments that are aligned with industry-recognized standards, if available and appropriate, during the reporting year.
Percentage of CTE Concentrators who earned a regular secondary school diploma or a General Education Development (GED), and earned proficient credential, certificate, or degree, in conjunction with secondary school diploma during the reporting year.
Percentage of CTE concentrators who, in the reporting year, were included as graduated in the state's computation of its graduation rate as described in ESEA .
Percentage of CTE Concentrators who left secondary education and were placed in postsecondary education or advanced training, in the military service or employment in the second quarter following the program year in which they left secondary education.
Percentage of CTE participants from underrepresented gender groups who participated in the program that leads to employment in nontraditional fields during the reporting year.
Percentage of CTE concentrators from underrepresented gender groups who completed a program that leads to employment in the nontraditional fields during the reporting year.
PY 2010–11 Performance levels 91.00% 79.00% 68.00% 88.00% 81.00% 41.00% 41.89% 21.25%
PY 2010–11 Results 88.28% 68.32% 36.46% >95.00% 90.32% 75.83% 17.82% 17.68%
Special populations
Individuals with disabilities (ADA )
Individuals with disabilities (ESEA /IDEA )
Economically disadvantaged students
Single parents
Displaced homemakers
Limited English proficient students
Migrant students
Students in nontraditional programs
NP
23.49%
59.99%
47.14%
NP
41.52%
56.14%
69.93%
NP
>95.00%
>95.00%
>95.00%
NP
>95.00%
>95.00%
>95.00%
NP
63.71%
72.17%
75.70%
72.41%
29.03%
47.17%
NE
NP
16.38%
18.85%
19.23%
NP
<10.00%
<10.00%
NP
NP NP NP NP
50.42% 18.13% 59.03% 16.31%
84.27% 26.74% 87.60% 18.37%
86.96% 32.85% 87.72% 18.34%
NP 50.00% NP NP
64.48% 20.17% 75.70% 16.03%
70.49% 33.33% 82.61% 14.97%
88.90% 38.42% 92.73% NP Tech prep NP NP NP NP NP NE NP NP NOTE: This table contains the results for students whom the state has identified as concentrators or participants (participants are only indicated by the state under the nontraditional participation core indicator) in career and technical education (CTE). See Appendix A, Table A-1 for the state’s definition of CTE concentrators and Table A-2 for the state’s definition of CTE participants. Definitions for special populations are provided in the Glossary of Terms in this report. Actual performance data above 95 percent and below 10 percent have been masked to protect student confidentiality. NE—state reported no enrollment; NP—data not provided; PNO—state reported program not offered; NA—data not applicable ADA—Americans with Disabilities Act; ESEA—Elementary and Secondary Education Act of 1965, as amended; IDEA—Individuals with Disabilities Education Act

APPENDIX B. INDIVIDUAL STATE PERFORMANCE PROFILES, PY 2010–11 | 125
Georgia Secondary Level—continued
Core indicators
Academic attainment: Reading/
language arts Academic attainment:
Mathematics T echnical skill
attainment School
completion Student
graduation rates Placement Nontraditional participation
Nontraditional completion
Gender
Male
Female
70.43%
66.30%
>95.00%
>95.00%
73.89%
77.67%
18.23%
17.19%
85.67% 30.89% 89.95% 17.11%
90.81% 42.14% 90.67% 18.57%
Race/ethnicity
American Indian or Alaska Native
Asian
Black or African American
Hispanic or Latino Native Hawaiian or Other Pacific Islander White
Two or more races
69.89%
22.22%
56.10%
66.16%
NP
78.23%
70.52%
>95.00%
>95.00%
>95.00%
>95.00%
>95.00%
>95.00%
>95.00%
NA*
NA*
NA*
NA*
NA*
NA*
NA*
18.92%
21.70%
19.58%
13.89%
NP
16.65%
20.20%
88.17% 40.00% 89.52% 16.44%
55.17% 40.30% >95.00% 22.82%
84.28% 26.28% 87.85% 20.04%
84.87% 28.30% 88.56% 16.01%
NP NE NP NP
91.85% 43.76% 92.32% 16.12%
91.65% 42.51% 92.57% 18.04% NA*—The state was unable to collect and report race/ethnicity data for this particular cell in accordance with the required 1997 race/ethnicity categories. While the state did report data using the 1977 race/ethnicity categories, we are only reporting data provided by the states according to the 1997 race/ethnicity categories described in the Department’s Oct. 19, 2007, memorandum titled “Final Guidance on Maintaining, Collecting, and Reporting Racial and Ethnic Data” (see 72 Federal Register 59266).

APPENDIX B. INDIVIDUAL STATE PERFORMANCE PROFILES, PY 2010–11 | 126
Georgia Postsecondary Level
Core indicators T echnical skill
attainment Credential,
certificate, or degree Student retention
or transfer Student
placement Nontraditional participation
Nontraditional completion
Measurement definitions
Percentage of students from the denominator for whom at least 75 percent of their technical course grades were A, B, C, or S in the fiscal year.
Percentage of students from the denominator who graduated.
Percentage of students from the denominator who were enrolled in postsecondary education during the fiscal year.
Percentage of students from the denominator who were placed in employment within two months of the end of the fiscal year.
Percentage of students from the denominator of underrepresented gender for their program.
Percentage of graduates from the denominator of underrepresented gender for their program.
PY 2010–11 Performance levels 86.09% 49.00% 66.50% 98.15% 17.50% 17.30%
PY 2010–11 Results 80.59% 46.88% 68.25% >95.00% 18.28% 16.47%
Special populations
Individuals with disabilities (ADA )
Economically disadvantaged students
Single parents
Displaced homemakers
Limited English proficient students
Students in nontraditional programs
48.07%
43.23%
42.11%
46.77%
48.23%
47.62%
>95.00%
>95.00%
>95.00%
>95.00%
94.94%
>95.00%
15.80%
15.58%
16.99%
16.24%
16.72%
NP
80.56% 73.61% 19.43%
77.27% 72.21% 18.65%
76.86% 70.81% 19.45%
82.88% 67.29% 17.97%
85.26% 86.14% 19.05%
77.81% 66.78% NP
T ech prep NP NE NP NP NP NP NOTE: This table contains the results for students whom the state has identified as concentrators or participants (participants are only indicated by the state under the nontraditional participation core indicator) in career and technical education (CTE). See Appendix A, Table A-1 for the state’s definition of CTE concentrators and Table A-2 for the state’s definition of CTE participants. Definitions for special populations are provided in the Glossary of Terms in this report. Actual performance data above 95 percent and below 10 percent have been masked to protect student confidentiality. NE—state reported no enrollment; NP—data not provided; PNO—state reported program not offered; NA—data not applicable ADA—Americans with Disabilities Act

APPENDIX B. INDIVIDUAL STATE PERFORMANCE PROFILES, PY 2010–11 | 127
Georgia Postsecondary Level—continued
Core indicators T echnical skill
attainment Credential,
certificate, or degree Student retention
or transfer Student
placement Nontraditional participation
Nontraditional completion
Gender
Male
Female
49.81%
44.99%
>95.00%
>95.00%
14.27%
18.10%
81.14% 62.90% 16.26%
80.25% 72.60% 19.56%
Race/ethnicity
American Indian or Alaska Native
Asian
Black or African American
Hispanic or Latino Native Hawaiian or Other Pacific Islander White
Two or more races
44.21%
48.15%
42.64%
50.13%
NE
50.39%
NE
95.00%
94.81%
>95.00%
>95.00%
NE
>95.00%
NE
20.00%
14.81%
18.51%
16.96%
NE
14.76%
NE
83.15% 63.89% 19.95%
86.78% 71.43% 19.66%
73.76% 66.85% 20.28%
84.10% 80.32% 19.74%
NE NE NE
85.78% 69.03% 16.21%
NE NE NE

APPENDIX B. INDIVIDUAL STATE PERFORMANCE PROFILES, PY 2010–11 | 128
Guam Secondary Level
Core indicators
Academic attainment: Reading/
language arts Academic attainment:
Mathematics T echnical skill
attainment School
completion Student
graduation rates Placement Nontraditional participation
Nontraditional completion
Measurement definitions
Percentage of CTE concentrators who have met the proficient or advanced level on the grade appropriate high school reading and language arts assessment administered by the Guam Department of Education and who, in the reporting year, left secondary education.
Percentage of CTE concentrators who have met the proficient or advanced level on the statewide high school mathematics assessment administered by the state under ESEA and who, in the reporting year, left secondary education.
Percentage of CTE concentrators who passed technical skill assessments that are aligned with industry-recognized standards, if available and appropriate, during the reporting year.
Percentage of CTE concentrators who left secondary education and who earned a secondary school diploma, earned a General Education Development (GED) credential as a state-recognized equivalent to a regular high school diploma, (if offered by the state) or other state-recognized equivalent (including recognized alternative standards for individuals with disabilities), or earned a proficiency credential, certificate, or degree, in conjunction with a secondary school diploma (if offered by the state) during the reporting year.
Percentage of CTE concentrators who, in the reporting year, were included as graduated in the state's computation of its graduation rate as described in ESEA .
Percentage of CTE concentrators who left secondary education and were placed in postsecondary education or advanced training, in the military service, or employment in the second quarter following the program year in which they left secondary education (i.e., concentrators who graduated by June 30, 2009 would be assessed between July, 2009 and Dec. 31, 2010).
Percentage of CTE concentrators from underrepresented gender groups who participated in a program that leads to employment in nontraditional fields, during the reporting year.
Percentage of CTE concentrators from underrepresented gender groups who completed a program that leads to employment in nontraditional fields, during the reporting year.
PY 2010–11 Performance levels 70.00% 65.00% 75.11% 68.11% 45.00% 84.44% 15.00% 9.00%
PY 2010–11 Results 74.52% 75.62% 91.54% 76.71% 82.64% 90.10% 22.40% 22.99%
Special populations
Individuals with disabilities (ADA )
Individuals with disabilities (ESEA /IDEA )
Economically disadvantaged students
Single parents
Displaced homemakers
Limited English proficient students
Migrant students
Students in nontraditional programs
NP
76.92%
65.67%
NE
NE
74.85%
NE
<10.00%
NP
71.43%
69.84%
NE
NE
79.48%
NE
<10.00%
NP
NE
NE
NE
NE
NE
NE
<10.00%
NP
14.29%
25.33%
NE
NE
22.86%
NE
NP
NP NP NP NP
59.38% 83.33% 71.79% 15.17%
63.64% 90.11% 75.00% 22.03%
NE NE NE NE
NE NE NE NE
76.49% 91.88% 25.85% 22.56%
NE NE NE NE
<10.00% <10.00% <10.00% NP T ech prep NE NE NE NE NE NE NE NE NOTE: This table contains the results for students whom the state has identified as concentrators or participants (participants are only indicated by the state under the nontraditional participation core indicator) in career and technical education (CTE). See Appendix A, Table A-1 for the state’s definition of CTE concentrators and Table A-2 for the state’s definition of CTE participants. Definitions for special populations are provided in the Glossary of Terms in this report. Actual performance data above 95 percent and below 10 percent have been masked to protect student confidentiality. NE—state reported no enrollment; NP—data not provided; PNO—state reported program not offered; NA—data not applicable ADA—Americans with Disabilities Act; ESEA—Elementary and Secondary Education Act of 1965, as amended; IDEA—Individuals with Disabilities Education Act

APPENDIX B. INDIVIDUAL STATE PERFORMANCE PROFILES, PY 2010–11 | 129
Guam Secondary Level—continued
Core indicators
Academic attainment: Reading/
language arts Academic attainment:
Mathematics T echnical skill
attainment School
completion Student
graduation rates Placement Nontraditional participation
Nontraditional completion
Gender
Male
Female
75.54%
75.73%
74.29%
79.82%
84.62%
>95.00%
29.35%
15.23%
72.77% 90.53% 81.14% 27.61%
76.73% 92.63% 84.53% 16.65%
Race/ethnicity
American Indian or Alaska Native
Asian
Black or African American
Hispanic or Latino Native Hawaiian or Other Pacific Islander White
Two or more races
NE
66.67%
NE
NE
75.77%
80.00%
71.43%
NE
57.14%
>95.00%
NE
76.86%
75.00%
81.82%
NE
>95.00%
NE
NE
89.90%
NE
NE
NE
<10.00%
<10.00%
NE
23.27%
25.00%
25.00%
NE NE NE NE
66.67% 91.30% 80.00% 25.00%
>95.00% >95.00% >95.00% 33.33%
NE 66.67% NE 33.33%
74.78% 91.45% 82.73% 22.25%
>95.00% >95.00% 66.67% 29.17%
55.56% 93.10% 88.89% 22.58%

APPENDIX B. INDIVIDUAL STATE PERFORMANCE PROFILES, PY 2010–11 | 130
Guam Postsecondary Level
Core indicators T echnical skill
attainment Credential,
certificate, or degree Student retention
or transfer Student
placement Nontraditional participation
Nontraditional completion
Measurement definitions
Percentage of CTE concentrators who passed technical skill assessments that are aligned with industry-recognized standards, if available and appropriate, during the reporting year.
Percentage of CTE concentrators who received an industry-recognized credential, certificate, or degree during the reporting year.
Percentage of CTE concentrators who remained enrolled in their original postsecondary institution or transferred to another two- or four-year postsecondary institution during the reporting year and were enrolled in postsecondary education in the fall of the previous reporting year.
Percentage of CTE concentrators who were placed or retained in employment, or placed in military service or apprenticeship programs in the second quarter following the program year in which they left postsecondary education (i.e., unduplicated placement status for CTE concentrators who graduated by June 30, 2009 would be assessed between July, 2009 and Dec. 31, 2010).
Percentage of CTE concentrators from underrepresented gender groups who participated in a program that leads to employment in nontraditional fields, during the reporting year.
Percentage of CTE concentrators from underrepresented gender groups who completed a program that leads to employment in nontraditional fields, during the reporting year.
PY 2010–11 Performance levels 90.67% 33.73% 58.78% 82.00% 12.00% 9.50%
PY 2010–11 Results <10.00% 33.87% 63.99% 68.09% 26.65% 18.39%
Special populations
Individuals with disabilities (ADA )
Economically disadvantaged students
Single parents
Displaced homemakers
Limited English proficient students
Students in nontraditional programs
<10.00%
<10.00%
22.22%
<10.00%
14.29%
29.06%
NE
NE
NE
NE
NE
NE
NE
NE
<10.00%
NE
NE
NP
NE <10.00% 33.33%
<10.00% 69.72% 29.79%
<10.00% 66.13% 22.22%
NE >95.00% <10.00%
<10.00% 73.08% 23.15%
<10.00% 59.19% NP
T ech prep NE NE NE NE NE NE NOTE: This table contains the results for students whom the state has identified as concentrators or participants (participants are only indicated by the state under the nontraditional participation core indicator) in career and technical education (CTE). See Appendix A, Table A-1 for the state’s definition of CTE concentrators and Table A-2 for the state’s definition of CTE participants. Definitions for special populations are provided in the Glossary of Terms in this report. Actual performance data above 95 percent and below 10 percent have been masked to protect student confidentiality. NE—state reported no enrollment; NP—data not provided; PNO—state reported program not offered; NA—data not applicable ADA—Americans with Disabilities Act
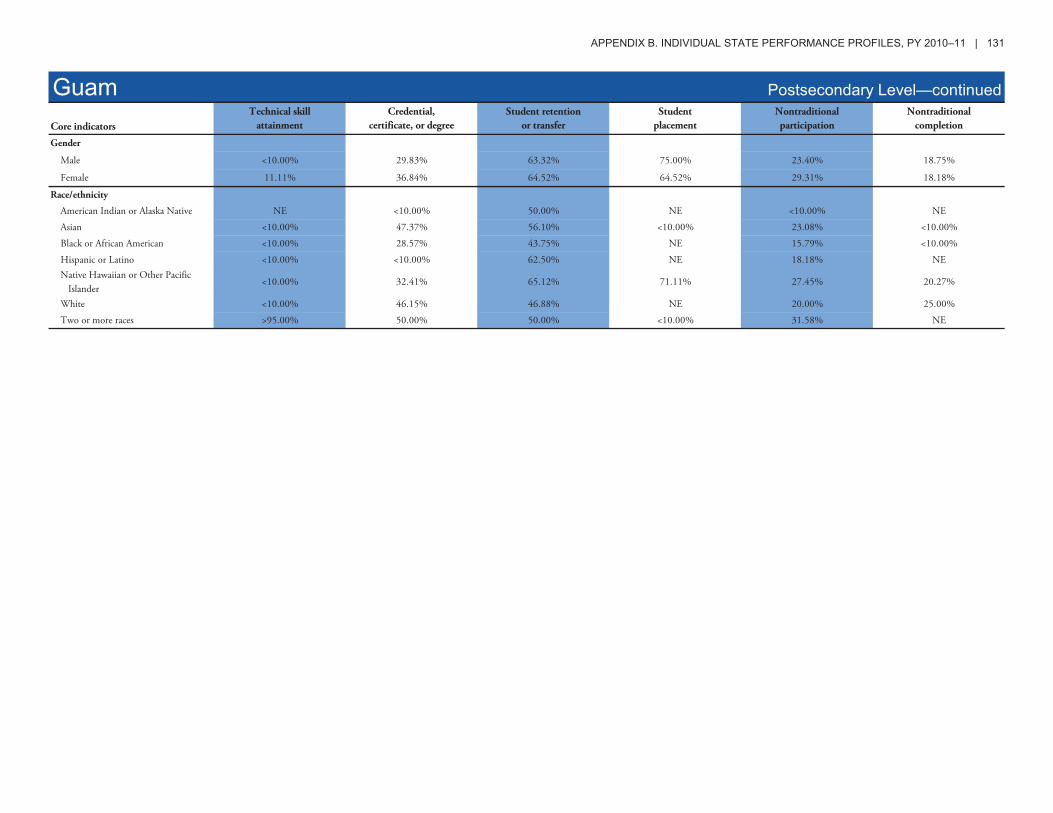
APPENDIX B. INDIVIDUAL STATE PERFORMANCE PROFILES, PY 2010–11 | 131
Guam Postsecondary Level—continued
Core indicators T echnical skill
attainment Credential,
certificate, or degree Student retention
or transfer Student
placement Nontraditional participation
Nontraditional completion
Gender
Male
Female
29.83%
36.84%
75.00%
64.52%
18.75%
18.18%
<10.00% 63.32% 23.40%
11.11% 64.52% 29.31%
Race/ethnicity
American Indian or Alaska Native
Asian
Black or African American
Hispanic or Latino Native Hawaiian or Other Pacific Islander White
Two or more races
<10.00%
47.37%
28.57%
<10.00%
32.41%
46.15%
50.00%
NE
<10.00%
NE
NE
71.11%
NE
<10.00%
NE
<10.00%
<10.00%
NE
20.27%
25.00%
NE
NE 50.00% <10.00%
<10.00% 56.10% 23.08%
<10.00% 43.75% 15.79%
<10.00% 62.50% 18.18%
<10.00% 65.12% 27.45%
<10.00% 46.88% 20.00%
>95.00% 50.00% 31.58%

APPENDIX B. INDIVIDUAL STATE PERFORMANCE PROFILES, PY 2010–11 | 132
Hawaii Secondary Level
Core indicators
Academic attainment: Reading/
language arts Academic attainment:
Mathematics T echnical skill
attainment School
completion Student
graduation rates Placement Nontraditional participation
Nontraditional completion
Measurement definitions
Percentage of CTE concentrators who have met the proficient or advanced level on the statewide high school reading and language arts assessment administered by the state under ESEA and who, in the reporting year, left secondary education.
Percentage of CTE concentrators who have met the proficient or advanced level on the statewide high school mathematics assessment administered by the state under ESEA and who, in the reporting year, left secondary education.
Percentage of CTE concentrators who passed technical skill assessments that are aligned with industry-recognized standards, if available and appropriate during the reporting year.
Percentage of CTE concentrators who earned a regular secondary school diploma, earned a General Education Development (GED) credential as a state-recognized equivalent, or earned proficiency credential, certificate, or degree, in conjunction with a secondary school diploma during the reporting year.
Percentage of CTE concentrators who, in the reporting year, were included as graduated in the state's computation of its graduation rate as described in ESEA .
Percentage of CTE concentrators who left secondary education during the reporting year and responded to the placement survey who were placed in postsecondary education or advanced training, in the military service, or employment in the second quarter following the program year in which they left secondary education.
Percentage of participants from underrepresented gender groups who participated in a program that leads to employment in nontraditional fields during the reporting year.
Percentage of CTE concentrators from underrepresented gender groups who completed a program that leads to employment in nontraditional fields during the reporting year.
PY 2010–11 Performance levels 45.25% 30.00% 30.00% 90.00% 76.00% 82.20% 29.00% 29.25%
PY 2010–11 Results 81.50% 38.32% 67.74% 89.88% >95.00% >95.00% 32.88% 31.28%
Special populations
Individuals with disabilities (ADA )
Individuals with disabilities (ESEA /IDEA )
Economically disadvantaged students
Single parents
Displaced homemakers
Limited English proficient students
Migrant students
Students in nontraditional programs
NP
<10.00%
28.70%
NE
NP
<10.00%
NE
38.77%
NP
87.43%
94.02%
NE
NP
85.71%
NE
94.33%
NP
>95.00%
>95.00%
NP
NP
>95.00%
NP
>95.00%
NP
26.67%
31.23%
NE
NP
19.48%
NE
NP
NP NP NP NP
31.08% NE >95.00% 19.42%
74.21% 50.00% >95.00% 32.94%
NE NE NE NE
NP NP NP NP
39.51% NE >95.00% 24.89%
NE NE NE NE
85.09% 66.67% >95.00% NP Tech prep 81.50% 38.32% 67.74% 89.88% >95.00% >95.00% 32.88% 31.28% NOTE: This table contains the results for students whom the state has identified as concentrators or participants (participants are only indicated by the state under the nontraditional participation core indicator) in career and technical education (CTE). See Appendix A, Table A-1 for the state’s definition of CTE concentrators and Table A-2 for the state’s definition of CTE participants. Definitions for special populations are provided in the Glossary of Terms in this report. Actual performance data above 95 percent and below 10 percent have been masked to protect student confidentiality. NE—state reported no enrollment; NP—data not provided; PNO—state reported program not offered; NA—data not applicable ADA—Americans with Disabilities Act; ESEA—Elementary and Secondary Education Act of 1965, as amended; IDEA—Individuals with Disabilities Education Act

APPENDIX B. INDIVIDUAL STATE PERFORMANCE PROFILES, PY 2010–11 | 133
Hawaii Secondary Level—continued
Core indicators
Academic attainment: Reading/
language arts Academic attainment:
Mathematics T echnical skill
attainment School
completion Student
graduation rates Placement Nontraditional participation
Nontraditional completion
Gender
Male
Female
36.87%
40.10%
87.51%
92.97%
>95.00%
>95.00%
24.09%
42.63%
75.34% 84.62% >95.00% 12.04%
89.10% 55.56% >95.00% 71.17%
Race/ethnicity
American Indian or Alaska Native
Asian
Black or African American
Hispanic or Latino Native Hawaiian or Other Pacific Islander White
Two or more races
41.67%
43.35%
45.83%
37.31%
25.68%
47.65%
44.04%
85.71%
94.06%
82.76%
89.47%
86.25%
89.26%
81.75%
>95.00%
>95.00%
>95.00%
>95.00%
>95.00%
>95.00%
>95.00%
54.55%
32.72%
40.00%
28.07%
29.41%
30.49%
29.55%
83.33% >95.00% >95.00% 28.89%
86.40% 63.16% >95.00% 32.56%
87.50% NE >95.00% 33.52%
74.63% NE >95.00% 35.97%
72.56% 66.67% >95.00% 33.51%
86.64% 75.00% >95.00% 31.95%
80.73% 75.00% >95.00% 31.91%

APPENDIX B. INDIVIDUAL STATE PERFORMANCE PROFILES, PY 2010–11 | 134
Hawaii Postsecondary Level
Core indicators T echnical skill
attainment Credential,
certificate, or degree Student retention
or transfer Student
placement Nontraditional participation
Nontraditional completion
Measurement definitions
Percentage of concentrators who have a cumulative GPA greater than or equal to 2.00 in CTE courses and who have stopped program participation in the year reported.
Percentage of concentrators who received a degree or certificate in a CTE program and who have stopped program participation in the year reported.
Percentage of concentrators in the year reported who have not completed a program and who continue postsecondary enrollment or who have transferred to a baccalaureate degree program.
Percentage of concentrators in the year reported (previous Perkins year) who have stopped program participation and who are placed or retained in employment, military service, or an apprenticeship program within Unemployment Insurance (UI) quarter following program completion.
Percentage of participants from underrepresented groups who participated in a program that leads to employment in nontraditional fields during the reporting year.
Percentage of concentrators from underrepresented gender groups who completed a program that leads to employment in nontraditional fields during the reporting year.
PY 2010–11 Performance levels 90.10% 45.00% 56.00% 51.00% 16.25% 15.15%
PY 2010–11 Results 91.04% 49.13% 75.81% 65.71% 17.47% 15.98%
Special populations
Individuals with disabilities (ADA )
Economically disadvantaged students
Single parents
Displaced homemakers
Limited English proficient students
Students in nontraditional programs
44.66%
47.74%
48.65%
33.33%
55.47%
46.80%
47.50%
62.38%
62.50%
61.90%
34.85%
61.46%
28.30%
15.74%
10.67%
<10.00%
<10.00%
NP
89.32% 69.75% 22.22%
89.55% 74.70% 18.73%
90.99% 69.70% 13.40%
91.67% 61.40% 12.70%
>95.00% 71.43% 15.23%
88.66% 76.77% NP
T ech prep PNO PNO PNO PNO PNO PNO NOTE: This table contains the results for students whom the state has identified as concentrators or participants (participants are only indicated by the state under the nontraditional participation core indicator) in career and technical education (CTE). See Appendix A, Table A-1 for the state’s definition of CTE concentrators and Table A-2 for the state’s definition of CTE participants. Definitions for special populations are provided in the Glossary of Terms in this report. Actual performance data above 95 percent and below 10 percent have been masked to protect student confidentiality. NE—state reported no enrollment; NP—data not provided; PNO—state reported program not offered; NA—data not applicable ADA—Americans with Disabilities Act
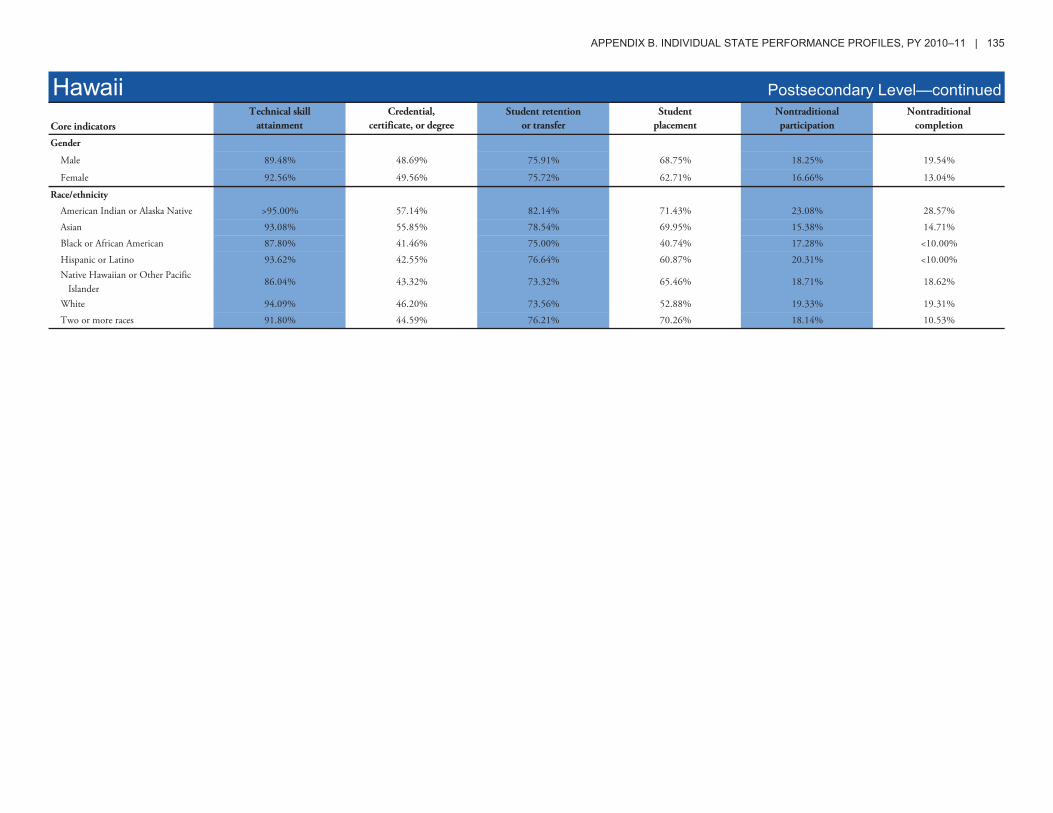
APPENDIX B. INDIVIDUAL STATE PERFORMANCE PROFILES, PY 2010–11 | 135
Hawaii Postsecondary Level—continued
Core indicators T echnical skill
attainment Credential,
certificate, or degree Student retention
or transfer Student
placement Nontraditional participation
Nontraditional completion
Gender
Male
Female
48.69%
49.56%
68.75%
62.71%
19.54%
13.04%
89.48% 75.91% 18.25%
92.56% 75.72% 16.66%
Race/ethnicity
American Indian or Alaska Native
Asian
Black or African American
Hispanic or Latino Native Hawaiian or Other Pacific Islander White
Two or more races
57.14%
55.85%
41.46%
42.55%
43.32%
46.20%
44.59%
71.43%
69.95%
40.74%
60.87%
65.46%
52.88%
70.26%
28.57%
14.71%
<10.00%
<10.00%
18.62%
19.31%
10.53%
>95.00% 82.14% 23.08%
93.08% 78.54% 15.38%
87.80% 75.00% 17.28%
93.62% 76.64% 20.31%
86.04% 73.32% 18.71%
94.09% 73.56% 19.33%
91.80% 76.21% 18.14%

APPENDIX B. INDIVIDUAL STATE PERFORMANCE PROFILES, PY 2010–11 | 136
Idaho Secondary Level
Core indicators
Academic attainment: Reading/
language arts Academic attainment:
Mathematics T echnical skill
attainment School
completion Student
graduation rates Placement Nontraditional participation
Nontraditional completion
Measurement definitions
Percentage of CTE concentrators who are seniors and scored proficient or above on the Idaho Standards Achievement Tests-10 (ISAT 10) in reading, or achieved proficiency through a state-approved alternative route to graduation.
Percentage of CTE concentrators who are seniors and scored proficient or above on the ISAT 10 in mathematics, or achieved proficiency through a state-approved alternative route to graduation.
Percentage of CTE concentrators who passed a state-approved technical skill assessment during the reporting year.
Percentage of CTE concentrators who earned a high school diploma during the reporting year.
Percentage of CTE concentrators who earned a high school diploma during the reporting year.
Percentage of CTE concentrators who achieved a positive placement or transition in the second quarter after leaving high school.
Percentage of CTE participants who enroll in a state-approved CTE program that is nontraditional to their gender.
Percentage of students who are CTE concentrators in programs nontraditional to their gender.
PY 2010–11 Performance levels 85.00% 80.00% 71.90% 87.38% 90.99% 93.38% 20.00% 21.00%
PY 2010–11 Results >95.00% 94.01% 68.70% >95.00% >95.00% 93.29% 39.03% 34.03%
Special populations
Individuals with disabilities (ADA )
Individuals with disabilities (ESEA /IDEA )
Economically disadvantaged students
Single parents
Displaced homemakers
Limited English proficient students
Migrant students
Students in nontraditional programs
NP
79.55%
91.86%
82.52%
NP
84.88%
64.29%
>95.00%
NP
>95.00%
>95.00%
>95.00%
NP
>95.00%
>95.00%
>95.00%
NP
85.62%
89.87%
85.96%
NE
86.34%
77.78%
94.04%
NP
44.16%
39.40%
30.16%
NP
36.07%
16.67%
NP
NP NP NP NP
80.39% 58.49% >95.00% 42.76%
>95.00% 64.74% >95.00% 43.29%
>95.00% 56.06% >95.00% 33.06%
NP NP NP NP
86.87% 57.50% >95.00% 42.70%
66.67% 37.50% >95.00% 45.00%
>95.00% 71.91% >95.00% NP T ech prep NP NP NP NP NP NP NP NP NOTE: This table contains the results for students whom the state has identified as concentrators or participants (participants are only indicated by the state under the nontraditional participation core indicator) in career and technical education (CTE). See Appendix A, Table A-1 for the state’s definition of CTE concentrators and Table A-2 for the state’s definition of CTE participants. Definitions for special populations are provided in the Glossary of Terms in this report. Actual performance data above 95 percent and below 10 percent have been masked to protect student confidentiality. NE—state reported no enrollment; NP—data not provided; PNO—state reported program not offered; NA—data not applicable ADA—Americans with Disabilities Act; ESEA—Elementary and Secondary Education Act of 1965, as amended; IDEA—Individuals with Disabilities Education Act

APPENDIX B. INDIVIDUAL STATE PERFORMANCE PROFILES, PY 2010–11 | 137
Idaho Secondary Level—continued
Core indicators
Academic attainment: Reading/
language arts Academic attainment:
Mathematics T echnical skill
attainment School
completion Student
graduation rates Placement Nontraditional participation
Nontraditional completion
Gender
Male
Female
94.48%
93.51%
>95.00%
>95.00%
92.11%
94.51%
41.13%
25.52%
>95.00% 64.04% >95.00% 47.47%
>95.00% 73.71% >95.00% 28.01%
Race/ethnicity
American Indian or Alaska Native
Asian
Black or African American
Hispanic or Latino Native Hawaiian or Other Pacific Islander White
Two or more races
92.92%
>95.00%
89.19%
89.01%
91.89%
94.87%
90.91%
93.00%
>95.00%
>95.00%
>95.00%
>95.00%
>95.00%
91.11%
90.70%
91.23%
87.88%
88.89%
88.89%
94.14%
91.67%
25.71%
35.38%
27.27%
35.37%
22.73%
34.01%
26.67%
92.04% 64.00% 92.93% 37.23%
>95.00% 68.42% >95.00% 43.57%
>95.00% 85.19% >95.00% 42.41%
94.42% 60.95% >95.00% 37.33%
>95.00% 76.19% >95.00% 42.62%
>95.00% 69.81% >95.00% 39.30%
93.18% 71.43% >95.00% 21.51%

APPENDIX B. INDIVIDUAL STATE PERFORMANCE PROFILES, PY 2010–11 | 138
Idaho Postsecondary Level
Core indicators T echnical skill
attainment Credential,
certificate, or degree Student retention
or transfer Student
placement Nontraditional participation
Nontraditional completion
Measurement definitions
Percentage of CTE concentrators who passed a state approved technical skill assessment during the reporting year.
Percentage of CTE concentrators who earned an industry-based credential, a certificate, or a degree during the reporting year.
Percentage of CTE concentrators who remained enrolled in their original institution, or transferred to another two- or four-year institution, and who were enrolled in the fall of the previous year.
Percentage of CTE concentrators who achieved a positive placement or transition in the second quarter after leaving postsecondary education.
Percentage of CTE participants who enroll in a state-approved CTE program that is nontraditional to their gender.
Percentage of CTE students who are CTE concentrators in programs nontraditional to their gender.
PY 2010–11 Performance levels 75.86% 72.40% 70.00% 95.00% 14.03% 13.86%
PY 2010–11 Results 92.69% 72.31% 74.04% 91.14% 16.40% 12.74%
Special populations
Individuals with disabilities (ADA )
Economically disadvantaged students
Single parents
Displaced homemakers
Limited English proficient students
Students in nontraditional programs
61.84%
69.99%
71.70%
NE
68.75%
76.36%
80.00%
88.59%
89.36%
NE
85.71%
88.11%
18.00%
14.57%
10.53%
NE
40.00%
NP
81.82% 65.57% 13.27%
92.28% 77.06% 14.91%
89.16% 77.06% <10.00%
NE NE NE
84.62% 60.00% 15.69%
91.01% 71.68% NP
T ech prep NP NP NP NE NP NP NOTE: This table contains the results for students whom the state has identified as concentrators or participants (participants are only indicated by the state under the nontraditional participation core indicator) in career and technical education (CTE). See Appendix A, Table A-1 for the state’s definition of CTE concentrators and Table A-2 for the state’s definition of CTE participants. Definitions for special populations are provided in the Glossary of Terms in this report. Actual performance data above 95 percent and below 10 percent have been masked to protect student confidentiality. NE—state reported no enrollment; NP—data not provided; PNO—state reported program not offered; NA—data not applicable ADA—Americans with Disabilities Act

APPENDIX B. INDIVIDUAL STATE PERFORMANCE PROFILES, PY 2010–11 | 139
Idaho Postsecondary Level—continued
Core indicators T echnical skill
attainment Credential,
certificate, or degree Student retention
or transfer Student
placement Nontraditional participation
Nontraditional completion
Gender
Male
Female
69.88%
75.32%
91.93%
90.18%
<10.00%
19.85%
92.32% 74.66% 13.79%
93.21% 73.27% 19.32%
Race/ethnicity
American Indian or Alaska Native
Asian
Black or African American
Hispanic or Latino Native Hawaiian or Other Pacific Islander White
Two or more races
72.22%
80.77%
66.67%
72.79%
71.43%
72.86%
46.15%
90.00%
85.71%
85.71%
87.50%
>95.00%
91.96%
>95.00%
<10.00%
23.53%
20.00%
12.50%
50.00%
12.46%
33.33%
87.50% 77.59% 19.13%
94.74% 79.17% 28.17%
90.91% 76.92% 24.24%
90.00% 73.68% 12.40%
50.00% >95.00% 46.15%
93.65% 75.69% 15.67%
>95.00% 90.00% 19.44%

APPENDIX B. INDIVIDUAL STATE PERFORMANCE PROFILES, PY 2010–11 | 140
Illinois Secondary Level
Core indicators
Academic attainment: Reading/
language arts Academic attainment:
Mathematics T echnical skill
attainment School
completion Student
graduation rates Placement Nontraditional participation
Nontraditional completion
Measurement definitions
Percentage of CTE concentrators who have met the proficient or advanced level on the statewide high school reading and language arts assessment administered by the state under ESEA and who, in the reporting year, left secondary education.
Percentage of CTE concentrators who have met the proficient or advanced level on the statewide high school mathematics assessment administered by the state under ESEA and who, in the reporting year, left secondary education.
Percentage of CTE concentrators who passed technical skill assessments that are aligned with industry-recognized standards, if available and appropriate, during the reporting year.
Percentage of CTE concentrators who earned a regular secondary school diploma, earned a General Education Development (GED) credential as a state-recognized equivalent to a regular high school diploma (if offered by the state) or other state-recognized equivalent (including recognized alternative standards for individuals with disabilities), or earned a proficiency credential, certificate, or degree, in conjunction with a secondary school diploma (if offered by the state) during the reporting year.
Percentage of CTE concentrators who earned a regular secondary school diploma, earned a GED credential as a state-recognized equivalent to a regular high school diploma (if offered by the state) or other state-recognized equivalent (including recognized alternative standards for individuals with disabilities), or earned a proficiency credential, certificate, or degree, in conjunction with a secondary school diploma (if offered by the state) during the reporting year.
Percentage of CTE concentrators who left secondary education and were placed in postsecondary education or advanced training, in the military service, or employment in the second quarter following the program year in which they left secondary education (i.e., unduplicated placement status for CTE concentrators who graduated by June 30, 2007 would be assessed between Oct. 1, 2007 and Dec. 31, 2007).
Percentage of CTE participants from underrepresented gender groups who participated in a program that leads to employment in nontraditional fields during the reporting year.
Percentage of CTE concentrators from underrepresented gender groups who completed a program that leads to employment in nontraditional fields during the reporting year.
PY 2010–11 Performance levels 40.41% 40.10% 41.00% 95.00% 95.00% 73.00% 16.00% 19.00%
PY 2010–11 Results 48.13% 46.74% 63.51% 91.46% 91.46% 73.51% 35.99% 37.09%
Special populations
Individuals with disabilities (ADA )
Individuals with disabilities (ESEA /IDEA )
Economically disadvantaged students
Single parents
Displaced homemakers
Limited English proficient students
Migrant students
Students in nontraditional programs
NP
18.48%
28.34%
32.26%
64.29%
23.24%
71.43%
44.78%
NP
80.17%
87.89%
94.44%
85.71%
82.77%
>95.00%
92.22%
NP
65.98%
66.12%
70.00%
50.00%
74.24%
NE
72.20%
NP
32.91%
37.34%
45.83%
36.36%
39.88%
33.33%
NP
NP NP NP NP
20.82% 18.69% 80.17% 36.12%
31.99% 49.97% 87.89% 35.87%
36.07% 42.86% 94.44% 37.11%
57.14% 52.38% 85.71% 39.56%
<10.00% 23.93% 82.77% 32.81%
57.14% 54.55% >95.00% 28.57%
46.74% 64.15% 92.22% NP T ech prep 48.13% 46.74% 63.51% 91.46% 91.46% 73.51% 35.99% 37.09% NOTE: This table contains the results for students whom the state has identified as concentrators or participants (participants are only indicated by the state under the nontraditional participation core indicator) in career and technical education (CTE). See Appendix A, Table A-1 for the state’s definition of CTE concentrators and Table A-2 for the state’s definition of CTE participants. Definitions for special populations are provided in the Glossary of Terms in this report. Actual performance data above 95 percent and below 10 percent have been masked to protect student confidentiality. NE—state reported no enrollment; NP—data not provided; PNO—state reported program not offered; NA—data not applicable ADA—Americans with Disabilities Act; ESEA—Elementary and Secondary Education Act of 1965, as amended; IDEA—Individuals with Disabilities Education Act

APPENDIX B. INDIVIDUAL STATE PERFORMANCE PROFILES, PY 2010–11 | 141
Illinois Secondary Level—continued
Core indicators
Academic attainment: Reading/
language arts Academic attainment:
Mathematics T echnical skill
attainment School
completion Student
graduation rates Placement Nontraditional participation
Nontraditional completion
Gender
Male
Female
50.69%
43.16%
89.78%
92.89%
72.05%
75.34%
40.92%
34.40%
46.35% 62.95% 89.78% 41.42%
49.75% 64.02% 92.89% 29.60%
Race/ethnicity
American Indian or Alaska Native
Asian
Black or African American
Hispanic or Latino Native Hawaiian or Other Pacific Islander White
Two or more races
42.31%
70.32%
19.27%
32.17%
57.89%
54.75%
51.09%
84.52%
>95.00%
87.50%
87.83%
95.00%
93.92%
91.64%
80.00%
80.09%
62.11%
73.67%
NP
76.06%
71.43%
34.78%
40.46%
39.50%
37.06%
64.29%
35.84%
45.92%
48.72% 53.77% 84.52% 34.90%
53.05% 75.02% >95.00% 35.90%
27.03% 42.45% 87.50% 39.02%
31.37% 52.67% 87.83% 34.97%
57.89% 63.64% 95.00% 35.98%
56.01% 70.58% 93.92% 35.59%
53.59% 63.16% 91.64% 36.82%

APPENDIX B. INDIVIDUAL STATE PERFORMANCE PROFILES, PY 2010–11 | 142
Illinois Postsecondary Level
Core indicators T echnical skill
attainment Credential,
certificate, or degree Student retention
or transfer Student
placement Nontraditional participation
Nontraditional completion
Measurement definitions
Percentage of CTE concentrators who completed a degree or occupational certificate or who are still enrolled in the institution or have transferred within four years of enrollment.
Percentage of CTE concentrators who received an industry-recognized credential, a certificate, or a degree during the reporting year.
Percentage of CTE concentrators who remained enrolled in their original postsecondary institution or transferred to another two- or four-year postsecondary institution during the reporting year and who were enrolled in postsecondary education in the fall of the previous reporting year.
Percentage of CTE concentrators who were placed or retained in employment, or placed in military service or apprenticeship programs in the second quarter following the program year in which they left postsecondary education (i.e., unduplicated placement status for CTE concentrators who graduated by June 30, 2007 would be assessed between Oct. 1, 2007 and Dec. 31, 2007).
Percentage of CTE participants from underrepresented gender groups who participated in a program that leads to employment in nontraditional fields during the reporting year.
Percentage of CTE concentrators from underrepresented gender groups who completed a program that leads to employment in nontraditional fields during the reporting year.
PY 2010–11 Performance levels 70.26% 52.97% 37.10% 67.00% 20.64% 15.06%
PY 2010–11 Results 78.75% 62.34% 46.81% 65.81% 19.29% 15.47%
Special populations
Individuals with disabilities (ADA )
Economically disadvantaged students
Single parents
Displaced homemakers
Limited English proficient students
Students in nontraditional programs
57.35%
61.36%
62.45%
67.69%
55.28%
59.51%
58.34%
65.57%
67.37%
57.95%
56.72%
63.56%
14.98%
14.37%
13.17%
<10.00%
20.61%
NP
74.37% 53.08% 18.65%
78.40% 47.21% 18.58%
78.30% 44.61% 15.27%
79.91% 50.00% 13.13%
78.47% 50.88% 24.47%
76.51% 49.27% NP
T ech prep 71.03% 45.23% 54.99% 84.77% 16.32% <10.00% NOTE: This table contains the results for students whom the state has identified as concentrators or participants (participants are only indicated by the state under the nontraditional participation core indicator) in career and technical education (CTE). See Appendix A, Table A-1 for the state’s definition of CTE concentrators and Table A-2 for the state’s definition of CTE participants. Definitions for special populations are provided in the Glossary of Terms in this report. Actual performance data above 95 percent and below 10 percent have been masked to protect student confidentiality. NE—state reported no enrollment; NP—data not provided; PNO—state reported program not offered; NA—data not applicable ADA—Americans with Disabilities Act

APPENDIX B. INDIVIDUAL STATE PERFORMANCE PROFILES, PY 2010–11 | 143
Illinois Postsecondary Level—continued
Core indicators T echnical skill
attainment Credential,
certificate, or degree Student retention
or transfer Student
placement Nontraditional participation
Nontraditional completion
Gender
Male
Female
56.38%
66.44%
58.61%
71.13%
21.49%
11.30%
73.65% 45.75% 13.58%
82.27% 47.63% 25.32%
Race/ethnicity
American Indian or Alaska Native
Asian
Black or African American
Hispanic or Latino Native Hawaiian or Other Pacific Islander White
Two or more races
60.53%
63.67%
54.89%
55.65%
NE
64.26%
NE
54.46%
54.24%
55.27%
68.12%
NE
69.94%
NE
16.54%
22.38%
19.19%
16.93%
29.69%
13.69%
18.81%
76.32% 53.01% 20.70%
82.87% 48.25% 27.43%
74.82% 45.29% 21.09%
75.33% 52.02% 22.95%
NE 36.56% 22.60%
79.59% 46.10% 17.79%
NE NE 21.90%

APPENDIX B. INDIVIDUAL STATE PERFORMANCE PROFILES, PY 2010–11 | 144
Indiana Secondary Level
Core indicators
Academic attainment: Reading/
language arts Academic attainment:
Mathematics T echnical skill
attainment School
completion Student
graduation rates Placement Nontraditional participation
Nontraditional completion
Measurement definitions
Percentage of CTE concentrators who have met the proficient or advanced level on the statewide high school reading and language arts assessment administered by the state under ESEA and who, in the reporting year, left secondary education.
Percentage of CTE concentrators who have met the proficient or advanced level on the statewide high school mathematics assessment administered by the state under ESEA and who, in the reporting year, left secondary education.
Percentage of CTE concentrators who passed technical skill assessments that are aligned with industry-recognized standards, if available and appropriate, during the reporting year.
Percentage of CTE concentrators who earned a regular secondary school diploma, earned a General Education Development (GED) credential as a state-recognized equivalent to a regular high school diploma (if offered by the state) or other state-recognized equivalent (including recognized alternative standards for individuals with disabilities), or earned a proficiency credential, certificate, or degree, in conjunction with a secondary school diploma (if offered by the state) during the reporting year.
Percentage of CTE concentrators who, in the reporting year, were included as graduated in the state's computation of its graduation rate as described in ESEA .
Percentage of CTE concentrators who left secondary education and were placed in postsecondary education or advanced training, in the military service, or employment in the second quarter following the program year in which they left secondary education (i.e., unduplicated placement status for CTE concentrators who graduated by June 30, 2007 would be assessed between Oct. 1, 2007 and Dec. 31, 2007).
Percentage of CTE participants from underrepresented gender groups who participated in a program that leads to employment in nontraditional fields during the reporting year.
Percentage of CTE concentrators from underrepresented gender groups who completed a program that leads to employment in nontraditional fields during the reporting year.
PY 2010–11 Performance levels 72.44% 70.67% 83.00% 90.50% 92.00% 77.78% 20.00% 22.67%
PY 2010–11 Results 75.13% 77.82% 88.56% >95.00% 92.25% 85.64% 29.43% 26.96%
Special populations
Individuals with disabilities (ADA )
Individuals with disabilities (ESEA /IDEA )
Economically disadvantaged students
Single parents
Displaced homemakers
Limited English proficient students
Migrant students
Students in nontraditional programs
NP
44.39%
78.30%
72.18%
71.43%
66.07%
NP
76.30%
NP
89.52%
>95.00%
93.31%
NP
>95.00%
NP
>95.00%
NP
80.71%
84.83%
88.50%
90.30%
76.09%
NE
83.31%
NP
26.54%
25.41%
28.14%
>95.00%
22.64%
NP
NP
NP NP NP NP
31.97% 82.40% 82.11% 29.68%
74.99% 90.08% 92.40% 29.40%
70.80% 73.81% 87.97% 30.33%
83.33% NP 90.91% >95.00%
49.12% >95.00% 86.08% 23.58%
NP NP NP NP
74.96% 80.95% 89.68% NP Tech prep 83.33% 84.43% >95.00% >95.00% 92.27% NE 15.86% 16.92% NOTE: This table contains the results for students whom the state has identified as concentrators or participants (participants are only indicated by the state under the nontraditional participation core indicator) in career and technical education (CTE). See Appendix A, Table A-1 for the state’s definition of CTE concentrators and Table A-2 for the state’s definition of CTE participants. Definitions for special populations are provided in the Glossary of Terms in this report. Actual performance data above 95 percent and below 10 percent have been masked to protect student confidentiality. NE—state reported no enrollment; NP—data not provided; PNO—state reported program not offered; NA—data not applicable ADA—Americans with Disabilities Act; ESEA—Elementary and Secondary Education Act of 1965, as amended; IDEA—Individuals with Disabilities Education Act

APPENDIX B. INDIVIDUAL STATE PERFORMANCE PROFILES, PY 2010–11 | 145
Indiana Secondary Level—continued
Core indicators
Academic attainment: Reading/
language arts Academic attainment:
Mathematics T echnical skill
attainment School
completion Student
graduation rates Placement Nontraditional participation
Nontraditional completion
Gender
Male
Female
78.99%
76.47%
>95.00%
>95.00%
84.54%
86.92%
23.74%
32.40%
71.35% 78.70% 90.47% 27.50%
79.55% 94.47% 94.36% 32.50%
Race/ethnicity
American Indian or Alaska Native
Asian
Black or African American
Hispanic or Latino Native Hawaiian or Other Pacific Islander White
Two or more races
80.85%
73.68%
56.84%
72.82%
NP
80.31%
75.05%
>95.00%
>95.00%
>95.00%
>95.00%
NP
>95.00%
>95.00%
NA*
NA*
NA*
NA*
NA*
NA*
NA*
33.95%
35.96%
28.56%
25.90%
NP
26.65%
28.31%
75.00% 33.33% 81.16% 34.65%
63.44% >95.00% 90.60% 33.22%
59.02% 90.06% 90.22% 33.08%
62.73% 93.22% 88.94% 30.32%
NP NP NP NP
77.38% 88.21% 92.70% 28.88%
73.90% 90.48% 91.82% 30.39% NA*—The state was unable to collect and report race/ethnicity data for this particular cell in accordance with the required 1997 race/ethnicity categories. While the state did report data using the 1977 race/ethnicity categories, we are only reporting data provided by the states according to the 1997 race/ethnicity categories described in the Department’s Oct. 19, 2007, memorandum titled “Final Guidance on Maintaining, Collecting, and Reporting Racial and Ethnic Data” (see 72 Federal Register 59266).

APPENDIX B. INDIVIDUAL STATE PERFORMANCE PROFILES, PY 2010–11 | 146
Indiana Postsecondary Level
Core indicators T echnical skill
attainment Credential,
certificate, or degree Student retention
or transfer Student
placement Nontraditional participation
Nontraditional completion
Measurement definitions
Percentage of CTE concentrators who passed technical skill assessments that are aligned with industry-recognized standards, if available and appropriate, during the year prior to the reporting year.
Percentage of CTE concentrators who received an industry-recognized credential, a certificate, or a degree during the previous reporting year.
Percentage of CTE concentrators who remained enrolled in their original postsecondary institution or transferred to another two- or four-year postsecondary institution during the reporting year and who were enrolled in postsecondary education in the fall of the previous reporting year.
Percentage of CTE concentrators who were placed or retained in employment, or placed in military service or apprenticeship programs in the second quarter following the program year in which they left postsecondary education (i.e., unduplicated placement status for CTE concentrators who graduated by June 30, 2007 would be assessed between Oct. 1, 2007 and Dec. 31, 2007).
Percentage of CTE participants from underrepresented gender groups who participated in a program that leads to employment in nontraditional fields during the reporting year.
Percentage of CTE concentrators from underrepresented gender groups who completed a program that leads to employment in nontraditional fields during the reporting year.
PY 2010–11 Performance levels 81.00% 28.00% 74.00% 78.67% 25.00% 26.00%
PY 2010–11 Results 89.56% 23.69% 68.33% 58.39% 28.97% 31.04%
Special populations
Individuals with disabilities (ADA )
Economically disadvantaged students
Single parents
Displaced homemakers
Limited English proficient students
Students in nontraditional programs
21.88%
13.16%
30.86%
37.29%
<10.00%
22.53%
50.00%
NE
NE
NE
NE
61.98%
NE
NE
NE
NE
NE
NP
>95.00% NE 11.11%
NE NE NE
NE NE NE
NE NE NE
NE NE NE
77.42% 65.26% NP
T ech prep NE NE NE NE NE NE NOTE: This table contains the results for students whom the state has identified as concentrators or participants (participants are only indicated by the state under the nontraditional participation core indicator) in career and technical education (CTE). See Appendix A, Table A-1 for the state’s definition of CTE concentrators and Table A-2 for the state’s definition of CTE participants. Definitions for special populations are provided in the Glossary of Terms in this report. Actual performance data above 95 percent and below 10 percent have been masked to protect student confidentiality. NE—state reported no enrollment; NP—data not provided; PNO—state reported program not offered; NA—data not applicable ADA—Americans with Disabilities Act

APPENDIX B. INDIVIDUAL STATE PERFORMANCE PROFILES, PY 2010–11 | 147
Indiana Postsecondary Level—continued
Core indicators T echnical skill
attainment Credential,
certificate, or degree Student retention
or transfer Student
placement Nontraditional participation
Nontraditional completion
Gender
Male
Female
21.49%
26.51%
56.71%
59.26%
10.65%
47.99%
90.51% 65.98% 10.64%
89.36% 71.05% 47.40%
Race/ethnicity
American Indian or Alaska Native
Asian
Black or African American
Hispanic or Latino Native Hawaiian or Other Pacific Islander White
Two or more races
32.14%
16.28%
12.09%
18.63%
20.00%
26.00%
13.95%
33.33%
55.56%
59.49%
60.61%
NE
58.55%
56.16%
42.86%
18.75%
42.20%
36.17%
<10.00%
29.57%
41.76%
>95.00% 60.78% 29.74%
87.50% 82.69% 30.61%
84.00% 59.51% 37.47%
87.50% 71.26% 31.99%
NE >95.00% 33.33%
90.70% 70.01% 26.96%
75.00% 62.45% 34.20%

APPENDIX B. INDIVIDUAL STATE PERFORMANCE PROFILES, PY 2010–11 | 148
Iowa Secondary Level
Core indicators
Academic attainment: Reading/
language arts Academic attainment:
Mathematics T echnical skill
attainment School
completion Student
graduation rates Placement Nontraditional participation
Nontraditional completion
Measurement definitions
Percentage of CTE concentrators who have met the proficient or advanced level on the statewide high school reading and language arts assessment administered by the state under ESEA and who, in the reporting year, left secondary education.
Percentage of CTE concentrators who have met the proficient or advanced level on the statewide high school mathematics assessment administered by the state under ESEA and who, in the reporting year, left secondary education.
Percentage of CTE concentrators who passed technical skill assessments that are aligned with industry-recognized standards, if available and appropriate, during the reporting year.
Percentage of CTE concentrators who earned a regular secondary school diploma, earned a General Education Development (GED) credential as a state-recognized equivalent to a regular high school diploma (if offered by the state) or other state-recognized equivalent (including recognized alternative standards for individuals with disabilities), or earned a proficiency credential, certificate, or degree, in conjunction with a secondary school diploma (if offered by the state) during the reporting year.
Percentage of CTE concentrators who, in the reporting year, were included as graduated in the state's computation of its graduation rate as described in ESEA .
Percentage of CTE concentrators who left secondary education and were placed in postsecondary education or advanced training, in the military service, or employment in the second quarter following the program year in which they left secondary education (i.e., unduplicated placement status for CTE concentrators who graduated by June 30, 2007 would be assessed between Oct. 1, 2007 and Dec. 31, 2007).
Percentage of CTE participants from underrepresented gender groups who participated in a program that leads to employment in nontraditional fields during the reporting year.
Percentage of CTE concentrators from the underrepresented gender group who completed a CTE program that leads to employment in a nontraditional field for their gender and left school during the reporting year.
PY 2010–11 Performance levels 79.30% 79.30% 70.67% 93.39% 92.20% 90.67% 30.16% 32.37%
PY 2010–11 Results 78.15% 78.40% 92.31% 90.83% 90.83% 86.15% 46.04% 40.08%
Special populations
Individuals with disabilities (ADA )
Individuals with disabilities (ESEA /IDEA )
Economically disadvantaged students
Single parents
Displaced homemakers
Limited English proficient students
Migrant students
Students in nontraditional programs
NP
33.92%
65.22%
NP
NP
42.13%
NP
78.99%
NP
87.20%
84.52%
NP
NP
81.92%
NP
91.57%
NP
76.96%
76.82%
NP
NP
70.38%
NP
87.07%
NP
31.47%
41.59%
NP
NP
26.32%
NP
NP
NP NP NP NP
33.72% 84.57% 87.20% 38.48%
66.22% 90.19% 84.52% 47.86%
NP NP NP NP
NP NP NP NP
37.70% 87.24% 81.92% 48.60%
NP NP NP NP
79.34% 93.31% 91.56% NP T ech prep 78.35% 79.80% 92.92% 92.03% 92.03% 87.20% 41.05% 32.80% NOTE: This table contains the results for students whom the state has identified as concentrators or participants (participants are only indicated by the state under the nontraditional participation core indicator) in career and technical education (CTE). See Appendix A, Table A-1 for the state’s definition of CTE concentrators and Table A-2 for the state’s definition of CTE participants. Definitions for special populations are provided in the Glossary of Terms in this report. Actual performance data above 95 percent and below 10 percent have been masked to protect student confidentiality. NE—state reported no enrollment; NP—data not provided; PNO—state reported program not offered; NA—data not applicable ADA—Americans with Disabilities Act; ESEA—Elementary and Secondary Education Act of 1965, as amended; IDEA—Individuals with Disabilities Education Act

APPENDIX B. INDIVIDUAL STATE PERFORMANCE PROFILES, PY 2010–11 | 149
Iowa Secondary Level—continued
Core indicators
Academic attainment: Reading/
language arts Academic attainment:
Mathematics T echnical skill
attainment School
completion Student
graduation rates Placement Nontraditional participation
Nontraditional completion
Gender
Male
Female
80.06%
76.34%
90.24%
91.57%
85.34%
87.16%
23.17%
81.86%
76.68% 91.18% 90.24% 29.93%
79.99% 93.87% 91.56% 71.35%
Race/ethnicity
American Indian or Alaska Native
Asian
Black or African American
Hispanic or Latino Native Hawaiian or Other Pacific Islander White
Two or more races
80.26%
76.33%
44.69%
61.35%
66.67%
80.88%
68.17%
81.58%
80.57%
76.14%
81.53%
80.95%
92.30%
81.69%
75.00%
76.92%
67.82%
73.69%
76.19%
87.99%
74.58%
30.77%
55.56%
53.57%
40.76%
16.67%
39.71%
40.35%
81.33% 87.83% 81.58% 41.11%
76.73% 93.35% 80.57% 56.53%
50.40% 92.73% 76.14% 58.94%
64.16% 89.62% 81.53% 45.92%
70.00% >95.00% 80.95% 42.50%
80.08% 92.52% 92.30% 45.02%
75.78% 87.83% 81.69% 54.09%

APPENDIX B. INDIVIDUAL STATE PERFORMANCE PROFILES, PY 2010–11 | 150
Iowa Postsecondary Level
Core indicators T echnical skill
attainment Credential,
certificate, or degree Student retention
or transfer Student
placement Nontraditional participation
Nontraditional completion
Measurement definitions
Percentage of CTE concentrators who passed technical skill assessments that are aligned with industry-recognized standards, if available and appropriate, during the reporting year.
Percentage of CTE concentrators who received an industry-recognized credential, a certificate, or a degree during the reporting year.
Percentage of CTE concentrators who remained enrolled in their original postsecondary institution or transferred to another two- or four-year postsecondary institution during the reporting year and who were enrolled in postsecondary education in the fall of the previous reporting year.
Percentage of CTE concentrators who were placed or retained in employment, or placed in military service or apprenticeship programs in the second quarter following the program year in which they left postsecondary education (i.e., unduplicated placement status for CTE concentrators who graduated by June 30, 2007 would be assessed between Oct. 1, 2007 and Dec. 31, 2007).
Percentage of CTE participants from underrepresented gender groups who participated in a program that leads to employment in nontraditional fields during the reporting year.
Percentage of CTE concentrators from underrepresented gender group who completed a CTE program that leads to employment in nontraditional fields for their gender and left college during the reporting year.
PY 2010–11 Performance levels 86.00% 50.22% 77.44% 77.44% 23.77% 41.77%
PY 2010–11 Results 93.17% 32.80% 71.35% 65.80% 16.49% 25.98%
Special populations
Individuals with disabilities (ADA )
Economically disadvantaged students
Single parents
Displaced homemakers
Limited English proficient students
Students in nontraditional programs
33.12%
28.21%
20.28%
25.55%
24.71%
26.52%
67.74%
62.05%
60.02%
49.62%
68.99%
60.62%
27.43%
20.73%
12.41%
19.44%
18.42%
NP
89.58% 71.90% 16.93%
91.93% 70.92% 17.58%
88.68% 65.58% 23.27%
92.31% 70.94% 28.81%
90.32% 79.65% 25.10%
93.53% 70.75% NP
T ech prep >95.00% 38.70% 72.88% 77.49% 10.00% 40.91% NOTE: This table contains the results for students whom the state has identified as concentrators or participants (participants are only indicated by the state under the nontraditional participation core indicator) in career and technical education (CTE). See Appendix A, Table A-1 for the state’s definition of CTE concentrators and Table A-2 for the state’s definition of CTE participants. Definitions for special populations are provided in the Glossary of Terms in this report. Actual performance data above 95 percent and below 10 percent have been masked to protect student confidentiality. NE—state reported no enrollment; NP—data not provided; PNO—state reported program not offered; NA—data not applicable ADA—Americans with Disabilities Act

APPENDIX B. INDIVIDUAL STATE PERFORMANCE PROFILES, PY 2010–11 | 151
Iowa Postsecondary Level—continued
Core indicators T echnical skill
attainment Credential,
certificate, or degree Student retention
or transfer Student
placement Nontraditional participation
Nontraditional completion
Gender
Male
Female
31.59%
33.89%
64.43%
67.05%
28.17%
25.02%
91.79% 66.97% 12.61%
94.18% 74.47% 19.34%
Race/ethnicity
American Indian or Alaska Native
Asian
Black or African American
Hispanic or Latino Native Hawaiian or Other Pacific Islander White
Two or more races
21.31%
33.82%
10.18%
23.51%
12.50%
36.88%
21.67%
64.35%
60.32%
48.37%
60.91%
60.00%
67.52%
61.29%
17.65%
20.83%
13.87%
<10.00%
<10.00%
30.19%
13.33%
>95.00% 65.34% 18.60%
90.20% 78.05% 22.09%
91.32% 61.46% 19.36%
85.34% 67.60% 16.23%
>95.00% 65.00% 23.53%
93.81% 72.47% 15.56%
NP 75.66% 23.03%

APPENDIX B. INDIVIDUAL STATE PERFORMANCE PROFILES, PY 2010–11 | 152
Kansas Secondary Level
Core indicators
Academic attainment: Reading/
language arts Academic attainment:
Mathematics T echnical skill
attainment School
completion Student
graduation rates Placement Nontraditional participation
Nontraditional completion
Measurement definitions
Percentage of CTE concentrators who have met the "meets standard" or above level on the statewide high school reading and language arts assessment administered by the state under ESEA and who, in the reporting year, left secondary education.
Percentage of CTE concentrators who have met the "meets standard" or above level on the statewide high school mathematics assessment administered by the state under ESEA and who, in the reporting year, left secondary education.
Percentage of CTE concentrators who passed technical skill assessments that are aligned with industry-recognized standards, if available and appropriate, during the reporting year.
Percentage of CTE concentrators who earned a regular secondary school diploma. earned a General Education Development (GED) credential as a state-recognized equivalent to a regular high school diploma (if offered by the state) or other state-recognized equivalent (including recognized alternative standards for individuals with disabilities), or earned a proficiency credential, certificate, or degree, in conjunction with a secondary school diploma (if offered by the state) during the reporting year.
Percentage of CTE concentrators who, in the reporting year, were included as graduated in the state's computation of its graduation rate as described in ESEA .
Percentage of CTE concentrators who left secondary education and were placed in postsecondary education or advanced training. in the military service, or employment in the second quarter following the program year in which they left secondary education (i.e., unduplicated placement status for CTE concentrators who graduated by June 30, 2007 would be assessed between Oct. 1, 2007 and Dec. 31, 2007).
Percentage of CTE participants from underrepresented gender groups who participated in a program that leads to employment in nontraditional fields during the reporting year.
Percentage of CTE concentrators from underrepresented gender groups who completed a program that leads to employment in nontraditional fields during the reporting year.
PY 2010–11 Performance levels 81.30% 82.30% 88.67% 96.00% 76.00% 88.67% 51.33% 62.00%
PY 2010–11 Results 90.30% 84.44% >95.00% 90.37% >95.00% 90.08% 47.69% 26.81%
Special populations
Individuals with disabilities (ADA )
Individuals with disabilities (ESEA /IDEA )
Economically disadvantaged students
Single parents
Displaced homemakers
Limited English proficient students
Migrant students
Students in nontraditional programs
NP
56.42%
73.77%
71.71%
NP
69.51%
66.67%
89.64%
NP
81.75%
86.05%
88.58%
NP
89.77%
85.71%
90.09%
NP
83.67%
88.82%
81.40%
NP
90.86%
NP
39.42%
NP
13.22%
22.80%
15.82%
NP
11.25%
14.29%
NP
NP NP NP NP
66.16% >95.00% >95.00% 41.02%
83.46% >95.00% >95.00% 47.70%
79.90% >95.00% >95.00% 35.86%
NP NP NP NP
62.96% >95.00% >95.00% 46.15%
85.71% >95.00% 85.71% 41.14%
93.42% >95.00% >95.00% NP T ech prep NP NP NP NP NP PNO NP NP NOTE: This table contains the results for students whom the state has identified as concentrators or participants (participants are only indicated by the state under the nontraditional participation core indicator) in career and technical education (CTE). See Appendix A, Table A-1 for the state’s definition of CTE concentrators and Table A-2 for the state’s definition of CTE participants. Definitions for special populations are provided in the Glossary of Terms in this report. Actual performance data above 95 percent and below 10 percent have been masked to protect student confidentiality. NE—state reported no enrollment; NP—data not provided; PNO—state reported program not offered; NA—data not applicable ADA—Americans with Disabilities Act; ESEA—Elementary and Secondary Education Act of 1965, as amended; IDEA—Individuals with Disabilities Education Act

APPENDIX B. INDIVIDUAL STATE PERFORMANCE PROFILES, PY 2010–11 | 153
Kansas Secondary Level—continued
Core indicators
Academic attainment: Reading/
language arts Academic attainment:
Mathematics T echnical skill
attainment School
completion Student
graduation rates Placement Nontraditional participation
Nontraditional completion
Gender
Male
Female
85.86%
82.87%
90.31%
90.45%
89.27%
91.18%
19.32%
35.09%
90.15% >95.00% >95.00% 35.63%
90.47% >95.00% >95.00% 63.37%
Race/ethnicity
American Indian or Alaska Native
Asian
Black or African American
Hispanic or Latino Native Hawaiian or Other Pacific Islander White
Two or more races
75.29%
88.31%
54.82%
75.05%
80.00%
87.86%
83.80%
91.86%
88.37%
86.46%
87.68%
66.67%
91.13%
87.91%
80.49%
NE
83.33%
75.86%
NP
91.94%
80.12%
36.71%
26.32%
26.49%
21.31%
25.00%
27.44%
23.03%
85.88% >95.00% >95.00% 51.15%
87.18% >95.00% >95.00% 48.62%
75.08% >95.00% >95.00% 52.22%
83.80% >95.00% >95.00% 48.17%
>95.00% >95.00% 83.33% 34.62%
92.39% >95.00% >95.00% 47.13%
87.78% >95.00% >95.00% 50.83%

APPENDIX B. INDIVIDUAL STATE PERFORMANCE PROFILES, PY 2010–11 | 154
Kansas Postsecondary Level
Core indicators T echnical skill
attainment Credential,
certificate, or degree Student retention
or transfer Student
placement Nontraditional participation
Nontraditional completion
Measurement definitions
Percentage of CTE concentrators who passed technical skill assessments that arc aligned with industry-recognized standards, if available and appropriate, during the reporting year.
Percentage of CTE concentrators who received an industry-recognized credential, a certificate, or a degree during the reporting year.
Percentage of CTE concentrators who remained enrolled in their original post-secondary institution or transferred to another two-or four-year postsecondary institution during the reporting year and who were enrolled in postsecondary education in the fall of the previous reporting year.
Percentage of CTE concentrators who were placed or retained in employment. or placed in military service or apprenticeship programs in the second quarter following the program year in which they left post-secondary education (i.e. unduplicated placement status for CTE concentrators who graduated by June 30, 2007 would be assessed between Oct. 1, 2007 and Dec. 31, 2007).
Percentage of CTE participants from underrepresented gender groups who participated in a program that leads to employment in nontraditional fields during the reporting year.
Percentage of CTE concentrators from underrepresented gender groups who completed a program that leads to employment in nontraditional fields during the reporting year.
PY 2010–11 Performance levels 66.00% 55.00% 53.00% 70.50% 11.00% 9.50%
PY 2010–11 Results 92.37% 75.98% 65.59% 82.96% 27.62% 11.13%
Special populations
Individuals with disabilities (ADA )
Economically disadvantaged students
Single parents
Displaced homemakers
Limited English proficient students
Students in nontraditional programs
63.51%
73.60%
80.62%
83.33%
58.25%
75.92%
78.38%
81.46%
86.03%
91.30%
84.17%
79.06%
<10.00%
<10.00%
<10.00%
<10.00%
<10.00%
NP
92.59% 63.12% 32.39%
91.44% 68.55% 25.57%
91.35% 64.18% 22.51%
92.00% 69.23% 14.67%
93.80% 65.51% 35.86%
93.93% 70.74% NP
T ech prep PNO PNO PNO PNO >95.00% PNO NOTE: This table contains the results for students whom the state has identified as concentrators or participants (participants are only indicated by the state under the nontraditional participation core indicator) in career and technical education (CTE). See Appendix A, Table A-1 for the state’s definition of CTE concentrators and Table A-2 for the state’s definition of CTE participants. Definitions for special populations are provided in the Glossary of Terms in this report. Actual performance data above 95 percent and below 10 percent have been masked to protect student confidentiality. NE—state reported no enrollment; NP—data not provided; PNO—state reported program not offered; NA—data not applicable ADA—Americans with Disabilities Act

APPENDIX B. INDIVIDUAL STATE PERFORMANCE PROFILES, PY 2010–11 | 155
Kansas Postsecondary Level—continued
Core indicators T echnical skill
attainment Credential,
certificate, or degree Student retention
or transfer Student
placement Nontraditional participation
Nontraditional completion
Gender
Male
Female
66.74%
83.24%
83.01%
82.92%
18.56%
<10.00%
92.59% 62.16% 32.95%
92.26% 69.32% 23.37%
Race/ethnicity
American Indian or Alaska Native
Asian
Black or African American
Hispanic or Latino Native Hawaiian or Other Pacific Islander White
Two or more races
76.98%
81.50%
68.98%
72.95%
>95.00%
77.10%
81.40%
70.00%
74.80%
74.18%
81.12%
57.14%
84.84%
76.67%
<10.00%
18.26%
21.64%
<10.00%
20.00%
10.46%
<10.00%
92.21% 64.15% 26.24%
94.00% 63.93% 35.71%
90.46% 64.81% 31.25%
85.48% 61.73% 24.07%
>95.00% 62.50% 28.21%
93.02% 66.29% 26.70%
>95.00% 75.68% 30.12%

APPENDIX B. INDIVIDUAL STATE PERFORMANCE PROFILES, PY 2010–11 | 156
Kentucky Secondary Level
Core indicators
Academic attainment: Reading/
language arts Academic attainment:
Mathematics T echnical skill
attainment School
completion Student
graduation rates Placement Nontraditional participation
Nontraditional completion
Measurement definitions
Percentage of senior concentrators who have met the proficient or advanced level on the statewide high school reading and language arts assessment administered by the state under ESEA .
Percentage of senior concentrators who have met the proficient or advanced level on the statewide high school mathematics assessment administered by the state under ESEA .
Percentage of senior concentrators who passed the technical assessment tests and left secondary education in the reporting year.
Percentage of senior concentrators who received a high school diploma, a General Education Development (GED) credential, or other state-recognized equivalent during the reporting year.
Percentage of senior concentrators who graduated in the reporting year.
Percentage of concentrators who completed the program and graduated from high school and who entered postsecondary education or advanced training, entered the military, or were employed in the reporting year during the second quarter.
Percentage of nontraditional participants who enrolled in programs leading to employment in the occupations that employ less than 25 percent of one gender in the reporting year.
Percentage of nontraditional concentrators who completed programs leading to employment in occupations that employ less than 25 percent of one gender.
PY 2010–11 Performance levels 35.69% 33.42% 61.00% 91.78% 86.84% 91.62% 33.00% 23.00%
PY 2010–11 Results 61.65% 37.45% 56.72% >95.00% >95.00% 72.72% 37.57% 20.92%
Special populations
Individuals with disabilities (ADA )
Individuals with disabilities (ESEA /IDEA )
Economically disadvantaged students
Single parents
Displaced homemakers
Limited English proficient students
Migrant students
Students in nontraditional programs
23.47%
NP
33.32%
20.87%
NP
<10.00%
NP
41.56%
>95.00%
NP
>95.00%
>95.00%
>95.00%
>95.00%
NP
>95.00%
NP
62.92%
70.21%
75.30%
>95.00%
76.54%
NE
66.43%
17.55%
NP
18.71%
13.10%
>95.00%
13.51%
NP
NP
27.42% 35.95% >95.00% 36.91%
NP NP NP NP
58.73% 56.26% >95.00% 34.84%
60.73% 56.71% >95.00% 20.10%
NP >95.00% >95.00% 33.33%
20.00% 15.22% 93.94% 41.19%
NP NP NP NP
68.55% 57.01% >95.00% NP Tech prep 53.44% 26.90% 60.52% >95.00% >95.00% NE 22.16% 16.93% NOTE: This table contains the results for students whom the state has identified as concentrators or participants (participants are only indicated by the state under the nontraditional participation core indicator) in career and technical education (CTE). See Appendix A, Table A-1 for the state’s definition of CTE concentrators and Table A-2 for the state’s definition of CTE participants. Definitions for special populations are provided in the Glossary of Terms in this report. Actual performance data above 95 percent and below 10 percent have been masked to protect student confidentiality. NE—state reported no enrollment; NP—data not provided; PNO—state reported program not offered; NA—data not applicable ADA—Americans with Disabilities Act; ESEA—Elementary and Secondary Education Act of 1965, as amended; IDEA—Individuals with Disabilities Education Act
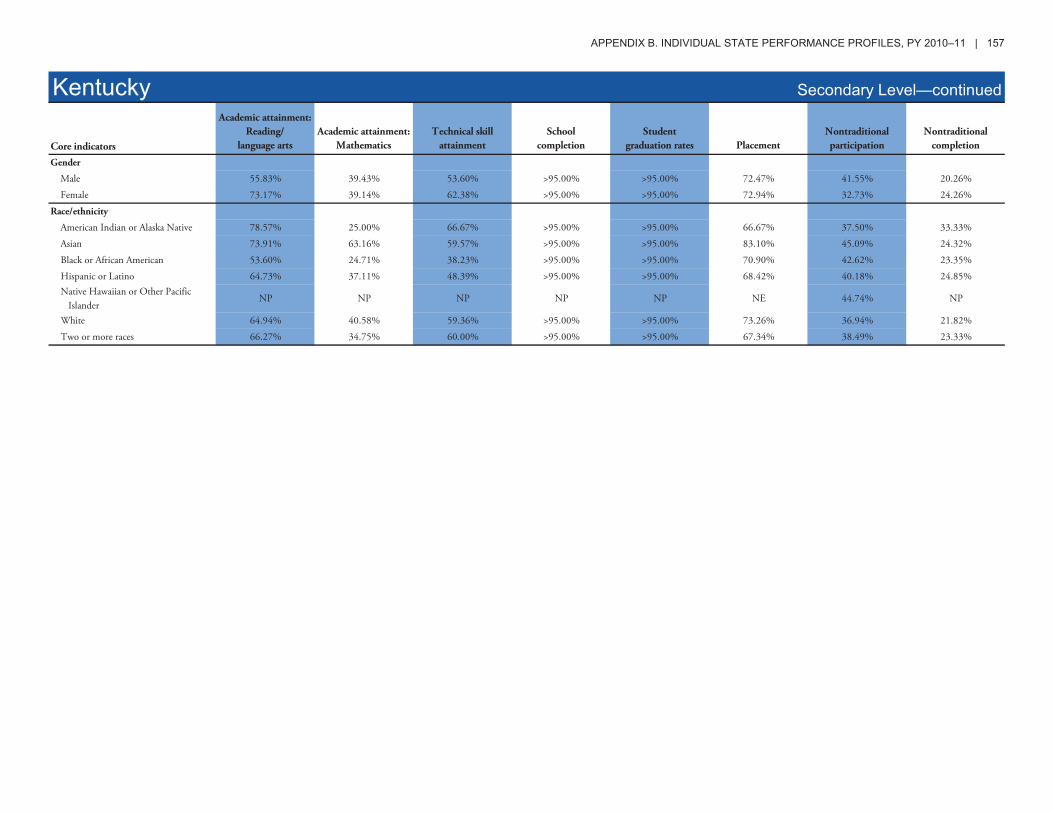
APPENDIX B. INDIVIDUAL STATE PERFORMANCE PROFILES, PY 2010–11 | 157
Kentucky Secondary Level—continued
Core indicators
Academic attainment: Reading/
language arts Academic attainment:
Mathematics T echnical skill
attainment School
completion Student
graduation rates Placement Nontraditional participation
Nontraditional completion
Gender
Male
Female
39.43%
39.14%
>95.00%
>95.00%
72.47%
72.94%
20.26%
24.26%
55.83% 53.60% >95.00% 41.55%
73.17% 62.38% >95.00% 32.73%
Race/ethnicity
American Indian or Alaska Native
Asian
Black or African American
Hispanic or Latino Native Hawaiian or Other Pacific Islander White
Two or more races
25.00%
63.16%
24.71%
37.11%
NP
40.58%
34.75%
>95.00%
>95.00%
>95.00%
>95.00%
NP
>95.00%
>95.00%
66.67%
83.10%
70.90%
68.42%
NE
73.26%
67.34%
33.33%
24.32%
23.35%
24.85%
NP
21.82%
23.33%
78.57% 66.67% >95.00% 37.50%
73.91% 59.57% >95.00% 45.09%
53.60% 38.23% >95.00% 42.62%
64.73% 48.39% >95.00% 40.18%
NP NP NP 44.74%
64.94% 59.36% >95.00% 36.94%
66.27% 60.00% >95.00% 38.49%

APPENDIX B. INDIVIDUAL STATE PERFORMANCE PROFILES, PY 2010–11 | 158
Kentucky Postsecondary Level
Core indicators T echnical skill
attainment Credential,
certificate, or degree Student retention
or transfer Student
placement Nontraditional participation
Nontraditional completion
Measurement definitions
Percentage of concentrators who passed the skill assessment tests in the reporting year plus concentrators who completed the program and received or were eligible to receive a credential in the reporting year.
Percentage of concentrators who completed the programs and received an industry-recognized credential and concentrators who completed the program and received or was eligible to receive a credential, certificate, or degree in the reporting year.
Percentage of concentrators who are retained in the programs or who transfer to baccalaureate degree programs in the reporting year.
Percentage of concentrators who completed the program and graduated from the institution or was eligible for graduation or degree that entered the military service or apprenticeship programs, was employed or retained in employment, or employed or retained in employment that is high skill, high demand, or high wage occupations or professions in the second quarter.
Percentage of nontraditional participants enrolled in program leading to nontraditional employment in an occupation that employs less than 25 percent of one gender in the reporting year.
Percentage of nontraditional concentrators who completed a program leading to nontraditional employment in occupations employing less than 25 percent of one gender in the reporting year.
PY 2010–11 Performance levels 71.00% 71.00% 59.00% 60.00% 15.00% 10.00%
PY 2010–11 Results 87.10% 87.10% >95.00% 71.76% 21.67% 12.67%
Special populations
Individuals with disabilities (ADA )
Economically disadvantaged students
Single parents
Displaced homemakers
Limited English proficient students
Students in nontraditional programs
86.88%
88.88%
90.17%
94.12%
90.00%
86.81%
62.18%
67.01%
66.67%
73.33%
>95.00%
61.25%
15.77%
13.52%
13.37%
<10.00%
10.00%
NP
86.88% 94.03% 23.11%
88.88% >95.00% 22.53%
90.17% >95.00% 23.17%
94.12% >95.00% 14.04%
90.00% 91.67% 11.54%
86.81% >95.00% NP
T ech prep NE NE NE NE NE NE NOTE: This table contains the results for students whom the state has identified as concentrators or participants (participants are only indicated by the state under the nontraditional participation core indicator) in career and technical education (CTE). See Appendix A, Table A-1 for the state’s definition of CTE concentrators and Table A-2 for the state’s definition of CTE participants. Definitions for special populations are provided in the Glossary of Terms in this report. Actual performance data above 95 percent and below 10 percent have been masked to protect student confidentiality. NE—state reported no enrollment; NP—data not provided; PNO—state reported program not offered; NA—data not applicable ADA—Americans with Disabilities Act

APPENDIX B. INDIVIDUAL STATE PERFORMANCE PROFILES, PY 2010–11 | 159
Kentucky Postsecondary Level—continued
Core indicators T echnical skill
attainment Credential,
certificate, or degree Student retention
or transfer Student
placement Nontraditional participation
Nontraditional completion
Gender
Male
Female
84.10%
89.11%
70.09%
72.55%
14.11%
11.78%
84.10% 94.74% 14.01%
89.11% >95.00% 27.44%
Race/ethnicity
American Indian or Alaska Native
Asian
Black or African American
Hispanic or Latino Native Hawaiian or Other Pacific Islander White
Two or more races
73.08%
92.65%
87.32%
86.11%
NE
87.21%
85.25%
33.33%
76.92%
60.50%
66.67%
NE
71.91%
78.71%
12.50%
15.94%
15.64%
16.22%
NE
12.64%
<10.00%
73.08% 90.28% 24.81%
92.65% >95.00% 26.16%
87.32% >95.00% 23.31%
86.11% >95.00% 27.92%
NE NE NE
87.21% 94.75% 20.99%
85.25% >95.00% 23.70%

APPENDIX B. INDIVIDUAL STATE PERFORMANCE PROFILES, PY 2010–11 | 160
Louisiana Secondary Level
Core indicators
Academic attainment: Reading/
language arts Academic attainment:
Mathematics T echnical skill
attainment School
completion Student
graduation rates Placement Nontraditional participation
Nontraditional completion
Measurement definitions
Percentage of CTE concentrators who have met the proficient or advanced level on the statewide high school reading and language arts assessment administered by the state under ESEA and who, in the reporting year, left secondary education.
Percentage of CTE concentrators who have met the proficient or advanced level on the statewide high school mathematics assessment administered by the state under ESEA and who, in the reporting year, left secondary education.
Percentage of CTE concentrators who passed technical skill assessments that are aligned with industry-recognized standards, if available and appropriate, during the reporting year.
Percentage of CTE concentrators who earned a regular secondary school diploma, earned a General Education Development (GED) credential as a state-recognized equivalent to a regular high school diploma (if offered by the state) or other state-recognized equivalent (including recognized alternative standards for individuals with disabilities), or earned a proficiency credential, certificate, or degree, in conjunction with a secondary school diploma (if offered by the state) during the reporting year.
Percentage of CTE concentrators who, in the reporting year, were included as graduated in the state's computation of its graduation rate as described in ESEA .
Percentage of CTE concentrators who left secondary education and were placed in postsecondary education or advanced training, in the military service, or employment in the second quarter following the program year in which they left secondary education (i.e., unduplicated placement status for CTE concentrators who graduated by June 30, 2007 would be assessed between Oct. 1, 2007 and Dec. 31, 2007).
Percentage of CTE participants from underrepresented gender groups who participated in a program that leads to employment in nontraditional fields during the reporting year.
Percentage of CTE concentrators from underrepresented gender groups who completed a program that leads to employment in nontraditional fields during the reporting year.
PY 2010–11 Performance levels 58.00% 54.00% 64.00% 57.50% 80.00% 49.50% 16.50% 12.00%
PY 2010–11 Results 62.38% 72.31% 91.71% >95.00% 89.37% 89.43% 16.97% <10.00%
Special populations
Individuals with disabilities (ADA )
Individuals with disabilities (ESEA /IDEA )
Economically disadvantaged students
Single parents
Displaced homemakers
Limited English proficient students
Migrant students
Students in nontraditional programs
NP
18.57%
64.65%
NP
NP
37.07%
NP
59.25%
NP
69.64%
93.13%
NP
NP
91.38%
NP
89.03%
NP
68.21%
86.46%
NE
NE
61.31%
NE
NE
NP
<10.00%
<10.00%
NP
NP
<10.00%
NP
NP
NP NP NP NP
10.71% 90.77% 53.32% 22.36%
54.39% 90.70% 85.46% 18.70%
NP NP NP NP
NP NP NP NP
<10.00% 93.65% 75.29% 24.06%
NP NP NP NP
47.02% NP NP NP Tech prep NP NP NP NP NP NE NP NP NOTE: This table contains the results for students whom the state has identified as concentrators or participants (participants are only indicated by the state under the nontraditional participation core indicator) in career and technical education (CTE). See Appendix A, Table A-1 for the state’s definition of CTE concentrators and Table A-2 for the state’s definition of CTE participants. Definitions for special populations are provided in the Glossary of Terms in this report. Actual performance data above 95 percent and below 10 percent have been masked to protect student confidentiality. NE—state reported no enrollment; NP—data not provided; PNO—state reported program not offered; NA—data not applicable ADA—Americans with Disabilities Act; ESEA—Elementary and Secondary Education Act of 1965, as amended; IDEA—Individuals with Disabilities Education Act

APPENDIX B. INDIVIDUAL STATE PERFORMANCE PROFILES, PY 2010–11 | 161
Louisiana Secondary Level—continued
Core indicators
Academic attainment: Reading/
language arts Academic attainment:
Mathematics T echnical skill
attainment School
completion Student
graduation rates Placement Nontraditional participation
Nontraditional completion
Gender
Male
Female
73.65%
71.19%
94.17%
>95.00%
88.87%
89.89%
12.10%
<10.00%
55.56% 91.01% 86.33% 23.14%
68.10% 92.27% 91.93% 10.15%
Race/ethnicity
American Indian or Alaska Native
Asian
Black or African American
Hispanic or Latino Native Hawaiian or Other Pacific Islander White
Two or more races
62.13%
83.25%
59.83%
68.45%
85.71%
80.53%
70.18%
94.67%
>95.00%
92.23%
>95.00%
>95.00%
>95.00%
>95.00%
NA*
NA*
NA*
NA*
NA*
NA*
NA*
<10.00%
10.00%
11.65%
<10.00%
<10.00%
<10.00%
<10.00%
57.40% 88.89% 89.94% 10.32%
66.04% >95.00% 93.21% 18.58%
51.24% 89.49% 85.00% 22.06%
55.36% 93.04% 88.85% 16.92%
71.43% >95.00% NE 40.00%
70.05% 92.67% 92.19% 13.08%
60.53% 90.57% NE 15.62% NA*—The state was unable to collect and report race/ethnicity data for this particular cell in accordance with the required 1997 race/ethnicity categories. While the state did report data using the 1977 race/ethnicity categories, we are only reporting data provided by the states according to the 1997 race/ethnicity categories described in the Department’s Oct. 19, 2007, memorandum titled “Final Guidance on Maintaining, Collecting, and Reporting Racial and Ethnic Data” (see 72 Federal Register 59266).

APPENDIX B. INDIVIDUAL STATE PERFORMANCE PROFILES, PY 2010–11 | 162
Louisiana Postsecondary Level
Core indicators T echnical skill
attainment Credential,
certificate, or degree Student retention
or transfer Student
placement Nontraditional participation
Nontraditional completion
Measurement definitions
Percentage of CTE concentrators who passed technical skill assessments that are aligned with industry-recognized standards, if available and appropriate, during the reporting year.
Percentage of CTE concentrators who received an industry-recognized credential, a certificate, or a degree during the reporting year.
Percentage of CTE concentrators who remained enrolled in their original postsecondary institution or transferred to another two- or four-year postsecondary institution during the reporting year and who were enrolled in postsecondary education in the fall of the previous reporting year.
Percentage of CTE concentrators who were placed or retained in employment, or placed in military service or apprenticeship programs in the second quarter following the program year in which they completed a postsecondary education credential, certificate, or diploma (i.e., unduplicated placement status for CTE concentrators who graduated by June 30, 2007 would be assessed between Oct. 1, 2007 and Dec. 31, 2007).
Percentage of CTE participants from underrepresented gender groups who participated in a program that leads to employment in nontraditional fields during the reporting year.
Percentage of CTE concentrators from underrepresented gender groups who completed a program that leads to employment in nontraditional fields during the reporting year.
PY 2010–11 Performance levels 35.00% 29.50% 84.00% 51.00% 18.50% 15.75%
PY 2010–11 Results 36.67% 30.14% 67.99% 41.95% 17.34% 17.44%
Special populations
Individuals with disabilities (ADA )
Economically disadvantaged students
Single parents
Displaced homemakers
Limited English proficient students
Students in nontraditional programs
48.28%
32.95%
22.13%
48.33%
18.69%
32.77%
40.20%
44.93%
69.70%
29.57%
39.81%
41.26%
12.70%
15.88%
<10.00%
23.33%
14.46%
NP
49.52% 65.68% 21.81%
37.37% 75.95% 15.23%
22.90% 62.53% 17.02%
48.41% 67.53% 34.04%
35.92% 70.26% 25.91%
37.26% 48.83% NP
T ech prep NE NE NE NE NE NE NOTE: This table contains the results for students whom the state has identified as concentrators or participants (participants are only indicated by the state under the nontraditional participation core indicator) in career and technical education (CTE). See Appendix A, Table A-1 for the state’s definition of CTE concentrators and Table A-2 for the state’s definition of CTE participants. Definitions for special populations are provided in the Glossary of Terms in this report. Actual performance data above 95 percent and below 10 percent have been masked to protect student confidentiality. NE—state reported no enrollment; NP—data not provided; PNO—state reported program not offered; NA—data not applicable ADA—Americans with Disabilities Act

APPENDIX B. INDIVIDUAL STATE PERFORMANCE PROFILES, PY 2010–11 | 163
Louisiana Postsecondary Level—continued
Core indicators T echnical skill
attainment Credential,
certificate, or degree Student retention
or transfer Student
placement Nontraditional participation
Nontraditional completion
Gender
Male
Female
32.02%
29.02%
39.40%
43.62%
27.33%
12.29%
38.64% 63.99% 26.42%
35.48% 70.09% 11.16%
Race/ethnicity
American Indian or Alaska Native
Asian
Black or African American
Hispanic or Latino Native Hawaiian or Other Pacific Islander White
Two or more races
23.62%
27.27%
23.86%
27.49%
16.67%
37.95%
24.77%
42.50%
50.81%
34.62%
36.64%
40.00%
45.79%
27.78%
16.67%
22.78%
18.54%
19.67%
<10.00%
16.99%
25.64%
35.71% 75.89% 21.95%
31.45% 68.71% 29.17%
30.66% 64.08% 17.06%
29.64% 68.03% 17.09%
20.00% 75.00% 28.57%
41.88% 66.04% 17.60%
24.32% 63.22% 21.93%

APPENDIX B. INDIVIDUAL STATE PERFORMANCE PROFILES, PY 2010–11 | 164
Louisiana Adult Level
Core indicators T echnical skill
attainment Credential,
certificate, or degree Student retention
or transfer Student
placement Nontraditional participation
Nontraditional completion
Measurement definitions
Percentage of CTE concentrators who passed technical skill assessments that are aligned with industry-recognized standards, if available and appropriate, during the reporting year.
Percentage of CTE concentrators who received an industry-recognized credential, a certificate, or a degree during the reporting year.
Percentage of CTE concentrators who remained enrolled in their original postsecondary institution or transferred to another two- or four-year postsecondary institution during the reporting year and who were enrolled in postsecondary education in the fall of the previous reporting year.
Percentage of CTE concentrators who were placed or retained in employment, or placed in military service or apprenticeship programs in the second quarter following the program year in which they completed a postsecondary education credential, certificate, or diploma (i.e., unduplicated placement status for CTE concentrators who graduated by June 30, 2007 would be assessed between Oct. 1, 2007 and Dec. 31, 2007).
Percentage of CTE participants from underrepresented gender groups who participated in a program that leads to employment in nontraditional fields during the reporting year.
Percentage of CTE concentrators from underrepresented gender groups who completed a program that leads to employment in nontraditional fields during the reporting year.
PY 2010–11 Performance levels 46.00% 44.00% 74.55% 56.93% 10.50% 10.00%
PY 2010–11 Results 53.70% 53.70% 71.34% 47.12% 10.21% 11.70%
Special populations
Individuals with disabilities (ADA )
Economically disadvantaged students
Single parents
Displaced homemakers
Limited English proficient students
Students in nontraditional programs
48.52%
50.08%
47.35%
55.32%
55.05%
51.85%
43.95%
43.49%
50.73%
46.43%
53.70%
46.84%
18.03%
10.08%
11.11%
10.17%
<10.00%
NP
48.52% 72.08% 19.06%
50.25% 66.17% 10.58%
47.35% 71.89% <10.00%
55.32% 71.15% 12.06%
55.05% 81.69% <10.00%
52.69% 74.77% NP
T ech prep NE NE NE NE NE NE NOTE: This table contains the results for students whom the state has identified as concentrators or participants (participants are only indicated by the state under the nontraditional participation core indicator) in career and technical education (CTE). See Appendix A, Table A-1 for the state’s definition of CTE concentrators and Table A-2 for the state’s definition of CTE participants. Definitions for special populations are provided in the Glossary of Terms in this report. Actual performance data above 95 percent and below 10 percent have been masked to protect student confidentiality. NE—state reported no enrollment; NP—data not provided; PNO—state reported program not offered; NA—data not applicable ADA—Americans with Disabilities Act

APPENDIX B. INDIVIDUAL STATE PERFORMANCE PROFILES, PY 2010–11 | 165
Louisiana Adult Level—continued
Core indicators T echnical skill
attainment Credential,
certificate, or degree Student retention
or transfer Student
placement Nontraditional participation
Nontraditional completion
Gender
Male
Female
56.78%
50.81%
47.00%
47.24%
<10.00%
14.93%
57.93% 72.69% <10.00%
49.74% 70.07% 12.53%
Race/ethnicity
American Indian or Alaska Native
Asian
Black or African American
Hispanic or Latino Native Hawaiian or Other Pacific Islander White
Two or more races
64.38%
55.56%
49.77%
66.34%
<10.00%
56.17%
64.00%
37.50%
51.69%
45.20%
66.67%
>95.00%
51.29%
44.00%
30.43%
12.00%
10.00%
16.00%
<10.00%
11.98%
20.00%
64.38% 72.00% 21.43%
55.56% 75.44% <10.00%
49.77% 71.63% 10.56%
66.34% 64.56% 13.51%
<10.00% 74.24% 14.29%
56.17% 71.17% <10.00%
64.00% 50.00% 13.64%

APPENDIX B. INDIVIDUAL STATE PERFORMANCE PROFILES, PY 2010–11 | 166
Maine Secondary Level
Core indicators
Academic attainment: Reading/
language arts Academic attainment:
Mathematics T echnical skill
attainment School
completion Student
graduation rates Placement Nontraditional participation
Nontraditional completion
Measurement definitions
Percentage of CTE concentrators who have met the proficient or advanced level on the statewide high school reading and language arts assessment administered by the state under ESEA and who, in the reporting year, left secondary education.
Percentage of CTE concentrators who have met the proficient or advanced level on the statewide high school mathematics assessment administered by the state under ESEA and who, in the reporting year, left secondary education.
Percentage of CTE concentrators who completed at least 80 percent of the standards guiding the state-approved program during the reporting year.
Percentage of CTE concentrators who earned a regular secondary school diploma and have left secondary education during the reporting year.
Percentage of CTE concentrators who, in the reporting year, were included as graduated in the state's computation of its graduation rate as described in ESEA .
Percentage of CTE concentrators who completed a secondary CTE program, attained a high school diploma and left secondary education in the reporting year and were placed in postsecondary education or advanced training, in military service, or employment in the second quarter following the program year in which they left secondary education (i.e., unduplicated placement status for CTE investors who graduated by June 30, 2007 would be assessed between Oct. 1, 2007 and Dec. 31, 2007).
Percentage of CTE participants from underrepresented gender groups who participated in a program that leads to employment in nontraditional fields during the reporting year.
Percentage of CTE concentrators from underrepresented gender groups who completed a program that leads to employment in nontraditional fields during the reporting year.
PY 2010–11 Performance levels 33.00% 25.00% 92.00% 97.27% 94.77% 91.84% 15.00% 13.24%
PY 2010–11 Results 28.43% 27.74% 91.38% 90.13% 92.89% >95.00% 21.15% 21.06%
Special populations
Individuals with disabilities (ADA )
Individuals with disabilities (ESEA /IDEA )
Economically disadvantaged students
Single parents
Displaced homemakers
Limited English proficient students
Migrant students
Students in nontraditional programs
NP
11.24%
20.78%
21.05%
>95.00%
<10.00%
25.00%
NP
NP
84.28%
85.43%
80.00%
>95.00%
82.28%
80.00%
>95.00%
NP
<10.00%
NE
>95.00%
>95.00%
>95.00%
NE
91.76%
NP
14.66%
23.41%
39.29%
>95.00%
11.76%
<10.00%
NP
NP NP NP NP
NP 88.83% 88.94% 14.83%
22.56% 87.75% 89.26% 23.07%
28.95% 74.36% 75.68% 32.56%
>95.00% >95.00% >95.00% >95.00%
<10.00% 93.75% NE 11.27%
25.00% 80.00% 83.33% <10.00%
NP 90.79% 93.11% NP Tech prep NP NP NP NP NP NE NP NP NOTE: This table contains the results for students whom the state has identified as concentrators or participants (participants are only indicated by the state under the nontraditional participation core indicator) in career and technical education (CTE). See Appendix A, Table A-1 for the state’s definition of CTE concentrators and Table A-2 for the state’s definition of CTE participants. Definitions for special populations are provided in the Glossary of Terms in this report. Actual performance data above 95 percent and below 10 percent have been masked to protect student confidentiality. NE—state reported no enrollment; NP—data not provided; PNO—state reported program not offered; NA—data not applicable ADA—Americans with Disabilities Act; ESEA—Elementary and Secondary Education Act of 1965, as amended; IDEA—Individuals with Disabilities Education Act

APPENDIX B. INDIVIDUAL STATE PERFORMANCE PROFILES, PY 2010–11 | 167
Maine Secondary Level—continued
Core indicators
Academic attainment: Reading/
language arts Academic attainment:
Mathematics T echnical skill
attainment School
completion Student
graduation rates Placement Nontraditional participation
Nontraditional completion
Gender
Male
Female
28.51%
26.52%
88.56%
92.57%
>95.00%
>95.00%
<10.00%
49.81%
26.52% 90.69% 91.62% <10.00%
31.47% 92.47% 94.84% 54.37%
Race/ethnicity
American Indian or Alaska Native
Asian
Black or African American
Hispanic or Latino Native Hawaiian or Other Pacific Islander White
Two or more races
17.39%
28.95%
13.98%
29.82%
NP
28.23%
12.50%
86.36%
84.62%
75.76%
89.66%
>95.00%
90.62%
78.95%
>95.00%
>95.00%
>95.00%
>95.00%
>95.00%
>95.00%
>95.00%
25.00%
17.65%
22.45%
38.24%
NE
20.78%
23.08%
34.78% 90.91% 89.47% 26.32%
18.92% 94.87% 90.91% 25.00%
16.13% 87.00% 86.84% 21.51%
31.58% >95.00% 89.23% 32.35%
NP >95.00% NE 50.00%
28.81% 91.47% 93.09% 20.89%
25.00% 73.68% >95.00% 25.00%

APPENDIX B. INDIVIDUAL STATE PERFORMANCE PROFILES, PY 2010–11 | 168
Maine Postsecondary Level
Core indicators T echnical skill
attainment Credential,
certificate, or degree Student retention
or transfer Student
placement Nontraditional participation
Nontraditional completion
Measurement definitions
Percentage of CTE concentrators who completed a CTE program and received an industry-recognized credential, a certificate, or a degree who passed third-party technical skill assessments, either end of course or end of program, that are aligned with industry-recognized standards, if available and appropriate.
Percentage of CTE concentrators who left postsecondary education and received an industry-recognized credential, a certificate, or a degree and did not transfer to another two- or four-year postsecondary institution.
Percentage of CTE concentrators who were enrolled in postsecondary education in the previous academic year and who remained enrolled in their original institution or transferred to another two- or four-year postsecondary institution (in-state and out-of-state) the following academic year and did not receive an industry-recognized credential, a certificate or degree.
Percentage of CTE concentrators who completed their postsecondary CTE program and received an industry-recognized credential, a certificate or a degree who left postsecondary education; did not transfer to another two- or four-year postsecondary institution; and were placed in employment, or placed in military service or apprenticeship programs in the second quarter following the program year in which they left postsecondary education (i.e., unduplicated placement status for CTE concentrators who graduated by June 30, 2007 would be assessed between Oct. 1, 2007 and Dec. 31, 2007).
Percentage of CTE participants from underrepresented gender groups who participated in a program that leads to employment in nontraditional fields during the reporting year.
Percentage of CTE concentrators from underrepresented gender groups who completed a program that leads to employment in nontraditional fields during the reporting year.
PY 2010–11 Performance levels 84.00% 55.00% 66.00% 88.85% 21.78% 20.43%
PY 2010–11 Results >95.00% 42.47% 73.86% 84.36% 20.52% 19.74%
Special populations
Individuals with disabilities (ADA )
Economically disadvantaged students
Single parents
Displaced homemakers
Limited English proficient students
Students in nontraditional programs
43.86%
42.11%
41.18%
36.84%
12.50%
38.81%
70.00%
83.61%
84.42%
71.43%
75.00%
88.24%
22.81%
20.21%
17.72%
23.81%
16.67%
NP
>95.00% 77.39% 18.03%
>95.00% 75.64% 21.38%
>95.00% 72.57% 25.65%
83.33% 80.49% 33.33%
NE 70.21% 25.35%
92.31% 74.15% NP
T ech prep NP NP NP NP NP NP NOTE: This table contains the results for students whom the state has identified as concentrators or participants (participants are only indicated by the state under the nontraditional participation core indicator) in career and technical education (CTE). See Appendix A, Table A-1 for the state’s definition of CTE concentrators and Table A-2 for the state’s definition of CTE participants. Definitions for special populations are provided in the Glossary of Terms in this report. Actual performance data above 95 percent and below 10 percent have been masked to protect student confidentiality. NE—state reported no enrollment; NP—data not provided; PNO—state reported program not offered; NA—data not applicable ADA—Americans with Disabilities Act

APPENDIX B. INDIVIDUAL STATE PERFORMANCE PROFILES, PY 2010–11 | 169
Maine Postsecondary Level—continued
Core indicators T echnical skill
attainment Credential,
certificate, or degree Student retention
or transfer Student
placement Nontraditional participation
Nontraditional completion
Gender
Male
Female
40.28%
44.68%
79.40%
88.87%
<10.00%
30.22%
>95.00% 72.25% <10.00%
>95.00% 75.42% 34.67%
Race/ethnicity
American Indian or Alaska Native
Asian
Black or African American
Hispanic or Latino Native Hawaiian or Other Pacific Islander White
Two or more races
31.82%
17.39%
40.00%
<10.00%
NE
43.46%
NE
78.57%
>95.00%
90.00%
>95.00%
NE
83.80%
NE
11.11%
20.00%
25.00%
28.57%
NE
19.21%
NE
>95.00% 60.53% 25.00%
>95.00% 70.77% 21.88%
>95.00% 85.15% 15.31%
>95.00% 55.88% 21.74%
NE NE NE
>95.00% 74.05% 20.19%
NE NE >95.00%
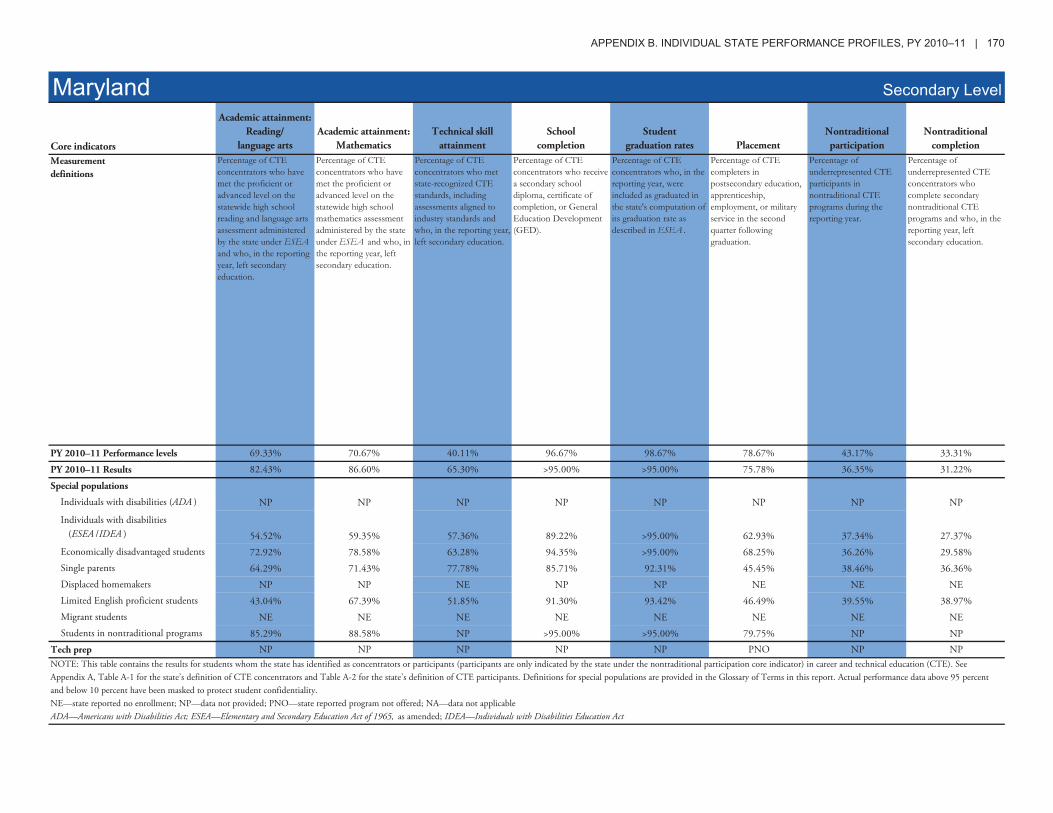
APPENDIX B. INDIVIDUAL STATE PERFORMANCE PROFILES, PY 2010–11 | 170
Maryland Secondary Level
Core indicators
Academic attainment: Reading/
language arts Academic attainment:
Mathematics T echnical skill
attainment School
completion Student
graduation rates Placement Nontraditional participation
Nontraditional completion
Measurement definitions
Percentage of CTE concentrators who have met the proficient or advanced level on the statewide high school reading and language arts assessment administered by the state under ESEA and who, in the reporting year, left secondary education.
Percentage of CTE concentrators who have met the proficient or advanced level on the statewide high school mathematics assessment administered by the state under ESEA and who, in the reporting year, left secondary education.
Percentage of CTE concentrators who met state-recognized CTE standards, including assessments aligned to industry standards and who, in the reporting year, left secondary education.
Percentage of CTE concentrators who receive a secondary school diploma, certificate of completion, or General Education Development (GED).
Percentage of CTE concentrators who, in the reporting year, were included as graduated in the state's computation of its graduation rate as described in ESEA .
Percentage of CTE completers in postsecondary education, apprenticeship, employment, or military service in the second quarter following graduation.
Percentage of underrepresented CTE participants in nontraditional CTE programs during the reporting year.
Percentage of underrepresented CTE concentrators who complete secondary nontraditional CTE programs and who, in the reporting year, left secondary education.
PY 2010–11 Performance levels 69.33% 70.67% 40.11% 96.67% 98.67% 78.67% 43.17% 33.31%
PY 2010–11 Results 82.43% 86.60% 65.30% >95.00% >95.00% 75.78% 36.35% 31.22%
Special populations
Individuals with disabilities (ADA )
Individuals with disabilities (ESEA /IDEA )
Economically disadvantaged students
Single parents
Displaced homemakers
Limited English proficient students
Migrant students
Students in nontraditional programs
NP
59.35%
78.58%
71.43%
NP
67.39%
NE
88.58%
NP
89.22%
94.35%
85.71%
NP
91.30%
NE
>95.00%
NP
62.93%
68.25%
45.45%
NE
46.49%
NE
79.75%
NP
27.37%
29.58%
36.36%
NE
38.97%
NE
NP
NP NP NP NP
54.52% 57.36% >95.00% 37.34%
72.92% 63.28% >95.00% 36.26%
64.29% 77.78% 92.31% 38.46%
NP NE NP NE
43.04% 51.85% 93.42% 39.55%
NE NE NE NE
85.29% NP >95.00% NP Tech prep NP NP NP NP NP PNO NP NP NOTE: This table contains the results for students whom the state has identified as concentrators or participants (participants are only indicated by the state under the nontraditional participation core indicator) in career and technical education (CTE). See Appendix A, Table A-1 for the state’s definition of CTE concentrators and Table A-2 for the state’s definition of CTE participants. Definitions for special populations are provided in the Glossary of Terms in this report. Actual performance data above 95 percent and below 10 percent have been masked to protect student confidentiality. NE—state reported no enrollment; NP—data not provided; PNO—state reported program not offered; NA—data not applicable ADA—Americans with Disabilities Act; ESEA—Elementary and Secondary Education Act of 1965, as amended; IDEA—Individuals with Disabilities Education Act

APPENDIX B. INDIVIDUAL STATE PERFORMANCE PROFILES, PY 2010–11 | 171
Maryland Secondary Level—continued
Core indicators
Academic attainment: Reading/
language arts Academic attainment:
Mathematics T echnical skill
attainment School
completion Student
graduation rates Placement Nontraditional participation
Nontraditional completion
Gender
Male
Female
87.15%
86.04%
>95.00%
>95.00%
72.18%
79.87%
38.54%
23.80%
79.58% 68.04% >95.00% 42.83%
85.31% 63.16% >95.00% 29.38%
Race/ethnicity
American Indian or Alaska Native
Asian
Black or African American
Hispanic or Latino Native Hawaiian or Other Pacific Islander White
Two or more races
85.90%
>95.00%
77.19%
85.86%
60.00%
91.76%
92.92%
>95.00%
>95.00%
93.96%
>95.00%
80.00%
>95.00%
>95.00%
74.29%
83.92%
74.11%
69.27%
42.86%
76.95%
74.10%
23.08%
37.96%
32.20%
33.01%
14.29%
29.68%
31.10%
85.90% 56.25% >95.00% 34.85%
91.43% 74.85% >95.00% 40.93%
74.98% 45.32% >95.00% 38.38%
79.98% 65.30% >95.00% 36.86%
80.00% >95.00% >95.00% 41.18%
86.60% 79.43% >95.00% 34.29%
86.05% 67.96% >95.00% 35.95%
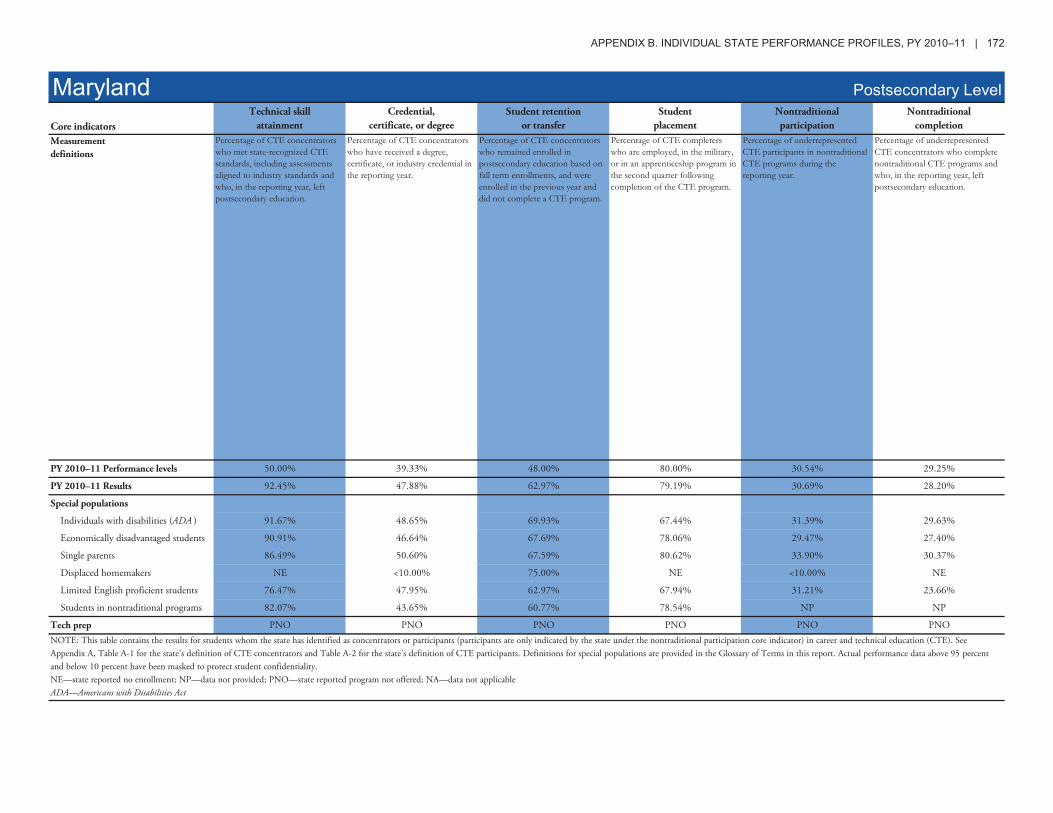
APPENDIX B. INDIVIDUAL STATE PERFORMANCE PROFILES, PY 2010–11 | 172
Maryland Postsecondary Level
Core indicators T echnical skill
attainment Credential,
certificate, or degree Student retention
or transfer Student
placement Nontraditional participation
Nontraditional completion
Measurement definitions
Percentage of CTE concentrators who met state-recognized CTE standards, including assessments aligned to industry standards and who, in the reporting year, left postsecondary education.
Percentage of CTE concentrators who have received a degree, certificate, or industry credential in the reporting year.
Percentage of CTE concentrators who remained enrolled in postsecondary education based on fall term enrollments, and were enrolled in the previous year and did not complete a CTE program.
Percentage of CTE completers who are employed, in the military, or in an apprenticeship program in the second quarter following completion of the CTE program.
Percentage of underrepresented CTE participants in nontraditional CTE programs during the reporting year.
Percentage of underrepresented CTE concentrators who complete nontraditional CTE programs and who, in the reporting year, left postsecondary education.
PY 2010–11 Performance levels 50.00% 39.33% 48.00% 80.00% 30.54% 29.25%
PY 2010–11 Results 92.45% 47.88% 62.97% 79.19% 30.69% 28.20%
Special populations
Individuals with disabilities (ADA )
Economically disadvantaged students
Single parents
Displaced homemakers
Limited English proficient students
Students in nontraditional programs
48.65%
46.64%
50.60%
<10.00%
47.95%
43.65%
67.44%
78.06%
80.62%
NE
67.94%
78.54%
29.63%
27.40%
30.37%
NE
23.66%
NP
91.67% 69.93% 31.39%
90.91% 67.69% 29.47%
86.49% 67.59% 33.90%
NE 75.00% <10.00%
76.47% 62.97% 31.21%
82.07% 60.77% NP
T ech prep PNO PNO PNO PNO PNO PNO NOTE: This table contains the results for students whom the state has identified as concentrators or participants (participants are only indicated by the state under the nontraditional participation core indicator) in career and technical education (CTE). See Appendix A, Table A-1 for the state’s definition of CTE concentrators and Table A-2 for the state’s definition of CTE participants. Definitions for special populations are provided in the Glossary of Terms in this report. Actual performance data above 95 percent and below 10 percent have been masked to protect student confidentiality. NE—state reported no enrollment; NP—data not provided; PNO—state reported program not offered; NA—data not applicable ADA—Americans with Disabilities Act

APPENDIX B. INDIVIDUAL STATE PERFORMANCE PROFILES, PY 2010–11 | 173
Maryland Postsecondary Level—continued
Core indicators T echnical skill
attainment Credential,
certificate, or degree Student retention
or transfer Student
placement Nontraditional participation
Nontraditional completion
Gender
Male
Female
42.69%
50.74%
76.67%
80.29%
36.74%
24.44%
91.82% 59.01% 36.28%
92.72% 65.13% 27.69%
Race/ethnicity
American Indian or Alaska Native
Asian
Black or African American
Hispanic or Latino Native Hawaiian or Other Pacific Islander White
Two or more races
38.18%
46.57%
39.12%
49.02%
42.86%
52.86%
46.72%
66.67%
69.09%
80.60%
71.84%
>95.00%
80.20%
87.50%
31.25%
27.74%
33.15%
26.82%
<10.00%
26.24%
30.77%
>95.00% 55.56% 31.56%
80.95% 60.90% 34.91%
84.82% 61.97% 32.83%
>95.00% 62.51% 29.92%
NE 61.54% 40.24%
94.84% 63.26% 28.18%
>95.00% 66.52% 30.48%

APPENDIX B. INDIVIDUAL STATE PERFORMANCE PROFILES, PY 2010–11 | 174
Massachusetts Secondary Level
Core indicators
Academic attainment: Reading/
language arts Academic attainment:
Mathematics T echnical skill
attainment School
completion Student
graduation rates Placement Nontraditional participation
Nontraditional completion
Measurement definitions
Percentage of CTE concentrators who have met the proficient or advanced level on the statewide high school reading and language arts assessment administered by the state under ESEA and who, in the reporting year, left secondary education.
Percentage of CTE concentrators who have met the proficient or advanced level on the statewide high school mathematics assessment administered by the state under ESEA and who, in the reporting year, left secondary education.
Percentage of CTE concentrators who were reported during the reporting year as receiving a state-recognized Chapter 74 certificate issued by a school district to a student enrolled in a specific state-approved vocational technical education program, known as a Chapter 74-approved vocational technical education program or another industry-recognized credential issued by a recognized private organization or other state, or federal government department, agency, or board.
Percentage of CTE concentrators who earned a regular secondary school diploma, earned a General Education Development (GED) credential as a state-recognized equivalent to a regular high school diploma (if offered by the state) or other state-recognized equivalent (including recognized alternative standards for individuals with disabilities), or earned a proficiency credential, certificate, or degree, in conjunction with a secondary school diploma (if offered by the state) during the reporting year.
Percentage of CTE concentrators who, in the reporting year, were included as graduated in the state's computation of its graduation rate as described in ESEA .
Percentage of CTE concentrators who left secondary education and were in postsecondary education or advanced training including registered apprenticeships, in the military service, or employment 9-12 months after they left secondary education (unduplicated placement status).
Percentage of CTE participants who were in enrolled in a CTE program that prepared them for a career that would be nontraditional for their gender during the reporting year.
Percentage of CTE concentrators who completed CTE programs that prepared them for careers that are nontraditional for their gender during the reporting year.
PY 2010–11 Performance levels 48.25% 43.06% 72.51% 91.48% 86.00% 96.64% 12.40% 11.83%
PY 2010–11 Results 73.51% 67.58% 75.33% >95.00% 89.23% >95.00% 21.70% 19.92%
Special populations
Individuals with disabilities (ADA )
Individuals with disabilities (ESEA /IDEA )
Economically disadvantaged students
Single parents
Displaced homemakers
Limited English proficient students
Migrant students
Students in nontraditional programs
NP
37.08%
58.67%
47.95%
NP
28.57%
<10.00%
65.60%
NP
90.61%
92.63%
76.32%
NP
77.21%
<10.00%
>95.00%
NP
89.81%
93.22%
88.89%
PNO
91.28%
NE
94.98%
NP
17.17%
23.15%
24.00%
NP
18.59%
NE
NP
NP NP NP NP
37.08% 78.34% 81.97% 18.48%
65.54% 72.83% 84.39% 24.05%
54.79% 74.63% 68.18% 29.08%
NP NP NP NP
10.29% 54.26% 74.61% 22.09%
<10.00% <10.00% >95.00% 50.00%
74.06% 74.22% 87.17% NP Tech prep 73.28% 67.40% 75.33% >95.00% 90.82% >95.00% 21.28% 19.89% NOTE: This table contains the results for students whom the state has identified as concentrators or participants (participants are only indicated by the state under the nontraditional participation core indicator) in career and technical education (CTE). See Appendix A, Table A-1 for the state’s definition of CTE concentrators and Table A-2 for the state’s definition of CTE participants. Definitions for special populations are provided in the Glossary of Terms in this report. Actual performance data above 95 percent and below 10 percent have been masked to protect student confidentiality. NE—state reported no enrollment; NP—data not provided; PNO—state reported program not offered; NA—data not applicable ADA—Americans with Disabilities Act; ESEA—Elementary and Secondary Education Act of 1965, as amended; IDEA—Individuals with Disabilities Education Act

APPENDIX B. INDIVIDUAL STATE PERFORMANCE PROFILES, PY 2010–11 | 175
Massachusetts Secondary Level—continued
Core indicators
Academic attainment: Reading/
language arts Academic attainment:
Mathematics T echnical skill
attainment School
completion Student
graduation rates Placement Nontraditional participation
Nontraditional completion
Gender
Male
Female
70.58%
63.68%
>95.00%
>95.00%
94.84%
>95.00%
11.19%
23.09%
71.22% 74.03% 88.70% 13.79%
76.48% 77.05% 89.96% 24.68%
Race/ethnicity
American Indian or Alaska Native
Asian
Black or African American
Hispanic or Latino Native Hawaiian or Other Pacific Islander White
Two or more races
50.00%
73.54%
54.18%
51.93%
50.00%
72.74%
68.58%
91.89%
92.92%
92.69%
90.28%
90.91%
>95.00%
93.13%
83.33%
94.27%
93.14%
94.08%
75.00%
>95.00%
>95.00%
34.48%
16.91%
22.27%
20.79%
30.00%
19.37%
25.71%
63.89% 70.97% 91.11% 27.50%
68.99% 65.76% 91.05% 22.32%
63.29% 57.11% 82.94% 23.61%
58.99% 69.47% 79.61% 23.74%
70.00% >95.00% 73.33% 23.53%
78.40% 79.26% 92.54% 20.73%
75.88% 75.92% 90.98% 25.88%

APPENDIX B. INDIVIDUAL STATE PERFORMANCE PROFILES, PY 2010–11 | 176
Massachusetts Postsecondary Level
Core indicators T echnical skill
attainment Credential,
certificate, or degree Student retention
or transfer Student
placement Nontraditional participation
Nontraditional completion
Measurement definitions
Percentage of technical credit courses completed by CTE concentrators during the fall semester of the reporting year.
Percentage of CTE concentrators enrolled in a fall semester who four years after a given fall term (fall to fall of fourth year out) received a degree, a certificate, or an industry-recognized credential.
Percentage of CTE concentrators enrolled in a fall semester who four years after a given fall term (fall to fall of fourth year out) received a degree, a certificate, or an industry-recognized credential; transferred, or were still pursuing their education (i.e. still enrolled).
Percentage of CTE program graduates who completed a CTE program one year prior to the reporting year and who entered military service or employment including registered apprenticeship programs within 9-12 months after completion.
Percentage of CTE participants enrolled in a CTE program that prepared them for a career that would be nontraditional for their gender during the reporting year.
Percentage of CTE participants and concentrators enrolled in a given fall term in a CTE program that prepared them for a career that would be nontraditional for their gender who four years after a given fall term (fall to fall of fourth year out) received a degree, a certificate, or an industry-recognized credential.
PY 2010–11 Performance levels 81.37% 53.31% 58.00% 80.00% 17.96% 18.68%
PY 2010–11 Results 81.58% 56.48% 71.25% 74.80% 24.76% 22.47%
Special populations
Individuals with disabilities (ADA )
Economically disadvantaged students
Single parents
Displaced homemakers
Limited English proficient students
Students in nontraditional programs
54.44%
55.31%
50.62%
56.80%
52.39%
60.60%
68.86%
71.53%
81.48%
64.00%
76.14%
77.14%
23.54%
28.17%
26.53%
31.90%
27.59%
NP
78.94% 68.26% 23.04%
80.38% 69.61% 26.55%
80.01% 67.26% 24.61%
81.41% 78.70% 24.13%
84.22% 70.15% 28.99%
83.48% 74.19% NP
T ech prep 79.60% 55.68% 70.54% 73.70% 19.63% 23.41% NOTE: This table contains the results for students whom the state has identified as concentrators or participants (participants are only indicated by the state under the nontraditional participation core indicator) in career and technical education (CTE). See Appendix A, Table A-1 for the state’s definition of CTE concentrators and Table A-2 for the state’s definition of CTE participants. Definitions for special populations are provided in the Glossary of Terms in this report. Actual performance data above 95 percent and below 10 percent have been masked to protect student confidentiality. NE—state reported no enrollment; NP—data not provided; PNO—state reported program not offered; NA—data not applicable ADA—Americans with Disabilities Act

APPENDIX B. INDIVIDUAL STATE PERFORMANCE PROFILES, PY 2010–11 | 177
Massachusetts Postsecondary Level—continued
Core indicators T echnical skill
attainment Credential,
certificate, or degree Student retention
or transfer Student
placement Nontraditional participation
Nontraditional completion
Gender
Male
Female
55.22%
57.22%
63.89%
81.89%
15.06%
27.64%
79.85% 67.70% 14.14%
82.83% 73.33% 33.86%
Race/ethnicity
American Indian or Alaska Native
Asian
Black or African American
Hispanic or Latino Native Hawaiian or Other Pacific Islander White
Two or more races
50.00%
59.08%
48.73%
47.93%
NE
58.97%
21.62%
44.00%
67.36%
80.13%
82.42%
NE
74.88%
75.00%
25.00%
30.18%
32.84%
30.62%
38.46%
19.58%
15.38%
78.37% 67.21% 23.60%
83.96% 72.82% 29.83%
79.69% 67.28% 30.82%
78.32% 67.18% 30.15%
79.88% NE 32.81%
82.38% 72.47% 21.88%
79.41% 51.35% 27.42%

APPENDIX B. INDIVIDUAL STATE PERFORMANCE PROFILES, PY 2010–11 | 178
Michigan Secondary Level
Core indicators
Academic attainment: Reading/
language arts Academic attainment:
Mathematics T echnical skill
attainment School
completion Student
graduation rates Placement Nontraditional participation
Nontraditional completion
Measurement definitions
Percentage of CTE concentrators who have met the proficient or advanced level on the statewide high school reading and language arts assessment administered by the state under ESEA and who, in the reporting year, left secondary education.
Percentage of CTE concentrators who have met the proficient or advanced level on the statewide high school mathematics assessment administered by the state under ESEA and who, in the reporting year, left secondary education.
Percentage of CTE concentrators who passed technical skill assessments that are aligned with industry-recognized standards, if available and appropriate, during the reporting year.
Percentage of CTE concentrators who earned a regular secondary school diploma, earned a General Education Development (GED) credential or earned a state-recognized equivalent, during the reporting year.
Percentage of CTE concentrators who, in the reporting year, were included as graduated in the state's computation of its graduation rate as described in ESEA .
Percentage of grade 11 and grade 12 CTE completers who left secondary education and were placed in postsecondary education or advanced training, in the military service, or employment in the third quarter following the program year in which they left secondary education.
Percentage of CTE participants from underrepresented gender groups who participated in a program that leads to employment in nontraditional fields during the reporting year.
Percentage of CTE participants from underrepresented gender groups, who completed a program that leads to employment in nontraditional fields prior to leaving secondary education and who left school in the reporting year.
PY 2010–11 Performance levels 48.00% 46.00% 35.05% 83.00% 80.00% 95.04% 25.00% 21.20%
PY 2010–11 Results 66.33% 51.00% 54.35% 94.39% 94.29% 94.36% 23.50% 28.35%
Special populations
Individuals with disabilities (ADA )
Individuals with disabilities (ESEA /IDEA )
Economically disadvantaged students
Single parents
Displaced homemakers
Limited English proficient students
Migrant students
Students in nontraditional programs
NP
14.57%
36.90%
39.06%
50.00%
16.81%
<10.00%
42.85%
NP
88.84%
15.06%
92.45%
NE
93.55%
89.47%
94.00%
NP
86.25%
90.79%
85.29%
NE
91.74%
>95.00%
91.65%
NP
32.08%
27.12%
42.86%
NE
30.36%
NE
NP
NP NP NP NP
27.66% 25.06% 88.92% 16.57%
54.82% 43.62% 90.81% 26.29%
58.46% 33.33% 90.48% 23.68%
50.00% NE NE <10.00%
26.72% 17.52% >95.00% 16.39%
50.00% 66.67% >95.00% 23.08%
64.54% 70.59% 94.23% NP Tech prep 66.59% 51.95% 59.18% >95.00% 94.80% 94.74% 18.98% 56.94% NOTE: This table contains the results for students whom the state has identified as concentrators or participants (participants are only indicated by the state under the nontraditional participation core indicator) in career and technical education (CTE). See Appendix A, Table A-1 for the state’s definition of CTE concentrators and Table A-2 for the state’s definition of CTE participants. Definitions for special populations are provided in the Glossary of Terms in this report. Actual performance data above 95 percent and below 10 percent have been masked to protect student confidentiality. NE—state reported no enrollment; NP—data not provided; PNO—state reported program not offered; NA—data not applicable ADA—Americans with Disabilities Act; ESEA—Elementary and Secondary Education Act of 1965, as amended; IDEA—Individuals with Disabilities Education Act

APPENDIX B. INDIVIDUAL STATE PERFORMANCE PROFILES, PY 2010–11 | 179
Michigan Secondary Level—continued
Core indicators
Academic attainment: Reading/
language arts Academic attainment:
Mathematics T echnical skill
attainment School
completion Student
graduation rates Placement Nontraditional participation
Nontraditional completion
Gender
Male
Female
55.85%
45.98%
92.84%
>95.00%
93.87%
94.84%
44.83%
28.03%
64.78% 56.96% 92.88% <10.00%
67.94% 53.20% >95.00% 76.18%
Race/ethnicity
American Indian or Alaska Native
Asian
Black or African American
Hispanic or Latino Native Hawaiian or Other Pacific Islander White
Two or more races
49.33%
<10.00%
20.43%
34.77%
NE
55.74%
46.50%
94.98%
>95.00%
91.50%
91.21%
>95.00%
94.91%
94.48%
90.67%
>95.00%
94.34%
91.18%
>95.00%
94.44%
93.42%
16.00%
28.07%
24.18%
28.65%
<10.00%
29.42%
22.22%
66.37% 57.83% 93.84% 25.93%
<10.00% 47.52% >95.00% 23.24%
44.97% 35.18% 91.52% 31.73%
55.14% 42.75% 92.28% 25.77%
NE 50.00% >95.00% 17.50%
69.61% 58.57% 94.76% 22.24%
66.67% 47.62% 93.09% 26.61%

APPENDIX B. INDIVIDUAL STATE PERFORMANCE PROFILES, PY 2010–11 | 180
Michigan Postsecondary Level
Core indicators T echnical skill
attainment Credential,
certificate, or degree Student retention
or transfer Student
placement Nontraditional participation
Nontraditional completion
Measurement definitions
Percentage of CTE concentrators who passed gold standard assessments that were available during the reporting year.
Percentage of CTE concentrators who received an award , certificate, or credential.
Percentage of CTE concentrators who remained enrolled in their original postsecondary institution or transferred to another two- or four-year postsecondary institution during the reporting year and who were enrolled in postsecondary education any time during the previous reporting year.
Percentage of CTE concentrators identified as leavers who responded to the survey and indicated that they were employed, in the military, or in an apprenticeship program.
Percentage of female CTE participants in programs considered nontraditional for women and of male CTE participants in programs considered nontraditional for men.
Percentage of female CTE concentrators who received an award in a program considered nontraditional for women of male CTE concentrators who received an award in a program considered nontraditional for men.
PY 2010–11 Performance levels 91.50% 27.73% 65.55% 62.27% 23.60% 20.60%
PY 2010–11 Results 90.81% 26.93% 67.44% 80.59% 24.69% 20.73%
Special populations
Individuals with disabilities (ADA )
Economically disadvantaged students
Single parents
Displaced homemakers
Limited English proficient students
Students in nontraditional programs
42.00%
28.25%
42.39%
50.41%
26.79%
39.36%
>95.00%
79.92%
81.08%
71.43%
66.67%
85.80%
31.97%
31.90%
19.23%
13.21%
36.11%
NP
90.43% 76.95% 24.54%
91.59% 67.46% 26.59%
94.21% 76.28% 32.17%
>95.00% 78.17% 18.83%
72.00% 81.73% 26.93%
89.46% 69.20% NP
T ech prep 73.47% 20.91% 64.94% 53.85% 21.83% 26.44% NOTE: This table contains the results for students whom the state has identified as concentrators or participants (participants are only indicated by the state under the nontraditional participation core indicator) in career and technical education (CTE). See Appendix A, Table A-1 for the state’s definition of CTE concentrators and Table A-2 for the state’s definition of CTE participants. Definitions for special populations are provided in the Glossary of Terms in this report. Actual performance data above 95 percent and below 10 percent have been masked to protect student confidentiality. NE—state reported no enrollment; NP—data not provided; PNO—state reported program not offered; NA—data not applicable ADA—Americans with Disabilities Act

APPENDIX B. INDIVIDUAL STATE PERFORMANCE PROFILES, PY 2010–11 | 181
Michigan Postsecondary Level—continued
Core indicators T echnical skill
attainment Credential,
certificate, or degree Student retention
or transfer Student
placement Nontraditional participation
Nontraditional completion
Gender
Male
Female
21.47%
31.22%
80.06%
81.01%
19.40%
21.55%
88.36% 65.16% 16.00%
92.12% 69.24% 32.59%
Race/ethnicity
American Indian or Alaska Native
Asian
Black or African American
Hispanic or Latino Native Hawaiian or Other Pacific Islander White
Two or more races
13.62%
30.07%
18.65%
26.65%
45.71%
30.27%
17.49%
55.81%
79.37%
64.71%
82.20%
>95.00%
82.72%
73.91%
29.19%
24.46%
29.92%
21.21%
22.58%
18.98%
16.67%
86.30% 63.63% 28.15%
84.54% 75.37% 27.66%
78.87% 67.60% 30.99%
89.66% 65.22% 24.19%
80.00% 74.14% 19.05%
92.09% 67.13% 22.36%
80.00% 65.60% 27.71%

APPENDIX B. INDIVIDUAL STATE PERFORMANCE PROFILES, PY 2010–11 | 182
Minnesota Secondary Level
Core indicators
Academic attainment: Reading/
language arts Academic attainment:
Mathematics T echnical skill
attainment School
completion Student
graduation rates Placement Nontraditional participation
Nontraditional completion
Measurement definitions
Percentage of CTE concentrators who have met the proficient or advanced level on the statewide high school reading and language arts assessment administered by the state under ESEA and who, in the reporting year, left secondary education.
Percentage of CTE concentrators who have met the proficient or advanced level on the statewide high school mathematics assessment administered by the state under ESEA and who, in the reporting year, left secondary education.
Percentage of secondary CTE concentrators within programs of study selected by the state for which state-approved technical skill assessment instruments have been identified who attain a passing score on any of those identified technical skill assessment instruments pertinent to the program of study in which concentrator status is obtained.
Percentage of CTE concentrators who earned a regular secondary school diploma during the reporting year.
Percentage of CTE concentrators who, in the reporting year, were included as graduated in the state's computation of its graduation rate as described in ESEA .
Percentage of secondary CTE completers who register as participating in higher education in a data match through the Minnesota Office of Higher Education.
Percentage of CTE participants from underrepresented gender groups who participated in a program that leads to employment in nontraditional fields during the reporting year.
Percentage of CTE concentrators from underrepresented gender groups who completed a program that leads to employment in nontraditional fields during the reporting year.
PY 2010–11 Performance levels 70.00% 48.00% 90.00% 76.67% 83.00% 90.00% 39.50% 36.50%
PY 2010–11 Results 72.52% 37.02% 45.48% >95.00% >95.00% 48.02% 26.65% 11.36%
Special populations
Individuals with disabilities (ADA )
Individuals with disabilities (ESEA /IDEA )
Economically disadvantaged students
Single parents
Displaced homemakers
Limited English proficient students
Migrant students
Students in nontraditional programs
NP
14.55%
23.57%
<10.00%
NP
19.79%
15.79%
40.29%
NP
>95.00%
>95.00%
91.14%
>95.00%
>95.00%
94.83%
>95.00%
NP
34.66%
40.89%
39.08%
25.00%
45.56%
36.07%
49.11%
NP
<10.00%
12.34%
28.57%
NP
<10.00%
<10.00%
NP
NP NP NP NP
34.95% 27.80% >95.00% 20.05%
58.23% 39.51% 94.97% 27.04%
35.94% 75.00% 86.00% 35.77%
NP NP 80.00% 25.00%
39.01% 64.86% >95.00% 26.72%
54.55% NP >95.00% 21.31%
75.52% 47.22% >95.00% NP Tech prep NP NP NP NP NP PNO NP NP NOTE: This table contains the results for students whom the state has identified as concentrators or participants (participants are only indicated by the state under the nontraditional participation core indicator) in career and technical education (CTE). See Appendix A, Table A-1 for the state’s definition of CTE concentrators and Table A-2 for the state’s definition of CTE participants. Definitions for special populations are provided in the Glossary of Terms in this report. Actual performance data above 95 percent and below 10 percent have been masked to protect student confidentiality. NE—state reported no enrollment; NP—data not provided; PNO—state reported program not offered; NA—data not applicable ADA—Americans with Disabilities Act; ESEA—Elementary and Secondary Education Act of 1965, as amended; IDEA—Individuals with Disabilities Education Act

APPENDIX B. INDIVIDUAL STATE PERFORMANCE PROFILES, PY 2010–11 | 183
Minnesota Secondary Level—continued
Core indicators
Academic attainment: Reading/
language arts Academic attainment:
Mathematics T echnical skill
attainment School
completion Student
graduation rates Placement Nontraditional participation
Nontraditional completion
Gender
Male
Female
40.42%
32.10%
>95.00%
>95.00%
45.36%
51.61%
<10.00%
55.05%
72.81% 39.98% >95.00% 14.31%
72.10% 52.21% >95.00% 58.24%
Race/ethnicity
American Indian or Alaska Native
Asian
Black or African American
Hispanic or Latino Native Hawaiian or Other Pacific Islander White
Two or more races
17.24%
36.84%
15.05%
17.93%
NP
39.80%
23.16%
90.32%
>95.00%
>95.00%
>95.00%
>95.00%
>95.00%
>95.00%
40.74%
39.16%
51.89%
32.23%
NP
49.16%
NP
<10.00%
<10.00%
14.08%
12.40%
NP
11.31%
16.32%
54.60% 14.29% NP 30.13%
60.33% 40.82% NP 28.89%
48.59% 43.56% NP 29.64%
53.97% 56.52% NP 28.44%
57.14% NP NP 42.03%
76.09% 46.23% NP 26.12%
65.31% <10.00% NP 32.29%

APPENDIX B. INDIVIDUAL STATE PERFORMANCE PROFILES, PY 2010–11 | 184
Minnesota Postsecondary Level
Core indicators T echnical skill
attainment Credential,
certificate, or degree Student retention
or transfer Student
placement Nontraditional participation
Nontraditional completion
Measurement definitions
Percentage of CTE concentrators who passed technical skill assessments that are aligned with industry-recognized standards, if available and appropriate, during the reporting year.
Percentage of CTE concentrators in a given student entry cohort who, anytime in the cohort time frame, received a CTE certificate, diploma, Associate of Applied Science (AAS) or an Associate of Science (AS) and were designated as such at the time of the reporting year.
Percentage of CTE concentrators in a given student entry cohort who, in the last year of the cohort time frame, were still intending to complete their program in the declared award, or have transferred to a two-year college or four-year university and were designated as such at the time of the reporting year.
Percentage of CTE completers who achieved that status anytime during the cohort time frame, and were designated as such at the time of the reporting year, and, who were placed or retained in employment, or placed in military service or apprenticeship programs in the second quarter following the program year in which they left postsecondary education (i.e., unduplicated placement status for CTE concentrators who graduated by June 30, 2007 would be assessed between Oct. 1, 2007 and Dec. 31, 2007).
Percentage of CTE participants in a given student entry cohort who, anytime in the cohort time frame, were classified as enrolling in a CTE program classified as nontraditional for their gender and that was underrepresented for their gender and were designated as such at the time of the reporting year.
Percentage of CTE completers in a given student entry cohort who, anytime in the cohort time frame, were classified as enrolling in a CTE program classified as nontraditional for their gender and that was underrepresented for their gender and were designated as such at the time of the reporting year.
PY 2010–11 Performance levels 73.33% 50.00% 29.00% 79.00% 17.40% 13.00%
PY 2010–11 Results 86.90% 46.35% 31.72% 82.19% 18.39% 13.61%
Special populations
Individuals with disabilities (ADA )
Economically disadvantaged students
Single parents
Displaced homemakers
Limited English proficient students
Students in nontraditional programs
36.63%
41.81%
36.34%
39.24%
27.84%
43.43%
73.65%
78.83%
75.69%
71.32%
53.69%
75.62%
12.20%
13.51%
14.08%
14.55%
24.29%
NP
NP 39.35% 18.63%
NP 35.76% 19.01%
NP 41.84% 22.12%
NP 41.63% 20.92%
NP 51.49% 25.31%
NP 35.81% NP
T ech prep PNO PNO PNO PNO PNO PNO NOTE: This table contains the results for students whom the state has identified as concentrators or participants (participants are only indicated by the state under the nontraditional participation core indicator) in career and technical education (CTE). See Appendix A, Table A-1 for the state’s definition of CTE concentrators and Table A-2 for the state’s definition of CTE participants. Definitions for special populations are provided in the Glossary of Terms in this report. Actual performance data above 95 percent and below 10 percent have been masked to protect student confidentiality. NE—state reported no enrollment; NP—data not provided; PNO—state reported program not offered; NA—data not applicable ADA—Americans with Disabilities Act

APPENDIX B. INDIVIDUAL STATE PERFORMANCE PROFILES, PY 2010–11 | 185
Minnesota Postsecondary Level—continued
Core indicators T echnical skill
attainment Credential,
certificate, or degree Student retention
or transfer Student
placement Nontraditional participation
Nontraditional completion
Gender
Male
Female
44.08%
48.55%
83.75%
80.84%
11.92%
15.18%
87.77% 29.89% 12.19%
86.63% 33.50% 24.83%
Race/ethnicity
American Indian or Alaska Native
Asian
Black or African American
Hispanic or Latino Native Hawaiian or Other Pacific Islander White
Two or more races
46.33%
38.60%
32.02%
42.06%
36.36%
48.59%
39.57%
61.84%
63.11%
56.79%
65.27%
42.86%
85.59%
75.07%
<10.00%
17.86%
22.91%
17.38%
<10.00%
12.68%
13.86%
NP 27.98% 18.75%
NP 40.16% 22.68%
NP 46.38% 25.82%
NP 34.91% 20.35%
NP 50.00% 19.23%
NP 29.62% 16.64%
NP 36.42% 21.96%

APPENDIX B. INDIVIDUAL STATE PERFORMANCE PROFILES, PY 2010–11 | 186
Mississippi Secondary Level
Core indicators
Academic attainment: Reading/
language arts Academic attainment:
Mathematics T echnical skill
attainment School
completion Student
graduation rates Placement Nontraditional participation
Nontraditional completion
Measurement definitions
Percentage of concentrators who have met the proficient or advanced level on the statewide high school reading and language arts assessment administered by the state under ESEA and who, in the reporting year, left secondary education.
Percentage of concentrators who have met the proficient or advanced level on the statewide high school mathematics assessment administered by the state under ESEA and who, in the reporting year, left secondary education.
Percentage of concentrators who passed technical skill assessments that are aligned with industry-recognized standards, if available and appropriate, during the reporting year.
Percentage of concentrators who completed both years of a two year program reported as graduated using the state's approved calculation for graduation rate as defined in the state's ESEA accountability workbook.
Percentage of concentrators who completed both years of a two year program reported as graduated using the state's approved calculation for graduation rate as defined in the state's ESEA accountability workbook.
Percentage of students placed in military, advanced education, or employment.
Percentage of CTE participants from underrepresented gender groups who participated in a program that leads to employment in nontraditional fields during the reporting year.
Percentage of CTE concentrators from underrepresented gender groups who completed a program that leads to employment in nontraditional fields during the reporting year.
PY 2010–11 Performance levels 40.00% 60.00% 64.00% 68.00% 68.00% 90.20% 16.80% 14.80%
PY 2010–11 Results 53.41% 74.16% 57.05% >95.00% 93.84% 88.44% 22.43% 22.41%
Special populations
Individuals with disabilities (ADA )
Individuals with disabilities (ESEA /IDEA )
Economically disadvantaged students
Single parents
Displaced homemakers
Limited English proficient students
Migrant students
Students in nontraditional programs
NP
35.39%
71.29%
70.95%
>95.00%
81.48%
>95.00%
74.01%
NP
>95.00%
>95.00%
>95.00%
>95.00%
>95.00%
>95.00%
>95.00%
NP
84.18%
87.53%
84.09%
>95.00%
>95.00%
>95.00%
89.27%
22.10%
NP
21.20%
68.35%
14.29%
16.67%
<10.00%
NP
NP NP NP NP
12.28% 23.90% 77.12% 22.27%
47.18% 50.69% 92.75% 21.24%
41.71% 47.66% 89.80% 25.12%
75.00% 57.14% >95.00% 14.29%
42.86% 48.28% 93.33% 16.67%
62.50% 62.50% >95.00% <10.00%
55.99% 51.46% >95.00% NP T ech prep 51.73% 71.81% 56.80% >95.00% 94.21% 85.79% 19.81% 20.00% NOTE: This table contains the results for students whom the state has identified as concentrators or participants (participants are only indicated by the state under the nontraditional participation core indicator) in career and technical education (CTE). See Appendix A, Table A-1 for the state’s definition of CTE concentrators and Table A-2 for the state’s definition of CTE participants. Definitions for special populations are provided in the Glossary of Terms in this report. Actual performance data above 95 percent and below 10 percent have been masked to protect student confidentiality. NE—state reported no enrollment; NP—data not provided; PNO—state reported program not offered; NA—data not applicable ADA—Americans with Disabilities Act; ESEA—Elementary and Secondary Education Act of 1965, as amended; IDEA—Individuals with Disabilities Education Act

APPENDIX B. INDIVIDUAL STATE PERFORMANCE PROFILES, PY 2010–11 | 187
Mississippi Secondary Level—continued
Core indicators
Academic attainment: Reading/
language arts Academic attainment:
Mathematics T echnical skill
attainment School
completion Student
graduation rates Placement Nontraditional participation
Nontraditional completion
Gender
Male
Female
73.20%
75.04%
>95.00%
>95.00%
87.43%
89.32%
14.36%
30.13%
50.45% 51.42% 92.07% 14.44%
56.16% 62.39% >95.00% 30.17%
Race/ethnicity
American Indian or Alaska Native
Asian
Black or African American
Hispanic or Latino Native Hawaiian or Other Pacific Islander White
Two or more races
55.56%
93.22%
67.56%
82.95%
>95.00%
81.46%
NE
>95.00%
>95.00%
>95.00%
>95.00%
NE
>95.00%
NE
>95.00%
>95.00%
84.03%
88.64%
NE
92.85%
NE
30.00%
29.09%
22.75%
23.91%
>95.00%
21.80%
NE
37.50% 54.55% >95.00% 30.00%
67.80% 77.05% 93.94% 28.57%
41.65% 42.99% 90.84% 22.78%
61.54% 55.91% >95.00% 23.91%
>95.00% NE NE >95.00%
66.77% 73.34% >95.00% 21.82%
NE NE NE NE
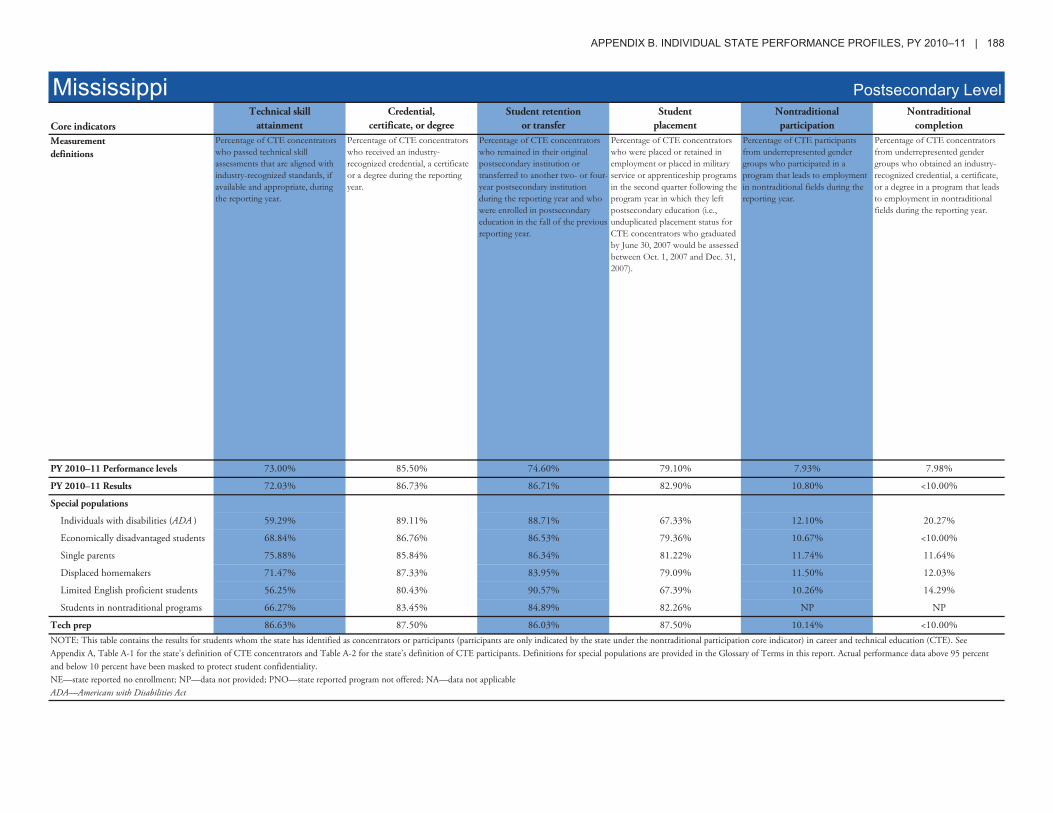
APPENDIX B. INDIVIDUAL STATE PERFORMANCE PROFILES, PY 2010–11 | 188
Mississippi Postsecondary Level
Core indicators T echnical skill
attainment Credential,
certificate, or degree Student retention
or transfer Student
placement Nontraditional participation
Nontraditional completion
Measurement definitions
Percentage of CTE concentrators who passed technical skill assessments that are aligned with industry-recognized standards, if available and appropriate, during the reporting year.
Percentage of CTE concentrators who received an industry-recognized credential, a certificate or a degree during the reporting year.
Percentage of CTE concentrators who remained in their original postsecondary institution or transferred to another two- or four-year postsecondary institution during the reporting year and who were enrolled in postsecondary education in the fall of the previous reporting year.
Percentage of CTE concentrators who were placed or retained in employment or placed in military service or apprenticeship programs in the second quarter following the program year in which they left postsecondary education (i.e., unduplicated placement status for CTE concentrators who graduated by June 30, 2007 would be assessed between Oct. 1, 2007 and Dec. 31, 2007).
Percentage of CTE participants from underrepresented gender groups who participated in a program that leads to employment in nontraditional fields during the reporting year.
Percentage of CTE concentrators from underrepresented gender groups who obtained an industry-recognized credential, a certificate, or a degree in a program that leads to employment in nontraditional fields during the reporting year.
PY 2010–11 Performance levels 73.00% 85.50% 74.60% 79.10% 7.93% 7.98%
PY 2010–11 Results 72.03% 86.73% 86.71% 82.90% 10.80% <10.00%
Special populations
Individuals with disabilities (ADA )
Economically disadvantaged students
Single parents
Displaced homemakers
Limited English proficient students
Students in nontraditional programs
89.11%
86.76%
85.84%
87.33%
80.43%
83.45%
67.33%
79.36%
81.22%
79.09%
67.39%
82.26%
20.27%
<10.00%
11.64%
12.03%
14.29%
NP
59.29% 88.71% 12.10%
68.84% 86.53% 10.67%
75.88% 86.34% 11.74%
71.47% 83.95% 11.50%
56.25% 90.57% 10.26%
66.27% 84.89% NP
T ech prep 86.63% 87.50% 86.03% 87.50% 10.14% <10.00% NOTE: This table contains the results for students whom the state has identified as concentrators or participants (participants are only indicated by the state under the nontraditional participation core indicator) in career and technical education (CTE). See Appendix A, Table A-1 for the state’s definition of CTE concentrators and Table A-2 for the state’s definition of CTE participants. Definitions for special populations are provided in the Glossary of Terms in this report. Actual performance data above 95 percent and below 10 percent have been masked to protect student confidentiality. NE—state reported no enrollment; NP—data not provided; PNO—state reported program not offered; NA—data not applicable ADA—Americans with Disabilities Act

APPENDIX B. INDIVIDUAL STATE PERFORMANCE PROFILES, PY 2010–11 | 189
Mississippi Postsecondary Level—continued
Core indicators T echnical skill
attainment Credential,
certificate, or degree Student retention
or transfer Student
placement Nontraditional participation
Nontraditional completion
Gender
Male
Female
84.16%
88.86%
83.67%
82.26%
<10.00%
<10.00%
64.88% 85.02% <10.00%
78.59% 88.24% 12.86%
Race/ethnicity
American Indian or Alaska Native
Asian
Black or African American
Hispanic or Latino Native Hawaiian or Other Pacific Islander White
Two or more races
72.09%
86.84%
84.53%
86.84%
50.00%
88.75%
>95.00%
65.12%
84.21%
78.32%
76.32%
>95.00%
86.77%
75.00%
17.24%
17.86%
<10.00%
11.54%
<10.00%
<10.00%
<10.00%
67.65% 78.85% <10.00%
82.86% 90.38% 10.59%
59.44% 83.09% 11.29%
69.23% 91.67% 12.61%
NE >95.00% <10.00%
81.61% 89.16% 10.39%
55.56% >95.00% <10.00%

APPENDIX B. INDIVIDUAL STATE PERFORMANCE PROFILES, PY 2010–11 | 190
Missouri Secondary Level
Core indicators
Academic attainment: Reading/
language arts Academic attainment:
Mathematics T echnical skill
attainment School
completion Student
graduation rates Placement Nontraditional participation
Nontraditional completion
Measurement definitions
Percentage of CTE concentrators who score either proficient or advanced on the communication arts assessment and whose scores were included in the state's adequate yearly progress (AYP) computation and left secondary education during the reporting year.
Percentage of CTE concentrators who score either proficient or advanced on the mathematics assessment and whose scores were included in the state's AYP computation and left secondary education during the reporting year.
Percentage of CTE concentrators who passed technical skill assessments that are aligned with industry-recognized standards.
Percentage of CTE concentrators who earned a high school diploma or General Education Development (GED) during the reporting year.
Percentage of CTE concentrators who graduate during the reporting year.
Percentage of CTE concentrators who graduated or received a GED and were placed in postsecondary or advanced training, in the military or employment in the second quarter following the program year.
Percentage of CTE participants from underrepresented gender groups enrolled in nontraditional career education programs. The student must have earned one or more credits in a nontraditional career education program.
Percentage of CTE concentrators from the underrepresented gender groups who completed and graduated from a nontraditional program.
PY 2010–11 Performance levels 75.50% 72.50% 62.00% 97.50% 86.00% 94.00% 22.25% 21.25%
PY 2010–11 Results 68.56% 41.71% 67.14% >95.00% >95.00% 93.01% 27.90% 20.13%
Special populations
Individuals with disabilities (ADA )
Individuals with disabilities (ESEA /IDEA )
Economically disadvantaged students
Single parents
Displaced homemakers
Limited English proficient students
Migrant students
Students in nontraditional programs
NP
14.84%
30.90%
23.38%
50.00%
<10.00%
10.00%
42.33%
NP
>95.00%
>95.00%
>95.00%
>95.00%
>95.00%
>95.00%
>95.00%
NP
84.62%
89.44%
83.42%
85.71%
88.75%
>95.00%
92.23%
NP
13.42%
19.31%
22.14%
<10.00%
12.70%
12.50%
NP
NP NP NP NP
24.10% 49.42% 93.85% 26.23%
59.08% 60.13% 94.23% 27.99%
56.69% 74.23% 89.77% 21.23%
83.33% 75.00% >95.00% <10.00%
33.98% 25.42% 89.92% 27.06%
10.00% 37.50% >95.00% 19.61%
74.56% 67.80% >95.00% NP Tech prep 62.72% 37.09% 69.41% >95.00% >95.00% 93.27% 16.93% 13.94% NOTE: This table contains the results for students whom the state has identified as concentrators or participants (participants are only indicated by the state under the nontraditional participation core indicator) in career and technical education (CTE). See Appendix A, Table A-1 for the state’s definition of CTE concentrators and Table A-2 for the state’s definition of CTE participants. Definitions for special populations are provided in the Glossary of Terms in this report. Actual performance data above 95 percent and below 10 percent have been masked to protect student confidentiality. NE—state reported no enrollment; NP—data not provided; PNO—state reported program not offered; NA—data not applicable ADA—Americans with Disabilities Act; ESEA—Elementary and Secondary Education Act of 1965, as amended; IDEA—Individuals with Disabilities Education Act

APPENDIX B. INDIVIDUAL STATE PERFORMANCE PROFILES, PY 2010–11 | 191
Missouri Secondary Level—continued
Core indicators
Academic attainment: Reading/
language arts Academic attainment:
Mathematics T echnical skill
attainment School
completion Student
graduation rates Placement Nontraditional participation
Nontraditional completion
Gender
Male
Female
44.46%
38.56%
>95.00%
>95.00%
93.10%
92.91%
<10.00%
34.07%
63.38% 64.68% 94.38% 27.18%
74.55% 69.90% >95.00% 28.57%
Race/ethnicity
American Indian or Alaska Native
Asian
Black or African American
Hispanic or Latino Native Hawaiian or Other Pacific Islander White
Two or more races
45.45%
52.38%
20.28%
33.79%
40.00%
45.07%
43.43%
>95.00%
>95.00%
>95.00%
>95.00%
>95.00%
>95.00%
>95.00%
83.72%
92.99%
89.88%
93.49%
NE
93.54%
NE
26.32%
23.64%
20.92%
21.14%
20.00%
19.90%
21.18%
73.91% 44.44% 93.42% 28.60%
68.89% 59.48% 94.33% 29.32%
54.03% 52.31% >95.00% 29.85%
62.78% 56.85% 93.97% 29.50%
50.00% <10.00% >95.00% 22.86%
70.86% 69.93% >95.00% 27.50%
72.73% 72.06% >95.00% 26.84%

APPENDIX B. INDIVIDUAL STATE PERFORMANCE PROFILES, PY 2010–11 | 192
Missouri Postsecondary Level
Core indicators T echnical skill
attainment Credential,
certificate, or degree Student retention
or transfer Student
placement Nontraditional participation
Nontraditional completion
Measurement definitions
Percentage of CTE concentrators who passed technical skill assessments aligned with industry-recognized standards.
Percentage of CTE concentrators who received an industry-recognized credential or certificate, a one-year or two-year program certificate, or a degree during the reporting year.
Percentage of CTE concentrators who remained enrolled in their original postsecondary institution or transferred to another two- or four-year postsecondary institution during the reporting year and who were enrolled in postsecondary education in the fall of the previous reporting year.
Percentage of CTE concentrators who were placed or retained in employment, or placed in military service or apprenticeship programs in the second quarter following the program year in which they left postsecondary education.
Percentage of CTE participants from underrepresented gender groups enrolled in nontraditional career education programs. The student must have earned one or more credits in a nontraditional career education program.
Percentage of CTE concentrators from underrepresented gender groups who completed a program that leads to employment in nontraditional fields during the reporting year.
PY 2010–11 Performance levels 71.50% 86.50% 70.50% 65.50% 22.25% 12.75%
PY 2010–11 Results 87.17% 85.53% >95.00% 69.24% 24.48% 16.68%
Special populations
Individuals with disabilities (ADA )
Economically disadvantaged students
Single parents
Displaced homemakers
Limited English proficient students
Students in nontraditional programs
84.88%
85.64%
>95.00%
>95.00%
>95.00%
84.22%
61.69%
66.11%
72.35%
71.43%
61.76%
64.34%
19.44%
15.78%
<10.00%
<10.00%
20.48%
NP
85.14% >95.00% 24.59%
87.29% >95.00% 23.58%
86.72% >95.00% 23.42%
>95.00% >95.00% 26.79%
88.89% >95.00% 21.07%
81.10% >95.00% NP
T ech prep 79.35% 70.83% 91.88% 76.39% 22.72% 15.50% NOTE: This table contains the results for students whom the state has identified as concentrators or participants (participants are only indicated by the state under the nontraditional participation core indicator) in career and technical education (CTE). See Appendix A, Table A-1 for the state’s definition of CTE concentrators and Table A-2 for the state’s definition of CTE participants. Definitions for special populations are provided in the Glossary of Terms in this report. Actual performance data above 95 percent and below 10 percent have been masked to protect student confidentiality. NE—state reported no enrollment; NP—data not provided; PNO—state reported program not offered; NA—data not applicable ADA—Americans with Disabilities Act

APPENDIX B. INDIVIDUAL STATE PERFORMANCE PROFILES, PY 2010–11 | 193
Missouri Postsecondary Level—continued
Core indicators T echnical skill
attainment Credential,
certificate, or degree Student retention
or transfer Student
placement Nontraditional participation
Nontraditional completion
Gender
Male
Female
80.97%
88.70%
68.90%
69.45%
20.09%
14.53%
84.53% >95.00% 20.39%
88.96% >95.00% 27.35%
Race/ethnicity
American Indian or Alaska Native
Asian
Black or African American
Hispanic or Latino Native Hawaiian or Other Pacific Islander White
Two or more races
87.88%
94.12%
89.86%
82.86%
83.33%
84.88%
84.09%
64.29%
53.97%
53.96%
67.86%
75.00%
71.64%
20.00%
13.64%
17.07%
19.22%
23.53%
50.00%
15.53%
33.33%
85.00% >95.00% 26.29%
82.35% >95.00% 28.32%
84.29% >95.00% 26.50%
88.89% >95.00% 25.60%
>95.00% 92.31% 23.53%
87.13% >95.00% 23.86%
90.48% >95.00% 31.17%

APPENDIX B. INDIVIDUAL STATE PERFORMANCE PROFILES, PY 2010–11 | 194
Missouri Adult Level
Core indicators T echnical skill
attainment Credential,
certificate, or degree Student retention
or transfer Student
placement Nontraditional participation
Nontraditional completion
Measurement definitions
Percentage of CTE concentrators who passed technical skill assessments aligned with industry-recognized standards.
Percentage of CTE concentrators who received an industry-recognized credential or certificate, a one-year or two-year program certificate, or a degree during the reporting year.
Percentage of CTE concentrators who remained enrolled in their original postsecondary institution or transferred to another two- or four-year postsecondary institution during the reporting year and who were enrolled in postsecondary education in the fall of the previous reporting year.
Percentage of CTE concentrators who were placed or retained in employment, or placed in military service or apprenticeship programs in the second quarter following the program year in which they left postsecondary education.
Percentage of CTE participants from underrepresented gender groups enrolled in nontraditional career education programs. The student must have earned one or more credits in a nontraditional career education program.
Percentage of CTE concentrators from underrepresented gender groups who completed a program that leads to employment in nontraditional fields during the reporting year.
PY 2010–11 Performance levels 0.00% 0.00% 0.00% 0.00% 0.00% 0.00%
PY 2010–11 Results 79.53% 88.89% 83.55% 72.71% 13.01% 11.31%
Special populations
Individuals with disabilities (ADA )
Economically disadvantaged students
Single parents
Displaced homemakers
Limited English proficient students
Students in nontraditional programs
>95.00%
89.34%
88.67%
93.88%
>95.00%
86.26%
60.42%
70.55%
66.67%
71.94%
52.78%
>95.00%
<10.00%
<10.00%
<10.00%
<10.00%
33.33%
NP
44.44% 90.00% <10.00%
79.86% 83.45% <10.00%
82.68% 85.47% <10.00%
72.97% 89.29% 10.14%
40.00% >95.00% 26.67%
76.60% 82.76% NP
T ech prep 72.90% 80.80% 64.31% 63.38% <10.00% 10.13% NOTE: This table contains the results for students whom the state has identified as concentrators or participants (participants are only indicated by the state under the nontraditional participation core indicator) in career and technical education (CTE). See Appendix A, Table A-1 for the state’s definition of CTE concentrators and Table A-2 for the state’s definition of CTE participants. Definitions for special populations are provided in the Glossary of Terms in this report. Actual performance data above 95 percent and below 10 percent have been masked to protect student confidentiality. NE—state reported no enrollment; NP—data not provided; PNO—state reported program not offered; NA—data not applicable ADA—Americans with Disabilities Act

APPENDIX B. INDIVIDUAL STATE PERFORMANCE PROFILES, PY 2010–11 | 195
Missouri Adult Level—continued
Core indicators T echnical skill
attainment Credential,
certificate, or degree Student retention
or transfer Student
placement Nontraditional participation
Nontraditional completion
Gender
Male
Female
90.47%
88.26%
66.83%
76.08%
30.90%
<10.00%
76.69% 80.54% 41.11%
80.73% 84.34% <10.00%
Race/ethnicity
American Indian or Alaska Native
Asian
Black or African American
Hispanic or Latino Native Hawaiian or Other Pacific Islander White
Two or more races
78.57%
66.67%
83.33%
88.46%
66.67%
89.83%
50.00%
58.33%
50.00%
74.60%
62.50%
<10.00%
73.08%
NE
<10.00%
66.67%
11.32%
14.29%
<10.00%
11.28%
<10.00%
77.78% 57.14% <10.00%
75.00% 60.00% 20.00%
92.31% 80.00% 10.08%
84.21% 75.00% <10.00%
50.00% 66.67% 25.00%
78.46% 84.69% 13.47%
>95.00% 25.00% <10.00%

APPENDIX B. INDIVIDUAL STATE PERFORMANCE PROFILES, PY 2010–11 | 196
Montana Secondary Level
Core indicators
Academic attainment: Reading/
language arts Academic attainment:
Mathematics T echnical skill
attainment School
completion Student
graduation rates Placement Nontraditional participation
Nontraditional completion
Measurement definitions
Percentage of CTE concentrators who have met the proficient or advanced level on the statewide high school reading and language arts assessment administered by the state under ESEA and who, in the reporting year, left secondary education.
Percentage of CTE concentrators who have met the proficient or advanced level on the statewide high school mathematics assessment administered by the state under ESEA and who, in the reporting year, left secondary education.
Percentage of CTE concentrators who passed technical skill assessments that are aligned with industry-recognized standards, if available and appropriate, during the reporting year.
Percentage of CTE concentrators who earned a regular secondary school diploma, earned a General Education Development (GED) credential as a state-recognized equivalent to a regular high school diploma (if offered by the state), or other state-recognized equivalent (including recognized alternative standards for individuals with disabilities), or earned a proficiency credential, certificate, or degree, in conjunction with a secondary school diploma (if offered by the state) during the reporting year.
Percentage of CTE concentrators who, in the reporting year, were included as graduated in the state's computation of its graduation rate as described in ESEA .
Percentage of CTE concentrators who left secondary education and were placed in postsecondary education or advanced training, in the military service, or employment in the second quarter following the program year in which they left secondary education (i.e. unduplicated placement status for CTE investors who graduated by June 30, 2007 would be assessed between Oct. 1, 2007 and Dec. 31, 2007).
Percentage of CTE participants from underrepresented gender groups who participated in a program that leads to employment in nontraditional fields during the reporting year.
Percentage of CTE concentrators from underrepresented gender groups who completed a program that leads to employment in nontraditional fields during the reporting year.
PY 2010–11 Performance levels 83.00% 68.00% 82.00% 82.00% 82.00% 86.00% 15.50% 15.50%
PY 2010–11 Results 78.48% 54.79% 76.65% >95.00% >95.00% >95.00% 22.57% 12.86%
Special populations
Individuals with disabilities (ADA )
Individuals with disabilities (ESEA /IDEA )
Economically disadvantaged students
Single parents
Displaced homemakers
Limited English proficient students
Migrant students
Students in nontraditional programs
NP
16.92%
41.87%
32.56%
NP
<10.00%
33.33%
55.60%
NP
>95.00%
>95.00%
91.38%
NP
94.92%
>95.00%
>95.00%
NP
>95.00%
>95.00%
>95.00%
NE
>95.00%
>95.00%
>95.00%
NP
10.27%
12.93%
20.69%
NP
<10.00%
<10.00%
NP
NP NP NP NP
30.45% 75.00% >95.00% 10.27%
70.47% 64.44% 94.54% 12.93%
67.44% NE 82.46% 20.69%
NP NP NP NP
11.54% <10.00% 88.14% <10.00%
66.67% NE >95.00% <10.00%
75.68% 70.59% >95.00% NP Tech prep 85.71% 66.67% NE >95.00% >95.00% >95.00% 14.29% 14.29% NOTE: This table contains the results for students whom the state has identified as concentrators or participants (participants are only indicated by the state under the nontraditional participation core indicator) in career and technical education (CTE). See Appendix A, Table A-1 for the state’s definition of CTE concentrators and Table A-2 for the state’s definition of CTE participants. Definitions for special populations are provided in the Glossary of Terms in this report. Actual performance data above 95 percent and below 10 percent have been masked to protect student confidentiality. NE—state reported no enrollment; NP—data not provided; PNO—state reported program not offered; NA—data not applicable ADA—Americans with Disabilities Act; ESEA—Elementary and Secondary Education Act of 1965, as amended; IDEA—Individuals with Disabilities Education Act

APPENDIX B. INDIVIDUAL STATE PERFORMANCE PROFILES, PY 2010–11 | 197
Montana Secondary Level—continued
Core indicators
Academic attainment: Reading/
language arts Academic attainment:
Mathematics T echnical skill
attainment School
completion Student
graduation rates Placement Nontraditional participation
Nontraditional completion
Gender
Male
Female
55.76%
53.39%
>95.00%
>95.00%
>95.00%
>95.00%
<10.00%
25.33%
74.26% 73.53% >95.00% 23.05%
84.54% 82.76% >95.00% 21.81%
Race/ethnicity
American Indian or Alaska Native
Asian
Black or African American
Hispanic or Latino Native Hawaiian or Other Pacific Islander White
Two or more races
31.16%
45.83%
51.52%
44.66%
33.33%
57.70%
41.46%
>95.00%
>95.00%
>95.00%
>95.00%
>95.00%
>95.00%
>95.00%
NA*
NA*
NA*
NA*
NA*
NA*
NA*
15.31%
13.33%
14.29%
<10.00%
40.00%
12.71%
11.11%
61.93% 42.86% 92.16% 15.31%
80.00% >95.00% >95.00% 13.33%
87.88% NE 92.86% 14.29%
78.85% 83.33% >95.00% <10.00%
50.00% NE >95.00% 40.00%
80.19% 77.27% >95.00% 12.71%
70.73% >95.00% >95.00% 11.11% NA*—The state was unable to collect and report race/ethnicity data for this particular cell in accordance with the required 1997 race/ethnicity categories. While the state did report data using the 1977 race/ethnicity categories, we are only reporting data provided by the states according to the 1997 race/ethnicity categories described in the Department’s Oct. 19, 2007, memorandum titled “Final Guidance on Maintaining, Collecting, and Reporting Racial and Ethnic Data” (see 72 Federal Register 59266).

APPENDIX B. INDIVIDUAL STATE PERFORMANCE PROFILES, PY 2010–11 | 198
Montana Postsecondary Level
Core indicators T echnical skill
attainment Credential,
certificate, or degree Student retention
or transfer Student
placement Nontraditional participation
Nontraditional completion
Measurement definitions
Percentage of CTE concentrators who passed technical skill assessments that are aligned with industry-recognized standards, if available and appropriate, during the reporting year.
Percentage of CTE concentrators who received an industry-recognized credential or certificate, a one-year or two-year program certificate, or a degree during the reporting year.
Percentage of CTE concentrators who remained enrolled in their original postsecondary institution or transferred to another two- or four-year postsecondary institution during the reporting year and who were enrolled in postsecondary education in the fall of the previous reporting year and who did not earn and were not eligible to earn an industry-recognized credential, a certificate, or a degree in that year.
Percentage of CTE concentrators who completed or were eligible to complete a CTE program and were placed or retained in employment, or placed in military service or apprenticeship programs in the second quarter following the program year in which they left postsecondary education (i.e., unduplicated placement status for CTE concentrators who graduated by June 30, 2008 would be assessed between Oct. 1, 2008 and Dec. 31, 2008).
Percentage of CTE participants from underrepresented gender groups who participated in a CTE program that leads to employment in nontraditional fields during the reporting year.
Percentage of CTE concentrators from underrepresented gender groups who completed or were eligible to complete a CTE program that leads to employment in nontraditional fields during the reporting year.
PY 2010–11 Performance levels 52.00% 53.00% 62.00% 75.00% 13.50% 12.50%
PY 2010–11 Results 86.34% 49.71% 70.99% 74.45% 16.36% 12.28%
Special populations
Individuals with disabilities (ADA )
Economically disadvantaged students
Single parents
Displaced homemakers
Limited English proficient students
Students in nontraditional programs
40.88%
51.75%
44.22%
54.87%
38.46%
41.38%
69.14%
73.83%
68.37%
56.76%
55.56%
83.20%
16.36%
13.11%
19.61%
11.36%
36.36%
NP
72.37% 70.34% 19.51%
85.51% 73.84% 16.87%
84.51% 69.09% 19.58%
79.17% 75.93% 16.85%
33.33% 71.43% 25.00%
87.21% 69.89% NP
T ech prep NE 66.67% 68.75% >95.00% <10.00% NE NOTE: This table contains the results for students whom the state has identified as concentrators or participants (participants are only indicated by the state under the nontraditional participation core indicator) in career and technical education (CTE). See Appendix A, Table A-1 for the state’s definition of CTE concentrators and Table A-2 for the state’s definition of CTE participants. Definitions for special populations are provided in the Glossary of Terms in this report. Actual performance data above 95 percent and below 10 percent have been masked to protect student confidentiality. NE—state reported no enrollment; NP—data not provided; PNO—state reported program not offered; NA—data not applicable ADA—Americans with Disabilities Act

APPENDIX B. INDIVIDUAL STATE PERFORMANCE PROFILES, PY 2010–11 | 199
Montana Postsecondary Level—continued
Core indicators T echnical skill
attainment Credential,
certificate, or degree Student retention
or transfer Student
placement Nontraditional participation
Nontraditional completion
Gender
Male
Female
45.27%
54.29%
71.46%
76.55%
10.62%
13.81%
80.27% 66.53% <10.00%
90.78% 75.13% 23.21%
Race/ethnicity
American Indian or Alaska Native
Asian
Black or African American
Hispanic or Latino Native Hawaiian or Other Pacific Islander White
Two or more races
25.40%
46.43%
<10.00%
36.73%
NE
55.78%
NE
56.90%
80.00%
40.00%
68.18%
NE
77.60%
NE
14.62%
18.18%
>95.00%
<10.00%
NE
12.82%
NE
72.97% 54.33% 16.77%
>95.00% 72.00% 25.40%
66.67% 65.38% 31.25%
82.35% 68.69% <10.00%
NE NE NE
87.41% 74.80% 15.97%
NE NE NE

APPENDIX B. INDIVIDUAL STATE PERFORMANCE PROFILES, PY 2010–11 | 200
Nebraska Secondary Level
Core indicators
Academic attainment: Reading/
language arts Academic attainment:
Mathematics T echnical skill
attainment School
completion Student
graduation rates Placement Nontraditional participation
Nontraditional completion
Measurement definitions
Percentage of CTE concentrators who have met the proficient or advanced level on the statewide high school reading and language arts assessment administered by the state under ESEA and who, in the reporting year, left secondary education.
Percentage of CTE concentrators who have met the proficient or advanced level on the statewide high school mathematics assessment administered by the state under ESEA and who, in the reporting year, left secondary education.
Percentage of CTE concentrators who passed technical skill assessments that are aligned with industry-recognized standards, if available and appropriate, during the reporting year.
Percentage of CTE concentrators who earned a regular secondary school diploma, earned a General Education Development (GED) credential as a state-recognized equivalent to a regular high school diploma (if offered by the state) or other state-recognized equivalent (including recognized alternative standards for individuals with disabilities), or earned a proficiency credential, certificate, or degree, in conjunction with a secondary school diploma (if offered by the state) during the reporting year.
Percentage of CTE concentrators who, in the reporting year, were included as graduated in the state's computation of its graduation rate as described in ESEA .
Percentage of CTE concentrators who left secondary education and were placed in postsecondary education or advanced training, in the military service, or employment in the second quarter following the program year in which they left secondary education (i.e., unduplicated placement status for CTE concentrators who graduated by June 30, 2007 would be assessed between Oct. 1, 2007 and Dec. 31, 2007).
Percentage of CTE participants from underrepresented gender groups who participated in a program that leads to employment in nontraditional fields during the reporting year.
Percentage of CTE concentrators from underrepresented gender groups who completed a program that leads to employment in nontraditional fields during the reporting year.
PY 2010–11 Performance levels 68.00% 41.00% 54.00% 83.00% 84.70% 74.50% 10.75% 13.25%
PY 2010–11 Results 70.29% 92.96% 83.86% >95.00% >95.00% >95.00% 43.73% 27.03%
Special populations
Individuals with disabilities (ADA )
Individuals with disabilities (ESEA /IDEA )
Economically disadvantaged students
Single parents
Displaced homemakers
Limited English proficient students
Migrant students
Students in nontraditional programs
NP
75.29%
90.29%
91.04%
NP
84.06%
77.78%
92.53%
NP
>95.00%
>95.00%
93.55%
NP
94.12%
>95.00%
>95.00%
NP
>95.00%
93.66%
87.10%
NP
91.14%
88.24%
>95.00%
NP
24.78%
27.48%
29.23%
NP
24.39%
42.11%
NP
NP NP NP NP
27.66% 76.18% >95.00% 43.51%
57.79% 77.18% >95.00% 44.50%
38.67% 74.19% 90.59% 37.33%
NP NP NP NP
<10.00% 63.73% 94.74% 48.71%
26.32% 64.00% 95.00% 45.23%
72.75% 83.72% >95.00% NP Tech prep NP NP NP NP NP PNO NP NP NOTE: This table contains the results for students whom the state has identified as concentrators or participants (participants are only indicated by the state under the nontraditional participation core indicator) in career and technical education (CTE). See Appendix A, Table A-1 for the state’s definition of CTE concentrators and Table A-2 for the state’s definition of CTE participants. Definitions for special populations are provided in the Glossary of Terms in this report. Actual performance data above 95 percent and below 10 percent have been masked to protect student confidentiality. NE—state reported no enrollment; NP—data not provided; PNO—state reported program not offered; NA—data not applicable ADA—Americans with Disabilities Act; ESEA—Elementary and Secondary Education Act of 1965, as amended; IDEA—Individuals with Disabilities Education Act

APPENDIX B. INDIVIDUAL STATE PERFORMANCE PROFILES, PY 2010–11 | 201
Nebraska Secondary Level—continued
Core indicators
Academic attainment: Reading/
language arts Academic attainment:
Mathematics T echnical skill
attainment School
completion Student
graduation rates Placement Nontraditional participation
Nontraditional completion
Gender
Male
Female
92.64%
93.36%
>95.00%
>95.00%
>95.00%
>95.00%
13.97%
48.20%
67.70% 82.55% >95.00% 39.41%
73.67% 85.59% >95.00% 49.07%
Race/ethnicity
American Indian or Alaska Native
Asian
Black or African American
Hispanic or Latino Native Hawaiian or Other Pacific Islander White
Two or more races
82.54%
93.62%
92.21%
90.67%
75.00%
93.34%
>95.00%
>95.00%
>95.00%
>95.00%
>95.00%
>95.00%
>95.00%
>95.00%
85.71%
>95.00%
91.11%
92.54%
NE
>95.00%
NE
30.65%
40.00%
33.08%
25.04%
14.29%
26.72%
27.07%
49.35% 76.19% NA* 46.15%
75.73% 91.07% NA* 44.39%
45.73% 71.70% NA* 45.25%
53.94% 77.55% NA* 45.82%
66.67% 88.89% NA* 42.65%
73.87% 85.56% NA* 43.11%
68.60% 79.89% NA* 42.68% NA*—The state was unable to collect and report race/ethnicity data for this particular cell in accordance with the required 1997 race/ethnicity categories. While the state did report data using the 1977 race/ethnicity categories, we are only reporting data provided by the states according to the 1997 race/ethnicity categories described in the Department’s Oct. 19, 2007, memorandum titled “Final Guidance on Maintaining, Collecting, and Reporting Racial and Ethnic Data” (see 72 Federal Register 59266).

APPENDIX B. INDIVIDUAL STATE PERFORMANCE PROFILES, PY 2010–11 | 202
Nebraska Postsecondary Level
Core indicators T echnical skill
attainment Credential,
certificate, or degree Student retention
or transfer Student
placement Nontraditional participation
Nontraditional completion
Measurement definitions
Percentage of CTE concentrators who passed technical skill assessments that are aligned with industry-recognized standards, if available and appropriate, during the reporting year.
Percentage of CTE concentrators who received an industry-recognized credential, a certificate, or a degree during the reporting year.
Percentage of CTE concentrators who remained enrolled in their original postsecondary institution or transferred to another two- or four-year postsecondary institution during the reporting year and who were enrolled in postsecondary education in the fall of the previous reporting year.
Percentage of CTE concentrators who were placed or retained in employment, or placed in military service or apprenticeship programs in the second quarter following the program year in which they left postsecondary education (i.e., unduplicated placement status for CTE concentrators who graduated by June 30, 2007 would be assessed between Oct. 1, 2007 and Dec. 31, 2007).
Percentage of CTE participants from underrepresented gender groups who participated in a program that leads to employment in nontraditional fields during the reporting year.
Percentage of CTE concentrators from underrepresented gender groups who completed a program that leads to employment in nontraditional fields during the reporting year.
PY 2010–11 Performance levels 62.50% 27.75% 38.25% 62.00% 10.25% 9.50%
PY 2010–11 Results 86.47% 50.57% 68.26% 74.24% 16.17% 14.16%
Special populations
Individuals with disabilities (ADA )
Economically disadvantaged students
Single parents
Displaced homemakers
Limited English proficient students
Students in nontraditional programs
28.08%
50.42%
56.11%
37.21%
23.40%
41.47%
50.31%
72.01%
73.00%
NE
46.67%
74.21%
12.98%
16.19%
16.28%
16.67%
19.44%
NP
77.87% 67.40% 38.01%
87.19% 67.19% 17.97%
87.99% 68.16% 18.45%
70.00% 30.77% 12.50%
81.64% 25.00% 39.91%
85.93% 62.84% NP
T ech prep PNO PNO PNO PNO 26.15% 11.50% NOTE: This table contains the results for students whom the state has identified as concentrators or participants (participants are only indicated by the state under the nontraditional participation core indicator) in career and technical education (CTE). See Appendix A, Table A-1 for the state’s definition of CTE concentrators and Table A-2 for the state’s definition of CTE participants. Definitions for special populations are provided in the Glossary of Terms in this report. Actual performance data above 95 percent and below 10 percent have been masked to protect student confidentiality. NE—state reported no enrollment; NP—data not provided; PNO—state reported program not offered; NA—data not applicable ADA—Americans with Disabilities Act
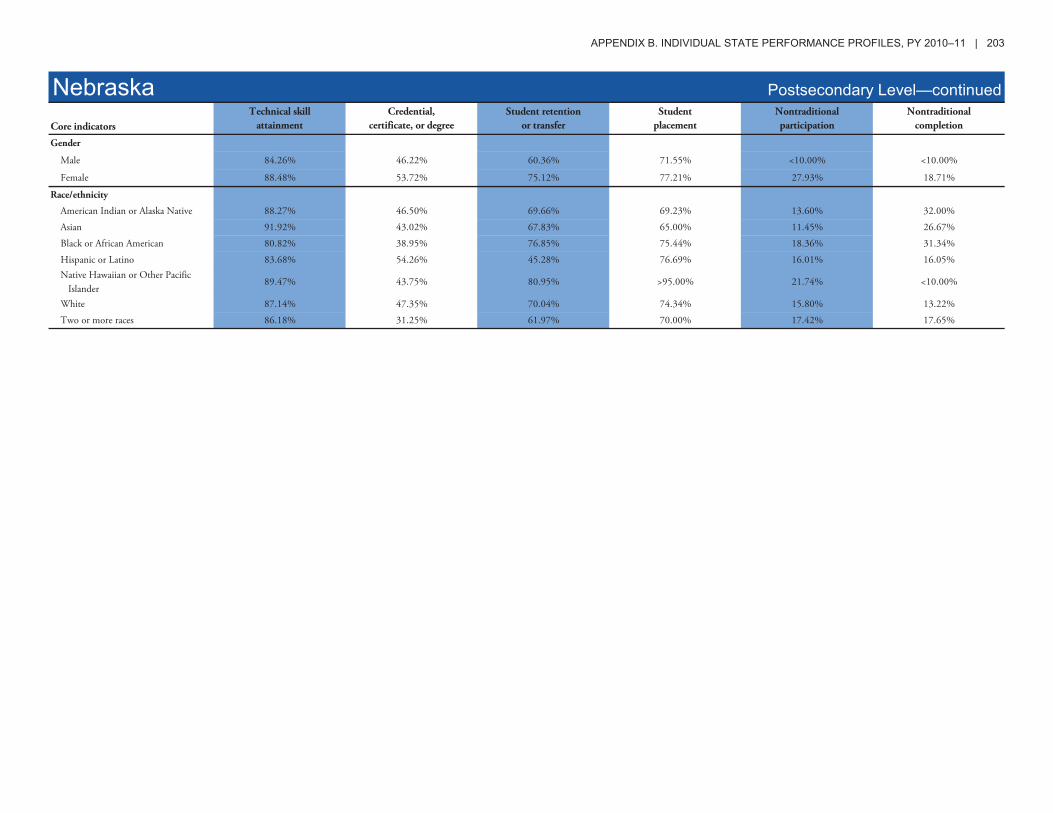
APPENDIX B. INDIVIDUAL STATE PERFORMANCE PROFILES, PY 2010–11 | 203
Nebraska Postsecondary Level—continued
Core indicators T echnical skill
attainment Credential,
certificate, or degree Student retention
or transfer Student
placement Nontraditional participation
Nontraditional completion
Gender
Male
Female
46.22%
53.72%
71.55%
77.21%
<10.00%
18.71%
84.26% 60.36% <10.00%
88.48% 75.12% 27.93%
Race/ethnicity
American Indian or Alaska Native
Asian
Black or African American
Hispanic or Latino Native Hawaiian or Other Pacific Islander White
Two or more races
46.50%
43.02%
38.95%
54.26%
43.75%
47.35%
31.25%
69.23%
65.00%
75.44%
76.69%
>95.00%
74.34%
70.00%
32.00%
26.67%
31.34%
16.05%
<10.00%
13.22%
17.65%
88.27% 69.66% 13.60%
91.92% 67.83% 11.45%
80.82% 76.85% 18.36%
83.68% 45.28% 16.01%
89.47% 80.95% 21.74%
87.14% 70.04% 15.80%
86.18% 61.97% 17.42%

APPENDIX B. INDIVIDUAL STATE PERFORMANCE PROFILES, PY 2010–11 | 204
Nevada Secondary Level
Core indicators
Academic attainment: Reading/
language arts Academic attainment:
Mathematics T echnical skill
attainment School
completion Student
graduation rates Placement Nontraditional participation
Nontraditional completion
Measurement definitions
Percentage of eligible CTE concentrators who have met the proficient or advanced level on the statewide high school reading and language arts assessments administered by the state under ESEA .
Percentage of eligible CTE concentrators who have met the proficient or advanced level on the statewide high school mathematics assessment administered by the state under ESEA .
Percentage of CTE concentrators completing a CTE program and receiving a certificate who have demonstrated at least 80 percent of the competencies of the certificate skills as recognized by the state during the reporting year.
Percentage of senior CTE concentrators completing a CTE program who earn an advanced, standard, or adult diploma, earn a General Education Development (GED) through a secondary program run by the secondary local education agency (LEA), earn an adjusted high school diploma, or earn a high school diploma with a CTE endorsement during the reporting year.
Percentage of CTE concentrators completing a CTE program who, in the reporting year, were included as graduated in the state's computation of its graduation rate as described in ESEA .
Percentage of CTE concentrators completing a CTE program who graduated and were placed in postsecondary education or advanced training, in the military service, or employment in the second quarter following the program year in which they left secondary education.
Percentage of CTE participants from underrepresented gender groups who enrolled in courses from a program that leads to employment in nontraditional fields during the reporting year.
Percentage of CTE concentrators from underrepresented gender groups who completed a program that leads to employment in nontraditional fields during the reporting year.
PY 2010–11 Performance levels 83.33% 56.00% 79.50% 90.00% 62.00% 93.25% 24.00% 19.45%
PY 2010–11 Results >95.00% 80.31% 80.44% 90.97% 68.48% >95.00% 37.68% 27.60%
Special populations
Individuals with disabilities (ADA )
Individuals with disabilities (ESEA /IDEA )
Economically disadvantaged students
Single parents
Displaced homemakers
Limited English proficient students
Migrant students
Students in nontraditional programs
NP
67.62%
72.15%
>95.00%
NE
41.99%
NE
80.63%
NP
88.10%
88.94%
>95.00%
NP
68.29%
NE
90.03%
NP
>95.00%
>95.00%
>95.00%
NE
>95.00%
PNO
>95.00%
NP
16.45%
27.14%
50.00%
NE
25.88%
NP
NP
NP NP NP NP
90.95% 75.35% 46.21% 30.52%
>95.00% 79.14% 64.53% 37.67%
>95.00% >95.00% >95.00% 43.75%
NE NE NE NE
78.85% 71.36% 36.59% 35.66%
NE >95.00% NE 54.55%
>95.00% 79.53% 71.05% NP T ech prep >95.00% 80.43% 80.05% 90.69% 69.01% >95.00% 37.50% 28.42% NOTE: This table contains the results for students whom the state has identified as concentrators or participants (participants are only indicated by the state under the nontraditional participation core indicator) in career and technical education (CTE). See Appendix A, Table A-1 for the state’s definition of CTE concentrators and Table A-2 for the state’s definition of CTE participants. Definitions for special populations are provided in the Glossary of Terms in this report. Actual performance data above 95 percent and below 10 percent have been masked to protect student confidentiality. NE—state reported no enrollment; NP—data not provided; PNO—state reported program not offered; NA—data not applicable ADA—Americans with Disabilities Act; ESEA—Elementary and Secondary Education Act of 1965, as amended; IDEA—Individuals with Disabilities Education Act

APPENDIX B. INDIVIDUAL STATE PERFORMANCE PROFILES, PY 2010–11 | 205
Nevada Secondary Level—continued
Core indicators
Academic attainment: Reading/
language arts Academic attainment:
Mathematics T echnical skill
attainment School
completion Student
graduation rates Placement Nontraditional participation
Nontraditional completion
Gender
Male
Female
81.51%
78.78%
89.56%
92.89%
>95.00%
>95.00%
12.37%
53.63%
>95.00% 78.12% 66.50% 41.40%
>95.00% 83.86% 71.21% 32.53%
Race/ethnicity
American Indian or Alaska Native
Asian
Black or African American
Hispanic or Latino Native Hawaiian or Other Pacific Islander White
Two or more races
65.35%
91.13%
63.34%
73.45%
83.53%
87.72%
91.59%
87.50%
>95.00%
82.97%
88.42%
91.30%
93.07%
>95.00%
>95.00%
94.34%
>95.00%
93.83%
NE
93.83%
NE
33.33%
33.99%
25.00%
26.89%
25.00%
27.35%
29.90%
93.00% 78.81% 60.00% 37.58%
>95.00% 88.27% 72.31% 44.74%
>95.00% 77.06% 55.87% 39.91%
>95.00% 79.39% 68.50% 36.36%
94.12% 88.00% 86.96% 40.05%
>95.00% 80.51% 68.75% 36.85%
>95.00% 80.43% 92.77% 41.34%

APPENDIX B. INDIVIDUAL STATE PERFORMANCE PROFILES, PY 2010–11 | 206
Nevada Postsecondary Level
Core indicators T echnical skill
attainment Credential,
certificate, or degree Student retention
or transfer Student
placement Nontraditional participation
Nontraditional completion
Measurement definitions
Percentage of CTE concentrators with a GPA of 2.0 or higher in their CTE courses.
Percentage of CTE concentrators who received certificate or degree.
Percentage of CTE concentrators who remained enrolled in their original postsecondary institution or transferred to another two-year or four-year postsecondary institution during the reporting year and who were enrolled in postsecondary education in the fall of the previous school year.
Percentage of CTE concentrators receiving a certificate or degree who were placed or retained in employment, or placed in military service or apprenticeship programs in the second quarter following the program year in which they left postsecondary education.
Percentage of CTE participants from underrepresented gender groups who enrolled in courses from a program that leads to employment in nontraditional fields during the reporting year.
Percentage of CTE concentrators from underrepresented gender groups who attain a certificate of achievement or a degree in a program that leads to employment in nontraditional fields during the reporting year.
PY 2010–11 Performance levels 72.00% 30.00% 35.00% 90.25% 26.00% 14.00%
PY 2010–11 Results 91.48% 46.74% 68.00% >95.00% 45.29% 40.88%
Special populations
Individuals with disabilities (ADA )
Economically disadvantaged students
Single parents
Displaced homemakers
Limited English proficient students
Students in nontraditional programs
53.00%
44.39%
36.92%
81.82%
44.09%
50.30%
>95.00%
>95.00%
>95.00%
>95.00%
>95.00%
94.61%
38.46%
52.52%
28.57%
36.36%
55.56%
NP
>95.00% 73.86% 44.05%
>95.00% 71.07% 51.37%
89.17% 55.10% 59.46%
>95.00% 75.22% 52.41%
92.48% 75.63% 51.80%
94.74% 70.11% NP
T ech prep 93.20% 58.14% 77.27% >95.00% 52.31% 21.43% NOTE: This table contains the results for students whom the state has identified as concentrators or participants (participants are only indicated by the state under the nontraditional participation core indicator) in career and technical education (CTE). See Appendix A, Table A-1 for the state’s definition of CTE concentrators and Table A-2 for the state’s definition of CTE participants. Definitions for special populations are provided in the Glossary of Terms in this report. Actual performance data above 95 percent and below 10 percent have been masked to protect student confidentiality. NE—state reported no enrollment; NP—data not provided; PNO—state reported program not offered; NA—data not applicable ADA—Americans with Disabilities Act

APPENDIX B. INDIVIDUAL STATE PERFORMANCE PROFILES, PY 2010–11 | 207
Nevada Postsecondary Level—continued
Core indicators T echnical skill
attainment Credential,
certificate, or degree Student retention
or transfer Student
placement Nontraditional participation
Nontraditional completion
Gender
Male
Female
35.28%
57.61%
>95.00%
>95.00%
22.60%
53.00%
88.25% 66.79% 18.98%
>95.00% 70.07% 68.83%
Race/ethnicity
American Indian or Alaska Native
Asian
Black or African American
Hispanic or Latino Native Hawaiian or Other Pacific Islander White
Two or more races
36.17%
53.68%
39.29%
38.21%
48.75%
49.50%
50.65%
92.86%
>95.00%
>95.00%
>95.00%
>95.00%
>95.00%
>95.00%
43.75%
51.56%
55.00%
45.58%
45.00%
37.43%
55.00%
91.37% 61.81% 47.87%
94.74% 69.11% 50.29%
90.61% 70.11% 51.50%
87.31% 68.04% 46.53%
>95.00% 73.44% 48.48%
92.96% 68.27% 42.94%
>95.00% 69.80% 45.59%

APPENDIX B. INDIVIDUAL STATE PERFORMANCE PROFILES, PY 2010–11 | 208
New Hampshire Secondary Level
Core indicators
Academic attainment: Reading/
language arts Academic attainment:
Mathematics T echnical skill
attainment School
completion Student
graduation rates Placement Nontraditional participation
Nontraditional completion
Measurement definitions
Percentage of CTE senior concentrators who have met the acceptable performance range of proficient or better on the statewide high school reading and language arts assessment administered by the state under ESEA and who, in the reporting year, left secondary education.
Percentage of CTE senior concentrators who have met the acceptable performance range of proficient or better on the statewide high school mathematics assessment administered by the state under ESEA and who, in the reporting year, left secondary education.
Percentage of CTE concentrators who completed all technical skill assessment that are aligned with industry-recognized standards, if available and appropriate, during the reporting year.
Percentage of CTE senior concentrators who earned a regular secondary school diploma, earned a General Education Development (GED) credential as a state-recognized equivalent to a regular high school diploma (if offered by the state) or other state-recognized equivalent (including recognized alternative standards for individuals with disabilities), or earned a proficiency credential, certificate, or degree, in conjunction with a secondary school diploma (if offered by the state) during the reporting year.
Percentage of CTE senior concentrators who, in the reporting year, were included as graduated in the state's computation of its graduation rate as described in ESEA .
Percentage of CTE concentrators who completed secondary career and technical education and left secondary education and were placed in postsecondary education or advanced training, in the military service, or employment in the second quarter following the program year in which they left secondary education (i.e., unduplicated placement status for CTE concentrators who graduated by June 30, 2007 would be assessed between Oct. 1, 2007 and Dec. 31, 2007).
Percentage of CTE participants from underrepresented gender groups who participated in a program that leads to employment in nontraditional fields during the reporting year.
Percentage of CTE concentrators from underrepresented gender groups who completed a program that leads to employment in nontraditional fields during the reporting year.
PY 2010–11 Performance levels 69.00% 25.25% 52.00% 88.56% 77.00% 62.00% 22.63% 19.10%
PY 2010–11 Results 70.59% 24.09% 13.38% >95.00% 94.81% 74.14% 23.01% 19.95%
Special populations
Individuals with disabilities (ADA )
Individuals with disabilities (ESEA /IDEA )
Economically disadvantaged students
Single parents
Displaced homemakers
Limited English proficient students
Migrant students
Students in nontraditional programs
NP
<10.00%
14.94%
<10.00%
NE
<10.00%
NE
26.98%
NP
>95.00%
>95.00%
>95.00%
NE
>95.00%
NE
>95.00%
NP
66.42%
67.18%
57.14%
NE
59.09%
NE
77.27%
NP
12.80%
17.62%
33.33%
NE
21.05%
NE
NP
NP NP NP NP
29.93% 14.26% 91.19% 16.47%
58.92% 15.97% 89.68% 22.87%
87.50% 25.00% 87.50% 50.00%
NE NE NE <10.00%
50.00% 13.79% 89.83% 16.10%
NE NE NE <10.00%
78.17% <10.00% >95.00% NP T ech prep 68.53% 22.77% 14.75% >95.00% 94.14% 76.67% 24.21% 25.56% NOTE: This table contains the results for students whom the state has identified as concentrators or participants (participants are only indicated by the state under the nontraditional participation core indicator) in career and technical education (CTE). See Appendix A, Table A-1 for the state’s definition of CTE concentrators and Table A-2 for the state’s definition of CTE participants. Definitions for special populations are provided in the Glossary of Terms in this report. Actual performance data above 95 percent and below 10 percent have been masked to protect student confidentiality. NE—state reported no enrollment; NP—data not provided; PNO—state reported program not offered; NA—data not applicable ADA—Americans with Disabilities Act; ESEA—Elementary and Secondary Education Act of 1965, as amended; IDEA—Individuals with Disabilities Education Act

APPENDIX B. INDIVIDUAL STATE PERFORMANCE PROFILES, PY 2010–11 | 209
New Hampshire Secondary Level—continued
Core indicators
Academic attainment: Reading/
language arts Academic attainment:
Mathematics T echnical skill
attainment School
completion Student
graduation rates Placement Nontraditional participation
Nontraditional completion
Gender
Male
Female
26.84%
20.83%
>95.00%
>95.00%
72.49%
76.29%
<10.00%
34.32%
63.22% 14.53% 93.05% <10.00%
79.33% 11.87% >95.00% 43.04%
Race/ethnicity
American Indian or Alaska Native
Asian
Black or African American
Hispanic or Latino Native Hawaiian or Other Pacific Islander White
Two or more races
37.50%
30.95%
<10.00%
<10.00%
>95.00%
24.82%
<10.00%
>95.00%
>95.00%
>95.00%
>95.00%
>95.00%
>95.00%
>95.00%
53.85%
69.57%
71.11%
63.81%
>95.00%
74.65%
NE
22.22%
21.88%
35.14%
21.59%
<10.00%
19.65%
19.35%
75.00% <10.00% 64.29% 21.05%
78.57% <10.00% >95.00% 19.75%
70.00% <10.00% 87.50% 25.83%
58.95% <10.00% 92.38% 22.26%
>95.00% <10.00% >95.00% 33.33%
70.77% 13.71% >95.00% 23.07%
>95.00% 21.43% 93.33% 21.11%

APPENDIX B. INDIVIDUAL STATE PERFORMANCE PROFILES, PY 2010–11 | 210
New Hampshire Postsecondary Level
Core indicators T echnical skill
attainment Credential,
certificate, or degree Student retention
or transfer Student
placement Nontraditional participation
Nontraditional completion
Measurement definitions
Percentage of matriculated CTE concentrators who passed technical skill assessments that are aligned with industry-recognized standards, if available and appropriate, during the reporting year.
Percentage of matriculated CTE concentrators who received an industry-recognized credential, a certificate, or a degree during the reporting year.
Percentage of matriculated CTE concentrators who remained enrolled in their original postsecondary institution during the reporting year and who were enrolled in the same postsecondary institution in the fall of the previous reporting year.
Percentage of matriculated CTE concentrators who were placed or retained in employment or statewide apprenticeship programs in the second quarter following the program year in which they left postsecondary education (i.e., unduplicated placement status for CTE concentrators who graduated by June 30, 2007 would be assessed between Oct. 1, 2007 and Dec. 31, 2007).
Percentage of CTE participants from underrepresented gender groups who enrolled in nontraditional programs during the reporting year.
Percentage of matriculated CTE concentrators from underrepresented gender groups who completed a nontraditional program during the reporting year.
PY 2010–11 Performance levels 49.20% 64.75% 74.00% 72.50% 19.00% 14.80%
PY 2010–11 Results 93.18% 62.50% 87.75% 53.98% 19.49% 18.56%
Special populations
Individuals with disabilities (ADA )
Economically disadvantaged students
Single parents
Displaced homemakers
Limited English proficient students
Students in nontraditional programs
89.47%
60.40%
52.17%
NE
52.38%
63.29%
45.86%
50.65%
34.78%
NE
47.62%
56.07%
20.83%
21.19%
90.00%
NE
33.33%
NP
NE 91.84% 22.51%
NE 89.38% 21.31%
NE 77.50% 90.62%
NE NE NE
NE 83.87% 23.68%
NE 84.16% NP
T ech prep NE 68.21% 94.09% 51.66% 14.73% 16.25% NOTE: This table contains the results for students whom the state has identified as concentrators or participants (participants are only indicated by the state under the nontraditional participation core indicator) in career and technical education (CTE). See Appendix A, Table A-1 for the state’s definition of CTE concentrators and Table A-2 for the state’s definition of CTE participants. Definitions for special populations are provided in the Glossary of Terms in this report. Actual performance data above 95 percent and below 10 percent have been masked to protect student confidentiality. NE—state reported no enrollment; NP—data not provided; PNO—state reported program not offered; NA—data not applicable ADA—Americans with Disabilities Act

APPENDIX B. INDIVIDUAL STATE PERFORMANCE PROFILES, PY 2010–11 | 211
New Hampshire Postsecondary Level—continued
Core indicators T echnical skill
attainment Credential,
certificate, or degree Student retention
or transfer Student
placement Nontraditional participation
Nontraditional completion
Gender
Male
Female
61.41%
63.59%
50.53%
57.41%
10.45%
29.22%
94.55% 87.60% <10.00%
92.89% 87.91% 37.66%
Race/ethnicity
American Indian or Alaska Native
Asian
Black or African American
Hispanic or Latino Native Hawaiian or Other Pacific Islander White
Two or more races
75.00%
70.27%
51.11%
55.88%
33.33%
67.58%
73.68%
50.00%
37.84%
55.56%
61.76%
66.67%
55.62%
42.11%
20.00%
12.50%
22.22%
25.00%
<10.00%
18.78%
30.00%
NE >95.00% 25.71%
NE 91.11% 21.43%
NE 85.35% 19.15%
NE 86.99% 22.50%
NE 66.67% <10.00%
NE 89.69% 19.64%
NE >95.00% 33.33%

APPENDIX B. INDIVIDUAL STATE PERFORMANCE PROFILES, PY 2010–11 | 212
New Jersey Secondary Level
Core indicators
Academic attainment: Reading/
language arts Academic attainment:
Mathematics T echnical skill
attainment School
completion Student
graduation rates Placement Nontraditional participation
Nontraditional completion
Measurement definitions
Percentage of CTE concentrators who met the proficient or advanced level on the statewide High School Proficiency Assessment (HSPA) in reading and language arts assessment administered by the state under ESEA , and who left secondary education in the reporting year.
Percentage of CTE concentrators who met the proficient or advanced level on the statewide HSPA in mathematics assessment administered by the state under ESEA , and who left secondary education in the reporting year.
Percentage of CTE concentrators who, during the reporting year, completed the CTE programs and passed the available and appropriate third-party, industry-aligned end of program skill assessments that are aligned with industry-recognized standards.
Percentage of CTE concentrators who earned a high school diploma and left secondary education during the reporting year.
Percentage of CTE concentrators who, in the reporting year, were included as graduated in the state's computation of its graduation rate as described in ESEA .
Percentage of CTE concentrators who completed CTE programs and attained a secondary school diploma, left secondary education one year before the reporting year, and were identified through the district survey as placed in employment in the military services or apprenticeships or in the postsecondary education or advanced training following the program year in which they left secondary education.
Percentage of CTE participants from an underrepresented gender group who participated in a nationally-recognized nontraditional program in the reporting year.
Percentage of CTE concentrators from an underrepresented gender group who completed a nationally-recognized nontraditional program in the reporting year.
PY 2010–11 Performance levels 88.00% 79.50% 87.50% 96.00% 96.00% 81.50% 30.50% 30.25%
PY 2010–11 Results 88.93% 78.44% 85.49% >95.00% >95.00% >95.00% 36.31% 31.58%
Special populations
Individuals with disabilities (ADA )
Individuals with disabilities (ESEA /IDEA )
Economically disadvantaged students
Single parents
Displaced homemakers
Limited English proficient students
Migrant students
Students in nontraditional programs
43.99%
NP
67.69%
82.81%
NP
62.50%
50.00%
77.67%
>95.00%
NP
>95.00%
>95.00%
NE
>95.00%
>95.00%
>95.00%
NP
94.25%
94.63%
>95.00%
NP
87.80%
89.44%
>95.00%
NP
23.74%
32.57%
26.17%
NP
36.73%
>95.00%
NP
61.42% NP NP NP
NP 76.24% >95.00% 29.67%
82.18% 83.03% >95.00% 36.72%
90.53% 93.46% >95.00% 29.63%
NP NP NP NP
68.75% 69.57% >95.00% 36.41%
75.00% >95.00% >95.00% 52.98%
89.62% 87.43% >95.00% NP Tech prep NP NP NP NE NP NP NP NP NOTE: This table contains the results for students whom the state has identified as concentrators or participants (participants are only indicated by the state under the nontraditional participation core indicator) in career and technical education (CTE). See Appendix A, Table A-1 for the state’s definition of CTE concentrators and Table A-2 for the state’s definition of CTE participants. Definitions for special populations are provided in the Glossary of Terms in this report. Actual performance data above 95 percent and below 10 percent have been masked to protect student confidentiality. NE—state reported no enrollment; NP—data not provided; PNO—state reported program not offered; NA—data not applicable ADA—Americans with Disabilities Act; ESEA—Elementary and Secondary Education Act of 1965, as amended; IDEA—Individuals with Disabilities Education Act

APPENDIX B. INDIVIDUAL STATE PERFORMANCE PROFILES, PY 2010–11 | 213
New Jersey Secondary Level—continued
Core indicators
Academic attainment: Reading/
language arts Academic attainment:
Mathematics T echnical skill
attainment School
completion Student
graduation rates Placement Nontraditional participation
Nontraditional completion
Gender
Male
Female
79.29%
77.51%
>95.00%
>95.00%
>95.00%
>95.00%
21.87%
44.64%
87.09% 82.84% >95.00% 31.66%
90.91% 88.39% >95.00% 42.35%
Race/ethnicity
American Indian or Alaska Native
Asian
Black or African American
Hispanic or Latino Native Hawaiian or Other Pacific Islander White
Two or more races
52.38%
94.17%
61.63%
71.79%
89.47%
86.34%
81.82%
>95.00%
>95.00%
>95.00%
>95.00%
>95.00%
>95.00%
>95.00%
NA*
NA*
NA*
NA*
NA*
NA*
NA*
26.32%
39.10%
35.34%
31.26%
37.93%
29.47%
17.65%
54.69% 77.78% >95.00% 37.82%
>95.00% 89.35% >95.00% 41.24%
80.65% 82.50% >95.00% 39.49%
83.72% 83.19% >95.00% 36.18%
>95.00% 94.12% >95.00% 42.13%
93.69% 87.18% >95.00% 34.49%
94.44% 92.31% >95.00% 22.50% NA*—The state was unable to collect and report race/ethnicity data for this particular cell in accordance with the required 1997 race/ethnicity categories. While the state did report data using the 1977 race/ethnicity categories, we are only reporting data provided by the states according to the 1997 race/ethnicity categories described in the Department’s Oct. 19, 2007, memorandum titled “Final Guidance on Maintaining, Collecting, and Reporting Racial and Ethnic Data” (see 72 Federal Register 59266).

APPENDIX B. INDIVIDUAL STATE PERFORMANCE PROFILES, PY 2010–11 | 214
New Jersey Postsecondary Level
Core indicators T echnical skill
attainment Credential,
certificate, or degree Student retention
or transfer Student
placement Nontraditional participation
Nontraditional completion
Measurement definitions
Percentage of CTE concentrators who completed the CTE programs and passed the available, appropriate, third party, industry-aligned end of program technical skill assessments during the reporting year.
Percentage of CTE concentrators who completed the CTE programs and received an industry-recognized credential, certificate, or a degree during the reporting year.
Percentage of CTE concentrators who remained enrolled in their original postsecondary institution or transferred to another two- or four-year postsecondary institution during the reporting year and who were enrolled in postsecondary education in the fall of the previous year, and who did not earn an industry-recognized credential, a certificate, or a degree in the previous reporting year.
Percentage of CTE concentrators who completed the CTE programs and were identified with their social security numbers to be placed or retained in employment, or placed in military service or apprenticeship programs in the second quarter following the program year in which they completed CTE postsecondary education program.
Percentage of CTE participants from an underrepresented gender group who participated in a nationally-recognized nontraditional program in the reporting year.
Percentage of CTE concentrators from an underrepresented gender group who completed a nationally-recognized nontraditional program in the reporting year.
PY 2010–11 Performance levels 83.00% 96.00% 40.00% 72.25% 25.25% 23.50%
PY 2010–11 Results >95.00% >95.00% 71.97% 74.42% 28.69% 27.02%
Special populations
Individuals with disabilities (ADA )
Economically disadvantaged students
Single parents
Displaced homemakers
Limited English proficient students
Students in nontraditional programs
>95.00%
>95.00%
>95.00%
>95.00%
>95.00%
>95.00%
65.22%
72.05%
66.67%
72.12%
63.91%
72.69%
14.81%
27.58%
24.17%
22.68%
31.64%
NP
>95.00% 83.48% 25.68%
>95.00% 73.03% 30.05%
>95.00% 82.78% 21.54%
92.00% 88.44% 22.42%
>95.00% 78.83% 32.49%
>95.00% 70.69% NP
T ech prep NP NP NP NP NP NP NOTE: This table contains the results for students whom the state has identified as concentrators or participants (participants are only indicated by the state under the nontraditional participation core indicator) in career and technical education (CTE). See Appendix A, Table A-1 for the state’s definition of CTE concentrators and Table A-2 for the state’s definition of CTE participants. Definitions for special populations are provided in the Glossary of Terms in this report. Actual performance data above 95 percent and below 10 percent have been masked to protect student confidentiality. NE—state reported no enrollment; NP—data not provided; PNO—state reported program not offered; NA—data not applicable ADA—Americans with Disabilities Act
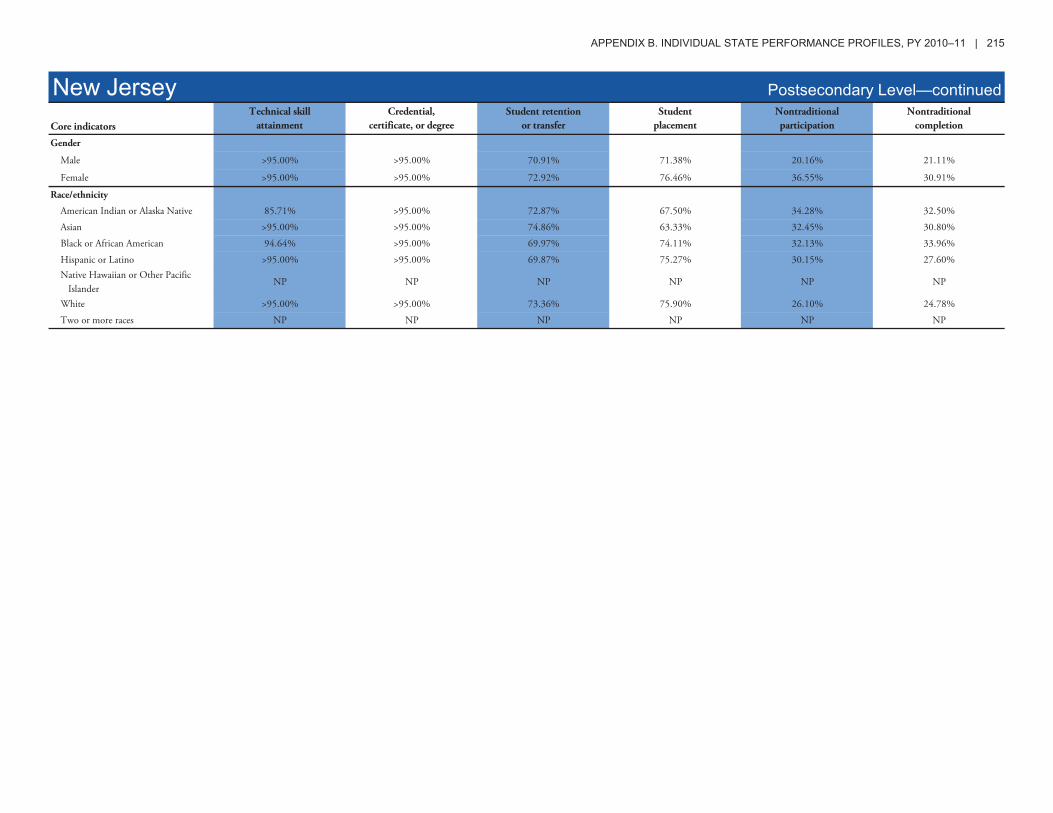
APPENDIX B. INDIVIDUAL STATE PERFORMANCE PROFILES, PY 2010–11 | 215
New Jersey Postsecondary Level—continued
Core indicators T echnical skill
attainment Credential,
certificate, or degree Student retention
or transfer Student
placement Nontraditional participation
Nontraditional completion
Gender
Male
Female
>95.00%
>95.00%
71.38%
76.46%
21.11%
30.91%
>95.00% 70.91% 20.16%
>95.00% 72.92% 36.55%
Race/ethnicity
American Indian or Alaska Native
Asian
Black or African American
Hispanic or Latino Native Hawaiian or Other Pacific Islander White
Two or more races
>95.00%
>95.00%
>95.00%
>95.00%
NP
>95.00%
NP
67.50%
63.33%
74.11%
75.27%
NP
75.90%
NP
32.50%
30.80%
33.96%
27.60%
NP
24.78%
NP
85.71% 72.87% 34.28%
>95.00% 74.86% 32.45%
94.64% 69.97% 32.13%
>95.00% 69.87% 30.15%
NP NP NP
>95.00% 73.36% 26.10%
NP NP NP

APPENDIX B. INDIVIDUAL STATE PERFORMANCE PROFILES, PY 2010–11 | 216
New Mexico Secondary Level
Core indicators
Academic attainment: Reading/
language arts Academic attainment:
Mathematics T echnical skill
attainment School
completion Student
graduation rates Placement Nontraditional participation
Nontraditional completion
Measurement definitions
Percentage of CTE concentrators who have met the proficient or advanced level on the statewide high school reading and language arts assessment administered by the state under ESEA and who in the reporting year, left secondary education and were included in the state's calculation and report of Adequate Yearly Progress (AYP).
Percentage of CTE concentrators who have met the proficient or advanced level on the statewide high school mathematics assessment administered by the state under ESEA and who in the reporting year, left secondary education and were included in the state's calculation and report of AYP.
Percentage of CTE concentrators who completed their program in a course sequence and earned a cumulative GPA of C (2.0) or better in their technical coursework.
Percentage of CTE concentrators who earned a secondary school diploma; other state recognized equivalent; or earned a proficiency credential, certificate or degree and who left secondary education during the reporting year.
Percentage of CTE concentrators who, in the reporting year, were included as graduated in the state's computation of its graduation rate as described in ESEA .
Percentage of secondary CTE concentrators who completed their CTE program sequence and who earned a secondary school diploma, or other state-recognized equivalent and who reported placement in postsecondary education, advanced training, employment, or the military in the second quarter following the program year in which they left secondary education (i.e., unduplicated placement status for CTE concentrators who graduated by June 30, 2007 would be assessed between Oct. 1, 2007 and Dec. 31, 2007).
Percentage of CTE participants from underrepresented gender groups who participated in a program that leads to employment in nontraditional fields during the reporting year.
Percentage of CTE concentrators from underrepresented gender groups who completed a program that leads to employment in nontraditional fields during the reporting year.
PY 2010–11 Performance levels 60.00% 45.00% 75.00% 90.00% 87.50% 43.00% 35.00% 25.00%
PY 2010–11 Results 54.22% 51.51% 68.90% 88.53% 87.36% 50.22% 54.41% 31.66%
Special populations
Individuals with disabilities (ADA )
Individuals with disabilities (ESEA /IDEA )
Economically disadvantaged students
Single parents
Displaced homemakers
Limited English proficient students
Migrant students
Students in nontraditional programs
NP
48.29%
54.16%
60.00%
37.50%
59.24%
61.72%
64.26%
NP
88.09%
85.71%
84.62%
85.71%
86.39%
89.47%
89.57%
NP
51.57%
50.97%
50.00%
58.33%
50.89%
51.58%
50.61%
NP
30.78%
32.31%
35.48%
40.00%
30.27%
26.67%
NP
NP NP NP NP
56.84% 66.86% 80.94% 56.05%
53.57% 62.68% 82.12% 56.97%
55.88% 62.86% 84.62% 52.27%
50.00% 73.53% 85.71% 44.44%
59.57% 69.32% 83.94% 54.37%
61.72% 64.69% 89.47% 56.27%
67.87% 60.74% 84.83% NP T ech prep 52.23% 52.23% 70.24% 88.24% 81.30% 52.08% 51.04% 29.20% NOTE: This table contains the results for students whom the state has identified as concentrators or participants (participants are only indicated by the state under the nontraditional participation core indicator) in career and technical education (CTE). See Appendix A, Table A-1 for the state’s definition of CTE concentrators and Table A-2 for the state’s definition of CTE participants. Definitions for special populations are provided in the Glossary of Terms in this report. Actual performance data above 95 percent and below 10 percent have been masked to protect student confidentiality. NE—state reported no enrollment; NP—data not provided; PNO—state reported program not offered; NA—data not applicable ADA—Americans with Disabilities Act; ESEA—Elementary and Secondary Education Act of 1965, as amended; IDEA—Individuals with Disabilities Education Act

APPENDIX B. INDIVIDUAL STATE PERFORMANCE PROFILES, PY 2010–11 | 217
New Mexico Secondary Level—continued
Core indicators
Academic attainment: Reading/
language arts Academic attainment:
Mathematics T echnical skill
attainment School
completion Student
graduation rates Placement Nontraditional participation
Nontraditional completion
Gender
Male
Female
51.76%
51.28%
93.80%
83.48%
51.64%
48.69%
29.23%
34.83%
52.83% 74.77% 92.38% 54.07%
55.47% 63.11% 82.55% 54.74%
Race/ethnicity
American Indian or Alaska Native
Asian
Black or African American
Hispanic or Latino Native Hawaiian or Other Pacific Islander White
Two or more races
51.31%
57.14%
58.62%
49.44%
46.46%
54.27%
46.83%
94.91%
84.83%
85.40%
91.74%
82.47%
83.43%
84.67%
50.68%
51.85%
49.67%
49.93%
45.89%
50.66%
49.62%
33.00%
32.05%
30.30%
31.96%
31.93%
30.42%
33.08%
52.57% 69.22% 94.27% 55.22%
58.10% 75.23% 81.25% 52.56%
59.71% 62.88% 83.56% 52.19%
51.07% 68.50% 89.11% 56.87%
50.22% 71.42% 83.33% 49.83%
59.71% 68.46% 83.50% 52.60%
45.44% 69.59% 84.67% 53.74%

APPENDIX B. INDIVIDUAL STATE PERFORMANCE PROFILES, PY 2010–11 | 218
New Mexico Postsecondary Level
Core indicators T echnical skill
attainment Credential,
certificate, or degree Student retention
or transfer Student
placement Nontraditional participation
Nontraditional completion
Measurement definitions
Percentage of CTE concentrators who completed their program in a course sequence and earned a cumulative GPA of C (2.0) or better in their technical coursework.
Percentage of CTE concentrators who received an industry-recognized credential, a certificate, or a degree during the reporting year.
Percentage of CTE concentrators who remained enrolled in their original postsecondary institution or transferred to another two- or four-year postsecondary institution during the reporting year and who were enrolled in postsecondary education in the fall of the previous reporting year.
Percentage of CTE concentrators who completed their CTE program sequence and who earned a postsecondary credential, certificate, or degree and left postsecondary education who reported placement in advanced education, employment, or military in the second quarter following the program year in which they left secondary education (i.e., unduplicated placement status for CTE concentrators who graduated by June 30, 2007 would be assessed between Oct. 1, 2007 and Dec. 31, 2007).
Percentage of CTE participants from underrepresented gender groups who participated in a program that leads to employment in nontraditional fields during the reporting year.
Percentage of CTE concentrators from underrepresented gender groups who completed a program that leads to employment in nontraditional fields during the reporting year.
PY 2010–11 Performance levels 61.00% 49.00% 57.00% 77.00% 26.00% 27.00%
PY 2010–11 Results >95.00% 30.46% 78.47% 75.71% 57.12% 35.65%
Special populations
Individuals with disabilities (ADA )
Economically disadvantaged students
Single parents
Displaced homemakers
Limited English proficient students
Students in nontraditional programs
34.71%
34.77%
32.01%
37.04%
32.21%
45.02%
71.30%
66.67%
67.39%
76.33%
65.71%
65.09%
40.37%
35.94%
40.54%
42.21%
41.91%
NP
>95.00% 86.53% 58.17%
>95.00% 83.96% 56.86%
>95.00% 81.93% 55.68%
>95.00% 78.29% 65.90%
>95.00% 77.46% 53.44%
>95.00% 81.80% NP
T ech prep 89.54% 46.57% 77.71% 19.53% 55.94% 40.52% NOTE: This table contains the results for students whom the state has identified as concentrators or participants (participants are only indicated by the state under the nontraditional participation core indicator) in career and technical education (CTE). See Appendix A, Table A-1 for the state’s definition of CTE concentrators and Table A-2 for the state’s definition of CTE participants. Definitions for special populations are provided in the Glossary of Terms in this report. Actual performance data above 95 percent and below 10 percent have been masked to protect student confidentiality. NE—state reported no enrollment; NP—data not provided; PNO—state reported program not offered; NA—data not applicable ADA—Americans with Disabilities Act

APPENDIX B. INDIVIDUAL STATE PERFORMANCE PROFILES, PY 2010–11 | 219
New Mexico Postsecondary Level—continued
Core indicators T echnical skill
attainment Credential,
certificate, or degree Student retention
or transfer Student
placement Nontraditional participation
Nontraditional completion
Gender
Male
Female
23.17%
37.10%
72.97%
78.07%
34.84%
36.19%
>95.00% 76.20% 51.85%
>95.00% 80.23% 64.22%
Race/ethnicity
American Indian or Alaska Native
Asian
Black or African American
Hispanic or Latino Native Hawaiian or Other Pacific Islander White
Two or more races
28.57%
30.39%
31.72%
30.45%
NE
26.36%
28.77%
76.14%
68.97%
67.57%
76.16%
NE
76.92%
78.46%
37.18%
32.35%
34.25%
37.87%
NE
38.70%
33.03%
>95.00% 80.09% 56.56%
>95.00% 80.52% 57.58%
91.76% 80.25% 55.85%
>95.00% 80.33% 57.68%
NE NE NE
>95.00% 75.97% 59.67%
>95.00% 70.50% 55.99%

APPENDIX B. INDIVIDUAL STATE PERFORMANCE PROFILES, PY 2010–11 | 220
New York Secondary Level
Core indicators
Academic attainment: Reading/
language arts Academic attainment:
Mathematics T echnical skill
attainment School
completion Student
graduation rates Placement Nontraditional participation
Nontraditional completion
Measurement definitions
Percentage of CTE concentrators who have met the proficient or advanced level on the statewide high school reading and language arts assessment administered by the state under ESEA and who, in the reporting year, left secondary education.
Percentage of CTE concentrators who have met the proficient or advanced level of the statewide high school mathematics assessment administered by the state under ESEA and who, in the reporting year, left secondary education.
Percentage of CTE concentrators who passed technical skill assessments that are aligned with industry-recognized standards, if available and appropriate, during the reporting year.
Percentage of CTE concentrators who earned a regular secondary school diploma, earned a General Education Development (GED) credential as a state-recognized equivalent to a regular high school diploma (if offered by the state) or other state-recognized equivalent (including recognized alternative standards for individuals with disabilities), or earned a proficiency credential, certificate, or degree, in conjunction with a secondary school diploma (if offered by the state) during the reporting year.
Percentage of CTE concentrators who, in the reporting year, were included as graduated in the state's computation of its graduation rate as described in ESEA .
Percentage of CTE concentrators in approved programs who left secondary education and were placed in postsecondary education or advanced training, in the military service, or employment in the second quarter following the program year in which they left secondary education (i.e., unduplicated placement status for CTE concentrators who graduated by June 30, 2007 would be assessed between Oct. 1, 2007 and Dec. 31, 2007).
Percentage of CTE participants from underrepresented gender groups who participated in a program that leads to employment in nontraditional fields during the reporting year.
Percentage of CTE concentrators from underrepresented gender groups who completed a program that leads to employment in nontraditional fields during the reporting year.
PY 2010–11 Performance levels 72.00% 73.00% 57.12% 67.50% 56.05% 87.25% 11.75% 10.75%
PY 2010–11 Results 94.84% 93.33% 73.10% 91.88% 84.75% 93.67% 34.70% 32.81%
Special populations
Individuals with disabilities (ADA )
Individuals with disabilities (ESEA /IDEA )
Economically disadvantaged students
Single parents
Displaced homemakers
Limited English proficient students
Migrant students
Students in nontraditional programs
NE
62.70%
91.98%
NP
NE
80.05%
85.71%
94.06%
NP
88.83%
91.39%
NP
NE
72.76%
86.96%
91.95%
NP
82.95%
78.53%
78.21%
>95.00%
75.12%
>95.00%
92.18%
NP
22.44%
34.23%
NP
NP
34.22%
22.73%
NP
NE NP NP NP
65.72% 57.20% 69.03% 24.07%
94.11% 72.40% 79.28% 36.09%
NP NP NP NP
NE NE NE NP
80.00% 72.55% 51.22% 37.22%
71.43% 37.50% 88.89% 26.00%
>95.00% 76.66% 82.52% NP Tech prep 92.93% 90.35% 75.38% 92.32% 82.18% >95.00% 26.56% 27.05% NOTE: This table contains the results for students whom the state has identified as concentrators or participants (participants are only indicated by the state under the nontraditional participation core indicator) in career and technical education (CTE). See Appendix A, Table A-1 for the state’s definition of CTE concentrators and Table A-2 for the state’s definition of CTE participants. Definitions for special populations are provided in the Glossary of Terms in this report. Actual performance data above 95 percent and below 10 percent have been masked to protect student confidentiality. NE—state reported no enrollment; NP—data not provided; PNO—state reported program not offered; NA—data not applicable ADA—Americans with Disabilities Act; ESEA—Elementary and Secondary Education Act of 1965, as amended; IDEA—Individuals with Disabilities Education Act

APPENDIX B. INDIVIDUAL STATE PERFORMANCE PROFILES, PY 2010–11 | 221
New York Secondary Level—continued
Core indicators
Academic attainment: Reading/
language arts Academic attainment:
Mathematics T echnical skill
attainment School
completion Student
graduation rates Placement Nontraditional participation
Nontraditional completion
Gender
Male
Female
92.50%
94.27%
91.18%
92.73%
92.58%
94.86%
<10.00%
63.26%
93.74% 70.56% 83.30% 10.77%
>95.00% 76.31% 86.45% 64.59%
Race/ethnicity
American Indian or Alaska Native
Asian
Black or African American
Hispanic or Latino Native Hawaiian or Other Pacific Islander White
Two or more races
90.00%
>95.00%
90.41%
92.94%
>95.00%
93.63%
84.62%
90.68%
>95.00%
86.78%
87.02%
92.00%
>95.00%
83.50%
94.74%
>95.00%
93.10%
92.88%
87.50%
92.97%
>95.00%
32.40%
38.49%
33.78%
36.15%
28.89%
27.64%
23.26%
92.63% 72.92% 79.49% 32.21%
>95.00% 88.49% 91.37% 40.61%
93.93% 74.07% 74.66% 36.82%
>95.00% 76.18% 76.01% 37.99%
95.00% 33.33% 70.97% 30.65%
94.28% 71.52% 91.79% 29.57%
89.74% 53.33% 85.11% 34.80%

APPENDIX B. INDIVIDUAL STATE PERFORMANCE PROFILES, PY 2010–11 | 222
New York Postsecondary Level
Core indicators T echnical skill
attainment Credential,
certificate, or degree Student retention
or transfer Student
placement Nontraditional participation
Nontraditional completion
Measurement definitions
Percentage of CTE concentrators who passed technical skill assessments that are aligned with industry-recognized standards, if available and appropriate, during the reporting year.
Percentage of CTE concentrators who received an industry-recognized credential, a certificate, or a degree during the reporting year.
Percentage of CTE concentrators who remained enrolled in their original postsecondary institution or transferred to another two- or four-year postsecondary institution during the reporting year and who were enrolled in postsecondary education in the fall of the previous reporting year.
Percentage of CTE concentrators who were placed or retained in employment, or placed in military service or apprenticeship programs in the second quarter following the program year in which they left postsecondary education (i.e., unduplicated placement status for CTE concentrators who graduated by June 30, 2007 would be assessed between Oct. 1, 2007 and Dec. 31, 2007).
Percentage of CTE participants from underrepresented gender groups who participated in a program that leads to employment in nontraditional fields during the reporting year.
Percentage of CTE concentrators from underrepresented gender groups who completed a program that leads to employment in nontraditional fields during the reporting year.
PY 2010–11 Performance levels 84.10% 54.00% 58.60% 94.30% 34.50% 21.75%
PY 2010–11 Results 94.59% 47.36% 78.05% 85.85% 29.88% 29.31%
Special populations
Individuals with disabilities (ADA )
Economically disadvantaged students
Single parents
Displaced homemakers
Limited English proficient students
Students in nontraditional programs
42.26%
46.56%
50.01%
48.99%
51.98%
47.18%
86.25%
82.28%
84.75%
74.50%
74.26%
84.00%
28.24%
30.13%
30.11%
28.02%
32.23%
NP
90.97% 73.70% 25.80%
94.04% 80.02% 31.10%
>95.00% 79.64% 31.60%
93.75% 80.30% 27.07%
>95.00% 83.79% 31.08%
93.51% 78.13% NP
T ech prep 48.22% 50.87% 71.66% 66.87% 19.66% 11.25% NOTE: This table contains the results for students whom the state has identified as concentrators or participants (participants are only indicated by the state under the nontraditional participation core indicator) in career and technical education (CTE). See Appendix A, Table A-1 for the state’s definition of CTE concentrators and Table A-2 for the state’s definition of CTE participants. Definitions for special populations are provided in the Glossary of Terms in this report. Actual performance data above 95 percent and below 10 percent have been masked to protect student confidentiality. NE—state reported no enrollment; NP—data not provided; PNO—state reported program not offered; NA—data not applicable ADA—Americans with Disabilities Act

APPENDIX B. INDIVIDUAL STATE PERFORMANCE PROFILES, PY 2010–11 | 223
New York Postsecondary Level—continued
Core indicators T echnical skill
attainment Credential,
certificate, or degree Student retention
or transfer Student
placement Nontraditional participation
Nontraditional completion
Gender
Male
Female
42.73%
51.20%
86.31%
85.59%
15.67%
40.19%
94.42% 76.87% 15.96%
94.66% 79.09% 43.75%
Race/ethnicity
American Indian or Alaska Native
Asian
Black or African American
Hispanic or Latino Native Hawaiian or Other Pacific Islander White
Two or more races
43.09%
57.54%
39.71%
41.10%
49.30%
49.71%
51.98%
86.36%
72.04%
79.98%
78.61%
85.71%
89.81%
76.67%
32.52%
36.11%
34.93%
33.81%
30.77%
26.25%
45.76%
>95.00% 71.43% 31.69%
>95.00% 84.57% 33.96%
92.02% 78.73% 34.08%
>95.00% 81.03% 32.10%
>95.00% 76.77% 21.09%
94.72% 76.21% 26.94%
>95.00% 76.68% 32.48%

APPENDIX B. INDIVIDUAL STATE PERFORMANCE PROFILES, PY 2010–11 | 224
North Carolina Secondary Level
Core indicators
Academic attainment: Reading/
language arts Academic attainment:
Mathematics T echnical skill
attainment School
completion Student
graduation rates Placement Nontraditional participation
Nontraditional completion
Measurement definitions
Percentage of CTE concentrators who have met the proficient or advanced level on the statewide high school reading and language arts assessment administered by the state under ESEA and who, in the reporting year, left secondary education.
Percentage of CTE concentrators who have met the proficient or advanced level on the statewide high school mathematics assessment administered by the state under ESEA and who, in the reporting year, left secondary education.
Percentage of CTE participants who achieved proficiency or above proficiency on CTE post-assessments or who received selected industry-recognized credential or who counted as proficient using the postsecondary technical attainment measure in the reporting year.
Percentage of senior concentrators who earned a high school diploma or General Education Development (GED) in the reporting year.
Percentage of CTE concentrators who, in the reporting year, were included as graduated in the state's computation of its graduation rate as described in ESEA .
Percentage of concentrators who left secondary education in the year prior to the reporting year and who are in postsecondary education, or advanced training, in military service, or in employment in the third quarter following leaving secondary education.
Percentage of participants who are enrolled during the year reporting in a program that leads to nontraditional fields and are of the nontraditional gender.
Percentage of concentrators in a program that leads to nontraditional fields and leaving secondary education in the year reporting.
PY 2010–11 Performance levels 48.00% 78.00% 76.00% 89.00% 83.00% 92.00% 26.50% 20.50%
PY 2010–11 Results 56.57% 63.47% 73.19% 94.26% 89.64% 91.00% 32.43% 24.80%
Special populations
Individuals with disabilities (ADA )
Individuals with disabilities (ESEA /IDEA )
Economically disadvantaged students
Single parents
Displaced homemakers
Limited English proficient students
Migrant students
Students in nontraditional programs
34.69%
NP
56.23%
50.70%
NE
39.68%
NE
67.61%
>95.00%
NP
>95.00%
>95.00%
NE
>95.00%
NE
>95.00%
NP
85.32%
87.44%
80.41%
NP
86.98%
>95.00%
92.49%
17.70%
NP
26.20%
44.53%
NE
20.17%
NE
NP
21.79% 36.94% 82.92% 28.90%
NP NP NP NP
47.98% 63.99% 82.93% 32.31%
49.86% 58.00% 82.89% 33.39%
NE NE NE NE
14.90% 33.00% 81.17% 28.64%
NE 40.74% 91.30% 19.35%
66.27% 80.41% 91.53% NP T ech prep 44.31% 50.69% 64.11% >95.00% 91.53% 87.85% 30.84% 22.91% NOTE: This table contains the results for students whom the state has identified as concentrators or participants (participants are only indicated by the state under the nontraditional participation core indicator) in career and technical education (CTE). See Appendix A, Table A-1 for the state’s definition of CTE concentrators and Table A-2 for the state’s definition of CTE participants. Definitions for special populations are provided in the Glossary of Terms in this report. Actual performance data above 95 percent and below 10 percent have been masked to protect student confidentiality. NE—state reported no enrollment; NP—data not provided; PNO—state reported program not offered; NA—data not applicable ADA—Americans with Disabilities Act; ESEA—Elementary and Secondary Education Act of 1965, as amended; IDEA—Individuals with Disabilities Education Act

APPENDIX B. INDIVIDUAL STATE PERFORMANCE PROFILES, PY 2010–11 | 225
North Carolina Secondary Level—continued
Core indicators
Academic attainment: Reading/
language arts Academic attainment:
Mathematics T echnical skill
attainment School
completion Student
graduation rates Placement Nontraditional participation
Nontraditional completion
Gender
Male
Female
64.82%
61.93%
92.80%
>95.00%
90.79%
91.22%
<10.00%
55.21%
52.21% 69.50% 87.02% 23.16%
61.54% 76.82% 92.65% 44.67%
Race/ethnicity
American Indian or Alaska Native
Asian
Black or African American
Hispanic or Latino Native Hawaiian or Other Pacific Islander White
Two or more races
56.97%
75.55%
46.96%
60.57%
60.00%
73.64%
66.54%
>95.00%
>95.00%
93.55%
94.77%
>95.00%
94.47%
94.44%
81.85%
>95.00%
89.27%
87.38%
NE
92.64%
90.95%
22.99%
22.61%
28.42%
>95.00%
<10.00%
23.64%
26.67%
46.22% 60.03% 92.40% 31.23%
56.19% 68.69% 94.13% 35.24%
44.02% 59.82% 86.60% 35.15%
46.32% 63.29% 87.87% 31.51%
46.67% 66.96% NP 40.95%
65.92% 82.60% 91.47% 31.23%
60.45% 75.29% 89.56% 32.45%

APPENDIX B. INDIVIDUAL STATE PERFORMANCE PROFILES, PY 2010–11 | 226
North Carolina Postsecondary Level
Core indicators T echnical skill
attainment Credential,
certificate, or degree Student retention
or transfer Student
placement Nontraditional participation
Nontraditional completion
Measurement definitions
Percentage of concentrators in CTE with an earned GPA of 2.5 or higher.
Percentage of concentrators in CTE who received an industry-recognized credential, a certificate, a diploma, or a degree during the reporting year.
Percentage of concentrators in CTE who remain enrolled in their original postsecondary institution or transferred to another two- or four-year postsecondary institution during the reporting year and who were enrolled in postsecondary education in the fall of the previous year.
Percentage of concentrators in CTE who were placed or retained in employment or in military service or apprenticeship programs in the second quarter following the program year in which they left postsecondary education.
Percentage of CTE participants from underrepresented gender groups who participated in a program that leads to employment in nontraditional fields during the reporting year.
Percentage of concentrators in CTE from underrepresented gender groups who completed a program that leads to employment in nontraditional fields during the reporting year.
PY 2010–11 Performance levels 79.50% 59.00% 80.50% 80.00% 21.00% 21.50%
PY 2010–11 Results 75.81% 51.62% 74.55% 82.90% 21.63% 21.43%
Special populations
Individuals with disabilities (ADA )
Economically disadvantaged students
Single parents
Displaced homemakers
Limited English proficient students
Students in nontraditional programs
53.73%
50.40%
42.46%
42.51%
53.76%
38.10%
82.44%
89.64%
91.67%
86.18%
74.71%
82.46%
26.98%
28.56%
33.93%
34.14%
23.11%
NP
71.79% 72.17% 21.72%
73.06% 87.56% 26.32%
71.49% 73.22% 30.80%
75.55% 76.98% 29.22%
75.65% 78.24% 22.02%
75.32% 82.74% NP
T ech prep 66.80% 65.32% 69.17% 81.67% 18.32% 17.60% NOTE: This table contains the results for students whom the state has identified as concentrators or participants (participants are only indicated by the state under the nontraditional participation core indicator) in career and technical education (CTE). See Appendix A, Table A-1 for the state’s definition of CTE concentrators and Table A-2 for the state’s definition of CTE participants. Definitions for special populations are provided in the Glossary of Terms in this report. Actual performance data above 95 percent and below 10 percent have been masked to protect student confidentiality. NE—state reported no enrollment; NP—data not provided; PNO—state reported program not offered; NA—data not applicable ADA—Americans with Disabilities Act

APPENDIX B. INDIVIDUAL STATE PERFORMANCE PROFILES, PY 2010–11 | 227
North Carolina Postsecondary Level—continued
Core indicators T echnical skill
attainment Credential,
certificate, or degree Student retention
or transfer Student
placement Nontraditional participation
Nontraditional completion
Gender
Male
Female
37.80%
73.13%
79.11%
85.17%
<10.00%
30.99%
75.47% 76.69% <10.00%
76.04% 73.14% 34.58%
Race/ethnicity
American Indian or Alaska Native
Asian
Black or African American
Hispanic or Latino Native Hawaiian or Other Pacific Islander White
Two or more races
41.27%
42.51%
36.54%
45.71%
40.00%
60.69%
23.69%
83.23%
67.33%
84.74%
72.38%
NE
83.41%
NE
20.96%
17.05%
24.35%
24.86%
40.00%
19.89%
31.82%
68.86% 67.63% 22.89%
79.19% 72.51% 21.65%
65.78% 72.76% 24.85%
74.50% 67.72% 22.79%
84.52% 48.28% 25.27%
80.81% 75.49% 19.75%
74.60% 50.75% 22.30%

APPENDIX B. INDIVIDUAL STATE PERFORMANCE PROFILES, PY 2010–11 | 228
North Dakota Secondary Level
Core indicators
Academic attainment: Reading/
language arts Academic attainment:
Mathematics T echnical skill
attainment School
completion Student
graduation rates Placement Nontraditional participation
Nontraditional completion
Measurement definitions
Percentage of CTE concentrators who have net the proficient or advanced level on the statewide high school reading and language arts assessment administered by the state under ESEA and who, in the reporting year, left secondary education.
Percentage of CTE concentrators who have met the proficient or advanced level on the statewide high school mathematics assessment administered by the state under ESEA and who, in the reporting year, left secondary education.
Percentage of CTE concentrators who passed technical skills assessments that are aligned with industry-recognized standards, if available and appropriate, during the reporting year.
Percentage of CTE concentrators who earned a regular secondary school diploma, earned a General Education Development (GED) credential as a state-recognized equivalent to a regular high school diploma (if offered by the state) or other state-recognized equivalent (including recognized alternative standards for individuals with disabilities), or earned a proficiency credential, certificate, or degree, in conjunction with a secondary school diploma (if offered by the state) during the reporting year.
Percentage of CTE concentrators who, in the reporting year, were included as graduated in the state's computation of its graduation rate as described in ESEA .
Percentage of CTE concentrators who left secondary education and were placed in postsecondary education or advanced training, in the military service, or employment in the second quarter following the program year in which they left secondary education (i.e., unduplicated placement status for CTE concentrators who graduated by June 30, 2007 would be assessed between Oct. 1, 2007 and Dec. 31, 2007).
Percentage of CTE participants from underrepresented gender groups who participated in a program that leads to employment in nontraditional fields during the reporting year.
Percentage of CTE concentrators from underrepresented gender groups who completed a program that leads to employment in nontraditional fields during the reporting year.
PY 2010–11 Performance levels 64.00% 50.00% 80.00% 90.00% 84.00% 70.00% 22.00% 15.00%
PY 2010–11 Results 58.68% 52.89% 88.95% >95.00% 92.29% 70.14% 19.12% 15.22%
Special populations
Individuals with disabilities (ADA )
Individuals with disabilities (ESEA /IDEA )
Economically disadvantaged students
Single parents
Displaced homemakers
Limited English proficient students
Migrant students
Students in nontraditional programs
NP
31.90%
42.03%
<10.00%
NE
16.22%
NE
51.83%
NP
>95.00%
>95.00%
>95.00%
NE
92.31%
>95.00%
>95.00%
NP
>95.00%
>95.00%
>95.00%
NE
>95.00%
>95.00%
>95.00%
NP
10.32%
20.19%
<10.00%
NE
23.08%
<10.00%
NP
NP NP NP NP
39.41% 78.57% 76.75% 14.62%
50.38% 84.06% 87.81% 22.73%
>95.00% >95.00% >95.00% <10.00%
NE NE NE NE
18.92% 58.97% 57.69% 24.49%
NE >95.00% >95.00% <10.00%
56.93% 88.71% 92.51% NP Tech prep NP NP NP NP NP PNO NP NP NOTE: This table contains the results for students whom the state has identified as concentrators or participants (participants are only indicated by the state under the nontraditional participation core indicator) in career and technical education (CTE). See Appendix A, Table A-1 for the state’s definition of CTE concentrators and Table A-2 for the state’s definition of CTE participants. Definitions for special populations are provided in the Glossary of Terms in this report. Actual performance data above 95 percent and below 10 percent have been masked to protect student confidentiality. NE—state reported no enrollment; NP—data not provided; PNO—state reported program not offered; NA—data not applicable ADA—Americans with Disabilities Act; ESEA—Elementary and Secondary Education Act of 1965, as amended; IDEA—Individuals with Disabilities Education Act

APPENDIX B. INDIVIDUAL STATE PERFORMANCE PROFILES, PY 2010–11 | 229
North Dakota Secondary Level—continued
Core indicators
Academic attainment: Reading/
language arts Academic attainment:
Mathematics T echnical skill
attainment School
completion Student
graduation rates Placement Nontraditional participation
Nontraditional completion
Gender
Male
Female
55.22%
49.49%
>95.00%
>95.00%
67.00%
74.58%
<10.00%
28.99%
57.38% 88.20% 92.36% 11.83%
60.57% 90.07% 92.18% 30.53%
Race/ethnicity
American Indian or Alaska Native
Asian
Black or African American
Hispanic or Latino Native Hawaiian or Other Pacific Islander White
Two or more races
41.35%
58.33%
11.76%
32.50%
>95.00%
54.23%
50.00%
91.67%
>95.00%
>95.00%
>95.00%
>95.00%
>95.00%
>95.00%
NA*
NA*
NA*
NA*
NA*
NA*
NA*
26.44%
20.00%
<10.00%
<10.00%
NE
14.84%
16.67%
42.86% 74.31% 77.91% 30.22%
58.33% >95.00% 91.67% 17.65%
11.76% 60.00% 64.00% 12.50%
42.50% 87.18% 78.72% 17.50%
>95.00% >95.00% >95.00% >95.00%
60.30% 90.09% 93.88% 18.51%
50.00% >95.00% 88.89% 11.11% NA*—The state was unable to collect and report race/ethnicity data for this particular cell in accordance with the required 1997 race/ethnicity categories. While the state did report data using the 1977 race/ethnicity categories, we are only reporting data provided by the states according to the 1997 race/ethnicity categories described in the Department’s Oct. 19, 2007, memorandum titled “Final Guidance on Maintaining, Collecting, and Reporting Racial and Ethnic Data” (see 72 Federal Register 59266).

APPENDIX B. INDIVIDUAL STATE PERFORMANCE PROFILES, PY 2010–11 | 230
North Dakota Postsecondary Level
Core indicators T echnical skill
attainment Credential,
certificate, or degree Student retention
or transfer Student
placement Nontraditional participation
Nontraditional completion
Measurement definitions
Percentage of CTE concentrators who passed technical skill assessments that are aligned with industry-recognized standards, if available and appropriate, during the reporting year.
Percentage of CTE concentrators who received an industry-recognized credential, a certificate, or a degree during the reporting year.
Percentage of CTE concentrators who remained enrolled in their original postsecondary institution or transferred to another two- or four-year postsecondary institution during the reporting year and who were enrolled in postsecondary education in the fall of the previous reporting year.
Percentage of CTE concentrators who were placed or retained in employment, or placed in military service or apprenticeship programs in the second quarter following the program year in which they left postsecondary education (i.e., unduplicated placement status for CTE concentrators who graduated by June 30, 2007 would be assessed between Oct. 1, 2007 and Dec. 31, 2007).
Percentage of CTE participants from underrepresented gender groups who participated in a program that leads to employment in nontraditional fields during the reporting year.
Percentage of CTE concentrators from underrepresented gender groups who completed a program that leads to employment in nontraditional fields during the reporting year.
PY 2010–11 Performance levels 87.00% 45.00% 65.00% 70.00% 20.00% 5.00%
PY 2010–11 Results 83.92% 55.56% 54.89% 60.86% 25.34% 12.14%
Special populations
Individuals with disabilities (ADA )
Economically disadvantaged students
Single parents
Displaced homemakers
Limited English proficient students
Students in nontraditional programs
82.86%
52.63%
47.09%
71.29%
76.42%
44.24%
43.33%
59.21%
52.63%
50.56%
42.03%
32.74%
<10.00%
13.71%
29.49%
<10.00%
<10.00%
NP
91.14% 63.33% 12.50%
83.75% 54.19% 29.13%
77.26% 82.90% 31.09%
88.05% 42.04% 19.00%
88.33% 63.16% 17.45%
82.51% 53.69% NP
T ech prep PNO PNO PNO PNO PNO PNO NOTE: This table contains the results for students whom the state has identified as concentrators or participants (participants are only indicated by the state under the nontraditional participation core indicator) in career and technical education (CTE). See Appendix A, Table A-1 for the state’s definition of CTE concentrators and Table A-2 for the state’s definition of CTE participants. Definitions for special populations are provided in the Glossary of Terms in this report. Actual performance data above 95 percent and below 10 percent have been masked to protect student confidentiality. NE—state reported no enrollment; NP—data not provided; PNO—state reported program not offered; NA—data not applicable ADA—Americans with Disabilities Act
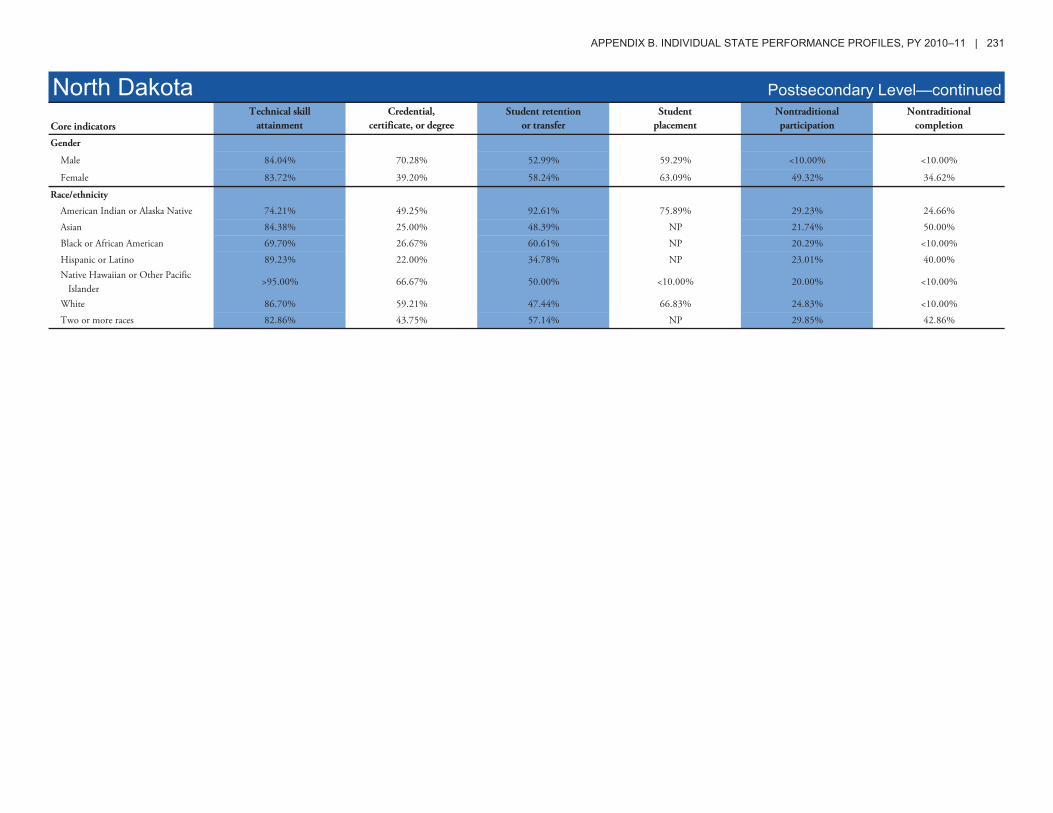
APPENDIX B. INDIVIDUAL STATE PERFORMANCE PROFILES, PY 2010–11 | 231
North Dakota Postsecondary Level—continued
Core indicators T echnical skill
attainment Credential,
certificate, or degree Student retention
or transfer Student
placement Nontraditional participation
Nontraditional completion
Gender
Male
Female
70.28%
39.20%
59.29%
63.09%
<10.00%
34.62%
84.04% 52.99% <10.00%
83.72% 58.24% 49.32%
Race/ethnicity
American Indian or Alaska Native
Asian
Black or African American
Hispanic or Latino Native Hawaiian or Other Pacific Islander White
Two or more races
49.25%
25.00%
26.67%
22.00%
66.67%
59.21%
43.75%
75.89%
NP
NP
NP
<10.00%
66.83%
NP
24.66%
50.00%
<10.00%
40.00%
<10.00%
<10.00%
42.86%
74.21% 92.61% 29.23%
84.38% 48.39% 21.74%
69.70% 60.61% 20.29%
89.23% 34.78% 23.01%
>95.00% 50.00% 20.00%
86.70% 47.44% 24.83%
82.86% 57.14% 29.85%

APPENDIX B. INDIVIDUAL STATE PERFORMANCE PROFILES, PY 2010–11 | 232
Ohio Secondary Level
Core indicators
Academic attainment: Reading/
language arts Academic attainment:
Mathematics T echnical skill
attainment School
completion Student
graduation rates Placement Nontraditional participation
Nontraditional completion
Measurement definitions
Percentage of CTE concentrators who left secondary education in the reporting year and who scored at or above the proficient level on the Ohio Graduation Tests (OGT) reading and language arts assessment administered by Ohio under ESEA .
Percentage of CTE concentrators who left secondary education in the reporting year and who scored at or above the proficient level on the OGT mathematics assessment administered by Ohio under ESEA .
Percentage of CTE concentrators who left secondary education the previous year and who passed state-recognized technical skill assessments that are aligned with industry-recognized standards.
Percentage of CTE concentrators who left secondary education the previous year who earned a regular or honors secondary school diploma (including summer graduates), a General Education Development (GED) credential, or another state-recognized equivalent.
Percentage of CTE concentrators who, in the reporting year, were included as graduated in the state's computation of its graduation rate as described in ESEA .
Percentage of status-known CTE concentrators who left secondary education the previous year and, in the second quarter following the program year in which they left secondary education, were enrolled in postsecondary education or advanced training, in military service or employed.
Percentage of CTE participants from underrepresented gender groups who, in the reporting year, participated in a CTE program that leads to employment in nontraditional fields.
Percentage of CTE concentrators from underrepresented gender groups who, in the reporting year, completed a CTE program that leads to employment in nontraditional fields.
PY 2010–11 Performance levels 88.00% 84.00% 63.00% 93.50% 82.30% 88.25% 20.50% 17.50%
PY 2010–11 Results 93.49% 92.35% 72.84% >95.00% >95.00% 90.17% 30.68% 24.13%
Special populations
Individuals with disabilities (ADA )
Individuals with disabilities (ESEA /IDEA )
Economically disadvantaged students
Single parents
Displaced homemakers
Limited English proficient students
Migrant students
Students in nontraditional programs
NP
65.82%
88.74%
88.60%
NP
83.50%
>95.00%
93.71%
NP
>95.00%
>95.00%
>95.00%
NP
>95.00%
>95.00%
>95.00%
NP
80.94%
85.03%
71.96%
NP
86.11%
66.67%
90.18%
NP
18.90%
23.31%
19.71%
NP
31.71%
<10.00%
NP
NP NP NP NP
70.56% 55.68% >95.00% 25.21%
90.25% 68.29% >95.00% 32.26%
89.21% 66.05% >95.00% 23.68%
NP NP NP NP
83.50% 56.00% >95.00% 41.98%
>95.00% 50.00% >95.00% 25.00%
>95.00% 68.08% >95.00% NP Tech prep >95.00% 94.88% 75.94% >95.00% >95.00% 92.39% 24.43% 23.22% NOTE: This table contains the results for students whom the state has identified as concentrators or participants (participants are only indicated by the state under the nontraditional participation core indicator) in career and technical education (CTE). See Appendix A, Table A-1 for the state’s definition of CTE concentrators and Table A-2 for the state’s definition of CTE participants. Definitions for special populations are provided in the Glossary of Terms in this report. Actual performance data above 95 percent and below 10 percent have been masked to protect student confidentiality. NE—state reported no enrollment; NP—data not provided; PNO—state reported program not offered; NA—data not applicable ADA—Americans with Disabilities Act; ESEA—Elementary and Secondary Education Act of 1965, as amended; IDEA—Individuals with Disabilities Education Act

APPENDIX B. INDIVIDUAL STATE PERFORMANCE PROFILES, PY 2010–11 | 233
Ohio Secondary Level—continued
Core indicators
Academic attainment: Reading/
language arts Academic attainment:
Mathematics T echnical skill
attainment School
completion Student
graduation rates Placement Nontraditional participation
Nontraditional completion
Gender
Male
Female
91.53%
93.32%
>95.00%
>95.00%
89.96%
90.40%
<10.00%
45.87%
91.89% 70.06% >95.00% 14.14%
>95.00% 75.87% >95.00% 53.17%
Race/ethnicity
American Indian or Alaska Native
Asian
Black or African American
Hispanic or Latino Native Hawaiian or Other Pacific Islander White
Two or more races
93.88%
>95.00%
88.18%
91.55%
>95.00%
92.95%
90.84%
>95.00%
>95.00%
>95.00%
>95.00%
>95.00%
>95.00%
>95.00%
73.91%
93.05%
91.74%
87.94%
>95.00%
89.99%
90.64%
22.22%
25.00%
27.29%
25.48%
<10.00%
23.58%
28.72%
>95.00% 83.33% >95.00% 28.50%
>95.00% 75.51% >95.00% 37.02%
91.48% 62.52% >95.00% 37.88%
92.76% 62.70% >95.00% 32.39%
>95.00% NE >95.00% 32.35%
93.78% 74.30% >95.00% 29.20%
91.79% 76.19% >95.00% 33.90%

APPENDIX B. INDIVIDUAL STATE PERFORMANCE PROFILES, PY 2010–11 | 234
Ohio Postsecondary Level
Core indicators T echnical skill
attainment Credential,
certificate, or degree Student retention
or transfer Student
placement Nontraditional participation
Nontraditional completion
Measurement definitions
Percentage of CTE concentrators who left postsecondary education the previous year and who passed state-recognized technical skill assessments that are aligned with industry-recognized standards.
Percentage of CTE concentrators who, in the previous year, received an industry-recognized credential, a certificate or a degree and left postsecondary education.
Percentage of CTE concentrators enrolled in postsecondary education in the autumn of the previous reporting year and who, during the reporting year, remained enrolled in their original postsecondary institution or transferred to another two- or four-year postsecondary institution.
Percentage of CTE concentrators who were employed, in military service or in apprenticeship programs in the second quarter following the program year in which they left postsecondary education.
Percentage of CTE participants from underrepresented gender groups who, in the reporting year, participated in a CTE program that leads to employment in nontraditional fields.
Percentage of CTE concentrators from underrepresented gender groups who, in the reporting year, completed a program that leads to employment in nontraditional fields.
PY 2010–11 Performance levels 75.50% 39.00% 67.75% 79.30% 15.25% 13.25%
PY 2010–11 Results 73.71% 41.51% 68.64% 77.59% 23.37% 19.96%
Special populations
Individuals with disabilities (ADA )
Economically disadvantaged students
Single parents
Displaced homemakers
Limited English proficient students
Students in nontraditional programs
42.04%
38.91%
37.28%
37.74%
42.08%
37.32%
70.00%
76.20%
78.58%
73.22%
61.39%
74.72%
18.91%
19.19%
14.88%
21.57%
20.28%
NP
67.01% 71.71% 25.37%
66.83% 71.32% 22.48%
63.62% 69.99% 17.44%
69.32% 73.02% 23.90%
73.33% 72.09% 30.25%
70.40% 69.84% NP
T ech prep 71.01% 41.40% 71.22% 81.08% 25.40% 23.55% NOTE: This table contains the results for students whom the state has identified as concentrators or participants (participants are only indicated by the state under the nontraditional participation core indicator) in career and technical education (CTE). See Appendix A, Table A-1 for the state’s definition of CTE concentrators and Table A-2 for the state’s definition of CTE participants. Definitions for special populations are provided in the Glossary of Terms in this report. Actual performance data above 95 percent and below 10 percent have been masked to protect student confidentiality. NE—state reported no enrollment; NP—data not provided; PNO—state reported program not offered; NA—data not applicable ADA—Americans with Disabilities Act

APPENDIX B. INDIVIDUAL STATE PERFORMANCE PROFILES, PY 2010–11 | 235
Ohio Postsecondary Level—continued
Core indicators T echnical skill
attainment Credential,
certificate, or degree Student retention
or transfer Student
placement Nontraditional participation
Nontraditional completion
Gender
Male
Female
49.16%
31.90%
79.33%
74.22%
<10.00%
45.98%
76.09% 69.17% <10.00%
70.72% 67.95% 41.27%
Race/ethnicity
American Indian or Alaska Native
Asian
Black or African American
Hispanic or Latino Native Hawaiian or Other Pacific Islander White
Two or more races
29.25%
47.18%
29.63%
29.71%
>95.00%
43.84%
<10.00%
80.65%
69.23%
72.40%
75.86%
>95.00%
78.92%
NA
18.87%
25.00%
18.74%
16.32%
NA
19.56%
40.00%
69.81% 70.64% 28.19%
75.00% 72.10% 29.18%
58.18% 71.53% 24.22%
66.39% 67.89% 25.79%
>95.00% 90.91% 30.77%
76.24% 67.92% 22.48%
60.00% 84.85% 35.54%

APPENDIX B. INDIVIDUAL STATE PERFORMANCE PROFILES, PY 2010–11 | 236
Ohio Adult Level
Core indicators T echnical skill
attainment Credential,
certificate, or degree Student retention
or transfer Student
placement Nontraditional participation
Nontraditional completion
Measurement definitions
Percentage of CTE concentrators who left adult workforce education in the reporting year and passed state-recognized technical skills assessments.
Percentage of CTE concentrators who left adult workforce education in the reporting year and received an industry-recognized certificate or license.
Percentage of status-known CTE concentrators enrolled in adult workforce education the previous year and who, during the reporting year, remained enrolled in the same adult workforce education institution or transferred to another adult workforce education institution or a two- or four-year postsecondary institution.
Percentage of status-known CTE concentrators who were employed, in military service or in apprenticeship programs in the second quarter following the program year in which they left adult workforce education.
Percentage of CTE participants from underrepresented gender groups in the reporting year who participated in an adult workforce education program that leads to employment in nontraditional fields.
Percentage of CTE concentrators from underrepresented gender groups in the reporting year who completed an adult workforce education program that leads to employment in nontraditional fields.
PY 2010–11 Performance levels 90.65% 67.75% 76.50% 86.50% 10.12% 9.42%
PY 2010–11 Results 91.47% 70.24% 88.93% 85.12% 10.63% 10.69%
Special populations
Individuals with disabilities (ADA )
Economically disadvantaged students
Single parents
Displaced homemakers
Limited English proficient students
Students in nontraditional programs
64.15%
68.83%
67.90%
71.43%
75.34%
<10.00%
69.18%
83.70%
83.19%
81.77%
87.18%
<10.00%
10.92%
<10.00%
<10.00%
<10.00%
22.03%
NP
23.01% 91.30% 10.83%
91.52% 88.78% 14.00%
90.23% 84.07% <10.00%
93.83% 83.33% <10.00%
93.22% >95.00% 22.03%
<10.00% 10.08% NP
T ech prep NP NP NP NP NP NP NOTE: This table contains the results for students whom the state has identified as concentrators or participants (participants are only indicated by the state under the nontraditional participation core indicator) in career and technical education (CTE). See Appendix A, Table A-1 for the state’s definition of CTE concentrators and Table A-2 for the state’s definition of CTE participants. Definitions for special populations are provided in the Glossary of Terms in this report. Actual performance data above 95 percent and below 10 percent have been masked to protect student confidentiality. NE—state reported no enrollment; NP—data not provided; PNO—state reported program not offered; NA—data not applicable ADA—Americans with Disabilities Act

APPENDIX B. INDIVIDUAL STATE PERFORMANCE PROFILES, PY 2010–11 | 237
Ohio Adult Level—continued
Core indicators T echnical skill
attainment Credential,
certificate, or degree Student retention
or transfer Student
placement Nontraditional participation
Nontraditional completion
Gender
Male
Female
69.70%
70.68%
86.52%
84.17%
11.87%
<10.00%
90.84% 92.11% 11.82%
91.99% 86.94% <10.00%
Race/ethnicity
American Indian or Alaska Native
Asian
Black or African American
Hispanic or Latino Native Hawaiian or Other Pacific Islander White
Two or more races
80.65%
66.00%
52.28%
68.25%
NE
71.60%
73.40%
87.50%
82.98%
85.05%
85.98%
NE
85.19%
75.68%
25.93%
15.00%
13.78%
<10.00%
NE
10.43%
<10.00%
>95.00% 90.00% 25.93%
82.50% >95.00% 15.00%
79.27% 88.39% 13.78%
86.14% 80.00% <10.00%
NE NE NE
92.35% 89.05% 10.37%
>95.00% 88.68% <10.00%

APPENDIX B. INDIVIDUAL STATE PERFORMANCE PROFILES, PY 2010–11 | 238
Oklahoma Secondary Level
Core indicators
Academic attainment: Reading/
language arts Academic attainment:
Mathematics T echnical skill
attainment School
completion Student
graduation rates Placement Nontraditional participation
Nontraditional completion
Measurement definitions
Percentage of Oklahoma students who have met the proficient or advanced level on the statewide high school reading and language arts assessment administered by the state under ESEA based on the scores that were included in the state's computation of Adequate Yearly Progress (AYP) and who, in the reporting year, left secondary education.
Percentage of Oklahoma students who have met the proficient or advanced level on the statewide high school mathematics assessment administered by the state under ESEA based on the scores that were included in the state's computation of AYP and who, in the reporting year, left secondary education.
Percentage of CTE concentrators who passed a state-approved technical skill attainment assessment that is aligned with industry-recognized standards during the reporting year.
Percentage of CTE concentrators who earned a regular secondary school diploma, earned a GED or other state recognized equivalent or earned a proficiency credential, certificate or degree, in conjunction with a secondary school diploma during the reporting year.
Percentage of Oklahoma students who, in the reporting year, were included as graduated in the state's computation of its graduation rate as defined by the state's Consolidated Accountability Plan pursuant to ESEA .
Percentage of secondary CTE concentrators who left secondary education and were placed in postsecondary education, advanced education, employment, or military in the second quarter following the program year in which they left secondary education.
Percentage of CTE participants from underrepresented gender groups who participated in a program that leads to employment in nontraditional fields during the reporting year.
Percentage of CTE concentrators from underrepresented gender groups who completed a program that leads to employment in nontraditional fields during the reporting year.
PY 2010–11 Performance levels 71.00% 72.00% 91.33% 96.67% 83.33% 90.00% 40.00% 8.50%
PY 2010–11 Results 81.37% 72.74% 89.53% >95.00% 86.47% 91.32% 13.85% <10.00%
Special populations
Individuals with disabilities (ADA )
Individuals with disabilities (ESEA /IDEA )
Economically disadvantaged students
Single parents
Displaced homemakers
Limited English proficient students
Migrant students
Students in nontraditional programs
NP
55.62%
63.56%
NP
NP
42.47%
63.27%
NP
NP
>95.00%
>95.00%
>95.00%
>95.00%
>95.00%
NE
>95.00%
NP
84.52%
86.93%
90.91%
60.00%
81.63%
NE
89.36%
NP
<10.00%
<10.00%
<10.00%
<10.00%
<10.00%
<10.00%
NP
NP NP NP NP
57.01% 86.38% 83.64% 13.21%
73.52% 88.02% 81.44% 14.12%
NP 81.43% NP <10.00%
NP 83.33% NP 22.73%
36.15% 87.68% NP <10.00%
59.09% >95.00% NP 50.00%
NP 91.81% NP NP Tech prep NP NP 89.71% >95.00% NP 91.55% 14.31% <10.00% NOTE: This table contains the results for students whom the state has identified as concentrators or participants (participants are only indicated by the state under the nontraditional participation core indicator) in career and technical education (CTE). See Appendix A, Table A-1 for the state’s definition of CTE concentrators and Table A-2 for the state’s definition of CTE participants. Definitions for special populations are provided in the Glossary of Terms in this report. Actual performance data above 95 percent and below 10 percent have been masked to protect student confidentiality. NE—state reported no enrollment; NP—data not provided; PNO—state reported program not offered; NA—data not applicable ADA—Americans with Disabilities Act; ESEA—Elementary and Secondary Education Act of 1965, as amended; IDEA—Individuals with Disabilities Education Act

APPENDIX B. INDIVIDUAL STATE PERFORMANCE PROFILES, PY 2010–11 | 239
Oklahoma Secondary Level—continued
Core indicators
Academic attainment: Reading/
language arts Academic attainment:
Mathematics T echnical skill
attainment School
completion Student
graduation rates Placement Nontraditional participation
Nontraditional completion
Gender
Male
Female
70.79%
74.78%
>95.00%
>95.00%
91.55%
91.04%
<10.00%
10.54%
78.61% 86.70% NP <10.00%
84.33% 92.97% NP 21.95%
Race/ethnicity
American Indian or Alaska Native
Asian
Black or African American
Hispanic or Latino Native Hawaiian or Other Pacific Islander White
Two or more races
NA*
NA*
NA*
NA*
NA*
NA*
NA*
>95.00%
>95.00%
>95.00%
>95.00%
NE
>95.00%
NE
NA*
NA*
NA*
NA*
NA*
NA*
NA*
<10.00%
13.48%
<10.00%
<10.00%
NE
<10.00%
NE
NA* 90.57% NA* 16.32%
NA* 86.21% NA* 20.62%
NA* 84.34% NA* 16.87%
NA* 84.94% NA* 12.43%
NA* NE NA* NE
NA* 90.41% NA* 12.93%
NA* NE NA* NE NA*—The state was unable to collect and report race/ethnicity data for this particular cell in accordance with the required 1997 race/ethnicity categories. While the state did report data using the 1977 race/ethnicity categories, we are only reporting data provided by the states according to the 1997 race/ethnicity categories described in the Department’s Oct. 19, 2007, memorandum titled “Final Guidance on Maintaining, Collecting, and Reporting Racial and Ethnic Data” (see 72 Federal Register 59266).
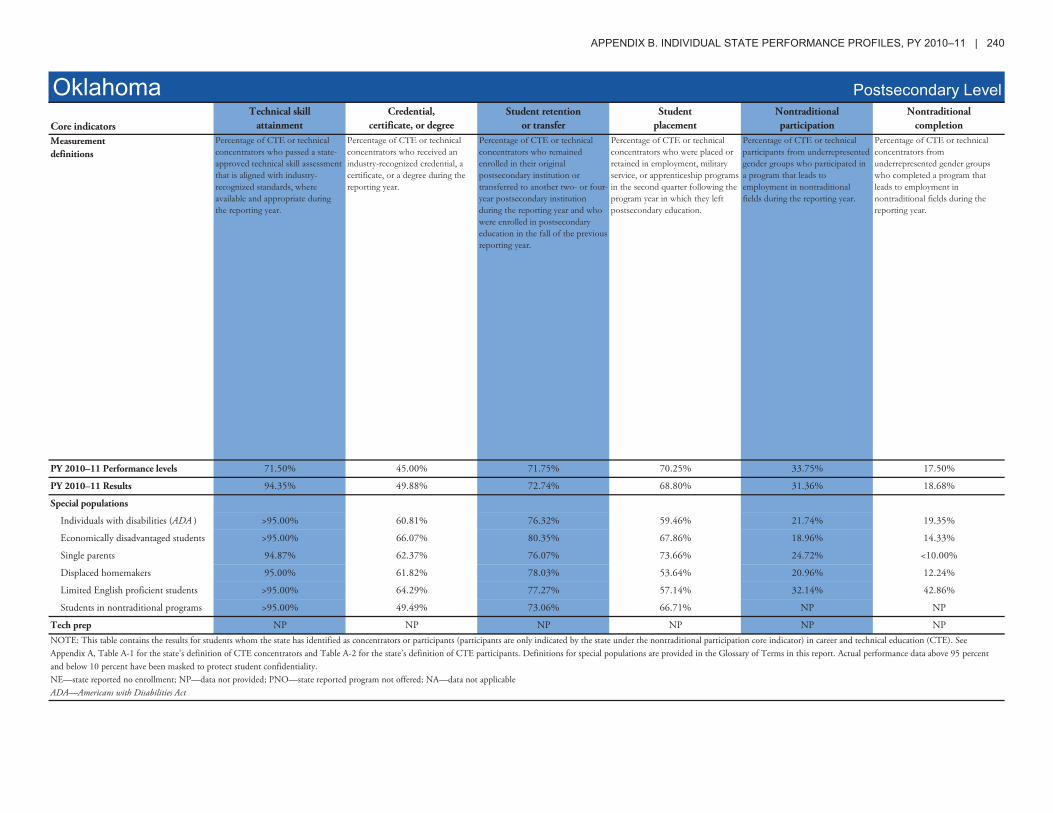
APPENDIX B. INDIVIDUAL STATE PERFORMANCE PROFILES, PY 2010–11 | 240
Oklahoma Postsecondary Level
Core indicators T echnical skill
attainment Credential,
certificate, or degree Student retention
or transfer Student
placement Nontraditional participation
Nontraditional completion
Measurement definitions
Percentage of CTE or technical concentrators who passed a state-approved technical skill assessment that is aligned with industry-recognized standards, where available and appropriate during the reporting year.
Percentage of CTE or technical concentrators who received an industry-recognized credential, a certificate, or a degree during the reporting year.
Percentage of CTE or technical concentrators who remained enrolled in their original postsecondary institution or transferred to another two- or four-year postsecondary institution during the reporting year and who were enrolled in postsecondary education in the fall of the previous reporting year.
Percentage of CTE or technical concentrators who were placed or retained in employment, military service, or apprenticeship programs in the second quarter following the program year in which they left postsecondary education.
Percentage of CTE or technical participants from underrepresented gender groups who participated in a program that leads to employment in nontraditional fields during the reporting year.
Percentage of CTE or technical concentrators from underrepresented gender groups who completed a program that leads to employment in nontraditional fields during the reporting year.
PY 2010–11 Performance levels 71.50% 45.00% 71.75% 70.25% 33.75% 17.50%
PY 2010–11 Results 94.35% 49.88% 72.74% 68.80% 31.36% 18.68%
Special populations
Individuals with disabilities (ADA )
Economically disadvantaged students
Single parents
Displaced homemakers
Limited English proficient students
Students in nontraditional programs
60.81%
66.07%
62.37%
61.82%
64.29%
49.49%
59.46%
67.86%
73.66%
53.64%
57.14%
66.71%
19.35%
14.33%
<10.00%
12.24%
42.86%
NP
>95.00% 76.32% 21.74%
>95.00% 80.35% 18.96%
94.87% 76.07% 24.72%
95.00% 78.03% 20.96%
>95.00% 77.27% 32.14%
>95.00% 73.06% NP
T ech prep NP NP NP NP NP NP NOTE: This table contains the results for students whom the state has identified as concentrators or participants (participants are only indicated by the state under the nontraditional participation core indicator) in career and technical education (CTE). See Appendix A, Table A-1 for the state’s definition of CTE concentrators and Table A-2 for the state’s definition of CTE participants. Definitions for special populations are provided in the Glossary of Terms in this report. Actual performance data above 95 percent and below 10 percent have been masked to protect student confidentiality. NE—state reported no enrollment; NP—data not provided; PNO—state reported program not offered; NA—data not applicable ADA—Americans with Disabilities Act

APPENDIX B. INDIVIDUAL STATE PERFORMANCE PROFILES, PY 2010–11 | 241
Oklahoma Postsecondary Level—continued
Core indicators T echnical skill
attainment Credential,
certificate, or degree Student retention
or transfer Student
placement Nontraditional participation
Nontraditional completion
Gender
Male
Female
45.27%
52.42%
64.87%
70.98%
30.43%
13.67%
>95.00% 71.80% 15.52%
90.89% 73.26% 46.46%
Race/ethnicity
American Indian or Alaska Native
Asian
Black or African American
Hispanic or Latino Native Hawaiian or Other Pacific Islander White
Two or more races
53.59%
54.36%
43.71%
46.22%
75.00%
51.38%
37.24%
72.82%
59.06%
69.05%
65.27%
66.67%
69.62%
68.57%
14.91%
19.72%
22.39%
26.81%
12.50%
17.79%
31.25%
92.41% 72.30% 31.00%
>95.00% 77.53% 32.58%
88.46% 70.34% 37.81%
>95.00% 73.12% 34.59%
>95.00% 84.62% 26.09%
94.89% 73.29% 30.11%
85.71% 68.09% 43.18%

APPENDIX B. INDIVIDUAL STATE PERFORMANCE PROFILES, PY 2010–11 | 242
Oklahoma Adult Level
Core indicators T echnical skill
attainment Credential,
certificate, or degree Student retention
or transfer Student
placement Nontraditional participation
Nontraditional completion
Measurement definitions
Percentage of CTE or technical concentrators who passed a state-approved technical skill assessment that is aligned with industry-recognized standards, where available and appropriate during the reporting year.
Percentage of CTE or technical concentrators who received an industry-recognized credential, a certificate, or a degree during the reporting year.
Percentage of CTE or technical concentrators who remained enrolled in their original postsecondary institution or transferred to another two- or four-year postsecondary institution during the reporting year and who were enrolled in postsecondary education in the fall of the previous reporting year.
Percentage of CTE or technical concentrators who were placed or retained in employment, military service, or apprenticeship programs in the second quarter following the program year in which they left postsecondary education.
Percentage of CTE or technical participants from underrepresented gender groups who participated in a program that leads to employment in nontraditional fields during the reporting year.
Percentage of CTE or technical concentrators from underrepresented gender groups who completed a program that leads to employment in nontraditional fields during the reporting year.
PY 2010–11 Performance levels 95.75% 95.45% 91.50% 78.00% 13.00% 12.00%
PY 2010–11 Results >95.00% 94.50% 88.81% 82.85% 10.98% 10.61%
Special populations
Individuals with disabilities (ADA )
Economically disadvantaged students
Single parents
Displaced homemakers
Limited English proficient students
Students in nontraditional programs
>95.00%
>95.00%
94.37%
>95.00%
>95.00%
>95.00%
75.12%
80.37%
75.12%
79.45%
79.49%
78.82%
13.51%
<10.00%
<10.00%
10.51%
17.11%
NP
93.66% 87.04% 12.64%
>95.00% 89.64% <10.00%
>95.00% 86.94% 10.60%
94.97% 92.16% <10.00%
95.00% 93.55% 15.62%
>95.00% 90.91% NP
T ech prep >95.00% >95.00% 88.52% 82.26% 12.70% 13.18% NOTE: This table contains the results for students whom the state has identified as concentrators or participants (participants are only indicated by the state under the nontraditional participation core indicator) in career and technical education (CTE). See Appendix A, Table A-1 for the state’s definition of CTE concentrators and Table A-2 for the state’s definition of CTE participants. Definitions for special populations are provided in the Glossary of Terms in this report. Actual performance data above 95 percent and below 10 percent have been masked to protect student confidentiality. NE—state reported no enrollment; NP—data not provided; PNO—state reported program not offered; NA—data not applicable ADA—Americans with Disabilities Act

APPENDIX B. INDIVIDUAL STATE PERFORMANCE PROFILES, PY 2010–11 | 243
Oklahoma Adult Level—continued
Core indicators T echnical skill
attainment Credential,
certificate, or degree Student retention
or transfer Student
placement Nontraditional participation
Nontraditional completion
Gender
Male
Female
94.34%
94.64%
83.67%
82.11%
10.81%
10.43%
>95.00% 88.59% 10.27%
>95.00% 89.02% 11.68%
Race/ethnicity
American Indian or Alaska Native
Asian
Black or African American
Hispanic or Latino Native Hawaiian or Other Pacific Islander White
Two or more races
NA*
NA*
NA*
NA*
NA*
NA*
NA*
NA*
NA*
NA*
NA*
NA*
NA*
NA*
NA*
NA*
NA*
NA*
NA*
NA*
NA*
NA* NA* NA*
NA* NA* NA*
NA* NA* NA*
NA* NA* NA*
NA* NA* NA*
NA* NA* NA*
NA* NA* NA* NA*—The state was unable to collect and report race/ethnicity data for this particular cell in accordance with the required 1997 race/ethnicity categories. While the state did report data using the 1977 race/ethnicity categories, we are only reporting data provided by the states according to the 1997 race/ethnicity categories as required in the Department’s Oct. 19, 2007, memorandum titled “Final Guidance on Maintaining, Collecting, and Reporting Racial and Ethnic Data” (see 72 Federal Register 59266).

APPENDIX B. INDIVIDUAL STATE PERFORMANCE PROFILES, PY 2010–11 | 244
Oregon Secondary Level
Core indicators
Academic attainment: Reading/
language arts Academic attainment:
Mathematics T echnical skill
attainment School
completion Student
graduation rates Placement Nontraditional participation
Nontraditional completion
Measurement definitions
Percentage of CTE concentrators who have met the proficient or advanced level on Oregon's reading and language arts assessment as administered under ESEA of CTE concentrators who, in the reporting year, completed high school.
Percentage of CTE concentrators who have met the proficient or advanced level on Oregon's mathematics assessment as administered under ESEA of CTE concentrators who, in the reporting year, completed high school.
Percentage of CTE concentrators who completed their CTE program and took and passed valid and reliable technical skill measurements that are aligned with industry-recognized standards, if available and appropriate, and completed high school during the reporting year.
Percentage of CTE concentrators who earned a regular secondary school diploma, earned a General Education Development (GED) credential or other Oregon-recognized equivalent (including recognized alternative standards for individuals with disabilities), and left secondary education, during the reporting year.
Percentage of CTE concentrators who were reported in the current data collections as graduated in the reporting year.
Percentage of CTE concentrators who completed high school and were found in postsecondary education or advanced training, in the military service, or employment in the second quarter following the program year in which they completed high school (i.e., unduplicated placement status for CTE concentrators who graduated by June 30, 2008 would be determined between Oct. 1, 2008 and Dec. 31, 2008).
Percentage of CTE participants from underrepresented gender groups who participated in a program that leads to employment in nontraditional fields during the reporting year.
Percentage of CTE concentrators from underrepresented gender groups who completed a program that leads to employment in nontraditional fields during the reporting year and completed high school.
PY 2010–11 Performance levels 70.00% 70.00% 50.00% 95.00% 68.10% 59.00% 36.50% 21.00%
PY 2010–11 Results 75.16% 67.68% 58.36% 86.55% 85.36% 10.51% 46.16% 44.84%
Special populations
Individuals with disabilities (ADA )
Individuals with disabilities (ESEA /IDEA )
Economically disadvantaged students
Single parents
Displaced homemakers
Limited English proficient students
Migrant students
Students in nontraditional programs
NP
24.00%
57.77%
37.31%
NE
23.89%
52.04%
66.35%
NP
73.35%
83.30%
69.90%
NE
79.76%
85.53%
87.05%
NP
<10.00%
<10.00%
<10.00%
NE
<10.00%
<10.00%
10.21%
NP
26.72%
48.30%
63.64%
NE
36.36%
47.62%
NP
NP NP NP NP
29.56% 41.38% 59.41% 32.81%
64.91% 52.12% 81.75% 45.39%
43.70% 20.00% 69.27% 55.44%
NE NE NE NE
13.41% 40.91% 76.74% 41.23%
52.88% 52.63% 83.83% 39.55%
76.35% 52.75% 85.98% NP Tech prep NE NE NE NE NE NE NE NE NOTE: This table contains the results for students whom the state has identified as concentrators or participants (participants are only indicated by the state under the nontraditional participation core indicator) in career and technical education (CTE). See Appendix A, Table A-1 for the state’s definition of CTE concentrators and Table A-2 for the state’s definition of CTE participants. Definitions for special populations are provided in the Glossary of Terms in this report. Actual performance data above 95 percent and below 10 percent have been masked to protect student confidentiality. NE—state reported no enrollment; NP—data not provided; PNO—state reported program not offered; NA—data not applicable ADA—Americans with Disabilities Act; ESEA—Elementary and Secondary Education Act of 1965, as amended; IDEA—Individuals with Disabilities Education Act

APPENDIX B. INDIVIDUAL STATE PERFORMANCE PROFILES, PY 2010–11 | 245
Oregon Secondary Level—continued
Core indicators
Academic attainment: Reading/
language arts Academic attainment:
Mathematics T echnical skill
attainment School
completion Student
graduation rates Placement Nontraditional participation
Nontraditional completion
Gender
Male
Female
69.86%
65.15%
84.54%
89.02%
<10.00%
11.62%
39.22%
52.02%
73.78% 53.13% 83.01% 32.01%
76.76% 63.56% 88.23% 64.82%
Race/ethnicity
American Indian or Alaska Native
Asian
Black or African American
Hispanic or Latino Native Hawaiian or Other Pacific Islander White
Two or more races
53.65%
80.62%
46.97%
54.39%
44.78%
70.47%
68.82%
79.07%
91.91%
81.96%
84.85%
86.42%
86.82%
88.01%
<10.00%
17.70%
<10.00%
<10.00%
NE
10.96%
<10.00%
45.00%
44.76%
40.00%
47.57%
66.67%
44.25%
45.90%
60.09% 68.75% 77.44% 49.03%
75.70% 45.88% 91.62% 52.17%
56.70% 34.62% 80.00% 45.35%
58.17% 58.08% 83.56% 43.50%
51.52% 62.50% 85.19% 45.10%
79.38% 60.35% 85.69% 46.36%
76.92% 50.00% 85.67% 47.54%

APPENDIX B. INDIVIDUAL STATE PERFORMANCE PROFILES, PY 2010–11 | 246
Oregon Postsecondary Level
Core indicators T echnical skill
attainment Credential,
certificate, or degree Student retention
or transfer Student
placement Nontraditional participation
Nontraditional completion
Measurement definitions
Percentage of CTE concentrators who completed their CTE program and took and passed valid and reliable technical skill assessments that are aligned with industry-recognized standards, if available and appropriate, during the reporting year or the following year.
Percentage of CTE concentrators in the previous reporting year who earned a degree, a certificate of completion or an industry-recognized credential and left during the previous reporting year or the current reporting year.
Percentage of CTE concentrators enrolled in the previous reporting year who did not earn an associate of applied science degree in the previous reporting year and remained enrolled in their original postsecondary institution or transferred to another two- or four-year postsecondary institution at any time during the following academic year.
Percentage of CTE concentrators who earned a degree, certificate of completion, or industry-recognized credential in the previous reporting year and were placed or retained in employment, or placed in military service or apprenticeship programs in the second quarter following the program year in which they left postsecondary education (i.e. unduplicated placement status for CTE concentrators who completed by June 30, 2008 would be determined between Oct. 1, 2008 and Dec. 31, 2008).
Percentage of CTE participants from underrepresented gender groups who participated in a program that leads to employment in nontraditional fields during the reporting year.
Percentage of CTE concentrators from underrepresented gender groups who earned a degree, a certificate of completion or an industry recognized credential in a program that leads to employment in nontraditional fields and left during the previous reporting year or the current reporting year.
PY 2010–11 Performance levels 70.00% 46.50% 67.73% 74.00% 21.26% 57.50%
PY 2010–11 Results >95.00% 46.77% 75.61% 71.50% 21.26% 47.20%
Special populations
Individuals with disabilities (ADA )
Economically disadvantaged students
Single parents
Displaced homemakers
Limited English proficient students
Students in nontraditional programs
47.03%
46.47%
NP
33.33%
60.49%
47.20%
60.00%
73.75%
NP
>95.00%
67.42%
65.94%
54.55%
43.70%
NP
37.50%
48.15%
NP
>95.00% 74.84% 26.39%
>95.00% 80.91% 21.64%
NP NP NP
NE 90.91% 29.27%
>95.00% 71.27% 23.15%
>95.00% 77.51% NP
T ech prep NP NP NP NP NP NP NOTE: This table contains the results for students whom the state has identified as concentrators or participants (participants are only indicated by the state under the nontraditional participation core indicator) in career and technical education (CTE). See Appendix A, Table A-1 for the state’s definition of CTE concentrators and Table A-2 for the state’s definition of CTE participants. Definitions for special populations are provided in the Glossary of Terms in this report. Actual performance data above 95 percent and below 10 percent have been masked to protect student confidentiality. NE—state reported no enrollment; NP—data not provided; PNO—state reported program not offered; NA—data not applicable ADA—Americans with Disabilities Act

APPENDIX B. INDIVIDUAL STATE PERFORMANCE PROFILES, PY 2010–11 | 247
Oregon Postsecondary Level—continued
Core indicators T echnical skill
attainment Credential,
certificate, or degree Student retention
or transfer Student
placement Nontraditional participation
Nontraditional completion
Gender
Male
Female
39.72%
53.18%
68.02%
73.64%
57.09%
41.98%
94.05% 74.35% 10.92%
>95.00% 76.84% 33.43%
Race/ethnicity
American Indian or Alaska Native
Asian
Black or African American
Hispanic or Latino Native Hawaiian or Other Pacific Islander White
Two or more races
37.31%
59.03%
46.21%
43.30%
45.83%
48.06%
45.95%
65.79%
65.31%
58.97%
72.88%
>95.00%
71.27%
83.33%
50.00%
60.53%
52.17%
42.35%
<10.00%
46.26%
33.33%
66.67% 74.24% 22.89%
>95.00% 73.79% 25.84%
>95.00% 75.73% 24.20%
>95.00% 79.23% 21.12%
>95.00% 84.21% 18.18%
>95.00% 75.45% 20.82%
NP 76.67% 28.12%

APPENDIX B. INDIVIDUAL STATE PERFORMANCE PROFILES, PY 2010–11 | 248
Pennsylvania Secondary Level
Core indicators
Academic attainment: Reading/
language arts Academic attainment:
Mathematics T echnical skill
attainment School
completion Student
graduation rates Placement Nontraditional participation
Nontraditional completion
Measurement definitions
Percentage of CTE concentrators who have met the proficient or advanced level on the statewide high school reading and language arts assessment administered by the state under ESEA and who, in the reporting year, left secondary education.
Percentage of CTE concentrators who have met the proficient or advanced level on the statewide high school mathematics assessment administered by the state under ESEA and who, in the reporting year, left secondary education.
Percentage of CTE concentrators who successfully achieve competency levels at or above the competent level on the National Occupational Competency Testing Institute's (NOCTI) Job Ready Occupational Specific Assessments or achieve competency on other Pennsylvania Department of Education (PDE) approved tests in the reporting year.
Percentage of CTE concentrators who earned a regular secondary school diploma, earned a General Education Development (GED) credential as a state-recognized equivalent to a regular high school diploma (if offered by the state) or other state-recognized equivalent (including recognized alternative standards for individuals with disabilities), or earned a proficiency credential, certificate, or degree, in conjunction with a secondary school diploma (if offered by the state) during the reporting year.
Percentage of CTE concentrators who, in the reporting year, were included as graduated in the state's computation of its graduation rate as described in ESEA .
Percentage of respondents to the PDE follow-up survey who were reported as employed; pursuing additional education or training; or in the military.
Percentage of CTE participants from underrepresented gender groups who participated in a program that leads to employment in nontraditional fields during the reporting year.
Percentage of CTE concentrators from underrepresented gender groups who completed a program that leads to employment in nontraditional fields during the reporting year.
PY 2010–11 Performance levels 44.00% 35.00% 64.00% 93.00% 93.00% 95.50% 18.75% 13.75%
PY 2010–11 Results 46.70% 39.45% 76.13% >95.00% >95.00% 87.79% 16.12% 12.71%
Special populations
Individuals with disabilities (ADA )
Individuals with disabilities (ESEA /IDEA )
Economically disadvantaged students
Single parents
Displaced homemakers
Limited English proficient students
Migrant students
Students in nontraditional programs
NP
20.22%
33.42%
27.23%
NE
14.92%
66.67%
44.88%
NP
>95.00%
>95.00%
>95.00%
NE
>95.00%
>95.00%
>95.00%
NP
88.24%
82.87%
70.97%
NE
83.87%
78.57%
87.80%
NP
<10.00%
15.09%
12.07%
NE
15.38%
<10.00%
NP
NP NP NP NP
18.47% 65.83% >95.00% 11.76%
40.99% 72.58% >95.00% 17.84%
40.00% 79.53% 93.89% 16.34%
NE NE NE <10.00%
10.67% 57.83% >95.00% 18.28%
33.33% >95.00% >95.00% 20.51%
56.11% 62.93% >95.00% NP Tech prep 49.27% 41.08% 80.87% >95.00% >95.00% 89.55% 16.01% 15.22% NOTE: This table contains the results for students whom the state has identified as concentrators or participants (participants are only indicated by the state under the nontraditional participation core indicator) in career and technical education (CTE). See Appendix A, Table A-1 for the state’s definition of CTE concentrators and Table A-2 for the state’s definition of CTE participants. Definitions for special populations are provided in the Glossary of Terms in this report. Actual performance data above 95 percent and below 10 percent have been masked to protect student confidentiality. NE—state reported no enrollment; NP—data not provided; PNO—state reported program not offered; NA—data not applicable ADA—Americans with Disabilities Act; ESEA—Elementary and Secondary Education Act of 1965, as amended; IDEA—Individuals with Disabilities Education Act

APPENDIX B. INDIVIDUAL STATE PERFORMANCE PROFILES, PY 2010–11 | 249
Pennsylvania Secondary Level—continued
Core indicators
Academic attainment: Reading/
language arts Academic attainment:
Mathematics T echnical skill
attainment School
completion Student
graduation rates Placement Nontraditional participation
Nontraditional completion
Gender
Male
Female
41.48%
36.64%
>95.00%
>95.00%
87.75%
87.83%
<10.00%
27.35%
44.04% 73.16% >95.00% <10.00%
50.39% 80.40% >95.00% 32.26%
Race/ethnicity
American Indian or Alaska Native
Asian
Black or African American
Hispanic or Latino Native Hawaiian or Other Pacific Islander White
Two or more races
37.14%
69.46%
29.47%
28.28%
33.33%
41.71%
40.79%
93.33%
>95.00%
>95.00%
>95.00%
>95.00%
>95.00%
>95.00%
85.71%
>95.00%
83.68%
84.57%
NE
88.18%
77.78%
15.62%
21.00%
21.11%
14.38%
<10.00%
11.46%
<10.00%
31.43% 69.23% >95.00% 16.38%
57.58% 72.48% >95.00% 27.67%
40.86% 65.96% >95.00% 23.10%
36.85% 69.99% >95.00% 17.59%
33.33% 66.67% >95.00% 20.00%
48.44% 78.13% >95.00% 14.91%
53.95% 76.56% >95.00% 15.25%
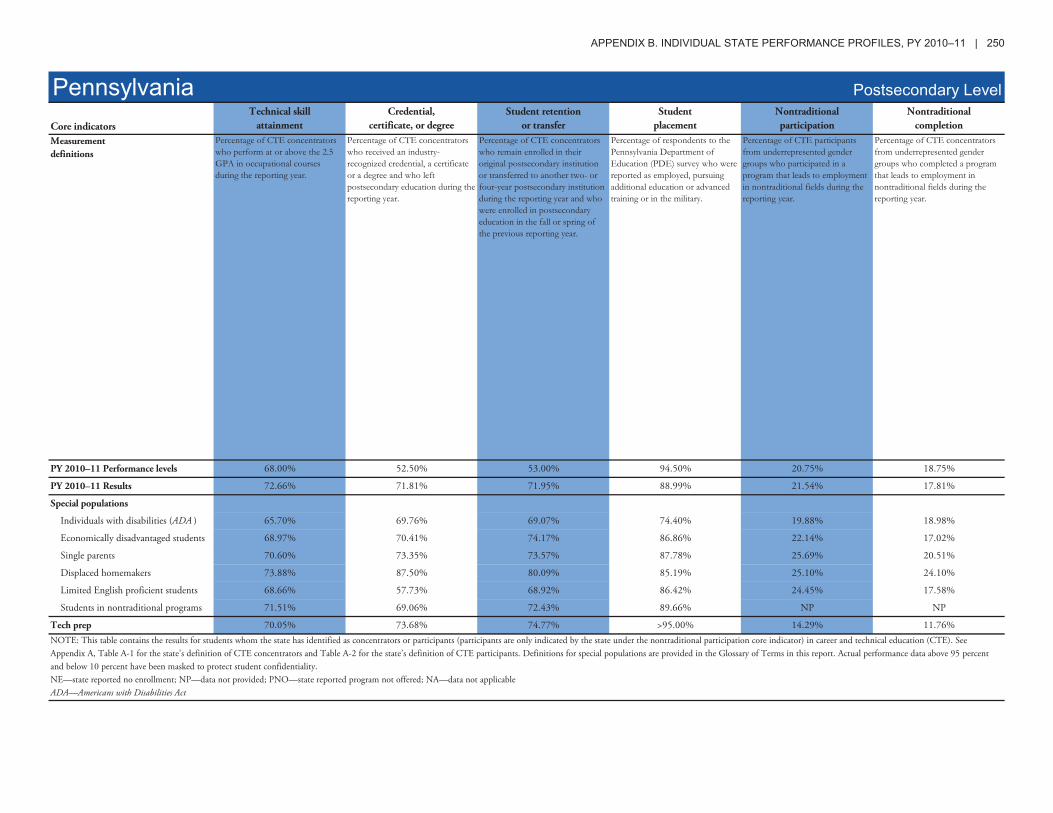
APPENDIX B. INDIVIDUAL STATE PERFORMANCE PROFILES, PY 2010–11 | 250
Pennsylvania Postsecondary Level
Core indicators T echnical skill
attainment Credential,
certificate, or degree Student retention
or transfer Student
placement Nontraditional participation
Nontraditional completion
Measurement definitions
Percentage of CTE concentrators who perform at or above the 2.5 GPA in occupational courses during the reporting year.
Percentage of CTE concentrators who received an industry-recognized credential, a certificate or a degree and who left postsecondary education during the reporting year.
Percentage of CTE concentrators who remain enrolled in their original postsecondary institution or transferred to another two- or four-year postsecondary institution during the reporting year and who were enrolled in postsecondary education in the fall or spring of the previous reporting year.
Percentage of respondents to the Pennsylvania Department of Education (PDE) survey who were reported as employed, pursuing additional education or advanced training or in the military.
Percentage of CTE participants from underrepresented gender groups who participated in a program that leads to employment in nontraditional fields during the reporting year.
Percentage of CTE concentrators from underrepresented gender groups who completed a program that leads to employment in nontraditional fields during the reporting year.
PY 2010–11 Performance levels 68.00% 52.50% 53.00% 94.50% 20.75% 18.75%
PY 2010–11 Results 72.66% 71.81% 71.95% 88.99% 21.54% 17.81%
Special populations
Individuals with disabilities (ADA )
Economically disadvantaged students
Single parents
Displaced homemakers
Limited English proficient students
Students in nontraditional programs
69.76%
70.41%
73.35%
87.50%
57.73%
69.06%
74.40%
86.86%
87.78%
85.19%
86.42%
89.66%
18.98%
17.02%
20.51%
24.10%
17.58%
NP
65.70% 69.07% 19.88%
68.97% 74.17% 22.14%
70.60% 73.57% 25.69%
73.88% 80.09% 25.10%
68.66% 68.92% 24.45%
71.51% 72.43% NP
T ech prep 70.05% 73.68% 74.77% >95.00% 14.29% 11.76% NOTE: This table contains the results for students whom the state has identified as concentrators or participants (participants are only indicated by the state under the nontraditional participation core indicator) in career and technical education (CTE). See Appendix A, Table A-1 for the state’s definition of CTE concentrators and Table A-2 for the state’s definition of CTE participants. Definitions for special populations are provided in the Glossary of Terms in this report. Actual performance data above 95 percent and below 10 percent have been masked to protect student confidentiality. NE—state reported no enrollment; NP—data not provided; PNO—state reported program not offered; NA—data not applicable ADA—Americans with Disabilities Act

APPENDIX B. INDIVIDUAL STATE PERFORMANCE PROFILES, PY 2010–11 | 251
Pennsylvania Postsecondary Level—continued
Core indicators T echnical skill
attainment Credential,
certificate, or degree Student retention
or transfer Student
placement Nontraditional participation
Nontraditional completion
Gender
Male
Female
73.15%
70.86%
89.09%
88.93%
15.90%
19.27%
71.16% 69.60% 17.88%
73.76% 73.56% 24.29%
Race/ethnicity
American Indian or Alaska Native
Asian
Black or African American
Hispanic or Latino Native Hawaiian or Other Pacific Islander White
Two or more races
64.58%
72.50%
68.27%
65.35%
65.00%
72.65%
63.92%
92.86%
88.68%
85.90%
86.96%
>95.00%
89.72%
87.50%
14.29%
15.73%
18.87%
21.03%
18.18%
17.49%
30.19%
66.07% 71.28% 26.57%
75.09% 70.05% 24.91%
62.26% 67.60% 25.63%
65.98% 71.04% 25.55%
71.43% 73.91% 14.93%
75.67% 73.05% 19.86%
61.51% 73.83% 26.42%

APPENDIX B. INDIVIDUAL STATE PERFORMANCE PROFILES, PY 2010–11 | 252
Puerto Rico Secondary Level
Core indicators
Academic attainment: Reading/
language arts Academic attainment:
Mathematics T echnical skill
attainment School
completion Student
graduation rates Placement Nontraditional participation
Nontraditional completion
Measurement definitions
Percentage of CTE concentrators who have met the proficient or advanced level on the statewide high school reading and language arts assessment administered by the state under ESEA and who, in the reporting year, left secondary education.
Percentage of CTE concentrators who have met the proficient or advanced level on the statewide high school mathematics assessment administered by the state under ESEA and who, in the reporting year, left secondary education.
Percentage of CTE concentrators who passed technical skill assessments that are aligned with industry-recognized standards, if available and appropriate, during the reporting year.
Percentage of CTE concentrators who earned a regular secondary school diploma, earned a General Education Development (GED) credential as a state-recognized equivalent to a regular high school diploma (if offered by the state) or other state-recognized equivalent (including recognized alternative standards for individuals with disabilities), or earned a proficiency credential, certificate, or degree, in conjunction with a secondary school diploma (if offered by the state) during the reporting year.
Percentage of CTE concentrators who, in the reporting year, were included as graduated in the state's computation of its graduation rate as described in ESEA .
Percentage of CTE concentrators who left secondary education and were placed in postsecondary education or advanced training, in the military service, or employment in the second quarter following the program year in which they left secondary education (i.e., unduplicated placement status for CTE concentrators who graduated by June 30, 2007 would be assessed between Oct. 1, 2007 and Dec. 31, 2007).
Percentage of CTE participants from underrepresented gender groups who participated in a program that leads to employment in nontraditional fields during the reporting year.
Percentage of CTE concentrators from underrepresented gender groups who completed a program that leads to employment in nontraditional fields during the reporting year.
PY 2010–11 Performance levels 58.00% 44.00% 89.00% 82.00% 93.00% 49.00% 10.50% 11.00%
PY 2010–11 Results 54.06% <10.00% 90.13% >95.00% 92.71% 30.85% 13.54% 13.54%
Special populations
Individuals with disabilities (ADA )
Individuals with disabilities (ESEA /IDEA )
Economically disadvantaged students
Single parents
Displaced homemakers
Limited English proficient students
Migrant students
Students in nontraditional programs
NP
<10.00%
<10.00%
<10.00%
NE
10.00%
NE
<10.00%
NP
>95.00%
>95.00%
>95.00%
>95.00%
>95.00%
NE
NP
NP
28.06%
31.48%
61.76%
<10.00%
30.00%
NE
37.50%
NP
14.31%
12.98%
<10.00%
<10.00%
<10.00%
NE
NP
NP NP NP NP
29.74% 90.52% 91.12% 14.31%
51.69% 91.47% 91.94% 12.98%
47.22% >95.00% >95.00% <10.00%
NE >95.00% >95.00% <10.00%
45.00% 80.00% 95.00% <10.00%
NE NE NE NE
54.87% 88.43% 94.74% NP Tech prep NP NP NP NP NP PNO NP NP NOTE: This table contains the results for students whom the state has identified as concentrators or participants (participants are only indicated by the state under the nontraditional participation core indicator) in career and technical education (CTE). See Appendix A, Table A-1 for the state’s definition of CTE concentrators and Table A-2 for the state’s definition of CTE participants. Definitions for special populations are provided in the Glossary of Terms in this report. Actual performance data above 95 percent and below 10 percent have been masked to protect student confidentiality. NE—state reported no enrollment; NP—data not provided; PNO—state reported program not offered; NA—data not applicable ADA—Americans with Disabilities Act; ESEA—Elementary and Secondary Education Act of 1965, as amended; IDEA—Individuals with Disabilities Education Act

APPENDIX B. INDIVIDUAL STATE PERFORMANCE PROFILES, PY 2010–11 | 253
Puerto Rico Secondary Level—continued
Core indicators
Academic attainment: Reading/
language arts Academic attainment:
Mathematics T echnical skill
attainment School
completion Student
graduation rates Placement Nontraditional participation
Nontraditional completion
Gender
Male
Female
<10.00%
<10.00%
>95.00%
>95.00%
32.37%
28.95%
25.52%
<10.00%
49.43% 88.32% 91.02% 25.52%
58.19% 90.83% 94.07% <10.00%
Race/ethnicity
American Indian or Alaska Native
Asian
Black or African American
Hispanic or Latino Native Hawaiian or Other Pacific Islander White
Two or more races
NP
NP
NP
<10.00%
NP
10.00%
NP
>95.00%
>95.00%
>95.00%
>95.00%
NP
>95.00%
NP
30.43%
33.33%
50.00%
30.86%
NE
20.00%
NE
NP
NP
NP
13.60%
NP
NP
NP
35.00% 81.82% >95.00% NP
>95.00% 66.67% >95.00% NP
NP >95.00% >95.00% NP
54.09% 90.20% 92.69% 13.60%
NP NP NP NP
50.00% 75.00% >95.00% NP
NP NP NP NP

APPENDIX B. INDIVIDUAL STATE PERFORMANCE PROFILES, PY 2010–11 | 254
Puerto Rico Postsecondary Level
Core indicators T echnical skill
attainment Credential,
certificate, or degree Student retention
or transfer Student
placement Nontraditional participation
Nontraditional completion
Measurement definitions
Percentage of CTE concentrators who passed technical skill assessments that are aligned with industry-recognized standards, if available and appropriate, during the reporting year.
Percentage of CTE concentrators who received an industry-recognized credential, a certificate, or a degree during the reporting year.
Percentage of CTE concentrators who remained enrolled in their original postsecondary institution or transferred to another two- or four-year postsecondary institution during the reporting year and who were enrolled in postsecondary education in the fall of the previous reporting year.
Percentage of CTE concentrators who were placed or retained in employment, or placed in military service or apprenticeship programs in the second quarter following the program year in which they left postsecondary education (i.e., unduplicated placement status for CTE concentrators who graduated by June 30, 2007 would be assessed between Oct. 1, 2007 and Dec. 31, 2007).
Percentage of CTE participants from underrepresented gender groups who participated in a program that leads to employment in nontraditional fields during the reporting year.
Percentage of CTE concentrators from underrepresented gender groups who completed a program that leads to employment in nontraditional fields during the reporting year.
PY 2010–11 Performance levels 86.00% 96.00% 72.00% 46.00% 11.50% 9.00%
PY 2010–11 Results 79.61% 90.51% 85.54% 48.04% 12.99% 10.74%
Special populations
Individuals with disabilities (ADA )
Economically disadvantaged students
Single parents
Displaced homemakers
Limited English proficient students
Students in nontraditional programs
77.78%
83.33%
88.00%
<10.00%
87.50%
78.95%
40.00%
46.81%
53.33%
33.33%
57.14%
47.30%
16.67%
10.69%
<10.00%
NE
<10.00%
NP
63.89% 80.00% 10.00%
79.29% 85.37% <10.00%
69.79% 84.09% 10.94%
20.00% 50.00% NE
79.31% 82.61% 10.00%
NP 83.76% NP
T ech prep PNO PNO PNO PNO PNO PNO NOTE: This table contains the results for students whom the state has identified as concentrators or participants (participants are only indicated by the state under the nontraditional participation core indicator) in career and technical education (CTE). See Appendix A, Table A-1 for the state’s definition of CTE concentrators and Table A-2 for the state’s definition of CTE participants. Definitions for special populations are provided in the Glossary of Terms in this report. Actual performance data above 95 percent and below 10 percent have been masked to protect student confidentiality. NE—state reported no enrollment; NP—data not provided; PNO—state reported program not offered; NA—data not applicable ADA—Americans with Disabilities Act

APPENDIX B. INDIVIDUAL STATE PERFORMANCE PROFILES, PY 2010–11 | 255
Puerto Rico Postsecondary Level—continued
Core indicators T echnical skill
attainment Credential,
certificate, or degree Student retention
or transfer Student
placement Nontraditional participation
Nontraditional completion
Gender
Male
Female
86.56%
>95.00%
46.47%
51.03%
<10.00%
16.82%
76.84% 83.88% 17.83%
84.39% 88.32% 10.58%
Race/ethnicity
American Indian or Alaska Native
Asian
Black or African American
Hispanic or Latino Native Hawaiian or Other Pacific Islander White
Two or more races
NP
NP
NP
90.51%
NP
NP
NP
NE
NE
NE
48.04%
NE
NE
NE
NE
NE
NE
<10.00%
NE
NE
NE
NE NP NE
NE NP NE
NE NP NE
79.61% 85.54% 12.99%
NE NP NE
NE NP NE
NE NP NE

APPENDIX B. INDIVIDUAL STATE PERFORMANCE PROFILES, PY 2010–11 | 256
Rhode Island Secondary Level
Core indicators
Academic attainment: Reading/
language arts Academic attainment:
Mathematics T echnical skill
attainment School
completion Student
graduation rates Placement Nontraditional participation
Nontraditional completion
Measurement definitions
Percentage of CTE concentrators who have met the proficient or advanced level on the statewide high school reading and language arts assessment administered by the state under ESEA and who, in the reporting year, left secondary education.
Percentage of CTE concentrators who have met the proficient or advanced level on the statewide high school mathematics assessment administered by the state under ESEA and who, in the reporting year, left secondary education.
Percentage of CTE concentrators who completed their CTE program and passed technical skill assessments in the sixteen cluster areas, if practicable, available and appropriate, that are aligned with industry-recognized standards.
Percentage of CTE concentrators who earned a regular secondary school diploma and left secondary education during the reporting year.
Percentage of CTE concentrators who, in the reporting year, were included as graduated in the state's computation of its graduation rate as described in ESEA .
Percentage of CTE concentrators who completed their CTE program and left secondary education in the reporting year and were placed in postsecondary education, advanced training, in the military service, or employment in the second quarter following the program year in which they left secondary education.
Percentage of CTE participants from underrepresented gender groups who participated in a program that leads to employment in nontraditional fields during the reporting year.
Percentage of CTE concentrators from underrepresented gender groups who completed a program that leads to employment in nontraditional fields during the reporting year.
PY 2010–11 Performance levels 49.00% 28.00% 34.00% 46.00% 80.00% 30.00% 10.75% 10.50%
PY 2010–11 Results 80.62% 32.16% >95.00% >95.00% 94.15% 63.57% 42.42% 40.26%
Special populations
Individuals with disabilities (ADA )
Individuals with disabilities (ESEA /IDEA )
Economically disadvantaged students
Single parents
Displaced homemakers
Limited English proficient students
Migrant students
Students in nontraditional programs
NP
<10.00%
18.40%
NP
NP
NP
NP
41.99%
NP
93.95%
94.87%
>95.00%
NE
>95.00%
NE
>95.00%
NP
41.71%
49.86%
>95.00%
NE
32.56%
PNO
74.08%
NP
20.05%
40.19%
NP
NP
41.67%
NE
NP
NP NP NP NP
34.44% 94.01% 87.64% 31.40%
72.28% >95.00% 90.84% 41.63%
>95.00% >95.00% >95.00% NP
NP NP NP NP
<10.00% >95.00% 89.76% 44.13%
NP NE NP NE
92.42% >95.00% >95.00% NP T ech prep NP NP NE NE NP PNO NP NP NOTE: This table contains the results for students whom the state has identified as concentrators or participants (participants are only indicated by the state under the nontraditional participation core indicator) in career and technical education (CTE). See Appendix A, Table A-1 for the state’s definition of CTE concentrators and Table A-2 for the state’s definition of CTE participants. Definitions for special populations are provided in the Glossary of Terms in this report. Actual performance data above 95 percent and below 10 percent have been masked to protect student confidentiality. NE—state reported no enrollment; NP—data not provided; PNO—state reported program not offered; NA—data not applicable ADA—Americans with Disabilities Act; ESEA—Elementary and Secondary Education Act of 1965, as amended; IDEA—Individuals with Disabilities Education Act
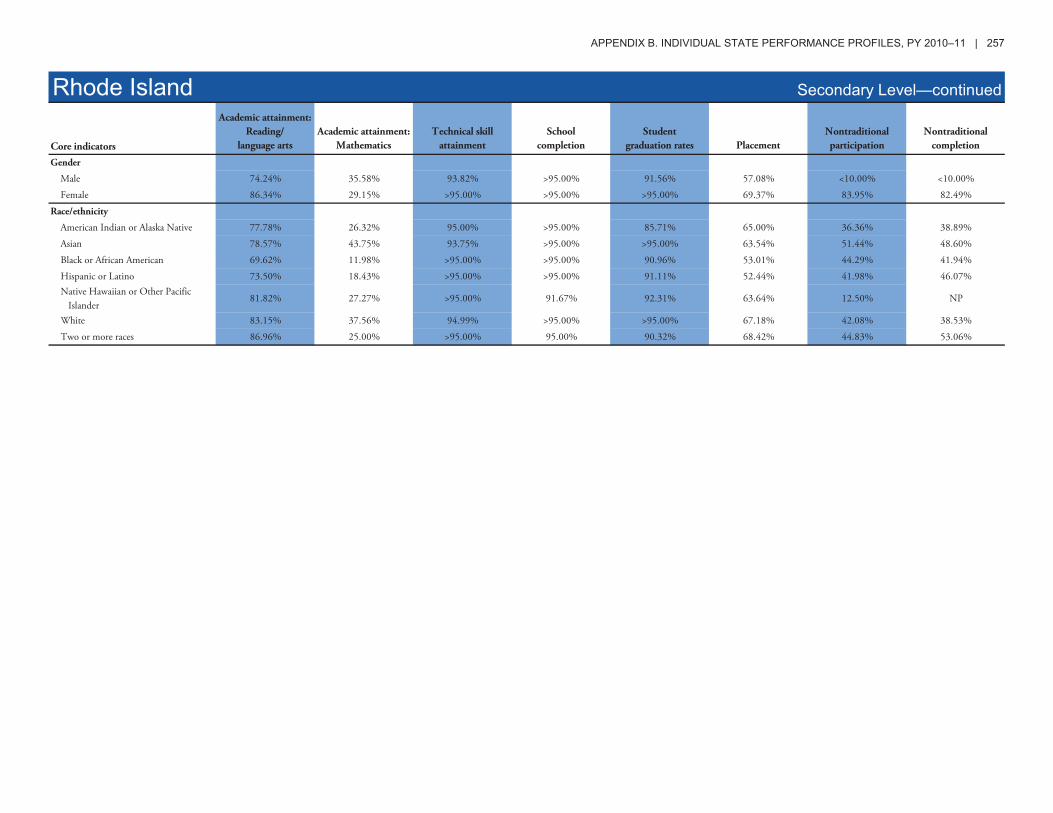
APPENDIX B. INDIVIDUAL STATE PERFORMANCE PROFILES, PY 2010–11 | 257
Rhode Island Secondary Level—continued
Core indicators
Academic attainment: Reading/
language arts Academic attainment:
Mathematics T echnical skill
attainment School
completion Student
graduation rates Placement Nontraditional participation
Nontraditional completion
Gender
Male
Female
35.58%
29.15%
>95.00%
>95.00%
57.08%
69.37%
<10.00%
82.49%
74.24% 93.82% 91.56% <10.00%
86.34% >95.00% >95.00% 83.95%
Race/ethnicity
American Indian or Alaska Native
Asian
Black or African American
Hispanic or Latino Native Hawaiian or Other Pacific Islander White
Two or more races
26.32%
43.75%
11.98%
18.43%
27.27%
37.56%
25.00%
>95.00%
>95.00%
>95.00%
>95.00%
91.67%
>95.00%
95.00%
65.00%
63.54%
53.01%
52.44%
63.64%
67.18%
68.42%
38.89%
48.60%
41.94%
46.07%
NP
38.53%
53.06%
77.78% 95.00% 85.71% 36.36%
78.57% 93.75% >95.00% 51.44%
69.62% >95.00% 90.96% 44.29%
73.50% >95.00% 91.11% 41.98%
81.82% >95.00% 92.31% 12.50%
83.15% 94.99% >95.00% 42.08%
86.96% >95.00% 90.32% 44.83%

APPENDIX B. INDIVIDUAL STATE PERFORMANCE PROFILES, PY 2010–11 | 258
Rhode Island Postsecondary Level
Core indicators T echnical skill
attainment Credential,
certificate, or degree Student retention
or transfer Student
placement Nontraditional participation
Nontraditional completion
Measurement definitions
Percentage of CTE concentrators who completed their CTE program and passed technical skill assessments that are aligned with industry standards, if available and appropriate, during the reporting year or earned a cumulative program GPA of 3.0 or higher.
Percentage of CTE concentrators who received an industry-recognized credential, a certificate, or a degree during the reporting year.
Percentage of CTE concentrators who remained enrolled in their original postsecondary institution or transferred to another two- or four-year postsecondary institution during the reporting year and who were enrolled in postsecondary education in the fall of the previous reporting year.
Percentage of CTE concentrators who were placed or retained in employment, or placed in military service or apprenticeship programs in the second quarter following the program year in which they left postsecondary education (i.e., unduplicated placement status for CTE concentrators who graduated by June 30, 2007 would be assessed between Oct. 1, 2007 and Dec. 31, 2007).
Percentage of CTE participants from underrepresented gender groups who participated in a program that leads to employment in nontraditional fields during the reporting year.
Percentage of CTE concentrators from underrepresented gender groups who completed a program that leads to employment in nontraditional fields during the reporting year.
PY 2010–11 Performance levels 57.00% 37.60% 50.50% 27.00% 16.55% 21.34%
PY 2010–11 Results 65.42% 36.47% 84.47% 20.80% 15.10% 21.55%
Special populations
Individuals with disabilities (ADA )
Economically disadvantaged students
Single parents
Displaced homemakers
Limited English proficient students
Students in nontraditional programs
NE
41.95%
30.43%
44.44%
PNO
45.51%
PNO
20.79%
11.76%
19.05%
PNO
48.59%
PNO
20.66%
12.50%
<10.00%
PNO
NP
PNO PNO PNO
60.73% 89.32% 17.77%
78.57% 90.62% 23.91%
87.50% 86.11% 33.33%
PNO PNO PNO
66.90% 80.61% NP
T ech prep PNO PNO PNO PNO PNO PNO NOTE: This table contains the results for students whom the state has identified as concentrators or participants (participants are only indicated by the state under the nontraditional participation core indicator) in career and technical education (CTE). See Appendix A, Table A-1 for the state’s definition of CTE concentrators and Table A-2 for the state’s definition of CTE participants. Definitions for special populations are provided in the Glossary of Terms in this report. Actual performance data above 95 percent and below 10 percent have been masked to protect student confidentiality. NE—state reported no enrollment; NP—data not provided; PNO—state reported program not offered; NA—data not applicable ADA—Americans with Disabilities Act

APPENDIX B. INDIVIDUAL STATE PERFORMANCE PROFILES, PY 2010–11 | 259
Rhode Island Postsecondary Level—continued
Core indicators T echnical skill
attainment Credential,
certificate, or degree Student retention
or transfer Student
placement Nontraditional participation
Nontraditional completion
Gender
Male
Female
34.10%
37.84%
18.25%
22.12%
13.51%
27.10%
56.30% 82.94% <10.00%
70.18% 85.28% 25.67%
Race/ethnicity
American Indian or Alaska Native
Asian
Black or African American
Hispanic or Latino Native Hawaiian or Other Pacific Islander White
Two or more races
23.53%
54.55%
29.23%
33.00%
NE
36.98%
NE
<10.00%
23.53%
12.42%
11.71%
NE
23.60%
NE
<10.00%
23.08%
37.50%
18.42%
NE
19.46%
NE
75.00% 73.47% >95.00%
50.00% 90.95% 10.00%
44.74% 84.25% 16.67%
55.22% 85.14% 20.16%
NE NE NE
70.18% 84.39% 13.29%
NE NE NE

APPENDIX B. INDIVIDUAL STATE PERFORMANCE PROFILES, PY 2010–11 | 260
South Carolina Secondary Level
Core indicators
Academic attainment: Reading/
language arts Academic attainment:
Mathematics T echnical skill
attainment School
completion Student
graduation rates Placement Nontraditional participation
Nontraditional completion
Measurement definitions
Percentage of grade 12 concentrators who scored proficient or advanced on the English Language Arts High School Assessment Program (HSAP) administered two years prior to the reporting year as required for ESEA .
Percentage of grade 12 concentrators who scored proficient or advanced on the math HSAP administered two years prior to the reporting year as required for ESEA .
Percentage of concentrators who completed a CTE program and who passed technical skill assessments that are aligned with industry-recognized standards, if available and appropriate, during the reporting year plus concentrators who achieved a final GPA of at least 2.0 averaged over the year for all the CTE courses taken during the year for those program areas that do not have other valid and reliable assessments.
Percentage of grade 12 concentrators who completed a CTE program and who attained a South Carolina high school diploma, a state certificate, or a General Education Development (GED).
Percentage of CTE concentrators who, in the reporting year, were included as graduated in the state's computation of its graduation rate as defined in South Carolina's Consolidated Accountability Plan.
Percentage of concentrators who completed a CTE program and who are placed in postsecondary education, military service, or employment, averaged over a three-year period.
Percentage of concentrators of the underrepresented gender enrolled in CTE programs identified as leading to nontraditional training and employment.
Percentage of grade 12 concentrators of the underrepresented gender who completed CTE programs identified as leading to nontraditional training and employment.
PY 2010–11 Performance levels 62.00% 60.00% 88.60% 96.00% 84.50% 92.00% 14.00% 75.00%
PY 2010–11 Results 52.20% 56.84% 94.08% >95.00% >95.00% >95.00% 13.87% 72.13%
Special populations
Individuals with disabilities (ADA )
Individuals with disabilities (ESEA /IDEA )
Economically disadvantaged students
Single parents
Displaced homemakers
Limited English proficient students
Migrant students
Students in nontraditional programs
NP
17.43%
45.11%
40.82%
72.73%
53.52%
<10.00%
57.72%
NP
84.85%
>95.00%
>95.00%
>95.00%
>95.00%
>95.00%
>95.00%
NP
94.71%
>95.00%
89.30%
92.50%
>95.00%
>95.00%
>95.00%
NP
80.39%
72.63%
81.82%
<10.00%
85.71%
NE
NP
NP NP NP NP
12.41% 87.63% 86.86% <10.00%
39.84% 92.70% >95.00% 14.01%
39.43% 89.13% 93.90% 19.38%
27.27% >95.00% >95.00% 22.22%
32.39% 93.10% 93.41% <10.00%
<10.00% >95.00% NE <10.00%
57.49% >95.00% >95.00% NP Tech prep NP NP NP NP NP PNO NP NP NOTE: This table contains the results for students whom the state has identified as concentrators or participants (participants are only indicated by the state under the nontraditional participation core indicator) in career and technical education (CTE). See Appendix A, Table A-1 for the state’s definition of CTE concentrators and Table A-2 for the state’s definition of CTE participants. Definitions for special populations are provided in the Glossary of Terms in this report. Actual performance data above 95 percent and below 10 percent have been masked to protect student confidentiality. NE—state reported no enrollment; NP—data not provided; PNO—state reported program not offered; NA—data not applicable ADA—Americans with Disabilities Act; ESEA—Elementary and Secondary Education Act of 1965, as amended; IDEA—Individuals with Disabilities Education Act

APPENDIX B. INDIVIDUAL STATE PERFORMANCE PROFILES, PY 2010–11 | 261
South Carolina Secondary Level—continued
Core indicators
Academic attainment: Reading/
language arts Academic attainment:
Mathematics T echnical skill
attainment School
completion Student
graduation rates Placement Nontraditional participation
Nontraditional completion
Gender
Male
Female
60.59%
53.03%
>95.00%
>95.00%
>95.00%
>95.00%
47.89%
74.67%
50.20% 92.74% >95.00% <10.00%
54.23% >95.00% >95.00% 40.28%
Race/ethnicity
American Indian or Alaska Native
Asian
Black or African American
Hispanic or Latino Native Hawaiian or Other Pacific Islander White
Two or more races
66.67%
81.82%
40.06%
57.66%
70.00%
67.53%
62.79%
>95.00%
>95.00%
>95.00%
>95.00%
>95.00%
>95.00%
>95.00%
NA*
NA*
NA*
NA*
NA*
NA*
NA*
<10.00%
66.67%
66.94%
73.08%
NE
75.11%
66.67%
50.00% 90.00% 84.21% 25.00%
62.63% >95.00% >95.00% <10.00%
38.00% 91.97% >95.00% 14.23%
44.57% 93.28% 93.14% 13.20%
50.00% >95.00% 92.31% <10.00%
62.00% >95.00% >95.00% 13.83%
58.14% >95.00% >95.00% 10.71% NA*—The state was unable to collect and report race/ethnicity data for this particular cell in accordance with the required 1997 race/ethnicity categories. While the state did report data using the 1977 race/ethnicity categories, we are only reporting data provided by the states according to the 1997 race/ethnicity categories described in the Department’s Oct. 19, 2007, memorandum titled “Final Guidance on Maintaining, Collecting, and Reporting Racial and Ethnic Data” (see 72 Federal Register 59266).

APPENDIX B. INDIVIDUAL STATE PERFORMANCE PROFILES, PY 2010–11 | 262
South Carolina Postsecondary Level
Core indicators T echnical skill
attainment Credential,
certificate, or degree Student retention
or transfer Student
placement Nontraditional participation
Nontraditional completion
Measurement definitions
Percentage of CTE concentrators who passed technical skill assessments that are aligned with industry-recognized standards, if available and appropriate, during the reporting year.
Percentage of CATE concentrators who left with a degree, diploma, or certificate during the reporting year.
Percentage of CTE concentrators who remained enrolled in their original postsecondary institution or transferred to another two- or four-year postsecondary institution during the reporting year and who were enrolled in postsecondary education in the fall of the previous reporting year.
Percentage of CTE concentrators who were placed or retained in employment, or continuing education, or placed in military service or apprenticeship programs in the third quarter following the program year in which they left postsecondary education (i.e., placement status for CTE concentrators who graduated by June 30, 2007, would be assessed between Jan. 1, 2008, and Mar. 31, 2008).
Percentage of CTE participants from underrepresented gender groups who participated in a program that leads to employment in nontraditional fields during the reporting year.
Percentage of CTE concentrators from underrepresented gender groups who completed a program that leads to employment in nontraditional fields during the reporting year.
PY 2010–11 Performance levels 87.50% 41.00% 59.00% 80.00% 9.25% 7.50%
PY 2010–11 Results 93.93% 46.56% 82.15% 80.15% 19.96% 15.68%
Special populations
Individuals with disabilities (ADA )
Economically disadvantaged students
Single parents
Displaced homemakers
Limited English proficient students
Students in nontraditional programs
60.61%
49.44%
63.49%
86.96%
>95.00%
49.06%
81.59%
80.23%
83.77%
82.99%
83.00%
81.04%
11.62%
19.61%
15.64%
20.57%
<10.00%
NP
80.00% 74.58% 20.22%
93.38% 82.94% 20.58%
91.50% 85.85% 22.33%
93.15% 87.28% 24.75%
90.00% 92.00% 22.11%
92.68% 81.99% NP
T ech prep PNO PNO PNO PNO PNO PNO NOTE: This table contains the results for students whom the state has identified as concentrators or participants (participants are only indicated by the state under the nontraditional participation core indicator) in career and technical education (CTE). See Appendix A, Table A-1 for the state’s definition of CTE concentrators and Table A-2 for the state’s definition of CTE participants. Definitions for special populations are provided in the Glossary of Terms in this report. Actual performance data above 95 percent and below 10 percent have been masked to protect student confidentiality. NE—state reported no enrollment; NP—data not provided; PNO—state reported program not offered; NA—data not applicable ADA—Americans with Disabilities Act
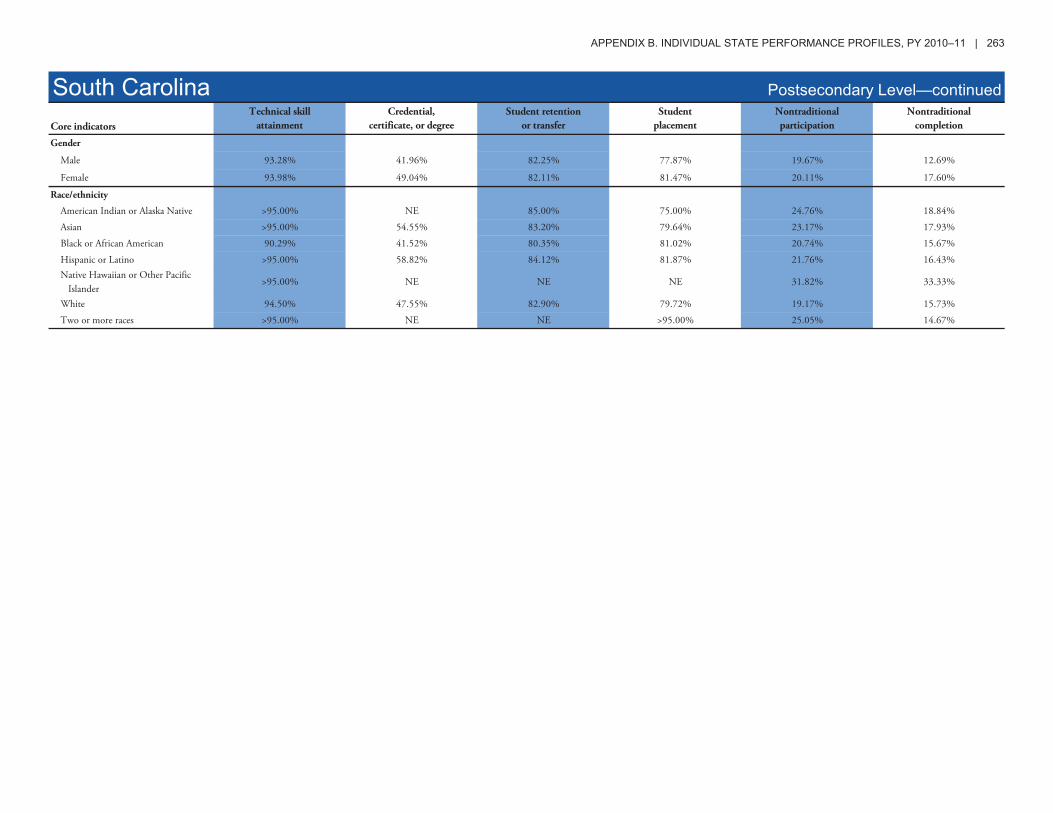
APPENDIX B. INDIVIDUAL STATE PERFORMANCE PROFILES, PY 2010–11 | 263
South Carolina Postsecondary Level—continued
Core indicators T echnical skill
attainment Credential,
certificate, or degree Student retention
or transfer Student
placement Nontraditional participation
Nontraditional completion
Gender
Male
Female
41.96%
49.04%
77.87%
81.47%
12.69%
17.60%
93.28% 82.25% 19.67%
93.98% 82.11% 20.11%
Race/ethnicity
American Indian or Alaska Native
Asian
Black or African American
Hispanic or Latino Native Hawaiian or Other Pacific Islander White
Two or more races
NE
54.55%
41.52%
58.82%
NE
47.55%
NE
75.00%
79.64%
81.02%
81.87%
NE
79.72%
>95.00%
18.84%
17.93%
15.67%
16.43%
33.33%
15.73%
14.67%
>95.00% 85.00% 24.76%
>95.00% 83.20% 23.17%
90.29% 80.35% 20.74%
>95.00% 84.12% 21.76%
>95.00% NE 31.82%
94.50% 82.90% 19.17%
>95.00% NE 25.05%

APPENDIX B. INDIVIDUAL STATE PERFORMANCE PROFILES, PY 2010–11 | 264
South Dakota Secondary Level
Core indicators
Academic attainment: Reading/
language arts Academic attainment:
Mathematics T echnical skill
attainment School
completion Student
graduation rates Placement Nontraditional participation
Nontraditional completion
Measurement definitions
Percentage of concentrators who have met the proficient or advanced level on the statewide high school reading and language arts assessment administered by the state under ESEA .
Percentage of concentrators who have met the proficient or advanced level on the statewide high school mathematics assessment administered by the state under ESEA .
Percentage of CTE concentrators attaining 72 percent in 2007-08 and 74 percent in 2008-09.
Percentage of CTE concentrators who earned a regular secondary school diploma.
Percentage of concentrators reported as graduated using the state's approved calculation for graduation rate as defined in the state's ESEA accountability workbook.
Percentage of concentrators placed in postsecondary education, employment or the military.
Percentage of nontraditional participants enrolled in programs preparing them for careers nontraditional for their gender.
Percentage of nontraditional concentrators completing programs preparing them for careers considered nontraditional for their gender.
PY 2010–11 Performance levels 67.00% 60.00% 94.62% 82.00% 82.00% 92.59% 11.34% 8.33%
PY 2010–11 Results 60.08% 61.45% >95.00% >95.00% >95.00% >95.00% 33.30% 21.94%
Special populations
Individuals with disabilities (ADA )
Individuals with disabilities (ESEA /IDEA )
Economically disadvantaged students
Single parents
Displaced homemakers
Limited English proficient students
Migrant students
Students in nontraditional programs
NP
16.24%
48.15%
46.67%
NP
13.95%
NE
63.27%
NP
>95.00%
>95.00%
>95.00%
NP
>95.00%
NE
>95.00%
NP
>95.00%
>95.00%
>95.00%
NE
79.07%
NE
>95.00%
NP
17.50%
22.59%
19.75%
NP
23.71%
NE
NP
NP NP NP NP
18.23% 88.73% >95.00% 30.36%
48.05% 92.09% 94.58% 32.80%
55.56% 91.67% >95.00% 22.97%
NP NP NP NP
16.28% 82.30% 90.70% 23.22%
NE NE NE 38.46%
64.01% >95.00% >95.00% NP Tech prep 60.08% 61.45% >95.00% >95.00% >95.00% >95.00% 33.30% 21.94% NOTE: This table contains the results for students whom the state has identified as concentrators or participants (participants are only indicated by the state under the nontraditional participation core indicator) in career and technical education (CTE). See Appendix A, Table A-1 for the state’s definition of CTE concentrators and Table A-2 for the state’s definition of CTE participants. Definitions for special populations are provided in the Glossary of Terms in this report. Actual performance data above 95 percent and below 10 percent have been masked to protect student confidentiality. NE—state reported no enrollment; NP—data not provided; PNO—state reported program not offered; NA—data not applicable ADA—Americans with Disabilities Act; ESEA—Elementary and Secondary Education Act of 1965, as amended; IDEA—Individuals with Disabilities Education Act

APPENDIX B. INDIVIDUAL STATE PERFORMANCE PROFILES, PY 2010–11 | 265
South Dakota Secondary Level—continued
Core indicators
Academic attainment: Reading/
language arts Academic attainment:
Mathematics T echnical skill
attainment School
completion Student
graduation rates Placement Nontraditional participation
Nontraditional completion
Gender
Male
Female
61.16%
61.90%
>95.00%
>95.00%
>95.00%
>95.00%
11.46%
41.02%
57.36% 94.14% >95.00% 23.48%
64.40% >95.00% >95.00% 47.55%
Race/ethnicity
American Indian or Alaska Native
Asian
Black or African American
Hispanic or Latino Native Hawaiian or Other Pacific Islander White
Two or more races
31.00%
55.56%
38.46%
40.38%
<10.00%
65.02%
NE
>95.00%
>95.00%
>95.00%
>95.00%
>95.00%
>95.00%
NE
NA*
NA*
NA*
NA*
NA*
NA*
NA*
26.77%
37.04%
26.83%
20.20%
50.00%
21.35%
NE
37.39% 88.29% 87.98% 36.13%
55.56% >95.00% >95.00% 36.58%
69.23% 91.84% >95.00% 27.64%
50.00% 91.60% 89.09% 30.49%
>95.00% >95.00% >95.00% 47.37%
62.42% >95.00% >95.00% 33.19%
NE NE NE NE NA*—The state was unable to collect and report race/ethnicity data for this particular cell in accordance with the required 1997 race/ethnicity categories. While the state did report data using the 1977 race/ethnicity categories, we are only reporting data provided by the states according to the 1997 race/ethnicity categories described in the Department’s Oct. 19, 2007, memorandum titled “Final Guidance on Maintaining, Collecting, and Reporting Racial and Ethnic Data” (see 72 Federal Register 59266).

APPENDIX B. INDIVIDUAL STATE PERFORMANCE PROFILES, PY 2010–11 | 266
South Dakota Postsecondary Level
Core indicators T echnical skill
attainment Credential,
certificate, or degree Student retention
or transfer Student
placement Nontraditional participation
Nontraditional completion
Measurement definitions
Percentage of CTE concentrators who attain a cumulative GPA of 2.0 or higher during the reporting year.
Percentage of CTE concentrators who received an industry-recognized credential, certificate, or a degree during the reporting year.
Percentage of CTE concentrators who remained enrolled in their original postsecondary institution or transferred to another two- or four-year postsecondary institution during the reporting year and who were enrolled in postsecondary education in the fall of the previous reporting year.
Percentage of CTE concentrators who were placed or retained in employment, or placed in military service or apprenticeship programs in the second quarter following the program year in which they left postsecondary education.
Percentage of nontraditional CTE participants from underrepresented gender groups who participated in a program that leads to employment in nontraditional fields during the reporting year.
Percentage of nontraditional CTE concentrators from underrepresented gender groups who completed a program that leads to employment in nontraditional fields during the reporting year.
PY 2010–11 Performance levels 89.82% 58.76% 74.98% 98.54% 10.96% 9.72%
PY 2010–11 Results 92.30% 69.12% 40.01% 84.92% 14.67% 12.52%
Special populations
Individuals with disabilities (ADA )
Economically disadvantaged students
Single parents
Displaced homemakers
Limited English proficient students
Students in nontraditional programs
65.31%
71.40%
67.83%
75.00%
66.67%
62.50%
NE
NE
NE
NE
NE
NE
<10.00%
13.00%
15.38%
30.00%
<10.00%
NP
87.50% 38.26% 15.00%
92.69% 40.41% 13.86%
91.82% 54.24% 20.85%
>95.00% 75.00% 31.91%
85.71% 16.67% <10.00%
91.44% 36.67% NP
T ech prep 92.51% 69.53% 41.42% NE <10.00% <10.00% NOTE: This table contains the results for students whom the state has identified as concentrators or participants (participants are only indicated by the state under the nontraditional participation core indicator) in career and technical education (CTE). See Appendix A, Table A-1 for the state’s definition of CTE concentrators and Table A-2 for the state’s definition of CTE participants. Definitions for special populations are provided in the Glossary of Terms in this report. Actual performance data above 95 percent and below 10 percent have been masked to protect student confidentiality. NE—state reported no enrollment; NP—data not provided; PNO—state reported program not offered; NA—data not applicable ADA—Americans with Disabilities Act

APPENDIX B. INDIVIDUAL STATE PERFORMANCE PROFILES, PY 2010–11 | 267
South Dakota Postsecondary Level—continued
Core indicators T echnical skill
attainment Credential,
certificate, or degree Student retention
or transfer Student
placement Nontraditional participation
Nontraditional completion
Gender
Male
Female
69.55%
68.48%
84.87%
84.97%
<10.00%
25.13%
91.82% 36.79% <10.00%
92.95% 44.47% 27.81%
Race/ethnicity
American Indian or Alaska Native
Asian
Black or African American
Hispanic or Latino Native Hawaiian or Other Pacific Islander White
Two or more races
66.67%
77.78%
54.17%
59.09%
NE
69.55%
NE
NE
NE
NE
NE
NE
NE
NE
23.26%
28.57%
14.29%
<10.00%
<10.00%
12.10%
NE
88.07% 50.00% 17.39%
87.50% 33.33% 25.00%
81.82% 30.77% 18.18%
82.14% 30.43% <10.00%
>95.00% >95.00% 25.00%
92.77% 40.19% 14.46%
NE NE NE

APPENDIX B. INDIVIDUAL STATE PERFORMANCE PROFILES, PY 2010–11 | 268
Tennessee Secondary Level
Core indicators
Academic attainment: Reading/
language arts Academic attainment:
Mathematics T echnical skill
attainment School
completion Student
graduation rates Placement Nontraditional participation
Nontraditional completion
Measurement definitions
Percentage of CTE concentrators who have met the proficient or advanced level on the statewide high school reading and language arts assessment administered by the state under ESEA and who, in the reporting year, left secondary education.
Percentage of CTE concentrators who have met the proficient or advanced level on the statewide high school mathematics assessment administered by the state under ESEA and who, in the reporting year, left secondary education.
Percentage of grade 12 concentrators who have mastered industry-validated CTE proficiency standards in the reporting year.
Percentage of grade 12 concentrators who attained a Tennessee high school diploma, a state certificate, or a General Education Development (GED).
Percentage of CTE concentrators who, in the reporting year, were included as graduated in the state's computation of its graduation rate as described in ESEA .
Percentage of concentrators who graduated in the reporting year and who were placed in postsecondary or advanced training, employment or military within one year of graduation.
Percentage of CTE participants from underrepresented gender groups who participated in a course that leads to employment in nontraditional fields in the reporting year.
Percentage of CTE concentrators from underrepresented gender groups who participated in a course that leads to employment in nontraditional fields in the reporting year.
PY 2010–11 Performance levels 89.37% 85.00% 88.37% 88.47% 81.50% 90.00% 18.55% 21.97%
PY 2010–11 Results 92.54% 89.26% 89.96% >95.00% >95.00% 90.77% 31.32% 50.59%
Special populations
Individuals with disabilities (ADA )
Individuals with disabilities (ESEA /IDEA )
Economically disadvantaged students
Single parents
Displaced homemakers
Limited English proficient students
Migrant students
Students in nontraditional programs
NP
60.68%
84.30%
82.81%
NP
70.51%
>95.00%
89.53%
NP
>95.00%
>95.00%
>95.00%
NP
94.59%
>95.00%
>95.00%
NP
81.86%
88.04%
78.47%
NP
86.25%
>95.00%
88.17%
NP
44.31%
47.88%
41.50%
NP
29.88%
50.00%
NP
NP NP NP NP
75.05% 82.25% 88.94% 23.26%
89.49% 88.10% >95.00% 30.46%
85.79% 85.81% 94.56% 25.90%
NP NP NP NP
44.07% 85.77% 90.81% 28.13%
>95.00% >95.00% >95.00% 21.43%
92.73% 89.98% >95.00% NP Tech prep NP NP NP NP NP PNO NP NP NOTE: This table contains the results for students whom the state has identified as concentrators or participants (participants are only indicated by the state under the nontraditional participation core indicator) in career and technical education (CTE). See Appendix A, Table A-1 for the state’s definition of CTE concentrators and Table A-2 for the state’s definition of CTE participants. Definitions for special populations are provided in the Glossary of Terms in this report. Actual performance data above 95 percent and below 10 percent have been masked to protect student confidentiality. NE—state reported no enrollment; NP—data not provided; PNO—state reported program not offered; NA—data not applicable ADA—Americans with Disabilities Act; ESEA—Elementary and Secondary Education Act of 1965, as amended; IDEA—Individuals with Disabilities Education Act

APPENDIX B. INDIVIDUAL STATE PERFORMANCE PROFILES, PY 2010–11 | 269
Tennessee Secondary Level—continued
Core indicators
Academic attainment: Reading/
language arts Academic attainment:
Mathematics T echnical skill
attainment School
completion Student
graduation rates Placement Nontraditional participation
Nontraditional completion
Gender
Male
Female
87.91%
90.61%
>95.00%
>95.00%
91.15%
90.40%
49.55%
51.66%
90.45% 88.75% >95.00% 20.62%
94.71% 91.19% >95.00% 44.32%
Race/ethnicity
American Indian or Alaska Native
Asian
Black or African American
Hispanic or Latino Native Hawaiian or Other Pacific Islander White
Two or more races
84.21%
>95.00%
82.44%
84.62%
>95.00%
90.88%
87.24%
>95.00%
>95.00%
>95.00%
90.00%
>95.00%
>95.00%
>95.00%
>95.00%
92.62%
90.02%
90.40%
NP
91.03%
50.00%
62.79%
55.93%
40.89%
54.29%
60.00%
53.65%
40.82%
94.12% >95.00% >95.00% 32.11%
>95.00% 92.50% >95.00% 37.78%
88.12% 92.17% >95.00% 34.15%
92.73% 94.29% 90.00% 35.53%
95.00% 85.00% >95.00% 39.71%
94.09% 89.20% >95.00% 30.81%
83.20% 87.38% >95.00% 29.52%

APPENDIX B. INDIVIDUAL STATE PERFORMANCE PROFILES, PY 2010–11 | 270
Tennessee Postsecondary Level
Core indicators T echnical skill
attainment Credential,
certificate, or degree Student retention
or transfer Student
placement Nontraditional participation
Nontraditional completion
Measurement definitions
Percentage of CTE completers who passed, on the first administration, major field assessments that are aligned with industry-recognized standards, if available and appropriate, during the reporting year.
Percentage of CTE concentrators who received an industry-recognized degree or other award by the end of the two years, subsequent to the fall of the sophomore cohort year.
Percentage of CTE concentrators who remained enrolled in their original community college, completed a degree or award at their original community college, or transferred to another two- or four-year postsecondary institution at the time of the subsequent fall after the sophomore concentrator year.
Percentage of CTE concentrators who received an industry-recognized degree or award, and reported according to Tennessee Higher Education Commission (THEC)'s performance measures reporting requirements were placed in employment, enrolled in postsecondary education, or serves in the military.
Percentage of CTE participants from underrepresented gender groups who participated in a program that leads to employment in nontraditional fields during the reporting year.
Percentage of CTE concentrators from underrepresented gender groups who completed a program that leads to employment in nontraditional fields by the end of two years subsequent to the fall of the sophomore cohort year.
PY 2010–11 Performance levels 85.25% 40.82% 64.55% 83.25% 25.03% 45.25%
PY 2010–11 Results 92.87% 42.31% 71.47% 90.43% 28.18% 48.64%
Special populations
Individuals with disabilities (ADA )
Economically disadvantaged students
Single parents
Displaced homemakers
Limited English proficient students
Students in nontraditional programs
37.80%
40.64%
36.35%
46.34%
45.10%
48.64%
88.10%
91.55%
90.75%
84.85%
73.91%
89.97%
37.50%
47.64%
42.91%
56.00%
50.00%
NP
87.50% 77.80% 27.68%
92.02% 72.42% 30.47%
85.04% 70.62% 32.09%
>95.00% 78.05% 31.62%
>95.00% 70.59% 38.10%
93.53% 74.49% NP
T ech prep PNO PNO PNO PNO PNO PNO NOTE: This table contains the results for students whom the state has identified as concentrators or participants (participants are only indicated by the state under the nontraditional participation core indicator) in career and technical education (CTE). See Appendix A, Table A-1 for the state’s definition of CTE concentrators and Table A-2 for the state’s definition of CTE participants. Definitions for special populations are provided in the Glossary of Terms in this report. Actual performance data above 95 percent and below 10 percent have been masked to protect student confidentiality. NE—state reported no enrollment; NP—data not provided; PNO—state reported program not offered; NA—data not applicable ADA—Americans with Disabilities Act

APPENDIX B. INDIVIDUAL STATE PERFORMANCE PROFILES, PY 2010–11 | 271
Tennessee Postsecondary Level—continued
Core indicators T echnical skill
attainment Credential,
certificate, or degree Student retention
or transfer Student
placement Nontraditional participation
Nontraditional completion
Gender
Male
Female
42.49%
42.24%
91.20%
90.01%
53.56%
46.47%
93.47% 72.46% 17.99%
92.76% 71.05% 34.75%
Race/ethnicity
American Indian or Alaska Native
Asian
Black or African American
Hispanic or Latino Native Hawaiian or Other Pacific Islander White
Two or more races
32.73%
40.80%
27.01%
41.87%
28.57%
46.00%
38.94%
90.00%
85.94%
88.69%
89.61%
>95.00%
90.33%
>95.00%
16.67%
29.73%
33.33%
51.79%
<10.00%
52.74%
45.71%
>95.00% 67.27% 28.36%
>95.00% 75.12% 31.18%
83.72% 63.29% 32.90%
>95.00% 69.70% 31.89%
NE 64.29% 30.00%
92.77% 73.29% 26.61%
92.31% 74.34% 28.24%

APPENDIX B. INDIVIDUAL STATE PERFORMANCE PROFILES, PY 2010–11 | 272
Tennessee Adult Level
Core indicators T echnical skill
attainment Credential,
certificate, or degree Student retention
or transfer Student
placement Nontraditional participation
Nontraditional completion
Measurement definitions
Percentage of student completers within the reporting year who passed a licensure or certification exam.
Percentage of students who receive a certificate or diploma within the reporting year.
Percentage of students who remained enrolled in the institution or transferred to another two- or four-year postsecondary institution during the reporting year and who were enrolled in postsecondary education in the previous reporting year.
Percentage of CTE completers during the reporting year who were placed in gainful employment, entered the military, or continued their education in postsecondary advanced studies.
Percentage of students in underrepresented gender groups who participate in nontraditional programs during the year.
Percentage of students from underrepresented gender groups who completed a program for a nontraditional occupation during the reporting year.
PY 2010–11 Performance levels 85.25% 64.95% 54.25% 81.25% 10.15% 45.25%
PY 2010–11 Results >95.00% 73.83% 73.91% 81.29% 12.38% 61.52%
Special populations
Individuals with disabilities (ADA )
Economically disadvantaged students
Single parents
Displaced homemakers
Limited English proficient students
Students in nontraditional programs
60.00%
74.08%
65.53%
69.18%
45.16%
67.29%
66.67%
73.80%
72.40%
61.52%
11.54%
44.98%
73.81%
66.21%
59.35%
74.01%
65.85%
NP
94.12% 73.27% 19.68%
>95.00% 77.54% 12.54%
>95.00% 73.15% <10.00%
85.19% 78.69% 12.09%
11.11% 76.81% 46.09%
73.08% 75.89% NP
T ech prep NE NE NE NE NE NE NOTE: This table contains the results for students whom the state has identified as concentrators or participants (participants are only indicated by the state under the nontraditional participation core indicator) in career and technical education (CTE). See Appendix A, Table A-1 for the state’s definition of CTE concentrators and Table A-2 for the state’s definition of CTE participants. Definitions for special populations are provided in the Glossary of Terms in this report. Actual performance data above 95 percent and below 10 percent have been masked to protect student confidentiality. NE—state reported no enrollment; NP—data not provided; PNO—state reported program not offered; NA—data not applicable ADA—Americans with Disabilities Act

APPENDIX B. INDIVIDUAL STATE PERFORMANCE PROFILES, PY 2010–11 | 273
Tennessee Adult Level—continued
Core indicators T echnical skill
attainment Credential,
certificate, or degree Student retention
or transfer Student
placement Nontraditional participation
Nontraditional completion
Gender
Male
Female
74.36%
73.19%
81.88%
80.55%
61.44%
61.81%
>95.00% 76.30% 17.57%
94.39% 71.15% <10.00%
Race/ethnicity
American Indian or Alaska Native
Asian
Black or African American
Hispanic or Latino Native Hawaiian or Other Pacific Islander White
Two or more races
80.00%
76.62%
63.82%
65.00%
33.33%
76.55%
71.58%
87.80%
80.77%
73.79%
>95.00%
>95.00%
77.47%
72.13%
88.89%
40.00%
49.60%
56.41%
<10.00%
64.31%
75.00%
87.50% 81.43% 15.71%
83.33% 78.51% <10.00%
92.23% 69.12% 12.30%
92.59% 69.52% 15.72%
50.00% 41.67% <10.00%
>95.00% 75.22% 12.34%
91.67% 79.74% 11.61%

APPENDIX B. INDIVIDUAL STATE PERFORMANCE PROFILES, PY 2010–11 | 274
Texas Secondary Level
Core indicators
Academic attainment: Reading/
language arts Academic attainment:
Mathematics T echnical skill
attainment School
completion Student
graduation rates Placement Nontraditional participation
Nontraditional completion
Measurement definitions
Percentage of CTE concentrators who have met the proficient or advanced level on the statewide high school reading and language arts assessment administered by the state as the Exit Level Texas Assessment of Knowledge and Skills (TAKS) assessment required for graduation from high school and who, in the reporting year, left secondary education.
Percentage of CTE concentrators who have met the proficient or advanced level on the statewide high school mathematics assessment administered by the state as the TAKS Exit Level assessment required for graduation from high school and who, in the reporting year, left secondary education.
Percentage of CTE concentrators who passed technical skill assessments that are aligned with industry-recognized standards, if available and appropriate, during the reporting year.
Percentage of CTE concentrators who earned a secondary school diploma, earned a General Education Development (GED) credential as a state-recognized equivalent to a regular high school diploma (if offered by the state) or other state-recognized equivalent (including recognized alternative standards for individuals with disabilities), or earned a proficiency credential, certificate, or degree, in conjunction with a secondary school diploma (if offered by the state) during the reporting year.
Percentage of CTE concentrators who, in the reporting year, were included as graduated in the state's computation of its graduation rate as described in ESEA .
Percentage of CTE concentrators who left secondary education and were placed in postsecondary education or advanced training, in the military service, or employment in the second quarter following the program year in which they left secondary education (i.e., unduplicated placement status for CTE concentrators who graduated by June 30, 2007 would be assessed between Oct. 1, 2007 and Dec. 31, 2007).
Percentage of CTE participants from underrepresented gender groups who participated in a program that leads to employment in nontraditional fields during the reporting year.
Percentage of CTE concentrators from underrepresented gender groups who completed a program that leads to employment in nontraditional fields during the reporting year.
PY 2010–11 Performance levels 95.00% 95.00% 81.33% 90.66% 89.91% 78.25% 38.84% 38.40%
PY 2010–11 Results >95.00% >95.00% 66.09% >95.00% >95.00% 70.47% 41.59% 40.07%
Special populations
Individuals with disabilities (ADA )
Individuals with disabilities (ESEA /IDEA )
Economically disadvantaged students
Single parents
Displaced homemakers
Limited English proficient students
Migrant students
Students in nontraditional programs
NP
42.82%
94.16%
92.75%
89.58%
80.55%
94.43%
>95.00%
NP
>95.00%
94.76%
89.86%
86.67%
82.06%
93.82%
>95.00%
NP
56.36%
65.98%
59.61%
NP
36.71%
64.75%
71.56%
NP
36.88%
38.65%
38.26%
43.40%
35.94%
35.53%
NP
NP NP NP NP
77.91% 42.09% 94.48% 38.03%
>95.00% 59.08% 94.04% 40.16%
>95.00% 74.84% 88.24% 42.70%
>95.00% 10.96% 86.89% 42.98%
82.06% 50.94% 81.56% 37.67%
>95.00% 52.71% 93.05% 38.09%
>95.00% 34.94% >95.00% NP Tech prep >95.00% >95.00% 90.17% >95.00% >95.00% 72.86% 38.95% 38.65% NOTE: This table contains the results for students whom the state has identified as concentrators or participants (participants are only indicated by the state under the nontraditional participation core indicator) in career and technical education (CTE). See Appendix A, Table A-1 for the state’s definition of CTE concentrators and Table A-2 for the state’s definition of CTE participants. Definitions for special populations are provided in the Glossary of Terms in this report. Actual performance data above 95 percent and below 10 percent have been masked to protect student confidentiality. NE—state reported no enrollment; NP—data not provided; PNO—state reported program not offered; NA—data not applicable ADA—Americans with Disabilities Act; ESEA—Elementary and Secondary Education Act of 1965, as amended; IDEA—Individuals with Disabilities Education Act

APPENDIX B. INDIVIDUAL STATE PERFORMANCE PROFILES, PY 2010–11 | 275
Texas Secondary Level—continued
Core indicators
Academic attainment: Reading/
language arts Academic attainment:
Mathematics T echnical skill
attainment School
completion Student
graduation rates Placement Nontraditional participation
Nontraditional completion
Gender
Male
Female
94.85%
>95.00%
>95.00%
>95.00%
69.58%
71.38%
34.64%
46.16%
>95.00% 63.13% >95.00% 36.26%
>95.00% 68.96% >95.00% 48.04%
Race/ethnicity
American Indian or Alaska Native
Asian
Black or African American
Hispanic or Latino Native Hawaiian or Other Pacific Islander White
Two or more races
>95.00%
>95.00%
92.26%
>95.00%
>95.00%
>95.00%
>95.00%
>95.00%
>95.00%
94.35%
>95.00%
>95.00%
>95.00%
>95.00%
69.00%
68.72%
67.55%
67.42%
62.03%
75.53%
70.74%
38.80%
42.26%
40.70%
38.12%
48.30%
42.09%
41.79%
>95.00% 73.77% >95.00% 40.30%
>95.00% 87.23% >95.00% 44.21%
>95.00% 76.22% 93.90% 43.39%
>95.00% 61.03% 94.50% 39.70%
>95.00% NP >95.00% 45.66%
>95.00% 68.31% >95.00% 43.10%
>95.00% NP >95.00% 43.36%

APPENDIX B. INDIVIDUAL STATE PERFORMANCE PROFILES, PY 2010–11 | 276
Texas Postsecondary Level
Core indicators T echnical skill
attainment Credential,
certificate, or degree Student retention
or transfer Student
placement Nontraditional participation
Nontraditional completion
Measurement definitions
Percentage of CTE concentrators who passed technical skill assessments that are aligned with industry-recognized standards, if available and appropriate, during the reporting year.
Percentage of CTE concentrators who received an industry-recognized credential, a certificate, or a degree during the reporting year.
Percentage of CTE concentrators who remained enrolled in their original postsecondary institution or transferred to another two- or four-year postsecondary institution during the reporting year and who were enrolled in postsecondary education in the fall of the previous reporting year.
Percentage of CTE concentrators who were placed or retained in employment, or placed in military service or apprenticeship programs in the second quarter following the program year in which they left postsecondary education (i.e., unduplicated placement status for CTE concentrators who graduated by June 30, 2007 would be assessed between Oct. 1, 2007 and Dec. 31, 2007).
Percentage of CTE participants from underrepresented gender groups who participated in a program that leads to employment in nontraditional fields during the reporting year.
Percentage of CTE concentrators from underrepresented gender groups who completed a program that leads to employment in nontraditional fields during the reporting year.
PY 2010–11 Performance levels 84.50% 36.00% 67.00% 79.00% 23.00% 17.30%
PY 2010–11 Results 92.20% 28.81% 65.72% 73.22% 21.52% 17.36%
Special populations
Individuals with disabilities (ADA )
Economically disadvantaged students
Single parents
Displaced homemakers
Limited English proficient students
Students in nontraditional programs
26.41%
27.48%
28.03%
33.41%
28.55%
23.25%
62.10%
71.61%
74.74%
59.60%
67.98%
72.99%
20.72%
17.91%
25.33%
21.15%
15.30%
NP
87.18% 66.10% 22.61%
91.38% 66.01% 21.34%
90.65% 64.71% 22.89%
92.53% 65.63% 20.12%
90.77% 66.87% 21.20%
88.68% 66.16% NP
T ech prep 90.90% 25.64% 67.18% 73.90% 23.00% 20.30% NOTE: This table contains the results for students whom the state has identified as concentrators or participants (participants are only indicated by the state under the nontraditional participation core indicator) in career and technical education (CTE). See Appendix A, Table A-1 for the state’s definition of CTE concentrators and Table A-2 for the state’s definition of CTE participants. Definitions for special populations are provided in the Glossary of Terms in this report. Actual performance data above 95 percent and below 10 percent have been masked to protect student confidentiality. NE—state reported no enrollment; NP—data not provided; PNO—state reported program not offered; NA—data not applicable ADA—Americans with Disabilities Act

APPENDIX B. INDIVIDUAL STATE PERFORMANCE PROFILES, PY 2010–11 | 277
Texas Postsecondary Level—continued
Core indicators T echnical skill
attainment Credential,
certificate, or degree Student retention
or transfer Student
placement Nontraditional participation
Nontraditional completion
Gender
Male
Female
27.14%
30.15%
72.95%
73.44%
<10.00%
31.26%
89.87% 62.60% 20.71%
93.39% 67.88% 22.09%
Race/ethnicity
American Indian or Alaska Native
Asian
Black or African American
Hispanic or Latino Native Hawaiian or Other Pacific Islander White
Two or more races
NA*
NA*
NA*
NA*
NA*
NA*
NA*
NA*
NA*
NA*
NA*
NA*
NA*
NA*
NA*
NA*
NA*
NA*
NA*
NA*
NA*
NA* NA* NA*
NA* NA* NA*
NA* NA* NA*
NA* NA* NA*
NA* NA* NA*
NA* NA* NA*
NA* NA* NA* NA*—The state was unable to collect and report race/ethnicity data for this particular cell in accordance with the required 1997 race/ethnicity categories. While the state did report data using the 1977 race/ethnicity categories, we are only reporting data provided by the states according to the 1997 race/ethnicity categories described in the Department’s Oct. 19, 2007, memorandum titled “Final Guidance on Maintaining, Collecting, and Reporting Racial and Ethnic Data” (see 72 Federal Register 59266).

APPENDIX B. INDIVIDUAL STATE PERFORMANCE PROFILES, PY 2010–11 | 278
United States Virgin Islands Secondary Level
Core indicators
Academic attainment: Reading/
language arts Academic attainment:
Mathematics T echnical skill
attainment School
completion Student
graduation rates Placement Nontraditional participation
Nontraditional completion
Measurement definitions
Percentage of CTE concentrators who have met the "meets standard" or above level on the statewide high school reading and language arts assessment administered by the state under ESEA and who, in the reporting year, left secondary education.
Percentage of CTE concentrators who have met the "meets standard" or above level on the statewide high school mathematics assessment administered by the state under ESEA and who, in the reporting year, left secondary education.
Percentage of CTE concentrators who have successfully completed all CTE courses and met state established validated.
Percentage of CTE concentrators who have received a high school diploma or its recognized state equivalent and have left secondary education the reporting year.
Percentage of CTE concentrators who, in the reporting year, were included as graduated in the state's computation of its graduation rate as described in ESEA .
Percentage of CTE concentrators who left secondary education and were placed in postsecondary education or advanced training, in the military service, or employment in the fourth quarter following the program year in which they left secondary education (i.e., unduplicated placement status for CTE concentrators who graduated by June 30, 2007 would be assessed between Oct. 1, 2007 and Dec. 31, 2007).
Percentage of CTE participants from underrepresented gender groups who participated in a nontraditional secondary program in the reporting year.
Percentage of CTE concentrators in underrepresented gender groups who completed a nontraditional secondary program in the reporting year.
PY 2010–11 Performance levels 46.50% 47.00% 72.00% 92.00% 79.50% 85.75% 16.75% 6.90%
PY 2010–11 Results 36.75% 47.53% 85.44% 93.01% 93.01% 36.63% 84.75% 92.83%
Special populations
Individuals with disabilities (ADA )
Individuals with disabilities (ESEA /IDEA )
Economically disadvantaged students
Single parents
Displaced homemakers
Limited English proficient students
Migrant students
Students in nontraditional programs
NP
<10.00%
47.53%
NP
NP
27.27%
NP
36.00%
NP
86.96%
93.01%
NP
NP
88.24%
NP
>95.00%
NP
13.04%
33.59%
NE
NE
<10.00%
NE
10.34%
NP
>95.00%
>95.00%
NP
NP
29.03%
NP
NP
NP NP NP NP
<10.00% 69.37% 86.96% 80.23%
37.55% 85.44% 93.01% 84.75%
NP NP NP NP
NP NP NP NP
<10.00% 77.78% 88.24% 90.91%
NP NP NP NP
21.43% 79.17% >95.00% NP Tech prep NP NP NP NP NP PNO NP NP NOTE: This table contains the results for students whom the state has identified as concentrators or participants (participants are only indicated by the state under the nontraditional participation core indicator) in career and technical education (CTE). See Appendix A, Table A-1 for the state’s definition of CTE concentrators and Table A-2 for the state’s definition of CTE participants. Definitions for special populations are provided in the Glossary of Terms in this report. Actual performance data above 95 percent and below 10 percent have been masked to protect student confidentiality. NE—state reported no enrollment; NP—data not provided; PNO—state reported program not offered; NA—data not applicable ADA—Americans with Disabilities Act; ESEA—Elementary and Secondary Education Act of 1965, as amended; IDEA—Individuals with Disabilities Education Act

APPENDIX B. INDIVIDUAL STATE PERFORMANCE PROFILES, PY 2010–11 | 279
United States Virgin Islands Secondary Level—continued
Core indicators
Academic attainment: Reading/
language arts Academic attainment:
Mathematics T echnical skill
attainment School
completion Student
graduation rates Placement Nontraditional participation
Nontraditional completion
Gender
Male
Female
51.39%
44.44%
89.56%
>95.00%
28.81%
46.13%
87.86%
>95.00%
36.25% 84.12% 89.56% 66.95%
37.14% 86.63% >95.00% 94.91%
Race/ethnicity
American Indian or Alaska Native
Asian
Black or African American
Hispanic or Latino Native Hawaiian or Other Pacific Islander White
Two or more races
NE
NE
48.53%
41.98%
NE
60.00%
25.00%
NE
NE
92.92%
93.68%
NE
83.33%
>95.00%
NE
NE
43.19%
<10.00%
NE
<10.00%
16.67%
NE
>95.00%
92.74%
94.81%
>95.00%
50.00%
87.50%
NE NE NE 50.00%
NE >95.00% NE 85.71%
37.82% 85.25% 92.92% 83.77%
32.10% 84.98% 93.68% 89.91%
NE >95.00% NE 66.67%
40.00% 83.33% 83.33% 88.89%
<10.00% >95.00% >95.00% 83.33%

APPENDIX B. INDIVIDUAL STATE PERFORMANCE PROFILES, PY 2010–11 | 280
United States Virgin Islands Postsecondary Level
Core indicators T echnical skill
attainment Credential,
certificate, or degree Student retention
or transfer Student
placement Nontraditional participation
Nontraditional completion
Measurement definitions
Percentage of CTE concentrators who passed technical skill assessments that are aligned with industry-recognized standards, if available and appropriate, during the reporting year.
Percentage of CTE concentrators who received an industry-recognized credential, a certificate, or a degree during the reporting year.
Percentage of CTE concentrators who remained enrolled in their original postsecondary institution or transferred to a two- or four-year postsecondary institution during the reporting year and who were enrolled in postsecondary education in the fall of the previous reporting year.
Percentage of CTE concentrators who were placed or retained in employment, or placed in military service or apprenticeship programs in the fourth quarter following the program year in which they left postsecondary education (i.e., unduplicated placement status for CTE concentrators who graduated by June 30, 2007 would be assessed between Oct. 1, 2007 and Dec. 31, 2007).
Percentage of CTE participants from underrepresented gender groups who participated in a program that leads to employment in nontraditional fields during the reporting year.
Percentage of CTE concentrators from underrepresented gender groups who completed a program that leads to employment in nontraditional fields during the reporting year.
PY 2010–11 Performance levels 74.50% 66.00% 34.00% 39.75% 35.50% 40.00%
PY 2010–11 Results 73.84% 86.99% >95.00% 19.18% 13.33% 13.33%
Special populations
Individuals with disabilities (ADA )
Economically disadvantaged students
Single parents
Displaced homemakers
Limited English proficient students
Students in nontraditional programs
>95.00%
86.99%
NP
NP
94.12%
>95.00%
NP
19.18%
NP
NP
<10.00%
<10.00%
NE
13.33%
NP
NP
<10.00%
NP
NP >95.00% NE
73.84% >95.00% 13.33%
NP NP NP
NP NP NP
68.00% >95.00% <10.00%
>95.00% >95.00% NP
T ech prep PNO PNO PNO PNO PNO PNO NOTE: This table contains the results for students whom the state has identified as concentrators or participants (participants are only indicated by the state under the nontraditional participation core indicator) in career and technical education (CTE). See Appendix A, Table A-1 for the state’s definition of CTE concentrators and Table A-2 for the state’s definition of CTE participants. Definitions for special populations are provided in the Glossary of Terms in this report. Actual performance data above 95 percent and below 10 percent have been masked to protect student confidentiality. NE—state reported no enrollment; NP—data not provided; PNO—state reported program not offered; NA—data not applicable ADA—Americans with Disabilities Act

APPENDIX B. INDIVIDUAL STATE PERFORMANCE PROFILES, PY 2010–11 | 281
United States Virgin Islands Postsecondary Level—continued
Core indicators T echnical skill
attainment Credential,
certificate, or degree Student retention
or transfer Student
placement Nontraditional participation
Nontraditional completion
Gender
Male
Female
>95.00%
81.19%
40.00%
<10.00%
<10.00%
>95.00%
>95.00% >95.00% <10.00%
64.57% >95.00% >95.00%
Race/ethnicity
American Indian or Alaska Native
Asian
Black or African American
Hispanic or Latino Native Hawaiian or Other Pacific Islander White
Two or more races
NE
NE
89.92%
94.12%
NE
NE
NE
NE
NE
22.69%
<10.00%
NE
NE
NE
NE
NE
14.29%
<10.00%
NE
NE
NE
NE NE NE
NE NE NE
74.65% >95.00% 14.29%
68.00% >95.00% <10.00%
NE NE NE
NE NE NE
NE NE NE

APPENDIX B. INDIVIDUAL STATE PERFORMANCE PROFILES, PY 2010–11 | 282
Utah Secondary Level
Core indicators
Academic attainment: Reading/
language arts Academic attainment:
Mathematics T echnical skill
attainment School
completion Student
graduation rates Placement Nontraditional participation
Nontraditional completion
Measurement definitions
Percentage of CTE concentrators who have met the proficient or advanced level on the statewide high school reading and language arts assessment administered by the state under ESEA and who, in the reporting year, left secondary education (grade 10 Language Arts Criterion-Referenced Tests (CRT)).
Percentage of CTE concentrators who have met the proficient or advanced level on the statewide high school mathematics assessment administered by the state under ESEA and who, in the reporting year, left secondary education (Algebra or Geometry grades 10-12 CRT).
Percentage of concentrators passing a skill test in the program of study of concentration in one of the required foundation courses.
Percentage of concentrators earning a regular high school diploma, or a General Education Development (GED) reported with graduating class.
Percentage of CTE concentrators who, in the reporting year, were included as graduated in the state's computation of its graduation rate as described in ESEA .
Percentage of concentrators who left secondary education and were placed in postsecondary education or advanced training, in military service, or in employment during the second quarter following the program year in which they left secondary education (Oct. 1-Dec. 31).
Percentage of participants from underrepresented gender groups who participated in a program that leads to employment in nontraditional fields during the reporting year.
Percentage of concentrators from underrepresented gender groups who completed a program that leads to employment in nontraditional fields during the reporting year.
PY 2010–11 Performance levels 80.68% 52.02% 70.29% 91.21% 87.68% 58.14% 33.68% 20.70%
PY 2010–11 Results 87.07% 46.19% 72.78% >95.00% 94.82% 55.64% 28.47% 19.97%
Special populations
Individuals with disabilities (ADA )
Individuals with disabilities (ESEA /IDEA )
Economically disadvantaged students
Single parents
Displaced homemakers
Limited English proficient students
Migrant students
Students in nontraditional programs
NP
30.60%
93.77%
NP
NP
24.36%
23.08%
45.05%
NP
>95.00%
>95.00%
NP
NP
92.64%
>95.00%
>95.00%
NP
41.76%
48.50%
NP
NP
39.34%
<10.00%
56.46%
NP
18.66%
21.39%
NP
NP
24.22%
25.00%
NP
NP NP NP NP
43.87% 43.95% 93.41% 28.85%
78.81% 62.55% 89.26% 28.47%
NP NP NP NP
NP NP NP NP
61.01% 44.07% 84.50% 28.99%
79.17% 52.17% 83.33% 28.28%
86.68% 74.35% 94.68% NP Tech prep NP NP NP NP NP PNO NP NP NOTE: This table contains the results for students whom the state has identified as concentrators or participants (participants are only indicated by the state under the nontraditional participation core indicator) in career and technical education (CTE). See Appendix A, Table A-1 for the state’s definition of CTE concentrators and Table A-2 for the state’s definition of CTE participants. Definitions for special populations are provided in the Glossary of Terms in this report. Actual performance data above 95 percent and below 10 percent have been masked to protect student confidentiality. NE—state reported no enrollment; NP—data not provided; PNO—state reported program not offered; NA—data not applicable ADA—Americans with Disabilities Act; ESEA—Elementary and Secondary Education Act of 1965, as amended; IDEA—Individuals with Disabilities Education Act

APPENDIX B. INDIVIDUAL STATE PERFORMANCE PROFILES, PY 2010–11 | 283
Utah Secondary Level—continued
Core indicators
Academic attainment: Reading/
language arts Academic attainment:
Mathematics T echnical skill
attainment School
completion Student
graduation rates Placement Nontraditional participation
Nontraditional completion
Gender
Male
Female
47.95%
44.15%
>95.00%
>95.00%
53.53%
57.77%
12.19%
32.50%
85.07% 71.75% 93.91% 30.96%
89.33% 73.89% >95.00% 25.77%
Race/ethnicity
American Indian or Alaska Native
Asian
Black or African American
Hispanic or Latino Native Hawaiian or Other Pacific Islander White
Two or more races
32.47%
46.20%
33.00%
32.67%
33.53%
49.97%
42.42%
94.35%
>95.00%
94.78%
94.85%
>95.00%
>95.00%
>95.00%
53.09%
56.16%
51.15%
43.64%
45.64%
57.42%
NE
19.74%
22.58%
24.68%
23.58%
30.56%
19.16%
16.13%
75.86% 53.37% 91.13% 32.16%
85.71% 69.36% 94.39% 29.35%
73.99% 55.45% 90.43% 28.44%
75.14% 55.87% 86.83% 28.80%
74.18% 47.16% 92.67% 30.59%
89.60% 76.64% >95.00% 28.30%
89.42% 67.71% NE 26.77%
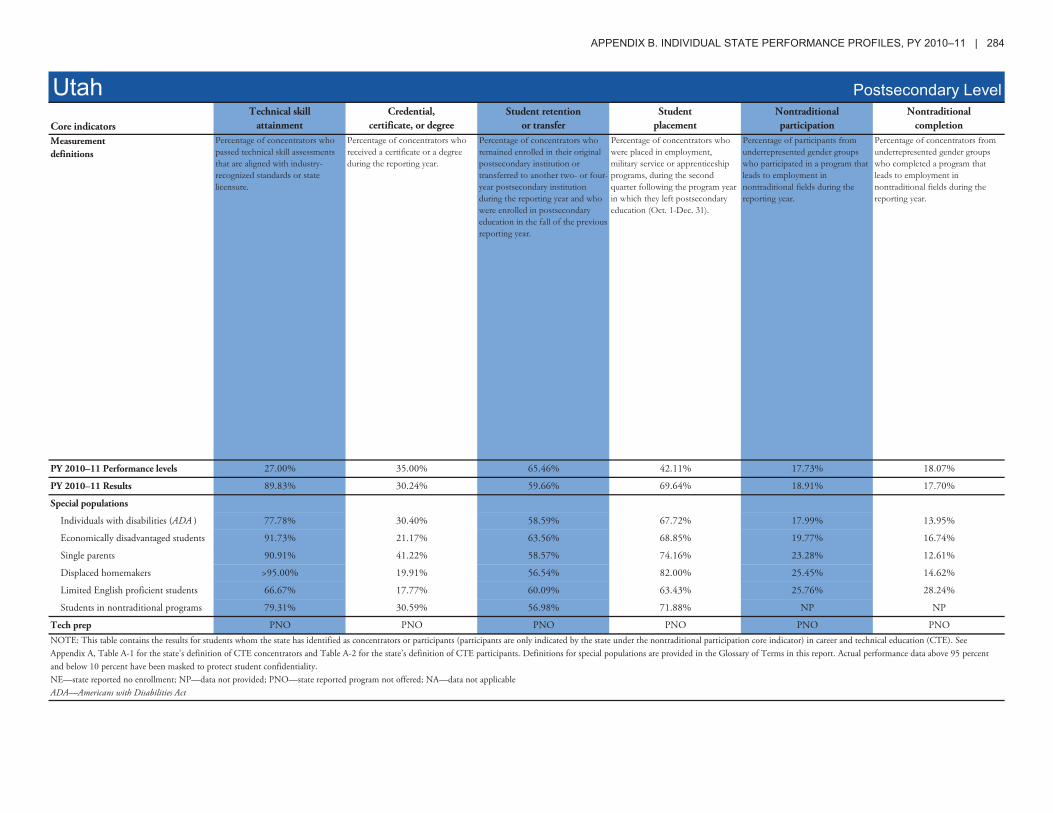
APPENDIX B. INDIVIDUAL STATE PERFORMANCE PROFILES, PY 2010–11 | 284
Utah Postsecondary Level
Core indicators T echnical skill
attainment Credential,
certificate, or degree Student retention
or transfer Student
placement Nontraditional participation
Nontraditional completion
Measurement definitions
Percentage of concentrators who passed technical skill assessments that are aligned with industry-recognized standards or state licensure.
Percentage of concentrators who received a certificate or a degree during the reporting year.
Percentage of concentrators who remained enrolled in their original postsecondary institution or transferred to another two- or four-year postsecondary institution during the reporting year and who were enrolled in postsecondary education in the fall of the previous reporting year.
Percentage of concentrators who were placed in employment, military service or apprenticeship programs, during the second quarter following the program year in which they left postsecondary education (Oct. 1-Dec. 31).
Percentage of participants from underrepresented gender groups who participated in a program that leads to employment in nontraditional fields during the reporting year.
Percentage of concentrators from underrepresented gender groups who completed a program that leads to employment in nontraditional fields during the reporting year.
PY 2010–11 Performance levels 27.00% 35.00% 65.46% 42.11% 17.73% 18.07%
PY 2010–11 Results 89.83% 30.24% 59.66% 69.64% 18.91% 17.70%
Special populations
Individuals with disabilities (ADA )
Economically disadvantaged students
Single parents
Displaced homemakers
Limited English proficient students
Students in nontraditional programs
30.40%
21.17%
41.22%
19.91%
17.77%
30.59%
67.72%
68.85%
74.16%
82.00%
63.43%
71.88%
13.95%
16.74%
12.61%
14.62%
28.24%
NP
77.78% 58.59% 17.99%
91.73% 63.56% 19.77%
90.91% 58.57% 23.28%
>95.00% 56.54% 25.45%
66.67% 60.09% 25.76%
79.31% 56.98% NP
T ech prep PNO PNO PNO PNO PNO PNO NOTE: This table contains the results for students whom the state has identified as concentrators or participants (participants are only indicated by the state under the nontraditional participation core indicator) in career and technical education (CTE). See Appendix A, Table A-1 for the state’s definition of CTE concentrators and Table A-2 for the state’s definition of CTE participants. Definitions for special populations are provided in the Glossary of Terms in this report. Actual performance data above 95 percent and below 10 percent have been masked to protect student confidentiality. NE—state reported no enrollment; NP—data not provided; PNO—state reported program not offered; NA—data not applicable ADA—Americans with Disabilities Act

APPENDIX B. INDIVIDUAL STATE PERFORMANCE PROFILES, PY 2010–11 | 285
Utah Postsecondary Level—continued
Core indicators T echnical skill
attainment Credential,
certificate, or degree Student retention
or transfer Student
placement Nontraditional participation
Nontraditional completion
Gender
Male
Female
24.01%
37.86%
68.68%
70.29%
25.96%
11.23%
83.19% 59.51% <10.00%
94.18% 59.89% 37.08%
Race/ethnicity
American Indian or Alaska Native
Asian
Black or African American
Hispanic or Latino Native Hawaiian or Other Pacific Islander White
Two or more races
28.52%
28.71%
34.18%
28.62%
26.09%
30.11%
50.00%
58.14%
62.71%
36.71%
60.33%
48.98%
71.82%
40.00%
18.27%
22.73%
27.96%
22.38%
26.53%
16.61%
19.74%
90.91% 51.22% 22.80%
77.27% 58.65% 31.27%
57.14% 60.38% 22.90%
74.73% 60.42% 21.06%
80.00% 53.28% 25.87%
91.63% 59.84% 17.86%
>95.00% 62.50% 21.09%

APPENDIX B. INDIVIDUAL STATE PERFORMANCE PROFILES, PY 2010–11 | 286
Vermont Secondary Level
Core indicators
Academic attainment: Reading/
language arts Academic attainment:
Mathematics T echnical skill
attainment School
completion Student
graduation rates Placement Nontraditional participation
Nontraditional completion
Measurement definitions
Percentage of CTE concentrators who have met the proficient or advanced level on the statewide high school reading and language arts assessment administered by the state under ESEA and who, in the reporting year, left secondary education.
Percentage of CTE concentrators who have met the proficient or advanced level on the statewide high school mathematics assessment administered by the state under ESEA and who, in the reporting year, left secondary education.
Percentage of CTE concentrators who passed state-recognized technical skill assessments that are aligned with industry-recognized standards, if available and appropriate, during the reporting year.
Percentage of CTE concentrators who earned a regular secondary school diploma, earned a General Education Development (GED) credential as a state-recognized equivalent to a regular high school diploma (if offered by the state) or other state-recognized equivalent (including recognized alternative standards for individuals with disabilities), or earned a proficiency credential, certificate, or degree, in conjunction with a secondary school diploma (if offered by the state) during the reporting year.
Percentage of CTE concentrators who, in the reporting year, were included as graduated in the state's computation of its graduation rate as described in ESEA .
Percentage of known status CTE concentrators who left secondary education the previous school year and were identified as placed in postsecondary education or advanced training, in the military service, or employment in the second quarter following the program year in which they left secondary education (i.e., unduplicated placement status for CTE concentrators who left secondary education (i.e. graduated or withdrew) by June 30, 2007 and were identified by local survey as in placement between Oct. 1, 2007 and Dec. 31, 2007).
Percentage of CTE participants from underrepresented gender groups who participated in a program that, as specified by the National Alliance for Partnerships in Equity (NAPE) leads to employment in nontraditional fields during the reporting year.
Percentage of CTE concentrators from underrepresented gender groups who completed a program that leads to employment in nontraditional fields during the reporting year.
PY 2010–11 Performance levels 51.00% 21.00% 70.00% 95.25% 93.25% 95.10% 16.50% 16.50%
PY 2010–11 Results 53.27% 16.10% 59.82% >95.00% >95.00% 94.10% 17.69% 15.21%
Special populations
Individuals with disabilities (ADA )
Individuals with disabilities (ESEA /IDEA )
Economically disadvantaged students
Single parents
Displaced homemakers
Limited English proficient students
Migrant students
Students in nontraditional programs
NP
<10.00%
10.87%
<10.00%
NE
<10.00%
NE
13.55%
NP
>95.00%
>95.00%
>95.00%
NE
>95.00%
NE
>95.00%
NP
88.78%
91.01%
72.73%
NE
>95.00%
NE
93.01%
NP
10.21%
14.38%
<10.00%
NE
<10.00%
NE
NP
NP NP NP NP
17.84% 37.96% 94.66% 13.48%
47.84% 54.89% 94.32% 19.06%
58.33% >95.00% 90.91% 37.50%
NE NE NE NE
<10.00% >95.00% >95.00% <10.00%
NE NE NE <10.00%
61.15% 72.73% >95.00% NP Tech prep NP NP NP NP NP PNO NP NP NOTE: This table contains the results for students whom the state has identified as concentrators or participants (participants are only indicated by the state under the nontraditional participation core indicator) in career and technical education (CTE). See Appendix A, Table A-1 for the state’s definition of CTE concentrators and Table A-2 for the state’s definition of CTE participants. Definitions for special populations are provided in the Glossary of Terms in this report. Actual performance data above 95 percent and below 10 percent have been masked to protect student confidentiality. NE—state reported no enrollment; NP—data not provided; PNO—state reported program not offered; NA—data not applicable ADA—Americans with Disabilities Act; ESEA—Elementary and Secondary Education Act of 1965, as amended; IDEA—Individuals with Disabilities Education Act

APPENDIX B. INDIVIDUAL STATE PERFORMANCE PROFILES, PY 2010–11 | 287
Vermont Secondary Level—continued
Core indicators
Academic attainment: Reading/
language arts Academic attainment:
Mathematics T echnical skill
attainment School
completion Student
graduation rates Placement Nontraditional participation
Nontraditional completion
Gender
Male
Female
17.07%
14.53%
>95.00%
>95.00%
93.75%
94.68%
<10.00%
45.35%
43.97% 54.34% >95.00% <10.00%
68.25% 74.83% >95.00% 51.68%
Race/ethnicity
American Indian or Alaska Native
Asian
Black or African American
Hispanic or Latino Native Hawaiian or Other Pacific Islander White
Two or more races
<10.00%
14.29%
27.27%
20.00%
NE
16.15%
<10.00%
>95.00%
>95.00%
91.67%
85.71%
NE
>95.00%
>95.00%
>95.00%
>95.00%
91.67%
>95.00%
NE
94.07%
80.00%
14.29%
50.00%
38.46%
10.00%
<10.00%
14.80%
20.00%
62.50% 80.00% >95.00% 19.23%
>95.00% 80.00% >95.00% 22.86%
54.55% 20.00% 91.67% 17.78%
20.00% 50.00% NE <10.00%
NE NE NE <10.00%
53.15% 59.89% >95.00% 17.75%
25.00% 60.00% >95.00% 15.00%

APPENDIX B. INDIVIDUAL STATE PERFORMANCE PROFILES, PY 2010–11 | 288
Vermont Postsecondary Level
Core indicators T echnical skill
attainment Credential,
certificate, or degree Student retention
or transfer Student
placement Nontraditional participation
Nontraditional completion
Measurement definitions
Percentage of CTE concentrators who passed state-recognized technical skill assessments that are aligned with industry-recognized standards, if available and appropriate, during the reporting year.
Percentage of CTE concentrators who received an industry-recognized credential, a certificate, or a degree during the reporting year.
Percentage of CTE concentrators who remained enrolled in a postsecondary institution or transferred to another two- or four-year postsecondary institution during the reporting year and who were enrolled in postsecondary education in the fall of the previous reporting year.
Percentage of CTE concentrators who were placed or retained in employment, or placed in military service or apprenticeship programs in the second quarter following the program year in which they left the postsecondary institution.
Percentage of CTE participants from underrepresented gender groups who participated in a program that, as specified by National Alliance for Partnerships in Equity (NAPE), leads to employment in nontraditional fields during the reporting year.
Percentage of CTE concentrators from underrepresented gender groups who graduated or completed a program that, as specified by NAPE, leads to employment in nontraditional fields during the reporting year.
PY 2010–11 Performance levels 72.67% 50.00% 77.33% 58.67% 19.25% 16.00%
PY 2010–11 Results 92.56% 76.39% 71.77% 46.14% 16.81% 13.71%
Special populations
Individuals with disabilities (ADA )
Economically disadvantaged students
Single parents
Displaced homemakers
Limited English proficient students
Students in nontraditional programs
75.76%
81.99%
76.82%
>95.00%
61.90%
72.44%
46.15%
42.21%
57.58%
<10.00%
57.14%
45.74%
21.74%
12.00%
11.00%
<10.00%
10.00%
NP
75.00% 61.29% 16.04%
89.63% 72.14% 14.59%
91.38% 71.62% 14.75%
>95.00% NE <10.00%
80.00% 75.61% 22.22%
>95.00% 68.22% NP
T ech prep PNO PNO PNO PNO PNO PNO NOTE: This table contains the results for students whom the state has identified as concentrators or participants (participants are only indicated by the state under the nontraditional participation core indicator) in career and technical education (CTE). See Appendix A, Table A-1 for the state’s definition of CTE concentrators and Table A-2 for the state’s definition of CTE participants. Definitions for special populations are provided in the Glossary of Terms in this report. Actual performance data above 95 percent and below 10 percent have been masked to protect student confidentiality. NE—state reported no enrollment; NP—data not provided; PNO—state reported program not offered; NA—data not applicable ADA—Americans with Disabilities Act

APPENDIX B. INDIVIDUAL STATE PERFORMANCE PROFILES, PY 2010–11 | 289
Vermont Postsecondary Level—continued
Core indicators T echnical skill
attainment Credential,
certificate, or degree Student retention
or transfer Student
placement Nontraditional participation
Nontraditional completion
Gender
Male
Female
70.86%
78.97%
37.59%
50.46%
21.50%
10.40%
92.50% 72.82% 16.69%
92.58% 71.03% 16.89%
Race/ethnicity
American Indian or Alaska Native
Asian
Black or African American
Hispanic or Latino Native Hawaiian or Other Pacific Islander White
Two or more races
50.00%
54.55%
61.54%
42.86%
NE
77.46%
NE
14.29%
30.00%
10.00%
22.22%
NE
47.51%
NE
50.00%
<10.00%
14.29%
<10.00%
<10.00%
14.38%
NE
>95.00% 37.50% 13.64%
66.67% 77.27% 16.67%
>95.00% 63.16% 16.67%
>95.00% 57.14% 16.67%
NE NE NE
92.36% 72.11% 16.18%
NE >95.00% NE

APPENDIX B. INDIVIDUAL STATE PERFORMANCE PROFILES, PY 2010–11 | 290
Virginia Secondary Level
Core indicators
Academic attainment: Reading/
language arts Academic attainment:
Mathematics T echnical skill
attainment School
completion Student
graduation rates Placement Nontraditional participation
Nontraditional completion
Measurement definitions
Percentage of CTE concentrators who have met the proficient or advanced level on the statewide high school reading and language arts assessment administered by the state under ESEA and who, in the reporting year, left secondary education.
Percentage of CTE concentrators who have met the proficient or advanced level on the statewide high school mathematics assessment administered by the state under ESEA and who, in the reporting year, left secondary education.
Percentage of CTE concentrators who passed technical skill assessments that are aligned with industry-recognized standards, if available and appropriate, during the reporting year.
Percentage of CTE concentrators who earned a regular secondary school diploma, or other state-recognized equivalent (including recognized alternative standards for individuals with disabilities), or earned a proficiency credential, certificate, or degree, in conjunction with a secondary school diploma (if offered by the state) during the reporting year.
Percentage of CTE concentrators who, in the reporting year, were included as graduated in the state's computation of its graduation rate as described in ESEA .
Percentage of CTE concentrators who left secondary education and were placed in postsecondary education or advanced training, in the military service, or employment in the second and third quarters following the program year in which they left secondary education (i.e., unduplicated placement status for CTE concentrators who graduated by June 30, 2007 would be assessed between Oct. 1, 2007 and Dec. 31, 2007).
Percentage of CTE participants from underrepresented gender groups who participated in a program that leads to employment in nontraditional fields during the reporting year.
Percentage of CTE concentrators from underrepresented gender groups who completed a program that leads to employment in nontraditional fields during the reporting year.
PY 2010–11 Performance levels 91.00% 83.00% 69.00% 82.00% 77.00% 82.00% 19.00% 16.00%
PY 2010–11 Results >95.00% >95.00% 73.46% >95.00% >95.00% 94.45% 34.13% 30.91%
Special populations
Individuals with disabilities (ADA )
Individuals with disabilities (ESEA /IDEA )
Economically disadvantaged students
Single parents
Displaced homemakers
Limited English proficient students
Migrant students
Students in nontraditional programs
NP
89.95%
>95.00%
>95.00%
>95.00%
>95.00%
>95.00%
>95.00%
NP
>95.00%
>95.00%
>95.00%
>95.00%
>95.00%
>95.00%
>95.00%
NP
86.71%
90.16%
80.15%
87.50%
94.86%
93.75%
93.88%
NP
25.69%
30.75%
29.56%
NP
31.82%
12.50%
NP
NP NP NP NP
87.47% 51.30% >95.00% NP
>95.00% 66.26% >95.00% NP
>95.00% 56.52% >95.00% NP
>95.00% >95.00% >95.00% NP
83.33% 47.62% >95.00% NP
85.71% 50.00% >95.00% NP
>95.00% 73.52% >95.00% NP T ech prep >95.00% >95.00% 78.07% >95.00% >95.00% >95.00% NP 32.84% NOTE: This table contains the results for students whom the state has identified as concentrators or participants (participants are only indicated by the state under the nontraditional participation core indicator) in career and technical education (CTE). See Appendix A, Table A-1 for the state’s definition of CTE concentrators and Table A-2 for the state’s definition of CTE participants. Definitions for special populations are provided in the Glossary of Terms in this report. Actual performance data above 95 percent and below 10 percent have been masked to protect student confidentiality. NE—state reported no enrollment; NP—data not provided; PNO—state reported program not offered; NA—data not applicable ADA—Americans with Disabilities Act; ESEA—Elementary and Secondary Education Act of 1965, as amended; IDEA—Individuals with Disabilities Education Act

APPENDIX B. INDIVIDUAL STATE PERFORMANCE PROFILES, PY 2010–11 | 291
Virginia Secondary Level—continued
Core indicators
Academic attainment: Reading/
language arts Academic attainment:
Mathematics T echnical skill
attainment School
completion Student
graduation rates Placement Nontraditional participation
Nontraditional completion
Gender
Male
Female
>95.00%
>95.00%
>95.00%
>95.00%
94.94%
93.88%
22.07%
41.39%
>95.00% 71.42% >95.00% 31.95%
>95.00% 75.81% >95.00% 36.91%
Race/ethnicity
American Indian or Alaska Native
Asian
Black or African American
Hispanic or Latino Native Hawaiian or Other Pacific Islander White
Two or more races
>95.00%
>95.00%
>95.00%
>95.00%
>95.00%
>95.00%
>95.00%
>95.00%
>95.00%
>95.00%
>95.00%
>95.00%
>95.00%
>95.00%
89.77%
>95.00%
92.89%
>95.00%
90.48%
94.87%
NE
30.77%
29.31%
34.46%
27.07%
25.49%
29.83%
31.62%
>95.00% 70.51% >95.00% NP
>95.00% 75.91% >95.00% NP
>95.00% 65.36% >95.00% NP
>95.00% 68.28% >95.00% NP
>95.00% 71.43% >95.00% NP
>95.00% 77.15% >95.00% NP
>95.00% 74.43% >95.00% NP

APPENDIX B. INDIVIDUAL STATE PERFORMANCE PROFILES, PY 2010–11 | 292
Virginia Postsecondary Level
Core indicators T echnical skill
attainment Credential,
certificate, or degree Student retention
or transfer Student
placement Nontraditional participation
Nontraditional completion
Measurement definitions
Percentage of CTE concentrators who passed technical skill assessments that are aligned with industry-recognized standards, if available and appropriate, during the reporting year.
Percentage of CTE concentrators who received an industry-recognized credential, a certificate, or a degree during the reporting year.
Percentage of CTE concentrators who remained enrolled in their original postsecondary institution or transferred to another two- or four-year postsecondary institution during the reporting year and who were enrolled in postsecondary education in the fall of the previous reporting year.
Percentage of CTE concentrators who were placed or retained in employment, or placed in military service or apprenticeship programs in the second quarter following the program year in which they left postsecondary education (i.e., unduplicated placement status for CTE concentrators who graduated by June 30, 2007 would be assessed between Oct. 1, 2007 and Dec. 31, 2007).
Percentage of CTE participants from underrepresented gender groups who participated in a program that leads to employment in nontraditional fields during the reporting year.
Percentage of CTE concentrators from underrepresented gender groups who completed a program that leads to employment in nontraditional fields during the reporting year.
PY 2010–11 Performance levels 72.00% 40.00% 60.00% 76.00% 19.00% 18.00%
PY 2010–11 Results 75.52% 38.61% 68.64% 69.03% 17.63% 14.69%
Special populations
Individuals with disabilities (ADA )
Economically disadvantaged students
Single parents
Displaced homemakers
Limited English proficient students
Students in nontraditional programs
46.24%
39.27%
NP
39.04%
14.61%
32.45%
53.19%
68.07%
NP
69.45%
81.82%
70.00%
<10.00%
<10.00%
NP
11.67%
15.38%
NP
65.77% 61.48% 18.06%
74.62% 66.62% 18.39%
NP NP NP
85.92% 58.67% 20.74%
69.14% 89.47% 22.03%
77.00% 60.79% NP
T ech prep 73.45% 43.32% 57.18% 65.38% 12.23% <10.00% NOTE: This table contains the results for students whom the state has identified as concentrators or participants (participants are only indicated by the state under the nontraditional participation core indicator) in career and technical education (CTE). See Appendix A, Table A-1 for the state’s definition of CTE concentrators and Table A-2 for the state’s definition of CTE participants. Definitions for special populations are provided in the Glossary of Terms in this report. Actual performance data above 95 percent and below 10 percent have been masked to protect student confidentiality. NE—state reported no enrollment; NP—data not provided; PNO—state reported program not offered; NA—data not applicable ADA—Americans with Disabilities Act

APPENDIX B. INDIVIDUAL STATE PERFORMANCE PROFILES, PY 2010–11 | 293
Virginia Postsecondary Level—continued
Core indicators T echnical skill
attainment Credential,
certificate, or degree Student retention
or transfer Student
placement Nontraditional participation
Nontraditional completion
Gender
Male
Female
37.86%
39.19%
65.89%
71.31%
11.64%
16.96%
72.37% 67.17% 11.06%
77.82% 69.67% 23.68%
Race/ethnicity
American Indian or Alaska Native
Asian
Black or African American
Hispanic or Latino Native Hawaiian or Other Pacific Islander White
Two or more races
30.66%
37.87%
33.30%
49.77%
NE
41.18%
NE
71.05%
64.10%
68.16%
66.35%
NE
69.68%
NE
15.85%
19.42%
15.70%
18.46%
<10.00%
13.90%
NE
71.13% 70.88% 19.23%
77.27% 72.22% 20.99%
66.59% 68.06% 20.04%
72.01% 70.35% 18.93%
NE NE <10.00%
79.17% 68.27% 15.80%
NE NE NE

APPENDIX B. INDIVIDUAL STATE PERFORMANCE PROFILES, PY 2010–11 | 294
Washington Secondary Level
Core indicators
Academic attainment: Reading/
language arts Academic attainment:
Mathematics T echnical skill
attainment School
completion Student
graduation rates Placement Nontraditional participation
Nontraditional completion
Measurement definitions
Percentage of CTE concentrators who have met the proficient or advanced level on the statewide high school reading and language arts assessment administered by the state under ESEA and who, in the reporting year, left secondary education.
Percentage of CTE concentrators who have met the proficient or advanced level on the statewide high school mathematics assessment administered by the state under ESEA and who, in the reporting year, left secondary education.
Percentage of exiting CTE concentrators who took and passed a program-specific assessment designed by the industry.
Percentage of CTE concentrators who have attained a high school diploma or General Education Development (GED) and who have left secondary education in the reporting year.
Percentage of CTE concentrators who, in the reporting year, were included as graduated in the state's computation of its graduation rate as described in ESEA .
Percentage of CTE concentrators who were employed, enrolled in higher education, or enlisted in the military during the third post-exit quarter, based on administrative records or a student survey.
Percentage of CTE participants from underrepresented gender groups who participated in a program that leads to employment in nontraditional fields during the reporting year.
Percentage of CTE concentrators from underrepresented gender groups who completed a program that leads to employment in nontraditional fields during the reporting year.
PY 2010–11 Performance levels 74.30% 62.40% 999.00% 88.52% 73.00% 60.42% 26.50% 34.50%
PY 2010–11 Results 86.02% 48.82% <10.00% 89.05% 44.29% 58.98% 59.29% 61.05%
Special populations
Individuals with disabilities (ADA )
Individuals with disabilities (ESEA /IDEA )
Economically disadvantaged students
Single parents
Displaced homemakers
Limited English proficient students
Migrant students
Students in nontraditional programs
NP
<10.00%
34.54%
NP
NP
<10.00%
20.70%
44.06%
NP
84.58%
85.79%
NP
NP
76.64%
79.82%
88.36%
NP
33.50%
47.60%
PNO
PNO
39.69%
44.17%
55.86%
NP
62.53%
64.37%
NP
NP
70.38%
70.59%
NP
NP NP NP NP
39.61% <10.00% 42.12% 62.32%
79.19% <10.00% 42.70% 61.28%
NP NP NP NP
NP NP NP NP
37.72% <10.00% 40.40% 59.75%
73.07% <10.00% 43.91% 64.49%
84.56% <10.00% 42.74% NP Tech prep 86.31% 48.64% <10.00% 88.97% 43.42% 60.10% 61.87% 62.39% NOTE: This table contains the results for students whom the state has identified as concentrators or participants (participants are only indicated by the state under the nontraditional participation core indicator) in career and technical education (CTE). See Appendix A, Table A-1 for the state’s definition of CTE concentrators and Table A-2 for the state’s definition of CTE participants. Definitions for special populations are provided in the Glossary of Terms in this report. Actual performance data above 95 percent and below 10 percent have been masked to protect student confidentiality. NE—state reported no enrollment; NP—data not provided; PNO—state reported program not offered; NA—data not applicable ADA—Americans with Disabilities Act; ESEA—Elementary and Secondary Education Act of 1965, as amended; IDEA—Individuals with Disabilities Education Act

APPENDIX B. INDIVIDUAL STATE PERFORMANCE PROFILES, PY 2010–11 | 295
Washington Secondary Level—continued
Core indicators
Academic attainment: Reading/
language arts Academic attainment:
Mathematics T echnical skill
attainment School
completion Student
graduation rates Placement Nontraditional participation
Nontraditional completion
Gender
Male
Female
50.30%
47.06%
86.47%
92.15%
54.95%
63.65%
58.27%
64.74%
83.06% <10.00% 43.34% 66.28%
89.53% <10.00% 45.39% 51.18%
Race/ethnicity
American Indian or Alaska Native
Asian
Black or African American
Hispanic or Latino Native Hawaiian or Other Pacific Islander White
Two or more races
35.40%
60.24%
23.12%
28.31%
27.61%
53.66%
48.39%
82.01%
92.89%
84.97%
84.15%
84.76%
90.15%
88.94%
43.10%
72.80%
53.89%
48.59%
45.21%
59.93%
55.24%
64.35%
61.37%
65.67%
66.39%
63.97%
59.54%
62.61%
77.06% <10.00% 37.96% 62.99%
88.49% <10.00% 47.19% 55.96%
76.56% <10.00% 42.39% 61.15%
78.71% <10.00% 41.63% 61.94%
78.68% 13.64% 43.09% 61.08%
88.06% <10.00% 45.22% 58.55%
85.21% <10.00% 43.13% 59.55%

APPENDIX B. INDIVIDUAL STATE PERFORMANCE PROFILES, PY 2010–11 | 296
Washington Postsecondary Level
Core indicators T echnical skill
attainment Credential,
certificate, or degree Student retention
or transfer Student
placement Nontraditional participation
Nontraditional completion
Measurement definitions
Percentage of CTE concentrators, exiting during the reporting year, who have attained an award (a degree, certificate, apprenticeship, or an industry certification) or completed at least 45 vocational credits with a 2.0 or higher GPA.
Percentage of CTE concentrators, exiting during the reporting year, who have attained an award (a degree, certificate, apprenticeship, or an industry certification).
Percentage of CTE participants who are not yet concentrators at the beginning of the reporting year, who became CTE concentrators or enrolled in other higher education, including apprenticeship, during the reporting year.
Percentage of CTE concentrators who were either employed according to Unemployment Insurance (UI)-wage records or in the military, and not enrolled in higher education during the third quarter after they exit.
Percentage of CTE participants from underrepresented gender groups who enrolled in a nontraditional program during the reporting period.
Percentage of CTE completers from underrepresented gender groups who enrolled in a nontraditional program during the reporting period.
PY 2010–11 Performance levels 999.00% 999.00% 57.79% 55.10% 18.50% 18.00%
PY 2010–11 Results NP NP 60.26% 51.68% 18.39% 16.92%
Special populations
Individuals with disabilities (ADA )
Economically disadvantaged students
Single parents
Displaced homemakers
Limited English proficient students
Students in nontraditional programs
PNO
PNO
PNO
PNO
PNO
PNO
37.00%
50.92%
46.47%
47.21%
48.46%
51.64%
19.37%
16.45%
16.02%
11.80%
14.56%
NP
NP 60.52% 22.05%
NP 66.33% 18.52%
NP 52.17% 18.31%
NP 67.45% 14.68%
NP 43.70% 19.66%
NP 52.10% NP
T ech prep NP PNO 58.37% 52.12% 24.97% 19.83% NOTE: This table contains the results for students whom the state has identified as concentrators or participants (participants are only indicated by the state under the nontraditional participation core indicator) in career and technical education (CTE). See Appendix A, Table A-1 for the state’s definition of CTE concentrators and Table A-2 for the state’s definition of CTE participants. Definitions for special populations are provided in the Glossary of Terms in this report. Actual performance data above 95 percent and below 10 percent have been masked to protect student confidentiality. NE—state reported no enrollment; NP—data not provided; PNO—state reported program not offered; NA—data not applicable ADA—Americans with Disabilities Act

APPENDIX B. INDIVIDUAL STATE PERFORMANCE PROFILES, PY 2010–11 | 297
Washington Postsecondary Level—continued
Core indicators T echnical skill
attainment Credential,
certificate, or degree Student retention
or transfer Student
placement Nontraditional participation
Nontraditional completion
Gender
Male
Female
PNO
PNO
47.97%
54.91%
17.25%
16.65%
NP 58.04% 18.15%
NP 62.34% 18.61%
Race/ethnicity
American Indian or Alaska Native
Asian
Black or African American
Hispanic or Latino Native Hawaiian or Other Pacific Islander White
Two or more races
PNO
PNO
PNO
PNO
PNO
PNO
PNO
43.49%
54.75%
46.51%
54.83%
50.83%
52.04%
53.09%
20.14%
19.72%
20.62%
15.59%
15.70%
16.46%
20.99%
NP 55.98% 21.25%
NP 64.98% 21.23%
NP 54.33% 23.99%
NP 56.61% 17.53%
NP 50.65% 19.15%
NP 62.27% 17.66%
NP 59.51% 23.36%

APPENDIX B. INDIVIDUAL STATE PERFORMANCE PROFILES, PY 2010–11 | 298
West Virginia Secondary Level
Core indicators
Academic attainment: Reading/
language arts Academic attainment:
Mathematics T echnical skill
attainment School
completion Student
graduation rates Placement Nontraditional participation
Nontraditional completion
Measurement definitions
Percentage of CTE concentrators who have met the proficient or advanced level on the statewide high school reading and language arts assessment administered by the state under ESEA and who, in the reporting year, left secondary education.
Percentage of CTE concentrators who have met the proficient or advanced level on the statewide high school mathematics assessment administered by the state under ESEA and who, in the reporting year, left secondary education.
Percentage of CTE participants who passed end-of-course technical skill assessments that are aligned with industry-recognized standards, if available and appropriate, during the reporting year.
Percentage of CTE concentrators who earned a regular secondary school diploma, earned a General Education Development (GED) credential as a state-recognized equivalent to a regular high school diploma (if offered by the state) or other state-recognized equivalent (including recognized alternative standards for individuals with disabilities), or earned a proficiency credential, certificate, or degree, in conjunction with a secondary school diploma (if offered by the state) during the reporting year.
Percentage of CTE concentrators who, in the reporting year, were included as graduated in the state's computation of its graduation rate as described in ESEA .
Percentage of CTE concentrators who left secondary education and were placed in postsecondary education or advanced training, in the military service, or employment in the second quarter following the program year in which they left secondary education (i.e., unduplicated placement status for CTE concentrators who graduated by June 30, 2007 would be assessed between Oct. 1, 2007 and Dec. 31, 2007).
Percentage of nontraditional CTE participants in occupational courses during the reporting year.
Percentage of CTE concentrators from underrepresented gender groups who completed a program that leads to employment in nontraditional fields during the reporting year.
PY 2010–11 Performance levels 46.00% 46.80% 78.00% 95.25% 86.00% 92.00% 38.65% 17.00%
PY 2010–11 Results 25.51% 32.37% 84.71% >95.00% >95.00% >95.00% 35.65% 18.43%
Special populations
Individuals with disabilities (ADA )
Individuals with disabilities (ESEA /IDEA )
Economically disadvantaged students
Single parents
Displaced homemakers
Limited English proficient students
Migrant students
Students in nontraditional programs
NP
<10.00%
25.77%
NE
NE
25.00%
NE
43.31%
NP
>95.00%
>95.00%
NE
NE
<10.00%
NE
>95.00%
NP
93.65%
>95.00%
NP
NP
NE
NE
>95.00%
13.23%
NP
16.12%
NP
NP
<10.00%
NE
NP
NP 65.84% >95.00% 32.64%
<10.00% NP NP NP
19.98% 81.80% >95.00% 35.76%
NE NP NP NP
NE NP NP NP
33.33% NE >95.00% 41.12%
NE NP NE NP
36.36% 87.25% >95.00% NP T ech prep 25.22% 31.64% 84.79% >95.00% >95.00% >95.00% 36.98% 18.43% NOTE: This table contains the results for students whom the state has identified as concentrators or participants (participants are only indicated by the state under the nontraditional participation core indicator) in career and technical education (CTE). See Appendix A, Table A-1 for the state’s definition of CTE concentrators and Table A-2 for the state’s definition of CTE participants. Definitions for special populations are provided in the Glossary of Terms in this report. Actual performance data above 95 percent and below 10 percent have been masked to protect student confidentiality. NE—state reported no enrollment; NP—data not provided; PNO—state reported program not offered; NA—data not applicable ADA—Americans with Disabilities Act; ESEA—Elementary and Secondary Education Act of 1965, as amended; IDEA—Individuals with Disabilities Education Act

APPENDIX B. INDIVIDUAL STATE PERFORMANCE PROFILES, PY 2010–11 | 299
West Virginia Secondary Level—continued
Core indicators
Academic attainment: Reading/
language arts Academic attainment:
Mathematics T echnical skill
attainment School
completion Student
graduation rates Placement Nontraditional participation
Nontraditional completion
Gender
Male
Female
30.97%
34.61%
>95.00%
>95.00%
>95.00%
>95.00%
15.52%
22.99%
19.83% 81.95% >95.00% 39.29%
34.61% 89.15% >95.00% 30.36%
Race/ethnicity
American Indian or Alaska Native
Asian
Black or African American
Hispanic or Latino Native Hawaiian or Other Pacific Islander White
Two or more races
28.57%
63.64%
28.70%
34.78%
>95.00%
32.38%
16.67%
>95.00%
>95.00%
>95.00%
>95.00%
>95.00%
>95.00%
>95.00%
NA*
NA*
NA*
NA*
NA*
NA*
NA*
33.33%
<10.00%
25.84%
11.76%
<10.00%
18.35%
<10.00%
40.00% 83.33% >95.00% 55.81%
50.00% >95.00% >95.00% 46.31%
13.89% 78.38% >95.00% 41.60%
26.09% 81.82% >95.00% 42.96%
<10.00% NE >95.00% 57.14%
25.74% 84.80% >95.00% 35.27%
<10.00% >95.00% >95.00% 41.25% NA*—The state was unable to collect and report race/ethnicity data for this particular cell in accordance with the required 1997 race/ethnicity categories. While the state did report data using the 1977 race/ethnicity categories, we are only reporting data provided by the states according to the 1997 race/ethnicity categories described in the Department’s Oct. 19, 2007, memorandum titled “Final Guidance on Maintaining, Collecting, and Reporting Racial and Ethnic Data” (see 72 Federal Register 59266).

APPENDIX B. INDIVIDUAL STATE PERFORMANCE PROFILES, PY 2010–11 | 300
West Virginia Postsecondary Level
Core indicators T echnical skill
attainment Credential,
certificate, or degree Student retention
or transfer Student
placement Nontraditional participation
Nontraditional completion
Measurement definitions
Percentage of CTE concentrators who passed technical skill assessments that are aligned with industry-recognized standards, if available and appropriate, during the reporting year.
Percentage of CTE concentrators who received an industry-recognized credential, a certificate, or a degree during the reporting year.
Percentage of CTE concentrators who remained enrolled in their original postsecondary institution or transferred to another two- or four-year postsecondary institution during the reporting year and who were enrolled in postsecondary education in the fall of the previous reporting year.
Percentage of CTE concentrators who were placed or retained in employment, or placed in military service or apprenticeship programs in the second quarter following the program year in which they left postsecondary education (i.e., unduplicated placement status for CTE concentrators who graduated by June 30, 2007 would be assessed between Oct. 1, 2007 and Dec. 31, 2007).
Percentage of CTE participants from underrepresented gender groups who participated in a program that leads to employment in nontraditional fields during the reporting year.
Percentage of CTE concentrators from underrepresented gender groups who completed a program that leads to employment in nontraditional fields during the reporting year.
PY 2010–11 Performance levels 87.00% 56.00% 57.00% 76.00% 17.50% 19.50%
PY 2010–11 Results 87.44% 60.35% 52.84% 70.95% 21.79% 21.61%
Special populations
Individuals with disabilities (ADA )
Economically disadvantaged students
Single parents
Displaced homemakers
Limited English proficient students
Students in nontraditional programs
60.00%
44.86%
47.39%
49.94%
<10.00%
52.38%
68.75%
63.96%
69.84%
75.80%
NE
76.32%
20.00%
19.43%
21.31%
23.36%
NE
NP
>95.00% 52.55% 22.41%
90.33% 52.83% 19.67%
93.09% 52.83% 21.65%
90.62% 52.82% 23.36%
89.29% NE NE
>95.00% 52.84% NP
T ech prep NP NP NP NP NP NP NOTE: This table contains the results for students whom the state has identified as concentrators or participants (participants are only indicated by the state under the nontraditional participation core indicator) in career and technical education (CTE). See Appendix A, Table A-1 for the state’s definition of CTE concentrators and Table A-2 for the state’s definition of CTE participants. Definitions for special populations are provided in the Glossary of Terms in this report. Actual performance data above 95 percent and below 10 percent have been masked to protect student confidentiality. NE—state reported no enrollment; NP—data not provided; PNO—state reported program not offered; NA—data not applicable ADA—Americans with Disabilities Act

APPENDIX B. INDIVIDUAL STATE PERFORMANCE PROFILES, PY 2010–11 | 301
West Virginia Postsecondary Level—continued
Core indicators T echnical skill
attainment Credential,
certificate, or degree Student retention
or transfer Student
placement Nontraditional participation
Nontraditional completion
Gender
Male
Female
57.68%
61.77%
67.74%
72.46%
16.79%
25.63%
84.55% 52.83% 15.86%
88.71% 52.84% 25.98%
Race/ethnicity
American Indian or Alaska Native
Asian
Black or African American
Hispanic or Latino Native Hawaiian or Other Pacific Islander White
Two or more races
52.94%
60.98%
49.86%
57.78%
>95.00%
61.06%
NP
75.00%
>95.00%
57.89%
>95.00%
NE
71.30%
NE
33.33%
<10.00%
20.59%
14.29%
50.00%
21.70%
27.27%
>95.00% 52.63% 17.39%
60.00% 52.63% 23.81%
79.69% 52.81% 31.31%
62.50% 52.67% 19.05%
NE 50.00% 66.67%
88.11% 52.78% 21.08%
NP 51.47% 34.62%

APPENDIX B. INDIVIDUAL STATE PERFORMANCE PROFILES, PY 2010–11 | 302
Wisconsin Secondary Level
Core indicators
Academic attainment: Reading/
language arts Academic attainment:
Mathematics T echnical skill
attainment School
completion Student
graduation rates Placement Nontraditional participation
Nontraditional completion
Measurement definitions
Percentage of CTE concentrators who have met the proficient or advanced level on the statewide high school reading and language arts assessment administered by the state under ESEA and who, in the reporting year, left secondary education.
Percentage of CTE concentrators who have met the proficient or advanced level on the statewide high school mathematics assessment administered by the state under ESEA and who, in the reporting year, left secondary education.
Percentage of CTE concentrators who passed technical skill assessments that are aligned with industry-recognized standards, if available and appropriate, during the reporting year.
Percentage of grade 12 CTE concentrators who graduated during the reporting year.
Percentage of CTE concentrators who, in the reporting year, were included as graduated in the state's computation of its graduation rate as described in ESEA .
Percentage of CTE concentrator graduates who were placed in postsecondary education or advanced training, in the military service, or employment.
Percentage of CTE participants from underrepresented gender groups who participated in a program that leads to employment in nontraditional fields during the reporting year.
Percentage of CTE concentrators from underrepresented gender groups who completed a program that leads to employment in nontraditional fields during the reporting year.
PY 2010–11 Performance levels 80.50% 74.00% 83.71% 82.00% 90.00% 96.78% 25.25% 91.00%
PY 2010–11 Results 76.59% 71.77% 86.35% >95.00% >95.00% 94.63% 22.26% >95.00%
Special populations
Individuals with disabilities (ADA )
Individuals with disabilities (ESEA /IDEA )
Economically disadvantaged students
Single parents
Displaced homemakers
Limited English proficient students
Migrant students
Students in nontraditional programs
NP
39.29%
55.50%
51.56%
NP
44.62%
33.33%
67.87%
NP
87.31%
93.11%
94.49%
NP
89.76%
87.50%
>95.00%
NP
87.03%
NP
89.13%
NP
86.72%
NP
94.67%
NP
83.60%
92.97%
>95.00%
NP
88.46%
50.00%
NP
NP NP NP NP
43.14% 81.36% 87.31% 19.05%
63.92% 80.93% 93.11% 28.04%
63.02% 77.78% 94.49% 36.95%
NP NP NP NP
50.08% 73.57% 89.76% 28.35%
77.78% >95.00% 87.50% 20.00%
76.57% 86.08% >95.00% NP Tech prep 80.86% 77.35% 88.21% >95.00% >95.00% >95.00% 17.79% >95.00% NOTE: This table contains the results for students whom the state has identified as concentrators or participants (participants are only indicated by the state under the nontraditional participation core indicator) in career and technical education (CTE). See Appendix A, Table A-1 for the state’s definition of CTE concentrators and Table A-2 for the state’s definition of CTE participants. Definitions for special populations are provided in the Glossary of Terms in this report. Actual performance data above 95 percent and below 10 percent have been masked to protect student confidentiality. NE—state reported no enrollment; NP—data not provided; PNO—state reported program not offered; NA—data not applicable ADA—Americans with Disabilities Act; ESEA—Elementary and Secondary Education Act of 1965, as amended; IDEA—Individuals with Disabilities Education Act

APPENDIX B. INDIVIDUAL STATE PERFORMANCE PROFILES, PY 2010–11 | 303
Wisconsin Secondary Level—continued
Core indicators
Academic attainment: Reading/
language arts Academic attainment:
Mathematics T echnical skill
attainment School
completion Student
graduation rates Placement Nontraditional participation
Nontraditional completion
Gender
Male
Female
75.06%
67.44%
>95.00%
>95.00%
93.73%
>95.00%
91.16%
>95.00%
76.10% 87.75% >95.00% <10.00%
77.24% 85.44% >95.00% 56.37%
Race/ethnicity
American Indian or Alaska Native
Asian
Black or African American
Hispanic or Latino Native Hawaiian or Other Pacific Islander White
Two or more races
63.54%
64.63%
41.60%
55.56%
50.00%
79.48%
79.31%
93.75%
>95.00%
88.15%
88.24%
>95.00%
>95.00%
>95.00%
88.00%
93.54%
87.29%
88.22%
62.50%
>95.00%
85.59%
92.31%
91.76%
89.78%
91.12%
>95.00%
>95.00%
>95.00%
69.79% 71.43% 93.75% 25.84%
64.30% 84.43% >95.00% 26.31%
54.85% 58.42% 88.15% 39.09%
64.34% 72.85% 88.24% 29.59%
50.00% NE >95.00% 33.33%
82.59% 89.83% >95.00% 18.99%
79.31% 89.47% >95.00% 23.17%

APPENDIX B. INDIVIDUAL STATE PERFORMANCE PROFILES, PY 2010–11 | 304
Wisconsin Postsecondary Level
Core indicators T echnical skill
attainment Credential,
certificate, or degree Student retention
or transfer Student
placement Nontraditional participation
Nontraditional completion
Measurement definitions
Percentage of CTE concentrators for the measurement period who passed at least 80 percent of the technical courses attempted during the measurement period.
Percentage of CTE concentrators for the measurement period who were reported by the college as a graduate.
Percentage of CTE concentrators for the measurement period who are still enrolled in a Wisconsin Technical College System (WTCS) two-year college at the end of the measurement period or have transferred to a non-WTCS two- or four-year postsecondary institution.
Percentage of CTE concentrators who reported employment two quarters after the end of the academic year.
Percentage of CTE participants from underrepresented gender groups who participated in a program that leads to employment in nontraditional fields during the reporting year.
Percentage of CTE concentrators from underrepresented gender groups who completed a program that leads to employment in nontraditional fields during the reporting year.
PY 2010–11 Performance levels 80.65% 44.85% 25.54% 90.00% 11.74% 9.53%
PY 2010–11 Results 80.36% 44.83% 26.49% 90.29% 13.77% 10.90%
Special populations
Individuals with disabilities (ADA )
Economically disadvantaged students
Single parents
Displaced homemakers
Limited English proficient students
Students in nontraditional programs
37.42%
43.01%
38.60%
38.10%
51.80%
42.19%
84.52%
88.47%
86.97%
86.91%
58.21%
67.86%
14.47%
12.57%
14.47%
17.95%
<10.00%
NP
70.92% 31.71% 15.97%
76.47% 27.10% 15.75%
72.92% 28.59% 16.80%
71.57% 28.07% 19.50%
82.85% 26.26% 13.91%
79.96% 48.17% NP
T ech prep 83.12% 45.31% 24.69% NP <10.00% <10.00% NOTE: This table contains the results for students whom the state has identified as concentrators or participants (participants are only indicated by the state under the nontraditional participation core indicator) in career and technical education (CTE). See Appendix A, Table A-1 for the state’s definition of CTE concentrators and Table A-2 for the state’s definition of CTE participants. Definitions for special populations are provided in the Glossary of Terms in this report. Actual performance data above 95 percent and below 10 percent have been masked to protect student confidentiality. NE—state reported no enrollment; NP—data not provided; PNO—state reported program not offered; NA—data not applicable ADA—Americans with Disabilities Act

APPENDIX B. INDIVIDUAL STATE PERFORMANCE PROFILES, PY 2010–11 | 305
Wisconsin Postsecondary Level—continued
Core indicators T echnical skill
attainment Credential,
certificate, or degree Student retention
or transfer Student
placement Nontraditional participation
Nontraditional completion
Gender
Male
Female
45.27%
44.43%
90.04%
90.49%
<10.00%
13.75%
80.97% 27.10% 10.68%
79.79% 25.91% 16.50%
Race/ethnicity
American Indian or Alaska Native
Asian
Black or African American
Hispanic or Latino Native Hawaiian or Other Pacific Islander White
Two or more races
36.47%
45.19%
33.33%
35.21%
45.45%
45.95%
29.55%
88.31%
78.06%
75.99%
69.60%
62.50%
92.01%
NE
10.53%
<10.00%
19.47%
15.98%
<10.00%
10.33%
15.38%
70.78% 30.20% 17.13%
78.33% 26.18% 12.38%
66.99% 36.68% 22.21%
77.59% 32.74% 16.62%
76.67% 33.33% 15.52%
81.30% 25.47% 12.94%
70.45% 38.64% 18.43%
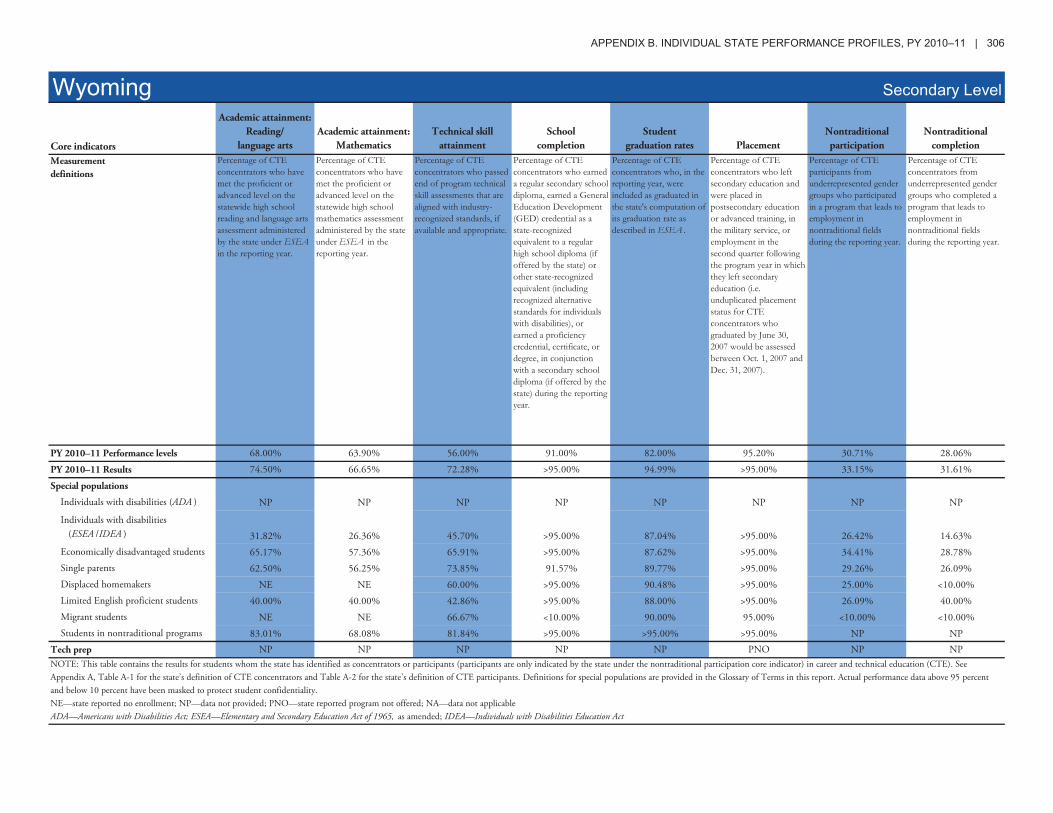
APPENDIX B. INDIVIDUAL STATE PERFORMANCE PROFILES, PY 2010–11 | 306
Wyoming Secondary Level
Core indicators
Academic attainment: Reading/
language arts Academic attainment:
Mathematics T echnical skill
attainment School
completion Student
graduation rates Placement Nontraditional participation
Nontraditional completion
Measurement definitions
Percentage of CTE concentrators who have met the proficient or advanced level on the statewide high school reading and language arts assessment administered by the state under ESEA in the reporting year.
Percentage of CTE concentrators who have met the proficient or advanced level on the statewide high school mathematics assessment administered by the state under ESEA in the reporting year.
Percentage of CTE concentrators who passed end of program technical skill assessments that are aligned with industry-recognized standards, if available and appropriate.
Percentage of CTE concentrators who earned a regular secondary school diploma, earned a General Education Development (GED) credential as a state-recognized equivalent to a regular high school diploma (if offered by the state) or other state-recognized equivalent (including recognized alternative standards for individuals with disabilities), or earned a proficiency credential, certificate, or degree, in conjunction with a secondary school diploma (if offered by the state) during the reporting year.
Percentage of CTE concentrators who, in the reporting year, were included as graduated in the state's computation of its graduation rate as described in ESEA .
Percentage of CTE concentrators who left secondary education and were placed in postsecondary education or advanced training, in the military service, or employment in the second quarter following the program year in which they left secondary education (i.e. unduplicated placement status for CTE concentrators who graduated by June 30, 2007 would be assessed between Oct. 1, 2007 and Dec. 31, 2007).
Percentage of CTE participants from underrepresented gender groups who participated in a program that leads to employment in nontraditional fields during the reporting year.
Percentage of CTE concentrators from underrepresented gender groups who completed a program that leads to employment in nontraditional fields during the reporting year.
PY 2010–11 Performance levels 68.00% 63.90% 56.00% 91.00% 82.00% 95.20% 30.71% 28.06%
PY 2010–11 Results 74.50% 66.65% 72.28% >95.00% 94.99% >95.00% 33.15% 31.61%
Special populations
Individuals with disabilities (ADA )
Individuals with disabilities (ESEA /IDEA )
Economically disadvantaged students
Single parents
Displaced homemakers
Limited English proficient students
Migrant students
Students in nontraditional programs
NP
26.36%
57.36%
56.25%
NE
40.00%
NE
68.08%
NP
>95.00%
>95.00%
91.57%
>95.00%
>95.00%
<10.00%
>95.00%
NP
>95.00%
>95.00%
>95.00%
>95.00%
>95.00%
95.00%
>95.00%
NP
14.63%
28.78%
26.09%
<10.00%
40.00%
<10.00%
NP
NP NP NP NP
31.82% 45.70% 87.04% 26.42%
65.17% 65.91% 87.62% 34.41%
62.50% 73.85% 89.77% 29.26%
NE 60.00% 90.48% 25.00%
40.00% 42.86% 88.00% 26.09%
NE 66.67% 90.00% <10.00%
83.01% 81.84% >95.00% NP T ech prep NP NP NP NP NP PNO NP NP NOTE: This table contains the results for students whom the state has identified as concentrators or participants (participants are only indicated by the state under the nontraditional participation core indicator) in career and technical education (CTE). See Appendix A, Table A-1 for the state’s definition of CTE concentrators and Table A-2 for the state’s definition of CTE participants. Definitions for special populations are provided in the Glossary of Terms in this report. Actual performance data above 95 percent and below 10 percent have been masked to protect student confidentiality. NE—state reported no enrollment; NP—data not provided; PNO—state reported program not offered; NA—data not applicable ADA—Americans with Disabilities Act; ESEA—Elementary and Secondary Education Act of 1965, as amended; IDEA—Individuals with Disabilities Education Act

APPENDIX B. INDIVIDUAL STATE PERFORMANCE PROFILES, PY 2010–11 | 307
Wyoming Secondary Level—continued
Core indicators
Academic attainment: Reading/
language arts Academic attainment:
Mathematics T echnical skill
attainment School
completion Student
graduation rates Placement Nontraditional participation
Nontraditional completion
Gender
Male
Female
68.10%
64.44%
>95.00%
>95.00%
>95.00%
>95.00%
<10.00%
79.73%
69.73% 65.21% 93.95% <10.00%
81.75% 82.54% >95.00% 75.90%
Race/ethnicity
American Indian or Alaska Native
Asian
Black or African American
Hispanic or Latino Native Hawaiian or Other Pacific Islander White
Two or more races
61.54%
81.82%
55.56%
56.97%
<10.00%
67.91%
60.00%
>95.00%
>95.00%
>95.00%
>95.00%
>95.00%
>95.00%
>95.00%
>95.00%
>95.00%
>95.00%
>95.00%
>95.00%
>95.00%
75.00%
38.10%
14.29%
33.33%
32.97%
NE
31.46%
33.33%
69.23% 80.39% 79.31% 43.10%
81.82% 86.96% >95.00% 39.02%
55.56% 68.75% 95.00% 32.91%
66.06% 67.89% 91.58% 31.89%
<10.00% 80.00% >95.00% 40.00%
75.68% 72.66% >95.00% 33.04%
>95.00% 55.56% >95.00% 26.92%

APPENDIX B. INDIVIDUAL STATE PERFORMANCE PROFILES, PY 2010–11 | 308
Wyoming Postsecondary Level
Core indicators T echnical skill
attainment Credential,
certificate, or degree Student retention
or transfer Student
placement Nontraditional participation
Nontraditional completion
Measurement definitions
Percentage of CTE concentrators in the identified entry cohort who receive an industry-recognized credential, certificate, or degree at any point between when they were classified into the cohort and the current reporting period.
Percentage of CTE concentrators in the identified entry cohort who receive or were eligible to receive an industry-recognized credential certificate, or degree at any point between when they were classified into the cohort and the current reporting period.
Percentage of CTE concentrators who remain enrolled in their original postsecondary institution or transferred to another two- or four-year postsecondary institution during the reporting year and who were enrolled in postsecondary education in the fall of the previous reporting year.
Percentage of CTE concentrators who were placed or retained in employment, or placed in military service or apprenticeship programs in the second quarter following the program year in which they left postsecondary education (i.e., unduplicated placement status for CTE concentrators who graduated by June 30, 2007 would be assessed between Oct. 1, 2007 and Dec. 31, 2007).
Percentage of CTE participants from underrepresented gender groups who participated in a program that leads to employment in nontraditional fields during the reporting year.
Percentage of CTE concentrators in the identified entry cohort and who were from underrepresented gender groups who receive a credential, certificate, or degree in a CTE program identified as preparing students for employment in an occupation identified as out-of-gender balance.
PY 2010–11 Performance levels 27.50% 27.50% 65.00% 69.00% 21.46% 12.75%
PY 2010–11 Results 28.52% 28.52% 71.66% 84.07% 25.85% 13.28%
Special populations
Individuals with disabilities (ADA )
Economically disadvantaged students
Single parents
Displaced homemakers
Limited English proficient students
Students in nontraditional programs
23.58%
28.78%
37.96%
42.11%
63.33%
18.40%
58.33%
85.90%
88.24%
75.00%
>95.00%
78.05%
14.29%
15.86%
15.62%
<10.00%
>95.00%
NP
23.58% 66.67% 30.14%
28.78% 72.64% 29.78%
37.96% 65.50% 33.33%
42.11% 85.00% 40.30%
63.33% 63.64% 33.33%
18.40% 73.47% NP
T ech prep PNO PNO PNO PNO PNO PNO NOTE: This table contains the results for students whom the state has identified as concentrators or participants (participants are only indicated by the state under the nontraditional participation core indicator) in career and technical education (CTE). See Appendix A, Table A-1 for the state’s definition of CTE concentrators and Table A-2 for the state’s definition of CTE participants. Definitions for special populations are provided in the Glossary of Terms in this report. Actual performance data above 95 percent and below 10 percent have been masked to protect student confidentiality. NE—state reported no enrollment; NP—data not provided; PNO—state reported program not offered; NA—data not applicable ADA—Americans with Disabilities Act

APPENDIX B. INDIVIDUAL STATE PERFORMANCE PROFILES, PY 2010–11 | 309
Wyoming Postsecondary Level—continued
Core indicators T echnical skill
attainment Credential,
certificate, or degree Student retention
or transfer Student
placement Nontraditional participation
Nontraditional completion
Gender
Male
Female
27.58%
29.09%
86.84%
82.08%
11.65%
14.40%
27.58% 66.24% 11.99%
29.09% 75.64% 42.56%
Race/ethnicity
American Indian or Alaska Native
Asian
Black or African American
Hispanic or Latino Native Hawaiian or Other Pacific Islander White
Two or more races
18.44%
25.00%
10.87%
26.86%
<10.00%
29.08%
NE
90.00%
>95.00%
>95.00%
>95.00%
>95.00%
82.66%
NE
35.00%
40.00%
33.33%
<10.00%
NE
12.48%
NE
18.44% 71.95% 32.64%
25.00% 91.30% 25.64%
10.87% 65.22% 30.12%
26.86% 68.36% 21.61%
<10.00% 66.67% 16.67%
29.08% 72.14% 25.73%
NE NE NE

THIS PAGE INTENTIONALLY LEFT BLANK
311
Glossary of Terms
1. Definitions of Special Populations and Other Student Categories
Below are the statutory Perkins IV definitions for each of the special populations and other student categories under the Elementary and Secondary Education Act (ESEA), the Individuals with Disabilities Education Act (IDEA), and the Americans with Disabilities Act (ADA), for which states are required to provide data.
Displaced Homemaker
The term “displaced homemaker” means an individual who—
“(A)(i) has worked primarily without remuneration to care for a home and family, and for that reason has diminished marketable skills; or
(ii) has been dependent on the income of another family member but is no longer supported by that income; or
(iii) is a parent whose youngest dependent child will become ineligible to receive assistance under Part A of Title IV of the Social Security Act (42 U.S.C. 601 et seq.) not later than two years after the date on which the parent applies for assistance under this title; and
(B) is unemployed or underemployed and is experiencing difficulty in obtaining or upgrading employment.” [Sec. 3(10) of Perkins IV]
Economically Disadvantaged
The term “economically disadvantaged” means “individuals from economically disadvantaged families, including foster children.” [Sec. 3(29)(B) of Perkins IV]
312 GLOSSARY OF TERMS
Individual With Limited English Proficiency
The term “individual with limited English proficiency” means “a secondary school student, an adult, or an out-of-school youth who has limited ability in speaking, reading, writing, or understanding the English language, and—
(A) whose native language is a language other than English; or
(B) who lives in a family or community environment in which a language other than English is the dominant language.” [Sec. 3(16) of Perkins IV]
Individual With a Disability
The term an “individual with a disability” in Sec. 3(17) of Perkins IV “(A) … means an individual with any disability (as defined in Sec. 3 of the Americans with Disabilities Act of 1990 (42 U.S.C. 12102));” and “(B) the term ‘individuals with disabilities’ means more than 1 individual with a disability.”
The term “disability” as defined in Sec. 902(b)(1) of ADA, means “with respect to an individual, (A) a physical or mental impairment that substantially limits one or more of the major life activities of such individual; (B) a record of such an impairment; or (C) being regarded as having such an impairment.”
The term “disability status” as used in Sec. 1111(h)(1)(C)(i) of ESEA refers to a “child with a disability,” which under Sec. 9101(5) of ESEA has the same meaning as the term in Sec. 602 of IDEA.
The term an “individual with a disability” as defined in Sec. 602(3)(A) of IDEA, refers to a “child with a disability,” which means a child “(i) with mental retardation, hearing impairments (including deafness), speech or language impairments, visual impairments (including blindness), serious emotional disturbance (referred to in this title as ‘emotional disturbance’), orthopedic impairments, autism, traumatic brain injury, other health impairments, or specific learning disabilities; and (ii) who, by reason thereof, needs special education and related services.” [Sec. 1111(h)(1)(C)(i) of ESEA; Sec. 602(3)(A) of IDEA; Sec. 902(b)(1) of ADA; Sec. 3(17) of Perkins IV]
Students in Nontraditional Fields
The term “students in nontraditional fields” as used in this report means students preparing for nontraditional fields. “Nontraditional fields” as defined in Sec. 3(20) of Perkins IV, means “occupations or fields of work, including careers in computer science, technology, and other current and emerging high-skill occupations, for which individuals from one gender comprise less than 25 percent of the individuals employed in each such occupation or field of work.” [Sec. 3(20) and Sec. (29)(C) of Perkins IV]

GLOSSARY OF TERMS 313
Migrant Students
The term “migrant students” means students in the migrant status category as used in Sec. 1111(h)(1)(C)(i) of ESEA. While not defined in ESEA, the Department strongly encourages states to use the same definition of “migrant students” as the state uses in its annual state report card and as approved in its “Consolidated State Application Accountability Workbook.” [Sec. 1111(h)(1)(C)(i) of ESEA]
Single Parents
The term “single parents” includes single pregnant women. [Sec. 3(29)(D) of Perkins IV]
Special Populations
The term “special populations” means “(A) individuals with disabilities; (B) individuals from economically disadvantaged families, including foster children; (C) individuals preparing for non-traditional fields; (D) single parents, including single pregnant women; (E) displaced homemakers; and (F) individuals with limited English proficiency.” [Sec. 3(29) of Perkins IV]
2. Glossary of Race/Ethnicity Categories Consistent with the Department’s Oct. 19, 2007, memorandum titled “Final Guidance on Maintaining, Collecting, and Reporting Racial and Ethnic Data” (see 72 Federal Register 59266), states were required to report data, beginning in PY 2010–11, disaggregated by race/ethnicity using the categories and definitions based on the “Revisions to the Standards for the Classification of Federal Data on Race and Ethnicity” that was issued by OMB in 1997.
• American Indian or Alaska Native—A person having origins in any of the original peoples of North and South America (including Central America) and who maintains a tribal affiliation or community attachment.
• Asian—A person having origins in any of the original peoples of the Far East, East, Southeast Asia, or the Indian subcontinent, including, for example, Cambodia, China, India, Japan, Korea, Malaysia, Pakistan, the Philippine Islands, Thailand, and Vietnam.
• Black or African American—A person having origins in any of the Black racial groups of Africa.
• Hispanic or Latino—A person of Cuban, Mexican, Puerto Rican, South or Central American, or other Spanish culture or origin.
• Native Hawaiian or Other Pacific Islander—A person having origins in any of the original peoples of Hawaii, Guam, Samoa, or other Pacific Islands.

314 GLOSSARY OF TERMS
• White—A person having origins in any of the original peoples of Europe, the Middle East, or North Africa.
• Two or More Races—A person belonging to two or more racial groups.
• Race and/or Ethnicity Unknown—A postsecondary student only who does not self-identify a race and/or ethnicity on a local information collection.

THIS PAGE INTENTIONALLY LEFT BLANK
