careers in statistical software
DESCRIPTION
Careers in Statistical Software. Cheryl Pammer Minitab Inc. [email protected]. About Me. Education BSE Mathematics, Truman State University MS Statistics, Penn State PhD Coursework, Penn State Minitab Experience (21 Years) - PowerPoint PPT PresentationTRANSCRIPT


© 2014 Minitab, Inc.
About Me
► Education• BSE Mathematics, Truman State University• MS Statistics, Penn State• PhD Coursework, Penn State
► Minitab Experience (21 Years)• Currently User Experience Designer and Technical Training Specialist• Previously Technical Support, Information Development, and Quality Assurance
► Other Experience• Biometrics Research at Merck Research Labs• Statistics Instructor at Penn State• Statistical consultant for Vespa Labs and Penn State Department of Food Science
© 2014 Minitab, Inc.
Benefits of Working in Statistical Software
► The reach of your work extends far beyond your organization► Great variety in projects► Software companies generally allow great flexibility and nice benefits► You will obtain skills transferable to other industries and jobs

© 2014 Minitab, Inc.
Statisticians at Minitab

© 2014 Minitab, Inc.
Example Problem
Problem
Customer needs to design an experiment for a process improvement project, but doesn’t know where to start.
Customer► Has a quality improvement role in financial, manufacturing, or healthcare industry► May be math-phobic. Greek letters and symbols like < can be intimidating.► Has to do a little data analysis; but will never be a data analyst.

© 2014 Minitab, Inc.
Technical Project Manager• Define problem • Understand customer• Develop solution ideas • Prototype• Obtain feedback• Repeat

© 2014 Minitab, Inc.
User Experience DesignCreate the user experience• Design inputs and outputs• Fill in all details• Deliver detailed design
document

© 2014 Minitab, Inc.
Statistical R&D
►Maintain statistical credibility► Determine statistical details
• Should we offer Plackett-Burman designs, classical 2K designs, or definitive screening designs?
• Do these designs have enough power? How many replicates should we require?• Which assumptions in the analysis are critical?• What method should we use to fit the model?

© 2014 Minitab, Inc.
Software Engineering, R&D, QA• Software Engineer:
Implement design
• Software R&D:
Optimize the algorithm
• Quality Assurance: Verify results are correct and error conditions are handled
Base design 2 factors, 4 runsReplicates 2Center points 3Total runs 11
Design Information
A
AB
B
43210
A ConcentrationB Catalyst
Factor Name
Standardized Effect
82.88% of the variation in Yield can be explained by the model.
0% 100%
R-sq = 82.88%
the factors in the model at the 0.10 level of significance.You can conclude that there is a relationship between Yield and
Pareto Chart of Standardized EffectsTerms with longer bars have more influence on Yield.
Comments
Fit Linear Model for YieldSummary Report
% of variation explained by the model
© 2014 Minitab, Inc.
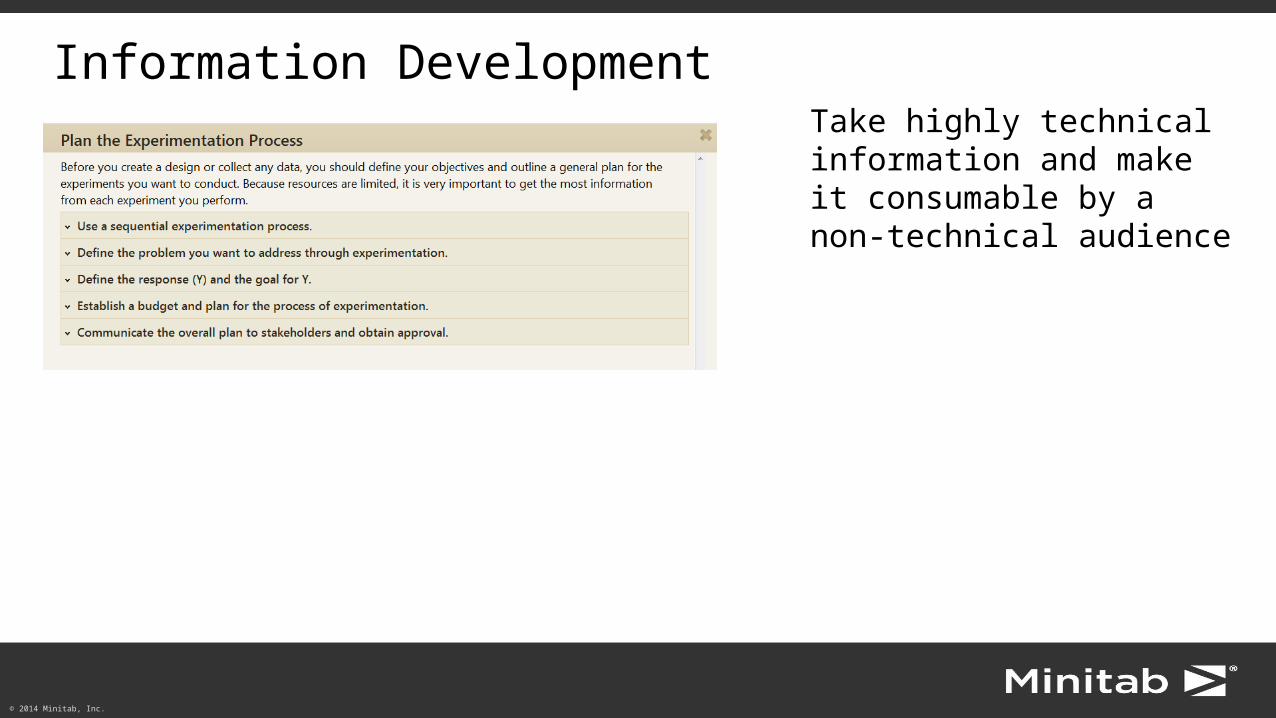
Information DevelopmentTake highly technical information and make it consumable by a non-technical audience

© 2014 Minitab, Inc.
Product Marketing• Promote products online and print• Provide webinars to get users
started with new products

© 2014 Minitab, Inc.
Technical Support
Provide phone and email support:• Why is Fit Quadratic
unavailable?• Why does this not match my
text book?• Why is alpha set at 0.1?

© 2014 Minitab, Inc.
Training and Mentoring
• Create relevant examples• Teach concepts• Analyze customer’s data

© 2014 Minitab, Inc.
Business Development and Market Research
► Develop new business► Find existing customers that are likely to be interested in new products► Create new product opportunities

© 2014 Minitab, Inc.
Skills Needed
► Solid foundation in statistics and data analysis► An interest in developing software solutions► Exceptional communication skills► Creative problem-solving ability► Strong computer skills, understanding of data sources is very helpful