career and technical education in san diego: a statistical...
TRANSCRIPT

i
Career and Technical Education in San Diego: A Statistical Analysis of
Course Availability, Students’ Course-Taking Patterns, and
Relationships with High School and Postsecondary Outcomes
Evaluation of the Outcomes of Career and Technical Education in the
San Diego CA School District
Submitted to U.S. Department of Education
by Julian R. Betts, Andrew Zau, John McAdams and Dallas Dotter
Department of Economics
and the San Diego Education Research Alliance (SanDERA at UCSD)
University of California, San Diego
9500 Gilman Drive,
La Jolla, CA 92093-0508
April 2014
Please address questions and comments to [email protected].
We are indebted to Shawn Loescher and Virginia Eves, current and former Director, College,
Career & Technical Education, (CCTE) SDUSD, Lynn McConville, Program Manager
Curriculum and Program Development, CCTE, Dr. Karen Bachofer, former Executive Director of
the Research and Evaluation Division, SDUSD, Dr. Peter Bell, Director, Research and Reporting
Department, SDUSD, Mr. Ron Rode, Director, Research and Evaluation Division, SDUSD, and
their colleagues for many helpful conversations throughout this project. We thank Michael Fong,
Jay Noell and members of the NACTE Independent Advisory Panel for helpful comments. Any
errors are the responsibility of the authors alone.

ii
Table of Contents
Summary iii
Part I – Introduction
1. Overview of Main Questions 2
2. An Overview of San Diego Unified School District and Its CTE System 6
Part II – Students’ Course-Taking Patterns
3. Patterns of Enrollment in CTE Coursework 19
4. Who Takes CTE Courses? 50
Part III – The Relation between Career and Technical Education and High
School Academic Outcomes
5. Overview of the Data and Empirical Approach 80
6. Annual Academic Progress in High School 84
7. Cumulative Measures of Overall Academic Progress While in High School 98
Part IV – The Relation between Career and Technical Education
and Postsecondary Academic Outcomes
8. Postsecondary Outcomes 123
Part V -- Conclusion
9. Conclusion and Policy Implications 167
References 172
Appendix A Additional Material Related to Students’ 174
Course-Taking Patterns
Appendix B Additional Material Related to High School 206
Academic Outcomes
Appendix C Additional Material Related to Postsecondary 218
Academic Outcomes

iii
Summary
The study examines career and technical education (CTE) in San Diego Unified
School District (SDUSD), as part of the National Assessment of Career and Technical
Education (NACTE). SDUSD is the second largest district in California and one of the
largest nationally. It is demographically quite representative of the public school
population of California as a whole.
The four overall goals of this research project were to study how schools vary in
offerings of CTE courses, who enrolls in CTE courses, the relationship between taking
CTE courses and academic outcomes in high school, and the corresponding relationship
between CTE and postsecondary educational outcomes.
CTE Course Offerings and Variations across Schools
SDUSD offers a rich and varied array of CTE coursework across its schools. We
define a CTE course as one where the course title closely matches a similar course title in
the 2007 CTE Secondary School Taxonomy. About 85 percent of CTE courses are
occupationally focused, just under 30 percent are eligible for community-college credit,
and, similar to what a national study by Bozick and Dalton (2007) has found, about 4
percent focus on primarily engineering courses often referred to as STEM (science,
technology, engineering, and math) courses, even though many of the other courses
incorporate some elements of STEM.
Variations in the total number of CTE offerings across schools are related
primarily to school size. CTE courses as a percentage of all courses offered show
moderate variations across schools. These variations matter, as students at schools with a
higher percentage of courses that are CTE are more likely to take more CTE courses.
Other aspects of schools are also associated with CTE course-taking. Students attending
charter schools that were created by converting traditional public schools had lower rates
of CTE course-taking. (We lacked the transcript data for startup charter schools to make
any conclusion about them.) Other aspects of schools that appear to matter at least to
some degree are teachers’ level of education, teacher race and the demographic makeup
of the student body.
Who Takes CTE Courses?
Average participation rates in CTE education in SDUSD closely match the rates
calculated in a recent national study by Bozick and Dalton (2007).
The National Assessment of Vocational Education (NAVE) (United States
Department of Education. 2004) created various methods of characterizing the depth of
student coursework in CTE areas. Following the NAVE terminology, this report
examines the percentage of students who participate in CTE by taking at least one year-
long course—participants; at least 3 courses in any occupational area or areas —
investors; or at least 2 or 3 courses in a single occupational area—concentrators. We
found that 38.8 percent of students have completed at least 3 CTE courses in
occupational and non-occupational areas by grade 12, thus qualifying as CTE investors.
We found that only 8.2 percent of students had become three-course CTE concentrators
by grade 12. CTE explorers, whom the NAVE identifies as students who complete three

iv
or more CTE courses but in more than one occupational area, make up the difference
between the large number of CTE investors and the relatively small number of CTE
concentrators. (Thus, 30.6%, or 38.8%-8.2%, of grade 12 students in San Diego are CTE
explorers). Some recent research has used an alternative definition of concentrators:
those who have taken at least 2 CTE courses in a given occupational cluster. We found
that 26.9 percent of students have become “two-course” concentrators.
We also examined the relation between CTE concentrators and students who
complete the New Basics – key academic coursework prescribed by the National
Commission on Excellence in Education (1983). 1 We did not find evidence that one
pattern of coursework crowds out the other. Indeed, students who complete CTE
concentrations tend to have a greater probability of having completed the New Basics.
Variations in CTE course-taking are associated with individual students’
demographics and the characteristics of their high schools. For instance, female students,
African-American and Hispanic students, special education students and English Learner
(EL) students are less likely than other students to become CTE concentrators, defined as
students who complete at least three year-long CTE courses. We found, in particular,
sharp variations between male and female students in the choice of occupational clusters.
As for academic grades measured in grade 8 and student behavior as reported on
grade 5 report cards, it is students in the “middle” of both distributions who are the most
likely to take CTE courses. Students at the bottom and top ends of the distributions for
grades and behavior take fewer CTE courses.
School characteristics are also associated with the probability that students
become CTE concentrators. For instance, variations in the percentage of courses offered
that are CTE are systematically and positively related to the proportion of students who
become CTE “concentrators”. As another example students at schools that convert to
charter school status are less likely to become CTE concentrators. (We cannot say
anything about the many “startup” charter schools in San Diego because the district does
not gather transcript data for these schools.) Demographics of the student body and of
the student’s high school math and English teachers also appear to matter to some degree.
By this we mean that higher percentages of certain student and teacher characteristics are
associated with an increased likelihood of being a CTE concentrator. These associations
are not necessarily causal.
Although variations in CTE course-taking across students do exist, 92.5 percent
of grade 12 students have taken at least some CTE-coursework, and 38.8 percent have
taken three or more CTE courses. In that sense, the choice between academic and
occupationally oriented coursework is a question of degree, not a question of “either or”.
In San Diego, career and technical education is an essential part of mainstream education.
1 National Center for Education Statistics (2008), p. 47.

v
The Relation between CTE Coursework and High School Academic Outcomes
The study pre-committed to two confirmatory analyses of annual academic
outcomes, namely, changes in math and reading achievement. In the domain of
cumulative academic outcomes, the study focused on the probability of graduating from
high school within five years of starting grade 9 as the confirmatory analysis. The study
conducts numerous exploratory analyses of related annual and cumulative high school
outcomes.
A key issue is whether we can consider regression results as conveying a causal
relation between CTE coursework and academic outcomes or merely a correlation. For
instance, if unobserved variations across students in ability or motivation or other
characteristics determine both the number of CTE courses the students take and their
academic outcomes, then CTE coursework is endogenous, and the estimated effects of
CTE coursework on outcomes could be compromised by those factors.
For annual outcomes, our main strategy for reducing endogeneity bias is to
estimate student fixed-effect models, which remove inter-student variation, and instead
identify the relation between CTE and academic outcomes by variations over years in the
CTE courses each student takes and his or her academic outcomes. Second, we also
estimate instrumental variable (IV) versions of these fixed effect models to reduce further
the endogeneity of CTE coursework. Our instrument is the percentage of all courses
offered at a high school in a given year that are CTE. Because we control for school and
year effects separately, we are in effect using within-school variations in CTE course
offerings over time, and relative from district trends, to identify the effect of CTE course-
taking on student outcomes. This instrumental variable should be unrelated to individual
characteristics.
For “once-only” academic outcomes that measure students’ cumulative academic
performance, such as the probability of graduating from high school, we cannot use
student fixed effects because there is only one observation per student. In this case we
emphasize the IV estimates because they are likely to reduce bias due to endogeneity of
CTE coursework.
For the annual variables, the instruments did not have strong explanatory power in
first-stage models of the number of CTE courses a student took, in the cases where we
modeled gains in reading and math scores. But the instruments performed well for all
other models of annual outcomes. (The main reasons why the instrument works well
except for test scores are that students are not tested in grade 12, which lowers sample
size for the test score models, and second, the instrument is particularly good at
predicting CTE course-taking in grade 12, which is outside the testing window.) Thus for
the reading and math models we focus on the fixed-effect results without IV’s; for all of
the other annual outcomes we focus on the fixed-effect results with IVs, because in those
cases the instruments had good first-stage explanatory power. For the cumulative
variables, the instruments in all cases (except for models of outcomes on the high school
exit exam) had good first-stage explanatory power and so in these models we focus on
the IV results.
Among the annual academic outcomes, our two confirmatory analyses were
changes in reading and math scores. The number of CTE courses taken had a small and

vi
marginally statistically significant negative relation with reading score changes, but no
statistically significant relation to changes in math scores. In the case of reading, a
student who took one additional (year-long) CTE course was predicted to lower changes
in reading scores by 0.004 of a standard deviation, which is a tiny effect. For instance,
for a student who was initially the median student in reading, a drop of this size would
lower his or her ranking from 500th out of 1000 to about 502nd. This effect is perhaps
best regarded as insignificantly different from zero as it is significant at only the 10%
level.
Exploratory analyses of a number of other annual academic outcomes were
conducted. In most cases the instrumental variables performed well on the relevant
samples. The instrumental variable models found no relation between CTE coursework
and absences or the probability of being promoted to the next grade. However, the
models that did not use the IV approach but still used student fixed-effects suggest that in
years in which a student took more CTE courses, absence rates fell slightly, and the
probability of being promoted rose mildly.
Models of A-G course completion were one case where the instrument did not
produce precise estimates. (“A-G” is California’s designation of specific high school
courses in designated subjects that must be completed in order for students to become
potentially eligible to attend either of the state’s public university systems.) Although
the IV model suggested no effect of CTE courses on the number of A-G courses
completed that year, the estimate is quite imprecise. The student fixed-effect model that
did not use the IV approach suggests that the number of A-G courses completed falls
very slightly, by about 0.14 course, for every CTE course taken. This may be a genuine
effect, resulting from the fact that only 7% of CTE courses taken qualify as A-G,
compared to 45% of non-CTE courses.
Both the regular models with student fixed effects and the corresponding models
that use instrumental variables suggest an increase in annual GPA for each additional
one-year CTE course taken. The effects are particularly large (0.3 grade point) in the IV
model. However this gain derives from the fact that in San Diego students tend to earn
higher grades on CTE courses than on more academic courses.
Our overall conclusion is that taking a CTE course might do minor harm to
reading achievement but the effect is only weakly significant. CTE coursework has no
effect on math test scores. As for the exploratory models of other annual outcomes, CTE
coursework is not strongly related to absences, or grade promotion, but there may be a
weak negative effect on completion of college preparatory courses.
The study also considered a number of cumulative academic outcomes, designed
to measure a student’s overall level of success while in high school. We estimated two
distinct specifications of all of the models of these cumulative degree outcomes. In the
first specification, which we emphasize below, we model outcomes as a function of the
cumulative number of CTE courses completed. In the second specification, we replaced
the cumulative number of CTE courses with an indicator for whether the person became a
three-course concentrator, defined as having completed three year-long CTE courses in a
single occupational cluster. This specification is important for two reasons. First, this
measure has been used widely in recent studies of CTE (see e.g. United States

vii
Department of Education, 2004, and Bozick and Dalton, 2007). It is important to test
whether becoming a concentrator predicts academic outcomes for students. Second, from
a statistical standpoint, modeling outcomes as a function of whether the student is a
concentrator provides a test for non-linearities in the relation between CTE course-taking
and the overall degree of success a student has in high school. That said, the total
number of courses taken in some senses provides fuller information than a simple binary
indicator for concentrator status. The additional information in the concentrator variable
that is not encapsulated in pure course counts is whether courses are clustered together
within one occupational field.
The sole confirmatory analysis in this section of the report consisted of a model of
the probability that a student graduated from high school within five years of starting
grade 9. Although models that condition only on grade 8 characteristics of students
suggest a positive relation between CTE coursework and the probability of graduation,
this is likely not a causal relation: those who were going to graduate anyway likely had
time in their grade 12 schedule to take CTE courses.
The IV version of the confirmatory model suggested that taking one additional
year-long CTE course has no effect on the probability of graduating from high school.
Our exploratory analyses of other cumulative high school outcomes, when we use
the IV method to control for the endogeneity of CTE course-taking suggested some
negative effects on the completion of the A-G courses required for students to become
eligible to attend either of California’s public university systems, but no effects of CTE
coursework on passage of the California High School Exit Exam or career GPA (overall
or for non-CTE courses). We find that concentrator status is insignificant in almost all of
these models as well.
A few notable differences among the various types of CTE courses emerged. In
the IV model for completing the New Basics curriculum, there is a negative estimated
effect from taking regular CTE courses, but taking ROP courses had no overall effect.
One potential explanation for these differences is that capstone (ROP) course takers have
higher average cumulative GPAs and a slightly higher on time graduation rate than other
students
The models of cumulative academic outcomes such as high school graduation
exhibited considerable evidence that it is important to control for endogeneity of CTE
course-taking by using instrumental variables. In the model of high school graduation,
the coefficient on CTE courses changes from positive and highly significant without the
IV approach to negative and insignificant in the model that uses the IV approach. Thus
the IV method instead suggests no causal relation. It is likely that the model that does not
use an instrument has an upward bias because empirically we find that struggling
students are likely to take fewer CTE courses. We found a highly non-linear relationship
between a student’s grade 8 GPA and the number of CTE courses taken in high school.
Students with a GPA below 2.0 (roughly a C) take considerably fewer CTE courses than
other students. Because students who are struggling to such an extent in grade 8 are
likely to fare poorly in high school, a positive but non-causal relation between the
number of CTE courses taken and high school outcomes could emerge. This finding may
viii
have broader implications for the analysis of the “effect” of taking CTE courses in other
regions of the country.
In other exploratory analyses, we tested for differences in the association between
the various outcomes and regular CTE courses, Tech Prep CTE courses (which are
eligible for community college credit) and Regional Occupational Program (ROP) CTE
courses. The latter, also known as capstone courses, are courses that under California’s
Regional Occupational Program represent the culmination of study in one of many
occupational specialties.
In the IV model for completing the New Basics curriculum, there is a negative
estimated effect from taking regular CTE courses, but taking ROP courses had no overall
effect. One potential explanation for these differences is that capstone (ROP) course
takers have higher average cumulative GPAs and a slightly higher on time graduation
rate than other students. Capstone course takers are also older and would likely have
more space in their schedule. Since CTE course are largely elective, those without space
in their schedule would not have taken those courses. We did not find big variations for
other cumulative outcomes. In the models of annual outcomes there were a few cases in
which Tech Prep or ROP courses appeared to have significantly different effects from
regular CTE courses. Usually these differential effects were small.
Overall, CTE coursework appears neither to divert students strongly away from
academic coursework, nor to motivate students dramatically to redouble their efforts on
academic coursework.
CTE Coursework and Postsecondary Outcomes
We conceptualized postsecondary outcomes as consisting of two domains:
enrollment and the level of degree that student ultimately obtain. We pre-committed to
one confirmatory analysis in the domain of postsecondary enrollment and one in the
domain of postsecondary attainment. For enrollment, the confirmatory analysis was a
model of the number of years of postsecondary enrollment in the first four years after
high school graduation. For postsecondary attainment, the confirmatory model was a
linear regression of the highest level of educational attainment.
We found a quite striking difference between the models that used and did not use
instrumental variables. The latter models, which implicitly assume that conditional upon
characteristics of students in grade 8, students do not endogenously choose how many
CTE courses to take, suggest a negative relation between taking CTE courses in high
school and postsecondary outcomes. Particularly illuminating in this regard are ordered
probit models of the highest level of postsecondary attainment, which suggest a positive
correlation between taking CTE courses in high school and the probabilities of the
highest attainment observed four years after high school graduation being “high school
graduation” or “some two-year college”, and lowered probabilities that highest
attainment would be a two-year degree, some four-year college, or a Bachelor’s degree.
In contrast, the instrumental variable model of postsecondary enrollment, which
attempts to estimate the causal effect of taking additional CTE courses, suggests that

ix
taking one additional CTE course in high school leads to an increase of 0.12 years of
postsecondary enrollment.
The IV version of our confirmatory model of the highest level of educational
attainment four years after high school graduation suggests no significant link to the
highest level of attainment.
Notably, the IV models produced far more positive results than the models that
did not take the possible endogeneity of CTE coursework into account. For both of the
outcomes listed above, models that merely controlled for student characteristics in grade
8 found significant negative associations between the number of CTE courses taken and
both years enrolled in postsecondary education and the highest level of postsecondary
attainment.
This pattern of negative conditional correlations between CTE courses taken and
a variety of measures of postsecondary outcomes, but of positive or zero relations
resulting once we instrumented for CTE coursework, also occurred for many of our
exploratory models of postsecondary enrollment and attainment. One obvious
interpretation of this pattern is that unobserved factors such as students’ interests and
motivation induce some high school students both to enroll in high school CTE courses
and to enroll less in postsecondary institutions. This likely causes the correlation
between CTE coursework and postsecondary success to be negative. The instrumental
variable approach instead uses variation from year to year in CTE course offerings at the
student’s high school to identify the causal effect of taking more CTE courses on
postsecondary outcomes. To the extent that this source of variation is not related to the
unobserved factors that endogenously determine CTE and postsecondary enrollment, we
would expect a bigger, more positive result to emerge.
Another way of thinking of the IV result is that it attempts to provide an unbiased
estimate of the causal effect of taking an additional CTE course when students are
induced to do so by a school expanding its CTE offerings. This is a question of obvious
policy relevance.
We also studied the relation between becoming a CTE concentrator and
postsecondary outcomes. Mostly due to the limited variation in the CTE concentrator
variable, the instrumental variable approach was not as effective in controlling for
endogeneity when this was our explanatory variable, unfortunately. The non-IV models
suggest no link between concentrator status and the number of years of postsecondary
education in which students enroll. As for our main attainment measure, again no
significant relationship with concentrator status emerged, although in this model some
evidence emerged of negative relations between taking any ROP or Tech Prep classes
and highest level of educational attainment.
We also subdivided CTE concentrators by cluster, and found some evidence that
cross-cutting patterns among occupational areas may be hidden by the overall findings of
little linkage between CTE concentrator status and postsecondary outcomes. For instance
three-course concentrators in Construction were significantly less likely to obtain a two-
year or four-year degree than those who did not become CTE concentrators. Because
these models do not use instrumental variables, the coefficients should be thought of as

x
conditional correlations, but they nonetheless shed light on the degree of heterogeneity in
CTE education.
Policy Implications
In 2010 the Obama administration announced a series of interventions designed to
boost college readiness, especially in underperforming high schools from which students
tend to drop out. Plans announced in March 2010 called for a College Pathways
Program designed to make college more readily accessible to all students. For instance,
the program would increase student access to college-level, dual credit, and other
accelerated courses in high-need high schools.
Plans to make college more accessible are laudable. At the same time, the focus
on college readiness, and therefore college preparatory courses, raises major questions
about the future of CTE.
For instance, in San Diego, CTE courses are only about one sixth as likely to be
recognized as college preparatory (“A-G”) as are non-CTE courses. Seen in this light, is
an emphasis on CTE coursework an impediment to college readiness?
Closely related to this issue is the seldom spoken but widely circulated stereotype
of CTE coursework as a consolation prize for those who are not likely to attend college.
If this were true, would a school or district that expanded its CTE course offerings be
responding to students’ underlying job aspirations, or merely shunting marginal students
into a track that makes a college degree all but impossible to attain?
The findings in this report provide an antidote to concerns that CTE coursework
and creating college readiness are antithetical goals. First, it is not the least academically
strong students who take the most CTE courses in high school. It is students in the
middle of the achievement distribution who invest the most in CTE coursework. Second,
the vast majority of students take at least one CTE course by the time they graduate, and
about four in ten students take at least three CTE courses by the time they graduate.
CTE coursework is not an isolated activity limited to the lowest performing
students, by any stretch of the imagination.
While it is true that relatively few CTE courses qualify as a UC ‘A-G’ course in
San Diego, taking CTE courses is only weakly negatively related to completing all of the
A-G course requirements by the end of high school. For the most part, there appear to be
few if any negative academic consequences in high school from taking CTE coursework.
But if this is true, shouldn’t it be the case that those who take CTE courses enroll
in and complete postsecondary education at similar rates as those high school students
who take fewer CTE courses? Our analyses suggest that in reality there is a negative
correlation between taking a CTE course in high school and a variety of postsecondary
outcomes. But these negative correlations are probably not causal. That is, unobserved
differences among students, perhaps related to career aspirations and motivation, may
induce this negative pattern.
Our instrumental variable models of postsecondary outcomes attempt to derive
the true causal impact of offering a greater number of CTE courses at a high school on

xi
students’ subsequent postsecondary outcomes. In these models, we can explain the
number of CTE courses students take in terms of the high school’s course offerings.
Importantly, we no longer find a negative link between CTE coursework and
postsecondary outcomes. The average effect of taking one more CTE course is about a
0.1 year increase in postsecondary attendance during the first four years after high school
graduation. The IV models also suggest no significant positive link between CTE
coursework and the level of educational attainment four years after high school
graduation, rather than a negative link.
These findings are important because they suggest that schools and districts
should not think of the provision of CTE programs as working against college readiness.
CTE coursework causes few if any observable blemishes on achievement during the high
school years, and may in fact induce some students to attend college.
Finally, our results may provide some insight into calls from the Obama
administration for strengthening links between high school and college education, for
instance through providing college credit for high school courses. Our analysis focused
on just one form of such an innovation. Tech Prep classes are CTE classes that are
sufficiently advanced to earn the student community college credit. We did not find that
students who had taken more Tech Prep classes in high school were more likely to enroll
in two-year or four-year colleges than otherwise identical students who had taken the
same number of regular CTE courses. Nor did students who took Tech Prep classes have
a higher level of educational attainment four years after high school than those who had
taken regular CTE courses. These findings do not imply that Tech Prep has no effect on
postsecondary outcomes; rather, they have the same slightly positive effect as regular
CTE courses that do not garner high school students any community college credit. This
somewhat surprising result hints that it will take a considerable amount of effort to
transform various programs that generate postsecondary credit for high school students
into a higher rate of college enrollment and completion.

1
Part I – Introduction

2
1. Overview of Main Questions
Career and technical education (CTE) refers to coursework designed to prepare students
for careers and adult life more generally. In America’s high schools, CTE courses provide
training in a rich array of occupational areas, as well as training in general labor market skills
and family and consumer sciences. This coursework prepares students not only for jobs in
numerous occupations, but also for postsecondary study in the nation’s community colleges and
four-year colleges and universities.
The U.S. Department of Education’s National Assessment of Career and Technical
Education (NACTE) calls for three detailed quantitative case studies. The case studies are being
conducted in San Diego, Philadelphia and Florida. The present study examines patterns of CTE
course-taking in the San Diego Unified School District, in San Diego, California. Part II of this
report focuses on the questions of CTE course availability, course-taking patterns, and an
analysis of who is taking CTE courses.
San Diego Unified School District (SDUSD), the second largest school district in
California and the eighth largest in the nation, enrolls about 130,000 students. The district’s
students are also very diverse, with over 60 percent eligible for the federal school lunch program,
almost 30 percent English-language learners, and about 75 percent non-white. As the second
largest district in California after Los Angeles Unified School District, SDUSD is quite
representative of the demographics of students statewide in California. 2
SDUSD has 7 middle schools and 32 high school sites that offer career and technical
education. While some offer only one or two CTE courses, others offer a wide array of courses
and programs.
The overall study that was conducted between 2007 and 2010 addresses the following set
of questions:
First, what is the overall availability of courses that are identifiable as CTE courses across the
school district? On a related note, how many students take CTE courses?
o At which kinds of schools are they available?
o Which types of courses are available? (Breakdowns include occupational versus non-
occupational and science technology, math and engineering (STEM) vs non-STEM, by
which we mean courses that are not highly dependent on new technologies and math and
science skills versus courses that involve technology, computer skills, and math and
science expertise.)
o What percentage of students at high schools takes no CTE courses; one CTE course; or
more?
o Various methods of capturing significant student investment in CTE coursework have
evolved. The U.S. Department of Education (2004) defines a CTE participator (a student
who takes at least one course), investor (a student who takes at least 3 courses),
concentrator (3 or more occupational courses in a single program area), and explorer (a
student who takes 3 or more CTE courses, but in more than one program area). Thus,
investors consist of explorers and concentrators). Most recently, Levesque et al. (2008)
2 For a comparison of the demographics of SDUSD to that of other large urban districts in California and to that of
the state as a whole, see Chapter 1 of Betts, Zau and Rice (2003).

3
and Bozick and Dalton (2007) define a concentrator as a student who takes 2 or more
CTE courses in a single occupational area during high school (see p. 17 in Bozick and
Dalton). To distinguish between the two definitions of concentrator, we refer to “two-
course” and “three-course” concentrators. We use all of these definitions, and study how
many students become concentrators (by either definition) or explorers. We also study
the percentage of students who complete a “capstone” CTE course. (Under California’s
Regional Occupational Program (ROP), capstone or ROP courses refer to CTE courses
that typically represent the culmination of study in a given CTE cluster.) We will refer to
such students as California concentrators.
o What courses allow students to receive dual credit at both the high school level and
postsecondary level?
o Based on analysis of the National Center for Education Statistic’s Education Longitudinal
Study of 2002, how does the provision of CTE in San Diego high schools compare to
high schools nationally?
Second, who enrolls in CTE courses and programs?
o What is their demographic and language background and how does it compare to students
who enroll in academic and other programs?
o What are the achievement levels and growth patterns in elementary school of those who
enroll in CTE and academic and other programs in high school?
o Who starts as well as completes a three-course CTE program of study?
o Who gets joint high school and college credit for their CTE or others courses?
o Who takes both academic and CTE programs? We operationalize the concept of
“academic” coursework by measuring whether individual students complete the New
Basics curriculum by the end of grade 12. The New Basics standards include 4 years of
English and 3 years each of mathematics, science, and social studies. (National Center
for Education Statistics, 2008, p. viii)
Third, what are the relationships between CTE course-work and high school academic
outcomes, including:
o Achievement levels and growth as measured by California state assessments
o School attendance, on-time promotion, and graduation in the standard number of years
with a regular high school diploma
o Completion of college-preparatory high school courses (A-G courses), and STEM
(science, technology, engineering, and math) courses
o Passing the California High School Exit Examination (CAHSEE)
Fourth, what are the relationships between CTE course-work and postsecondary academic
outcomes, including:
o Enrollment and years of enrollment in postsecondary education, by type of institution
o Highest degree obtained
o Probability of transferring from a two-year college to a four-year college
It is important to note that the many tables in this report that show patterns of CTE
course-taking do not necessarily imply that certain student or school characteristics cause

4
students to take more or fewer CTE courses. Rather, these associations should be interpreted as
correlational. Further, we note that many student characteristics are highly correlated with each
other, so that, for instance, a correlation between coursework patterns and race could well reflect
an underlying correlation between coursework patterns and measures of socioeconomic status,
such as parental education. In other words, collinearity exists between many of the student
characteristics. One of the later sections of this report discusses results from probit models that
simultaneously control for many personal and school characteristics. This approach can often
reveal which of the underlying student characteristics are most strongly related to CTE course-
taking patterns. But even here, because we are using observational data, the probit models do
not necessarily establish causation between specific student and school characteristics and CTE
course-taking patterns.
In order to understand what courses students take during their school careers, it is
important to be able to link students’ transcripts over time. The primary data come from
administrative records on students and teachers maintained at SDUSD. The data consist of
longitudinally linked data on each student in the district, providing details year by year of
courses taken, attendance, grades, test scores, grade promotion and whether the student dropped
out of high school or graduated. In addition, the database also includes information on the
specific math and English teachers of each high school student, and detailed qualifications of
these teachers. This longitudinally linked (or “panel”) dataset represents an extension of a
database that Betts and Zau, with various co-authors, have assembled in collaboration with
SDUSD over the last eight years.
Part II focuses on high school course-taking patterns. Chapter 2 provides an introduction
to SDUSD, its CTE system and the role that the district’s extensive system of school choice
plays in making CTE coursework accessible to students regardless of where they live within the
district. Chapter 3 studies the overall availability of CTE courses, and course-taking patterns.
Chapter 4 focuses on the question of “who takes CTE courses”, and uses both cross-tabulations
and probit analysis to study this question.
Part III considers the relation between CTE coursework and high school academic
outcomes. Chapter 5 describes the data, the statistical challenges and the solutions we adopt to
deal with them. Chapter 6 examines annual academic progress in high school through measures
such as test-score gains. Chapter 7 examines cumulative measures of overall academic progress
in high school, such as the probability of graduating or of completing the set of courses required
for eligibility to attend either of California’s public university systems.
Part IV turns the attention to postsecondary outcomes. Chapter 8 summarizes our
findings on the link between CTE enrollment and postsecondary enrollment and the highest level
of education achieved by each student.
Chapter 9, in part V, concludes and discusses policy implications.

5
Part II – Students’ Course-Taking Patterns

6
2. An Overview of San Diego Unified School District and Its CTE
System
This chapter provides an overview of how SDUSD delivers CTE courses to students.
Because roughly one out of three students in the district attends a school outside his or her local
attendance area, we also provide a brief overview of the main forms of school choice in San
Diego. Because high schools specialize to varying degrees in CTE, school choice provides an
avenue for a student to take CTE courses that are not available locally. With this introduction to
San Diego’s schools in hand, the final section of the chapter shows course offerings and how
they vary by type of school. The analysis shows how CTE course offerings vary in number and
field across high schools, both individually and when the schools are grouped into types
(traditional, magnet, charter, etc.).
First, we present a basic overview of San Diego’s schools. Schools are categorized as
elementary, middle and high schools, with the typical grade spans for these three typically being
kindergarten through grade 5, grade 6 through grade 8, and grade 9 through 12, respectively.
However, some elementary schools run through grade 6 and feed into middle schools that serve
grades 7 and 8. In the 2007-2008 school year, there were roughly 32 distinct school sites at
which high school students could enroll in the district. This includes 16 main sites for regular
public high schools, eight charter schools, and eight atypical/alternative schools. Of these eight
atypical schools, three schools offered atypical grade ranges such as K-12, three schools were
“continuation schools”, which are schools specially designed to provide instruction to students
with special needs (including special education, students with behavioral needs, and expectant
teenagers), and two schools offered quite distinct curricula. Both of these last two schools, the
San Diego Metropolitan Regional and Technical (MET) School, and the School of Creative and
Performing Arts (SCPA), offer curricula that are quite occupationally targeted.
As will be discussed in some detail in section iii of this chapter, enrollment levels vary
across these high schools. The 16 main high school sites have higher enrollment on average than
some of the other types of schools (charter, atypical/alternative and, as discussed in section iii,
magnet schools).
i) The CTE “System” in San Diego Unified
In some ways, the phrase “CTE system” is misleading, as it suggests that a district plans
its CTE course offerings in a purely centralized way managed by the district administration. The
district does indeed have an office that actively plans and coordinates CTE offerings across the
district. But our impression is that in addition to new ideas emerging from this group, in some
instances plans for new CTE offerings bubble up organically from the individual schools, based
on perceived local needs and opportunities. History and new initiatives that on the surface are
only tangentially related to CTE also play important roles in what CTE courses or subject areas
are offered.
The state Regional Occupational Program (ROP) funds some of the district’s course
offerings: ROP courses are capstone courses, passage of which signals that students have
mastered a prescribed set of skills in a given occupational cluster.
The private sector is an important partner in CTE in San Diego. Bachofer, Betts and Zau
(2010) give numerous examples of local companies that donate goods, equipment and employee

7
time to benefit CTE courses relevant to their businesses. The authors summarize outside help
from corporations and others as follows (page 32):
“It was reported that a range of industry partners – from corporations,
professional organizations (such as the Association of General Contractors and
the California Restaurant Association), medical facilities, construction companies,
colleges and universities, law enforcement, the military, local hotels and
restaurants, and even former students – spent time at schools and in classrooms
talking with students about opportunities in their respective fields, assisting with
class projects, and mentoring. Industry partners help students “find their passion”
and “understand the importance of being job ready” (CTE teacher), discover a
range of options within a given industry (Employer Outreach Specialist), “learn to
work with people” (principal), and even get jobs (counselor). One counselor
reported that “a lot of the seniors have already been hired – some even while they
are still in high school – because they have the job skills” as a result of contacts
made with industry partners.”
Bachofer and colleagues report that there are over 350 active industry partnerships in
SDUSD schools at the present time.
In San Diego, the drive to create multiple high schools on the same high school campus
has indirectly affected the delivery and offering of CTE programs in potentially important ways.
These innovations were funded in part by the small schools initiative implemented nationwide by
the Bill and Melinda Gates Foundation.
Three very large high schools with a long history of serving relatively disadvantaged
students have recently been re-designed with funding from the Gates Foundation. The schools
re-opened in fall 2004 as high school complexes, each sporting several distinct schools on the
same campus. Crawford High Educational Complex hosts four smaller high schools: the
Community Health and Medical Practices School (CHAMPS), the Invention and Design
Educational Academy (IDEA), the Law and Business School, and the Multimedia and Visual
Arts School. Kearny High Educational Complex hosts four high schools: the School of Digital
Media and Design, Science Connections and Technology, the International Business School, and
the Stanley E. Foster Construction Tech Academy (CTA). San Diego High Educational
Complex is home to six high schools: the School of Business, the School of Communication
Investigations in a Multicultural Atmosphere (CIMA), the School of International Studies, the
School of Learn, Explore, Achieve, Discover and Serve (LEADS), the School of Media, Visual
and Performing Arts, and the School of Science and Technology. As is clear from this list, many
of these new “schools within schools” have a strong CTE focus. Nonetheless, it is not
necessarily the case that the re-design of these school “complexes” has vastly increased CTE
course offerings. Each of these three high school education complexes has a long history of
operation, and in their earlier single-school-per-campus formulations they offered CTE courses
as well.
Earlier, we characterized the district as including 32 distinct high school sites, including
16 main sites. The above three high school education complexes are included in these 16 main
sites, and they in turn host 14 schools-within-schools. Thus another way of summarizing the mix
of high schools in SDUSD is that there are 43 distinct high schools in which students can enroll,

8
consisting of 27 high schools located in 16 large campuses, eight charter schools, three schools
offering atypical grade ranges such as K-12, three “continuation schools”, and two alternative
schools offering quite distinct curricula.
Some of the charter schools offer a mix of CTE courses that differ from the typical high
school offerings in San Diego. High Tech High and its younger sibling high schools, High Tech
High International and High Tech High Media Arts, offer rich project-based technical training.
The Preuss School at UCSD, a charter school that admits low-income students whose parents
have not graduated from a four-year college program, provides all students with an intensive
college preparatory curriculum. Because of its intense academic focus, the Preuss School does
not offer a large number of CTE courses. Indeed, tallies of CTE course offerings put together by
SDUSD for the 2006-2007 school year list only one CTE course in Engineering Principles at the
Preuss School, which is far below the numbers of CTE courses that other high schools offer.
However, the Preuss School offers a vibrant after-school robotics program supported by faculty
and students from the UCSD Jacobs School of Engineering. 3
ii) The School Choice System in San Diego Unified
San Diego boasts a rich and complex school choice system. School choice is relevant to
studies of CTE course offerings because if, as turns out to be the case in San Diego, schools
differ in their CTE course offerings, a student can move to (or from) a CTE-intensive school by
applying to attend a school outside his or her local attendance area.
There are four main (and five total) forms of public school choice in SDUSD. We
provide an overview here; more detailed descriptions can be found in Betts, Rice, Zau, Tang and
Koedel (2006) and Zau and Betts (2005).
In the 1977 Carlin v. Board of Education decision, the California State Supreme Court
determined that 23 San Diego schools were segregated and ordered SDUSD to develop a plan to
integrate these schools. Unlike other large cities, San Diego was allowed to pursue this goal
through the use of voluntary busing and magnet school programs.
As a result of Carlin and related court cases, San Diego implemented a broad range of
measures designed to promote integration and to provide better opportunities to non-white
students. Among these were the Voluntary Ethnic Enrollment Program (VEEP) and the
establishment of magnet schools, both of which enabled students to choose schools outside their
neighborhoods in the hopes that the resulting transfers would create a balanced racial mix in the
district’s schools.
In recent years, including the years spanned by our current CTE study, neither the VEEP
nor the magnet school program provides preferences to students of a given race or ethnicity.
However, the programs do attempt to integrate the district socioeconomically. They do this in
slightly different ways. Magnet schools accept students based on which of four clusters of
schools they would otherwise attend. Each school in the district is assigned to one of four
clusters. The clusters are sorted by racial composition, with cluster 1 having the largest
percentage of white students, and cluster 4 having the largest percentage of non-white students.
Magnet schools with a large percentage of white students first accept applications from students
3 Course count data are taken from San Diego Unified School District (2007), tab 4.

9
living in cluster 4, then 3, 2, and finally 1.4 Meanwhile, schools with a large percentage of non-
white students, such as the San Diego High Education Complex, accept applications in cluster
order 1, 2, 3, and 4. However, within clusters, applicants of all races and ethnicities are given the
same priority, and lotteries are used to decide who is admitted to oversubscribed schools.
VEEP, unlike the magnet program, limits the choices available to each student. It does
this by offering students in traditionally “VEEP-sending” schools a short list of VEEP-receiving
schools to which they can apply. (Students from traditionally receiving schools can apply to
attend a VEEP-receiving school in their list, but this seldom happens.) The district creates many
of these small VEEP “allied patterns” so as to keep the number of bus routes to a financially
manageable level. Much of the movement between sending and receiving schools is across
Interstate 8, which runs east-west through the city, dividing the northern, largely white areas
from the southern, largely minority areas. Generally speaking, achievement at schools north of
Interstate 8 has been higher on state tests. 5
The third choice program in SDUSD, the Choice program, provides any student in the
district with the opportunity to attend any school within the district’s boundaries. A state law
passed in 1993 mandates Choice statewide. In practice almost all open enrollment transfers in
San Diego occur within district, although some students living outside the district participate.
The fourth main choice program in SDUSD is a rapidly growing system of charter
schools. The number of charter high schools has varied by year. In 2007-2008 eight charter
schools served high school students.
The fifth school choice program provides busing to allow students to leave schools that
fail to meet the provisions of Adequate Yearly Progress, as outlined in the federal No Child Left
Behind law. Virtually no students participated in this program as late as 2003-2004. More
recently some students have started to participate in this type of school choice. However,
because the district initially implemented NCLB busing as an extension of VEEP busing, and
more recently added certain magnet schools to the list of NCLB receiving schools, it is fairly
accurate to claim that even in 2007-2008 that NCLB busing was mostly a special case of the
magnet and VEEP busing programs.
Figure 2.1 shows the percentage of students in SDUSD who have enrolled in non-local
schools through the various school choice programs. Overall, participation in these choice
programs rose from 24.7 percent in 2001-2002 to 27.7 percent in 2003-2004.
Section iii) of this chapter will summarize course offerings by type of school, including
types of choice programs.
4 Recently the district reduced the number of clusters from four to three. 5 In 2007-2008, there were 113 elementary schools in total in the district, of which 41 were VEEP receiving schools,
each of which received students from anywhere from one to 13 sending schools. Most receiving schools had about
four to eight sending schools in their allied pattern. Conversely, 101 elementary schools were listed by the district
as VEEP sending schools, although in many cases of schools in affluent areas and that also had high test scores no
students actually left for another school. A student’s local attendance area for elementary schools also determines
his or her local middle or high school, and the VEEP-receiving middle and high schools available to him or her.

10
iii) CTE Course Offerings Overall and by School
This section shows how CTE course offerings vary in number and field across high
schools, both individually and when the schools are grouped into types (traditional, magnet,
charter, etc.).
Table 2.1 disaggregates high schools into the following types:
i) traditional public
ii) magnet school
iii) VEEP receiving school
iv) charter school
v) continuation high school
vi) CTE-focused high school
vii) all high schools combined
The table disaggregates CTE courses into those with a focus on Science, Technology,
Engineering and Mathematics (STEM) versus non-STEM, as well as occupational versus non-
occupational courses. STEM courses are a set of courses, as defined in Appendix B of Bozick
and Dalton (2007), which focus mainly on engineering. Non-occupational courses include the
categories general labor market prep and family and consumer sciences from the Secondary
School Taxonomy (2007). CTE-focused schools are high schools which have a vocational
mission. The table shows that traditional public schools offer more CTE courses, both overall
and by STEM/non-STEM, than any of the other types of high schools. Continuation schools,
which are attended by students facing major difficulties either academically or behaviorally,
charter schools, and CTE-focused schools all tend to offer far fewer CTE courses than other
schools. This pattern applies to the counts of overall CTE courses, STEM and non-STEM
courses. In the case of charter schools, we note that the district has transcript data mainly for
those students attending charter schools that have converted from traditional public school status.
Because we are missing data for many of the startup charter schools, our results for charter
schools may not be representative of charter schools as a whole in San Diego. In total, we have
transcript data for 3 of 9 charter high schools. This is a significant limitation of the data that
readers should bear in mind.
Across all types of high schools, STEM CTE offerings are relatively rare. This finding
echoes the results of Bozick and Dalton (2007), who report, based on a nationwide sample of
high school students, that the average high school student has completed only 0.1 STEM CTE
courses by the end of grade 12.
Traditional public schools offer more occupational courses than the other school types,
similar to the pattern we observed for STEM courses.
The bottom of Table 2.1 shows p-values from tests for equality of means across the
groups in each column, and we find in each case that the hypothesis of no differences across
school types is strongly rejected.
Figures 2.2 and 2.3 show the number of CTE courses offered per school in San Diego’s
middle and high schools respectively in 2006-2007. A comparison of the figures indicates that
11
although middle schools do participate in CTE course offerings, in relative terms it is the high
schools that provide the lion’s share of CTE offerings. 6
It is useful to count the total number of courses offered per school to convey a sense of
the breadth of offerings available to individual students. But small schools offer fewer courses
across the board. This distinction is important because many of the specific types of schools
listed in Table 2.1 are much smaller than average. 7
Because larger high schools are likely to offer more CTE courses than small high
schools, Table 2.2 repeats the above analysis but instead of reporting the average number of CTE
courses presents the percentage of all courses that are CTE, overall and by type. The results are
quite different from those in Table 2.1: magnet schools, VEEP receiving schools, charters,
continuation, and CTE-focused schools now resemble traditional public schools more closely.
Further, the percentage of courses that are CTE is over 7 percentage points higher in continuation
schools than in traditional public schools. Occupational courses in particular make up a larger
percentage in continuation schools than in traditional public schools. One of the main reasons
why this table looks so different from Table 2.1 is that smaller schools offer a smaller number,
and therefore subject range, of CTE coursework, but CTE offerings tend to be offered in direct
proportion to non-CTE courses. Again, the p-values show that differences in STEM, non-
STEM, occupational, non-occupational, and overall CTE course offerings are significant.
An important implication is that students who opt for one of the above school choice
programs will not necessarily find a much different ratio of CTE courses to other courses when
they switch schools.
In Table 2.3, we ranked high schools by the percentage of students eligible for meal
assistance and then divided these schools as closely as possible into five quintiles, each
representing one fifth of student enrollment in 2006-2007. The top panel suggests that schools
serving more advantaged students tend to offer more CTE courses on average, although this
pattern does not apply to STEM CTE courses. For example, quintile 5, which consists of the
highest SES schools, offer the greatest number of CTE courses, but the lowest number of STEM
CTE courses (zero). The next panel of the table instead shows the percentage of all courses that
are CTE. From this vantage point, the differences across schools are not nearly as striking,
although again a slightly larger share of courses are CTE-based in the more advantaged SES
quintiles relative to lower quintiles. As shown by the p-values in Table 2.3, these differences are
again statistically significant. 8
6 We were curious as to what CTE courses students might be taking in middle school. Overall, during the 1998-
1999 through 2006-2007 school years, 16.6% of CTE courses taken in middle school were non-occupational (mostly
general labor market preparation), and the rest were occupational. Of the occupational CTE courses, on average
44.9% were in Computer and Information Sciences and 23.2% were in Business Support. 7 In our sample for 2006-2007, traditional public schools on average enrolled 1563 students, compared to the
following enrollments by school type: magnets (621), charters (378), continuation (380) atypical (151), and CTE-
focused schools (). 8 Chapter 4 will provide information on how CTE course-taking patterns are related to a variety of measures of
individual students’ socioeconomic status. We include the patterns by school lunch participation here as a way of
distinguishing schools by their overall demographics.
12
iv) Conclusion
SDUSD offers a rich and varied array of CTE coursework across its schools. About 85
percent of CTE courses are occupationally focused, just under 30 percent are eligible for
community-college credit, and, similar to what a national study by Bozick and Dalton (2007) has
found, about 4 percent focus on primarily engineering courses often referred to as STEM
(science, technology, engineering, and math) courses, even though many of the other courses to
incorporate some elements of STEM.
Schools vary in both the number of CTE courses offered and the percentage of courses
that are CTE. School size explains most of the variation in the number of CTE courses offered.
Schools in more affluent areas tend to offer a greater number of CTE courses, but they offer only
very slightly more CTE courses when calculated as a percentage of all courses offered. The
various school choice systems in San Diego also provide important tools for students seeking a
specific curriculum or school setting. Schools of choice such as magnet schools and charter
schools, and specialized schools including continuation schools, tend to offer fewer CTE courses
than traditional public high schools, but this almost wholly reflects the fact that these schools
have lower enrollment levels than traditional schools, and thus offer fewer courses of all types.
Differences across these school types in the percentage of courses that are CTE are relatively
minor.

13
Figure 2.1 Percentage of SDUSD Students Attending Non-Local Schools by Type of School Choice: School years 2001-2002 and 2003-2004
0.0%
5.0%
10.0%
15.0%
20.0%
25.0%
30.0%
2001-2002 2003-2004
Charters
Magnet (Non-resident)
Choice (Open Enrollment)
VEEP
Notes: VEEP is the Voluntary Ethnic Enrollment Program, which offers free busing between sending and receiving schools in “allied patterns” of schools in the district. The figure does not show students being bused under the stipulations of No Child Left Behind Act, which amounted to 0.0 percent of students in 2001-2002 and 0.2 percent of students in 2003-2004. Figure based on data in Betts, Rice, Zau, Tang and Koedel (2006).
Source: Author’s tabulations of SDUSD administrative data.

14
Figure 2.2 Percentage of Middle Schools by Number of CTE Courses Offered in 2006-2007
010
20
30
40
Perc
ent
0 1 2 3 4 5# of CTE Course Offerings
Histogram of CTE Course Offerings of Middle Schools
Source: Author’s tabulations of SDUSD administrative data.

15
Figure 2.3 Percentage of High Schools by Number of CTE Courses Offered in 2006-2007
02
46
810
Perc
ent
0 10 20 30 40 50# of CTE Course Offerings
Histogram of CTE Course Offerings of High Schools
Source: Author’s tabulations of SDUSD administrative data.

16
Table 2.1: The Average Number of CTE Courses Offered, by Type of CTE Course, and by High School Type: 2006-2007
School Type Overall STEM Non-
STEM Occupatio
-nal Non-
occupational
All High Schools 24.7 1.6 23.1 22.5 2.2
Traditional Public 28.5 1.8 26.6 26.4 2.1
Magnet 19.8 1.4 18.4 18.4 1.4
VEEP Receiving 28.2 1.6 26.6 26.3 1.9
Charter 12.3 0.4 11.9 7.8 4.5
Continuation 14.6 0.2 14.4 10.8 3.8
CTE-focused 16.4 1.0 15.4 15.5 0.9
p-value <0.001 <0.001 <0.001 <0.001 <0.001
Note: The p-values are from an F-test for equality of group means. * High schools range from grades 9-12. Some middle schools range from grades 6-8 while others range from grades 7-8. CTE-focused schools include three high schools with a career-oriented mission.

17
Table 2.2: The Average Percentage of Courses Offered in 2006-2007 that are CTE, Overall and by Type of CTE Course, and by High School Type
Note: The p-values are from an F-test for equality of group means.
School Type Overall STEM Non-
STEM Occupatio-
nal Non-
occupational
All High Schools 20.6 1.2 19.3 18.5 2.1
Traditional Public 20.5 1.3 19.2 19.1 1.5
Magnet 20.3 1.4 19.0 19.0 1.4
VEEP Receiving 20.3 1.1 19.2 19.0 1.3
Charter 18.0 0.6 17.5 11.4 6.6
Continuation 28.8 0.3 28.4 20.7 8.1
CTE-focused 21.7 1.4 20.3 20.5 1.1
p-value <0.001 <0.001 <0.001 <0.001 <0.001
* High schools range from grades 9-12. Some middle schools range from grades 6-8 while others range from grades 7-8. CTE-focused schools include three high schools with a career-oriented mission.

18
Table 2.3: The Average Number of CTE Courses Offered in 2006-2007, by Type of CTE Course, and by Socioeconomic Status (Quintile 5 = Highest SES)
SES Quintile Overall STEM Non-STEM
Average Number of CTE Course Offerings
All High Schools 24.8 1.6 23.3
1 18.1 0.7 17.4
2 24.9 3.0 22.0
3 20.5 0.7 19.8
4 31.9 3.2 28.7
5 37.1 0.0 37.1
p-value <0.001 <0.001 <0.001
Course Offerings as a Percentage of Total Offerings
All High Schools 20.4 1.2 19.2
1 20.1 1.0 19.2
2 22.1 2.3 19.7
3 17.7 0.6 17.1
4 21.5 2.0 19.4
5 23.0 0.0 23.0
p-value <0.001 <0.001 <0.001
Note: The p-values are from an F-test for equality of group means.

19
3. Patterns of Enrollment in CTE Coursework
The previous chapter provided some indications of the supply of CTE courses in San
Diego. But enrollment depends on the demand for courses in addition to the supply of courses.
That is, providing a course does not guarantee how many students will enroll. We now examine
the actual patterns in CTE course-taking in San Diego in recent years. The unit of analysis will
be students. That is, instead of reporting on the number of courses available, as in Chapter 2, we
report here on the number of courses taken by students, and variants of that measure.
i) Enrollment in Given Years or on Average across Years
This section addresses both average CTE course-taking rates and the distribution across
students of CTE course-taking.
Table 3.1 reports the percentage of students taking a given number of CTE courses for
each school year from 1998-1999 to 2008-2009. We note that some students take a course for
one half of the school year. Because a Carnegie unit is defined as a year-long course, categories
in the table are for increments of 0.5 courses. The percentage of students taking no CTE courses
is roughly stable over the sample period. There is a slight increase in the number of students
taking one year-long course, with a corresponding decrease in those taking a half-school-year
course (shown in the column titled “0.5”).. The distribution of students taking more than one
course is roughly stable, although there are some signs that the percentage of students taking two
or more year-long courses has inched up. A test of the stability of the distribution of students
across calendar years rejects handily, as seen in the low p-value.
Table 3.2 describes course-taking behavior of SDUSD students across different grade
levels, with the figures averaged over the school years 1998-1999 to 2008-2009. As expected
from the limited number of course offerings at the middle school level (seen in Figure 2.2), few
students take CTE courses before grade 9. But we see a sizable jump at grade 9 in the number of
students who have taken at least one CTE course. Thereafter, as students progress through high
school, their CTE course loads become progressively heavier. For example, while in grade 9
only five percent of students decide to take two or more year-long CTE courses, by twelfth grade
that percentage has risen to 22.6 percent (the sum of the two rightmost columns). Not
surprisingly, then, we strongly reject the hypothesis that the distribution of course-taking by
students is the same across grades.
As a way of evaluating whether some schools have a heavier CTE enrollment rate we
also show a variation of the above tables in those tables that follow. Table 3.3 looks at the
distribution over time of students attending schools with various average levels of CTE course-
taking. We see that the majority of students attend a school where the average student takes
more than zero but fewer than one year-long CTE course each year. There has been a slight
increase over the sample period in the percentage of students attending schools with an average
enrollment rate of one course or greater. From 2004-2005 and onward, about ten percent of
students attended schools with an average rate between one and two courses per year.
A second prominent feature is that over time the percentage of students attending schools
where average enrollment rates each year are less than half a year-long CTE course rose but then
fell again. In some senses, then, high schools have become less alike in their CTE enrollment
patterns over time. In nine of eleven school years, the median student has attended a school

20
where the average number of CTE courses taken per year was in the range 0.5 to 0.99. (In the
other years, 2002-2003 and 2003-2004, the median student attended a school where the average
was under 0.5.) Although this median has been quite stable, there has been a slight shift in the
distribution towards more CTE course taking over time. . The distribution of students is
significantly different across school years at well below conventional levels of significance.
Could these course taking patterns be a result of changes in CTE course offerings over
time? Table 3.4 examines these trends. Reported is the percentage of students attending a
school which offers a given number of CTE courses. For example, in the 2006-2007 school
year, about 42 percent of students attended a school which offered 26-50 courses per year, 8
percent attended a school with 1-25 courses, and less than a percentage point attended one with
zero courses. We see that the majority of schools offer more than 26 courses per year. There
appears to be a reduction over time in schools offering the most classes (76+), which falls from
over 50 percent in 1998-1999 to about 6 percent in 2008-2009. Part of the shift toward fewer
offerings is likely explained by the breakup of the Crawford High School, the Kearny High
School and the San Diego High School into 14 smaller schools, each with a very specific career
focus, but narrower CTE offerings. It is possible that budget cuts that have occurred in California
public education have also played a role.
Examining patterns across different types of schools, Table 3.5 documents that students
at magnet schools take on average slightly more CTE courses than their traditional public school
counterparts. Although charter students appear to take only a fraction of the CTE classes as their
counterparts at public and magnet schools, this may again be an artifact of our lack of data on
start-up charters in the SDUSD. In contrast, continuation and VEEP-receiving schools exhibit
CTE enrollment rates very similar to traditional public high schools. As expected, students at
CTE-focused schools take CTE at the highest rate, almost a year-long course per year. Testing
the hypothesis of equality of the average number of courses taken across different types of
schools (but excluding the “All high schools” category) rejects strongly the hypothesis of no
variations across school types.
As in Table 2.3, Table 3.6 describes CTE course prevalence according to the SES status
of the school. Here, however, the focus is on course-taking per year rather than course offerings,
and contains figures averaged over the 1998-99 to 2008-09 school years instead of just for 2006-
2007. The lowest SES schools have the highest rate of overall CTE course-taking, and the
highest SES schools likewise have the lowest rate. This result stands in stark contrast to the
patterns of CTE course offerings displayed in Table 2.3. Compared to schools serving the least
affluent students, schools serving the most affluent students offer relatively more CTE courses,
both as a percentage of all courses and especially in terms of the raw number of CTE courses,
and yet the average student at these “affluent” schools takes considerably fewer CTE courses per
year. 9
9 Although we do not show the data, there is little difference across SES groups in the pattern of STEM courses,
which anyway make up a slim portion of the overall total. Nevertheless, a hypothesis test for the equality of mean
courses taken across SES groups rejects for STEM, non-STEM, and overall CTE courses.

21
ii) Students’ Cumulative Number of CTE Courses Completed by Given Grades
Thus far, the tables have concentrated on measures of course-taking in a given year or in
an average year. It is important as well to follow the progress of individual students, counting
the cumulative number of CTE courses finished. Here, there is a subtle distinction from the
previous section in that now we count only CTE courses for which students earned passing
grades, whereas in the previous section we focused on the interest in CTE courses, and therefore
looked at enrollment alone.
When calculating cumulative courses completed, one must be aware that not all students
who start grade 9 in SDUSD graduate four years later. Some leave the district, presumably to re-
enroll elsewhere, some drop out, and a few remain in the district for four years but fail to
graduate. The last of these issues is the simplest to handle: we count cumulative courses
completed by the grade in which a student is currently enrolled. The first two issues, transfers
and dropouts, present a more difficult challenge. Because California has lacked a longitudinal
system for tracking students over time, we cannot know how many of the students who leave the
district may ultimately have dropped out. Because some students drop out or depart the district,
a table showing cumulative number of courses completed by grade 9, 10 and so on, compares
different students in different grades. Suppose for example that those who take CTE courses are
more likely to drop out. Then it is theoretically possible for the cumulative number of CTE
courses passed to fall between grade 10 and 11 because those who dropped out took more CTE
courses than did those who stayed.
In order to provide readers with a sense of how important attrition might be, we present
many of the tables below in two formats: first using all high school records of students enrolled
in SDUSD from grade 9 in 1998-1999 through 2008-2009, and second, using only the subsample
of students who start grade 9 and are still enrolled in the district four years later. (We exclude a
small number of students who arrive in the district after grade 9 because we cannot construct
their cumulative course-taking records.)
A third distinction from the prior section is that because now we are following cohorts
over time, instead of observing all who were in a given grade in any year, we instead focus on
those who were in any of the cohorts expected to graduate in spring 2002 or later. In other
words, students in grade 12 in spring 2001 or earlier are not included.
Table 3.7 shows the cumulative number of CTE courses completed by the end of each
grade. Again, we note that because a Carnegie unit is defined as a year-long course, some
students are listed as taking a course for one half of the school year. Thus additional categories
such as 0.5 courses and 1.5 courses appear in the table.
By the end of grade 9, just over half of students have yet to complete any CTE
coursework. But the pattern changes dramatically in later grades. For instance, by the end of
grade 10, roughly one third of students have yet to complete a CTE course, slightly over one
third have competed 0.5 or 1 CTE course, and just under one third have completed 1.5 or more
CTE courses. By the end of grade 12, only 7.5 percent of all students have not taken any
CTE courses. Further, almost two-thirds have completed two or more CTE courses.
As mentioned, a concern in this table and subsequent ones that show cumulative progress
by grade is that weaker students leave school, making it possible for much of the changes in CTE
course-taking across grades simply to reflect differential attrition. To guard against this,

22
Appendix A Table 1 repeats the analysis on the subsample of students for whom we have
complete transcript data from grades 9 through 12. The patterns are strikingly similar to the ones
we just presented, alleviating concerns that composition bias is driving the patterns across
grades.
Additionally, Table 3.8 highlights the enrollment patterns by grade level and year to
show how much enrollment declines as students progress in their studies. Enrollment figures are
calculated from student grade reports, which means that a student is counted only if the district
supplied us with the student’s grade report. These figures will differ from actual district-wide
enrollment since, for example, we do not have grade reports from start-up charter schools. It is
important to look carefully across rows which show declines in enrollment between grades 9-12.
The patterns are not the same across cohorts, and to some extent reflect not just changes in
enrollment but changes in availability of grade reports. 10
Table 3.9 disaggregates cumulative CTE course-taking in three separate ways: whether
the course taken is STEM, whether it qualifies for community college credit, and whether the
course taken is occupational. In light of the previous evidence on STEM, it is not surprising to
see the scarcity of STEM courses taken in the top panel. Consequently, the second panel, which
displays non-STEM CTE coursework, closely resembles the overall cumulative CTE patterns
seen previously in Table 3.7.
In the third panel of Table 3.9, we see a modest increase over the average student's high
school career in courses which quality for community college credit. Nevertheless, only about
14 percent of students manage to take two or more such courses by grade 12. The fourth panel
shows a substantial increase in the proportion of students who have taken at least some CTE
coursework which does not qualify for community college credit, from 43 percent by grade 9 to
85 percent by grade 12. Accompanying this is a sharp increase in those having taken two or
more such courses by grades 11 and 12.
The final two panels show that the cumulative number of both occupational and non-
occupational CTE courses rises substantially in grades 11 and 12, although most of the CTE
coursework involves courses in specific occupational clusters rather than the two non-
occupational clusters: family and consumer sciences education and general labor market
preparation. Later in this chapter we discuss further the various CTE course clusters.
Hypothesis tests, one for each panel, on the equality of the distribution of students across
grades yield p-values low enough to reject such equality. Again, restricting the sample to those
for which we have complete data makes little difference in the conclusions, as is seen by
comparing Table 3.9 with Appendix A Table 2.
Table 3.10 tabulates the average number of CTE courses passed by grade, where courses
are divided into STEM/non-STEM, community college credit qualifying/non-qualifying courses,
and occupational/non-occupational courses. Overall, students in San Diego Unified have taken
about one half of a CTE course by the end of ninth grade, a figure which rises to two-and-a-half
10 The biggest change occurs between 2005-2006 and 2006-2007. We have determined that the increase in the
number of grade reports is due to both an increase in overall enrollments in the district, as well as the inclusion of
students who were not previously included due to lack of transcript data. A total of 3267 unique student ID’s from
2006-2007 were not in 2005-2006. The primary source of the transcript omissions in the earlier year was the
Charter School of San Diego which contributed 1134 students in 2006-2007 for whom transcript data in the earlier
year were not available. Audeo Charter School also contributed 124 students. The remaining increase comes from
various schools within the district.

23
by graduation. Once again, it is evident that the mainly engineering-oriented courses labeled as
STEM courses do not constitute a large portion of CTE courses taken. We see sizable increases
across grades in courses both qualifying and not qualifying for college credit, with those not
qualifying for credit making up a bigger portion of overall CTE courses taken in grade 9 than in
grade 12. Not surprisingly, hypothesis tests for the equality of means across grades strongly
reject for all five measures of CTE coursework. Using only students for which complete data are
available yields very similar conclusions, as reported in Appendix A Table 3.
iii) CTE Concentrators and Investors by Given Grades
This section uses the same approach as the prior section, but instead focuses on how
many students become CTE concentrators and investors. The U.S. Department of Education
(2004) in its NAVE report defines a student as a CTE investor he or she has taken at least three
CTE courses, regardless of field. Two other definitions are that a student becomes a
concentrator when he or she has completed at least two or at least three CTE courses within a
single specific occupational cluster in the Secondary School Taxonomy (SST) as first created by
the National Assessment of Vocational Education. The NAVE report uses the three-course
definition of concentrator, and more recent work has also used the two-course definition. We
will refer to students passing these latter definitions as two-course or three-course concentrators.
CTE explorers, whom the NAVE defines as students who complete three or more CTE courses
but in more than one occupational area, are likely to be trying out career options rather than
necessarily focusing on one narrow occupational cluster. (Investors include both three-course
concentrators and explorers.)
Further, the state of California subsidizes CTE work in high schools through its Regional
Occupational Program (ROP). As part of this program, the state considers students who
complete a capstone course in a given field, commonly referred to as an ROP course, to have
become concentrators. Many but by no means all ROP courses have one or two courses as
prerequisites. Courses generally follow the 15 industry sectors used by the state of California.
These fields also mostly overlap with the SST. Examples include: Information Technology,
Education, Building Trades and Construction, Finance and Business, and Arts, Media, and
Entertainment. We refer to students who have completed an ROP course as California
concentrators.
We will present tabulations of CTE participators for four groups – investors, two- and
three-course concentrators and California concentrators. The percentage of students who
become CTE explorers can be inferred by taking the difference between the number of CTE
investors (who have taken three or more CTE courses of any type) and the number of CTE three-
course concentrators (who have taken three or more CTE courses in a single occupational
cluster). In addition we will report on the percentage of students who satisfy any of the three
definitions of concentrator that are specific to occupational cluster, that is, two- or three-course
cluster concentrators or ROP concentrators.
Table 3.11 shows the percentage of all students by grade level in the sample who become
CTE investors or CTE concentrators (based on the three definitions of the latter). As students
progress in their studies, the percentage of those who meet the definition of investor or
concentrator increases rapidly in grades 11 and 12. This is reasonable considering each year
represents an opportunity to add to the cumulative number of courses taken. The more stringent
concentrator definition of three year-long courses in one field yields a percent completion that is

24
substantially lower than that for the two-course concentrator definition by 12th grade, while the
less stringent definition of three year-long courses in any field has a higher percentage of
students by grade 12. Also, the percentage of students who are concentrators rises rapidly
between 11th grade and 12th grade. This can be adequately explained by the completion of
graduation requirements by 11th grade. Typically, students must carry a full course load from 9th
grade to 11th grade in order to complete the district’s graduation requirements. With the majority
of requirements met by grade 11, this leaves room in students’ schedule by grade 12 for
electives. The large percentage of students who become investors by taking three or more CTE
courses certainly includes students who dabbled in more than one field. Such course-taking
patterns are not necessarily cause for concern. Indeed students may take courses in different
fields in order to broaden their exposure to various fields or simply to explore career
possibilities.
The table shows that 38.8 percent of students have completed at least 3 CTE courses in
occupational and non-occupational areas by grade 12, thus qualifying as CTE investors. We
found that only 8.2 percent of students had become three-course CTE concentrators by grade 12.
CTE explorers, whom the NAVE identifies as students who complete three or more CTE courses
but in more than one occupational area, make up the difference between the large number of
CTE investors and the relatively small number of CTE concentrators (30.6%, or 38.8%-8.2%, of
grade 12 students in San Diego are CTE explorers).
Appendix A Table 4 presents the same information except that it includes only students
for whom we have complete grades 9-12 data on course taking. This table shows slightly higher
percentages of students becoming concentrators by grade 12, which is expected given that we
have a full four years of data for this subsample. Overall, the patterns are very close to what
appears in Table 3.11.
Table 3.12 lists for eight graduating classes the percentage of students who complete the
various definitions of a course concentrator. Looking at successive years of graduating classes is
useful when investigating temporal trends in course taking. Because several years are often
necessary to complete the various definitions of concentrator, a greater percentage of students
become two-course cluster concentrators than three-course cluster concentrators. Looking
specifically at the grade range from 9 to 12, the percentage of students who are concentrators,
regardless of definition used, skyrockets in grade 12, probably because by grade 12 many
students have completed course requirements for graduation and are more able to take CTE
courses.
Over time, that is, across cohorts, we can see that the percentage of students who are two-
and three-course concentrators remains level initially, but increases over the last three years. The
effect is more dramatic with ROP courses with the percentage of students completing a capstone
course increasing by 17 percent between the first and last cohort. Interestingly, the percentage of
investors -- students who complete three or more courses in any CTE field(s) -- decreases over
time, by 15.8 percentage points between the graduating classes of 2002 and 2006. The trend
then reverses with an increase in percentage by 7.9 percent between the graduating classes of
2007 and 2009. Recall that CTE explorers are those who take three or more CTE courses
without becoming a concentrator. Comparing the trends in the percentages of students who by
grade 12 are investors and those who become two-course concentrators, we see that the
difference, representing CTE explorers, falls by half across the cohorts, from about 19 percent to
10 percent in the last cohort.

25
Overall, then, students may have become less likely to take a very large number of CTE
courses, but this did not weaken their probability of becoming concentrators. Moreover, the
percentage of students completing at least one capstone ROP course rose markedly over time,
and the percentage becoming three-course concentrators rose slightly. CTE explorers, who are
defined as those who take three CTE courses in two or more fields without becoming a
concentrator, became less common in the later cohorts.
The causes of these countervailing trends are probably complex. One explanation that we
have ruled out is that the number of ROP courses offered, either in absolute terms, as a
percentage of all courses, or as a percentage of CTE courses, has risen over time. In fact, these
numbers show little change over time. We infer that across cohorts the number of students
taking three or more CTE courses in any field declined and partially recovered in more recent
cohorts, but interest in taking ROP capstone courses and to a lesser extent becoming a three-
course concentrator have increased in San Diego. 11
The popularity of CTE fields will vary regionally based on which sectors present the best
opportunity for employment. Which SST occupational clusters have proven most popular in San
Diego? Table 3.13 presents a view of which clusters have more students completing the various
definitions of a concentrator. In San Diego, when we examine the percentage of students
becoming a two-course concentrator or completing an ROP course, communications and design
appears to be the most popular cluster followed closely by business support, with about 18
percent and 15 percent of students meeting one of the cluster-specific definitions of concentrator
in each of these fields respectively. (This is shown in the rightmost column.) Other popular
fields, each of which induces 3.6 to 5.3 percent of students to become cluster or ROP
concentrators, include consumer services, culinary arts, mechanics and repair, computer and
information sciences, marketing, business management and engineering technologies. In terms
of two- and three-course cluster concentrators, communications and design is the most popular
cluster, followed by business support. It is possible that business support had many courses
which do not require prerequisites. This might explain why there are a large percentage of
capstone courses completed by students in that cluster. Appendix A Table 6 presents the same
information except that it includes only students for which we have complete data for grades 9-
12 on course taking. The results are almost the same as in the full sample shown in Table 3.13.
We have also used a slightly different version of occupational clustering, based on The
States’ Career Clusters Initiative grouping of 16 occupational clusters. The results, which are
quite similar to those in Table 3.13, appear in Table 3.14. 12 The largest clusters in this
classification system are “Arts, Audio-Video Technology, and Communications,” and Business
and Administration. These are closely linked to the two largest clusters in the classification
system we considered in Table 3.13 (namely, Communications and Design, and Business
Support, respectively).
Table 3.15 further categorizes cluster concentrators by gender. We will show in Chapter
4 that differences between the genders in CTE course completion are fairly modest, with males
taking 0.60 and females taking 0.55 courses on average per year. However, Table 3.15 shows a
11 Appendix A Table 5 shows similar patterns when we restrict the sample to those who stayed in the district from
grade 9 through the next three school years. Again, as expected, this subsample has slightly higher percentages of
students becoming concentrators. 12 Information on this alternative clustering approach appears on www.careersclusters.org.

26
striking specialization by males and females in quite distinct career clusters, along traditional
occupational lines. The cells in this table show the number of males and females completing
concentrations in each field, and underneath these raw numbers the percentages of concentrators
in a given field by gender are shown. Four areas in which females have constituted the majority
of concentrators, and which may surprise some readers, are business support, business
management, business finance, and protective services. Since it is a relatively new field in San
Diego, there were very few concentrators in protective services so the results may not be
indicative of a trend. The more intuitive result shows females constituting a majority of
concentrators in the fields of communications and design, marketing, health sciences, consumer
services, education, and library sciences.
It is useful to compare SDUSD students to those nationwide. Evidence on the latter has
been gathered by Bozick and Dalton (2007), who report on the cumulative mean number of CTE
courses taken and the cumulative percentage of students who have become CTE concentrators by
spring of the years when the cohort being studied should have been in grades 9 through 12. They
use data from the Education Longitudinal Study of 2002. Because the national sample used by
Bozick and Dalton sampled students who were in grade 10 in 2001-2002, we show results using
the corresponding “Class of 2004” from SDUSD. The following table shows their results while
presenting our own results from San Diego.
Bozick and Dalton (2007) used the three-course definition for a CTE “investor” that does
not require students to take all three in a single occupational area. They also used a sample of
students for whom they had complete transcript records from grades 9 to 12. As shown in the
top panel of Table 3.16, the authors found that the percent of students who were CTE
concentrators grew steadily as student progressed from grades 9 to 12, although most students
who ever became a concentrator did so in grade 11 or grade 12. In San Diego Unified, the
percentage of students who become concentrators by grade 12 is extraordinarily similar: 33.46
percent compared to 32.80 percent in the national sample. However, the grades by which
students became concentrators were slightly different in San Diego: students in San Diego
appear to complete relatively more of their CTE coursework in grade 12.
This pattern of San Diego students “catching up” in grade 12 is echoed to some degree by
the rows showing the mean number of CTE courses completed by the end of the given grade.
San Diego students complete slightly fewer by the end of grade 11 but slightly more by the end
of grade 12.
We note that our calculations here include all students in grade 9 in 2000-2001, and for
students who drop out or who otherwise leave the district our CTE course count stops when they
leave the district. This is as close as we can come to Bozick and Dalton’s panel approach. If we
instead restrict the sample to those who reached grade 12 in 2003-2004, the percentage becoming
concentrators by grade 12 rises by about 1.5 percent, as to be expected on this subsample. The
bottom panel of the table illustrates.
One interesting question that arises when assessing CTE course taking is the extent to
which CTE course work replaces or inhibits academic coursework. In A Nation at Risk, the
National Commission on Excellence in Education (1983) suggested a broad curriculum of 4
years of English, 3 years of math, 3 years of science, and 3 years of social studies for all
graduates of high schools. Table 3.17 shows the percentage of students in the 12th grade, by
year of graduation, who have met these criteria. Overall, the average completion rate is 75.5

27
percent with high completion rates in English and math. Some students do not meet the criterion
in science which likely contributes to the lower overall rate. Comparing results across cohorts to
the overall completion rate of 75.5 percent across all cohorts, the last four graduating cohorts
have had slightly higher than average rates of completion of the New Basics.
Table 3.18 compares students who are CTE concentrators or investors to those who meet
the New Basics recommendations. Each cell represents the percentage of students in that
particular category out of all grade 12 students. A large percentage of students complete
requirements for New Basics as well as meeting the definition of a CTE investor by completing
any 3 or more CTE courses. The table also shows that CTE concentrators by each definition are
much more likely to complete the New Basics. For instance, in the top panel, those who do not
complete 3 CTE courses make up a total of 61.2 percent of the population, and 72 percent of
these students (43.9 percent/(17.3+43.9) percent) complete the New Basics. But of the 38.9
percent of graduates who become CTE investors, more than 81 percent complete the New
Basics. There is scant evidence that CTE coursework distracts students in San Diego from
completing the New Basics.
iv) Conclusion
We find that over time the share of students taking zero CTE courses in a given year has
remained fairly constant. However, the number of CTE courses taken in the rest of the student
population has inched upward
When we instead compare CTE course-taking across grades, we find a meaningful jump
in interest in CTE coursework in grade 12, with almost three-quarters of grade 12 students in an
average year taking at least one semester of CTE courses. This compares to slightly under one
half of grade nine students who take a CTE course. One possible explanation for this pattern is
that once students complete the courses needed to obtain a high school diploma they begin to
branch out into CTE courses. An alternative, and perhaps complementary, conclusion is that
some students toward the end of high school decide to explore more vocationally oriented career
paths.
We see some minor but potentially important variations in course-taking patterns across
schools, with magnet school students taking somewhat more CTE courses than average and
charter school students, at least in the subsample of conversion charter schools in our dataset,
taking slightly fewer than average. Students in schools serving more affluent students tend to
take slightly fewer CTE courses than those in schools serving the least affluent students. This
pattern stands in stark contrast to variations across schools in CTE course offerings. (Recall
from Chapter 2 that lower SES schools tended to offer fewer CTE courses overall, and to some
extent a smaller percentage of courses that were CTE.)
When we examine cumulative course-taking patterns across students’ high school
careers, we find fairly big accelerations in grade 12 in the percentage of students qualifying as a
CTE concentrator under the various definitions, or as a CTE investor. This pattern reflects the
fact that students become increasingly interested and/or able to take CTE courses in grade 12.
Examining students’ cumulative transcripts also reveals an important finding: in San
Diego about 92 percent of grade 12 students have taken at least one semester-long CTE course
during their high school careers. The median grade 12 student has taken two year-long CTE

28
courses. These findings shatter any notion that CTE courses are narrowly aimed at a small
percentage of students who are vocationally inclined.
We find that students become CTE concentrators in most of the SST occupational
clusters. Communications and Design and Business Support are clearly the dominant fields
among concentrators. We found evidence of quite strong gender differences in which clusters
males and females completed concentrations. Traditionally male dominated fields such as
computer and information sciences, mechanics and repair, engineering, and construction
continue to attract males.
The vast majority of CTE courses taken do not fall into the category of STEM
coursework. By grade 12, about 92 percent of students have taken some non-STEM CTE
courses, but only about 8 percent have taken a STEM CTE course. When we instead divide CTE
courses into those that do and do not qualify for community college credit, we get a similar but
less dramatic pattern, with 85 percent of students having completed CTE course-work that does
not quality for community college credit, and 56 percent having completed CTE course-work
that does qualify for community college credit. A third division of CTE coursework
distinguishes between the many occupational clusters and the two non-occupational clusters
(family and consumer sciences education, and general labor market preparation). By the end of
grade 12, 90.6 percent of students have taken some occupational CTE coursework, compared to
just 36.7 percent who have completed some non-occupational CTE courses.
The total number of CTE courses completed and the percentage of students becoming
CTE investors in San Diego closely matches the data from a national sample survey, as reported
by Bozick and Dalton (2007), with the exception that students in San Diego have taken slightly
fewer CTE courses by the end of grade 11 but more CTE courses by the end of grade 12.
Finally, we examined the relation between CTE concentrators and investors and students
who complete the New Basics – key academic coursework prescribed by the National
Commission on Excellence in Education (1983). We did not find evidence that one type of
coursework crowds out the other. Indeed, students who complete CTE concentrations or who
become CTE investors tend to have a greater probability of having completed the New Basics.

29
Table 3.1: Number of CTE Occupational Courses Taken per High School Student for Each Year, Reported as Percentage of Students
Year Percentage of Students in each Category by CTE Courses per Student:
Total 0 0.5 1 1.5 2 2.5+
Average 100.0 50.7 10.6 25.4 4.1 6.6 2.6
1998-1999 100.0 44.5 16.2 25.5 5.8 5.6 2.3
1999-2000 100.0 45.5 14.9 25.0 6.1 5.9 2.7
2000-2001 100.0 50.1 12.6 24.0 5.8 5.2 2.4
2001-2002 100.0 52.3 12.0 23.0 4.9 5.4 2.3
2002-2003 100.0 56.4 10.3 22.7 3.3 5.0 2.4
2003-2004 100.0 57.4 12.2 20.8 3.2 4.6 1.8
2004-2005 100.0 51.5 7.5 26.8 3.3 7.8 3.1
2005-2006 100.0 51.9 7.4 27.5 3.0 7.6 2.5
2006-2007 100.0 51.4 8.3 25.9 3.9 7.7 2.9
2007-2008 100.0 48.6 7.0 29.4 2.9 9.2 2.9
2008-2009 100.0 50.1 8.6 27.7 2.6 7.9 3.0
p-value <0.001
Note: The p-value is from a Pearson's chi-squared test for the independence of the row and column variables (i.e., from a test that the distribution of students is the same over time).

30
Table 3.2: Number of CTE Occupational Courses Taken per Student for Each Grade from 6 through 12, Averaged over the 1998-1999 through 2008-2009 School Years, Reported as Percentage of Students
Student Grade
Percentage of Students in each Category by CTE Courses per Student:
Total 0 0.5 1 1.5 2 2.5+
Average 100.0 50.1 11.0 25.2 4.3 6.7 2.9
6 100.0 99.8 0.2 0.0 0.0 0.0 0.0
7 100.0 95.1 3.1 1.8 0.0 0.0 0.0
8 100.0 89.7 4.7 5.5 0.1 0.0 0.0
9 100.0 53.2 9.5 27.7 4.0 4.5 1.1
10 100.0 59.8 11.4 21.5 2.5 4.0 0.9
11 100.0 45.9 12.4 27.9 4.2 7.2 2.4
12 100.0 29.0 12.1 28.1 8.1 13.7 8.9
p-value <0.001
Note: The p-value is from a Pearson's chi-squared test for the independence of the row and column variables (i.e., from a test that the distribution of students is the same across grades).

31
Table 3.3: Number of CTE Occupational Courses Taken per High School Student for Each Year, Reported by Percentage of Students Attending Schools in Each Range
Year Percentage of Students in each Category by CTE Courses per Capita:
Total 0 0.01 to
0.49 0.5 to 0.99 1.0 to 1.49
1.5 to 1.99 2.0+
Average 100.0 0.3 37.9 56.2 4.6 0.9 0.1
1998-1999 100.0 0.2 29.9 69.9 0.0 0.0 0.0
1999-2000 100.0 0.1 30.4 69.5 0.0 0.0 0.0
2000-2001 100.0 0.2 35.2 59.7 4.9 0.0 0.0
2001-2002 100.0 0.0 27.7 72.3 0.0 0.0 0.0
2002-2003 100.0 0.0 52.2 47.8 0.0 0.0 0.0
2003-2004 100.0 0.2 52.5 47.3 0.0 0.0 0.0
2004-2005 100.0 0.3 43.1 46.3 6.6 2.9 0.9
2005-2006 100.0 0.3 47.1 41.4 9.7 1.5 0.0
2006-2007 100.0 0.0 46.8 41.6 9.2 2.4 0.0
2007-2008 100.0 0.1 29.3 58.7 10.5 1.4 0.0
2008-2009 100.0 2.0 27.4 60.0 8.5 2.1 0.0
p-value <0.001
Note: The p-value is from a Pearson's chi-squared test for the independence of the row and column variables (i.e., from a test that the distribution of students is the same over time).

32
Table 3.4: Number of CTE Occupational Course Offerings per School for Each Year, Reported By Percentage of Students Attending Schools in Each Range
Year Percentage of Students in each Category:
Total 0 1-25 26-50 51-75 76+
Average 100.0 0.3 10.6 29.9 34.7 24.5
1998-1999 100.0 0.2 6.8 16.9 25.6 50.6
1999-2000 100.0 0.1 14.6 22.0 4.2 59.1
2000-2001 100.0 0.2 2.5 22.7 22.3 52.5
2001-2002 100.0 0.0 7.4 18.4 42.3 31.9
2002-2003 100.0 0.0 9.7 25.3 54.8 10.1
2003-2004 100.0 0.2 6.5 35.8 37.0 20.5
2004-2005 100.0 0.3 17.5 23.9 44.1 14.3
2005-2006 100.0 0.3 15.3 34.4 43.1 6.9
2006-2007 100.0 0.0 8.4 42.0 43.4 6.1
2007-2008 100.0 0.1 11.2 40.0 42.3 6.3
2008-2009 100.0 2.0 14.8 44.7 32.9 5.7
p-value <0.001
Note: The p-value is from a Pearson's chi-squared test for the independence of the row and column variables (i.e., from a test that the distribution of students is the same over time).

33
Table 3.5: Average Number of CTE Occupational Courses Taken per Student per Year in High Schools in 2001-2002 to 2008-2009, by Type of High School
School Type Overall
All High Schools 0.6
Traditional Public 0.6
Magnet 0.7
VEEP Receiving 0.5
Charter 0.2
Continuation 0.4
CTE-focused 0.9
p-value <0.001
Note: The p-values are from an F-test for equality of group means.
Table 3.6: Average Number of CTE Occupational Courses Taken Per Student Per Year in High Schools, Averaged over School Years 1998-1999 to 2008-2009, by Socioeconomic Status of the School (Quintile 5 = Highest SES)
SES Quintile Overall
All High Schools 0.6
1 0.8
2 0.6
3 0.5
4 0.5
5 0.5
p-value <0.001
Note: The p-values are from an F-test for equality of group means.
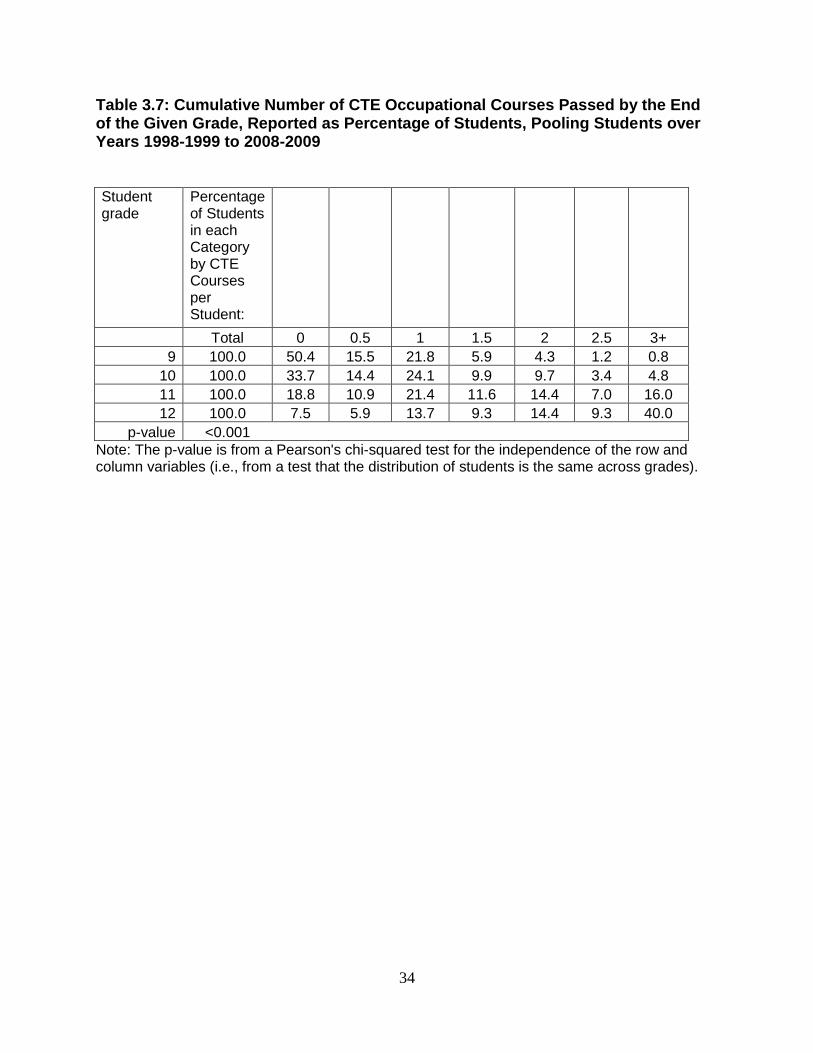
34
Table 3.7: Cumulative Number of CTE Occupational Courses Passed by the End of the Given Grade, Reported as Percentage of Students, Pooling Students over Years 1998-1999 to 2008-2009
Student grade
Percentage of Students in each Category by CTE Courses per Student:
Total 0 0.5 1 1.5 2 2.5 3+
9 100.0 50.4 15.5 21.8 5.9 4.3 1.2 0.8
10 100.0 33.7 14.4 24.1 9.9 9.7 3.4 4.8
11 100.0 18.8 10.9 21.4 11.6 14.4 7.0 16.0
12 100.0 7.5 5.9 13.7 9.3 14.4 9.3 40.0
p-value <0.001
Note: The p-value is from a Pearson's chi-squared test for the independence of the row and column variables (i.e., from a test that the distribution of students is the same across grades).
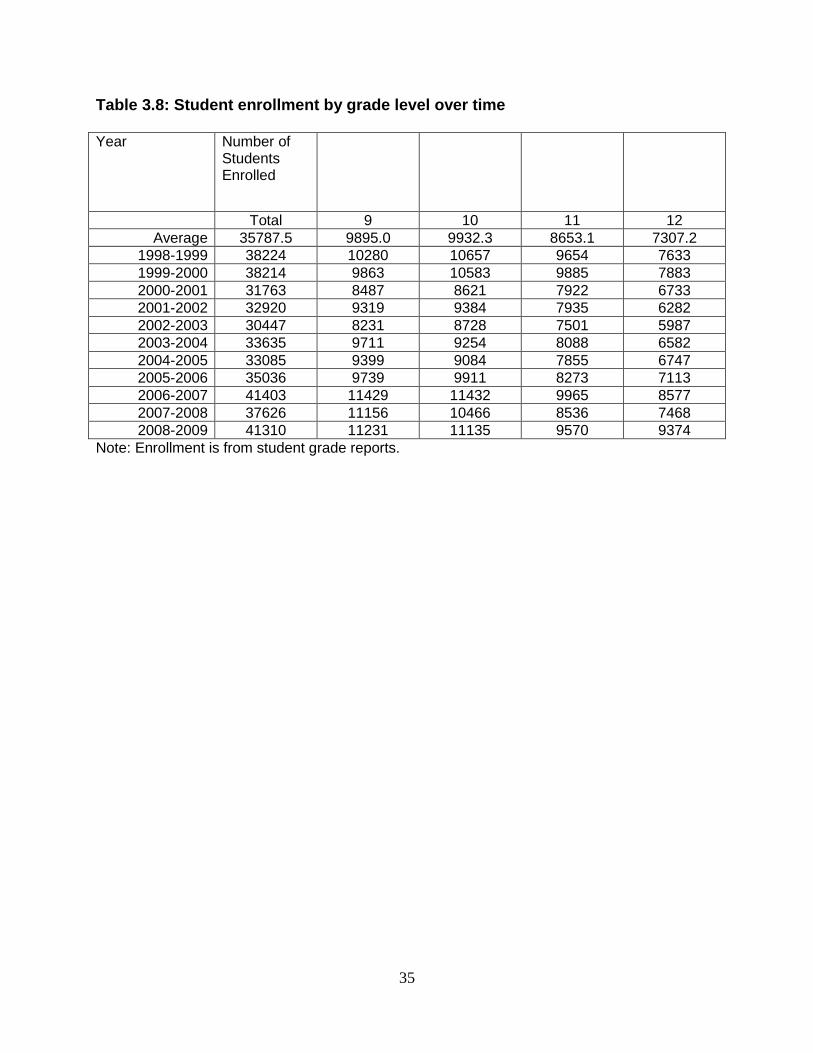
35
Table 3.8: Student enrollment by grade level over time
Year Number of Students Enrolled
Total 9 10 11 12
Average 35787.5 9895.0 9932.3 8653.1 7307.2
1998-1999 38224 10280 10657 9654 7633
1999-2000 38214 9863 10583 9885 7883
2000-2001 31763 8487 8621 7922 6733
2001-2002 32920 9319 9384 7935 6282
2002-2003 30447 8231 8728 7501 5987
2003-2004 33635 9711 9254 8088 6582
2004-2005 33085 9399 9084 7855 6747
2005-2006 35036 9739 9911 8273 7113
2006-2007 41403 11429 11432 9965 8577
2007-2008 37626 11156 10466 8536 7468
2008-2009 41310 11231 11135 9570 9374
Note: Enrollment is from student grade reports.

36
Table 3.9: Cumulative Number of CTE Occupational Courses Passed by the End of the Given Grade, Divided into STEM/non-STEM and Those Qualifying/Not Qualifying for Community College Credit, Pooling Students over Years 1998-1999 to 2008-2009 Student grade
Type of CTE Course
Percentage of Students in each Category by CTE Courses per Student:
Total 0 0.5 1 1.5 2 2.5 3+ p-value
STEM <0.001
9 100.0 97.1 1.0 1.9 0.0 0.0 0.0 0.0
10 100.0 95.2 1.6 2.8 0.1 0.2 0.0 0.0
11 100.0 93.4 1.8 3.6 0.4 0.6 0.1 0.1
12 100.0 91.8 1.9 4.4 0.5 0.9 0.2 0.4
Non-STEM <0.001
9 100.0 51.7 15.6 21.5 5.6 3.9 1.1 0.6
10 100.0 35.2 14.7 24.0 9.6 9.2 3.2 4.2
11 100.0 20.0 11.2 21.9 11.5 14.1 6.7 14.7
12 100.0 8.2 6.2 14.4 9.4 14.6 9.4 37.9
Does qualify for community college credit <0.001
9 100.0 89.0 5.3 5.6 0.1 0.1 0.0 0.0
10 100.0 78.2 9.3 10.8 0.9 0.7 0.1 0.0
11 100.0 61.8 12.0 18.0 3.1 3.7 0.6 1.0
12 100.0 44.0 13.0 22.7 5.9 7.9 2.3 4.1
Does not qualify for community college credit <0.001
9 100.0 56.3 15.4 18.6 5.0 3.3 0.9 0.5
10 100.0 41.5 15.6 22.4 8.4 6.9 2.3 2.8
11 100.0 28.0 13.5 23.0 11.0 11.5 5.0 8.0
12 100.0 14.7 9.3 19.0 11.3 14.8 8.7 22.3
Occupational <0.001
9 100.0 59.2 15.7 17.7 3.5 2.8 0.5 0.5
10 100.0 41.7 16.4 22.3 7.4 7.2 2.1 3.0
11 100.0 24.4 13.4 22.3 10.8 12.4 5.4 11.4
12 100.0 10.4 7.6 15.9 10.6 14.7 9.0 31.7
Non-occupational <0.001
9 100.0 81.9 10.9 6.3 0.7 0.3 0.0 0.0
10 100.0 75.8 13.7 8.0 1.7 0.8 0.1 0.0
11 100.0 70.2 15.8 10.0 2.6 1.2 0.2 0.1
12 100.0 63.3 17.7 12.4 3.9 2.1 0.4 0.2
Note: The p-values are from a Pearson's chi-squared test for the independence of the row and column variables (i.e., from a test that the distribution of students is the same across grades).

37
Table 3.10: Average Number of CTE Courses Passed by the End of the Given Grade, Overall and Divided into STEM/non-STEM, Those Qualifying/Not Qualifying for Community College Credit, and Occupational/Non-Occupational, Pooling Students over Years 1998-1999 to 2008-2009
Student Grade
All CTE Courses
STEM CTE Courses
Non-STEM CTE Courses
CTE Courses Qualifying for Community College Credit
CTE Courses Not Qualifying for Community College Credit
Occupat-ional CTE Courses
Non-occupational CTE Courses
9 0.5 0.0 0.5 0.1 0.4 0.4 0.1
10 0.9 0.0 0.9 0.2 0.7 0.7 0.2
11 1.5 0.1 1.4 0.4 1.1 1.3 0.2
12 2.5 0.1 2.4 0.7 1.8 2.2 0.3
p-value <0.001 <0.001 <0.001 <0.001 <0.001 <0.001 <0.001
Note: The p-values are from an F-test for equality of group means.

38
Table 3.11: Cumulative Percentage of Students Completing CTE Occupational Concentrations by Grade and Various Definitions of CTE Concentrations, 1997-1998 to 2008-2009 Student
Grade
Total Number
of Students
Percentage of
Students
Completing 3
or more CTE
courses
Percentage of
Students
Completing
One or More 2-
Course CTE
Concentrations
Percentage of
Students
Completing
One or More 3-
Course CTE
Concentrations
Percentage of
Students
Completing One
or More ROP
Capstone
Courses
Percentage of Students
Completing One or
More 2-Course CTE
Concentrations and/or
One or More ROP
Courses
9 120453 1.0 1.9 0.7 1.2 3.1
10 88618 5.3 4.5 0.3 5.4 9.3
11 65126 16.7 12.0 1.5 19.3 26.5
12 49432 38.8 26.9 8.2 44.4 53.6
Note: This table double counts students who repeat a given grade.

39
Table 3.12: A Cohort Analysis of Percentage of Students Completing CTE Cluster Concentrations by Grade and Various Definitions of CTE Concentrations
Student Grade Investors:
Percentage
of Students
Completing
Three or
more CTE
courses
Two-Course
Concentrators:
Percentage of
Students
Completing
One or More
2-Course CTE
Concentrations
Three-Course
Concentrators:
Percentage of
Students
Completing
One or More 3-
Course CTE
Concentrations
California
Concentrator:
Percentage of
Students
Completing
One or More
ROP
Capstone
Courses
Percentage of
Students
Completing
One or More
2-Course
CTE
Concentratio
ns and/or
One or More
ROP Courses
Class of 2002
9 0.7 0.9 0.0 1.0 1.8
10 5.4 4.4 0.2 4.3 8.4
11 22.2 12.8 1.2 16.8 26.1
12 48.6 29.3 7.7 34.7 49.7
Class of 2003
9 1.1 1.0 0.0 1.2 2.1
10 6.0 3.9 0.2 4.9 8.5
11 18.5 11.5 1.2 14.4 22.9
12 41.8 26.1 7.8 36.4 48.8
Class of 2004
9 1.3 1.4 0.0 1.1 2.4
10 5.5 4.0 0.1 4.6 8.3
11 16.5 10.2 0.7 15.0 22.7
12 39.9 24.8 7.5 39.7 50.5
Class of 2005
9 1.3 1.2 0.1 1.0 2.1
10 4.7 3.4 0.1 4.8 7.9
11 13.1 8.6 0.7 16.0 22.3
12 37.3 24.3 6.1 46.1 54.4
Class of 2006
9 1.5 1.0 0.0 0.9 1.8
10 4.5 3.1 0.1 4.0 6.6
11 13.2 9.7 1.0 18.3 23.9
12 32.9 24.2 7.1 44.9 51.9
Continued on next page:

40
Continued: Student
Grade
Investors:
Percentage
of Students
Completing
Three or
more CTE
courses
Two-Course
Concentrators:
Percentage of
Students
Completing
One or More
2-Course CTE
Concentrations
Three-Course
Concentrators:
Percentage of
Students
Completing
One or More
3-Course CTE
Concentrations
California
Concentrator:
Percentage of
Students
Completing
One or More
ROP
Capstone
Courses
Percentage of
Students
Completing
One or More
2-Course CTE
Concentrations
and/or One or
More ROP
Courses
Class of 2007
9 0.9 1.1 0.0 0.8 1.9
10 4.1 2.8 0.2 4.9 7.2
11 13.4 10.5 1.0 19.2 25.0
12 35.3 26.8 8.4 48.6 55.8
Class of 2008
9 1.0 2.7 0.0 1.7 4.3
10 5.7 6.0 0.1 6.5 11.7
11 17.7 14.4 1.2 21.4 30.0
12 40.1 30.5 9.7 51.3 59.2
Class of 2009
9 0.7 0.9 0.0 1.8 2.7
10 5.7 4.7 0.2 6.6 10.5
11 18.1 13.4 1.5 23.2 30.2
12 40.7 30.7 11.3 51.7 58.8
Notes: Data includes courses from 8th grade.

41
Table 3.13: Percentage of High School Students Completing CTE Courses before Leaving the District or Graduating, by SST Occupational Cluster and Various Definitions of CTE Participation, 1997-1998 to 2008-2009 SST Categories Two-Course
Concentrators:
Percentage of
Students
Completing One
or More 2-Course
CTE
Concentrations
Three-Course
Concentrators:
Percentage of
Students
Completing One
or More 3-Course
CTE
Concentrations
California
Concentrator:
Percentage of
Students
Completing One
or More ROP
Capstone Courses
Percentage of
Students
Completing
One or More
2-Course CTE
Concentrations
and/or One or
More ROP
Courses
Family and
Consumer
Sciences
Education
0.1 0.0 0.9 1.0
General Labor
Market
Preparation
1.3 0.0 1.3
Specific Labor Market Preparation (Occupational Education)
Agriculture and
Natural
Resources
None None None None
Communications
and Design
11.8 5.2 10.0 17.8
Computer and
Information
Sciences
2.4 0.6 3.2 4.6
Health Sciences 0.7 0.1 2.8 2.8
Marketing 0.9 0.1 3.5 3.6
Business
Support
5.3 1.1 13.5 15.4
Business
Management
1.0 0.2 3.6 3.6
Business
Finance
0.4 0.2 0.9 1.0
Engineering
Technologies
1.2 0.4 3.7 3.9
Architecture 0.2 0.0 0.3 0.3
Construction 1.0 0.2 0.7 1.4
Continued on next page:

42
Continued:
SST Categories
Two-Course
Concentrators:
Percentage of
Students
Completing One
or More 2-Course
CTE
Concentrations
Three-Course
Concentrators:
Percentage of
Students
Completing One
or More 3-Course
CTE
Concentrations
California
Concentrator:
Percentage of
Students
Completing One
or More ROP
Capstone Courses
Percentage of
Students
Completing
One or More
2-Course CTE
Concentrations
and/or One or
More ROP
Courses
Manufacturing 0.2 0.0 2.0 2.0
Mechanics and
Repair
1.6 0.3 3.5 4.4
Transportation 0.0 0.0
Consumer
Services
0.8 0.1 5.2 5.3
Culinary Arts 0.9 0.1 4.3 4.3
Education 0.7 0.0 1.9 1.9
Library Science 0.2 0.0 0.2
Public
Administration
None None None None
Legal Services None None None None
Protective
Services
0.0 0.3 0.3
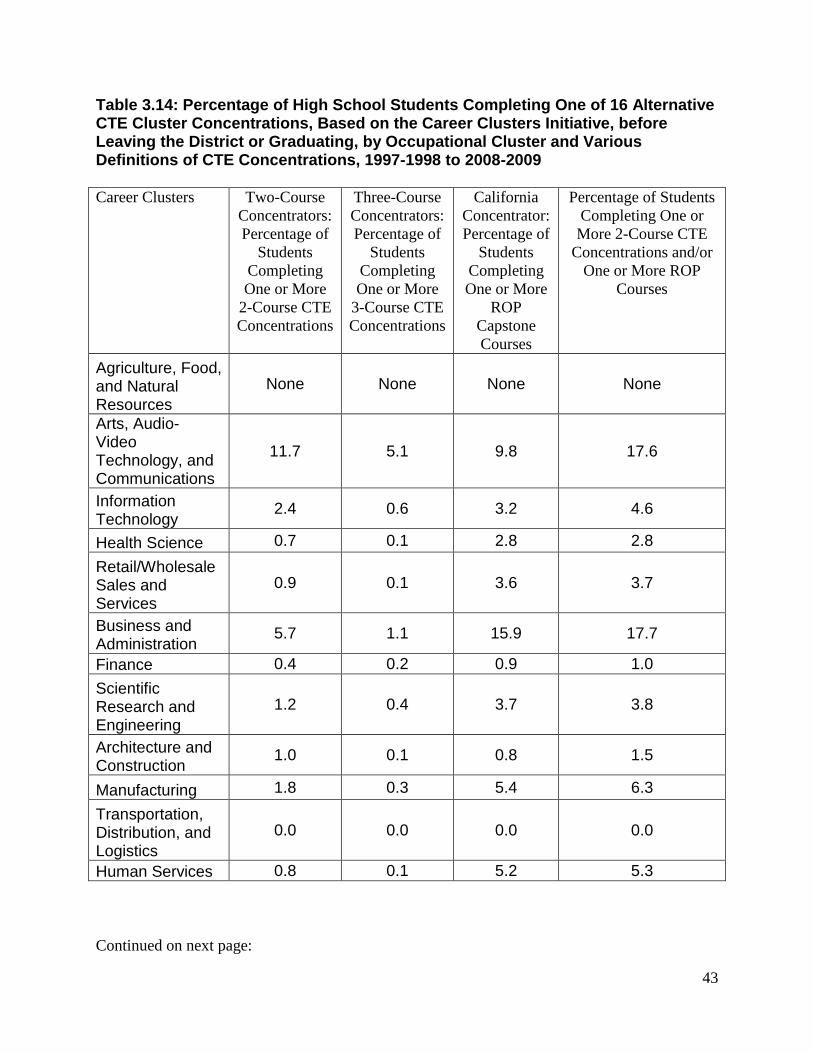
43
Table 3.14: Percentage of High School Students Completing One of 16 Alternative CTE Cluster Concentrations, Based on the Career Clusters Initiative, before Leaving the District or Graduating, by Occupational Cluster and Various Definitions of CTE Concentrations, 1997-1998 to 2008-2009 Career Clusters Two-Course
Concentrators:
Percentage of
Students
Completing
One or More
2-Course CTE
Concentrations
Three-Course
Concentrators:
Percentage of
Students
Completing
One or More
3-Course CTE
Concentrations
California
Concentrator:
Percentage of
Students
Completing
One or More
ROP
Capstone
Courses
Percentage of Students
Completing One or
More 2-Course CTE
Concentrations and/or
One or More ROP
Courses
Agriculture, Food, and Natural Resources
None None None None
Arts, Audio- Video Technology, and Communications
11.7 5.1 9.8 17.6
Information Technology
2.4 0.6 3.2 4.6
Health Science 0.7 0.1 2.8 2.8
Retail/Wholesale Sales and Services
0.9 0.1 3.6 3.7
Business and Administration
5.7 1.1 15.9 17.7
Finance 0.4 0.2 0.9 1.0
Scientific Research and Engineering
1.2 0.4 3.7 3.8
Architecture and Construction
1.0 0.1 0.8 1.5
Manufacturing 1.8 0.3 5.4 6.3
Transportation, Distribution, and Logistics
0.0 0.0 0.0 0.0
Human Services 0.8 0.1 5.2 5.3
Continued on next page:

44
Continued:
Career Clusters Two-Course
Concentrators:
Percentage of
Students
Completing
One or More
2-Course CTE
Concentrations
Three-Course
Concentrators:
Percentage of
Students
Completing
One or More
3-Course CTE
Concentrations
California
Concentrator
:
Percentage of
Students
Completing
One or More
ROP
Capstone
Courses
Percentage of Students
Completing One or
More 2-Course CTE
Concentrations and/or
One or More ROP
Courses
Hospitality and Tourism
0.9 0.1 4.4 4.4
Education and Training
0.7 0.0 1.9 1.9
Government and Public Administration
0.2 0.0 0.0 0.2
Law, Public Safety, Corrections, and Security
0.0 0.0 0.3 0.3
Note: This table uses a 16-cluster categorization downloaded from www.careercluster.org (September 2008). None refers to the absence of courses being offered for that cluster.

45
Table 3.15: Percentage of Males and Females Completing CTE Cluster Concentrations before Leaving the District or Graduating, by SST Occupational Cluster and Various Definitions of CTE Concentrations, 1997-1998 to 2008-2009
SST Occupational
Cluster
Students Completing
One or More fffCourse
CTE Concentrations
Students Completing
One or More 3-Course
CTE Concentrations
Students Completing
One or More ROP
Capstone Courses
Male/Female Male/Female Male/Female
Family and
Consumer Sciences
Education
18 (25
percent)
54 (75
percent)
2 (66.7
percent)
1 (33.3
percent)
180 (40.4
percent) 266 (59.6 percent)
General Labor
Market Preparation
284 (47.3
percent)
317 (52.7
percent)
5 (22.7
percent)
17 (77.3
percent) None
Specific Labor Market Preparation (Occupational Education)
Agriculture and
Natural Resources None None None
Communications
and Design
2351 (41.6
percent)
3302 (58.4
percent)
958 (39.1 percent)
1490 (60.9
percent)
2702 (56.7
percent)
2067 (43.3
percent)
Computer and
Information
Sciences
881 (77.4 percent)
257 (22.6 percent)
206 (76.9 percent)
62 (23.1 percent)
1150 (74.2
percent)
401 (25.8 percent)
Health Sciences 93 (26.6 percent)
257 (73.4 percent)
536 (40 percent)
805 (60 percent)
536 (39.4 percent)
826 (60.6 percent)
Marketing 181 (41 percent)
261 (59 percent)
16 (34 percent)
31 (66 percent)
610 (34.9 percent)
1137 (65.1
percent)
Business Support 1059 (40.5
percent)
1556 (59.5
percent)
188 (36.4 percent)
328 (63.57
percent)
3137 (47.3
percent)
3490 (52.7
percent)
Business
Management 198 (42.1 percent)
272 (57.9 percent)
45 (50 percent)
45 (50 percent)
767 (45.3 percent)
927 (54.7 percent)
Business Finance 71 (37.4 percent)
119 (62.6 percent)
21 (28.8 percent)
52 (71.2 percent)
177 (40 percent)
266 (60 percent)
Engineering
Technologies 486 (83.2 percent)
98 (16.8 percent)
145 (76.7 percent)
44 (23.3 percent)
1349 (76 percent)
425 (24 percent)
Architecture 69 (70
percent) 30 (30
percent) 2 (25
percent) 6 (75
percent) 100 (68 percent)
47 (32 percent)
Construction 474 (91.5 percent)
44 (8.5 percent)
93 (95.9 percent)
4 (4.1 percent)
284 (85.5 percent)
48 (14.5 percent)
Continued on next page:
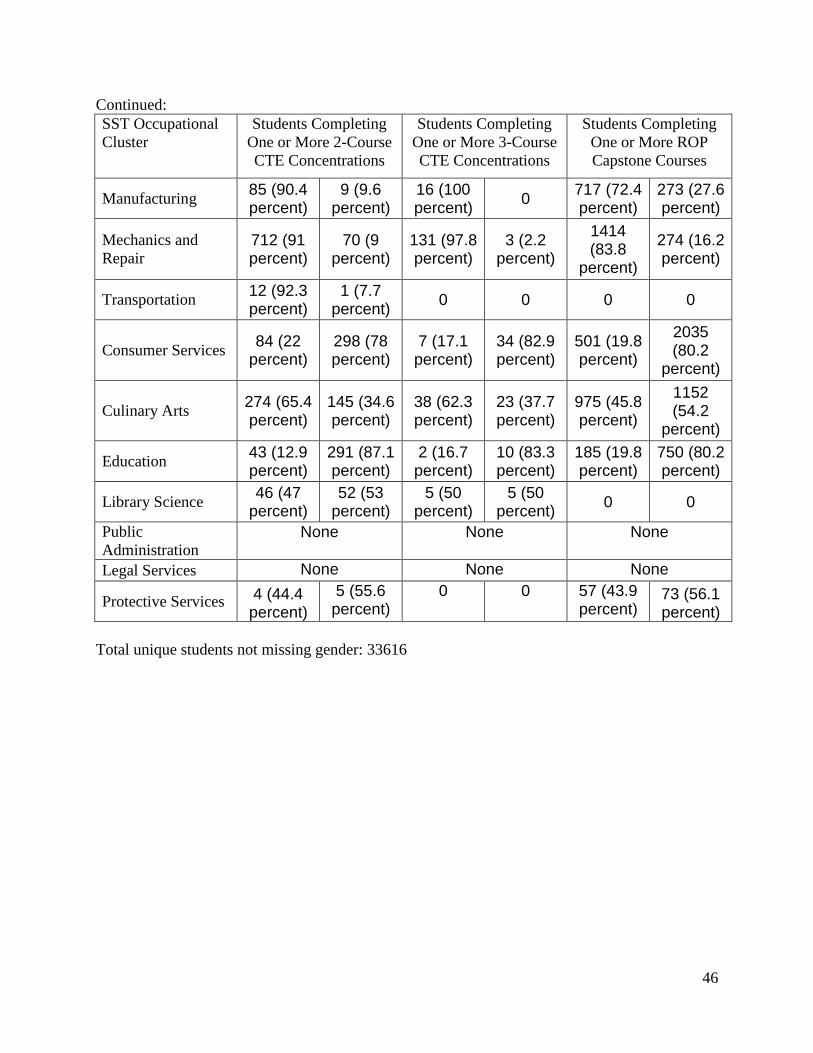
46
Continued:
SST Occupational
Cluster
Students Completing
One or More 2-Course
CTE Concentrations
Students Completing
One or More 3-Course
CTE Concentrations
Students Completing
One or More ROP
Capstone Courses
Manufacturing 85 (90.4 percent)
9 (9.6 percent)
16 (100 percent)
0 717 (72.4 percent)
273 (27.6 percent)
Mechanics and
Repair 712 (91 percent)
70 (9 percent)
131 (97.8 percent)
3 (2.2 percent)
1414 (83.8
percent)
274 (16.2 percent)
Transportation 12 (92.3 percent)
1 (7.7 percent)
0 0 0 0
Consumer Services 84 (22
percent) 298 (78 percent)
7 (17.1 percent)
34 (82.9 percent)
501 (19.8 percent)
2035 (80.2
percent)
Culinary Arts 274 (65.4 percent)
145 (34.6 percent)
38 (62.3 percent)
23 (37.7 percent)
975 (45.8 percent)
1152 (54.2
percent)
Education 43 (12.9 percent)
291 (87.1 percent)
2 (16.7 percent)
10 (83.3 percent)
185 (19.8 percent)
750 (80.2 percent)
Library Science 46 (47
percent) 52 (53
percent) 5 (50
percent) 5 (50
percent) 0 0
Public
Administration None None None
Legal Services None None None
Protective Services 4 (44.4 percent)
5 (55.6 percent)
0 0 57 (43.9 percent)
73 (56.1 percent)
Total unique students not missing gender: 33616

47
Table 3.16: Comparison of Cumulative Occupational Course-Taking Patterns by Grade between the ELS 2002 National Sample and San Diego Data Using the Sample of Grade 9 Students Expected to Graduate in the Class of 2004
Variable and sample Grade 9 Grade 10 Grade 11 Grade12
ELS 2002 National Sample
Mean Total CTE Courses 0.36 0.85 1.53 2.29
Percent CTE Investors 0.60 6.30 18.70 32.80
San Diego Students in the Class of 2004 Reaching Given Grade
Mean Total CTE Courses 0.46 0.92 1.49 2.57
Percent CTE Investors 0.25 2.91 11.94 33.46
San Diego Students in the Class of 2004 where all 4 years of data are available
Mean Total CTE Courses 0.47 0.93 1.53 2.57
Percent CTE Investors 0.43 3.12 12.78 34.99
Notes: The San Diego cohort is chosen to match the year in which students in the national ELS sample reached grade 10. We follow the NAVE definition of CTE investors that requires a student to take at least 3 CTE courses in any fields. The ELS data used by Bozick and Dalton (2007) are shown in the top panel. The second panel shows the records of all students who were in grade 9 in 2000-2001. The third panel restricts the sample to students in that cohort who remained in San Diego schools through 2003-2004.

48
Table 3.17: Percent of Graduating Grade 12 Students Completing New Basics by Year
Year N New Basics English Math Science Social Studies
2001-2002 5468 83.4 92.1 92.4 84.8 92.0
2002-2003 5287 78.7 90.8 91.2 82.2 88.3
2003-2004 5585 46.0 82.2 88.3 56.0 75.5
2004-2005 5613 66.0 93.5 89.2 70.2 90.5
2005-2006 5618 78.5 92.2 87.5 88.5 88.4
2006-2007 7229 79.5 86.1 86.2 85.3 84.3
2007-2008 6611 89.6 93.4 93.8 93.6 91.2
2008-2009 8021 78.0 83.2 85.4 84.2 81.2
Average 49432 75.5 88.9 89.0 81.2 86.2
Note: New Basics calculation is performed by taking the cumulative number of courses passed
by each student with a C or better grade in each of the 4 subject areas. In order to fulfill the
recommendations, students must complete 4 years of English, 3 years of math, 3 years of
science, and 3 years of social studies to be considered a completer of New Basics.

49
Table 3.18: Cross-tabulation of Percentage of Grade 12 Students Becoming CTE Explorers or Concentrators by Whether Students Completed New Basic Curriculum, Averaged over Classes of 2002 through 2009
Definition of CTE Concentrator:
Completed New Basics? P-value
No Yes
Investor: Completed Three or More CTE Courses
No 17.3% 43.9% <0.0001
Yes 7.2% 31.7%
Two-Course Concentrator: Completed One or More 2-Course CTE Concentrations
No 20.0% 53.1% <0.0001
Yes 4.5% 22.5%
Three-Course Concentrator: Completed One or More 3-Course CTE Concentrations
No 23.4% 68.4% <0.0001
Yes 1.1% 7.1%
California Concentrator: Completed One or More ROP Capstone Courses
No 15.5% 40.1% <0.0001
Yes 9.0% 35.4%
Combined Measure: Completed One or More 2-Course CTE Concentrations and/or One or More ROP Courses
No 13.8% 32.6% <0.0001
Yes 10.7% 42.9%
Notes: Cumulative counts in each grade include courses from 8th grade.

50
4. Who Takes CTE Courses?
This chapter uses both tabular analysis and probit models to study the characteristics of
students who take CTE coursework. The main goal is to reveal both similarities and differences
across student groups in various measures of CTE course-taking. Throughout this chapter, when
counting enrollment in courses we define a student as having taken a course if any grade is
registered on the student’s transcript, regardless of whether it is failing or passing. However
when we take cumulative counts of courses taken, such as when we calculate who becomes a
CTE concentrator, we focus on CTE courses that the student passes.
i) Course-Taking Patterns on an Annual Basis
Tables 4.1 through 4.7 consider CTE course-taking along several important dimensions
of student characteristics, including gender, ethnicity, English Learner status, parental education,
GPA in grade 8, and a measure of the student's behavioral maturity in grade 5.
Table 4.1 illustrates differences across gender. For each method of measuring CTE
course-taking or CTE concentration, the table provides in the final column the p-value from an
appropriate test for independence between gender and the given measure of CTE course-taking.
In the first rows, where we simply show the mean number of CTE courses taken per grade, the
table shows the results of a t-test for differences in means. In the rows that show the percentage
of students in multiple categories (e.g. 0, 1, 2 courses taken) we show the p-value for a chi-
squared test of independence between the student identifier (in this case, gender) and course-
taking.
Contrary to stereotypes of CTE as a male-dominated field, Table 4.1 reveals that the
difference between male and female students is small. Although hypothesis tests of equality of
group means (first row) and of cell proportions (second through eighth rows) both roundly reject
the null hypothesis in each case, the point estimates are fairly close, with males taking 0.60 and
females taking 0.55 courses on average per year. About half choose to take no CTE at all (49
percent of males and 53 percent of females), and among those taking any, the majority of either
gender takes one course or fewer per year. 13
How do ethnic groups differ in their propensity to take career and technical education?
Such cross-ethnic differences, which are highly statistically significant, are revealed in Table 4.2.
Asian students average the highest rate of course-taking at 0.63 courses per year, whereas white,
black, and “other” students all average about a tenth of a course less. Hispanic students, at 0.59
courses per year, are in the middle. The bottom panel shows that Asian students are more likely
to take one, 1.5 or two or more CTE courses than students from other groups.
Table 4.3 shows the breakdown of CTE course-taking by English Learner (EL) status.
Students classified as Fluent English Proficient (FEP) -- non-native speakers who have
demonstrated English proficiency--lead the pack in average courses per year. Native speakers
13 It should be noted that the overall mean values and proportions (appearing in the second to last column in this and
later tables) are not quite equal across tables because data on student characteristics are missing for some students.
So, for example, while the overall mean number of CTE courses taken per year appears as 0.58 in Table 4.1 (on
gender), it falls to 0.54 in Table 4.6 (on grade 8 reading test scores). This is because data on these test scores is
missing, for example, for those students who entered SDUSD in grade 9. These latecomers apparently have higher
rates of CTE participation.

51
(“Never EL”) and EL students trail FEP students by about a tenth of a course per year. The
difference in means across groups is highly statistically significant. This overall pattern is
mirrored by test scores, where studies in California often show that FEP students not only
outperform EL students, but also sometimes perform close to the levels of native English
speakers. 14 The bottom panel shows that FEP students are about four percentage points more
likely to take two or more CTE courses than students in the other two groups.
Table 4.4 highlights the relationship between parental education and CTE participation.
Our measure of parental education is the maximum of the mother's and father's highest grade of
schooling achieved. We see that higher levels of parental education are associated with lower
rates of participation. This fact is consistent with the notion of CTE as preparation more for
working after high school than for attending college, given that a parent’s level of educational
achievement tends to predict his or her child's. Those students with college- (or higher) educated
parents average 0.42 courses per year. Reducing parental education to high school or some
college is predicted to increase this rate to about 0.5 courses, while reducing it further to less
than high school adds almost two tenths of a course per year. In this table, we also show
students whose parental education is unknown. These students are particularly likely to take a
large number of CTE courses.
Table 4.5 reinforces the evidence that CTE course-taking is less prevalent among those
most likely to attend college. Students at the top of the grade distribution (as measured at the
end of grade 8), with a GPA of 3.5 to 4.0 (on a 4.0 scale), take less CTE than those in the middle
of the pack with GPAs between 2.0 to 3.5. Observing that the poorest students academically,
those with GPAs below 2.0, also take CTE at a relatively low rate adds another dimension to the
storyline. These students, who are perhaps those most likely to enter the workforce after high
school, may take fewer CTE courses because they struggle to complete their coursework needed
for graduation. The bottom panel, showing the detailed distribution of course-taking, provides a
reminder that the differences by GPA are not huge. Students in the middle, with GPA between
2.0 and 3.5, exhibit small variations in the percentage taking two or more CTE courses.
Using a different measure of academic aptitude, Table 4.6 classifies students according to
quartiles based on their reading scores on a standardized test taken in grade 8. Students in the
middle two quartiles (quartiles two and three) display the highest rates of CTE course-taking.
Those in the top quartile (four) have the lowest rate, with those in the bottom lying somewhere in
between. The differences among these groups are highly statistically significant. The lower
panel of this table suggests that even among the top-scoring students, it would be a mistake to
think that these students altogether abandon CTE coursework: about forty percent of these
students take at least some CTE coursework in a given year, compared to about half of lower-
scoring students.
Table 4.7 reports on cross-tabulations of CTE course-taking and students’ behavioral
GPA measured in grade 5. This categorization is based upon Zau and Betts (2008) who convert
elementary school teachers’ reports on a variety of student behaviors into a 0 to 4 analogy to
grade point average. Because these measures are very highly correlated, Zau and Betts take an
average of these measures. They looked at four specific behavior grades: “begins promptly,”
“follows directions,” “classroom behavior,” and “self discipline.” For each of these questions,
14 See for example Zau and Betts (2008), who show that EL students perform far worse on the California High
School Exit Examination than FEP students, who in turn perform worse than average never-EL students.

52
teachers checked the most appropriate box from a list that included the following responses:
excellent, good, satisfactory, needs improvement, and unsatisfactory. Zau and Betts translated
these into numeric grades of 4, 3, 2, 1, and 0 to correspond to the well-known academic GPA
range of 0 (F) through 4 (A). They found that this measure was highly predictive of whether
students would later fail the California High School Exit Examination in grades 10 or 12.
Table 4.7 again shows the sort of “hump-shaped” pattern of Tables 4.5 and 4.6, with
those in the middle of the distribution participating most heavily in CTE and those at the two
tails participating least. Though statistically significant, the differences among the groups are
not overwhelming in magnitude: those with the lowest behavioral GPA (below 2.0) take the
fewest CTE courses per year at 0.48, while those with GPAs 3.0 to 3.49 take 0.54 courses per
year on average.
Table 4.8 shows course-taking by special education status. Students who are in special
education take slightly fewer CTE courses per year.
ii) Cumulative Course-taking Patterns
This section examines how cumulative course-taking patterns by grade vary across
student characteristics.
Table 4.9 shows gender breakdowns of the various categories of CTE participators. In
general, gender differences are more statistically significant in the higher grades than in the
lower grades of high school. The differences by gender that do emerge are moderate in size and
somewhat complex. Females are less likely to become three-course concentrators (investors) by
grade 12, but no less likely to become two-course cluster concentrators, and indeed are more
likely than males to become three-course cluster concentrators. Conversely, males are slightly
more likely to complete one or more ROP courses by grade 12. Overall, then, female students
are slightly less likely to take three or more CTE courses, but more likely to dedicate themselves
to taking a two- or three-course sequence in a specific occupational cluster.
Table 4.10 shows that with occasional exceptions, differences emerge by race/ethnicity in
the percentage of students who become CTE concentrators by a given grade. Asians are far
more likely than other groups to take three or more CTE courses. Blacks and Hispanics are less
likely than students in other groups to become two- or three-course cluster concentrators, but
more likely to complete an ROP course.
Table 4.11 compares EL, FEP and never EL students. As shown in the previous section,
FEP students tend to take more courses than other types of students. FEP students rank either
first or occasionally second in terms of the percentage who become concentrators, based on
which definition of concentrator we use. In contrast, “never EL” and EL students lag behind
FEP students in the percentage who become concentrators, depending on the definition of
concentrator used. EL students are roughly five to ten percent less likely to take at least three
CTE courses by grade 12 than the other two groups, and they also fall into third place for the
percentage becoming two- or three course cluster concentrators.
In contrast, EL students have a higher percentage of students taking an ROP course than
students who were never EL. One interpretation of this pattern is that EL students tend to have
less time available for CTE course-work because they initially lag behind in high school courses
needed to graduate, but that they compensate by being more likely to take a single ROP course

53
later on in high school to exhibit mastery of a specific vocational skill. This notion gains support
from the very large increases in the percentage of EL (and FEP) students who complete an ROP
course in grade 12. For EL students, the percentage completing one or more ROP courses
mushrooms from 23 percent at the end of grade 11 to 51.5 percent at the end of grade 12. FEP
students show almost as large an increase. When two additional years of data are added, the
percentage of students who were never EL completing an ROP course increases from 15.5
percent to over 40 percent in grade 12.
Table 4.12 shows concentrator data by group based on parental education. No significant
differences emerge for two- or three-course concentrator percentages by grade 12, but by grade
12 students in the various parental education groups exhibit moderate but statistically significant
gaps in the percentage taking at least three CTE courses or completing an ROP course. Children
of less highly educated parents are relatively more likely to become concentrators by the ROP
definition of concentrator, while students in all but the lowest group (whose parents lacking a
high school diploma) are more likely to have completed at least 3 CTE courses than are students
whose parents have graduated with a Bachelor’s degree or attended graduate school.
Table 4.13 examines variations by student GPA. Students with GPA below 2 in general
are less likely than other students to become concentrators by any of the definitions apart from
ROP, in which case they lag slightly behind students with GPA between 2 and 2.99 but rank
above students with higher GPA. Again, one likely interpretation of this is that struggling
students find themselves focusing on taking and re-taking courses required to graduate, and
cannot easily branch out into CTE coursework in grade 12, except perhaps through ROP courses
which frequently do not have prerequisites.
Table 4.14 uses another measure of academic achievement – grade 8 reading test scores.
There are clearly variations between test score quartiles, but often they are not monotonic, and
the variations are not huge. An exception is ROP courses, where there is a strong negative
correlation with test scores: 54.5 percent of students in the bottom quartile have by grade 12
completed at least one ROP course compared to only 38.1 percent of students in the top quartile.
Variations by behavioral GPA measured when students were in grade 5 are shown in
Table 4.15. The most typical pattern is that students in the two middle behavioral groups are the
most likely to become concentrators by the various definitions. The exceptions are two- and
three-course cluster concentrators, for which the percentage of students becoming concentrators
increases steadily with behavioral GPA.
Table 4.16 shows a measure of concentrators by special education status. Special
education students make up approximately 2-5 percent of the enrollment at any school. There
are a small number of schools which are designated specifically for special ed. It is useful to
note that CTE courses are not offered at these locations. By the end of 12th grade, special ed
students are less likely to become CTE concentrators than non-special ed students. These
differences are less marked for the ROP definition of CTE concentrator, perhaps because special
ed students with CTE interests lack the scheduling flexibility to take electives, and thus gravitate
towards these capstone courses which, as we reported earlier, often lack CTE prerequisites.

54
iii) Probit Models
The above tables provide considerable detail on course availability, course-taking, and
course completion. It is useful to re-analyze course completion using probit models, so that we
can simultaneously take into account multiple explanatory factors related to students and the
schools they attend. However, the relationships uncovered by the probit analysis are not
necessarily causal, and should be viewed as associations.
In theory we could model numerous outcomes, each separately by grade: the probability
of becoming a CTE concentrator by each of the four definitions described earlier, the probability
of having completed a CTE course, the probability of having completed a STEM CTE course,
and the probability of having completed a CTE course that was eligible for community college
credit. Below we discuss results for the seven outcomes measured at grade 12 for the classes of
2002 through 200t, and measured in the grade currently attended in spring 2007 for younger
cohorts.
Finally, we will also estimate an ordered probit model of the cumulative number of CTE
courses completed (by grade 12 for the classes of 2002 through 2007 and for the grade attended
for the classes of 2008 through 2010).
All models allow for clustering by the high school attended. This allows for arbitrary
correlations between the students at a given school, or within classrooms within a school.
In explaining high school CTE outcomes, we will focus on the characteristics of students
as observed at the end of grade 8. It could be misleading to use characteristics such as EL status
and GPA observed in the higher grades as they could be endogenous outcomes that are
determined simultaneously with CTE course completion. Our main explanatory characteristics
related to students, measured in grade 8, are gender, race/ethnicity, EL or FEP status, special
education status, GPA, test scores in math and reading, and behavior GPA in grade 5 for those
students with available data. Because California changed the tests it administered to students, for
grade 8 test scores up to spring 2002 we will use the Stanford 9 scores. For spring 2003 forward,
we will use the California Standards Test (CST). These tests are quite strongly and positively
correlated with each other, but to put them on the same metric we convert each to Z-scores, by
which we mean scores that have mean zero and standard deviation one for the given grade and
school year. We also include cohort dummies, that is, for each cohort entering grade 9 in a given
year we include a separate dummy variable. These dummy variables control for, among other
things, the change in the test in spring 2003, as well as the fact that rather than being in grade 12,
students in the classes of 2008, 2009 and 2010 were in grades 11, 10 and 9 respectively in spring
2007, which is the endpoint for our data. For the math CST we also control for the type of test
taken in grade 8 (e.g. 8th grade/9th grade math test or Algebra I). We added these controls
because in the middle and high school years students within a given grade take different state
math tests, the choice of which is meant to match the math course they are currently taking.
Thus, the coefficient on math scores should be thought of as identifying the association between
CTE and students’ relative standing within a group of students who took the same math test. 15
15 We do not discuss the coefficients on the dummy variables for type of test because we have included them as
controls to standardize the meaning of test scores across tests, and because the dummies for type of math test will
have little generalizability outside of California.

55
We also include as explanatory variables summary characteristics of the high school
attended. Because students sometimes switch high schools, our measures will be averaged
across school years for each student, up to the grade level at which we are observing the CTE
outcome. These high school characteristics include the percentage of the student body by
race/ethnicity, and the percentage of the students eligible for free or reduced meals. We also
include controls for magnet schools, continuation schools and charter schools, and the average
during the grades attended of the percentage of courses offered that were CTE.
The characteristics of teachers who teach the given student math and English could
influence CTE course-taking. Thus we include the average characteristics across the high school
grades of the English and math teachers who taught the student. Our measures of teacher
characteristics include years teaching, Master’s degree, and teaching credential. We also include
controls for teacher race/ethnicity and gender.
When explanatory variables are missing for a given student, we set them to zero but then
add a dummy variable set to 1 if the given variable is missing. The coefficient on the missing
dummy variable can be interpreted as the mean value of the missing value in cases that it is
missing, times the coefficient on that variable.
Appendix A Table 7 shows means for each dependent variable and the explanatory
variables for the grade 12 probit model of whether students take three or more CTE courses (i.e.
become CTE investors). Appendix A Tables 8, 9 and 10 show results for the various other probit
models. These tables show for each explanatory variable coefficients, standard errors, and
dP/dX values, the latter of which indicates the predicted change in probability for a one unit
increase in the explanatory variable.
We focus on which variables entered significantly in the main model of the determinants
of taking three or more courses in any CTE field. We then summarize some of the most salient
differences that emerge when instead of modeling taking three or more CTE courses we focus on
the various other definitions of CTE concentrators, and models of taking STEM CTE or CTE
courses that qualify for community college credit.
Overall, the demographic variables that we have discussed above tend to enter into the
model in the ways suggested by the cross-tabulations in the foregoing section, but these variables
do not always enter in a statistically significant fashion. Appendix A Table 8 shows the results
for models of whether the student takes three or more CTE courses, and whether the student
takes any CTE courses. A general but not universal pattern is that if a variable enters the latter
model significantly it also enters the former model significantly, but many more variables enter
significantly in the former model. This makes sense because we have already seen that the large
majority of grade 12 students in the district have taken at least some CTE course-work. So in
our model of this variable there is little variation for our demographic variables to explain.
However, there is more variation in who completes three or more CTE courses, and therefore
greater opportunity for our explanatory variables to enter into the equation in a statistically
significant fashion.
Figure 4.1 shows graphically the predicted effect on the probability of taking three CTE
courses by the end of grade 12 from changing selected demographic characteristics compared to
a reference student who is white, male, not EL in grade 8, but with a GPA below 2.0 in grade 8
and a behavior GPA below 2.0 in grade 5. Holding other factors constant, females, African-
Americans and Hispanics are predicted to be 4 percent, 9 percent and 7 percent less likely to

56
become a three-course concentrator. Asians, once we control for other factors, do not differ
significantly from the omitted group, whites, which suggests that the strong Asian-white
difference we found in the simple cross-tabulations earlier in this chapter may reflect some of the
other control variables in the present model. Those who were EL in grade 8 are predicted to be 6
percent less likely to become concentrators. Students who were special education students in
grade 8 were 11 percent less likely to become concentrators. Both academic GPA and
behavioral GPA exhibit a hump-shaped pattern, with student with GPA (of either type) in the
range 3.0-3.49 predicted to have the highest probability of becoming a concentrator, and those
with a GPA of either type below 2.0 predicted to have the lowest probability. The shapes of
these patterns are very similar for academic and behavioral GPA, although changes in the former
are predicted to lead to bigger changes in the probability of becoming a CTE concentrator.
In contrast, a host of teacher qualifications are not in general related to whether the
teachers’ students became CTE concentrators. There is one major exception to this rule: the
percentage of a student’s math and English teachers who hold a Master’s degree enters positively
and significantly. A 10 percentage point increase in this variable is associated with a 1 percent
increase in the probability of a student becoming a three-course concentrator. There is also
some weak evidence that teacher race might matter, with higher percentages of teachers who are
black, Hispanic or Asian being associated with slightly greater rates of students becoming a CTE
concentrator. (White teachers serve as the comparison group.) For instance, simultaneous one
percent increases in the shares of each of these races/ethnicities among teachers taken together
are predicted to increase the probability of a student becoming a three-course concentrator by
about 1 percent. 16 The evidence shows up in a more statistically significant fashion in the model
of whether a grade 12 student has taken any CTE courses, as shown in the columns on the right
of Appendix A Table 8.
Figure 4.2 illustrates how teacher ethnicity and whether the teacher holds a Master’s
degree are predicted to affect the change in probability of becoming a CTE concentrator by
taking any 3 CTE courses. The effect size is very small compared to values in Figure 4.1. The
one negative predictor for teacher ethnicity is also not statistically significant.
These results are important because they confirm many of the patterns found in the cross-
tabulations. In other words, the persistence of these patterns in a multivariate setting lowers
concern that all of the patterns shown in the earlier cross-tabulations are simply multiple ways of
showing the same underlying relationships.
Demographic makeup of the school appears to be only weakly correlated with the
probability of completing CTE coursework after we control for the other covariates in the model.
The percentage of the student body that is Pacific Islander is negatively associated with
becoming a three-course concentrator, above and beyond the student’s own race/ethnicity: a 1
percent increase in Pacific Islanders is associated with a 8.7 percent drop in the probability that a
student becomes a concentrator. Conversely the percentage of students eligible for federal meal
assistance is positively related to students becoming CTE concentrators. Here, a 10 percent
16 The mean percentages of teachers who are black, Hispanic or Asian are 6%, 8% and 6% respectively, so an
increase of 1% in each of these does not extrapolate wildly.

57
increase in the share of students eligible for meal assistance is associated with a 6 percent
increase in the probability that the student becomes a concentrator. 17
Notably, the percentage of courses a school offers that are CTE is strongly positively
associated with the school’s students becoming three-course concentrators: a ten percentage
point increase in CTE offerings is predicted to increase the probability that a student becomes a
concentrator by 18 percent. 18
The variables capturing the type of school attended are in one case highly significant:
attending a charter school throughout high school is associated with a 69 percentage point drop
in the probability of becoming a three-course concentrator. However, as mentioned before, this
charter variable picks up outcomes at conversion charter schools rather than at startup charter
schools, because the district lacks transcript data for the latter.
Appendix A Table 9 shows probit models for whether a student has taken at least one
CTE course in the STEM area by the end of grade 12. We know from earlier tables that very
few students ever take such a course, which accounts for why most of the explanatory variables
are not statistically significant in this model. Demographic and school variables that are
statistically significant at the one percent level (and the sign of the associations) are: female
(negative), special education (negative), the mean percentage of the student body that is Pacific
Islander (positive), total school enrollment (negative), the mean percent of courses offered that
are CTE (positive) and mean years of teacher experience (negative). Notably, students in the
graduating classes of 2004, 2006 and 2007 were about 10 percent more likely to have taken a
STEM class than the comparison cohort, the class of 2002.
The next pair of columns in Appendix A Table 9 shows the probit model of whether a
grade 12 student has taken one or more CTE courses that qualify for community college credit,
which is the definition used by SDUSD of Tech Prep classes. 19 (Recall from Table 3.8 that
these courses are a minority of all CTE courses taken: by the end of grade 12 the average student
has taken 0.7 of these courses compared to 1.8 CTE courses that do not qualify for credit.) The
San Diego Unified School District’s definition of Tech Prep is CTE courses allowing students in
high school to receive college credit in one of many defined career pathways. The advantage of
the Tech Prep program is that it prepares students for post-secondary education in a specific field
and allows students to receive college credit without having to spend money on tuition. Students
17 We note that the mean percentage Pacific Islander in our sample is only 0.74%, which is why we discuss the
predicted effects of a small (1%) increase in this variable. In contrast, a 10% variation across schools in the share of
students eligible for reduced-price meals is commonplace. See Appendix A Table 7. 18 This fact could be useful in our future work on the relation between CTE coursework and academic outcomes. A
challenge in this upcoming work is that if students “endogenously” choose how many CTE courses to take, as they
surely do, then regressing academic outcomes on the number of CTE courses taken will yield biased results.
Because we have now found that the percentage of courses offered in a school that are CTE occupational courses
predicts actual CTE course-taking, this particular measure of the richness of CTE course offerings could serve as an
instrumental variable for the number of CTE courses taken by a student. Note that we also control for school
enrollment and the total number of courses offered, to guard against the possibility that the percentage of courses
that are CTE could be inadvertently proxying for school size. 19 Chapter 4 of U.S. Department of Education (2004) outlines the original goals of federal Tech Prep funding. This
NAVE study reports that although the original federal plans for Tech Prep envisioned two years of postsecondary
study to follow two years of high school study, this pattern has not been observed in many school districts
nationally. Indeed, the NAVE report also found that the most common state and local definition of Tech Prep is the
provision of a CTE course for which an articulation agreement to a local postsecondary institution has been
negotiated. This is the definition used by the San Diego Unified School District.

58
ideally would complete their education with the necessary skills to succeed in an increasingly
technical economy that demands highly skilled workers. Tech Prep is not without its challenges.
School districts need to make sure their students are aware of the availability of Tech Prep and
also that the students follow up on their courses to ensure they receive community college credit.
The patterns here loosely resemble those in our main model of whether students take at
least three CTE courses, but there are some important deviations. Asian students are more likely
to take one of these courses than are white students, and African-American students are equally
likely as whites to take one of these courses. These patterns contrast with our earlier results on
three-course concentrators, where whites and Asians were on par and more likely than other
groups to become concentrators. Another difference from the concentrator model is that
students’ EL status and academic and behavior GPA do not strongly predict whether a student
completes a course eligible for community college credit. The exception to these “zero” results
is that students with a grade 8 GPA in the 2.0-2.99 range were two percent more likely to
complete one of these courses compared to students with a GPA below 2. As for the
concentrator model, higher math scores are again associated with lower probability of taking
CTE courses. But in addition those with higher reading scores in grade 8 were less likely to
complete a course eligible for community college credit. Two types of schools, charters and
atypical schools, are associated with sharply reduced probabilities of completing a Tech Prep
class. Other results related to demographics of the student body and qualifications of teachers
mirror the results for three-course concentrators quite closely.
The final column of Appendix A Table 9 shows the results from an ordered probit model
that treats the number of CTE courses taken as an ordinal variable. The results are very similar
in pattern to those we have earlier highlighted for three-course concentrators.
Appendix A Table 10 shows probit models of four alternative definitions of CTE
concentrator: including models of two- and three-course cluster concentrators, of whether the
student takes at least one ROP capstone course, thereby becoming a California concentrator, and
our composite measure of whether a student took at least two courses in an occupational cluster
or at least one capstone course. Here we summarize the main differences between these models
and the model of three-course concentrators highlighted in Figures 4.1 and 4.2 and Appendix A
Table 8. Results on variables capturing student demographic characteristics and academic
achievement in models of these alternative definitions of concentrators are quite similar to results
for the three-course concentrator model, although some of the results in these models are not as
statistically significant. For example, in these new models the coefficient on female students is
usually negative but never becomes significant. An exception is that female students are more
likely to become three-course concentrators, according the probit model. But this difference,
although in line with the cross-tabulation in Table 4.9, is not statistically significant.
The eighth grade reading score, which enters positively but insignificantly in our main
model, enters positively and significantly in the models of two-course and three-course
concentrators. Notably, this same reading score enters negatively in the model of whether the
student completes at least one capstone course or one CTE course of any kind. These results
match the cross-tabulations fairly well. They suggest that weaker students, at least in terms of
reading proficiency, are more likely to take some CTE course-work and a capstone course, but
less likely to have the persistence (or the scheduling freedom) to take enough courses to become
a CTE concentrator.

59
Results for school type and teacher background variables are broadly similar to the earlier
results in these alternative models, although the percentage of a student’s teachers who hold a
Master’s degree does not enter significantly in the two- or three-course concentrator models.
It is worthwhile to focus more specifically on the model of whether a student takes a
capstone (ROP) course by grade 12, because Table 4.14 showed a very strong negative relation
between test scores in grade 8 and whether students took a capstone course. This result survives
in the probit model, with students being about 2 percent less likely to take an ROP course by
grade 12 for every one-standard-deviation increase in grade 8 reading scores.
The start of Appendix A provides information on probit models that we estimate for the
earlier grades.
iv) Conclusion
This chapter reveals evidence of some statistically significant relations between student
characteristics and school characteristics on the one hand, and CTE course-taking behavior on
the other. We used both simple cross-tabulations and probit analysis to examine various
measures of course-taking.
Female students are less likely than male students to become CTE investors by taking
three or more CTE courses, but are no less likely to complete two- or three-course cluster
concentrations in a specific occupational area. We found meaningful variations across racial and
ethnic lines. African-Americans and Hispanics were less likely than whites to become three-
course concentrators or concentrators by most other measures. Asians, according to the raw
data, take more CTE courses than whites, but these differences are not statistically significant
once we control for other characteristics such as GPA and test scores in grade 8. Both academic
and behavioral GPA predict CTE course-taking quite well. Most typically, a hump-shaped
pattern emerged, such that those in the bottom rungs of either GPA measure were the least likely
to become concentrators and those near but not at the top were the most likely to become
concentrators. EL students are less likely than students who speak English as their mother
tongue to complete at least three CTE courses, but they do not fare significantly differently from
other students when we instead model whether the students become cluster concentrators (that is,
take two or more courses in a given occupational field), while controlling for other observable
characteristics. Students who were special education in grade 8 were less likely to become CTE
concentrators by most measures.
Characteristics of schools appear to matter quite a lot as well. Attendance at charter
schools, which in our San Diego sample are limited to schools that have converted from
traditional public schools, is associated with significantly lower probability that the student will
become a CTE concentrator. Magnet schools and atypical schools, with some exceptions, did
not appear to be significantly different from traditional public schools. San Diego’s high schools
vary substantially in terms of the percentage of the courses they offer that are CTE courses.
Schools with higher percentage offerings are associated with meaningful increases in the number
of CTE courses actually taken, and with the probability of becoming a CTE concentrator. This
suggests that in future work we may be able to use this variable as an instrumental variable to
predict CTE course-taking in models of academic outcomes as a function of CTE courses taken.
We also found some evidence that the racial/ethnic makeup of teachers and the school’s student

60
body might be associated with the probability that students become CTE concentrators. Most
measures of teacher qualifications do not enter the models significantly, although teachers who
hold a Master’s degree are positively associated with the probability that their students become
CTE concentrators.
At the same time, we found some hints that students who might have trouble finishing the
academic courses needed to graduate cannot take as many CTE courses as they would have
liked. For instance, students with relatively low grade 8 reading scores were less likely to
become two- or three-course cluster concentrators in a specific occupational field, perhaps
because they could not find enough free blocks on their schedule. But at the same time, these
low-scoring students were more likely to take at least one CTE course, and more likely to take at
least one capstone CTE course. By grade 12, 51 percent of students in the lowest quartile of
grade 8 reading scores have taken at least one ROP course, compared to just 37 percent of
students in the top quartile. It could be that these struggling students make up for lost time by
taking a capstone course, which frequently lacks prerequisites, as a way of signaling to the labor
market that they have mastered basic skills in at least one occupational niche. Many of these
ROP courses are taken in grade 12. We found a similar, although less strong, association
between grade 8 academic GPA and the probability of taking a capstone course.
In sum, students’ background does matter for CTE course-taking, but in quite nuanced
ways. It is very difficult to find any demographic niche, or students in any specific range of
academic achievement, who do not take at least some CTE courses. Thus, it is a false dichotomy
to argue that high school students in San Diego take “either CTE or academic courses”. Almost
all take both types of courses.
Bachofer, Betts and Zau (2010), in a case study of CTE implementation in San Diego,
find that CTE teachers, principals, counselors, Employer Outreach Specialists on the school site
and central administration staff who oversee CTE activities understand deeply just how
widespread is student interest in CTE coursework. Indeed, of 39 staff interviewed, none
answered in the affirmative when asked “Is there a typical CTE student?”.

61
Figure 4.1 Predicted Change in Probability of Taking Three or More CTE Occupational Courses by Grade 12 With Respect to Student Characteristics Measured before Student Enters High School: Students in Graduating Classes of Spring 2002 through Spring 2009
Notes: Bars show the dP/dX relative to the reference student, who is a white male, not EL when
in grade 8, with a GPA below 2 when in grade 8 and with a behavior GPA below 2 when in
grade 5. Blank bars indicate characteristics that were not statistically significant. For the classes
of 2008 through 2010 we measure the outcome as of spring 2007. We add cohort dummies to
control for these age variations as well as other variations across cohorts.

62
Figure 4.2 Predicted Change in Probability of Taking Three or More CTE Occupational Courses by Grade 12 with Respect to Teacher Characteristics Measured before Student Enters High School: Students in Graduating Classes of Spring 2002 through Spring 2009
*Indicates the value is statistically significant (p<0.01)
Notes: For the classes of 2008 through 2010 we measure the outcome as of spring 2007. We
add cohort dummies to control for these age variations as well as other variations across cohorts.
The comparison group for the teacher ethnicity variables shown above is white teachers.

63
Table 4.1: Average Number of CTE Occupational Courses Taken Per Student Per Year and Percentage of Students Taking a Given Number of CTE Courses Per Year, by Gender: 1997-1998 to 2008-2009
Measure of CTE Course Taking Overall Male Female p-value
Average Number of CTE Courses Taken Annually
Per Capita in High Schools 0.58 0.60 0.55 <0.001
Number of CTE Courses Taken per High School
Student Per Year
0 50.8 48.7 52.9 <0.001
0.5 or more 49.2 51.3 47.1
0 50.8 48.7 52.9 <0.001
0.5 10.6 11.0 10.2
1 25.4 26.5 24.3
1.5 4.0 4.2 3.9
2 or more 9.2 9.6 8.7
Note: The top row reports the p-value from a t-test for equality of group means. The p-values below are from a chi-squared test for equality of percentages across columns.

64
Table 4.2: Average Number of CTE Courses Taken Per Student Per Year and Percentage of Students Taking a Given Number of CTE Courses Per Year, by Ethnicity: 1997-1998 to 2008-2009
Measure of CTE Course Taking Overall White Black Asian Hispanic Other p-value
Average Number of CTE Courses Taken Annually
Per Capita in High Schools 0.58 0.53 0.55 0.63 0.59 0.53 <0.001
Number of CTE Courses Taken per High School Student Per Year
0 50.8 53.5 51.5 48.0 49.9 52.6 <0.001
0.5 or more 49.2 46.5 48.5 52.0 50.1 47.4
0 50.8 53.5 51.5 48.0 49.9 52.6 <0.001
0.5 10.6 10.2 12.0 9.7 10.8 11.2
1 25.4 25.0 23.7 27.1 25.6 25.0
1.5 4.0 3.3 4.5 4.9 4.0 3.2
2 or more 9.2 8.1 8.3 10.3 9.7 8.1
Note: The top row reports the p-value from an F-test for equality of group means. The p-values below are from a chi-squared test for equality of percentages across columns.

65
Table 4.3: Average Number of CTE Courses Taken Per Student Per Year and Percentage of Students Taking a Given Number of CTE Courses Per Year, by English Learner Status: 1997-1998 to 2008-2009
Measure of CTE Course Taking Overall EL FEP Never EL p-value
Average Number of CTE Courses Taken Annually Per Capita
in High Schools 0.58 0.56 0.68 0.55 <0.001
Number of CTE Courses Taken per
High School Student Per Year
0 50.8 50.5 46.1 52.0 <0.001
0.5 or more 49.2 49.5 53.9 48.0
0 50.8 50.5 46.1 52.0 <0.001
0.5 10.6 11.5 8.6 10.9
1 25.4 25.4 28.5 24.7
1.5 4.0 4.2 4.3 4.0
2 or more 9.2 8.4 12.6 8.5
Note: The top row reports the p-value from an F-test for equality of group means. The p-values below are from a chi-squared test for equality of percentages across columns.

66
Table 4.4: Average Number of CTE Courses Taken Per Student Per Year and Percentage of Students Taking a Given Number of CTE Courses Per Year, by Parental Education: 1997-1998 to 2008-2009
Measure of CTE Course Taking Overall Unknown
Less than HS
Exactly HS
Some college
College or higher p-value
Average Number of CTE Courses Taken Annually
Per Capita in High Schools 0.58 0.68 0.59 0.52 0.49 0.42 <0.001
Number of CTE Courses Taken per High School Student Per Year
0 50.8 45.5 48.8 53.4 54.2 59.4 <0.001
0.5 or more 49.2 54.5 51.2 46.6 45.8 40.6
0 50.8 45.5 48.8 53.4 54.2 59.4 <0.001
0.5 10.6 11.9 9.9 9.5 10.1 9.1
1 25.4 24.7 28.7 26.7 26.0 24.4
1.5 4.0 4.9 3.9 3.5 3.6 2.7
2 or more 9.2 12.9 8.7 7.0 6.0 4.4
Note: The top row reports the p-value from an F-test for equality of group means. The p-values below are from a chi-squared test for equality of percentages across columns.

67
Table 4.5: Average Number of CTE Courses Taken Per Student Per Year and Percentage of Students Taking a Given Number of CTE Courses Per Year, by Grade 8 GPA: 1997-1998 to 2008-2009
Measure of CTE Course Taking Overall
Below 2.0
2.0 to 2.99
3.0 to 3.49
3.5 to 4.0 p-value
Average Number of CTE Courses
Taken Annually Per Capita in High
Schools 0.55 0.53 0.59 0.58 0.49 <0.001
Number of CTE Courses Taken per
High School Student Per Year
0 53.1 52.4 50.4 52.5 58.7 <0.001
0.5 or more 47.0 47.6 49.7 47.5 41.3
0 53.1 52.4 50.4 52.5 58.7 <0.001
0.5 9.1 12.2 9.9 8.0 6.1
1 25.8 24.2 26.6 26.5 25.2
1.5 3.3 3.5 3.7 3.2 2.4
2 or more 8.8 7.8 9.5 9.7 7.6
Note: The top row reports the p-value from an F-test for equality of group means. The p-values below are from a chi-squared test for equality of percentages across columns.

68
Table 4.6: Average Number of CTE Courses Taken Per Student Per Year and Percentage of Students Taking a Given Number of CTE Courses Per Year, by Grade 8 Reading Test Score (4th quartile contains the top scoring students): 2001-2002 to 2008-2009
Measure of CTE Course Taking Overall
1st quartile
2nd quartile
3rd quartile
4th quartile p-value
Average Number of CTE Courses Taken Annually
Per Capita in High Schools 0.54 0.55 0.60 0.57 0.43 <0.001
Number of CTE Courses Taken per High School Student Per Year
0 53.7 51.9 49.7 51.7 61.7 <0.001
0.5 or more 46.3 48.1 50.3 48.3 38.3
0 53.7 51.9 49.7 51.7 61.7 <0.001
0.5 8.5 10.3 9.1 8.3 6.2
1 26.3 25.7 27.5 27.6 24.5
1.5 3.1 3.6 3.6 3.1 2.0
2 or more 8.4 8.4 10.1 9.3 5.6
Note: The listed quartiles refer to the quartile of the student's score on a grade 8 reading test. Quintile 4 is the highest achieving group. The top row reports the p-value from an F-test for equality of group means. The p-values below are from a chi-squared test for equality of percentages across columns.

69
Table 4.7: Average Number of CTE Courses Taken Per Student Per Year and Percentage of Students Taking a Given Number of CTE Courses Per Year, by Grade 5 Behavioral GPA: 1997-1998 to 2008-2009
Measure of CTE Course Taking Overall
Below 2.0
2.0 to 2.99
3.0 to 3.49
3.5 to 4.0 p-value
Average Number of CTE Courses Taken Annually
Per Capita in High Schools 0.55 0.52 0.56 0.58 0.54 <0.001
Number of CTE Courses Taken per
High School Student Per Year
0 54.6 54.4 53.0 53.0 56.5 <0.001
0.5 or more 45.4 45.7 47.0 47.0 43.5
0 54.6 54.4 53.0 53.0 56.5 <0.001
0.5 7.6 10.9 8.7 7.5 5.8
1 25.6 23.3 25.6 26.5 25.9
1.5 2.9 3.4 3.1 2.9 2.6
2 or more 9.3 8.0 9.5 10.1 9.2

70
Table 4.8: Average Number of CTE Courses Taken Per Student Per Year and Percentage of Students Taking a Given Number of CTE Courses Per Year, by Special Education Status: 2001-2002 to 2008-2009
Measure of CTE Course Taking Overall Special Ed
Non-Special
Ed p-value
Average Number of CTE Courses Taken Annually
Per Capita in High Schools 0.57 0.51 0.58 <0.001
Number of CTE Courses Taken per High School
Student Per Year
0 50.8 48.7 52.9 <0.001
0.5 or more 49.2 51.3 47.1
0 50.8 48.7 52.9 <0.001
0.5 10.6 11.0 10.2
1 25.4 26.5 24.3
1.5 4.0 4.2 3.9
2 or more 9.2 9.6 8.7
Note: The sample period is 2001-2002 to 2008-2009, the years for which reliable data exist on special education status. The top row reports the p-value from a t-test for equality of group means. The p-values below are from chi-squared tests for equality of the distribution of students across groups.

71
Table 4.9: Variations by Gender in Percentage of Students Completing CTE Concentrations by Given Grades: 1997-1998 to 2008-2009
Definition of CTE Concentrator By grade Male Female p-value
Completed 3 or more CTE courses 9 0.9 0.9 0.9965
10 5.2 4.9 0.0578
11 17.2 15.6 <0.0001
12 40.4 37.6 <0.0001
Completed one or more 2-Course CTE Concentrations 9 1.0 1.5 <0.0001
10 4.3 4.4 0.2186
11 11.7 11.9 0.5269
12 27.1 26.9 0.4697
Completed One or More 3-Course CTE Concentrations 9 0.0 0.1 0.015
10 0.2 0.3 0.0053
11 1.3 1.5 0.0327
12 7.7 8.7 <0.0001
Completed One or More ROP Capstone Courses 9 1.0 0.8 0.0018
10 4.9 4.2 <0.0001
11 19.0 17.5 <0.0001
12 46.0 43.0 <0.0001
Complete One or More 2-Course CTE Concentrations and/or One or More ROP Courses 9 2.0 2.4 <0.0001
10 8.6 8.2 0.0442
11 26.0 25.1 0.0102
12 54.5 52.9 0.0005
Null hypothesis: No difference between males and females by grade level

72
Table 4.10: Variations by Ethnicity in Percentage of Students Completing CTE Concentrations by Given Grades: 1997-1998 to 2008-2009
Definition of CTE Concentrator By
grade White Black Asian Hispanic Other p-value
Completed 3 or more CTE courses 9 1.0 0.8 1.6 0.6 0.5 <0.0001
10 4.5 4.6 6.9 4.7 4.9 <0.0001
11 14.6 15.0 19.7 16.4 15.8 <0.0001
12 37.1 36.5 45.4 37.5 35.2 <0.0001
Completed one or more 2-Course CTE Concentrations 9 1.7 0.9 2.0 0.8 1.2 <0.0001
10 5.0 3.4 5.2 3.8 5.1 <0.0001
11 12.8 9.5 12.8 11.3 11.8 <0.0001
12 28.7 23.4 29.9 25.2 26.4 <0.0001
Completed One or More 3-Course CTE Concentrations 9 0.1 0.1 0.1 0.0 0.0 0.001
10 0.3 0.1 0.3 0.2 0.2 0.001
11 1.4 1.0 1.4 1.6 1.8 0.0065
12 10.3 5.9 8.3 7.3 9.3 <0.0001
Completed One or More ROP Capstone Courses 9 0.9 1.0 0.7 1.0 0.9 0.0004
10 3.5 5.1 3.3 5.8 3.7 <0.0001
11 13.9 19.3 16.3 22.4 17.4 <0.0001
12 36.4 47.7 44.3 50.3 39.7 <0.0001
Complete One or More 2-Course CTE Concentrations and/or One or More ROP Courses 9 2.5 1.9 2.6 1.8 2.1 <0.0001
10 8.0 8.0 8.0 9.1 8.3 0.0038
11 23.3 24.5 24.6 28.3 25.6 <0.0001
12 49.2 54.1 54.8 56.7 50.1 <0.0001
Null hypothesis: No difference between each ethnicity by grade level

73
Table 4.11: Variations by English Learner Status in Percentage of Students Completing CTE Concentrations by Given Grades: 1997-1998 to 2008-2009
Definition of CTE Concentrator By grade EL FEP Never EL p-value
Completed 3 or more CTE courses 9 0.4 1.5 0.9 <0.0001
10 3.6 7.8 4.6 <0.0001
11 14.2 21.9 15.0 <0.0001
12 32.9 45.2 37.7 <0.0001
Completed one or more 2-Course CTE Concentrations 9 0.4 1.7 1.4 <0.0001
10 2.8 5.4 4.4 <0.0001
11 8.9 14.0 11.6 <0.0001
12 20.4 29.6 27.0 <0.0001
Completed One or More 3-Course CTE Concentrations 9 0.0 0.0 0.1 0.0011
10 0.1 0.3 0.2 <0.0001
11 1.4 1.8 1.3 <0.0001
12 5.5 8.7 8.4 <0.0001
Completed One or More ROP Capstone Courses 9 1.1 0.9 0.9 0.0006
10 6.2 5.5 3.9 <0.0001
11 23.0 23.8 15.5 <0.0001
12 51.5 54.6 40.2 <0.0001
Complete One or More 2-Course CTE Concentrations and/or One or More ROP Courses 9 1.5 2.5 2.3 <0.0001
10 8.5 10.3 7.9 <0.0001
11 26.9 31.2 23.5 <0.0001
12 55.7 61.2 50.9 <0.0001
Null hypothesis: No difference in EL status by grade level

74
Table 4.12: Variations by Parental Education Level in Percentage of Students Completing CTE Concentrations by Given Grades: 1997-1998 to 2008-2009
Definition of CTE Concentrator By
Grade
Less Than High
School High
School Some
College College Graduate School
p- value
Completed 3 or more CTE courses 9 1.1 0.9 1.3 0.9 0.8 0.0001
10 7.0 5.8 5.6 4.1 3.6 <0.0001
11 20.8 17.4 17.5 13.9 11.9 <0.0001
12 45.4 50.5 50.7 48.3 34.5 <0.0001
Completed one or more 2-Course CTE Concentrations 9 1.0 1.1 1.5 1.5 1.9 <0.0001
10 4.5 4.5 4.8 4.2 4.7 0.1232
11 12.6 11.7 11.9 11.1 12.2 0.0385
12 26.3 28.1 31.2 29.2 28.3 0.1914
Completed One or More 3-Course CTE Concentrations 9 0.0 0.0 0.1 0.1 0.1 0.0285
10 0.2 0.3 0.3 0.2 0.3 0.5642
11 1.4 1.3 1.5 1.0 1.0 0.0048
12 6.0 6.7 7.1 7.7 7.5 0.6053
Completed One or More ROP Capstone Courses 9 1.0 0.8 0.8 0.7 0.7 0.0431
10 6.5 4.7 3.7 2.9 2.9 <0.0001
11 24.0 18.9 17.1 13.8 10.6 <0.0001
12 45.7 38.6 34.8 30.8 17.8 <0.0001
Complete One or More 2-Course CTE Concentrations and/or One or More ROP Courses 9 2.0 1.9 2.3 2.2 2.6 0.004
10 10.4 8.7 8.1 6.8 7.1 <0.0001
11 30.6 26.2 25.0 21.8 20.3 <0.0001
12 56.2 51.7 50.3 46.2 37.5 <0.0001
Null hypothesis: No difference in parental education levels by grade level.

75
Table 4.13: Variations by Grade Point Average in Percentage of Students Completing CTE Concentrations by Given Grades: 1997-1998 to 2008-2009
Definition of CTE Concentrator By grade <2.0 2.0-2.99 3.0-3.49 3.5-4.0 p-value
Completed 3 or more CTE courses 9 0.3 1.0 1.5 1.8 <0.0001
10 2.8 5.5 6.7 6.8 <0.0001
11 11.3 17.6 19.7 17.7 <0.0001
12 31.5 40.5 43.6 38.2 <0.0001
Completed one or more 2-Course CTE Concentrations 9 0.3 1.0 1.8 2.9 <0.0001
10 2.4 4.2 5.6 6.6 <0.0001
11 7.7 11.6 13.9 15.2 <0.0001
12 20.3 27.2 30.9 29.9 <0.0001
Completed One or More 3-Course CTE Concentrations 9 0.0 0.1 0.1 0.2 <0.0001
10 0.1 0.2 0.3 0.5 <0.0001
11 0.8 1.6 1.7 1.9 <0.0001
12 4.9 8.0 10.0 10.8 <0.0001
Completed One or More ROP Capstone Courses 9 0.9 0.8 0.8 0.8 0.6637
10 5.2 4.6 3.9 3.7 0.0005
11 19.6 19.8 18.4 15.7 <0.0001
12 46.7 48.0 45.9 38.0 <0.0001
Complete One or More 2-Course CTE Concentrations and/or One or More ROP Courses 9 1.2 1.8 2.5 3.6 <0.0001
10 7.2 8.3 9.0 9.8 <0.0001
11 23.7 26.4 27.3 26.4 <0.0001
12 52.1 55.8 56.4 51.3 <0.0001
Null hypothesis: No difference in GPA by grade level

76
Table 4.14: Variations by Grade 8 CST Reading Score in Percentage of Students Completing CTE Concentrations by Given Grades: 2002-2003 to 2008-2009
Reading test score
Definition of CTE Concentrator By grade Quartile 1 Quartile 2 Quartile 3 Quartile 4 p-value
Completed 3 or more CTE courses 9 0.6 1.5 0.8 1.5 <0.0001
10 5.0 7.2 4.1 6.3 <0.0001
11 18.2 19.2 13.8 18.5 <0.0001
12 38.3 42.5 36.4 42.0 <0.0001
Completed one or more 2-Course CTE Concentrations 9 0.7 2.1 1.3 1.6 <0.0001
10 4.0 6.3 3.4 5.2 <0.0001
11 12.9 15.0 9.2 13.3 <0.0001
12 28.1 32.2 23.4 29.1 <0.0001
Completed One or More 3-Course CTE Concentrations 9 0.0 0.2 0.1 0.0 <0.0001
10 0.2 0.5 0.2 0.2 <0.0001
11 2.1 2.4 0.9 1.2 <0.0001
12 8.4 11.6 6.6 8.9 <0.0001
Completed One or More ROP Capstone Courses 9 1.2 0.9 0.6 0.7 <0.0001
10 5.7 4.2 4.2 3.7 <0.0001
11 25.4 21.3 16.7 14.5 <0.0001
12 54.5 50.2 44.9 38.1 <0.0001
Complete One or More 2-Course CTE Concentrations and/or One or More ROP Courses 9 1.9 3.0 1.8 2.3 <0.0001
10 9.0 9.8 7.3 8.5 <0.0001
11 31.0 29.4 22.7 24.5 <0.0001
12 59.3 58.9 53.0 51.3 <0.0001
Null hypothesis: No difference in grade 8 reading test score by grade level Quartile 1 is the lowest group while quartile 4 is the highest group

77
Table 4.15: Variations by Behavioral GPA in Percentage of Students Completing CTE Concentrations by Given Grades: 1997-1998 to 2008-2009
Behavior GPA
Definition of CTE Concentrator By grade <2.0 2.0-2.99 3.0-3.49 3.5-4.0 p-value
Completed 3 or more CTE courses 9 0.4 0.8 1.4 1.5 <0.0001
10 3.5 4.9 6.4 6.1 <0.0001
11 12.9 16.1 17.1 17.0 <0.0001
12 29.3 37.1 39.8 38.4 <0.0001
Completed one or more 2-Course CTE Concentrations 9 0.5 1.0 1.6 2.6 <0.0001
10 2.9 4.2 5.0 5.9 <0.0001
11 8.3 11.5 12.2 14.3 <0.0001
12 20.2 27.0 27.6 29.8 <0.0001
Completed One or More 3-Course CTE Concentrations 9 0.0 0.0 0.1 0.2 0.001
10 0.1 0.2 0.4 0.4 <0.0001
11 1.2 1.7 1.5 2.0 0.0026
12 5.0 8.1 8.2 10.5 <0.0001
Completed One or More ROP Capstone Courses 9 1.2 1.1 1.0 0.9 0.0647
10 6.1 5.1 4.7 3.9 <0.0001
11 21.8 21.1 20.9 18.6 <0.0001
12 47.9 50.6 50.3 44.9 <0.0001
Complete One or More 2-Course CTE Concentrations and/or One or More ROP Courses 9 1.6 2.1 2.5 3.4 <0.0001
10 8.3 8.8 9.1 9.2 0.1458
11 25.3 27.2 27.2 27.5 0.0772
12 52.3 56.7 56.9 55.1 0.0002
Null hypothesis: No difference in behavior GPA by grade level

78
Table 4.16: Variations by Special Education Status in Percentage of Students Completing CTE Concentrations by Given Grades: 2001-2002 to 2005-2006
Definition of CTE Concentrator By
grade Special
Ed
Non-Special
ed p-value
Completed 3 or more CTE courses 9 0.6 0.9 0.0006
10 3.3 5.2 <0.0001
11 11.0 16.9 <0.0001
12 25.5 40.5 <0.0001
Completed one or more 2-Course CTE Concentrations 9 0.5 1.3 <0.0001
10 3.1 4.5 <0.0001
11 8.4 12.1 <0.0001
12 7.3 27.9 <0.0001
Completed One or More 3-Course CTE Concentrations 9 0.0 0.1 0.1214
10 0.1 0.2 0.0116
11 1.4 1.4 0.8487
12 5.6 8.5 <0.0001
Completed One or More ROP Capstone Courses 9 1.3 0.9 0.0001
10 6.1 4.5 <0.0001
11 18.1 18.3 0.7015
12 39.4 45.0 <0.0001
Complete One or More 2-Course CTE Concentrations and/or One or More ROP Courses 9 1.8 2.2 0.0085
10 8.5 8.4 0.7856
11 22.6 25.9 <0.0001
12 44.3 54.7 <0.0001
Null hypothesis: No difference in special ed status by grade level

79
Part III – The Relation between Career
and Technical Education and High School
Academic Outcomes

80
5. Overview of the Data and Empirical Approach
This part of the report examines the relation between course-taking in career and
technical education and a variety of high school outcomes at the student level. We
employ three different measures of CTE coursework. In our main specifications we
control for the total number of CTE courses taken. In expanded models we also add the
number of Tech Prep classes and Regional Occupational Program (ROP) classes taken.
As discussed in Chapter 4, the San Diego Unified School District defines Tech Prep as
CTE courses that allow students in high school to receive college credit in one of many
defined career pathways. The advantage of the Tech Prep program is that it prepares
students for post-secondary education in a specific field and allows students to receive
college credit without having to spend money on college tuition. Under California’s
Regional Occupational Program (ROP), capstone or ROP courses refer to CTE courses
that typically represent the culmination of study in a given CTE occupational cluster.
Because Tech Prep and ROP courses are thought of as representing the culmination of
study in a given occupational field, there is a possibility that such courses would have an
effect over and above regular CTE courses.
i) Key Outcomes and Empirical Issues
The outcomes we examine include:
School absences, on-time promotion, and graduation within five years with a regular
high school diploma. (We allow students five years from their first enrollment in
grade 9 to graduate from high school given the large number of English Learners in
the district, as these students, especially recent arrivals to the United States, may
require extra time to graduate.)
Completion of college-preparatory high school courses (which in California are
known as A-G courses)
Completion of the New Basics, a set of academic coursework recommended by the
National Commission on Excellence in Education (1983). 53 The New Basics
standards include 4 years of English and 3 years each of mathematics, science, and
social studies. (Levesque et al., 2008, p. viii)
Passing the California High School Exit Examination (CAHSEE) and its separate
components in mathematics and English Language Arts
Achievement levels and growth as measured by California state assessments in math
and reading
Cumulative GPA at the end of grade 12 (measured as the third year after students
finish grade 9)
Distinguishing between correlation and causation is a key issue in our analysis.
Ideally, we would like to know whether taking more CTE courses causes changes in
longer-term academic outcomes such as the probability of graduating from high school or
53 See also National Center for Education Statistics (2008), p. 47.

81
of completing the courses required to become eligible to attend either the University of
California or the California State University systems. However, CTE course-taking and
these longer-term outcomes could both be endogenous functions of factors that we cannot
hope to capture in our data. For instance, innate ability, interest and ability in technical
occupations, and overall levels of student motivation could influence both CTE course-
taking and the probability of graduation. Even if CTE course-taking is not endogenous,
biased results can obtain if we have omitted important explanatory variables that happen
to be correlated with CTE course-taking. For these reasons, simple regression models of
high school graduation on CTE course-taking should be interpreted as explorations of
correlations, conditional upon other observable student characteristics. Our goal,
however, is to go beyond such models towards something that reduces or arguably
removes the endogeneity of CTE course-taking, through use of student fixed-effects
models and instrumental variables models.
We study in separate chapters outcomes we observe repeatedly, such as test
scores, and “once only” outcomes, such as high school graduation. We divide the
analysis in this way because different approaches can be taken depending upon the
number of times we observe a given type of academic outcome for a student.
Chapter 6 examines annual academic outcomes of students during the high school
years. We employ two methods to reduce the potential for biased results related to
unobserved student characteristics. First, we estimate models with student fixed effects.
This method controls for any omitted characteristics of students that do not change over
time. Second, we estimate instrumental variable models in which we replace CTE
courses taken with a predicted value based on a first-stage model of CTE course-taking,
as a function of observables plus, serving as the instrumental variable, the percentage of
courses offered at the school in the given school year that are CTE. In Chapter 4 we
found that this latter variable is highly predictive of actual course-taking within a given
school year. In extended models that add to the list of explanatory variables the numbers
of Tech Prep and Regional Occupational (ROP) courses, we add as instruments the
number of CTE courses of either type.
Chapter 7 models “once-only” outcomes such as the probability of high school
completion. Student fixed-effects cannot be used in such situations because with only
one observation per student, there is no variation left to explain in the data after we
condition the outcome upon dummy variables for each student. We take two approaches
to contend with endogeneity in these models. First, we condition upon measures of
academic standing at the end of grade 8, including Grade Point Average and test scores,
just before students enter high school. Second, we adopt a similar instrumental variables
technique to the one described above. The instrumental variable approach becomes
especially important in the context of outcomes observed only once, because we are
unable to use student fixed effects to net out unobserved student characteristics that are
fixed over time. Because we are modeling cumulative outcomes of the high school
experience in this chapter, we use as instruments the percentage of courses that are CTE
in the school the student attended in grade 9, grade 10, grade 11 and grade 12. We found
that using these separate instruments led to significantly better first stage fit than an
average over the student’s four years of high school. As in Chapter 6, in models that
condition upon ROP and Tech Prep course-taking, we add eight instruments measuring

82
the percentage of all courses offered that were ROP or Tech Prep in the student’s school
in each of grades 9 through 12.
ii) Data Samples
Cohorts
It is important to control for students’ characteristics at the time they enter high
school, especially measures of academic achievement. California began testing students
in reading and math in spring 1998. Accordingly we begin our analysis with students
entering grade 9 in the fall of 1998. These students, if they are promoted from grade to
grade and graduate on time, should have graduated from high school in the spring of
2002.
We analyze eight cohorts of high school students, who, based on the year they
entered grade 9, were expected to form the graduating classes of 2002 through 2009.
Subsamples that Are Studied
We have two distinct types of outcomes – those observed annually between
grades 9 and 12, and “once-only” variables that we measure typically at the end of grade
12. The student samples in the analyses of different outcomes should be roughly similar,
so that we are comparing roughly the same set of students across different outcomes.
For these reasons, we focus in our analyses on students for whom grade 8 reading
and math scores, Grade Point Average (GPA), English Learner (EL) status, special
education status, gender and race/ethnicity are available. These grade 8 characteristics
will serve as conditioning variables in the models of once-only outcomes in Chapter 7. In
the annual models of test scores and other outcomes in Chapter 6, by excluding those
who lack grade 8 GPA, test scores and EL and special education status will create a
sample more similar to the sample we will use for the “once-only” outcomes. In
addition, we will focus on students who are enrolled in SDUSD for grades 9 through 12
inclusive. It is especially important to have a complete picture of CTE coursework
throughout high school for the longer-term outcomes such as high school graduation and
postsecondary outcomes. There will still be slight variations in sample size across
models of different outcomes due to variations in the number of observations for each
dependent variable.
iii) Multiple Comparisons
The Department of Education has recently encouraged researchers to pre-commit
to main or “confirmatory” models within each major domain of study which will be used
to test a theory while relegating other models to “exploratory” status. 54 This is a sensible
approach to handling the issue of multiple comparisons (estimating a large number of
54 See Schochet (2008) for a recent review.

83
models in which the coefficients of interest are truly zero will almost surely lead to some
rejections of the null).
Because the essence of this approach is pre-commitment on the part of the
researcher, here are the demarcations we proposed before undertaking the analysis.
Domains of Inquiry
We chose as the four domains of inquiry be high school academic
outcomes (Chapter 6), high school educational attainment (Chapter 7), postsecondary
enrollment (Chapter 8) and postsecondary educational attainment (i.e. degrees) (Chapter
8).
Confirmatory Models
The confirmatory models will be the models with three CTE variables (defined as
the number of CTE, ROP, and Tech Prep classes completed) from the following tables: 55
Table 6.1 Student-Fixed Effects Models of Gains in Reading
Table 6.2 Student-Fixed Effects Models of Gains in Math
Table 7.1a. Linear Probability Models of Graduation within Five Years of Entering Grade
9, in Terms of CTE Courses Taken: Classes of 2002 through 2009
Table 8.6a Linear Models of Number of Years in the First Four Years after High School
Graduation During Which the Student Enrolls in Postsecondary Education, in Terms of
CTE Courses Taken: High School Graduates from 2002 through 2005
Table 8.8a Linear Models of Highest Level of Educational Attainment by 2009, in Terms
of CTE Courses Taken: High School Graduates from 2002 through 2005 56
Exploratory Models
The remaining models will be considered as exploratory models within the same
domains listed above.
55 Within these tables we propose to use the Instrumental Variable estimates that account for endogeneity of
the number of CTE courses taken by using the percentage of courses offered by the student’s high school
that are CTE. Because we have two confirmatory models (reading and math gains) for the domain of high
school academic outcomes, in theory one could make suitable adjustments to the p-values in these two
models, if requested to do so by ED. The issue of how to adjust is somewhat complex as it is unlikely that
the reading and math outcomes are independent of each other. 56 For this last table, an alternative model is the ordered probit, but because it is important to use
instrumental variables to control for endogeneity of selection into CTE coursework, and because we could
estimate IV models for the linear probability model, this is our preferred specification.

84
6. Annual Academic Progress in High School
This chapter presents models of annual measures of student progress while in high
school. These include test scores in reading and math (grades 9 through 11), which are
our two confirmatory analyses. In exploratory analyses, we also model student absences,
whether the student was promoted to the next grade at the end of each year and the
number of college preparatory (“A-G”) courses passed. Because we have a panel dataset
we can include a student fixed effect to control for unobservables to the extent that they
are constant over time.
i) Analytical Approach
Consider the following model of test-score gains in reading for student i in
classroom c, grade g, school s and year t:
(1)
Constant
( )
icgst igst it it
icgst ist i it
Score CTE
FAMILY PERSONAL
CLASS SCHOOL
where CTEigst is the number of CTE courses taken by student i in grade g, school s, year
t, β is the estimated relation between CTE courses taken and gains in reading, and the
bold names indicate vectors of family, personal, classroom and school characteristics.
The error term consists of a person-specific component αi and a white noise error term εit.
If the included family and personal controls do not fully capture the reasons why
some students tend to gain more or less than average, holding constant the school and
classroom setting, the coefficient estimates in (1) are likely to be biased, because they
will be correlated with unobserved characteristics of the student αi. This problem is
aggravated if personal characteristics are correlated with classroom or school
environment. For instance, U.S. schools often assign students to classrooms at least
partially based on their previous achievement. See for example Oakes (1990), Argys
Rees and Brewer (1996), Betts and Shkolnik (2000) and a review of the literature by
Betts (forthcoming).
Our solution is to account for the student error component i explicitly by adding
fixed effects for each student to sweep i out of the error term, removing both bias and
inconsistency arising from unobserved student heterogeneity to the extent that it is time-
invariant. Our basic regression model adds dummy variables to account for observed and
unobserved variations across not only students, but their schools and their home
neighborhoods, as proxied by home zip codes, as well as dummies for calendar year and
grade. The set of dummy variables for each year controls for variations in test
familiarization and changes in tests (with a nationally standardized state test giving way
to a criterion-referenced test in 2002), or temporal changes that are the same across
students. This approach of using fixed effects can remove unobserved heterogeneity
related to students, schools, grade levels, and even the year in which the test is given, to
the extent that the student, school, and grade heterogeneity do not change over time in
ways that vary across students or schools.

85
Family, personal, class and school characteristics that do not vary over time, such
as student race, can be excluded, because they will be absorbed by the student and/or
school fixed effects. But we control for characteristics that can change over time such as
parental education, demographics of the student body at the school, and the
characteristics of the English and math teachers who taught the student in the given year.
The above discussion of equation (1) pertains explicitly to models of reading and
math test-score gains. But it also applies to the other outcomes for which we have annual
observations, namely, absence rates, whether the student was promoted to the next grade
on time, and the number of college preparatory (A-G) courses passed. We estimate
student fixed-effects models of these outcomes, replacing gains in test scores on the left-
hand side of (1) with attendance rates and the probability of promotion.
Alternatives to linear regression exist for limited and qualitative dependent
variables. For limited dependent variables such as attendance rates, which must lie
between 0 and 100, one could estimate a two-sided tobit model. For binary dependent
variables such as whether the student was promoted to the next grade, one could estimate
a probit model. For ordered qualitative variables such as the number of A-G courses
passed in a year, an ordered probit model could be estimated. These models tend to
produce results qualitatively similar to linear regression models except when there are
many constrained observations, in the case of the tobit, or just a few observations for
which the outcome is either zero or one in the case of the probit, or just a few
observations in a given level for the ordered probit. A practical issue we face is that our
overriding concern is that we should control for unobserved student heterogeneity as
much as possible, and so we intend to use student fixed-effects to control for all that is
unobservable about students and that does not change over time. Unfortunately, no
consistent estimator exists for fixed-effect versions of models with limited or qualitative
dependent variables. Thus we rely on linear regression. However, as detailed later,
Appendix B Tables will reproduce the linear regression results without student fixed
effects and compare these to the corresponding qualitative and limited dependent variable
models. If these two sets of models are similar to each other it will reduce concerns
about the use of Ordinary Least Squares. 57
Instrumental Variable Estimates to Account for Endogeneity of Coursework Variables
The student fixed-effect approach is quite rigorous, but neglects the serious
possibility that time-varying student unobservables such as motivation are influencing
both CTE course-taking and the annual observation on the academic outcome, such as
test scores. To guard against endogenous choice of CTE coursework in a given year we
use Two Stage Least Squares (TSLS) models, more widely known as Instrumental
Variables (IV), in which we replace CTE courses taken with a predicted value, with the
goal of providing unbiased estimates.
An issue with IV models is that the instruments must have good explanatory
power for the endogenous (CTE coursework) regressor(s), and at the same time a case
57 A comparison of the OLS models with and without student fixed effects will also inform us about the
actual impact of removing unobserved (time-invariant) student heterogeneity.

86
must be made that the instruments do not themselves directly affect the outcome, be it
test score gains, attendance, or promotion, except through the student’s CTE coursework. 58
Our choice of instrumental variable (IV) for the number of CTE courses taken in a
given year is the percentage of courses offered at the high school that year that were
CTE. 59 This measure of course offerings should not be related to individual student
motivation, and yet should be related to overall course-taking. In Part II of this report we
found in probit models that the percentage of courses that were CTE was typically a
highly significant (and always positive) predictor of the amount of CTE coursework
completed. The rationale for this instrument is that it is orthogonal to individual
variations in interests and motivation. The instrument instead identifies variation in
course-taking that reflects variations in the supply of CTE courses at the school level. It
completely removes inter-student variations in course-taking patterns within the school.
Further, because we include school fixed effects in our models of outcomes,
identification of the CTE “effect” does not come from inter-school variations in course-
offerings. Rather, we use within school variations across the years to identify the effects
of CTE course-taking on various outcomes. (We also include year dummies, which
removes district-wide trends in course-offerings as well. Thus identification derives from
within-school variations over time that are orthogonal to district-wide trends.)
We also experimented with an IV approach in which we replaced the percentage
of all courses that is CTE with the percentage of all courses that are CTE for each of the
four most popular CTE occupational clusters in which at least some San Diego students
become three-course concentrators. (See Table 3.14 for an analysis on a 16-cluster
categorization downloaded from www.careercluster.org (September 2008).) We did not
anticipate that this approach would do far better than the main, and simpler, IV approach
outlined above, as only 4 of the 14 clusters with active student participation see more
than one percent of students completing two or more courses in that given cluster. The
results in this chapter were little changed with this approach and so we focus on the more
obvious choice of instrument, which is the percentage of all courses that are CTE. In
general, our instrument of choice had better first-stage explanatory power than the
alternative described here.
58 A related question is whether we need to use instruments. IV models are consistent but inefficient if the
regressor(s) suspected of being endogenous are actually exogenous. A superior approach if the CTE
regressor(s) is/are exogenous with respect to the given outcome would be to use linear regression (Ordinary
Least Squares, or OLS) instead. We estimate each specification using OLS and again using IV. We can
use a Hausman test to choose between these two options. However, we believe that we should focus on the
IV estimates even if a Hausman test reports that the OLS model is retained against the IV model. There are
two reasons for doing so. First, recent research suggests that pre-testing using a Hausman test can lead to
errors in the size of second-stage models in the IV method. Guggenberger (2010) shows that use of a
Hausman pre-test to select between the OLS and IV models will lead to the null hypothesis of no effect
being severely overrejected in practice. Second, even if the Hausman test retains the null hypothesis that
the OLS model is consistent, it would not necessarily erase concerns that students actively make choices
about which courses, including CTE courses, to take, and that this decision process reflects unobserved
characteristics of the student that themselves directly affect the outcome being modeled. 59 We have found that official lists of courses offered can overstate what is available in a given year. Thus,
we measure course offerings based on courses in which one or more students actually enrolled during a
given year.

87
In a second specification of the student outcome models, we augment the simple
count of the number of CTE courses taken with the number of Tech Prep classes taken
and the number of Regional Occupational Program (ROP) courses taken. Because these
CTE measures could be endogenous results of student choices, we use three instrumental
variables in the IV models that incorporate all three measures of CTE coursework: the
percentage of all courses at the given high school that are CTE, the percentage of all
courses that are Tech Prep, and corresponding percentage that are ROP. The rationale for
the two additional instruments is similar to that set out above.
ii) Results
Appendix B Tables 1 and 2 contain the means and standard deviations of each of
the explanatory variables and outcomes considered in this chapter.
Table 6.1 shows results for reading. Models (1) and (2) incorporate student fixed
effects. The first model controls for the number of CTE courses completed and the
second model adds controls for the numbers of Tech Prep and ROP courses completed.
These are sub-types of CTE courses, so the coefficients on these latter two variables tell
us whether there is a distinction between CTE courses as a whole and Tech Prep and
ROP CTE courses. Models (3) and (4) repeat these specifications, but adopt an IV
approach, using the instruments described above.
Model (1) suggests a negative and significant relation between the number of
CTE courses taken and gains in reading scores. However, the level of statistical
significance is not high (10%), and the effect is very small: taking one CTE course is
predicted to lower a student’s reading score by 0.004 of a standard deviation. For
instance, for a student who was initially the median student in reading, a drop of this size
would drop his or her ranking from about 500th out of 1000 to about 502nd. In model (2)
only the ROP CTE variable is negative and significant, but the overall effect of taking
one ROP course is to reduce reading test score gains by only 0.01 of a standard deviation.
The IV estimates in models (3) and (4) suggest no significant relation between the
CTE variables and gains in reading scores. However, the p-values for the exclusion of
the instruments in the first stage for CTE courses taken retain the null hypothesis, which
indicates that our instruments do not have much explanatory power for predicting overall
CTE course taking patterns. The instruments are able to predict both Tech Prep and ROP
course taking. Nevertheless, this weak instrument problem suggests that we should rely
more heavily on the models in (1) and (2).
Table 6.2, which shows results for gains in math achievement, tells a similar
story. There is no relation between math score gains and the number of CTE courses
taken. Once controls for Tech Prep and ROP courses taken are added in model (2), the
coefficient on Tech Prep is negative and very small, but statistically significant. The
estimate suggests that a student who takes one Tech Prep class in a given year
experiences a drop in math achievement of about one percent of a standard deviation.
Again, the IV estimates show no significant coefficient on any of the CTE variables, but
this lack of significance could easily be caused by the poor first-stage explanatory power
of the instruments for CTE course taking.

88
The weak explanatory power of the instruments seems at odds with the findings in
Chapter 4 that CTE course-taking was significantly related to the availability of CTE
coursework. 60 Two factors are probably at play. First, the analysis in Chapter 4
examined the entire student record from grade 9 through grade 12, while in California
students are tested in reading and math only in grades 9 through 11, and so our sample
here is much smaller. Compounding this issue, we found earlier that much of student’s
CTE course-taking occurs in grade 12. For instance, Appendix A Table 3 shows that for
students who were in SDUSD from grades 9 through 12, the cumulative number of CTE
courses completed per student rose from 0.6 in grade 9, to 0.9 in grade 10, 1.5 in grade 11
and to 2.5 by the end of grade 12. Thus almost half of CTE course-taking occurs in grade
12, during which time we have no measures of reading and math achievement. A
secondary reason for the low predictive power of the instruments in the test score
equations may be that the sample is further reduced by missing test scores, which most
typically occurs when a student is ill and misses a test day.
This reduced sample size is less of an issue with the other outcomes in this
chapter. For both of these reasons, we should not be surprised when we find that the
instruments have better explanatory power for CTE course-taking in the models of
absences, promotion, and especially, as we will find, in the models of A-G course
completion and GPA.
Table 6.3 models the percentage of days for which the student was absent in a
given year. Model (1) suggests that taking one CTE course is associated with a 0.023
percentage point reduction in absences. Model (2) indicates that this effect derives
directly from the number of Tech Prep classes taken. Turning to the IV models, we see
that the instruments do a good job of predicting course taking in CTE, Tech Prep, and
ROP. But models (3) and (4) suggest that there is no significant relationship between
CTE course taking and absences. Given the strength of the instruments, the IV results are
to be preferred here.
Table 6.4 shows results of linear probability models of whether the student was
promoted to the next grade at the end of the current year. Both models (1) and (2) reveal
positive and highly significant effects of CTE course-taking on the probability of grade
promotion. Taking one CTE course is associated with an increase in the probability of
grade promotion of 0.0013, that is 0.13%. Model (2) suggests that this effect is larger for
Tech Prep classes and lower for ROP courses relative to CTE courses as a whole. The IV
models show that ROP course taking is associated with lower probability of grade
promotion but only relative to other CTE courses. That is, the hypothesis test at the
bottom of the table shows that the overall effect of taking one ROP course (the sum or the
CTE and ROP coefficients) is not significant. There are no other significant effects of
course taking on the likelihood of promotion. As with the model for student absences,
the explanatory power of the instruments is good for all three course taking variables
(significant at a 2.5 percent level or lower).
Table 6.5 models the number of college-preparatory “A-G” courses passed per
year. Note that we measure these courses in semester units, as California does, but we
measure the number of CTE courses in Carnegie (year-long) units. Models (1) and (2)
60 See Chapter 4 and in particular Appendix A Tables 8 through 10.

89
indicate that for every CTE course completed, the number of A-G courses completed falls
by about -0.14. This finding, to the extent that it is real, could mechanically result from
the fact that only 7% of CTE courses taken qualify as A-G, compared to 45% of non-
CTE courses. Thus, taking one year-long CTE course reduces the chance to take two
semester-long non-CTE courses, which should result in a reduction in A-G courses
completed of 2(0.45-0.07)=0.76. Seen in this light, an estimated effect of -0.14 suggests
that students might be more likely to take a non-CTE course that qualifies for A-G credit
when they take one year-long CTE course. As seen in Model 2, there is no distinction
between regular CTE courses and ROP courses, but it appears that taking Tech Prep
courses are unique in being associated with higher A-G course taking relative to CTE.
The IV estimates in models (3) and (4) tell a different story – there is no link to overall
CTE coursework taken. (This time, in model (3) the first-stage fit of the instrument is
very good, with the null hypothesis that CTE course offerings bear no relation to A-G
course completion being rejected at the 0.006 level.) Thus, even though it is true that
CTE courses are less likely to qualify for A-G credit than non-CTE courses, there is no
overall effect. Again, the suggestion is that students might be taking both a CTE course
and a non-CTE course, the latter of which has a higher than normal probability of being
A-G. Model (4) presents some problematically large estimates: each Tech Prep class
taken is associated with an increase of about 3.4 A-G courses relative to other CTE
classes, and about 4.7 relative to non-CTE classes. This effect, although highly
significant, is too big to be credible. (The average number of A-G classes completed per
grade is 7.0.)61
Table 6.6 shows models of GPA over the course of the given year. Taking a CTE
course is associated with a 0.04 increase in GPA. Model (2) suggests that Tech Prep
classes have a smaller positive association and that ROP classes have a bigger positive
association than does the average CTE course. Turning to the IV estimates, Model 3
finds a far bigger effect – taking one CTE course is now associated with a 0.3 point
increase in GPA – but one which is only marginally significant (at the 10 percent level).
Adding in Tech Prep and ROP, Model (4) shows no significant differences among types
of CTE coursework. (However, we reject the null hypothesis that the coefficients on all
three CTE variables is zero at 1.9% level.)
One concern we had about this was whether the GPA was mechanically higher
because grades in CTE courses tend to earn higher grades than non-CTE courses. The
mean GPA for CTE courses between 1998-1999 and 2008-2009 in the regression sample
was 3.20 and the mean GPA for non-CTE courses for the same time period was 2.85. It
appears either that CTE courses are more easily graded, or students try harder or are more
interested in these courses so they get better grades. Either way, grades are higher for
CTE courses. When we repeated the regressions in Table 6.6 using the GPA earned on
non-CTE courses, the number of courses entered negatively and significantly in Table
6.7, but with a tiny coefficient (-0.0042). This reverses the sign on what we had before.
In the IV models, despite the good fit of the instruments, it appears that taking CTE is
61 The number of A-G semester coursed completed per year varies by grade, from 6.2 semester classes in
9th grade to 6.9 in 10th grade, 7.7 in 11th grade, and 7.0 in 12th grade.

90
unrelated to non-CTE GPA. 62 So it appears that the positive relationship between
overall GPA and CTE course taking is driven primarily by grades achieved in CTE
courses themselves. Overall, there is no influence of CTE coursework on the grades
earned in non-CTE courses.
iii) Conclusion
The student fixed-effect models which we estimate in this chapter suggest that
taking a CTE course does little harm to various annual measures of academic outcomes
and may in a few cases boost outcomes.
Due to a weak instruments problem, the student fixed-effect models are the most
convincing models for reading and math achievement. Conversely, the instruments
perform well in the models of absences, grade promotion, A-G (college preparatory)
classes and GPA, which tended to use bigger samples, so that here we focus on the
student fixed-effect models that additionally instrument for the number of CTE courses
taken.
Put together, the evidence suggests that taking one more CTE course is associated
with a very small drop in reading achievement, which is the sole negative finding in the
chapter. This effect is only weakly significant (at the 10% level) and as such should
perhaps best be thought of as a zero effect. We find no association with math scores. We
also find no association with the total number of A-G courses, absence rates, or the
probability of being promoted. The more favorable finding is CTE’s association with a
meaningful (0.3 point) increase in annual GPA, although this appears to be driven by
higher grades in CTE courses themselves rather than by spillovers to non-CTE courses.
We identified in the outline to this research report reading and math gains as the
confirmatory models for this work, with the other outcomes as exploratory outcomes.
We have a very small negative result for reading, and no effect for math. However, it is
noteworthy that one of our four exploratory analyses suggested some gains from taking
CTE coursework, and none suggested losses.
We also tested for variations in the effects of Tech Prep or ROP courses relative
to regular CTE courses. In a few cases, Tech Prep or ROP courses appeared to have
significantly different effects from regular CTE courses. Usually these differential
effects were small. There are three instances in which the differences were meaningful.
ROP classes were marginally more negatively related to on-time promotion than other
CTE courses. Second, in the IV model of the number of A-G courses taken there was a
large positive differential between the estimated effects for Tech Prep courses relative to
regular CTE courses. The gap was so large as to be implausible, and may reflect
idiosyncratic results for a few students. Third, Tech Prep was significantly and positively
related to non-CTE GPA, not compared to taking no Tech Prep, but compared to taking a
regular CTE course.
62 There is weak evidence that taking a Tech Prep course has a larger positive association with non-CTE
GPA than does taking a regular CTE course. But the overall effect of taking a Tech Prep course is
insignificantly different from zero, as shown in the bottom panel.

91
Table 6.1 Student-Fixed Effects Models of Gains in Reading
[1] [2] [3] [4]
# of CTE Courses -0.0035* -0.0022 -0.2009 -0.0870
[0.0020] [0.0024] [0.2493] [0.2433]
# of Tech Prep Courses
0.0002
-0.1222
[0.0035]
[0.2237]
# of ROP Courses
-0.0071*
-0.4012
[0.0039]
[0.2719]
Student Fixed Effects? Yes Yes Yes Yes
Instrumental Variables? No No Yes Yes
Number of Observations 122,993 122,993 120,496 120,496
R-squared 0.017 0.017 N/A N/A
P-Values from Tests
ROP=Tech Prep=0
0.165
0.311
CTE+Tech Prep=0
0.507
0.619
CTE+ROP=0
0.029
0.232
All 3 CTE Coursework
0.081
0.484
Coefficients Equal Zero
Test for Exclusion of Added
0.242 (CTE) 0.498 (CTE)
Instrument(s), First-Stage
Model
0.001 (TECHPREP)
0.049 (ROP)
Exclusion of Student Fixed
Effects
Hausman Test (exogeneity) 0.230 0.158
Standard errors in parentheses
* Significant at 10%; ** Significant at 5%; *** Significant at 1%

92
Table 6.2 Student-Fixed Effects Models of Gains in Math
[1] [2] [3] [4]
# of CTE Courses 0.0014 0.0036 -0.2553 -0.1964
[0.0028] [0.0034] [0.3414] [0.3798]
# of Tech Prep Courses
-0.0099**
-0.3218
[0.0048]
[0.3738]
# of ROP Courses
0.0049
-0.2684
[0.0052]
[0.3991]
Student Fixed Effects? Yes Yes Yes Yes
Instrumental Variables? No No Yes Yes
Number of Observations 120,414 120,414 117,314 117,314
R-squared 0.0124 0.0125 N/A N/A
P-Values from Tests
ROP=Tech Prep=0
0.116
0.564
CTE+Tech Prep=0
0.158
0.435
CTE+ROP=0
0.129
0.415
All 3 CTE Coursework
0.222
0.766
Coefficients Equal Zero
Test for Exclusion of Added
0.218 (CTE) 0.462 (CTE)
Instrument(s), First-Stage
Model
0.001 (TECHPREP)
0.040 (ROP)
Exclusion of Student Fixed
Effects
Hausman Test (exogeneity) 0.302 0.444
Standard errors in parentheses
* Significant at 10%; ** Significant at 5%; *** Significant at 1%
.

93
Table 6.3 Student-Fixed Effects Models of the Percentage of Time the Student was Absent
[1] [2] [3] [4]
# of CTE Courses -0.0228** -0.0099 0.9648 1.6551
[0.0099] [0.0107] [1.8648] [2.2136]
# of Tech Prep Courses
-0.0541***
-1.2432
[0.0184]
[0.9240]
# of ROP Courses
0.0157
-1.5472
[0.0189]
[1.0479]
Student Fixed Effects? Yes Yes Yes Yes
Instrumental Variables? No No Yes Yes
Number of Observations 182,766 182,766 182,724 182,724
R-squared 0.0775 0.0776 N/A N/A
P-Values from Tests
ROP=Tech Prep=0
0.014
0.125
CTE+Tech Prep=0
0.000
0.839
CTE+ROP=0
0.779
0.953
All 3 CTE Coursework
0.004
0.160
Coefficients Equal Zero
Test for Exclusion of Added
0.004 (CTE) 0.025 (CTE)
Instrument(s), First-Stage
Model
0.000 (TECHPREP)
0.000 (ROP)
Exclusion of Student Fixed
Effects
Hausman Test (exogeneity) 0.578 0.044
Standard errors in parentheses
* Significant at 10%; ** Significant at 5%; *** Significant at 1%

94
Table 6.4 Student-Fixed Effects Linear Probability Models of Whether the Student was Promoted to the Next Grade at the End of the School Year
[1] [2] [3] [4]
# of CTE Courses 0.0013*** 0.0014*** -0.0094 0.0110
[0.0004] [0.0005] [0.0205] [0.0224]
# of Tech Prep Courses
0.0016**
-0.0040
[0.0007]
[0.0247]
# of ROP Courses
-0.0022***
-0.0615*
[0.0007]
[0.0343]
Student Fixed Effects? Yes Yes Yes Yes
Instrumental Variables? No No Yes Yes
Number of Observations 182,766 182,766 182,724 182,724
R-squared 0.901 0.901 N/A N/A
P-Values from Tests
ROP=Tech Prep=0
0.002
0.072
CTE+Tech Prep=0
0.000
0.856
CTE+ROP=0
0.302
0.158
All 3 CTE Coursework
0.000
0.140
Coefficients Equal Zero
Test for Exclusion of
Added
0.004 (CTE) 0.025 (CTE)
Instrument(s), First-Stage
Model
0.000 (TECHPREP)
0.000 (ROP)
Exclusion of Student Fixed
Effects
Hausman Test
(exogeneity) 0.596 0.134
Standard errors in parentheses
* Significant at 10%; ** Significant at 5%; *** Significant at 1%

95
Table 6.5 Student-Fixed Effects Models of the Number of A-G Courses Passed
[1] [2] [3] [4]
# of CTE Courses -0.1350*** -0.1933*** 1.449 1.3014
[0.0158] [0.0178] [1.0083] [1.1115]
# of Tech Prep Courses
0.1587***
3.3843***
[0.0226]
[0.7723]
# of ROP Courses
0.0252
-0.4898
[0.0246]
[1.1660]
Student Fixed Effects? Yes Yes Yes Yes
Instrumental Variables? No No Yes Yes
Number of Observations 172,912 172,912 172,204 172,204
R-squared 0.165 0.167 N/A N/A
P-Values from Tests
ROP=Tech Prep=0
0.000
0.000
CTE+Tech Prep=0
0.152
0.001
CTE+ROP=0
0.000
0.556
All 3 CTE Coursework
0.000
0.000
Coefficients Equal Zero
Test for Exclusion of Added
0.006 (CTE) 0.044 (CTE)
Instrument(s), First-Stage
Model
0.000 (TECHPREP)
0.000 (ROP)
Exclusion of Student Fixed
Effects
Hausman Test (exogeneity) 0.172 0.001
Standard errors in parentheses
* Significant at 10%; ** Significant at 5%; *** Significant at 1%

96
Table 6.6: Student-Fixed Effects Linear Probability Models of Grade Point Average
[1] [2] [3] [4]
# of CTE Courses 0.0366*** 0.0369*** 0.3144* 0.2114
[0.0015] [0.0017] [0.1637] [0.1835]
# of Tech Prep Courses
-0.0076***
0.1524
[0.0025]
[0.1237]
# of ROP Courses
0.0073***
0.1896
[0.0026]
[0.1549]
Student Fixed Effects? Yes Yes Yes Yes
Instrumental Variables? No No Yes Yes
Number of Observations 180,736 180,736 180,670 180,670
R-squared 0.097 0.098 N/A N/A
P-Values from Tests
ROP=Tech Prep=0
0.001
0.041
CTE+Tech Prep=0
0.000
0.098
CTE+ROP=0
0.000
0.057
All 3 CTE Coursework
0.000
0.019
Coefficients Equal Zero
Test for Exclusion of Added
0.012 (CTE) 0.073 (CTE)
Instrument(s), First-Stage
Model
0.000 (TECHPREP)
0.000 (ROP)
Exclusion of Student Fixed
Effects
Hausman Test (exogeneity) 0.061 0.000
Standard errors in parentheses
* Significant at 10%; ** Significant at 5%; *** Significant at 1%

97
Table 6.7: Student-Fixed Effects Linear Probability Models of Grade Point Average (Not Including CTE courses)
[1] [2] [3] [4]
# of CTE Courses -0.0042*** -0.0036** 0.1022 0.0373
[0.0012] [0.0015] [0.1340] [0.1604]
# of Tech Prep Courses
0.0006
0.2104**
[0.0023]
[0.0972]
# of ROP Courses
-0.0030
0.1099
[0.0021]
[0.1145]
Student Fixed Effects? Yes Yes Yes Yes
Instrumental Variables? No No Yes Yes
Number of Observations 181,174 181,174 181,065 181,065
R-squared 0.085 0.085 N/A N/A
P-Values from Tests
ROP=Tech Prep=0
0.357
0.018
CTE+Tech Prep=0
0.183
0.124
CTE+ROP=0
0.002
0.378
All 3 CTE Coursework
0.002
0.008
Coefficients Equal Zero
Test for Exclusion of Added
0.004 (CTE) 0.024 (CTE)
Instrument(s), First-Stage
Model
0.000 (TECHPREP)
0.000 (ROP)
Exclusion of Student Fixed
Effects
Hausman Test (exogeneity) 0.444 0.000
Standard errors in parentheses
* Significant at 10%; ** Significant at 5%; *** Significant at 1%

98
7. Cumulative Measures of Overall Academic Progress While
in High School
Chapter 7 examines a variety of “once-only” outcomes (that is, cumulative
outcomes that we observe once per student) at the high school level.
First, for students who remain in the district, we estimate a model of the
probability that students graduate within five years of entering grade 9. (We choose five
years so that we can take into account those who might have been retained for a grade
while in high school, and thus measure their eventual outcome. The previous chapter
contains models of the probability of being promoted to the next grade on time.) Because
we focus on students who remain in the district between grades 9 and 12 (and who do not
leave for other districts), those who fail to graduate will be chiefly those whom we have
identified as having dropped out of school, or remained in school without graduating.
This is the main confirmatory analysis in this chapter. We also conduct exploratory
analyses of other important cumulative measures of academic outcomes.
Two inter-related measures of overall academic progress we model are the
probability that students complete the New Basics and the California A-G requirements
by the end of grade 12. The latter refer to the courses high school students in California
must complete to be eligible to attend either the University of California or the California
State University system.
California has implemented a requirement that all students must pass a basic test
of math and English Language Arts (ELA) known as the California High School Exit
Examination (CAHSEE) in order to receive a high school diploma. (See Zau and Betts
(2008) for a detailed study of student performance on the CAHSEE in San Diego.) We
model the probability that students pass both elements of the CAHSEE by the time they
complete grade 12. Separately we model whether students have passed the math and the
ELA components by the end of grade 12.
Finally we model cumulative GPA at the end of grade 12. Because some students
are held back a grade, and our goal here is to obtain a long-term measure of course
grades, we define this variable as cumulative GPA earned over the four-year period
starting when a student first enrolls in grade 9.
i) Analytical Approach
None of the models in this chapter can incorporate student fixed-effects as in each
case the outcome is observed only once. 63 Instead, we supplement the specifications
used in Chapter 6 by adding controls for the characteristics of students as measured in
63 An intuitive way of seeing why the student fixed-effect model cannot be estimated when there is only
one observation per student is to re-cast fixed effect models as regular OLS models that subtract the student
mean from each variable on the left-hand side and the right-hand side of the model. With only one
observation per student, once we subtract the mean of each variable from the actual value of the variable,
the result would be zero in all cases in which we had only one observation per student. This is how the
fixed-effect model gained the moniker “within estimator” – identification derives from variations within
each student’s observations over time, rather than from variation across students.

99
grade 8, just before they arrived at high school. These controls include standardized math
and English Language Arts test scores, EL and special education status, and GPA, all
measured as of grade 8. But as in the models of the preceding chapter, school and home
zip codes will be included, and standard errors will be clustered at the school level. In
cases in which students attended more than one high school between grades 9 and 12, we
use the school in which the student spent the greater amount of time (or the later period
of his/her schooling in the case of a tie among schools) for the purposes of clustering the
error term. Additionally, we include as a regressor a student behavior indicator in grade
5, if available for the given student. (Because we wish to include all students who have
arrived in the district by grade 8, if the grade 5 behavioral variable is not available we
will set it to zero, and will include a dummy variable indicating that this variable is
missing.)
As in Chapter 6 the models are estimated with and without instruments for the
CTE course variable(s). We assign course offerings based on the actual school attended
each year in the student’s career. The IV estimates assume greater importance in this
chapter than in Chapter 6, because unlike in Chapter 6 we no longer have repeated
observations that allow us to incorporate a student fixed effect. This means that the OLS
models in the present chapter are particularly vulnerable to unobserved student
heterogeneity, even though the addition of grade 8 student characteristics should reduce
this problem. By using four instruments capturing the percentage of courses that are CTE
in the student’s school in each of grades 9 through 12, we therefore abstract from this
individual heterogeneity, greatly increasing the probability that we are capturing a causal
effect. In models that also condition upon Tech Prep or ROP courses taken, we add a
quartet of instruments for each, again measuring the percentage of courses offered by the
student’s high school that were Tech Prep or ROP, for each of grades 9 through 12.
Another variation from the models of the previous chapter is that because the
outcome variable is measured at the end of grade 12, now it becomes interesting not to
condition upon the number of various types of CTE courses taken in a given year, but
upon courses taken over a student’s career in high school. More importantly, it allows us
to estimate a second specification in which we condition upon whether the student has
become a three-course concentrator in any single occupational field, instead of upon the
number of CTE courses taken. 64 Similarly, in the models that condition additionally
upon ROP and Tech Prep coursework, we condition upon whether the student has
completed any such courses, rather than the specific number. Thus there will be four
main specifications. We can think of these models as supplementary specifications of the
main models, in which we hypothesize non-linear effects of CTE course-taking.
Although we attempted to estimate the models of this chapter using probit (for the
five binary outcomes) and tobit (for censored outcomes like GPA) models, we had
trouble getting the models to converge when using instrumental variables. (We had no
trouble estimating them without instrumental variables.) This can be common in
nonlinear models like probit and tobit when trying to estimate a large number of
parameters, a situation we are in given the number of covariates and dummy variables
64 The National Assessment of Vocational Education (NAVE) (U.S. Department of Education, 2004)
defines concentrators as students who complete at least two or at least three CTE courses within a single
specific occupational cluster in the Secondary School Taxonomy (SST).

100
included in our models. To check for the sensitivity of our results to the use of linear
probability, we re-estimated each of the models using probit or tobit without instrumental
variables and compared the results to linear probability without instrumental variables,
and found the estimates to be very similar in sign and significance. Thus we can be
confident that our results are not driven by our use of linear probability models.
ii) Results
Appendix B Tables 8 and 9 show the means and standard deviations of all the
regressors in the graduation models in Table 7.1a and b, and the corresponding data for
the dependent variables used in this chapter, respectively.
Tables 7.1a to 7.8a present regression results from linear probability models for
outcomes which occur only once per student. These outcomes are graduation within five
years of beginning grade 9, completion of the New Basics and California A-G curricula,
passage of the California High School Exit Exam (overall and separately for the English
Language Arts and Math sections), and career Grade Point Average (overall and for non-
CTE courses). We will analyze each of the tables in turn below.
Unlike in Chapter 6, where we used student fixed-effects to remove much of the
unobserved student heterogeneity, in this chapter we rely on the grade 8 characteristics of
each student plus instrumental variables to remove bias. For this reason we give greater
emphasis to the IV estimates in this chapter than in Chapter 6.
Overall, our instruments appear to have good first-stage explanatory power for the
models of Chapter 7. This is particularly useful since we cannot include fixed effects to
control for unobserved, time invariant heterogeneity across students, and so IV offers a
way to overcome the selection problem into CTE course taking. An F test for the joint
significance of the instruments rejects at below the 0.04 level for every model except
those for CAHSEE, which reject instead at the 0.05 level. Although for every outcome
the first-stage model is identical (a model for the cumulative number of CTE courses
taken as a function of other covariates plus the instruments), the first-stage estimates will
differ slightly. This occurs due to differences in the sample available for each outcome
due to missing data. But because our instruments appear to have good explanatory
power, we will generally emphasize the IV results, although we still discuss the results
from OLS because comparing them to the IV can be informative.
The first (and only confirmatory) outcome we consider in this chapter is
graduation, defined as a student having received a diploma within five years of having
entered grade 9. Students who did not receive a diploma either stayed enrolled past grade
12, dropped out or transferred between districts. Dropouts are identified by the school
district as students who leave the district prior to graduation and who cannot be reliably
tracked to another location using the California student identifier. Prior to 2007-2008,
the procedure was done manually and was subject to misclassification due to the inability
to reliably track student relocation. Thus, some students who were labeled as dropouts
could potentially be inter-district transfers if their whereabouts were unknown. In our
dataset, we label students who do not show an enrollment in the district the following
year of an active enrollment as having left the district.

101
To calculate a binary outcome variable for graduation within five years, we
restrict our sample, as with the other cumulative outcomes, to students who enter grade 9
between 1998-1999 and 2004-2005 and for whom at least four years of records are
available. Thus we do not attempt to distinguish between school leavers and inter-district
transfers in the early years. Given that the school-leaving age in California is 18, the vast
majority of attrition before grade 12 will be inter-district transfers. In our model and the
sample of students with four years of records starting with grade 9, students either have
graduated within five years, or they have not. In the latter category, either students
dropped out at the end of their fourth year, are still in school after their fifth year in high
school, or, in a small number of cases, may have failed to graduate and have transferred
out of district in their fifth year. This is the cleanest dichotomy between graduate and
non-graduate status that is possible.
Table 7.1a presents the estimation results on the estimated effect of CTE course
taking on our measure of graduation. In both OLS specifications (columns (1) and (2)),
CTE course-taking is associated with a higher likelihood of graduation: each additional
course is associated with a statistically significant increase of about one percentage point.
Although Tech Prep courses do not appear to have a differential effect, ROP courses do,
with a magnitude similar to the main CTE effect. A major concern about these estimates
is that cumulative CTE courses taken is an endogenous variable, and students inclined to
take more courses may have been more likely to graduate regardless of any CTE course-
taking. Recall the finding from Table 4.5 that when students were grouped by grade 8
GPA, those with a GPA below 2 (roughly below a C average) took significantly fewer
CTE courses than students with GPA in the 2-3.49 range, and slightly more than students
with a GPA of 3.5 or above.
Columns (3) and (4) report results from the IV models for graduation. The effect
of instrumenting CTE course taking is to reverse the sign on CTE coursework relative to
OLS. Additional CTE courses are now not significantly related to the likelihood of
graduation. We conclude that although the conditional correlation between CTE
coursework is positive, when we instrument to obtain something closer to a causal effect,
the impact of CTE courses is not statistically significant.
To sum up, for our single confirmatory analysis, there is a positive conditional
correlation between CTE coursework and the probability of graduating from high school,
but the IV estimate, which is closer to a causal estimate, suggests no link.
We also note that results change in model (4) distinguishes among the effects of
regular CTE, Tech Prep and ROP courses. However, this is one of the few cases in
which the overidentification restrictions are retained at only a low level (2.5%), signaling
that the added instruments in this model may directly belong in the second stage. We
thus caution that the results in column (4) are probably not reliable. For what they are
worth, the results in model (4) suggest a negative effect of regular CTE classes and a
positive effect of ROP courses.
In Table 7.2a, we investigate how CTE course taking influences completion of the
New Basics curriculum. All our coursework variables appear insignificant in the OLS
specifications, except that ROP course taking has a marginally more positive impact than
non-ROP CTE courses. When moving to the IV models, to which we give more weight,

102
overall CTE course-work remains insignificant. However, we see a negative and
significant effect of CTE in the full model (column 4), amounting to a six percentage
point decline in the probability of completion of New Basics for each CTE course taken.
This should be interpreted as the effect of regular CTE courses that cannot be described
as either ROP or Tech Prep. ROP, however, has a positive and statistically significant
effect, relative to regular CTE courses, on the New Basics. Additional ROP courses are
predicted to lead to a ten percentage point increase in New Basics completion, and a net
effect of 4.3 percentage points. Tech Prep courses appear to have an influence similar to
regular CTE courses. Since CTE courses are not included among the New Basics, the
negative effect of regular CTE courses may reflect a crowding out of New Basics
courses, either at the school level (offering more CTE as a percent of total offerings leads
to a mechanical decline in the percent of New Basics offered) or substitution among
courses at the student level. These findings should be interpreted as differential effects of
different types of CTE courses, as we have already found in the IV model (3) that the
overall effect of taking CTE courses is insignificantly different from zero.
The effect of CTE course taking on completing the A-G course requirements, a
series of college preparatory classes, is considered in Table 7.3a. The OLS models in
columns (1) and (2) suggest a slightly negative impact of CTE overall, with ROP courses
contributing most of this effect. The overall estimated effect is about a half percentage
point reduction per completed CTE course. This is not surprising given that CTE courses
are rarely included among the A-G classification, and taking career and technical-type
classes may signal a disinclination for attending college.
The IV estimates partly confirm the results from OLS. The estimated overall
impact from CTE courses is negative and significant (at the 10 percent level), but the
magnitude is too large to be credible: every additional CTE course taken is associated
with a 9 percentage point decline in the probability of A-G completion. Column (4)
suggests no differential impact of Tech Prep and ROP. Overall, then, it appears there is
some (weak) evidence of a negative relationship between CTE and completion of the A-
G requirement.
In Table 7.4a, we look at how CTE relates to passage of both sections of the
California High School Exit Exam (CAHSEE). (Note that the sample size is smaller here
than in the earlier models. The sample reduction occurs because only students in the
graduating classes of 2006 and later were subject to the CAHSEE requirement for a high
school diploma.) Both CTE and Tech Prep are slightly positively associated with passing
both sections of the CAHSEE in the OLS specifications (columns (1) and (2)), an effect
which disappears after instrumenting for course taking (columns (3) and (4)). It is likely
that the positive association in the OLS models in columns (1) and (2) reflect
endogeneity. Again, we note that in Chapter 4 we found that students with a GPA below
a C (2.0) and above an A- (3.5 and up)in grade 8 were the least likely to take CTE
courses in high school. It is the former students who were at most risk of failing the
CAHSEE. The IV models, which remove this endogeneity by instrumenting using the
school’s CTE course offerings, suggest no effect of CTE coursework on the probability
of passing the CAHSEE.
Examining the two sections of the CAHSEE separately paints a virtually identical
picture, as is seen in Table 7.5a for English Language Arts (ELA) and Table 7.6a for

103
Math. The OLS models show a positive effect which is probably spurious: the IV models
suggest no relationship between CTE course-taking and passage of the exit exam. It is
interesting to compare this result for CAHSEE with the finding for A-G course
completion. Although CTE course takers tend to complete fewer college prep courses,
these students do equally well as others on passing CAHSEE. Since CAHSEE is pitched
at a 6th to 8th grade level in math and 10th grade level in English, this should not come as
a surprise. Also, it should be noted that CAHSEE is first taken in 10th grade, with 60%
of students passing on the first try (Zau and Betts, 2008). Since most CTE courses are
taken in 11th and 12th grade, we should not necessarily expect an effect of CTE course
taking on CAHSEE passage unless one uses OLS and ignores the possibility that initial
student achievement when entering high school jointly influences CTE course-taking and
the probability of passing the exit exam.
The estimates for the final outcome we consider in this chapter, cumulative GPA
from grade 9 for four years, appear in Table 7.7a. There is no significant relationship
between GPA and CTE course taking in either the OLS or IV specifications. This result
is somewhat different than what we found in Chapter 6 when modeling one-year GPA.
The first explanation is that the coefficient on CTE course-taking should be about one-
quarter as big in the current model: if taking a CTE course affects GPA only in the year
in which the course was taken, and supposing for example, that the student took only one
CTE course ever in high school, the effect on GPA within the grade the course was taken
would get washed out when calculating a four-year GPA. The second explanation is that
unobserved student heterogeneity may be biasing the GPA effect downward. A
comparison of the annual GPA model in Chapter 6 with and without student fixed effects
shows that the latter estimates are about half as big as when fixed effects are included.
Thus unobserved student heterogeneity may be biased the GPA effect downward. Note
that in this chapter, with only one observation per student on cumulative GPA, we cannot
use student fixed effects and so the results may be biased to zero, even when we
instrument.
As in Chapter 6, we investigate whether taking CTE had an impact on students'
cumulative GPA for non-CTE courses in order to control for the fact that grades tend to
be higher in CTE courses. Table 7.8a shows the results. The OLS models suggest a tiny
negative association between the cumulative number of CTE courses taken and
cumulative GPA. The more credible estimates in columns (3) and (4) that use the IV
model reveals no relation, consonant with the results in Table 7.7a.
Tables 7.1b to 7.8b reexamine the once-only outcomes but instead use whether or
not students became a three-course concentrator in CTE as the measure of participation in
CTE. Likewise, we also ask whether or not taking any Tech Prep and ROP course has
any effect on the outcomes.
Unfortunately, the instrumental variables do not have as much explanatory power
when modeling concentrator status as they do when modeling the number of CTE courses
taken. This fact manifests itself through p-values for excluding the instruments in the
first-stage that frequently are larger than 0.05, especially on the subsamples used to
model passage of CAHSEE, and on occasion, some improbably large coefficients in the
second stage. Thus, we feel much more confident of the preceding IV results that model
the effect of the number of CTE courses taken.

104
The results for the OLS specifications that use CTE concentrator status as an
explanatory variable, found in columns (1) and (2) of each table, are fairly similar to the
results from using number of CTE courses taken, so we will only mention the exceptions.
On the whole, the estimated effect on outcomes of becoming a concentrator is more
positive than is taking a CTE course. Becoming a concentrator is now positively
associated with completing the New Basics (in the full specification of column (2)), but
taking ROP is now insignificant. The estimated effect of CTE concentration on A-G is
now insignificant rather than negative, but having taken any Tech Prep course is a strong
negative predictor. For CAHSEE, taking ROP now positively predicts passage overall
and for both the math and ELA sections. Concentrating in CTE is now a strong positive
predictor of both overall GPA and non-CTE GPA. This effect is attenuated by taking
either Tech Prep or ROP courses, however, which are both associated with lower GPA
relative to other CTE courses. As in our earlier discussion, we do not place heavy weight
on these OLS results because of concerns about endogeneity, which we address through
IV estimates.
Our estimates for the IV models of CTE concentrators appear in columns (3) and
(4) of Tables 7.1b to 7.8b. As shown in Table 7.1.b, a similarity with our models that
instead condition on the total number of CTE courses taken is that the OLS models
suggest a positive and significant relation between becoming a CTE concentrator and the
probability of graduation, but this finding disappears once we instrument for concentrator
status. 65 For the same reasons stated earlier, we believe that the results that do not
instrument for the CTE variable are likely to be biased upward.
Apart from the graduation outcome, we find from the IV results that concentrating
in CTE is not significantly related to any of the outcomes, except for a large negative
effect on the probability of A-G completion, which is marginally significant. However,
the size of the coefficient is much too large to be credible. 66 Notice that for several of
the outcomes, concentrating in CTE has an estimated coefficient greater than one (in
absolute value); for a binary outcome, this obviously does not make sense. For some of
the models, especially passage of CAHSEE, another culprit may be the weak first-stage
fit. Our instruments are not jointly significant in predicting concentrating in CTE for any
of the CAHSEE models. This is not surprising since the sample size for CAHSEE is
about half that of the other models, due to the fact that it was instituted as a requirement
toward the middle of our sample period.
Overall, it appears that changing the definition of CTE participation does not have
very much of an effect on our results.
65 . There does appear to be a positive effect of taking any ROP courses in model (4), but the coefficient is
improbably high. 66 As with the models with number of courses taken, there are some differences across the different types of
CTE courses. Taking any Tech Prep is negatively related to A-G completion, although its coefficient is
large enough to raise some doubt as to its credibility. Taking any ROP is positively related to A-G
completion and passage of the overall CAHSEE exam, a finding which appears to be driven by increased
rates of passage on the math portion of the test (Table 7.6b). Finally, our results for CTE concentrators
confirm our previous results that there is no significant relationship between CTE and GPA (both overall
and non-CTE).

105
iii) Conclusion
In our main confirmatory analysis of cumulative high school outcomes, we find in
the IV model that CTE coursework is insignificantly related to the likelihood of
graduation. Notably, the corresponding OLS equation suggests a positive link, but this is
not a causal estimate.
Our exploratory analyses of other outcomes, when we use the IV method to
control for the endogeneity of CTE course-taking suggested some negative effects on the
completion of the A-G courses required for students to become eligible to attend either of
California’s public university systems, but no effects of CTE coursework on passage of
the California High School Exit Exam or career GPA (overall or for non-CTE courses).
We find that concentrator status is insignificant in almost all of these models as well.
A few notable differences among the various types of CTE courses emerged. In
the IV model for completing the New Basics curriculum, there is a negative estimated
effect from taking regular CTE courses, but taking ROP courses had no overall effect.
One potential explanation for these differences is that capstone (ROP) course takers have
higher average cumulative GPAs and a slightly higher on time graduation rate than other
students.

106
Table 7.1a Linear Probability Models of Graduation within Five Years of Entering Grade 9, in Terms of CTE Courses Taken: Classes of 2002 through 2009
[1] [2] [3] [4]
# of CTE Courses 0.0126*** 0.0078*** -0.0344 -0.0347**
[0.0015] [0.0010] [0.0200] [0.0146]
# of Tech Prep Courses
0.0013
0.0313
[0.0015]
[0.0337]
# of ROP Courses
0.0136***
0.0798***
[0.0029]
[0.0218]
Instrumental Variables? No No Yes Yes
Number of Observations 44,397 44,397 42,347 42,347
R-squared 0.299 0.303 N/A N/A
P-Values from Tests
ROP=Tech Prep=0
<0.001
<0.001
CTE+Tech Prep=0
<0.001
0.922
CTE+ROP=0
<0.001
0.018
All 3 CTE Coursework
<0.001
<0.001
Coefficients Equal Zero
Test for Exclusion of Added
0.015 (CTE) <0.001 (CTE)
Instrument(s), First-Stage
Model
<0.001 (TECHPREP)
<0.001 (ROP)
Exclusion of Student Fixed
Effects
Hausman Test (exogeneity)
0.025 0.011
Over Identification Test 0.229 0.025
Standard errors in parentheses
* Significant at 10%; ** Significant at 5%; *** Significant at 1%

107
Table 7.2a Linear Probability Models of Completion of the New Basics Curriculum by the End of Grade 12, in Terms of CTE Courses Taken: Classes of 2002 through 2009
[1] [2] [3] [4]
# of CTE Courses 0.0000 -0.0019 -0.0333 -0.0577**
[0.0015] [0.0018] [0.0235] [0.0238]
# of Tech Prep Courses
0.0013
-0.0109
[0.0022]
[0.0428]
# of ROP Courses
0.0045*
0.1006***
[0.0025] [0.0359]
Instrumental Variables? No No Yes Yes
Number of Observations 41,128 41,128 39,994 39,994
R-squared 0.310 0.310 N/A N/A
P-Values from Tests
ROP=Tech Prep=0
0.031
0.002
CTE+Tech Prep=0
0.847
0.175
CTE+ROP=0
0.181
0.214
All 3 CTE Coursework
0.033
0.004
Coefficients Equal Zero
Test for Exclusion of Added
0.037 (CTE) <0.001 (CTE)
Instrument(s), First-Stage
Model
<0.001 (TECHPREP)
<0.001 (ROP)
Exclusion of Student Fixed
Effects
Hausman Test (exogeneity)
0.148 0.024
Over Identification Test 0.375 0.271
Standard errors in parentheses
* Significant at 10%; ** Significant at 5%; *** Significant at 1%

108
Table 7.3a Linear Probability Models of Completion of the A-G Course Requirements by the End of Grade 12, in Terms of CTE Courses Taken: Classes of 2002 through 2009
[1] [2] [3] [4]
# of CTE Courses -0.0057*** -0.0034** -0.0877* -0.0434
[0.0015] [0.0016] [0.0509] [0.0361]
# of Tech Prep Courses
-0.0023
-0.0111
[0.0024]
[0.0527]
# of ROP Courses
-0.0050**
0.0308
[0.0024]
[0.0433]
Instrumental Variables? No No Yes Yes
Number of Observations 44,069 44,069 42,090 42,090
R-squared 0.295 0.296 N/A N/A
P-Values from Tests
ROP=Tech Prep=0
0.039
0.753
CTE+Tech Prep=0
0.013
0.329
CTE+ROP=0
0.007
0.772
All 3 CTE Coursework
0.002
0.614
Coefficients Equal Zero
Test for Exclusion of Added
0.027 (CTE) <0.001 (CTE)
Instrument(s), First-Stage
Model
<0.001 (TECHPREP)
<0.001 (ROP)
Exclusion of Student Fixed
Effects
Hausman Test (exogeneity)
0.013 0.555
Over Identification Test 0.212 0.471
Standard errors in parentheses
* Significant at 10%; ** Significant at 5%; *** Significant at 1%
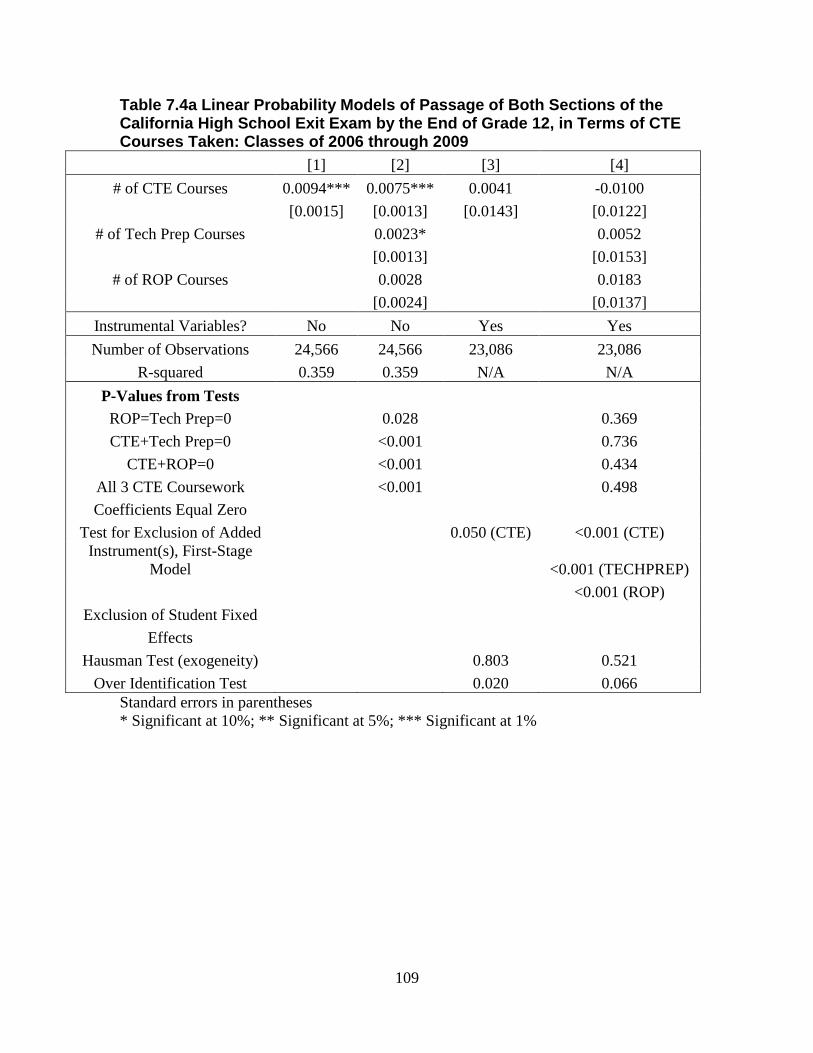
109
Table 7.4a Linear Probability Models of Passage of Both Sections of the California High School Exit Exam by the End of Grade 12, in Terms of CTE Courses Taken: Classes of 2006 through 2009
[1] [2] [3] [4]
# of CTE Courses 0.0094*** 0.0075*** 0.0041 -0.0100
[0.0015] [0.0013] [0.0143] [0.0122]
# of Tech Prep Courses
0.0023*
0.0052
[0.0013]
[0.0153]
# of ROP Courses
0.0028
0.0183
[0.0024]
[0.0137]
Instrumental Variables? No No Yes Yes
Number of Observations 24,566 24,566 23,086 23,086
R-squared 0.359 0.359 N/A N/A
P-Values from Tests
ROP=Tech Prep=0
0.028
0.369
CTE+Tech Prep=0
<0.001
0.736
CTE+ROP=0
<0.001
0.434
All 3 CTE Coursework
<0.001
0.498
Coefficients Equal Zero
Test for Exclusion of Added
0.050 (CTE) <0.001 (CTE)
Instrument(s), First-Stage
Model
<0.001 (TECHPREP)
<0.001 (ROP)
Exclusion of Student Fixed
Effects
Hausman Test (exogeneity)
0.803 0.521
Over Identification Test 0.020 0.066
Standard errors in parentheses
* Significant at 10%; ** Significant at 5%; *** Significant at 1%

110
Table 7.5a Linear Probability Models of Passage of the English Language Arts Section of the California High School Exit Exam by the End of Grade 12, in Terms of CTE Courses Taken: Classes of 2006 through 2009
[1] [2] [3] [4]
# of CTE Courses 0.0076*** 0.0064*** 0.0129 -0.0001
[0.0013] [0.0012] [0.0127] [0.0087]
# of Tech Prep Courses
0.0025**
0.0061
[0.0012]
[0.0138]
# of ROP Courses
0.0009
0.0049
[0.0022]
[0.0105]
Instrumental Variables? No No Yes Yes
Number of Observations 24,566 24,566 23,086 23,086
R-squared 0.322 0.323 N/A N/A
P-Values from Tests
ROP=Tech Prep=0
0.048
0.767
CTE+Tech Prep=0
<0.001
0.619
CTE+ROP=0
0.006
0.634
All 3 CTE Coursework
<0.001
0.715
Coefficients Equal Zero
Test for Exclusion of Added
0.050 (CTE) <0.001 (CTE)
Instrument(s), First-Stage
Model
<0.001 (TECHPREP)
<0.001 (ROP)
Exclusion of Student Fixed
Effects
Hausman Test (exogeneity)
0.573 0.937
Over Identification Test 0.042 0.131
Standard errors in parentheses
* Significant at 10%; ** Significant at 5%; *** Significant at 1%

111
Table 7.6a Linear Probability Models of Passage of the Math Section of the California High School Exit Exam by the End of Grade 12, in Terms of CTE Courses Taken: Classes of 2006 through 2009
[1] [2] [3] [4]
# of CTE Courses 0.0073*** 0.0050*** 0.0039 -0.0109
[0.0010] [0.0011] [0.0145] [0.0120]
# of Tech Prep Courses
0.0022*
0.0063
[0.0011]
[0.0118]
# of ROP Courses
0.0043**
0.0191
[0.0017]
[0.0132]
Instrumental Variables? No No Yes Yes
Number of Observations 24,566 24,566 23,086 23,086
R-squared 0.300 0.301 N/A N/A
P-Values from Tests
ROP=Tech Prep=0
0.006
0.284
CTE+Tech Prep=0
<0.001
0.684
CTE+ROP=0
<0.001
0.435
All 3 CTE Coursework
<0.001
0.361
Coefficients Equal Zero
Test for Exclusion of Added
0.050 (CTE) <0.001 (CTE)
Instrument(s), First-Stage
Model
<0.001 (TECHPREP)
<0.001 (ROP)
Exclusion of Student Fixed
Effects
Hausman Test (exogeneity)
0.894 0.547
Over Identification Test 0.044 0.049
Standard errors in parentheses
* Significant at 10%; ** Significant at 5%; *** Significant at 1%

112
Table 7.7a Models of Cumulative GPA Four Years after Starting Grade 9, in Terms of CTE Courses Taken: Students Beginning Grade 9 in Fall 1998 through Fall 2005
[1] [2] [3] [4]
# of CTE Courses 0.0014 0.0027 -0.0236 -0.0206
[0.0019] [0.0020] [0.0221] [0.0187]
# of Tech Prep Courses
-0.0051
0.0540
[0.0031]
[0.0361]
# of ROP Courses
0.0008
0.0119
[0.0030]
[0.0178]
Instrumental Variables? No No Yes Yes
Number of Observations 44,397 44,397 42,347 42,347
R-squared 0.517 0.518 N/A N/A
P-Values from Tests
ROP=Tech Prep=0
0.286
0.162
CTE+Tech Prep=0
0.379
0.226
CTE+ROP=0
0.348
0.722
All 3 CTE Coursework
0.418
0.286
Coefficients Equal Zero
Test for Exclusion of Added
0.015 (CTE) <0.001 (CTE)
Instrument(s), First-Stage Model
<0.001 (TECHPREP)
<0.001 (ROP)
Exclusion of Student Fixed
Effects
Hausman Test (exogeneity)
0.280 0.118
Over Identification Test 0.441 0.159
Standard errors in parentheses
* Significant at 10%; ** Significant at 5%; *** Significant at 1%

113
Table 7.8a Models of Cumulative GPA for non-CTE Courses Four Years after Starting Grade 9, in Terms of CTE Courses Taken: Students Beginning Grade 9 in Fall 1998 through Fall 2005
[1] [2] [3] [4]
# of CTE Courses -0.0103*** -0.0091*** -0.0260 -0.0234
[0.0025] [0.0022] [0.0222] [0.0187]
# of Tech Prep Courses
-0.0002
0.0472
[0.0032]
[0.0327]
# of ROP Courses
-0.0035
0.0169
[0.0035]
[0.0169]
Instrumental Variables? No No Yes Yes
Number of Observations 44,397 44,397 42,347 42,347
R-squared 0.506 0.506 N/A N/A
P-Values from Tests
ROP=Tech Prep=0
0.617
0.127
CTE+Tech Prep=0
0.005
0.348
CTE+ROP=0
0.008
0.784
All 3 CTE Coursework
0.001
0.248
Coefficients Equal Zero
Test for Exclusion of Added
0.015 (CTE) <0.001 (CTE)
Instrument(s), First-Stage
Model
<0.001 (TECHPREP)
<0.001 (ROP)
Exclusion of Student Fixed
Effects
Hausman Test (exogeneity)
0.505 0.049
Over Identification Test 0.411 0.175
Standard errors in parentheses
* Significant at 10%; ** Significant at 5%; *** Significant at 1%
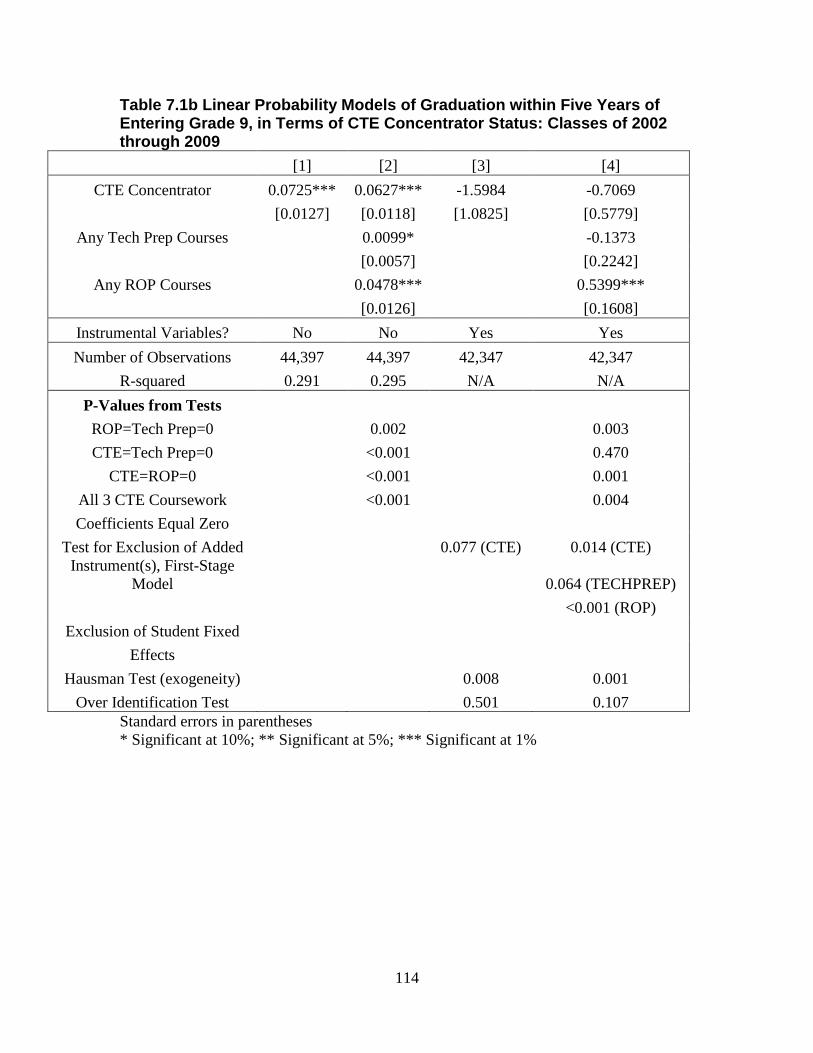
114
Table 7.1b Linear Probability Models of Graduation within Five Years of Entering Grade 9, in Terms of CTE Concentrator Status: Classes of 2002 through 2009
[1] [2] [3] [4]
CTE Concentrator 0.0725*** 0.0627*** -1.5984 -0.7069
[0.0127] [0.0118] [1.0825] [0.5779]
Any Tech Prep Courses
0.0099*
-0.1373
[0.0057]
[0.2242]
Any ROP Courses
0.0478***
0.5399***
[0.0126]
[0.1608]
Instrumental Variables? No No Yes Yes
Number of Observations 44,397 44,397 42,347 42,347
R-squared 0.291 0.295 N/A N/A
P-Values from Tests
ROP=Tech Prep=0
0.002
0.003
CTE=Tech Prep=0
<0.001
0.470
CTE=ROP=0
<0.001
0.001
All 3 CTE Coursework
<0.001
0.004
Coefficients Equal Zero
Test for Exclusion of Added
0.077 (CTE) 0.014 (CTE)
Instrument(s), First-Stage
Model
0.064 (TECHPREP)
<0.001 (ROP)
Exclusion of Student Fixed
Effects
Hausman Test (exogeneity)
0.008 0.001
Over Identification Test 0.501 0.107
Standard errors in parentheses
* Significant at 10%; ** Significant at 5%; *** Significant at 1%

115
Table 7.2b Linear Probability Models of Completion of the New Basics Curriculum by the End of Grade 12, in Terms of CTE Concentrator Status: Classes of 2002 through 2009
[1] [2] [3] [4]
CTE Concentrator 0.0153* 0.0150** -0.9747 -0.8182
[0.0078] [0.0071] [0.9252] [0.5770]
Any Tech Prep Courses
-0.0080
-0.2844
[0.0071]
[0.2520]
Any ROP Courses
0.0075
0.5256**
[0.0073]
[0.2108]
Instrumental Variables? No No Yes Yes
Number of Observations 41,128 41,128 39,994 39,994
R-squared 0.310 0.310 N/A N/A
P-Values from Tests
ROP=Tech Prep=0
0.476
0.029
CTE=Tech Prep=0
0.013
0.235
CTE=ROP=0
0.101
0.027
All 3 CTE Coursework
0.015
0.049
Coefficients Equal Zero
Test for Exclusion of Added
0.066 (CTE) 0.035 (CTE)
Instrument(s), First-Stage
Model
0.382 (TECHPREP)
<0.001 (ROP)
Exclusion of Student Fixed
Effects
Hausman Test (exogeneity)
0.191 0.017
Over Identification Test 0.491 0.712
Standard errors in parentheses
* Significant at 10%; ** Significant at 5%; *** Significant at 1%
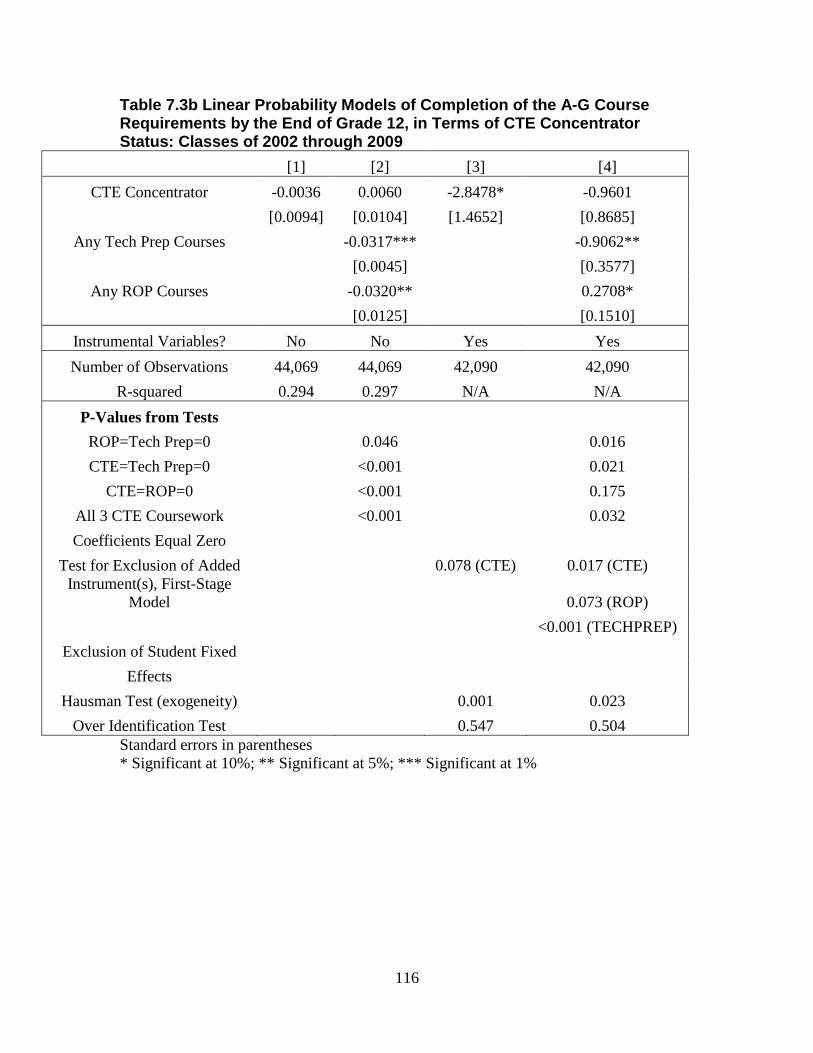
116
Table 7.3b Linear Probability Models of Completion of the A-G Course Requirements by the End of Grade 12, in Terms of CTE Concentrator Status: Classes of 2002 through 2009
[1] [2] [3] [4]
CTE Concentrator -0.0036 0.0060 -2.8478* -0.9601
[0.0094] [0.0104] [1.4652] [0.8685]
Any Tech Prep Courses
-0.0317***
-0.9062**
[0.0045]
[0.3577]
Any ROP Courses
-0.0320**
0.2708*
[0.0125]
[0.1510]
Instrumental Variables? No No Yes Yes
Number of Observations 44,069 44,069 42,090 42,090
R-squared 0.294 0.297 N/A N/A
P-Values from Tests
ROP=Tech Prep=0
0.046
0.016
CTE=Tech Prep=0
<0.001
0.021
CTE=ROP=0
<0.001
0.175
All 3 CTE Coursework
<0.001
0.032
Coefficients Equal Zero
Test for Exclusion of Added
0.078 (CTE) 0.017 (CTE)
Instrument(s), First-Stage
Model
0.073 (ROP)
<0.001 (TECHPREP)
Exclusion of Student Fixed
Effects
Hausman Test (exogeneity)
0.001 0.023
Over Identification Test 0.547 0.504
Standard errors in parentheses
* Significant at 10%; ** Significant at 5%; *** Significant at 1%

117
Table 7.4b Linear Probability Models of Passage of Both Sections of the California High School Exit Exam by the End of Grade 12, in Terms of CTE Concentrator Status: Classes of 2006 through 2009
[1] [2] [3] [4]
CTE Concentrator 0.0300*** 0.0233** 0.5966 -0.2453
[0.0095] [0.0091] [0.6132] [0.3505]
Any Tech Prep Courses
0.0146***
-0.2444
[0.0048]
[0.1731]
Any ROP Courses
0.0231***
0.2238*
[0.0083]
[0.1344]
Instrumental Variables? No No Yes Yes
Number of Observations 24,566 24,566 23,086 23,086
R-squared 0.351 0.353 N/A N/A
P-Values from Tests
ROP=Tech Prep=0
0.001
0.248
CTE=Tech Prep=0
0.003
0.364
CTE=ROP=0
0.013
0.239
All 3 CTE Coursework
0.002
0.406
Coefficients Equal Zero
Test for Exclusion of Added
0.701 (CTE) 0.343 (CTE)
Instrument(s), First-Stage
Model
<0.001 (TECHPREP)
<0.001 (ROP)
Exclusion of Student Fixed
Effects
Hausman Test (exogeneity)
0.178 0.255
Over Identification Test 0.051 0.163
Standard errors in parentheses
* Significant at 10%; ** Significant at 5%; *** Significant at 1%

118
Table 7.5b Linear Probability Models of Passage of the English Language Arts Section of the California High School Exit Exam by the End of Grade 12, in Terms of CTE Concentrator Status: Classes of 2006 through 2009
[1] [2] [3] [4]
CTE Concentrator 0.0242*** 0.0187** 0.7929 -0.0017
[0.0081] [0.0076] [0.6988] [0.1892]
Any Tech Prep Courses
0.0135***
-0.1002
[0.0040]
[0.1178]
Any ROP Courses
0.0173**
0.1218
[0.0077]
[0.0985]
Instrumental Variables? No No Yes Yes
Number of Observations 24,566 24,566 23,086 23,086
R-squared 0.315 0.317 N/A N/A
P-Values from Tests
ROP=Tech Prep=0
0.002
0.463
CTE=Tech Prep=0
0.001
0.572
CTE=ROP=0
0.029
0.308
All 3 CTE Coursework
0.002
0.496
Coefficients Equal Zero
Test for Exclusion of Added
0.701 (CTE) 0.343 (CTE)
Instrument(s), First-Stage
Model
<0.001 (TECHPREP)
<0.001 (ROP)
Exclusion of Student Fixed
Effects
Hausman Test (exogeneity)
0.020 0.447
Over Identification Test 0.237 0.202
Standard errors in parentheses
* Significant at 10%; ** Significant at 5%; *** Significant at 1%

119
Table 7.6b Linear Probability Models of Passage of the Math Section of the California High School Exit Exam by the End of Grade 12, in Terms of CTE Concentrator Status: Classes of 2006 through 2009
[1] [2] [3] [4]
CTE Concentrator 0.0244*** 0.0179** 0.3835 -0.3121
[0.0078] [0.0078] [0.4970] [0.3526]
Any Tech Prep Courses
0.0119***
-0.2234
[0.0037]
[0.1392]
Any ROP Courses
0.0242***
0.2358**
[0.0066]
[0.1197]
Instrumental Variables? No No Yes Yes
Number of Observations 24,566 24,566 23,086 23,086
R-squared 0.294 0.297 N/A N/A
P-Values from Tests
ROP=Tech Prep=0
<0.001
0.143
CTE=Tech Prep=0
0.002
0.273
CTE=ROP=0
0.002
0.135
All 3 CTE Coursework
<0.001
0.257
Coefficients Equal Zero
Test for Exclusion of Added
0.701 (CTE) 0.343 (CTE)
Instrument(s), First-Stage
Model
<0.001 (TECHPREP)
<0.001 (ROP)
Exclusion of Student Fixed
Effects
Hausman Test (exogeneity)
0.387 0.167
Over Identification Test 0.078 0.127
Standard errors in parentheses
* Significant at 10%; ** Significant at 5%; *** Significant at 1%

120
Table 7.7b Models of Cumulative GPA Four Years after Starting Grade 9, in Terms of CTE Concentrator Status: Students Beginning Grade 9 in Fall 1998 through Fall 2005
[1] [2] [3] [4]
CTE Concentrator 0.1060*** 0.1140*** -0.9073 -0.5162
[0.0145] [0.0133] [0.8118] [0.5806]
Any Tech Prep Courses
-0.0318***
0.0353
[0.0075]
[0.2124]
Any ROP Courses
-0.0206
0.1761
[0.0130]
[0.1433]
Instrumental Variables? No No Yes Yes
Number of Observations 44,397 44,397 42,347 42,347
R-squared 0.520 0.521 N/A N/A
P-Values from Tests
ROP=Tech Prep=0
<0.001
0.463
CTE=Tech Prep=0
<0.001
0.620
CTE=ROP=0
<0.001
0.467
All 3 CTE Coursework
<0.001
0.666
Coefficients Equal Zero
Test for Exclusion of Added
0.077 (CTE) 0.014 (CTE)
Instrument(s), First-Stage
Model
0.064 (TECHPREP)
<0.001 (ROP)
Exclusion of Student Fixed
Effects
Hausman Test (exogeneity)
0.067 0.193
Over Identification Test 0.616 0.208
Standard errors in parentheses
* Significant at 10%; ** Significant at 5%; *** Significant at 1%

121
Table 7.8b Models of Cumulative GPA for non-CTE Courses Four Years after Starting Grade 9, in Terms of CTE Concentrator Status: Students Beginning Grade 9 in Fall 1998 through Fall 2005
[1] [2] [3] [4]
CTE Concentrator 0.0310** 0.0453*** -1.0086 -0.5562
[0.0152] [0.0129] [0.8373] [0.5875]
Any Tech Prep Courses
-0.0474***
-0.025
[0.00785]
[0.2210]
Any ROP Courses
-0.0464***
0.1901
[0.0152]
[0.1377]
Instrumental Variables? No No Yes Yes
Number of Observations 44,397 44,397 42,347 42,347
R-squared 0.503 0.507 N/A N/A
P-Values from Tests
ROP=Tech Prep=0
<0.001
0.385
CTE=Tech Prep=0
<0.001
0.612
CTE=ROP=0
<0.001
0.385
All 3 CTE Coursework
<0.001
0.592
Coefficients Equal Zero
Test for Exclusion of Added
0.077 (CTE) 0.014 (CTE)
Instrument(s), First-Stage Model
0.064 (TECHPREP)
<0.001 (ROP)
Exclusion of Student Fixed
Effects
Hausman Test (exogeneity)
0.070 0.110
Over Identification Test 0.632 0.192
Standard errors in parentheses
* Significant at 10%; ** Significant at 5%; *** Significant at 1%

122
Part IV – The Relation between Career
and Technical Education and
Postsecondary Academic Outcomes

123
8. Postsecondary Outcomes
A key policy question related to CTE is whether it influences postsecondary
enrollment and attainment, that is, the probability that students proceed to postsecondary
studies after graduating from high school, and the highest degree students earn. Because
CTE is occupationally oriented, one might surmise that students who take considerable
CTE coursework in high school make the transition from school to work relatively
quickly after high school. Countering this tendency, though, is the increasing skill
content in many occupations, especially those related to computer technology. In
addition, students who take Tech Prep courses while in high school are eligible for
community college credit on those courses. This may encourage them to enroll in
community college after finishing high school to round out their training.
Using the merged SDUSD and National Student Clearinghouse (NSC) data, this
chapter examines numerous postsecondary enrollment and attainment outcomes and how
they relate to CTE course taking. As in Chapter 3, we model one-time outcomes in this
chapter, and cannot use student fixed effects. Therefore, as in Chapter 3, we condition on
the same set of grade 8 student characteristics, and attempt most models twice, with and
without the use of instrumental variables.
The NSC has provided data on postsecondary enrollment and degrees through the
Fall of 2009. With our cohorts in the classes of 2002 through 2008, we are able to obtain
anywhere from one to a full seven years of postsecondary outcomes, depending on the
cohort. 67 The NSC collects data from postsecondary institutions representing 92% of
postsecondary students in the United States. We report a list of the handful of small
California institutions that did not participate, and estimates of their annual enrollment
numbers in Appendix C Table 20.
Because we have one cohort with 7 years of post-graduation NSC data, one cohort
with 6 years of post-graduation NSC data, and so on, we need to consider how best to
combine the cohorts. We approach this issue in three different ways. Because the chance
of a student completing a Bachelor’s degree increases with the number of years since
high school graduation, we pool the graduating classes of 2002 through 2005, who by
spring 2009 are four through seven years out from high school graduation. We use this
sample to model the highest level of education achieved within four years of graduating
from high school and the highest level of institution at which the student enrolled during
this time. In addition, we study postsecondary enrollment patterns in the first year after
graduating from high school for the high school classes in 2002 through 2008. In other
models, we continue to focus on the classes of 2002 through 2008 and study the highest
postsecondary outcome. In this case, we add controls for the number of years that each
cohort is beyond high school. This last approach increases the number of cohorts under
67 Our use of the term “cohort” differs somewhat from our use of the term in earlier chapters. In those
chapters, we studied students entering grade 9 in year X and inferred which school year during which they
would be expected to graduate if they progressed normally. In the present chapter, because we want to
model postsecondary outcomes as a function of the time since students have graduated from high school,
for the most part we instead define cohorts based on the year in which they graduated.

124
study but is somewhat problematic in that the outcome is measured anywhere from one to
seven years after high school graduation.
As in Chapter 3, we condition student outcomes on individual students’
characteristics in grade 8 and on an average across years of the student’s high school and
English and math teachers’ characteristics. We cluster standard errors at the level of the
high school that the student attended most of the time, as explained earlier.
We first provide details on the association between postsecondary outcomes and
the number and type of CTE courses taken, focusing on postsecondary enrollment, and
then on postsecondary attainment. A later section in the chapter repeats these analyses,
but instead focuses on the association between postsecondary outcomes and CTE
concentrator status.
i) Postsecondary Outcomes as a Function of the Number and Type of CTE
Courses Taken
i-a) Postsecondary Enrollment as a Function of the Number and Type of CTE
Courses Taken
Using Ordinary Least Squares (OLS) we model whether the student enrolled in
any postsecondary institution the first year after graduating from high school. For
comparison, we also model whether the student has ever enrolled in any postsecondary
institution by 2009. In the latter model we control for the number of years since high
school graduation.
In both cases we also estimate ordered probit models for the highest level of
educational institution in which one enrolled in the first year, or in any year up to 2009.
Ordered probit results display the marginal effects of each CTE variable on the
probability of each level of educational institution in which the student enrolls.
The samples for all four of these models are the graduating cohorts of 2002
through 2008 inclusive. Appendix C Table 1 reports the means and standard deviations
of all CTE regressors for this sample.
In addition, to obtain a sense of postsecondary persistence, we also model the
number of years in the first four years since high school graduation during which the
student enrolls in postsecondary education. For this model we study the cohorts of 2002
through 2005. Appendix C Table 2 reports the means and standard deviations of all CTE
regressors for this sample, which is a subsample of that reported in Appendix C Table 1.
Appendix C Table 5 shows the distribution of the dependent variable for all
models in the chapter.
We recognize that the models which estimate the probability of a binary outcome,
such as the event of postsecondary enrollment, are better estimated by a probit model
than a linear one. Since our estimates were unable to achieve convergence when
instrumenting for endogenous regressors in a probit framework, we report linear versions
of these models along with Two-Stage Least Squares estimates. The corresponding probit
models for each outcome are presented for comparison. We find the marginal effects
estimated in the probit models closely resemble the linear estimates reported within this
chapter.

125
Postsecondary Enrollment in the First Year after High School or by 2009
Tables 8.1a and 8.2a show estimates of the relation between the probability of a
high school graduate enrolling in any postsecondary institution within one year of
graduating from high school and measures of CTE coursework, using probit and linear
probability (OLS) models respectively. (The first pair of columns in Table 8.2a shows
the OLS versions of the linear probability model and the second pair shows the IV
versions of the same specifications.) Column 1 of both Tables 8.1a and 8.2a suggest no
significant relationship between the number of CTE courses taken and the probability of
enrolling within one year. Although the coefficient is negative, not much weight should
be put on the estimated “effect” of taking one CTE course, namely, a drop in the
probability of postsecondary enrollment of about 0.1 percent. The 95% confidence
interval suggests a range of coefficients that is always very small.
In column 2 of both tables we add measures of the number of ROP and Tech Prep
CTE classes taken. The only coefficient that is significant is the number of Tech Prep
classes taken. The coefficient is negative suggesting that Tech Prep classes had a less
positive effect than other CTE courses. To obtain the overall estimated effect of one
Tech Prep class, we add together the CTE and Tech Prep coefficients, because a Tech
Prep class is itself a CTE class, and find small negative overall estimated effects on the
probability of postsecondary enrollment. The bottom of Table 8.2a shows that the p-
value for a test that the sum of these two coefficients is zero is roughly 0.01. The overall
relation between taking one Tech Prep class and postsecondary enrollment is thus
negative and almost significant at the 1% level. This result is somewhat surprising
because CTE courses that are Tech Prep earn students community college credit, which
one might think would encourage students to enroll at least in community college. Note
that the test that all three CTE coefficients are jointly insignificant retains the null
hypothesis with a p-value of 0.0735.
Columns 3 and 4 of Table 8.2a show the corresponding IV results. Because we
have four instruments -- measures of CTE course availability in each of grades 9 through
12 -- we have more instruments than the minimum needed to ensure identification. In
this case we can test whether the overidentification restrictions are satisfied: for the
instruments to be valid, it must be the case that the only way they affect the second-stage
outcome variable (postsecondary enrollment) is through their influence on CTE course-
taking. The overidentification test shows that the IV’s do not belong in the second stage
model. Additionally, the first-stage fit is quite good, indicating these instruments have
good explanatory power for CTE course-taking. The instruments’ explanatory power is
shown by the p-values on tests for exclusion of the IVs in the first stage.
The most notable difference between the OLS and IV results is that in the IV
model the coefficient on the number of CTE courses taken becomes positive and slightly
significant (at the 10% level), suggesting that a student who takes one CTE course
increases his or her probability of enrolling in postsecondary education within a year of
graduating from high school by about 2.4 percent. This estimate is closer than the OLS
estimate to estimating a true causal effect. Perhaps the OLS results show no relation
because this effect is swamped by the (endogenous) tendency of some students based on

126
their intrinsic interests and motivation to take CTE coursework and not to attend college.
The instruments abstract from any such personal variations because they reflect changes
in CTE courses taken by students in response to changes in school course offerings on a
year-to-year basis. Another, but less important difference in the IV results is that the
expanded model that differentiates between regular CTE, ROP and Tech Prep classes
shows no difference between Tech Prep and regular CTE courses. As with the OLS
models, when we add three measures of CTE coursework, they are jointly insignificant.
This may reflect collinearity among these explanatory variables.
To capture students who postpone college education for whatever reason, we
repeat the models of Tables 8.1a and 8.2a allowing students more time after high school
to enroll. We use enrollment of high school graduates in any postsecondary institution by
Fall 2009 as the outcome. Because this particular outcome allows more time for older
cohorts to enroll, we add cohort dummies to control for time since high school
graduation. Appendix C Tables 6 and 7 report the results for the probit and linear
probability models of postsecondary enrollment by 2009, respectively. For the most part,
these results are very similar to the models of enrollment within one year of high school.
Unlike the models for enrollment within one year of high school graduation, however, we
no longer find any statistically significant relation between taking a Tech Prep class and
postsecondary enrollment in the probit and OLS models. Once we instrument for CTE
coursework, we again have a positive effect of an additional CTE course on the
probability of postsecondary enrollment, this time by about 1.6 percent, although this
estimate is not statistically significant. The IV models also suggest no differences in the
impact of regular CTE, Tech Prep and ROP courses.
The Highest Level of Postsecondary Institution in which a Student Enrolls
Tables 8.3a and 8.4a report ordered probit and linear models of students’ highest
level of postsecondary enrollment within one year after graduating high school: no
enrollment, enrollment at a 2-year institution or enrollment at a 4-year institution. These
levels correspond to dependent variable values of 0, 1 or 2, respectively. Table 8.3a
reports the marginal effects of an additional course on the probability of each level of
enrollment. Table 8.4a reports the linear coefficient estimates for the number of courses
where the discrete level of postsecondary institution is the dependent variable.
In the first two columns of Table 8.3a, we see that the relationships between all
types of CTE coursework and the probability of no postsecondary enrollment is positive
and significant at the 1% level. The overall effect of an additional Tech Prep course is an
estimated increase of about 1% in the probability of no enrollment within one year of
high school. (The overall predicted effect is the sum of the marginal effects for one CTE
course and one Tech Prep course, because Tech Prep is a specific type of CTE course.)
The overall effect of an ROP course is slightly less. The corresponding relationships to
the probability of enrollment at a 2-year institution are positive, but much smaller in
magnitude. Given the small number of observations in this category, standard errors
could not be calculated and thus these results should be treated with caution. On the other
hand, columns 5 and 6 show that for the probability of enrollment at a 4-year institution,

127
there is a significant and negative relationship between enrollment and all types of CTE
coursework.
The OLS estimates in the first two columns of Table 8.4a show linear probability
models of the same relationship. They show similar correlations to those in Table 8.3a.
For instance, on average, there is a significant negative relation between an additional
CTE course and the highest level of postsecondary institution in which a student enrolls
within one year after high school.
None of the relationships shown in Table 8.3a or in the OLS results in the first
two columns of Table 8.4a should be interpreted causally as students who plan to attend
4-year institutions may be less likely to take CTE courses for reasons that have nothing to
do with the impact of CTE coursework itself. Similarly, students not planning for a
college education may be more likely to complete career-oriented CTE courses.
In a bid to come closer to estimating the causal effect of taking more CTE
courses, we instrument for the endogenous nature of taking CTE courses in columns 3
and 4 of Table 8.4a. Our overidentification tests here retain the null that the instrumental
variables do not belong in the second-stage model. Column 3 shows a positive, though
weakly significant effect, of roughly 0.04 for a CTE course on the level of enrollment one
year after high school. In column 4, we see an overall positive and significant effect of
almost 0.09 for a Tech Prep course on enrollment level. The estimated overall effect for
an ROP course is negative here, though not statistically significant. The IV results for
this model are interesting, as they suggest positive effects for CTE in general and
specifically for Tech Prep courses on students’ enrollment levels whereas the correlations
found in the OLS and ordered probit models were negative and significant. We find no
significant difference between the impacts of Tech Prep and regular CTE courses, a by
now familiar finding, which is somewhat surprising if one believes that offering high
school students community college credit, as is the case with Tech Prep classes, might
encourage more students to attend postsecondary institutions.
Appendix C Tables 8 and 9 repeat the previous models of highest enrollment level
after high school, this time looking at the highest level of enrollment by Fall 2009.
Comparing Table 8 from Appendix C to Table 8.3a, we see quite similar results. The
signs of the marginal effects of various CTE coursework measures on each enrollment
level remain the same, and the levels of significance are similar. The magnitudes of the
effects on the probabilities of no enrollment and enrollment at a 4-year institution are
generally slightly smaller in absolute value, and the effect on two-year enrollment rises
somewhat.
Table 9 in Appendix C is analogous to Table 8.4a, as both tables use linear
probability models, but the former uses instead the highest level of postsecondary
enrollment by 2009 as the outcome. A key difference here is the IV model of column 3
no longer shows significance for the effect of an additional CTE course on the level of
postsecondary enrollment. This loss of significance is the result of a smaller coefficient
estimate than that of Table 8.4a, since the standard errors are nearly identical between the
two. Again, the magnitudes of most estimates here diminish slightly when using all of
the cohorts who had graduated by 2008.
128
Number of Years Enrolled in the First Four Years after High School
We also examine the relation between CTE coursework and the number of years
in the first four years after graduating from high school in which students are enrolled at a
postsecondary institution. Table 8.5a presents estimated marginal effects of CTE courses
on years of enrollment from an ordered probit. An additional CTE course has the
positive and significant association with the probability of 0, 1 and 2 years of enrollment
out of the first four years after high school, with 0.36, 0.09 and 0.04 percent predicted
increases, respectively. Conversely, a CTE course is associated with a decrease in the
probability of 3 or 4 years of enrollment out of the first four years after high school. We
estimate a CTE course being associated with a 0.49 percent decrease in the probability of
being enrolled at a postsecondary institution all four years.
The association of a Tech Prep course on years of enrollment follows the same
patterns of sign and significance as that of a CTE course, with the magnitudes being
slightly greater than those of a CTE course. However, none of these differences between
regular CTE and Tech Prep classes is significant.
As before, we re-estimate this model using a linear probability (OLS) approach.
Column 1 of Table 8.6a suggests taking a CTE course is associated with a decline of
about 0.013 years of enrollment in the first four after high school. In column 2, a Tech
Prep course is associated with about a 0.023 decline in the number of years of enrollment,
significant at almost the 1% level. We find no significant relation between an ROP
course and years of enrollment.
Because none of these estimates is necessarily causal, it is important to look at the
IV results as well. In column 3 of Table 8.6a, the IV version of this model yields a larger
and, notably, a positive effect of a CTE course on years of enrollment. Here, we now
find an additional CTE course will increase the number of years of enrollment in the first
four after high school by about 0.12. This estimate is significant at the 5% level. The
model that adds ROP and Tech Prep variables yields insignificant coefficients on those
variables as well a decrease in the significance of overall CTE courses, which again, is
likely due to collinearity between CTE courses and these two subsamples of CTE
courses.
i-b) Postsecondary Attainment as a Function of the Number and Type of CTE
Courses Taken
This section examines the ultimate level of educational attainment of
students, as opposed to their enrollment. There are two logical approaches to modeling
outcomes such as “highest degree attained”. The first, which fits with the work described
above, is to model the highest postsecondary level of attainment conditional upon high
school graduation. The second is instead to model the highest level of education attained
for students at 8 years after beginning grade 9, four years after their expected high school
graduation. In this way, we widen the sample and allow for all outcomes from high
school dropout to four-year college graduate to be included. We use both approaches
below. In the former models, the levels of educational attainment are high school,
attended community college, obtained an Associate’s degree, attended a four-year college

129
or university, and obtained a Bachelor’s or higher degree. We note that there is some
ambiguity whether a person with an Associate’s degree should be considered to have
obtained more or less education than a person who has attended a four-year college but
has not yet obtained a Bachelor’s degree.
A related question involves whether students who begin in two-year colleges
transfer to four-year colleges and universities. The national community college system
cites preparing students to transfer to Bachelor’s degree programs as one of its diverse
goals. This “transfer function” is particularly important in California, where the Master
Plan for Postsecondary Education--passed into law in 1960--explicitly mandates
community colleges to prepare students for eventual transfer to the California State and
University of California systems. Indeed, in a study of California’s education system,
Betts (2000) notes that one of the most striking differences between the postsecondary
systems of California and the nation as a whole was the relatively large size of
California’s community college enrollment. This reflects the stipulation in the California
Master Plan that many of the states’ aspiring college graduates should obtain Bachelor’s
degrees by completing two years of study in community college followed by two years in
state universities. To study this question, for the subsample of high school graduates who
enroll in community college, we model the probability that students transfer to a four-
year college or university.
Highest Level of Educational Attainment
Table 8.7a presents an ordered probit model of student’s highest level of
educational attainment four years after high school, in terms of the number of CTE, Tech
Prep and ROP courses taken. Our sample in this model is restricted to students graduating
from high school in the years 2002 through 2005 inclusive. Highest level of educational
attainment is an ordered variable such that the integer values 0 through 4 correspond to
high school graduate, some schooling at a 2-year institution, a 2-year degree, some
schooling at a 4-year institution and a 4-year degree, respectively.
As with the enrollment level outcomes, in the models that do not use an IV
approach we find an overall negative relation between CTE coursework and level of
educational attainment. Marginal effects of an additional CTE course for each level of
attainment are shown in the columns of Table 8.7a. (Results for a second specification
that adds the number of Tech Prep and ROP courses are also shown.) An additional CTE
course is associated with about 0.7 and 0.3 percent increases in the probabilities of a high
school diploma or some 2-year schooling being the student’s respective highest level of
educational attainment. There are corresponding decreases of 0.02 percent, 0.6 percent
and 0.32 percent in the respective probabilities of a 2-year degree, some 4-year schooling
and a 4-year degree. These estimates are significant at the 1% level. ROP courses have
similar predicted effects to regular CTE courses. The magnitudes of the overall Tech
Prep estimates are roughly double that for regular CTE courses, and each of these
differences from the effect of a regular CTE course is statistically significant. An
additional Tech Prep course is associated with about a 1.0 percent increase in the
probability of attaining only a high school diploma and about a 0.5 percent decrease in
the probability of attaining a 4-year degree.

130
Table 8.8a presents both OLS and IV linear models for the highest level of
educational attainment. In columns 1 and 2, the overall linear effects of CTE courses on
the ordered level of educational attainment are presented. Here the directions and
significance levels of the relationships between various types of CTE courses and the
level of educational attainment from Table 8.7a are repeated.
The IV models of columns 3 and 4, however, show no statistical significance for
the effects of CTE courses on the level of educational attainment. The third column of
8.8a suggests that on average a CTE course raises the level of attainment, ranging from 0
to 4 as described above, by about 0.07, but this result is not statistically significant.
Again, when we add Tech Prep and ROP indicators, neither they nor the original CTE
variable are significant, which could be an indication of collinearity. We cannot say with
any precision whether the effects of Tech Prep and ROP courses differ significantly from
the effects of regular CTE courses. The sign of the overall effect of a Tech Prep course is
now positive but insignificant, while that of an ROP course is still negative but no longer
significant. The tests for exclusion of the instruments and the overidentification test yield
p-values that suggest our first-stage fit is good and the instruments do not belong in the
second-stage model. These IV results suggest there is no significant variation in the
effects of different types of CTE courses, and that there is no significant link between
regular CTE courses and postsecondary attainment.
Appendix C Tables 10 and 11 repeat the models of Tables 8.7a and 8.8a, now
including students who do not complete high school. This adds one more level of
educational attainment--some high school--increasing the range of the dependent variable
to 0 through 5. (Since not all students in these models graduate from high school, we
group cohorts by the year they start 9th grade.) When including high school dropouts in
the estimation sample, none of the types of CTE courses are found to have significant
relationships with the level of educational attainment in the ordered probit models. The
signs of the estimates for CTE and Tech Prep for each of the attainment levels are similar
to those in the models for only high school graduates. The ROP coefficients often change
in sign in this larger sample but are never statistically significant. In the IV model of
column 3 in Appendix C Table 11, we find a weakly significant increase of roughly 0.07
in the level of educational attainment for each CTE course taken. This reverses a weakly
significant negative effect in the corresponding OLS model in the table. This is similar to
the results in Table 8.8a except that the IV result becomes significant in the larger sample
in Appendix C Table 11. The IV results suggest that there are no differences between
regular CTE, Tech Prep and ROP courses, but collinearity is again a concern.
Likelihood of Transfer from a 2-Year to a 4-Year Institution
For these analyses, we restrict the estimation sample to students who attend a 2-
year institution within 2 years of graduating high school. The OLS models in columns 1
and 2 of Table 8.10a suggest that taking a CTE course is associated with a 0.4 percent
decrease in the probability of transfer for such students. Taking an ROP course is
associated with roughly a 0.8 percent decrease in the probability of transfer (which can be
seen by adding the CTE and ROP coefficients). These estimates are significant at the 5%
level. Taking a Tech Prep class has a statistically identical effect to taking a regular CTE
131
class. The probit marginal effect estimates in Table 8.9a yield similar results. These
correlations are small, but consistent with the overall patterns of CTE and postsecondary
outcomes in this chapter. Given the occupational focus of ROP classes, it seems intuitive
that students who take ROP courses are somewhat less likely to attend a 4-year
institution.
In columns 3 and 4 of Table 8.10a, we instrument for CTE coursework to account
for endogeneity. The test for exclusion of the IVs in the first-stage for column 3 reports a
p-value of almost 0.06, suggesting the IVs may not be particularly good at predicting
CTE course taking for the rather small and self-selected estimation sample used in this
model. The first-stage fit in column 4, however, does look much stronger. Additionally,
the overidentification test very strongly retains the null that the IVs do not belong in the
second-stage model. Both IV models show no statistically significant effect of any type
of CTE course. This suggests CTE courses have little or no causal effect on the likelihood
of transferring from a 2-year institution to a 4-year institution.
ii)Postsecondary Outcomes as a Function of CTE Concentrator Status
ii-a) Postsecondary Enrollment as a Function of CTE Concentrator Status
Postsecondary Enrollment in the First Year after High School or by 2009
Tables 8.1b and 8.2b show models that characterize CTE coursework in terms of
concentrator status and whether students have taken any ROP or Tech Prep classes. The
probit marginal effects of 8.1b coincide with the OLS estimates in 8.2b and suggest a
positive relation between becoming a three-course concentrator and postsecondary
enrollment in the first year after high school, but the relationship is only very weakly
significant in the model of the first column. Column 2 suggests that ROP coursework
does not predict postsecondary enrollment, and taking any Tech Prep courses is
negatively associated with postsecondary enrollment.
The IV estimates in columns 3 and 4 of Table 8.2b suggest no relationship
between concentrator status and postsecondary enrollment in the first year after high
school. Although the first-stage tests of column 4 suggest the instruments have
reasonably good explanatory power, the large standard errors on all of the CTE variables
in the second stage suggest otherwise. Part of the problem may arise from the exclusion
restrictions – in column 3 the overidentification test that the IVs do not belong in the
second stage is retained, but weakly. Given the size of the standard errors in the IV
models, we cannot state with any authority whether becoming a concentrator has no
causal effect. This finding that the instruments produce less precise estimates of the
impact of concentrator status than they do for the number of CTE courses taken will re-
appear throughout the tables in this section of the chapter.
Appendix C Tables 12 and 13 repeat the models of Tables 8.1b and 8.2b, this time
modeling any postsecondary enrollment by Fall 2009. The probit estimates show no
statistically significant relationship between concentrator status and ever enrolling in a
postsecondary institution after graduating from high school, while the OLS estimates are
positive and only weakly significant. This differs from the slightly more positive and
more significant association between being a CTE concentrator and postsecondary

132
enrollment within one year after high school. It appears that although CTE concentrators
may be more likely to enroll within that first year, this effect is less prevalent given more
time after graduating high school.
As in Table 8.2b, the IV results show no significant effect of concentrator status
or having taken Tech Prep or ROP courses on the probability of postsecondary
enrollment by 2009. In column 3 of Appendix C Table 13, we see the overidentification
test that the IVs do not belong in the second stage is retained more strongly this time. As
before, however, the large standard errors present in this model prohibit us from inferring
with confidence that becoming a CTE concentrator has no causal effect on postsecondary
enrollment.
Since CTE course content varies greatly across fields, the estimated CTE
concentrator effects should be thought of as averages of concentrator effects across
categories of CTE courses. To get a sense of how different types of CTE course
concentrations contribute to these average effects, we repeat various models using
indicators for concentration in each of the top four CTE cluster categories as the variables
of interest. We do this for both 2-course and 3-course concentration in each of the four
most popular clusters at San Diego Unified, based on the percent of students achieving
concentrator status in those fields. Table 8.1c repeats the model of postsecondary
enrollment within one year after high school, this time looking at the effect of
concentrating in each of the top four CTE clusters. We show separate estimates that
define concentrators first as those taking two or courses in a given CTE cluster, and then
show a specification that uses three-course concentrators.
In the final column, we see that the two clusters with independently significant
three-course concentrator effects at the 5% level are the Computer and Information
Sciences (CIS) and Construction clusters. Three-course concentration in the Computer
and Information Science cluster is associated with over a 9 percent increase in the
probability of enrollment in the first year while three-course concentration in
Construction is associated with roughly a 7 percent decrease. When we instead look at 2-
course concentration in these clusters, we find slightly smaller associations for the
Computer and Information Science and Construction clusters with postsecondary
enrollment in the first year. At the same time, course concentration in Communication
Design becomes a significant positive predictor of enrollment in postsecondary
education. Perhaps completing several courses in the Computer and Information Science
cluster significantly increases the likelihood of pursuing careers in this field, which tend
to require postsecondary education at the entry level. A similar effect could be at work in
the opposite direction for the Construction cluster, as the returns to postsecondary
education may be relatively smaller in this field. There is a weakly significant relation
between postsecondary enrollment in the first year and two-course concentration in
Business Support. On average, there is no significant relation between enrollment in the
first year and concentrating in a cluster outside of the top four clusters.

133
The Highest Level of Postsecondary Institution in which a Student Enrolls
Next, we investigate the relationship between becoming a CTE concentrator and
the level of postsecondary institution in which students enroll. Tables 8.3b and 8.4b look
at postsecondary enrollment levels in the first year using CTE concentrator status and
indicators for whether or not the student has taken any Tech Prep or ROP courses as the
variables of interest.
We find no significant effect of being a concentrator of CTE or a concentrator
who has taken any ROP classes on enrollment level after high school. (The latter result
can be seen by the p-value on a test that the sum of the two coefficients is zero in the
bottom panel of the table.) There is a negative association between being a concentrator
who has taken some Tech Prep and the enrollment level after high school, significant at
almost the 1% level. Setting aside whether the student becomes a concentrator, these
models suggest a negative relation between taking any Tech Prep or ROP course and the
probability of enrolling in a four-year college. The OLS estimates in the first two
columns of Table 8.4b coincide with the estimated effects of 8.3b. Again, we remind the
reader that such models that do not use the IV approach are suggestive of correlations but
not necessarily causal links.
The IV models of columns 3 and 4 in 8.4b yield no effects that are statistically
different from zero. The overidentification test for the model without indicators for any
Tech Prep or ROP coursework retains the null that the IVs do not belong in the model,
but not very strongly with a p-value of 0.1487. Although the first-stage fit for these IV
models is decent, the large standard errors in the second stage prevent us from making
definitive causal interpretations from these results.
Table 14 in Appendix C duplicates Table 8.3b, instead using enrollment level by
2009 as the outcome. We see similar sign and significance patterns here as in 8.3b. The
OLS and IV versions of this model are presented in Appendix C Table 15. Comparing
them to Table 8.4b we still find no significant concentrator effects on postsecondary
enrollment levels, even when including the maximum number of cohorts possible.
Negative associations between taking Tech Prep or ROP courses and postsecondary
enrollment continue to appear in the OLS model, but do not appear in the 2SLs model.
Table 8.3c examines highest level of postsecondary institution in which a student
enrolls in terms of CTE concentrator cluster. 3-course concentration in Computer and
Information Science is associated with about a 7 percent increase in the likelihood of
enrolling at a 4-year postsecondary institution, a nearly symmetric decrease in the
likelihood of no enrollment and a small 0.16 percent decrease in the likelihood of
enrollment at a 2-year institution. But these results are only marginally significant.
Estimates for 2-course concentration in Computer and Information Science are roughly
one-half that of 3-course concentration, but are highly significant at the 1% level. Two-
course and three-course concentration in the Construction cluster are significantly
associated with lower enrollment levels. Students who concentrate in the Construction
cluster are roughly 11% less likely to enroll at a 4-year institution their first year after
high school. There appears to be a negative relationship between concentrating at the
two-course level outside of the top four clusters and postsecondary enrollment level. The
overall positive association of 2-course concentration in Communication Design with

134
enrollment, which we saw in Table 8.1c, appears to derive from a roughly 2 percent
increase in the probability of enrollment at a 4-year institution within the first year after
high school. These marginal effects, however, are not significant below the 10% level.
The relation between 3-course concentration in Communication Design and highest level
of enrollment in the first year is not statistically significant.
Number of Years Enrolled in First Four Years after High School
Tables 8.5b and 8.6b repeat the models of 8.5a and 8.6a, respectively, instead
looking at the effect of concentrator status and taking any Tech Prep or ROP courses. As
with the other enrollment outcomes that do not use instrumental variables, we find no
statistically significant effect of being a concentrator on the number of years of
postsecondary enrollment after high school. The IV model in column 3 of Table 8.6b
reports a weakly significant effect of CTE concentration on years of enrollment.
However, the high first-stage exclusion test p-value and large standard error and
coefficient estimate downplay the credibility of these results. Taking any Tech Prep is
associated with lower number of years of enrollment, but is insignificant in the IV model.
The effects of taking any Tech Prep courses reflect the associations of a Tech Prep course
found in the course count models above. The magnitudes for Tech Prep are larger here
since this model captures the average effect of taking Tech Prep courses in general rather
than the effect of one additional Tech Prep course.
Table 8.5c is broken into two tables. Table 8.5c-1 presents predicted marginal
effects of 2-course concentration in the top four CTE clusters on the number of years of
the first four after high school in which a student enrolls at a postsecondary institution.
Table 8.5c-2 repeats the model, but for 3-course concentration. The negative association
of concentration in the Construction cluster with postsecondary enrollment is again
significant here within the 5% level. Two-course concentrators in Construction are about
7 percent less likely to enroll during all of four years after likely and are about 5 percent
more likely not to enroll at all. Three-course concentrators of Construction are about 13
percent less likely to enroll during all of the four years, but are roughly 9 percent more
likely to not enroll during that time. Concentration in the Computer and Information
Science cluster exhibits a positive relation with the probability of being enrolled for three
or four years in the first four years after high school. Two-course concentrators in this
cluster are about 5 percent more likely to enroll all four years and just under 4 percent
less likely to not enroll at all. These estimates for three-course concentration are very
similar, being about 0.1 percent greater in magnitude, respectively. Although the relations
between concentrations in Communication Design and years of enrollment are similar to
those found with other enrollment outcomes, these estimates in 8.5c are never significant
beyond the 10% level. Again, because these estimates do not use instrumental variables,
these relations should be thought of as correlational rather than causal.

135
ii-b) Postsecondary Attainment as a Function of CTE Concentrator Status
Highest Level of Educational Attainment
Next, we look at students’ highest level of educational attainment in terms of CTE
concentrator status and whether or not students have taken any Tech Prep or ROP
courses. In general, none of the specifications for these models show a significant
relationship between being a CTE concentrator and the level of educational attainment.
Similar to the patterns in Table 8.7a, we find an overall negative association between
taking any Tech Prep or ROP courses and attainment level in Table 8.7b. Being both a
concentrator and taking some Tech Prep is associated with lower level of educational
attainment. This effect is significant at the 1% level, but most of the magnitude and
significance of this effect is attributed to taking any Tech Prep rather than being a CTE
concentrator. The IV model in column 3 of Table 8.8b shows a very large positive but
only weakly significant effect of being a concentrator on the level of educational
attainment. Once we add indicators for having taken any Tech Prep or ROP, however,
column 4 yields no statistically significant effects of being a CTE concentrator of taking
any Tech Prep or ROP courses on the level of educational attainment. As with the other
models employing concentrator measures, the large standard errors for the IV models
discount the certainty with which we draw causal inference from these estimates.
Appendix C Tables 16 and 17 repeat these models of educational attainment level
in terms of CTE concentrator status, but include students who do not complete high
school. The ordered probit and OLS models maintain negative and significant
associations between taking any Tech Prep and the level of educational attainment. There
is no significant relation between taking any ROP or being a CTE concentrator and
educational attainment in any of the specifications. As in Table 8.8b, the IV model in
column 3 of Appendix C Table 17 shows a very large, positive and significant effect of
CTE concentration on attainment level, though the first stage fit of this IV model is not
very good. The model in column 4 suggests no significant relation between any of the
CTE measures and postsecondary attainment. Once again, however, we note that the
standard errors are very big and refrain from drawing conclusive inference from these
results.
Tables 8.7c-1 and 8.7c-2 look at highest level of educational attainment in terms
of being a 2-course or 3-course concentrator in each of the top four CTE clusters. We
find the association between 3-course concentration in the Construction cluster and
educational attainment is statistically significant at the 1% level. Three-course
Construction concentrators are about 10 percent more likely to have no postsecondary
education and about 5 percent less likely to receive a 4-year degree than non-
concentrators, four years after graduating from high school. Being a 2-course
Construction concentrator has similar, but smaller associations with the probabilities of
each attainment level, also significant at the 1% level. Two-course concentrators in
Communication Design appear to be slightly more likely to reach each of the
postsecondary attainment models, but the effects are significant only at the 10% level.
Appendix C Tables 18 and 19 repeat the previous two tables, this time including
students who do not complete high school. Appendix C Table 18 shows positive
associations between 2-course concentration in both the Communication Design and

136
Computer and Information Science clusters and educational attainment with significance
of at least 5%. As with the models using only high school graduates, we still see a strong
negative relationship between 2-course concentration in the Construction cluster and the
level of educational attainment. For 3-course concentrators, patterns are very similar to
those in Table 8.7.c-2 with a significant pattern emerging only for Construction.
Likelihood of Transfer from a 2-Year to a 4-Year Institution
Table 8.10b repeats the models of Table 8.10a, using concentrator status. Being a
CTE concentrator does not appear to have any statistically significant association with
transferring to a 4-year institution. Taking any ROP courses is associated with about a 4
percent decline in the probability of transfer, significant at the 1% level. This is an
expectedly larger effect than that of one ROP course in Table 8.10a since the average
number of ROP courses taken is greater than one. The probit model in column 2 of Table
8.9b agrees with this estimate, showing a significant decrease in the likelihood of transfer
by almost 5 percent. The IV models in Table 8.10b present no significant effects on the
likelihood of transfer, although again we note the large standard errors prevent us from
putting much confidence in these estimates.
Table 8.9c uses a probit model to estimate the marginal effects of concentrating in
any of the top four CTE clusters on the likelihood of transferring. Three-course
concentration in the Construction cluster is associated with about a 34 percent decrease in
the probability of transferring, implying that these students often need some additional
coursework at community college but enter their chosen profession without transferring
to a four-year college. Two-course concentration in the Computer and Information
Science cluster is associated with a roughly 8 percent increase in the likelihood of
transferring, but for unknown reasons this pattern does not recur for three-course
concentrations. While these concentration field tables shed light on how the associations
between CTE coursework and postsecondary outcomes vary by field, their estimates
should not be interpreted as causal. Students determined to forgo a 4-year degree and
enter the labor market after high school may enroll in construction CTE courses more
often than other students. On the other hand, some would-be college students may
develop an interest in construction through the CTE program and decide against a 4-year
degree. Again, the IV results from Tables 8.10a and 8.10b suggest there is no measurable
causal effect of CTE courses on the likelihood of transferring to a 4-year college.
iii) Conclusion
We set out in this chapter to conduct one confirmatory analysis in the domain of
postsecondary enrollment and one in the domain of postsecondary attainment. For
enrollment, the confirmatory analysis to which we pre-committed was a model of the
number of years of postsecondary enrollment in the first four years after high school
graduation. As shown in Table 8.6a, the instrumental variable model, which attempts to
estimate the causal effect of taking additional CTE courses, suggests that taking one
137
additional CTE course in high school leads to an increase of 0.12 years of postsecondary
enrollment.
For postsecondary attainment, our confirmatory model comes from Table 8.8a,
where the IV model suggests no significant link to the highest level of attainment four
years after graduating from high school.
Notably, the IV models produced far more positive results than the models that
did not take the possible endogeneity of CTE coursework into account. For both of the
outcomes listed above, models that merely controlled for student characteristics in grade
8 found significant negative associations between the number of CTE courses taken and
both years enrolled in postsecondary education and the highest level of postsecondary
attainment.
This pattern of negative conditional correlations between CTE courses taken and
a variety of measures of postsecondary outcomes, but of positive or zero relations
resulting once we instrumented for CTE coursework, also occurred for many of our
exploratory models of postsecondary enrollment and attainment. One obvious
interpretation of this pattern is that unobserved factors such as students’ interests and
motivation induce some high school students both to enroll in high school CTE courses
and to enroll less in postsecondary institutions. This likely causes the correlation
between CTE coursework and postsecondary success to be negative. The instrumental
variable approach instead uses variation from year to year in CTE course offerings at the
student’s high school to identify the effect of taking more CTE courses on postsecondary
outcomes. To the extent that this source of variation is not related to the unobserved
factors that endogenously determine CTE and postsecondary enrollment, we would
expect a bigger, more positive result to emerge.
We tested for differences between regular CTE courses, ROP courses, and Tech
Prep courses. We hypothesized that ROP courses, also known as capstone courses, might
have a different influence on postsecondary outcomes, but in general we found no
differences. Although ROP courses are specific to California, the issue of Tech Prep
courses is likely to be of wider interest, because these courses that earn students credit at
community college are used across the nation. Our analyses that were of a more
correlational nature often found that taking a Tech Prep class had a more negative effect
on postsecondary enrollment and attainment than did taking a regular CTE course.
However, in the IV models we typically found that Tech Prep classes had about the same
effect as regular CTE courses. Even with the finding of “no difference” emanating from
the more convincing IV models, this result is somewhat surprising. We had hypothesized
that technical high school courses that also garnered students community college credit
would spur interest in postsecondary studies. Our results suggest that this may be so, but
Tech Prep classes seem to generate interest in postsecondary education to about the same
extent as regular CTE courses.
Some of the more interesting exploratory analyses in the chapter involve the
relation between becoming a CTE concentrator and postsecondary outcomes. Mostly due
to the limited variation in the CTE concentrator variable, the instrumental variable
approach was not as effective in controlling for endogeneity when this was our
explanatory variable. The non-IV models suggest no link between concentrator status

138
and the number of years of postsecondary education in which students enroll. As for our
main attainment measure, again no significant relationship emerged with concentrator
status, although in this model some evidence emerged of negative relations between
taking any ROP or Tech Prep classes and highest level of educational attainment. (There
was some weak evidence that CTE concentrators might be slightly more likely to enroll
in a postsecondary institution in the first year after graduating from high school but this
pattern disappears when examining enrollment over longer time frames.)
As a further analysis, we subdivided CTE concentrators by cluster, and found
some evidence that cross-cutting patterns among occupational areas may be hidden by the
overall findings of little linkage between CTE concentrator status and postsecondary
outcomes. For instance two- and three-course concentrators in Computer Information
Sciences were significantly more likely to enroll for all of the first four years after high
school, while those with a concentration in Construction during high school were
significantly more likely to enroll for one or two years or not enroll at all, but much less
likely to enroll in postsecondary institutions in each of the four years after high school
graduation. These should be thought of as conditional correlations, but they are
nonetheless enlightening about the heterogeneity in CTE education.

139
Table 8.1a Probit Models of Whether High School Graduates Enroll in Any Postsecondary Institution within One Year of Graduating from High School, in Terms of CTE Courses Taken: High School Graduates from 2002 through 2008
dp/dx dp/dx
# of CTE Courses -0.0018 -0.0007
[0.0011] [0.0015]
# of Tech Prep Courses
-0.0046**
[0.0023]
# of ROP Courses
0.0009
[0.0020]
Number of Observations 33381 33381
R-squared 0.1472 0.1473
P-Values from Tests
ROP=Tech Prep=0
0.1259
CTE + Tech Prep=0
0.0011
CTE + ROP=0
0.9210
All 3 CTE Coefficients = 0
0.0092
Notes: Standard errors in parentheses are clustered at the school level. *significant at 10%; ** significant at 5%; *** significant at 1% Average marginal effects of independent variables reported. Marginal effects are estimated around the mean number of CTE courses taken in the estimation sample

140
Table 8.2a Linear Probability Models of Whether High School Graduates Enroll in Any Postsecondary Institution within One Year of Graduating from High School, in Terms of CTE Courses Taken: High School Graduates from 2002 through 2008
OLS OLS 2SLS 2SLS
# of CTE Courses -0.00095 0.000165 0.0242* 0.0181
[0.00103] [0.00140] [0.0126] [0.0130]
# of Tech Prep Courses
-0.00455*
0.0218
[0.00226]
[0.0303]
# of ROP Courses
0.000601
-0.0225
[0.00181]
[0.0150]
Instrumental Variables? No No Yes Yes
Number of Observations 33382 33382 32868 32868
R-squared 0.174 0.174 0.147 0.152
P-Values from Tests ROP=Tech Prep=0
0.146
0.322
CTE + Tech Prep=0
0.0102
0.13
CTE + ROP=0
0.725
0.832
All 3 CTE Coefficients = 0
0.0735
0.154
Test for Exclusion of Added IVs (First-Stage Model) CTE
0.0105 <0.001
Tech Prep
<0.001
ROP
<0.001
Hausman Test (exogeneity)
0.0059 0.0679
Overidentification Test
0.5918 0.8482 Notes: Standard errors in parentheses are clustered at the school level. *significant at 10%; ** significant at 5%; *** significant at 1%
Instruments are percentage of courses offered in each of grades 9th – 12th within school and year which are CTE, Tech Prep or ROP.

141
Table 8.3a Ordered Probit Models of Highest Level of Educational Institution in Which a Student Enrolled Within One Year of Graduating from High School, in Terms of CTE Courses Taken: High School Graduates from 2002 through 2008
No Enrollment 2-year Institution 4-year Institution
# of CTE Courses 0.0074*** 0.0049*** 0.0002 0.00012 -0.0076*** -0.0050***
[0.0014] [0.0016] [0.00065] [.] [0.0013] [0.00168]
# of Tech Prep Courses
0.0052**
0.00013
-0.0053**
[0.0022]
[.]
[0.00220]
# of ROP Courses
0.0033
0.00008
-0.0033
[0.0020]
[.]
[0.00207]
Number of Observations 33382 33382 33382 33382 33382 33382
R-squared 0.1679 0.1682 0.1679 0.1682 0.1679 0.1682
P-Values from Tests ROP=Tech Prep=0
0.009
0.009
0.009
CTE + Tech Prep=0
<0.001
<0.001
<0.001
CTE + ROP=0
0.0019
0.0019
0.0019
All 3 CTE Coefficients = 0
<0.001
<0.001
<0.001
Notes: Standard errors in brackets are clustered at the school level. * significant at 10%; ** significant at 5%; *** significant at 1% Average marginal effects of independent variables on the probability of each incremental level of enrollment reported. Marginal effects are estimated around the mean number of CTE courses taken in the estimation sample. The table shows results from two separate models, one that conditions upon CTE concentrator status and a second model that additionally includes indicators for whether students have taken any ROP or Tech Prep classes.
Note: Standard errors could be calculated for the two-year institutions due to the relatively small number of students in this group.

142
Table 8.4a Linear Models of Highest Level of Educational Institution in Which a Student Enrolled Within One Year of Graduating from High School, in Terms of CTE Courses Taken: High School Graduates from 2002 through 2008
OLS OLS 2SLS 2SLS
# of CTE Courses -0.0131*** -0.00834*** 0.0351* 0.033
[0.00233] [0.00286] [0.0185] [0.0202]
# of Tech Prep Courses
-0.00956**
0.0531
[0.00402]
[0.0446]
# of ROP Courses
-0.00650*
-0.0763***
[0.00382]
[0.0247]
Instrumental Variables? No No Yes Yes
Number of Observations 33382 33382 32868 32868
R-squared 0.308 0.309 0.275 0.272
P-Values from Tests ROP=Tech Prep=0
0.0129
0.00668
CTE + Tech Prep=0
<0.001
0.0369
CTE + ROP=0
0.0045
0.134
All 3 CTE Coefficients = 0
<0.001
0.0131
Test for Exclusion of Added IVs
(First-Stage Model) CTE
0.0105 <0.001
Tech Prep
<0.001
ROP
<0.001
Hausman Test (exogeneity)
<0.001 0.00431
Overidentification Test
0.5782 0.5866 Notes: Standard errors in brackets are clustered at the school level. * significant at 10%; ** significant at 5%; *** significant at 1%
Instruments are percentage of courses offered in each of grades 9th – 12th within school and year which are CTE, Tech Prep or ROP.

143
Table 8.5a Ordered Probit Models of Number of Years in the First Four Years after High School Graduation During Which the Student Enrolls in Postsecondary Education, in Terms of CTE Courses Taken: High School Graduates from 2002 through 2005
No Enrollment 1/4 Years Enrollment
2/4 Years Enrollment
3/4 Years Enrollment
4/4 Years Enrollment
# of CTE Courses 0.0036*** 0.0027* 0.0009*** 0.0006* 0.00044*** 0.0003 -0.00002** -0.000016 -0.0049*** -0.0036*
[0.00131] [0.00159] [0.00031] [0.00038] [0.00016] [0.00020] [0.00001] [0.00001] [0.00178] [0.00216]
# of Tech Prep Courses
0.0032
0.0008
0.0004
-0.000020
-0.0043
[0.00251]
[0.00059]
[0.00030]
[0.000015]
[0.00338]
# of ROP Courses
0.0007
0.0002
0.0001
-4.29e-06
-0.0009
[0.00178]
[0.00042]
[0.00022]
[0.00001]
[0.00241]
Number of Observations 18412 18412 18412 18412 18412 18412 18412 18412 18412 18412
R-squared 0.1143 0.1144 0.1143 0.1144 0.1143 0.1144 0.1143 0.1144 0.1143 0.1144
P-Values from Tests ROP=Tech Prep=0
0.2486
0.2486
0.2486
0.2486
0.2486
CTE + Tech Prep=0
0.0012
0.0012
0.0012
0.0012
0.0012
CTE + ROP=0
0.2092
0.2092
0.2092
0.2092
0.2092
All 3 CTE Coefficients=0
<0.001
<0.001
<0.001
<0.001
<0.001
Notes: Standard errors in brackets are clustered at the school level. * significant at 10%; ** significant at 5%; *** significant at 1% Average marginal effects of independent variables on each incremental level of enrollment reported. Marginal effects are estimated around the mean number of CTE courses taken in the estimation sample. The table shows results from two separate models, one that conditions upon CTE concentrator status and a second model that additionally includes indicators for whether students have taken any ROP or Tech Prep classes.

144
Table 8.6a Linear Models of Number of Years in the First Four Years after High School Graduation During Which the Student Enrolls in Postsecondary Education, in Terms of CTE Courses Taken: High School Graduates from 2002 through 2005
OLS OLS 2SLS 2SLS
# of CTE Courses -0.0127** -0.00807 0.119** 0.0930*
[0.00559] [0.00696] [0.0557] [0.0543]
# of Tech Prep Courses
-0.0154
0.0871
[0.0115]
[0.133]
# of ROP Courses
-0.00298
-0.14
[0.00782]
[0.145]
Instrumental Variables? No No Yes Yes
Number of Observations 18412 18412 18165 18165
R-squared 0.269 0.269 0.215 0.232
P-Values from Tests ROP=Tech Prep=0
0.348
0.625
CTE + Tech Prep=0
0.0118
0.167
CTE + ROP=0
0.323
0.732
All 3 CTE Coefficients = 0
0.036
0.208
Test for Exclusion of Added IVs
(First-Stage Model) CTE
0.0016 <0.001
Tech Prep
<0.001
ROP
<0.001
Hausman Test (exogeneity)
0.0432 0.153
Overidentification Test
0.3141 0.2468 Notes: Standard errors in brackets are clustered at the school level. * significant at 10%; ** significant at 5%; *** significant at 1%
Instruments are percentage of courses offered in each of grades 9th – 12th within school and year which are CTE, Tech Prep or ROP.

145
Table 8.7a Ordered Probit Models of Highest Level of Educational Attainment, in Terms of CTE Courses Taken: High School Graduates from 2002 through 2005
High School Some 2-year 2-year Degree Some Univ. 4-year Degree
# of CTE Courses 0.0068*** 0.0051*** 0.0026*** 0.0020*** -0.0002*** -0.0001*** -0.0060*** -0.0045*** -0.0032*** -0.0024***
[0.00134] [0.00155] [0.00051] [0.00059] [0.00003] [0.00004] [0.00116] [0.00134] [0.00066] [0.00076]
# of Tech Prep Courses
0.0047**
0.0018**
-0.0001*
-0.0042**
-0.0022**
[0.00219]
[0.00087]
[0.00006]
[0.00198]
[0.00103]
# of ROP Courses
0.0018
0.0007
-0.00004
-0.0016
-0.0009
[0.00185] [0.00072] [0.00004]
[0.00165] [0.00088]
Number of Observations 18412 18412 18412 18412 18412 18412 18412 18412 18412 18412
R-squared 0.1737 0.1739 0.1737 0.1739 0.1737 0.1739 0.1737 0.1739 0.1737 0.1739
P-Values from Tests
ROP=Tech Prep=0
0.0250
0.0250
0.0250
0.0250
0.0250
CTE + Tech Prep=0
<0.001
<0.001
<0.001
<0.001
<0.001
CTE + ROP=0
0.0099
0.0099
0.0099
0.0099
0.0099
All 3 Coefficients = 0
<0.001
<0.001
<0.001
<0.001
<0.001
Notes: Standard errors in brackets are clustered at the school level. * significant at 10%; ** significant at 5%; *** significant at 1% Average marginal effects of independent variable on the probability of each incremental level of educational attainment level reported. Marginal effects are estimated around the mean number of CTE courses taken for the estimation sample. Dependent variable is highest educational attainment level four years after high school graduation. The table shows results from two separate models, one that conditions upon CTE concentrator status and a second model that additionally includes indicators for whether students have taken any ROP or Tech Prep classes.

146
Table 8.8a Linear Models of Highest Level of Educational Attainment by 2009, in Terms of CTE Courses Taken: High School Graduates from 2002 through 2005
OLS OLS 2SLS 2SLS
# of CTE Courses -0.0300*** -0.0216*** 0.0675 0.0677
[0.00521] [0.00567] [0.0425] [0.0415]
# of Tech Prep Courses
-0.0178*
0.00131
[0.00885]
[0.103]
# of ROP Courses
-0.0149*
-0.105
[0.00835]
[0.104]
Instrumental Variables? No No Yes Yes
Number of Observations 18412 18412 18165 18165
R-squared 0.398 0.398 0.357 0.371
P-Values from Tests ROP=Tech Prep=0
0.01
0.318
CTE + Tech Prep=0
<0.001
0.517
CTE + ROP=0
0.0036
0.699
All 3 CTE Coefficients = 0
<0.001
0.39
Test for Exclusion of Added IVs
(First-Stage Model) CTE
0.0016 <0.001
Tech Prep
<0.001
ROP
<0.001
Hausman Test (exogeneity)
0.0351 0.18
Overidentification Test
0.1398 0.2531 Notes: Standard errors in brackets are clustered at the school level. * significant at 10%; ** significant at 5%; *** significant at 1% Instruments are percentage of courses offered in each of grades 9th – 12th within school and year which are CTE, Tech Prep, or ROP. Dependent variable is highest level of educational attainment, where ordinal levels are: high school graduate, some 2-year college education, 2-year degree, some 4-year college education, 4-year degree.

147
Table 8.9a Probit Models of the Probability that Community College Students Transfer to Four-Year Postsecondary Institutions, in Terms of CTE Courses Taken: High School Graduates from 2002 through 2005
dp/dx dp/dx
# of CTE Courses -0.0040** -0.0042**
[0.00197] [0.00185]
# of Tech Prep Courses 0.0051
[0.00502]
# of ROP Courses -0.0041
[0.00332]
Number of Observations 9424 9424
Pseudo R-squared 0.1288 0.1290
P-Values from Tests
ROP=Tech Prep=0 0.372
CTE + Tech Prep=0 0.867
CTE + ROP=0 0.012
All 3 CTE Coefficients = 0 0.028
Notes: Standard errors in parentheses are clustered at the school level. * significant at 10%; ** significant at 5%; *** significant at 1%
Average marginal effects of probability of transfer reported. Marginal effects estimated around the mean number of CTE courses taken. Dependent variable is an indicator for whether a student transferred to a 4-year institution. Estimation sample is restricted to students who enroll at a 2-year institution within the first two years after high school.

148
Table 8.10a Linear Probability Models of the Probability that Community College Students Transfer to Four-Year Postsecondary in Terms of CTE Courses Taken: High School Graduates from 2002 through 2005
OLS OLS 2SLS 2SLS
# of CTE Courses -0.00409** -0.00429** -0.0128 -0.0231
[0.00184] [0.00181] [0.0277] [0.0243]
# of Tech Prep Courses
0.00514
0.00471
[0.00484]
[0.0565]
# of ROP Courses
-0.00401
0.0166
[0.00327]
[0.0528]
Instrumental Variables? No No Yes Yes
Number of Observations 9471 9471 9364 9364
R-squared 0.132 0.132 0.129 0.121
P-Values from Tests ROP=Tech Prep=0
0.392
0.807
CTE + Tech Prep=0
0.866
0.766
CTE + ROP=0
0.015
0.899
All 3 CTE Coefficients = 0
0.033
0.807
Test for Exclusion of Added IVs
(First-Stage Model) CTE
0.0574 0.0082
Tech Prep
0.0039
ROP
<0.001
Hausman Test (exogeneity)
0.773 0.894
Overidentification Test
0.2277 0.5761 Notes: Standard errors in brackets are clustered at the school level. * significant at 10%; ** significant at 5%; *** significant at 1%
Instruments are percentage of courses offered within school, year and grade-level which are CTE (or TechPrep, ROP). Estimation sample restricted to students who enroll at a 2-year postsecondary institution within the first two years after high school graduation. Dependent variable defined as transferring to a 4-year institution.

149
Table 8.1b Probit Models of Whether High School Graduates Enroll in Any Postsecondary Institution within One Year of Graduating from High School, in Terms of CTE Concentrator Status: Graduating Classes of 2002 through 2008
dp/dx dp/dx
CTE Concentrator 0.0236* 0.0265*
[0.0128] [0.0137]
Any Tech Prep Courses
-0.0223***
[0.0055]
Any ROP Courses
-0.0038
[0.0098]
Number of Observations 33381 33381
R-squared 0.1472 0.1476
P-Values from Tests
ROP=Tech Prep=0
<0.001
CTE + Tech Prep=0
0.7527
CTE + ROP=0
0.0614
All 3 CTE Coefficients = 0
<0.001
Notes: Standard errors in parentheses are clustered at the school level. * significant at 10%; ** significant at 5%; *** significant at 1% Average marginal effects of probability of enrollment reported.

150
Table 8.1c Probit Models of Whether High School Graduates Enroll in Any Postsecondary Institution within One Year of Graduating from High School, in Terms of CTE Concentration Fields: High School Graduates from 2002 through 2008
Original Top 4 Concentration Fields
dp/dx 2-Course
Concentrator
dp/dx 3-Course
Concentrator
Communication Design 0.0285** 0.0247*
[0.01154] [0.01476]
Business Support 0.0255* 0.0168
[0.01444] [0.01950]
Computer and Information Science 0.0318** 0.09438**
[0.01249] [0.03612]
Construction -0.0519** -0.0732**
[0.02315] [0.03568]
Other 0.0059 0.0138
[0.00852] [0.03418]
Number of Observations No No
R-squared 33381 33381
P-Values from Tests 0.1477 0.1474
Top 4 = 0
Top 4 = Other = 0 <0.001 0.0027
Notes: Standard errors in brackets are clustered at the school level. * significant at 10%; ** significant at 5%; *** significant at 1%
Average marginal effects of probability of enrollment reported.

151
Table 8.2b Linear Probability Models of Whether High School Graduates Enroll in Any Postsecondary Institution within One Year of Graduating from High School, in Terms of CTE Concentrator Status: Graduating Classes of 2002 through 2008
OLS OLS 2SLS 2SLS
CTE Concentrator 0.0229* 0.0252** 0.136 -0.0454
[0.0116] [0.0124] [0.257] [0.166]
Any Tech Prep Courses
-0.0185***
0.0823
[0.00512]
[0.139]
Any ROP Courses
-0.00268
0.000591
[0.00895]
[0.0668]
Instrumental Variables? No No Yes Yes
Number of Observations 33382 33382 32868 32868
R-squared 0.174 0.174 0.168 0.162
P-Values from Tests ROP=Tech Prep=0
0.0040
0.797
CTE + Tech Prep=0
0.583
0.874
CTE + ROP=0
0.0496
0.806
All 3 CTE Coefficients = 0
0.0063
0.891
Test for Exclusion of Added IVs
(First-Stage Model) CTE
0.0694 <0.001
Tech Prep
0.0247
ROP
<0.001
Hausman Test (exogeneity)
0.625 0.805
Overidentification Test
0.1409 0.2700 Notes: Standard errors in parentheses are clustered at the school level. *significant at 10%; ** significant at 5%; *** significant at 1%

152
Table 8.3b Ordered Probit Models of Highest Level of Educational Institution in Which a Student Enrolled Within One Year of Graduating from High School, in Terms of CTE Concentrator Status: High School Graduates from 2002 through 2008
No Enrollment 2-year Institution 4-year Institution
CTE Concentrator -0.0045 -0.0127 -0.0001 -0.0003 0.0046 0.0130
[0.00925] [0.0097] [0.00031] [.] [0.00945] [0.00993]
Any Tech Prep Courses
0.0359***
0.0009
-0.0368***
[0.00423]
[.]
[0.00436]
Any ROP Courses
0.0291***
0.0007
-0.0298***
[0.01028] [.] [0.01052]
Number of Observations 33382 33382 33382 33382 33382 33382
R-squared 0.1665 0.1682 0.1665 0.1682 0.1665 0.1682
P-Values from Tests
ROP=Tech Prep=0
<0.001
<0.001
<0.001
CTE + Tech Prep=0 0.013 0.013 0.013
CTE + ROP=0
0.151
0.151
0.151
All 3 CTE Coefficients = 0
<0.001
<0.001
<0.001
Notes: Standard errors in brackets are clustered at the school level. * significant at 10%; ** significant at 5%; *** significant at 1% Average marginal effects of independent variables on each incremental level of enrollment reported. The table shows results from two separate models, one that conditions upon CTE concentrator status and a second model that additionally includes indicators for whether students have taken any ROP or Tech Prep classes.
Note: Standard errors could be calculated for the two-year institutions due to the relatively small number of students in this group.

153
Table 8.3c Ordered Probit Models of Highest Level of Educational Institution in Which a Student Enrolled Within One Year of Graduating from High School, in Terms of CTE Concentration Fields: High School Graduates from 2002 through 2008
2-course concentrator 3-course concentrator
Concentration Field No
Enrollment 2-year 4-year No
Enrollment 2-year 4-year
Communication Design -0.0219* -0.00051 0.0224* -0.0143 -0.00033 0.0147
[0.0113] [.] [0.0116] [0.0128] [0.00041] [0.0130]
Business Support -0.0002 -4.60e-06 0.0002 0.0116 0.00027 -0.0119
[0.0124] [.] [0.0127] [0.0175] [0.00047] [0.0179]
Computer and Information Science -0.0350*** -0.00081 0.0358*** -0.0703* -0.00162 0.0719*
[0.0132] [.] [0.0137] [0.0368] [0.00164] [0.0374]
Construction 0.0672*** 0.00156 -0.0688*** 0.1065*** 0.00245 -0.1090***
[0.0213] [.] [0.0221] [0.0282] [0.00228] [0.0283]
Other 0.0245*** 0.00057 -0.0251*** 0.0241 0.00056 -0.0247
[0.0092] [.] [0.0095] [0.0292] [0.00083] [0.0298]
Number of Observations 33382 33382 33382 33382 33382 33382
R-squared 0.1670 0.1670 0.1670 0.1667 0.1667 0.1667
P-Values from Tests
Top 4 = 0 <0.001 <0.001 <0.001 <0.001 <0.001 <0.001
Top 4 = Other = 0 <0.001 <0.001 <0.001 <0.001 <0.001 <0.001
Notes: Standard errors in brackets are clustered at the school level. * significant at 10%; ** significant at 5%; *** significant at 1%

154
Table 8.4b Linear Models of Highest Level of Educational Institution in Which a Student Enrolled Within One Year of Graduating from High School, in Terms of CTE Concentrator Status: High School Graduates from 2002 through 2008
OLS OLS 2SLS 2SLS
CTE Concentrator 0.00873 0.0236 0.124 -0.153
[0.0157] [0.0164] [0.474] [0.270]
Any Tech Prep Courses
-0.0634*** 0.023
[0.00858] [0.173]
Any ROP Courses
-0.0531** -0.147
[0.0197] [0.109]
Instrumental Variables? No No Yes Yes
Number of Observations 33382 33382 32868 32868
R-squared 0.306 0.309 0.303 0.301
P-Values from Tests
ROP=Tech Prep=0
<0.001 0.354
CTE + Tech Prep=0
0.018 0.691
CTE + ROP=0
0.162 0.256
All 3 CTE Coefficients = 0
<0.001 0.385
Test for Exclusion of Added IVs
(First-Stage Model)
CTE
0.0694 <0.001
Tech Prep
0.0247
ROP
<0.001
Hausman Test (exogeneity)
0.8 0.727
Overidentification Test
0.1487 0.3290 Notes: Standard errors in brackets are clustered at the school level. * significant at 10%; ** significant at 5%; *** significant at 1%

155
Table 8.5b Ordered Probit Models of Number of Years in the First Four Years after High School Graduation During Which the Student Enrolls in Postsecondary Education, in Terms of CTE Concentrator Status: High School Graduates from 2002 through 2005
No Enrollment 1/4 Years Enrollment
2/4 Years Enrollment
3/4 Years Enrollment
4/4 Years Enrollment
CTE Concentrator -0.0050 -0.0079 -0.0012 -0.0019 -0.00060 -0.00096 0.00003 0.0001 0.0067 0.0107
[0.01013] [0.00996] [0.00240] [0.00236] [0.00122] [0.00120] [0.00007] [0.000062] [0.01368] [0.01345]
Any Tech Prep Courses
0.0170***
0.0040***
0.0021***
-0.0001***
-0.0229***
[0.00408]
[0.00092]
[0.00051]
[0.00004]
[0.00548]
Any ROP Courses
0.0146*
0.0035*
0.0018*
-0.00009
-0.0198*
[0.00847] [0.00200] [0.00104]
[0.00006]
[0.01145]
Number of Observations 18412 18412 18412 18412 18412 18412 18412 18412 18412 18412
R-squared 0.1139 0.1144 0.1139 0.1144 0.1139 0.1144 0.1139 0.1144 0.1139 0.1144
P-Values from Tests
ROP=Tech Prep=0
<0.001
<0.001
<0.001
<0.001
<0.001
CTE + Tech Prep=0
0.319
0.319
0.319
0.319
0.319
CTE + ROP=0 0.647 0.647 0.647 0.647 0.647
All 3 CTE Coefficients=0
<0.001
<0.001
<0.001
<0.001
<0.001
Notes: Standard errors in brackets are clustered at the school level. * significant at 10%; ** significant at 5%; *** significant at 1% Average marginal effects of independent variables on each incremental level of enrollment reported. The table shows results from two separate models, one that conditions upon CTE concentrator status and a second model that additionally includes indicators for whether students have taken any ROP or Tech Prep classes.

156
Table 8.5c-1 Ordered Probit Models of Number of Years in the First Four Years after High School Graduation During Which the Student Enrolls in Postsecondary Education, in Terms of 2-Course CTE Concentration Fields: High School Graduates from 2002 through 2005
2-Course Concentration Field No
Enrollment 1 year 2 years 3 years 4 years
Communication Design -0.0205* -0.0049* -0.0025* 0.00013 0.0277*
[0.0124] [0.0029] [0.0015] [0.00009] [0.0167]
Business Support -0.0073 -0.0017 -0.0009 0.00005 0.0099
[0.0125] [0.0030] [0.0015] [0.00008] [0.0170]
Computer and Information Science -0.0359** -0.0085** -0.0043** 0.00024* 0.0485**
[0.0177] [0.0042] [0.0022] [0.00014] [0.0239]
Construction 0.0515* 0.0122** 0.0062** -0.00034** -0.0697*
[0.0267] [0.0061] [0.0032] [0.00017] [0.0358]
Other 0.0018 0.0004 0.0002 -0.00001 -0.0024
[0.0140] [0.0033] [0.0017] [0.00009] [0.0190]
Number of Observations 18412 18412 18412 18412 18412
R-squared 0.1143 0.1143 0.1143 0.1143 0.1143
P-Values from Tests
Top 4 = 0 <0.001 <0.001 <0.001 <0.001 <0.001
Top 4 = Other = 0 0.0011 0.0011 0.0011 0.0011 0.0011
Notes: Standard errors in brackets are clustered at the school level. * significant at 10%; ** significant at 5%; *** significant at 1%

157
Table 8.5c-2 Ordered Probit Models of Number of Years in the First Four Years after High School Graduation During Which the Student Enrolls in Postsecondary Education, in Terms of 3-Course CTE Concentration Fields: High School Graduates from 2002 through 2005
3-Course Concentration Field No
Enrollment 1 year 2 years 3 years 4 years
Communication Design -0.0173 -0.0041 -0.0021 0.00011 0.0234
[0.0179] [0.0042] [0.0021] [0.00012] [0.0241]
Business Support 0.0090 0.0022 0.0011 -0.00006 -0.0122
[0.0160] [0.0038] [0.0019] [0.00010] [0.0216]
Computer and Information Science -0.0369** -0.0087** -0.0045** 0.00024 0.0498**
[0.0169] [0.0042] [0.0021] [0.00016] [0.0231]
Construction 0.0940** 0.0223*** 0.0114** -0.00061** -0.1270**
[0.0383] [0.0085] [0.0045] [0.00026] [0.0511]
Other 0.0062 0.0015 0.0008 -0.00004 -0.0084
[0.0333] [0.0079] [0.0040] [0.00022] [0.0450]
Number of Observations 18412 17358 17358 17358 17358
R-squared 0.1141 0.1087 0.1087 0.1087 0.1087
P-Values from Tests
Top 4 = 0 0.0306 0.0326 0.0326 0.0326 0.0326
Top 4 = Other = 0 0.0438 0.0453 0.0453 0.0453 0.0453
Notes: Standard errors in brackets are clustered at the school level.
* significant at 10%; ** significant at 5%; *** significant at 1

158
Table 8.6b Linear Models of Number of Years in the First Four Years after High School Graduation During Which the Student Enrolls in Postsecondary Education, in Terms of CTE Concentrator Status: High School Graduates from 2002 through 2005
OLS OLS 2SLS 2SLS
CTE Concentrator 0.0266 0.0383 5.474* 2.713 [0.0446] [0.0444] [2.829] [1.969]
Any Tech Prep Courses
-0.0732*** 0.481
[0.0183] [0.719]
Any ROP Courses
-0.0531 0.0758
[0.0384] [0.478]
Instrumental Variables? No No Yes Yes
Number of Observations 18412 18412 18165 18165 R-squared 0.269 0.269 . 0.059
P-Values from Tests
ROP=Tech Prep=0 <0.001 0.79 CTE + Tech Prep=0 0.399 0.136
CTE + ROP=0 0.818 0.116 All 3 CTE Coefficients = 0 0.00224 0.364
Test for Exclusion of Added IVs
(First-Stage Model)
CTE 0.118 0.026 Tech Prep <0.001
ROP <0.001
Hausman Test (exogeneity) 0.0282 0.0855 Overidentification Test 0.4071 0.3520
Notes: Standard errors in brackets are clustered at the school level. * significant at 10%; ** significant at 5%; *** significant at 1%

159
Table 8.7b Ordered Probit Models of Highest Level of Educational Attainment, in Terms of CTE Concentrator Status: High School Graduates from 2002 through 2005
High School Some 2-year 2-year Degree Some Univ. 4-year Degree
CTE Concentrator 0.0047 -0.00012 0.0018 -0.00005 -0.0001 2.92e-06 -0.0042 0.0001 -0.0023 0.0001
[0.01027] [0.0107] [0.00399] [0.00417] [0.00025] [0.00026] [0.00909] [0.00949] [0.00492] [0.00510]
Any Tech Prep Courses
0.0317***
0.0124***
-0.0008***
-0.0282***
-0.0151***
[0.00521]
[0.00206]
[0.00014]
[0.00468]
[0.00245]
Any ROP Courses
0.0222***
0.0087**
-0.0005***
-0.0197**
-0.0106***
[0.00866] [0.00339] [0.00021] [0.00773] [0.00412]
Number of Observations 18412 18412 18412 18412 18412 18412 18412 18412 18412 18412
R-squared 0.1721 0.1737 0.1721 0.1737 0.1721 0.1737 0.1721 0.1737 0.1721 0.1737
P-Values from Tests
ROP=Tech Prep=0
<0.001
<0.001
<0.001
<0.001
<0.001
CTE + Tech Prep=0
<0.001
<0.001
<0.001
<0.001
<0.001
CTE + ROP=0
0.103
0.103
0.103
0.103
0.103
All 3 CTE Coefficients=0
<0.001
<0.001
<0.001
<0.001
<0.001
Notes: Standard errors in brackets are clustered at the school level. * significant at 10%; ** significant at 5%; *** significant at 1% Average marginal effects of independent variable on each incremental level of educational attainment level reported. Dependent variable defined as highest educational attainment level four years after high school graduation. The table shows results from two separate models, one that conditions upon CTE concentrator status and a second model that additionally includes indicators for whether students have taken any ROP or Tech Prep classes.

160
Table 8.7c-1 Ordered Probit Models of Highest Level of Educational Attainment, in Terms of 2-Course CTE Concentration Fields: High School Graduates from 2002 through 2005
2-Course Concentration Fields High School Some 2-year 2-year Degree Some Univ.
4-year Degree
Communication Design -0.0211* -0.0082* 0.00051* 0.0187* 0.0101*
[0.0125] [0.0048] [0.0003] [0.0110] [0.0059]
Business Support 0.0058 0.0022 -0.00014 -0.0051 -0.0028
[0.0127] [0.0049] [0.00030] [0.0112] [0.0061]
Computer and Information Science -0.0213 -0.0083 0.00051 0.0189 0.0102
[0.0187] [0.0074] [0.00046] [0.0167] [0.0089]
Construction 0.0862*** 0.0334*** -0.00206*** -0.0763*** -0.0412***
[0.0222] [0.0084] [0.00054] [0.0194] [0.0108]
Other 0.0180 0.0070 -0.00043 -0.0159 -0.0086
[0.0118] [0.0047] [0.00029] [0.0105] [0.0057]
Number of Observations 18412 18412 18412 18412 18412
R-squared 0.1728 0.1728 0.1728 0.1728 0.1728
P-Values from Tests
Top 4 Fields = 0 <0.001 <0.001 <0.001 <0.001 <0.001
Other = Top 4 = 0 <0.001 <0.001 <0.001 <0.001 <0.001
Notes: Standard errors in brackets are clustered at the school level. * significant at 10%; ** significant at 5%; *** significant at 1% Average marginal effects of independent variable on the probability of each incremental level of educational attainment level reported. Dependent variable defined as highest educational attainment level four years after high school graduation.

161
Table 8.7c-2 Ordered Probit Models of Highest Level of Educational, in Terms of 3-course CTE Concentration Fields: Graduating Classes of 2002 through 2005
3-Course Concentration Fields High School Some 2-year 2-year Degree Some Univ.
4-year Degree
Communication Design -0.0106 -0.0041 0.00025 0.0094 0.0051
[0.0169] [0.0065] [0.00040] [0.0149] [0.0081]
Business Support 0.0142 0.0055 -0.00034 -0.0125 -0.0068
[0.0149] [0.0057] [0.00035] [0.0131] [0.0071]
Computer and Information Science -0.0083 -0.0032 0.00020 0.0073 0.0040
[0.0271] [0.0105] [0.00065] [0.0239] [0.0130]
Construction 0.0963*** 0.0372*** -0.00230*** -0.0851*** -0.0461***
[0.0274] [0.0099] [0.00068] [0.0234] [0.0133]
Other 0.0408 0.0157 -0.00097 -0.0360 -0.0195
[0.0333] [0.0132] [0.00082] [0.0299] [0.0158]
Number of Observations 18412 17358 17358 17358 17358
R-squared 0.1723 0.1643 0.1643 0.1643 0.1643
P-Values from Tests
Top 4 Fields = 0 0.0033 0.0073 0.0073 0.0073 0.0073
Other = Top 4 = 0 0.0033 0.0058 0.0058 0.0058 0.0058
Notes: Standard errors in brackets are clustered at the school level. * significant at 10%; ** significant at 5%; *** significant at 1% Average marginal effects of independent variable on the probability of each incremental level of educational attainment level reported. Dependent variable defined as highest educational attainment level four years after high school graduation.

162
Table 8.8b Linear Models of Highest Level of Educational Attainment, in Terms of CTE Concentrator Status: Graduating Classes of 2002 through 2005
OLS OLS 2SLS 2SLS
CTE Concentrator -0.0374 -0.0142 3.631* 1.451
[0.0357] [0.0368] [1.880] [1.304]
Any Tech Prep Courses
-0.122*** 0.0464
[0.0222] [0.465]
Any ROP Courses
-0.115*** -0.0439
[0.0358] [0.261]
Instrumental Variables? No No
Number of Observations 18412 18412 18165 18165
R-squared 0.394 0.398 . 0.317
P-Values from Tests
ROP=Tech Prep=0
<0.001 0.982
CTE + Tech Prep=0
<0.001 0.286
CTE + ROP=0
0.0176 0.262
All 3 CTE Coefficients = 0
<0.001 0.737
Test for Exclusion of Added IVs
(First-Stage Model)
CTE
0.118 0.026
Tech Prep
<0.001
ROP
<0.001
Hausman Test (exogeneity)
0.0384 0.457
Overidentification Test
0.3858 0.2392
Notes: Standard errors in brackets are clustered at the school level. * significant at 10%; ** significant at 5%; *** significant at 1% Dependent variable is highest level of educational attainment 4 years after high school, where ordinal levels are: high school graduate, some 2-year college education, 2-year degree, some 4-year college education, 4-year degree.

163
Table 8.9b Probit Models of the Probability that Community College Students Transfer to Four-Year Postsecondary Institutions, in Terms of CTE Concentrator Status: High School Graduates from 2002 through 2005
dp/dx dp/dx
CTE Concentrator -0.0220 -0.0161
[0.02109] [0.02070]
Any Tech Prep Courses -0.0005
[0.01502]
Any ROP Courses -0.0455***
[0.01116]
Number of Observations 9424 9424
Pseudo R-squared 0.1283 0.1301
P-Values from Tests
ROP=Tech Prep=0 <0.001
CTE + Tech Prep=0 0.581
CTE + ROP=0 0.003
All 3 CTE Coefficients = 0 <0.001
Notes: Standard errors in brackets are clustered at the school level. * significant at 10%; ** significant at 5%; *** significant at 1%
Dependent variable is an indicator for whether a student transferred to a 4-year institution. Estimation sample is restricted to students who enroll at a 2-year institution within the first two years after high school.

164
Table 8.9c Probit Models of the Probability that Community College Students Transfer to Four-Year Postsecondary Institutions, in Terms of CTE Concentration Fields: High School Graduates from 2002 through 2005
Original Top 4 Concentration Fields
dp/dx 2-Course
Concentrator
dp/dx 3-Course
Concentrator
Communication Design 0.0045 -0.0172
[0.0132] [0.0257]
Business Support 0.0008 -0.0356
[0.0157] [0.0272]
Computer and Information Science 0.0787*** -0.0387
[0.0246] [0.0366]
Construction -0.0289 -0.3426**
[0.0546] [0.1566]
Other -0.0135 0.0194
[0.0151] [0.0363]
Number of Observations 9424 9424
R-squared 0.1290 0.1289
P-Values from Tests
Top 4 = 0 0.0148 0.1630
Top 4 = Other = 0 0.0189 0.2306
Notes: Standard errors in brackets are clustered at the school level. * significant at 10%; ** significant at 5%; *** significant at 1% # The Construction field was dropped due to perfect prediction of no transfer. Estimation sample restricted to students who enroll at a 2-year postsecondary institution within the first two years after high school graduation. Dependent variable defined as transferring to a 4-year institution.

165
Table 8.10b Linear Probability Models of the Probability that Community College Students Transfer to Four-Year Postsecondary, in Terms of CTE Concentrator Status: High School Graduates from 2002 through 2005
OLS OLS 2SLS 2SLS
CTE Concentrator -0.0242 -0.0185 0.519 0.0258
[0.0197] [0.0194] [0.811] [0.534]
Any Tech Prep Courses
0.0022
-0.121
[0.0152]
[0.255]
Any ROP Courses
-0.0434***
0.102
[0.0114]
[0.123]
Instrumental Variables? No No Number of Observations 9471 9471 9364 9364
R-squared 0.132 0.133 0.023 0.11
P-Values from Tests ROP=Tech Prep=0
<0.001
0.706
CTE + Tech Prep=0
0.585
0.898
CTE + ROP=0
0.004
0.809
All 3 CTE Coefficients = 0
<0.001
0.842
Test for Exclusion of Added IVs
(First-Stage Model) CTE
0.659 0.002
Tech Prep
<0.001
ROP
<0.001
Hausman Test (exogeneity)
0.482 0.713
Overidentification Test
0.5890 0.8208 Notes: Standard errors in brackets are clustered at the school level. * significant at 10%; ** significant at 5%; *** significant at 1%
Estimation sample restricted to students who enroll at a 2-year postsecondary institution within the first two years after high school graduation. Dependent variable defined as transferring to a 4-year institution.

166
Part V – Conclusion

167
9 Conclusion and Policy Implications
The four overall goals of this research have been to study how schools vary in offerings
of CTE courses, who enrolls in CTE courses, and the relationship between taking CTE courses
and both academic outcomes in high school and postsecondary educational outcome.
Variations across Schools
Schools certainly do vary in the number of CTE courses they offer, but this is largely a
function of school size. We also found some variations across schools, though, in the percentage
of courses offered that are CTE offerings. These variations matter, as students at schools with a
higher percentage of courses that are CTE are more likely to become CTE concentrators. Other
aspects of schools are also associated with CTE course-taking. Students attending charter
schools that were created by converting traditional public schools had lower rates of CTE
concentration. (We lacked the transcript data for startup charter schools to make any conclusion
about them.) Other aspects of schools that appear to matter at least to some degree are teachers’
level of education, teacher race and the demographic makeup of the student body.
Who Takes CTE Courses?
Female students were likely to take slightly fewer CTE courses but were no less likely
than male students to become concentrators in a specific occupational cluster. African-
Americans and Hispanics were slightly less likely than whites or Asians to become CTE
concentrators. English Learners and in particular special education students were less likely to
complete 3 or more CTE courses by grade 12. Some of the most interesting results had to do
with academic GPA measured in grade 8 and behavior GPA measured in grade 5. A non-linear
relationship between these variables and CTE course-taking emerged. Students “in the middle”
of the GPA distributions are the most likely to become CTE concentrators. Students with the
lowest GPA’s are the least likely to become CTE concentrators, and students with the top GPA’s
(of either type) rank in between these two extremes. We cannot know for sure why this hump-
shaped relation exists, but we note that students with the highest academic GPA are the least
likely to take any CTE courses, suggesting that these are the students least vocationally inclined.
Students with lower GPA’s (and lower reading scores) may be less likely to become three-course
concentrators because they have to spend extra time fulfilling the academic requirements to earn
their high school diplomas. Interviews conducted by Bachofer et al. (2010) support both
hypotheses.
Although variations in CTE course-taking across students certainly exist, this focus
misses the larger message that CTE course-work is not a fringe activity occupying a small
minority of vocationally inclined students. Fully 93 percent of grade 12 students have taken at
least some CTE-coursework, and 39 percent have taken three or more CTE courses, thus
becoming CTE.
In that sense, the choice between academic and vocationally and technically oriented
coursework is a question of degree, not a question of “either or”. In San Diego, Career and
Technical Education is an essential part of mainstream education.

168
The Relation between CTE Coursework and High School Academic Outcomes
It is helpful to outline two theories of the effect that CTE coursework might have on
students’ academic outcomes in high school, against which to compare the results presented in
the preceding chapters.
A skeptical view of CTE might hold that taking courses with a career and vocational
focus risks diverting students from more academic work. Under this view, one might expect that
CTE course-taking would be associated negatively with gains in math and reading achievement,
grade promotion, and GPA, at least the GPA on non-CTE courses. Similarly, it might lessen
students’ chances of passing the high school exit exam, because of that exam’s non-CTE focus.
Taking more CTE courses could decrease the number of A-G (college preparatory) courses
taken, and could even lessen the probability of graduating from high school if the student’s
mainstream academic coursework suffered.
A more positive theory of CTE coursework might hold that CTE courses are not
orthogonal to progress along traditional academic dimensions such as reading and math scores
and the other measures listed above. Indeed, supposing that some students who plan on CTE-
focused careers would find a high school without CTE course offerings as an irrelevant form of
education, injection of CTE into the high school curriculum could prevent some students from
dropping out of high school. CTE course offerings could conceivably energize students,
showing them the real-world relevance of reading, writing, math and science, and motivating
them to take more academic courses, and to work harder at them. Under this view of the world,
high school graduation rates should increase along with traditional yardsticks of academic
performance.
If we focus on the three confirmatory analyses of math and reading achievement and the
probability of graduation alone, the evidence is mixed. We find no relationship between the
number of CTE courses taken and test scores in reading and math. Similarly we find in the IV
model that CTE coursework is insignificantly related to the likelihood of graduation. Notably,
the corresponding OLS equation suggests a positive link, but this is not a causal estimate. (When
we modeled high school graduation as a function of concentrator status, this CTE indicator again
entered positively and significantly, but was insignificant in the IV model.) It seems likely that
the positive correlations with the probability of high-school graduation are not causal but merely
reflect the fact that those students who intend to graduate from high school stay in school longer
and are able to take more CTE courses.
Our exploratory analyses of other high school outcomes also tend to support the idea that
CTE coursework does not affect high school academic outcomes much. For instance we find no
link with absence rates, or the probability of being promoted. Our exploratory analyses of other
outcomes, when we use the IV method to control for the endogeneity of CTE course-taking,
suggested no effects of CTE coursework on passage of the California High School Exit Exam or
career GPA (overall or for non-CTE courses). One exception is an estimated negative effect on
the completion of the A-G courses required for students to become eligible to attend either of
California’s public university systems. The effect is not large, and is not surprising as only some
CTE courses are approved as A-G courses.
Neither the fears of the skeptics or of those most hopeful about CTE gain unwavering
support from our findings. Overall, and on many of our measures, it might be most appropriate

169
to think of CTE coursework as mostly neutral with respect to more traditional measures of high
school academic outcomes.
CTE Coursework and Postsecondary Outcomes
We pre-committed to one confirmatory analysis in the domain of postsecondary
enrollment and one in the domain of postsecondary attainment. These were models of the
number of years of postsecondary enrollment in the first four years after high school graduation,
and the highest level of educational attainment.
We found a quite striking difference between the models that used and did not use
instrumental variables. The latter models, which implicitly assume that conditional upon
characteristics of students in grade 8, students do not endogenously choose how many CTE
courses to take, suggest a negative relation between taking CTE courses in high school and
postsecondary outcomes.
In contrast, the instrumental variable model of postsecondary enrollment, which attempts
to estimate the causal effect of taking additional CTE courses, suggests that taking one additional
CTE course in high school leads to an increase of 0.12 years of postsecondary enrollment.
The IV version of our confirmatory model of the highest level of educational attainment
four years after high school graduation suggests no significant link to the highest level of
attainment.
Notably, the IV models produced far more positive results than the models that did not
take the possible endogeneity of CTE coursework into account. For both of the outcomes listed
above, models that merely controlled for student characteristics in grade 8 found significant
negative associations between the number of CTE courses taken and both years enrolled in
postsecondary education and the highest level of postsecondary attainment.
This pattern of negative conditional correlations between CTE courses taken and a
variety of measures of postsecondary outcomes, but of positive or zero relations resulting once
we instrumented for CTE coursework, also occurred for many of our exploratory models of
postsecondary enrollment and attainment. A likely cause is endogenous choices made by some
students who for unobserved reasons are particularly interested in working after high school
rather than going to college, and who for similar reasons decide to take more CTE courses while
in high school. Even if CTE courses had not been available it would not have changed their
decisions about working after high school.
The instrumental variable approach instead uses variation from year to year in CTE
course offerings at the student’s high school to identify the causal effect of taking more CTE
courses on postsecondary outcomes. To the extent that this source of variation is not related to
the unobserved factors that endogenously determine CTE and postsecondary enrollment, we
would expect a bigger, more positive result to emerge, and our results confirm this expectation.
We also studied the relation between becoming a CTE concentrator and postsecondary
outcomes. Mostly due to the limited variation in the CTE concentrator variable, the instrumental
variable approach was not as effective in controlling for endogeneity when this was our
explanatory variable. The non-IV models suggest no link between concentrator status and the
number of years of postsecondary education in which students enroll, although there was some
weak evidence that students who became concentrators were slightly more likely to attend
postsecondary institutions in their first year after high school graduation. As for our main

170
attainment measure, again no significant relationship with concentrator status emerged, although
in this model some evidence emerged of negative relations between taking any ROP or Tech
Prep classes and highest level of educational attainment.
We also subdivided CTE concentrators by cluster, and found some evidence that cross-
cutting patterns among occupational areas may be hidden by the overall findings of little linkage
between CTE concentrator status and postsecondary outcomes. For instance three-course
concentrators in Computer Information Sciences were significantly more likely to obtain a two-
year or four-year degree than those who did not become CTE concentrators, while those with a
concentration in Construction during high school were significantly less likely to obtain either
degree. Because these models do not use instrumental variables, the coefficients should be
thought of as conditional correlations, but they nonetheless shed light on the degree of
heterogeneity in CTE education.
Policy Implications
In 2010 the Obama administration announced a series of interventions designed to boost
college readiness, especially in underperforming high schools from which students tend to drop
out. Plans announced in March 2010 called for a College Pathways Program designed to make
college more readily accessible to all students. For instance, the program would increase student
access to college-level, dual credit, and other accelerated courses in high-need high schools.
(White House Office of the Press Secretary, 2010)
Plans to make college more accessible are laudable. At the same time, the focus on
college readiness, and therefore college preparatory courses, raises major questions about the
future of CTE.
For instance, in San Diego, CTE courses are only about one sixth as likely to be
recognized as college preparatory (“A-G”) as are non-CTE courses. Seen in this light, is an
emphasis on CTE coursework an impediment to college readiness?
Closely related to this issue is the seldom spoken but widely circulated stereotype of CTE
coursework as a consolation prize for those who are not likely to attend college. If this were
true, would a school or district that expanded its CTE course offerings be responding to students’
underlying job aspirations, or merely shunting marginal students into a track that makes a college
degree all but impossible to attain?
The findings in this report provide an antidote to concerns that CTE coursework and
creating college readiness are antithetical goals. First, it is not the least academically strong
students who take the most CTE courses in high school. It is students in the middle of the
achievement distribution who invest the most in CTE coursework. Second, the vast majority of
students take at least one CTE course by the time they graduate, and about four in ten students
take at least three CTE courses by the time they graduate.
CTE coursework is not an isolated activity limited to the lowest performing students, by
any stretch of the imagination.
While it is true that relatively few CTE courses qualify as a UC ‘A-G’ course in San
Diego, taking CTE courses is only weakly negatively related to completing all of the A-G course
requirements by the end of high school. For the most part, there appear to be few if any negative
academic consequences in high school from taking CTE coursework.

171
But if this is true, shouldn’t it be the case that those who take CTE courses enroll in and
complete postsecondary education at similar rates as those high school students who take fewer
CTE courses? Our analyses suggest that in reality there is a negative correlation between taking
a CTE course in high school and a variety of postsecondary outcomes. But these negative
correlations are probably not causal. That is, unobserved differences among students, perhaps
related to career aspirations and motivation, may induce this negative pattern.
Our instrumental variable models of postsecondary outcomes attempt to derive the true
causal impact of offering a greater number of CTE courses at a high school on students’
subsequent postsecondary outcomes. In these models, we can explain the number of CTE
courses students take in terms of the high school’s course offerings.
Importantly, we no longer find a negative link between CTE coursework and
postsecondary outcomes. The average effect of taking one more CTE course is about a 0.1 year
increase in postsecondary attendance during the first four years after high school graduation.
The IV models suggest that there is no link between CTE coursework and the level of
educational attainment four years after high school graduation.
These findings are important because they suggest that schools and districts should not
think of the provision of CTE programs as working against college readiness. CTE coursework
causes few if any observable blemishes on achievement during the high school years, and may in
fact induce some students to attend college.
Finally, our results may provide some insight into calls from the Obama administration
for strengthening links between high school and college education, for instance through
providing college credit for high school courses. Our analysis focused on just one form of such
an innovation. Tech Prep classes are CTE classes that are sufficiently advanced to earn the
student community college credit. We did not find that students who had taken more Tech Prep
classes in high school were more likely to enroll in two-year or four-year colleges than otherwise
identical students who had taken the same number of regular CTE courses. Nor did students
who took Tech Prep classes have a higher level of educational attainment four years after high
school than those who had taken regular CTE courses. These findings do not imply that Tech
Prep has no effect on postsecondary outcomes; rather, they have the same slightly positive effect
as regular CTE courses that do not garner high school students any community college credit.
This somewhat surprising result hints that it will take a considerable amount of effort to
transform various programs that generate postsecondary credit for high school students into a
higher rate of college enrollment and completion.
We must also be mindful of the possibility that many young people find it in their own
best interests to enter the workforce at the end of high school. Public schools are a means to an
end, namely, to prepare young people for productive adult lives. If Tech Prep courses encourage
some high school students to attend college, while for others it prepares them for immediate
entry into a career, it would seem wise to consider both outcomes a success.

172
References
Argys, L. M., Rees, D. I., Brewer, D. J., 1996. Detracking America’s Schools: Equity at Zero
Cost? Journal of Policy Analysis and Management 15, (4), 623-645.
Bachofer, Karen V., Julian R. Betts and Andrew Zau. 2010. An Evaluation of the Outcomes of
Career and Technical Education in San Diego Unified School District (SDUSD): A
Descriptive Case Study, La Jolla, CA: University of California San Diego. Manuscript
submitted to U.S. Department of Education, Policy and Program Studies Service.
Betts, Julian R, (forthcoming 2010), “The Economics of Tracking in Education”, in Hanushek,
Eric A., Stephen Machin and Ludger Woessmann (Eds.), Handbook of the Economics Of
Education,Volume 3, Amsterdam: North Holland.
Betts, Julian R. and Jamie L. Shkolnik, (2000), “The Effects of Ability Grouping on Student
Math Achievement and Resource Allocation in Secondary Schools”, Economics of Education
Review, (19:1), pp. 1-15.
Betts, Julian R., Andrew Zau and Lorien Rice. 2003. Determinants of Student Achievement:
New Evidence from San Diego, San Francisco: Public Policy Institute of California. Available
at www.ppic.org
Betts, Julian R., Lorien A. Rice, Andrew C. Zau, Y. Emily Tang, and Cory R. Koedel. 2006.
Does School Choice Work? Effects on Student Integration and Achievement, San Francisco:
Public Policy Institute of California. Available at www.ppic.org.
Bozick, Robert and Ben Dalton. 2007. Career and Technical Education and Academic
Progress at the End of High School: Evidence from the Education Longitudinal Study of
2002, Final Draft Deliverable 4.7 December 19, 2007 presented to U.S. Department of
Education, Chapel Hill, NC: RTI International.
Guggenberger, Patrik. 2010. “The Impact of a Hausman Pretest on the Asymptotic Size of a
Hypothesis Test”, Econometric Theory 26(2), pp.369-382.
Levesque, Karen, Jennifer Laird, Elisabeth Hensley, Susan P. Choy, Emily Forrest Cataldi and
Lisa Hudson. 2008. Career and Technical Education in the United States 1990 to 2005.
NCES 2008-035. Washington, D.C.: National Center for Education Statistics, U.S. Department
of Education.
National Center for Education Statistics. 2007. The 2007 Revision of the Career/Technical
Education Portion of the Secondary School Taxonomy. Washington, D.C.
National Center for Education Statistics. 2008. Career and Technical Education in the United
States: 1990-2005. Washington, D.C.

173
National Commission on Excellence in Education. 1983. A Nation at Risk: The Imperative forEducational Reform. Washington, DC: Author.
Oakes, J., (1990), Multiplying Inequalities - The Effects of Race, Social Class, and Tracking
on Opportunities to Learn Mathematics and Science. RAND, Santa Monica.
San Diego Unified School District. 2007. Board of Education Workshop, March 27, 2007.
Schochet, P. 2008. Technical Methods Report: Guidelines for Multiple Testing in Impact
Evaluations, (NCEE 2008-4018). Washington, D.C.: National Center for Education Evaluation
and Regional Assistance, Institute of Education Sciences, U.S. Department of Education.
United States Department of Education. 2004. National Assessment of Vocational Education:
Final Report to Congress. Washington, D.C.
White House Office of the Press Secretary. 2010. “President Obama Announces Steps to Reduce
Dropout Rate and Prepare Students for College and Careers”, March 1press release downloaded
from http://www.whitehouse.gov/the-press-office/president-obama-announces-steps-reduce-
dropout-rate-and-prepare-students-college-an in October 2010.
Zau, Andrew C. and Julian R. Betts. 2005. “The Evolution of School Choice,” in Frederick M.
Hess (Ed.) Urban School Reform: Lessons from San Diego, Cambridge, MA: Harvard
Education Press, pp. 223-241.
Zau, Andrew C. and Julian R. Betts. 2008. Predicting Success, Preventing Failure: An
Investigation of the California High School Exit Exam, San Francisco: Public Policy Institute
of California. Available at www.ppic.org.

174
Appendix A: Additional Material Related to Students’ Course-
Taking Patterns
This appendix contains additional tables and text relating to Part II of this report, on course-
taking patterns.
Variations When Probits are Estimated for Earlier Grades
We re-estimated each of the probit and ordered probit models using CTE course-taking at
the end of grade 11 and grade 10, and compared the results to the findings we have discussed in
chapter 4, which focus on grade 12 outcomes. We have not included these separate sets of probit
results due to space constraints, but they are available from the authors. In general the results
were highly similar. A comparison with grade 11 results for three-course concentrators shows
some minor variations in the patterns of significance of the variables summarizing teacher traits,
but the coefficients for student and school characteristics were highly similar. One of the most
interesting differences was that in the grade 11 models charter schools showed no significant
differences relative to traditional public schools, perhaps because so few students become
concentrators until they take their final set of courses in grade 12. Another difference was that in
grade 11 the variable capturing the percentage of courses offered that are CTE was not
significantly related to the two- and three-course cluster concentrator definitions, although it was
significantly related to the probability that a student takes any three CTE courses or any such
courses.
The grade 10 probit results were also quite similar to those for grade 12, although again
there were some cases in which patterns were not significant in grade 10 even though they were
significant in the grade 12 probits. This is exactly what we would expect given the very small
percentage of students who have become CTE concentrators by the end of grade 10.

175
Appendix A Table 1: Cumulative Number of CTE Courses Passed by the End of the Given Grade, Restricting the Sample to Students Who Remained in SDUSD Schools from Grade 9 Through Grade 12, Pooling Students over Years 1998-1999 to 2008-2009
Student grade
Percentage of Students in each Category by CTE Courses per Student:
Total 0 0.5 1 1.5 2 2.5 3+
9 100.0 48.5 13.5 23.7 6.8 5.1 1.5 1.0
10 100.0 33.4 12.9 24.5 10.1 10.4 3.6 5.1
11 100.0 18.7 10.2 21.5 11.6 14.6 7.1 16.4
12 100.0 7.8 5.9 13.6 9.2 14.3 9.3 39.9
p-value <0.001
Note: The p-value is from a Pearson's chi-squared test for equality of percentages across rows.

176
Appendix A Table 2: Cumulative Number of CTE Courses Passed by the End of the Given Grade, Divided into STEM/non-STEM and Those Qualifying/Not Qualifying for Community College Credit, Pooling Students over Years 1998-1999 to 2008-2009 , Restricting the Sample to Students Who Remained in SDUSD Schools from Grade 9 Through Grade 12 Student grade
Type of CTE Course
Percentage of Students in each Category by CTE Courses per Student:
Total 0 0.5 1 1.5 2 2.5 3+ p-
value
STEM <0.001
9 100.0 97.6 0.7 1.7 0.0 0.0 0.0 0.0
10 100.0 95.9 1.3 2.6 0.1 0.2 0.0 0.0
11 100.0 93.8 1.6 3.5 0.4 0.6 0.1 0.1
12 100.0 91.7 1.9 4.4 0.5 0.9 0.2 0.4
Non-STEM <0.001
9 100.0 49.6 13.6 23.1 6.7 4.9 1.4 0.8
10 100.0 34.7 13.1 24.4 9.9 9.8 3.6 4.6
11 100.0 19.8 10.6 21.8 11.6 14.3 6.9 15.1
12 100.0 8.4 6.2 14.3 9.4 14.5 9.3 37.8
Does qualify for community college credit <0.001
9 100.0 90.2 4.1 5.6 0.1 0.1 0.0 0.0
10 100.0 78.8 8.8 10.6 0.9 0.7 0.1 0.1
11 100.0 62.0 11.7 17.8 3.1 3.7 0.6 1.0
12 100.0 43.9 12.9 22.8 6.0 8.0 2.3 4.2
Does not qualify for community college credit <0.001
9 100.0 53.2 14.2 20.8 6.2 4.1 1.1 0.6
10 100.0 40.8 14.3 22.6 9.1 7.6 2.6 3.0
11 100.0 27.8 13.1 22.9 11.2 11.6 5.3 8.3
12 100.0 15.1 9.3 18.9 11.1 14.8 8.6 22.2
Occupational <0.001
9 100.0 57.0 15.2 19.6 3.9 3.2 0.6 0.5
10 100.0 40.9 15.5 23.0 7.8 7.5 2.2 3.0
11 100.0 24.0 12.9 22.6 11.0 12.5 5.7 11.4
12 100.0 10.6 7.6 15.9 10.5 14.6 9.0 31.7
Non-occupational <0.001
9 100.0 79.8 11.8 7.1 0.9 0.5 0.0 0.0
10 100.0 74.7 14.1 8.4 1.9 0.8 0.1 0.0
11 100.0 69.6 15.9 10.3 2.7 1.2 0.2 0.1
12 100.0 63.7 17.4 12.3 3.9 2.1 0.4 0.2

177
Appendix A Table 3 Average Number of CTE Courses Passed by the End of the Given Grade, Overall and Divided into STEM/non-STEM, Those Qualifying/Not Qualifying for Community College Credit, and Occupational/Non-Occupatoinal, Restricting the Sample to Students Who Remained in SDUSD Schools from Grade 9 Through Grade 12, Pooling Students over Years 1998-1999 to 2008-2009
Student Grade
All CTE Courses
STEM CTE Courses
Non-STEM CTE Courses
CTE Courses Qualifying for Community College Credit
CTE Courses Not Qualifying for Community College Credit
Occupat-ional CTE Courses
Non-occupational CTE Courses
9 0.6 0.0 0.6 0.1 0.5 0.4 0.2
10 0.9 0.0 0.9 0.2 0.8 0.7 0.2
11 1.5 0.1 1.5 0.4 1.1 1.3 0.3
12 2.5 0.1 2.4 0.7 1.8 2.2 0.3
p-value <0.001 <0.001 <0.001 <0.001 <0.001 <0.001 <0.001

178
Appendix A Table 4: Percentage of Students Completing CTE Cluster Concentrations by Grade and Various Definitions of CTE Concentrations, 1997-1998 to 2008-2009, Restricting Sample to Students Who Remained in SDUSD Schools from Grade 9 Through Grade 12 Student
Grade
Total number
of students
Percentage of
Students or
Completing 3
or More CTE
Courses
(Investors)
Percentage of
Students
Completing
One or More 2-
Course CTE
Concentrations
Percentage of
Students
Completing
One or More 3-
Course CTE
Concentrations
Percentage of
Students
Completing
One or More
ROP Capstone
Courses
Percentage of
Students
Completing
One or More
2-Course CTE
Concentrations
and/or One or
More ROP
Courses
9 49160 1.4 1.7 0.0 1.0 2.7
10 49793 6.1 4.9 0.2 5.0 9.3
11 48666 17.7 12.5 1.1 18.5 26.5
12 45883 40.4 28.0 8.6 45.6 55.0

179
Appendix A Table 5: A Cohort Analysis of Percentage of Students Completing CTE Cluster Concentrations by Grade and Various Definitions of CTE Concentrations, Restricting Sample to Students Who Remained in SDUSD Schools from Grade 9 Through Grade 12
Student Grade
Percentage of Students Completing 3 or More CTE Courses
Percentage of Students Completing One or More 2-Course CTE Concentrations
Percentage of Students Completing One or More 3-Course CTE Concentrations
Percentage of Students Completing One or More ROP Capstone Courses
Percentage of Students Completing One or More 2-Course CTE Concentrations and/or One or More ROP Courses
Class of 2002
9 0.9 1.1 0.0 0.9 1.9
10 6.5 5.4 0.2 4.3 9.3
11 24.5 13.9 1.3 17.2 27.3
12 49.0 29.2 7.5 35.8 50.6
Class of 2003
9 1.6 1.4 0.0 1.2 2.5
10 7.3 4.7 0.3 5.2 9.5
11 19.7 12.0 1.1 14.1 23.1
12 42.2 26.0 7.9 36.7 49.0
Class of 2004
9 1.9 1.8 0.0 1.3 3.1
10 6.4 4.7 0.1 4.8 9.0
11 18.1 11.2 0.7 15.3 23.7
12 42.4 26.5 8.2 41.0 52.5
Class of 2005
9 1.6 1.6 0.0 1.2 2.8
10 5.5 4.2 0.1 4.8 8.6
11 14.5 9.7 0.7 16.5 23.6
12 38.4 25.3 6.4 47.0 55.5
Class of 2006
9 2.1 1.3 0.0 0.9 2.0
10 5.3 3.5 0.1 4.0 7.0
11 13.7 10.2 1.0 18.6 24.6
12 33.6 24.8 7.3 45.5 52.6 Continued on next page:

180
Continued:
Student Grade
Percentage of Students Completing 3 or More CTE Courses
Percentage of Students Completing One or More 2-Course CTE Concentrations
Percentage of Students Completing One or More 3-Course CTE Concentrations
Percentage of Students Completing One or More ROP Capstone Courses
Percentage of Students Completing One or More 2-Course CTE Concentrations and/or One or More ROP Courses
Class of 2007
9 1.2 1.4 0.1 0.8 2.2
10 4.6 3.1 0.2 4.6 7.4
11 14.2 11.2 1.0 19.4 25.6
12 35.7 27.2 8.6 49.0 56.3
Class of 2008
9 1.4 3.4 0.1 1.6 5.0
10 6.5 6.9 0.1 6.1 12.2
11 18.7 15.4 1.2 22.0 31.3
12 40.5 30.9 9.9 51.7 49.8
Class of 2009
9 1.1 1.2 0.0 1.4 2.5
10 6.5 5.3 0.2 6.3 10.7
11 18.7 13.9 1.5 23.4 30.8
12 41.8 31.5 11.6 53.1 60.3
Notes: Includes courses from 8th grade. The 'class of' may include students who were held back the prior year. There are different sample sizes for each grade level due to grade retention/skipping

181
Appendix A Table 6: Percentage of High School Students Completing CTE Cluster Concentrations before Leaving the District or Graduating, by SST Occupational Cluster and Various Definitions of CTE Concentrations, Restricting the Sample to Students Who Remained in SDUSD Schools from Grade 9 Through Grade 12, 1997-1998 to 2008-2009
SST Occupational Cluster
Percentage of Students Completing One or More 2-Course CTE Concentrations
Percentage of Students Completing One or More 3-Course CTE Concentrations
Percentage of Students Completing One or More ROP Capstone Courses
Percentage of Students Completing One or More 2-Course CTE Concentrations and/or One or More ROP Courses
Family and Consumer Sciences Education
0.2 0.0 0.9 1.1
General Labor Market Preparation 1.3 0.1 0.0 1.3
Specific Labor Market Preparation (Occupational Education)
Agriculture and Natural Resources
None None None None
Communications and Design
12.4 5.5 10.5 18.7
Computer and Information Sciences
2.5 0.6 3.4 4.8
Health Sciences 0.8 0.1 2.9 2.9
Marketing 1.0 0.1 3.7 3.9
Business Support
5.7 1.1 14.2 16.2
Business Management
1.0 0.2 3.7 3.8
Business Finance
0.4 0.2 1.0 1.1
Engineering Technologies
1.3 0.4 3.9 4.0
Architecture 0.2 0.0 0.3 0.4
Continued on next page:

182
Continued:
SST Occupational Cluster
Percentage of Students Completing One or More 2-Course CTE Concentrations
Percentage of Students Completing One or More 3-Course CTE Concentrations
Percentage of Students Completing One or More ROP Capstone Courses
Percentage of Students Completing One or More 2-Course CTE Concentrations and/or One or More ROP Courses
Construction 1.1 0.2 0.7 1.5
Manufacturing 0.2 0.0 2.1 2.2
Mechanics and Repair
1.7 0.3 3.7 4.6
Transportation 0.0 0.0 0.0 0.0
Consumer Services
0.8 0.1 5.4 5.5
Culinary Arts 0.9 0.1 4.5 4.5
Education 0.7 0.0 2.0 2.0
Library Science 0.2 0.0 0.0 0.2
Public Administration
None None None None
Legal Services None None None None
Protective Services
0.0 0.0 0.3 0.3

183
Appendix A Table 7: Table of Means and Standard Deviations from Probit Analysis for Grade 12 Outcomes
Variable name Mean Standard Deviation
Any 3 course concentrator by 12th grade 0.4 0.5
2 course concentrator in one field by 12th 0.3 0.4
3 course concentrator in one field by 12th 0.1 0.3
Capstone course taken by 12th grade 0.4 0.5
2 course concentrator or capstone taken 0.5 0.5
Took at least 1 CTE course by 12th grade 0.9 0.3
Took a STEM course by 12th grade 0.1 0.3
Took a Tech Prep course by 12th grade 0.5 0.5
Cumulative CTE courses taken by 12th grade 4.5 3.5
Female student 0.5 0.5
African American student 0.1 0.4
Asian American student 0.2 0.4
Hispanic student 0.3 0.5
Other race student 0.9 0.1
EL student in 8th grade 0.1 0.3
Special Ed in 8th grade 0.1 0.2
GPA 2.0-2.99 0.3 0.5
GPA 3.0-3.49 0.2 0.4
GPA 3.5-4.0 0.2 0.4
GPA missing 0.2 0.4
Behavior GPA 2.0-2.99 0.1 0.3
Behavior GPA 3.0-3.49 0.1 0.3
Behavior GPA 3.50-4.0 0.2 0.4
Behavior GPA missing 0.5 0.5
Standardized reading score in 8th grade 0.2 0.9
Standardized math score in 8th grade 0.2 0.9
Average school percent black 14.0 7.9
Average school percent Asian 19.9 14.5
Average school percent Hispanic 34.1 15.9
Average school percent Native American 0.6 0.3
Average school percent Pacific Islander 0.7 0.5
Average percent of school on lunch assistance 42.3 22.9
Average of magnet schools attended 0.2 0.3
Continued on next page:

184
Continued:
Variable name Mean
Standard Deviation
Average of charter schools attended 0.0 0.1
Average of atypical schools attended 0.0 0.1
Average of courses offered 262.2 59.9
Average of school enrollment 1743.5 553.3
Average school percent CTE courses
Average of teacher years experience 12.8 4.4
Average pct of teacher masters degree 56.9 18.6
Average pct of female teachers 48.0 15.2
Average pct of intern teachers 0.9 3.0
Average pct of emergency teachers 3.1 5.3
Average pct of black teachers 6.1 8.2
Average pct of Asian teachers 7.1 7.7
Average pct of Hispanic teachers 6.9 8.5
Average pct of other race teachers 2.3 4.6
Sample size 49184

185
Appendix A Table 8: Probit Analysis of the Determinants of Students Becoming a CTE Investor (i.e. Taking Three or More CTE Courses of Any Kind) or Ever Taking Any CTE Course by Grade 12
Any 3 CTE
courses taken by grade 12 dp/dx
Took CTE by grade
12 dp/dx
Student is female -0.1072 -0.0405 -0.1537 -0.0240
(0.0311)** (0.0117)** (0.0206)** (0.0033)**
Student is African American
-0.2363 -0.0865 -0.0774 -0.0125
(0.0450)** (0.0160)** (0.0269)** (0.0046)**
Student is Asian 0.0001 0.0000 0.0496 0.0076
(0.0462) (0.0175) (0.0412) (0.0062)
Student is Hispanic -0.1878 -0.0702 -0.0658 -0.0104
(0.0358)** (0.0134)** (0.0301)* (0.0048)*
Student is other race -0.1421 -0.0524 -0.0449 -0.0072
(0.0710)* (0.0256)* (0.0720) (0.0120)
Student was EL in 8th grade
-0.1674 -0.0619 -0.1067 -0.0176
(0.0469)** (0.0168)** (0.0357)** (0.0064)**
Student was special education in 8th
-0.3194 -0.1138 -0.2396 -0.0431
(0.0620)** (0.0205)** (0.0493)** (0.0098)**
GPA between 2.0-2.99
0.2596 0.0993 0.0558 0.0086
(0.0308)** (0.0118)** (0.0266)* (0.0040)*
GPA between 3.0-3.49
0.3338 0.1295 -0.0391 -0.0062
(0.0436)** (0.0171)** (0.0405) (0.0066)
GPA between 3.5-4.0
0.2257 0.0868 -0.1964 -0.0330
(0.0501)** (0.0193)** (0.0501)** (0.0092)**
GPA is missing 0.3740 0.1454 -0.2463 -0.0429
(0.0885)** (0.0349)** (0.1022)* (0.0201)*
Behavior GPA between 2.0-2.99
0.1560 0.0600 0.0697 0.0105
(0.0423)** (0.0167)** (0.0497) (0.0073)
Behavior GPA between 3.0-3.49
0.2155 0.0834 0.0888 0.0132
(0.0445)** (0.0177)** (0.0510) (0.0073)
Continued on next page:

186
Continued:
Any 3 CTE
courses taken by grade 12 dp/dx
Took CTE by grade
12 dp/dx
Behavior GPA between 3.5-4.0
0.1738 0.0666 0.0605 0.0092
(0.0474)** (0.0185)** (0.0540) (0.0081)
Missing behavior GPA
0.0879 0.0332 0.0502 0.0078
(0.0463) (0.0176) (0.0521) (0.0082)
8th grade reading CST score
-0.0025 -0.0009 -0.0662 -0.0103
(0.0177) (0.0067) (0.0175)** (0.0028)**
8th grade math CST score
-0.0435 -0.0164 -0.0574 -0.0089
(0.0209)* (0.0079)* (0.0167)** (0.0026)**
Algebra 2 CST taken
0.0029 0.0011 0.5078 0.0552
(0.1542) (0.0584) (0.1369)** (0.0098)**
8th/9th grade math CST taken
-0.0087 -0.0033 -0.0336 -0.0054
(0.0472) (0.0178) (0.0606) (0.0099)
Geometry CST taken
-0.2421 -0.0874 -0.0212 -0.0033
(0.0690)** (0.0236)** (0.0385) (0.0062)
Integrated math 1 CST taken
0.1435 0.0554 -0.0780 -0.0128
(0.1615) (0.0633) (0.2142) (0.0370)
Integrated math 2 CST taken
-0.1663 -0.0610 -0.1635 -0.0285
(0.2482) (0.0878) (0.3618) (0.0697)
Integrated math 3 CST taken
-0.3728 -0.1299 -0.4174 -0.0850
(0.3467) (0.1081) (0.3346) (0.0846)
7th grade math CST taken
0.4767 0.1877 0.0745 0.0110
(0.6184) (0.2439) (0.6679) (0.0937)
8th grade math CST taken
-0.0112 -0.0042 -0.0534 -0.0086
(0.0597) (0.0225) (0.0772) (0.0129)
Continued on next page:

187
Continued:
Any 3 CTE
courses taken by grade 12 dp/dx
Took CTE by grade
12 dp/dx
Mean school percent black
-0.0015 -0.0006 0.0006 0.0001
(0.0046) (0.0017) (0.0041) (0.0006)
Mean school percent Asian
0.0075 0.0028 0.0130 0.0020
(0.0034)* (0.0013)* (0.0035)** (0.0006)**
Mean school percent Hispanic
-0.0085 -0.0032 0.0011 0.0002
(0.0041)* (0.0016)* (0.0043) (0.0007)
Mean school percent Native American
-0.1100 -0.0416 -0.0415 -0.0065
(0.0829) (0.0313) (0.0941) (0.0147)
Mean school percent Pacific Islander
-0.2288 -0.0866 -0.1624 -0.0253
(0.0792)** (0.0299)** (0.0849) (0.0134)
Mean school percent on reduced meal plan
0.0152 0.0058 0.0077 0.0012
(0.0031)** (0.0012)** (0.0028)** (0.0004)**
Mean school percent of courses that are CTE
0.0485 0.0184 0.0510 0.0080
(0.0077)** (0.0030)** (0.0083)** (0.0013)**
Mean of magnet schools attended
0.1972 0.0746 0.2036 0.0318
(0.1175) (0.0446) (0.0829)* (0.0128)*
Mean of charter schools attended
-1.8281 -0.6917 0.1031 0.0161
(0.2682)** (0.1019)** (0.1656) (0.0258)
Mean of atypical schools attended
0.1204 0.0455 -0.2741 -0.0428
(0.5236) (0.1982) (0.3417) (0.0531)
Mean number of courses offered
0.0007 0.0003 -0.0010 -0.0002
(0.0006) (0.0002) (0.0007) (0.0001)
Continued on next page:

188
Continued:
Any 3 CTE
courses taken by grade 12 dp/dx
Took CTE by grade
12 dp/dx
Mean of school enrollment size
-0.0003 -0.0001 -0.0002 -0.0000
(0.0001)** (0.0000)** (0.0001)* (0.0000)*
Mean years teacher experience
0.0013 0.0005 -0.0148 -0.0023
(0.0054) (0.0020) (0.0046)** (0.0007)**
Mean of teacher MA/MS degree
0.0027 0.0010 0.0052 0.0008
(0.0013)* (0.0005)* (0.0010)** (0.0002)**
Mean of female teachers
0.0012 0.0005 0.0010 0.0002
(0.0011) (0.0004) (0.0012) (0.0002)
Mean of intern teachers
0.0005 0.0002 0.0014 0.0002
(0.0039) (0.0015) (0.0044) (0.0007)
Mean of emergency teachers
-0.0057 -0.0022 -0.0062 -0.0010
(0.0019)** (0.0007)** (0.0025)* (0.0004)*
Mean of black teachers
0.0040 0.0015 0.0065 0.0010
(0.0023) (0.0009) (0.0029)* (0.0004)*
Mean of Asian teachers
0.0052 0.0020 0.0026 0.0004
(0.0020)** (0.0008)** (0.0016) (0.0002)
Mean of Hispanic teachers
0.0035 0.0013 0.0034 0.0005
(0.0016)* (0.0006)* (0.0021) (0.0003)
Mean of other race teachers
-0.0014 -0.0005 -0.0029 -0.0005
(0.0024) (0.0009) (0.0030) (0.0005)
Graduating class of 2003
0.0042 0.0016 0.0248 0.0038
(0.0604) (0.0229) (0.0498) (0.0076)
Graduating class of 2004
0.0906 0.0346 0.1348 0.0196
(0.0824) (0.0319) (0.0638)* (0.0088)*
Continued on next page:

189
Continued:
Any 3 CTE
courses taken by grade 12 dp/dx
Took CTE by grade
12 dp/dx
Graduating class of 2005
-0.0288 -0.0108 0.1197 0.0175
(0.0928) (0.0349) (0.0653) (0.0090)
Graduating class of 2006
-0.1202 -0.0447 0.0046 0.0007
(0.1039) (0.0379) (0.0594) (0.0092)
Graduating class of 2007
-0.0841 -0.0315 -0.0086 -0.0013
(0.0996) (0.0369) (0.0546) (0.0086)
Graduating class of 2008
0.0396 0.0150 -0.5604 -0.1136
(0.0936) (0.0357) (0.0766)** (0.0198)**
Graduating class of 2009
0.0773 0.0295 -0.9346 -0.2189
(0.0811) (0.0311) (0.0873)** (0.0262)**
Graduating class of 2010
-0.6533 -0.2094 -1.3909 -0.4195
(0.1487)** (0.0373)** (0.0905)** (0.0345)**
Missing EL status -0.0579 -0.0218 0.5101 0.0623
(0.0723) (0.0270) (0.1065)** (0.0099)**
Missing 8th grade reading score
-0.1701 -0.0631 -0.2116 -0.0361
(0.0671)* (0.0244)** (0.0612)** (0.0107)**
Missing 8th grade math score
-0.1508 -0.0561 -0.3453 -0.0622
(0.0538)** (0.0197)** (0.0443)** (0.0092)**
Missing school enrollment
-0.6650 -0.2115 -1.0534 -0.2902
(0.6804) (0.1663) (0.3810)** (0.1445)*
6th grade math CST taken
-0.1414 -0.0242
Constant -1.6720
0.5088
(0.2821)**
(0.3006)
Continued on next page:

190
Continued:
Any 3 CTE
courses taken by grade 12 dp/dx
Took CTE by grade
12 dp/dx
Missing percent of courses that are CTE
-0.5281 -0.1145
(0.7812) (0.2189)
Observations 49184 . 49198 .
Robust standard errors in parentheses * significant at 5%; ** significant at 1%
Note: In this and later tables missing coefficients indicate that the variable was dropped because it was a perfect predictor of the outcome.
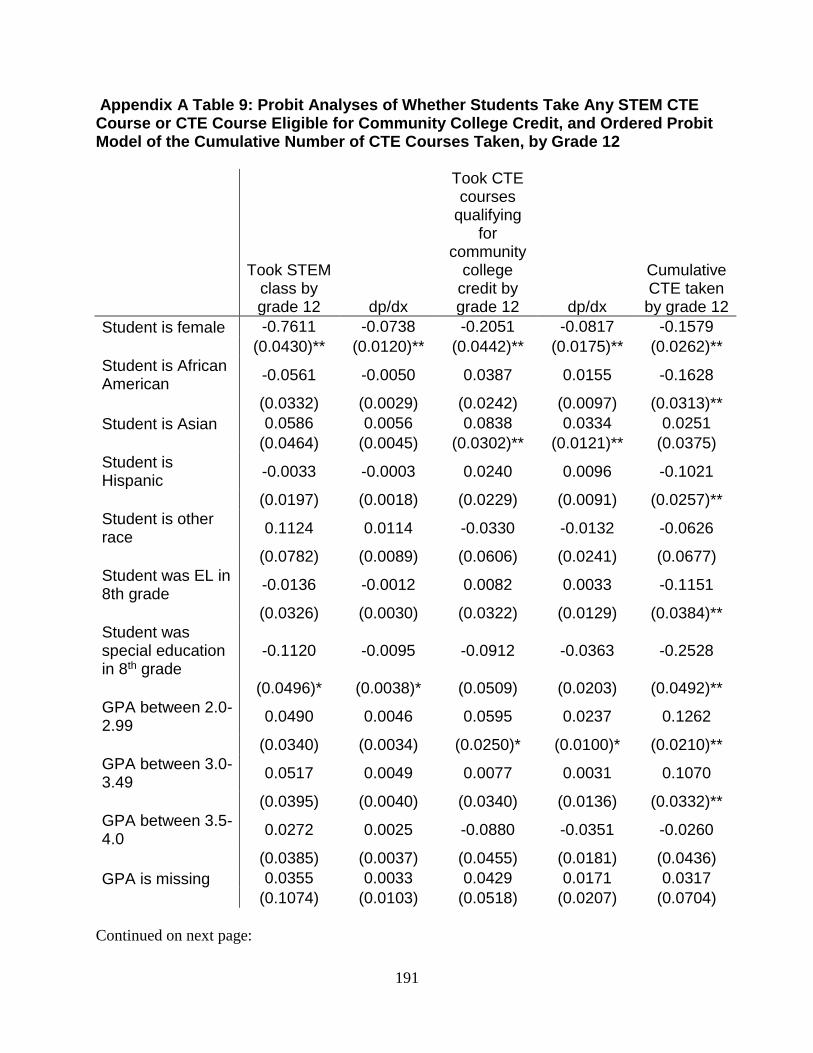
191
Appendix A Table 9: Probit Analyses of Whether Students Take Any STEM CTE Course or CTE Course Eligible for Community College Credit, and Ordered Probit Model of the Cumulative Number of CTE Courses Taken, by Grade 12
Took STEM class by grade 12 dp/dx
Took CTE courses
qualifying for
community college
credit by grade 12 dp/dx
Cumulative CTE taken by grade 12
Student is female -0.7611 -0.0738 -0.2051 -0.0817 -0.1579
(0.0430)** (0.0120)** (0.0442)** (0.0175)** (0.0262)**
Student is African American
-0.0561 -0.0050 0.0387 0.0155 -0.1628
(0.0332) (0.0029) (0.0242) (0.0097) (0.0313)**
Student is Asian 0.0586 0.0056 0.0838 0.0334 0.0251
(0.0464) (0.0045) (0.0302)** (0.0121)** (0.0375)
Student is Hispanic
-0.0033 -0.0003 0.0240 0.0096 -0.1021
(0.0197) (0.0018) (0.0229) (0.0091) (0.0257)**
Student is other race
0.1124 0.0114 -0.0330 -0.0132 -0.0626
(0.0782) (0.0089) (0.0606) (0.0241) (0.0677)
Student was EL in 8th grade
-0.0136 -0.0012 0.0082 0.0033 -0.1151
(0.0326) (0.0030) (0.0322) (0.0129) (0.0384)**
Student was special education in 8th grade
-0.1120 -0.0095 -0.0912 -0.0363 -0.2528
(0.0496)* (0.0038)* (0.0509) (0.0203) (0.0492)**
GPA between 2.0-2.99
0.0490 0.0046 0.0595 0.0237 0.1262
(0.0340) (0.0034) (0.0250)* (0.0100)* (0.0210)**
GPA between 3.0-3.49
0.0517 0.0049 0.0077 0.0031 0.1070
(0.0395) (0.0040) (0.0340) (0.0136) (0.0332)**
GPA between 3.5-4.0
0.0272 0.0025 -0.0880 -0.0351 -0.0260
(0.0385) (0.0037) (0.0455) (0.0181) (0.0436)
GPA is missing 0.0355 0.0033 0.0429 0.0171 0.0317
(0.1074) (0.0103) (0.0518) (0.0207) (0.0704)
Continued on next page:

192
Continued:
Took STEM class by grade 12
dp/dx
Took CTE courses
qualifying for
community college
credit by grade 12
dp/dx Cumulative CTE taken by grade 12
Behavior GPA between 2.0-2.99
0.0102 0.0009 0.0327 0.0130 0.0685
(0.0408) (0.0038) (0.0313) (0.0125) (0.0341)*
Behavior GPA between 3.0-3.49
0.0797 0.0078 0.0040 0.0016 0.0965
(0.0595) (0.0062) (0.0337) (0.0135) (0.0313)**
Behavior GPA between 3.5-4.0
0.0052 0.0005 -0.0275 -0.0110 0.0624
(0.0582) (0.0054) (0.0361) (0.0144) (0.0388)
Missing behavior GPA
-0.0520 -0.0048 0.0942 0.0376 -0.0040
(0.0610) (0.0058) (0.0436)* (0.0174)* (0.0360)
8th grade reading CST score
-0.0279 -0.0026 -0.0934 -0.0373 -0.0059
(0.0282) (0.0028) (0.0163)** (0.0065)** (0.0156)
8th grade math CST score
0.0693 0.0064 -0.0698 -0.0278 -0.0506
(0.0258)** (0.0029)* (0.0124)** (0.0049)** (0.0152)**
Algebra 2 CST taken
-0.2069 -0.0159 -0.2032 -0.0803 -0.0136
(0.3161) (0.0203) (0.2325) (0.0903) (0.0931)
8th/9th grade math CST taken
-0.1087 -0.0092 -0.0132 -0.0053 -0.0020
(0.1150) (0.0096) (0.0601) (0.0240) (0.0565)
Geometry CST taken
-0.1984 -0.0155 -0.2971 -0.1165 -0.1716
(0.1254) (0.0077)* (0.0847)** (0.0322)** (0.0495)**
Integrated math 1 CST taken
-0.0716 -0.0062 0.2875 0.1135 0.1166
(0.2615) (0.0212) (0.1581) (0.0609) (0.1010)
Integrated math 2 CST taken
0.1454 0.0151 -0.0287 -0.0114 -0.1246
(0.2855) (0.0332) (0.2454) (0.0978) (0.2189)
Continued on next page:

193
Continued:
Took STEM class by grade 12
dp/dx
Took CTE courses
qualifying for
community college
credit by grade 12
dp/dx Cumulative CTE taken by grade 12
Integrated math 3 CST taken
-0.8090 -0.0376 -0.3229 -0.1261 -0.1190
(0.2151)** (0.0071)** (0.2881) (0.1080) (0.2428)
6th grade math CST taken
0.0000
-0.9826
(0.0000)
(0.0911)**
7th grade math CST taken
0.6177 0.0934 0.6358 0.2391 0.5003
(0.4279) (0.0951) (0.6434) (0.2116) (0.5400)
8th grade math CST taken
-0.0873 -0.0075 0.0166 0.0066 -0.0167
(0.0756) (0.0064) (0.0541) (0.0216) (0.0432)
Mean school percent black
-0.0095 -0.0009 -0.0040 -0.0016 -0.0004
(0.0116) (0.0011) (0.0083) (0.0033) (0.0052)
Mean school percent Asian
0.0128 0.0012 0.0022 0.0009 0.0081
(0.0118) (0.0010) (0.0060) (0.0024) (0.0030)**
Mean school percent Hispanic
-0.0082 -0.0008 -0.0051 -0.0020 -0.0091
(0.0105) (0.0010) (0.0059) (0.0024) (0.0040)*
Mean school percent Native American
0.0383 0.0035 -0.0563 -0.0225 -0.1716
(0.3000) (0.0278) (0.2543) (0.1014) (0.0955)
Mean school percent Pacific Islander
0.4909 0.0452 -0.1100 -0.0439 -0.2481
(0.1262)** (0.0117)** (0.1114) (0.0444) (0.0827)**
Mean school percent on reduced meal plan
0.0075 0.0007 0.0123 0.0049 0.0156
(0.0076) (0.0007) (0.0040)** (0.0016)** (0.0032)**
Continued on next page:

194
Continued:
Took STEM class by grade 12
dp/dx
Took CTE courses
qualifying for
community college
credit by grade 12
dp/dx Cumulative CTE taken by grade 12
Mean school percent of courses that are CTE
0.0938 0.0086 0.0380 0.0152 0.0591
(0.0192)** (0.0019)** (0.0128)** (0.0051)** (0.0078)**
Mean of magnet schools attended
-0.0404 -0.0037 0.0233 0.0093 0.1260
(0.1697) (0.0157) (0.1415) (0.0564) (0.1153)
Mean of charter schools attended
-0.0945 -0.0087 -0.4942 -0.1971 -0.2973
(0.4540) (0.0423) (0.2861) (0.1141) (0.1526)
Mean of atypical schools attended
-0.3056 -0.0281 -0.7540 -0.3007 0.2648
(0.5168) (0.0485) (0.4376) (0.1746) (0.5614)
Mean number of courses offered
0.0016 0.0001 -0.0003 -0.0001 -0.0001
(0.0020) (0.0002) (0.0014) (0.0006) (0.0006)
Mean of school enrollment size
-0.0006 -0.0001 -0.0003 -0.0001 -0.0003
(0.0003) (0.0000)* (0.0001)* (0.0001)* (0.0001)**
Mean years teacher experience
-0.0316 -0.0029 -0.0121 -0.0048 -0.0128
(0.0088)** (0.0008)** (0.0057)* (0.0023)* (0.0046)**
Mean of teacher MA/MS degree
0.0032 0.0003 0.0060 0.0024 0.0040
(0.0019) (0.0002) (0.0017)** (0.0007)** (0.0015)**
Mean of female teachers
-0.0011 -0.0001 -0.0009 -0.0004 -0.0000
(0.0017) (0.0002) (0.0014) (0.0006) (0.0009)
Mean of intern teachers
-0.0059 -0.0005 0.0029 0.0012 0.0026
(0.0076) (0.0007) (0.0036) (0.0014) (0.0038)
Continued on next page:

195
Continued:
Took STEM class by grade 12
dp/dx
Took CTE courses
qualifying for
community college
credit by grade 12
dp/dx Cumulative CTE taken by grade 12
Mean of emergency teachers
-0.0004 -0.0000 0.0010 0.0004 -0.0039
(0.0042) (0.0004) (0.0024) (0.0010) (0.0021)
Mean of black teachers
-0.0003 -0.0000 0.0060 0.0024 0.0058
(0.0031) (0.0003) (0.0030)* (0.0012)* (0.0025)*
Mean of Asian teachers
0.0095 0.0009 0.0009 0.0004 0.0035
(0.0034)** (0.0003)** (0.0022) (0.0009) (0.0016)*
Mean of Hispanic teachers
0.0039 0.0004 0.0126 0.0050 0.0019
(0.0024) (0.0002) (0.0026)** (0.0010)** (0.0015)
Mean of other race teachers
0.0071 0.0007 -0.0062 -0.0025 -0.0038
(0.0065) (0.0006) (0.0047) (0.0019) (0.0023)
Graduating class of 2003
0.1064 0.0105 0.0466 0.0186 0.0808
(0.1137) (0.0119) (0.0663) (0.0264) (0.0681)
Graduating class of 2004
0.3996 0.0478 0.1507 0.0600 0.2283
(0.1485)** (0.0231)* (0.0902) (0.0358) (0.0956)*
Graduating class of 2005
0.4418 0.0542 0.3904 0.1535 0.1480
(0.1748)* (0.0280) (0.0948)** (0.0358)** (0.0876)
Graduating class of 2006
0.6732 0.0954 0.4238 0.1662 0.0531
(0.1632)** (0.0344)** (0.1139)** (0.0425)** (0.1011)
Graduating class of 2007
0.6598 0.0909 0.4593 0.1798 0.0533
(0.1683)** (0.0343)** (0.1069)** (0.0395)** (0.0889)
Graduating class of 2008
0.4728 0.0583 0.0680 0.0271 -0.5403
(0.2260)* (0.0382) (0.1271) (0.0507) (0.1006)**
Continued on next page:

196
Continued:
Took STEM class by grade 12
dp/dx
Took CTE courses
qualifying for
community college
credit by grade 12
dp/dx Cumulative CTE taken by grade 12
Graduating class of 2009
0.4271 0.0511 -0.5424 -0.2089 -1.0198
(0.2805) (0.0446) (0.1287)** (0.0456)** (0.0899)**
Graduating class of 2010
0.3707 0.0462 -0.6432 -0.2387 -1.3873
(0.3199) (0.0533) (0.1888)** (0.0607)** (0.0897)**
Missing EL status 0.1369 0.0137 0.0421 0.0168 0.1530
(0.1608) (0.0176) (0.0787) (0.0314) (0.0746)*
Missing 8th grade reading score
-0.1170 -0.0101 0.0487 0.0194 -0.1699
(0.0844) (0.0074) (0.0629) (0.0251) (0.0491)**
Missing 8th grade math score
-0.1563 -0.0133 -0.2028 -0.0805 -0.1889
(0.0968) (0.0075) (0.0560)** (0.0221)** (0.0454)**
Missing school enrollment
-1.1612 -0.3729 -1.0996
(0.4360)** (0.0887)** (0.4663)*
6th grade math CST taken
0.1007 0.0402
(0.0989) (0.0394)
Constant -3.4944
-0.7746
(0.6245)**
(0.4849)
Missing percent of
classes that are CTE
-0.4162
(0.6727)
Missing total number of courses offered
1.6214
(0.7051)* Observations 49157 . 49190 . 49203
Notes: Robust standard errors in parentheses * significant at 5 percent; ** significant at 1 percent

197
The model of cumulative CTE courses take by the end of grade 12 is an ordered probit model. Because the ordered probit estimates a separate intercept for each cutpoint, in order for the model to be identified we had to combine a small number of students with very large numbers of CTE courses completed with the next highest level. Thus, we recoded one student in each of the three highest categories observed(13, 15 and 16 CTE (year-long) courses taken) to the next highest level, which was 12 CTE courses taken.

198
Appendix A Table 10: Probit Models of Two- or Three-Course Cluster Concentrators, Completing a Capstone (ROP) Course, or Becoming Either a Two-Course Cluster Concentrator or Complete a Capstone Course by Grade 12
2 course concentrator
dp/dx 3 course concentrator
dp/dx Capstone course taken
dp/dx 2 course concentrator or capstone
course taken
dp/dx
Student is female -0.0403 -0.0129 0.0190 0.0023 -0.0920 -0.0361 -0.0653 -0.0260
(0.0272) (0.0087) (0.0354) (0.0042) (0.0359)* (0.0140)** (0.0253)** (0.0101)*
Student is African American
-0.2382 -0.0715 -0.3982 -0.0382 0.0079 0.0031 -0.0949 -0.0378
(0.0464)** (0.0125)** (0.0431)** (0.0035)** (0.0386) (0.0152) (0.0389)* (0.0155)*
Student is Asian -0.0301 -0.0096 -0.1431 -0.0161 0.0270 0.0106 -0.0086 -0.0034
(0.0431) (0.0136) (0.0460)** (0.0049)** (0.0502) (0.0197) (0.0450) (0.0179)
Student is Hispanic -0.1521 -0.0477 -0.2265 -0.0256 -0.0100 -0.0039 -0.0742 -0.0296
(0.0350)** (0.0106)** (0.0346)** (0.0038)** (0.0268) (0.0105) (0.0238)** (0.0095)**
Student is other race -0.0993 -0.0307 -0.0522 -0.0060 0.0473 0.0186 -0.0147 -0.0059
(0.0850) (0.0254) (0.1059) (0.0117) (0.0512) (0.0202) (0.0686) (0.0273)
Student was EL in 8th grade
-0.1094 -0.0340 -0.1080 -0.0121 -0.0969 -0.0377 -0.1028 -0.0410
(0.0413)** (0.0123)** (0.0620) (0.0064) (0.0384)* (0.0148)* (0.0424)* (0.0169)*
Student was special education in 8th grade
-0.1818 -0.0548 -0.1368 -0.0148 -0.2393 -0.0914 -0.2337 -0.0930
(0.0550)** (0.0154)** (0.0471)** (0.0046)** (0.0454)** (0.0177)** (0.0479)** (0.0190)**
GPA between 2.0-2.99 0.2029 0.0663 0.2052 0.0260 0.1129 0.0445 0.1324 0.0525
(0.0279)** (0.0092)** (0.0324)** (0.0045)** (0.0270)** (0.0106)** (0.0271)** (0.0107)**
Continued on next page:

199
Continued:
2 course concentrator
dp/dx 3 course
concentrator dp/dx
Capstone course taken
dp/dx
2 course concentrator or capstone
course taken
dp/dx
GPA between 3.0-3.49 0.2742 0.0924 0.2888 0.0399 0.1304 0.0515 0.1714 0.0677
(0.0340)** (0.0119)** (0.0489)** (0.0078)** (0.0316)** (0.0123)** (0.0294)** (0.0116)**
GPA between 3.5-4.0 0.2270 0.0753 0.2828 0.0382 0.0402 0.0158 0.1084 0.0430
(0.0446)** (0.0152)** (0.0494)** (0.0076)** (0.0499) (0.0195) (0.0423)* (0.0168)*
GPA is missing 0.1047 0.0342 0.0154 0.0019 0.0558 0.0220 0.0686 0.0272
(0.0577) (0.0189) (0.0948) (0.0115) (0.0751) (0.0296) (0.0680) (0.0269)
Behavior GPA between 2.0-2.99
0.1386 0.0457 0.1240 0.0159 0.0615 0.0242 0.0614 0.0244
(0.0401)** (0.0140)** (0.0740) (0.0105) (0.0248)* (0.0099)* (0.0254)* (0.0100)*
Behavior GPA between 3.0-3.49
0.1308 0.0432 0.0832 0.0105 0.0913 0.0360 0.0701 0.0278
(0.0411)** (0.0143)** (0.0680) (0.0092) (0.0289)** (0.0116)** (0.0286)* (0.0112)*
Behavior GPA between 3.5-4.0
0.1470 0.0481 0.1415 0.0180 0.0421 0.0165 0.0620 0.0246
(0.0421)** (0.0144)** (0.0794) (0.0110) (0.0450) (0.0178) (0.0352) (0.0139)
Missing behavior GPA 0.0793 0.0253 0.0572 0.0068 0.0869 0.0341 0.0652 0.0259
(0.0408) (0.0132) (0.0757) (0.0092) (0.0537) (0.0213) (0.0497) (0.0197)
8th grade reading CST score
0.0314 0.0100 0.0882 0.0105 -0.0548 -0.0215 -0.0233 -0.0093
(0.0144)* (0.0047)* (0.0183)** (0.0022)** (0.0193)** (0.0076)** (0.0172) (0.0068)
8th grade math CST score
-0.0138 -0.0044 -0.0091 -0.0011 -0.0512 -0.0201 -0.0346 -0.0137
(0.0161) (0.0051) (0.0186) (0.0022) (0.0212)* (0.0083)* (0.0196) (0.0078)
Continued on next page:

200
Continued:
2 course concentrator
dp/dx 3 course
concentrator dp/dx
Capstone course taken
dp/dx
2 course concentrator or capstone
course taken
dp/dx
Algebra 2 CST taken -0.0594 -0.0186 0.1324 0.0175 -0.4051 -0.1493 -0.2313 -0.0920
(0.1413) (0.0433) (0.3166) (0.0462) (0.1836)* (0.0609)* (0.1203) (0.0475)
8th/9th grade math CST taken
0.0407 0.0132 -0.0794 -0.0090 -0.0455 -0.0178 -0.0351 -0.0140
(0.0386) (0.0126) (0.0623) (0.0066) (0.0457) (0.0179) (0.0418) (0.0166)
Geometry CST taken -0.1908 -0.0570 -0.1064 -0.0117 -0.4214 -0.1552 -0.3165 -0.1254
(0.0672)** (0.0188)** (0.1140) (0.0115) (0.0731)** (0.0237)** (0.0685)** (0.0266)**
Integrated math 1 CST taken
0.2089 0.0711 -0.3590 -0.0323 0.0138 0.0054 0.1749 0.0688
(0.1549) (0.0558) (0.4412) (0.0280) (0.1478) (0.0582) (0.1497) (0.0578)
Integrated math 2 CST taken
-0.2057 -0.0610 -0.3257 -0.0301 -0.1011 -0.0392 -0.0231 -0.0092
(0.2266) (0.0620) (0.3813) (0.0263) (0.2019) (0.0775) (0.1708) (0.0681)
Integrated math 3 CST taken
-0.2473 -0.0721
-0.4686 -0.1702 -0.3473 -0.1372
(0.1887) (0.0492)
(0.2099)* (0.0687)* (0.1858) (0.0716)
8th grade math CST taken
-0.0962 -0.0298 0.0122 0.0015 0.0239 0.0094 -0.0097 -0.0039
(0.0490)* (0.0147)* (0.0682) (0.0083) (0.0437) (0.0172) (0.0389) (0.0155)
Mean school percent black
0.0051 0.0016 0.0092 0.0011 -0.0081 -0.0032 -0.0069 -0.0027
(0.0048) (0.0015) (0.0070) (0.0008) (0.0118) (0.0047) (0.0078) (0.0031)
Continued on next page:

201
Continued:
2 course concentrator
dp/dx 3 course
concentrator dp/dx
Capstone course taken
dp/dx
2 course concentrator or capstone
course taken
dp/dx
Mean school percent Asian
0.0038 0.0012 -0.0011 -0.0001 0.0148 0.0058 0.0090 0.0036
(0.0033) (0.0011) (0.0034) (0.0004) (0.0084) (0.0032) (0.0048) (0.0019)
Mean school percent Hispanic
-0.0067 -0.0021 -0.0140 -0.0017 0.0032 0.0012 -0.0019 -0.0008
(0.0028)* (0.0009)* (0.0048)** (0.0006)** (0.0073) (0.0028) (0.0049) (0.0019)
Mean school percent Native American
0.0780 0.0249 0.0471 0.0056 -0.1244 -0.0488 -0.0499 -0.0199
(0.0655) (0.0209) (0.1164) (0.0139) (0.3029) (0.1193) (0.1947) (0.0774)
Mean school percent Pacific Islander
-0.1874 -0.0599 -0.3007 -0.0359 -0.1360 -0.0534 -0.1159 -0.0461
(0.0798)* (0.0254)* (0.0761)** (0.0093)** (0.1267) (0.0497) (0.0896) (0.0356)
Mean school percent on reduced meal plan
0.0085 0.0027 0.0118 0.0014 0.0136 0.0053 0.0148 0.0059
(0.0024)** (0.0008)** (0.0031)** (0.0004)** (0.0036)** (0.0014)** (0.0031)** (0.0012)**
Mean school percent of courses that are CTE
0.0304 0.0097 0.0301 0.0036 0.0110 0.0043 0.0105 0.0042
(0.0058)** (0.0019)** (0.0086)** (0.0010)** (0.0148) (0.0058) (0.0108) (0.0043)
Mean of magnet schools attended
0.0817 0.0261 0.3035 0.0363 -0.1665 -0.0653 -0.0252 -0.0100
(0.0857) (0.0273) (0.1051)** (0.0128)** (0.1775) (0.0695) (0.1510) (0.0601)
Continued on next page:

202
Continued:
2 course concentrator
dp/dx 3 course
concentrator dp/dx
Capstone course taken
dp/dx
2 course concentrator or capstone
course taken
dp/dx
Mean of charter schools attended
-1.9391 -0.6193 -2.1430 -0.2561 -2.3667 -0.9289 -2.3980 -0.9540
(0.2884)** (0.0896)** (0.2887)** (0.0326)** (0.2852)** (0.1139)** (0.2356)** (0.0934)**
Mean of atypical schools attended
0.0411 0.0131 -0.5324 -0.0636 -0.8162 -0.3203 -0.7665 -0.3049
(0.5110) (0.1632) (0.3135) (0.0382) (0.6099) (0.2393) (0.5171) (0.2058)
Mean number of courses offered
0.0006 0.0002 0.0013 0.0002 0.0020 0.0008 0.0015 0.0006
(0.0005) (0.0002) (0.0008) (0.0001) (0.0016) (0.0006) (0.0011) (0.0004)
Mean of school enrollment size
-0.0003 -0.0001 -0.0004 -0.0000 -0.0006 -0.0002 -0.0005 -0.0002
(0.0001)** (0.0000)** (0.0001)** (0.0000)** (0.0001)** (0.0000)** (0.0001)** (0.0000)**
Mean years teacher experience
0.0069 0.0022 0.0020 0.0002 -0.0018 -0.0007 0.0046 0.0018
(0.0059) (0.0019) (0.0090) (0.0011) (0.0059) (0.0023) (0.0058) (0.0023)
Mean of teacher MA/MS degree
0.0016 0.0005 0.0010 0.0001 0.0031 0.0012 0.0027 0.0011
(0.0012) (0.0004) (0.0017) (0.0002) (0.0015)* (0.0006)* (0.0012)* (0.0005)*
Mean of female teachers
0.0014 0.0004 -0.0004 -0.0000 0.0013 0.0005 0.0010 0.0004
(0.0010) (0.0003) (0.0012) (0.0001) (0.0017) (0.0007) (0.0014) (0.0006)
Continued on next page:

203
Continued:
2 course concentrator
dp/dx 3 course
concentrator dp/dx
Capstone course taken
dp/dx
2 course concentrator or capstone
course taken
dp/dx
Mean of intern teachers
0.0024 0.0008 -0.0083 -0.0010 -0.0004 -0.0002 0.0000 0.0000
(0.0026) (0.0008) (0.0045) (0.0005) (0.0031) (0.0012) (0.0025) (0.0010)
Mean of emergency teachers
-0.0022 -0.0007 -0.0027 -0.0003 0.0015 0.0006 0.0002 0.0001
(0.0018) (0.0006) (0.0026) (0.0003) (0.0025) (0.0010) (0.0021) (0.0008)
Mean of black teachers
0.0010 0.0003 -0.0009 -0.0001 -0.0010 -0.0004 -0.0001 -0.0001
(0.0026) (0.0008) (0.0030) (0.0004) (0.0031) (0.0012) (0.0028) (0.0011)
Mean of Asian teachers
0.0032 0.0010 0.0001 0.0000 0.0045 0.0018 0.0040 0.0016
(0.0016) (0.0005) (0.0022) (0.0003) (0.0029) (0.0011) (0.0021) (0.0008)
Mean of Hispanic teachers
-0.0003 -0.0001 -0.0046 -0.0006 0.0136 0.0054 0.0097 0.0039
(0.0016) (0.0005) (0.0015)** (0.0002)** (0.0035)** (0.0013)** (0.0020)** (0.0008)**
Mean of other race teachers
0.0019 0.0006 -0.0084 -0.0010 0.0000 0.0000 0.0024 0.0009
(0.0033) (0.0011) (0.0042)* (0.0005)* (0.0038) (0.0015) (0.0031) (0.0012)
Graduating class of 2003
0.0236 0.0076 0.1485 0.0194 0.1401 0.0554 0.0761 0.0302
(0.0678) (0.0219) (0.0918) (0.0131) (0.0931) (0.0370) (0.0690) (0.0272)
Continued on next page:

204
Continued:
2 course concentrator
dp/dx 3 course
concentrator dp/dx
Capstone course taken
dp/dx
2 course concentrator or capstone
course taken
dp/dx
Graduating class of 2004
0.0918 0.0300 0.2187 0.0298 0.3537 0.1403 0.2352 0.0923
(0.0940) (0.0316) (0.1398) (0.0216) (0.1368)** (0.0540)** (0.1076)* (0.0412)*
Graduating class of 2005
0.0548 0.0178 0.0837 0.0105 0.5856 0.2301 0.3462 0.1345
(0.1002) (0.0329) (0.1157) (0.0152) (0.1559)** (0.0589)** (0.1274)** (0.0471)**
Graduating class of 2006
0.0635 0.0206 0.1591 0.0209 0.5797 0.2278 0.3108 0.1212
(0.1043) (0.0344) (0.1280) (0.0182) (0.1865)** (0.0705)** (0.1583)* (0.0592)*
Graduating class of 2007
0.1474 0.0487 0.2580 0.0356 0.6422 0.2515 0.3921 0.1518
(0.0928) (0.0317) (0.1252)* (0.0197) (0.1798)** (0.0671)** (0.1482)** (0.0542)**
Graduating class of 2008
0.2120 0.0710 0.3156 0.0449 0.6970 0.2719 0.4612 0.1772
(0.0973)* (0.0342)* (0.1079)** (0.0180)* (0.1903)** (0.0700)** (0.1501)** (0.0536)**
Graduating class of 2009
0.2324 0.0781 0.4649 0.0716 0.6592 0.2579 0.4142 0.1600
(0.0931)* (0.0326)* (0.1157)** (0.0220)** (0.1771)** (0.0658)** (0.1486)** (0.0539)**
Graduating class of 2010
-0.3922 -0.1080 -0.1082 -0.0119 -0.1102 -0.0427 -0.2693 -0.1069
(0.1334)** (0.0311)** (0.2269) (0.0229) (0.2109) (0.0805) (0.1773) (0.0693)
Missing EL status 0.1443 0.0476 -0.0074 -0.0009 0.0927 0.0366 0.1378 0.0545
(0.0774) (0.0267) (0.0858) (0.0102) (0.0779) (0.0309) (0.0725) (0.0284)
Continued on next page:

205
Continued:
2 course concentrator
dp/dx 3 course
concentrator dp/dx
Capstone course taken
dp/dx
2 course concentrator or capstone
course taken
dp/dx
Missing 8th grade reading score
-0.1411 -0.0437 0.0992 0.0124 -0.0018 -0.0007 -0.0706 -0.0281
(0.0627)* (0.0189)* (0.0709) (0.0092) (0.0547) (0.0215) (0.0484) (0.0193)
Missing 8th grade math score
-0.1122 -0.0350 -0.1499 -0.0167 -0.1809 -0.0701 -0.1682 -0.0670
(0.0480)* (0.0146)* (0.0674)* (0.0067)* (0.0701)** (0.0269)** (0.0620)** (0.0247)**
Missing school enrollment
-0.5391 -0.1385
-1.0393 -0.3172 -0.6099 -0.2336
(0.3983) (0.0768)
(0.7432) (0.1421)* (0.6704) (0.2319)
6th grade math CST taken
0.1426 0.0565 0.0448 0.0178
(0.1233) (0.0489) (0.0936) (0.0371)
7th grade math CST taken
-0.5348 -0.1912 -0.6392 -0.2436
(0.5886) (0.1836) (0.5900) (0.2014)
Constant -1.6060
-2.0531
-1.3301
-0.9205
(0.2498)**
(0.3276)**
(0.9054)
(0.5556)
Observations 49192 . 49133 . 49203 . 49203 . Robust standard errors in parentheses * significant at 5 percent; ** significant at 1 percent

206
Appendix B: Additional Material Related to High School
Academic Outcomes
As mentioned above, Appendix B Tables 1 and 2 show the means and standard
deviations of all the regressors in the reading models in Table 6.1, and the corresponding
data for the dependent variables used in Chapter 6 (Appendix B Table 2), respectively.
Appendix B Tables 3 through 7 reproduce the OLS results from Tables 2.3
through 2.7 respectively, but without student fixed effects, and then show the results from
tobit, probit and ordered probit versions of the same models. The goal here is to study
whether the use of OLS has distorted the level of significance of any of the CTE course-
work coefficients.
Appendix B Tables 8 and 9 show the means and standard deviations of all the
regressors in the graduation models in Table 7.1a and 3.1b, and the corresponding data
for the dependent variables used in Chapter 7, respectively.

207
Appendix B Table 1: Table of Means and Standard Deviations of Explanatory Variables from Tables 6.1 to 6.5
Student Characteristics
Variable Mean
Standard
Deviation
Special Ed. 0.09 0.28
English Learner 0.13 0.34
Fluent English Proficient 0.21 0.41
Parental Ed is High School 0.11 0.31
Parental Ed is Some College 0.12 0.32
Parental Ed is College 0.16 0.37
Parental Ed is Graduate School 0.09 0.28
Missing Parental Ed Status 0.36 0.48
Student is Female 0.50 0.50
Student is black 0.14 0.34
Student is Asian 0.22 0.42
Student is Hispanic 0.34 0.48
Student is Other Race 0.01 0.09
School Characteristics
Variable Mean
Standard
Deviation
Percent of School of Free/Reduced Lunch 42.86 24.63
Missing Percent of School on Free/Reduced Lunch 0.00 0.04
Percent of School that is Asian 19.62 14.86
Percent of School that is white 28.59 19.44
Percent of School that is black 13.94 8.73
Percent of School that is Hispanic 34.58 18.03
Percent of School that is Pacific Islander 0.71 0.53
Percent of School that is Native American 0.54 0.35
Percent of School that is English Learner 13.67 12.82
Magnet School 0.21 0.41
Charter School 0.01 0.11
Atypical (Continuation) School 0.01 0.08
Teacher Characteristics
Variable Mean
Standard
Deviation
Missing Credential 0.02 0.15
Average of Teachers with Intern Credential 0.91 5.41
Average of Teachers with Emergency Credential 3.07 9.52
Average Years of Service in District 12.96 6.30
Average Total Years of Teaching Experience 14.93 6.62
Average of Female Teachers 48.66 26.02
Average of Teachers Who are white 74.80 25.22
Continued on next page:

208
Continued:
Teacher Characteristics
Variable Mean
Standard
Deviation
Average of Teachers Who are black 6.10 13.08
Average of Teachers Who are Asian 7.31 13.73
Average of Teachers Who are Hispanic 6.94 14.33
Average of Teachers Who are Other Race 2.39 8.21
Average of Math Teachers with Supplemental
Authorization 8.39 27.19
Average of Math Teachers with Board Resolution
Authorization 0.24 4.73
Average of Math Teachers with Limited Assignment
Emergency Authorization 1.36 11.25
Missing English Authorization 22.89 42.33
Missing Math Authorization 26.27 43.54
Average of English Teachers with Board Resolution
Authorization 0.90 9.17
Average of English Teachers with Limited Assignment
Emergency Authorization 5.15 21.84
Average of Math Teachers with Masters in Math 42.30 48.59
Average of English Teachers with Masters in English 44.30 48.73
Average of Math Teachers with PhD in Math 1.07 10.02
Average of English Teachers with PhD in English 0.56 7.31
Missing Graduate Degree for English Teachers 0.24 0.42
Missing Graduate Degree for Math Teachers 0.25 0.44
Average of Asian Teachers in English Classes 3.90 18.89
Average of Asian Teachers in Math Classes 8.65 27.50
Average of black Teachers in English Classes 5.66 22.42
Average of black Teachers in Math Classes 4.23 19.63
Average of Hispanic Teachers in English Classes 4.23 19.53
Average of Hispanic Teachers in Math Classes 4.18 19.54
Average of Other Race Teachers in English Classes 1.44 11.50
Average of Other Race Teachers in Math Classes 3.22 17.19
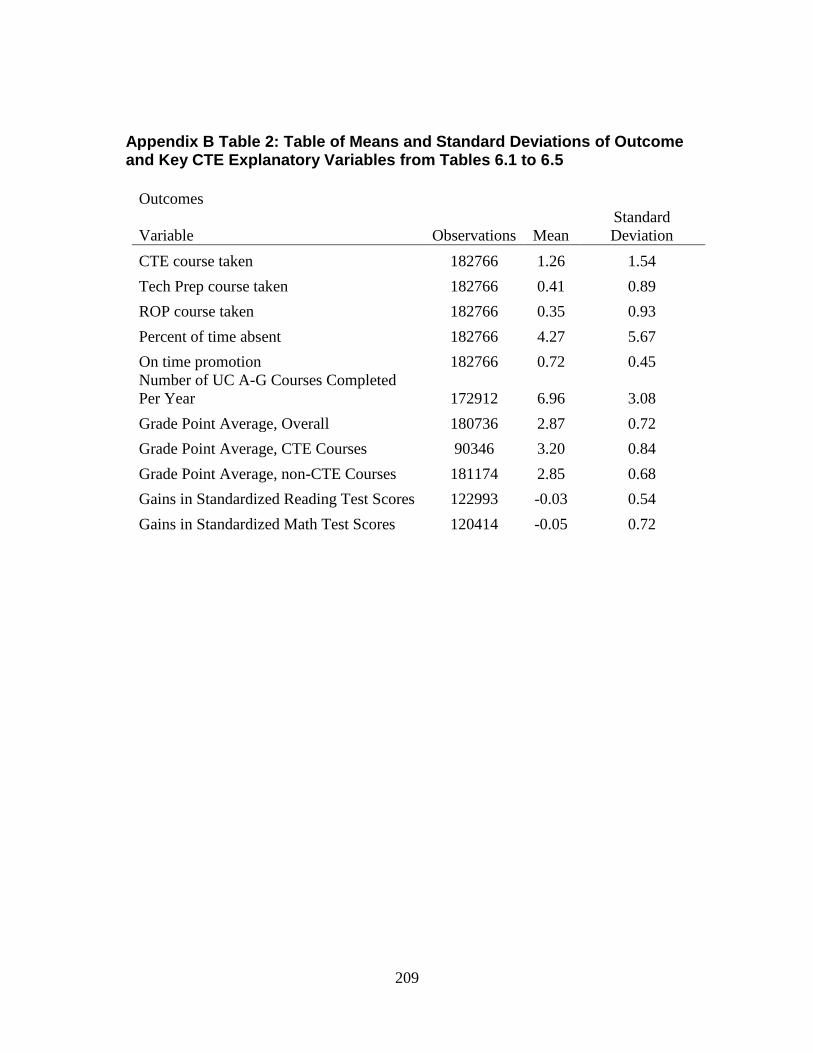
209
Appendix B Table 2: Table of Means and Standard Deviations of Outcome and Key CTE Explanatory Variables from Tables 6.1 to 6.5
Outcomes
Variable Observations Mean
Standard
Deviation
CTE course taken 182766 1.26 1.54
Tech Prep course taken 182766 0.41 0.89
ROP course taken 182766 0.35 0.93
Percent of time absent 182766 4.27 5.67
On time promotion 182766 0.72 0.45
Number of UC A-G Courses Completed
Per Year 172912 6.96 3.08
Grade Point Average, Overall 180736 2.87 0.72
Grade Point Average, CTE Courses 90346 3.20 0.84
Grade Point Average, non-CTE Courses 181174 2.85 0.68
Gains in Standardized Reading Test Scores 122993 -0.03 0.54
Gains in Standardized Math Test Scores 120414 -0.05 0.72

210
Appendix B Table 3: OLS and Tobit Models of the Percentage of Time the Student was Absent
OLS OLS
Tobit
(dp/dx) Tobit (dp/dx)
[1] [2] [3] [4]
# of CTE Courses -0.0577*** -0.0469*** -0.0402** -0.0305
[0.0160] [0.0169] [0.0180] [0.0193]
# of Tech Prep Courses
-0.0671**
-0.0865***
[0.0266]
[0.0300]
# of ROP Courses
0.035
0.0591*
[0.0276] [0.0310]
Student Fixed Effects? No No No No
Instrumental Variables? No No No No
Number of Observations 182,766 182,766 182,766 182,766
R-squared 0.111 0.111 N/A N/A
P-Values from Tests
ROP=Tech Prep=0
0.037
0.009
CTE+Tech Prep=0
<0.001
<0.001
CTE+ROP=0
0.706
0.407
All 3 CTE Coursework
<0.001
0.001
Coefficients Equal Zero
Test for Exclusion of Added
Instrument(s), First-Stage Model
Exclusion of Student Fixed
Effects
Hausman Test (exogeneity)
Standard errors in parentheses
* significant at 10%; ** significant at 5%; *** significant at 1%

211
Appendix B Table 4: OLS and Probit Models of Whether the Student was Promoted to the Next Grade at the End of the School Year
OLS OLS Probit (dp/dx) Probit (dp/dx)
[1] [2] [3] [4]
# of CTE Courses 0.0020*** 0.0012** 0.0025*** 0.0024***
[0.0006] [0.0006] [0.0005] [0.0005]
# of Tech Prep Courses
0.0028***
0.0003
[0.0009]
[0.0007]
# of ROP Courses
-0.0005
0.0002
[0.0010] [0.0009]
Student Fixed Effects? No No No No
Instrumental Variables? No No No No
Number of Observations 182,766 182,766 175,451 175,451
R-squared 0.842 0.842 0.801 0.801
P-Values from Tests
ROP=Tech Prep=0
0.006
0.842
CTE+Tech Prep=0
<0.001
<0.001
CTE+ROP=0
0.464
0.006
All 3 CTE Coursework
<0.001
<0.001
Coefficients Equal Zero
Test for Exclusion of Added
Instrument(s), First-Stage Model
Exclusion of Student Fixed
Effects
Hausman Test (exogeneity)
Standard errors in parentheses
* significant at 10%; ** significant at 5%; *** significant at 1%

212
Appendix B Table 5: OLS and Ordered Probit Models of the Number of A-G Courses Passed per Year.
OLS OLS
Ordered
Probit
Ordered
Probit
[1] [2] [3] [4]
# of CTE Courses -0.1416*** -0.1866*** -0.0561*** -0.0743***
[0.0178] [0.0197] [0.0075] [0.0083]
# of Tech Prep Courses
0.1423***
0.0577***
[0.0258]
[0.0101]
# of ROP Courses
0.0005
-0.0002
[0.0269] [0.0106]
Student Fixed Effects? No No No No
Instrumental Variables? No No No No
Number of Observations 172,912 172,912 172,912 172,912
R-squared 0.314 0.315 0.076 0.076
P-Values from Tests
ROP=Tech Prep=0
<0.001
<0.001
CTE+Tech Prep=0
0.110
0.139
CTE+ROP=0
<0.001
<0.001
All 3 CTE Coursework
<0.001
<0.001
Coefficients Equal Zero
Test for Exclusion of Added
Instrument(s), First-Stage Model
Exclusion of Student Fixed
Effects
Hausman Test (exogeneity)
Standard errors in parentheses
* significant at 10%; ** significant at 5%; *** significant at 1%

213
Appendix B Table 6: OLS and Tobit Models of Grade Point Average
OLS OLS Tobit (dp/dx) Tobit (dp/dx)
[1] [2] [3] [4]
# of CTE Courses 0.0162*** 0.0218*** 0.0147*** 0.0205***
[0.0026] [0.0030] [0.0027] [0.0031]
# of Tech Prep Courses
-0.0124***
-0.0125***
[0.0038]
[0.0040]
# of ROP Courses
-0.0056
-0.0064*
[0.0034] [0.0035]
Student Fixed Effects? No No No No
Instrumental Variables? No No No No
Number of Observations 180,736 180,736 180,736 180,736
R-squared 0.225 0.2252 N/A N/A
P-Values from Tests
ROP=Tech Prep=0
<0.001
<0.001
CTE+Tech Prep=0
0.026
0.061
CTE+ROP=0
<0.001
<0.001
All 3 CTE Coursework
<0.001
<0.001
Coefficients Equal Zero
Test for Exclusion of Added
Instrument(s), First-Stage Model
Exclusion of Student Fixed
Effects
Hausman Test (exogeneity)
Standard errors in parentheses
* significant at 10%; ** significant at 5%; *** significant at 1%

214
Appendix B Table 7: OLS and Tobit Models of Grade Point Average, Not Including CTE Courses
OLS OLS Tobit (dp/dx) Tobit (dp/dx)
[1] [2] [3] [4]
# of CTE Courses -0.0281*** -0.0220*** -0.0296*** -0.0233***
[0.0027] [0.0028] [0.0027] [0.0030]
# of Tech Prep Courses
-0.0045
-0.005
[0.0038]
[0.0039]
# of ROP Courses
-0.0157***
-0.0164***
[0.0035] [0.0036]
Student Fixed Effects? No No No No
Instrumental Variables? No No No No
Number of Observations 181,174 181,174 181,174 181,174
R-squared 0.209 0.209 N/A N/A
P-Values from Tests
ROP=Tech Prep=0
<0.001
<0.001
CTE+Tech Prep=0
<0.001
<0.001
CTE+ROP=0
<0.001
<0.001
All 3 CTE Coursework
<0.001
<0.001
Coefficients Equal Zero
Test for Exclusion of Added
Instrument(s), First-Stage Model
Exclusion of Student Fixed
Effects
Hausman Test (exogeneity)
Standard errors in parentheses
* significant at 10%; ** significant at 5%; *** significant at 1%

215
Appendix B Table 8: Table of Means and Standard Deviations of Explanatory Variables from Tables 7.1 to 7.7
Student Characteristics
Variable Mean Standard Deviation
Special Ed. 0.01 0.08
English Learner 0.28 0.45
Student is Female 0.50 0.50
Student is black 0.13 0.34
Student is Asian 0.22 0.42
Student is Hispanic 0.34 0.47
Student is Other Race 0.01 0.09
5th grade Behavior GPA less than 2.0 0.13 0.33
5th grade Behavior GPA 3.0-3.49 0.09 0.29
5th grade Behavior GPA 3.5-4.0 0.25 0.43
Missing 5th grade Behavior GPA 0.48 0.50
8th grade academic GPA less than 2.0 0.32 0.47
8th grade academic GPA 3.0-3.49 0.18 0.38
8th grade academic GPA 3.5-4.0 0.23 0.42
Missing 8th grade academic GPA 0.15 0.36
8th grade special ed. status 0.05 0.22
8th grade EL status 0.14 0.35
8th grade standardized CST reading score 0.15 0.90
Missing 8th grade standardized CST reading score 0.17 0.38
8th grade standardized CST math score 0.16 0.95
Missing 8th grade standardized CST math score 0.17 0.38
8th grade math CST algebra 2 subtest 0.00 0.04
8th grade math CST 8th grade math subtest 0.07 0.25
8th grade math CST geometry subtest 0.02 0.14
8th grade math CST integrated math 1 subtest 0.00 0.03
8th grade math CST integrated math 2 subtest 0.00 0.03
8th grade math CST integrated math 3 subtest 0.00 0.03
School Characteristics
Variable Mean Standard Deviation
Average Percent of School that is Asian 19.66 14.16
Average Percent of School that is white 28.62 18.79
Average Percent of School that is black 13.91 7.74
Average Percent of School that is Hispanic 34.48 15.80
Average Percent of School that is Pacific Islander 0.71 0.47
Average Percent of School that is Native American 0.54 0.30
Average Percent of School that is English Learner 13.69 10.66
Average of Magnet Schools 0.21 0.35
Continued on next page:

216
Continued:
Variable Mean Standard Deviation
Average Charter Schools 0.01 0.05
Average Atypical (Continuation) Schools 0.00 0.03
Average of total number of courses offered 258.70 62.81
Teacher Characteristics
Variable Mean Standard Deviation
Average of Teachers with Intern Credential 0.90 2.94
Average of Teachers with Emergency Credential 3.08 5.16
Average Years of Service in District 13.00 4.17
Average Total Years of Teaching Experience 14.97 4.37
Average of Female Teachers 48.65 14.38
Average of Teachers Who are white 74.94 14.52
Average of Teachers Who are black 6.08 7.88
Average of Teachers Who are Asian 7.35 7.65
Average of Teachers Who are Hispanic 6.99 8.40
Average of Teachers Who are Other Race 2.40 4.59
Average of Math Teachers with Supplemental
Authorization 8.42 15.46
Average of Math Teachers with Board Resolution
Authorization 0.24 2.34
Average of Math Teachers with Limited Assignment
Emergency Authorization 1.36 6.03
Missing English Authorization 0.44 0.50
Missing Math Authorization 0.00 0.00
Average of English Teachers with Board Resolution
Authorization 0.27 2.53
Average of English Teachers with Limited
Assignment Emergency Authorization 3.85 10.26
Average of Math Teachers with Masters in Math 42.29 25.54
Average of English Teachers with Masters in English 44.59 26.43
Average of Asian Teachers in English Classes 3.94 9.95
Average of Asian Teachers in Math Classes 8.62 14.78
Average of black Teachers in English Classes 5.66 12.84
Average of black Teachers in Math Classes 4.25 10.81
Average of Hispanic Teachers in English Classes 4.23 10.51
Average of Hispanic Teachers in Math Classes 4.23 10.53
Average of Other Race Teachers in English Classes 1.46 6.01
Average of Other Race Teachers in Math Classes 3.19 9.07

217
Appendix B Table 9: Table of Means and Standard Deviations from Tables 7.1a to 7.8a and 7.1b to 7.8b
Outcomes
Variable Observations Mean
Standard
Deviation
Cumulative CTE courses taken 44589 5.09 3.52
Cumulative Tech Prep courses taken 44589 1.66 1.93
Cumulative ROP courses taken 44589 1.44 1.98
Three Course Concentrator in one cluster 44589 0.09 0.28
Any Tech Prep course taken 44589 0.59 0.49
Any ROP course taken 44589 0.48 0.50
On time graduation 44589 0.86 0.34
Completion of New Basics 41307 0.82 0.38
Completion of UC A-G curriculum 44261 0.20 0.40
Passed California High School Exit Exam 24757 0.91 0.29
Grade Point Average, Cumulative 44589 2.90 0.57
Grade Point Average, Cumulative non-CTE
Courses 44589 2.84 0.58

218
Appendix C: Additional Material Related to Postsecondary
Academic Outcomes

219
Appendix C Table 1 Means and Standard Deviations of Regressors From Sample in Tables 8.1 – 8.4 (High School Graduates from 2002 through 2008)
CTE Course Count Variables - "A" Tables
# CTE Courses Taken 5.1048
(3.4890)
# Tech Prep Courses Taken 1.5817
(1.8822)
# ROP Courses Taken 1.3885
(1.9263)
CTE Concentrator Indicators - "B" Tables
3-course CTE Concentrator 0.0891
(0.2850)
Any Tech Prep Taken 0.5746
(0.4944)
Any ROP Taken 0.4665
(0.4989)
2-Course CTE Concentration Field Indicators - "C-1" Tables
Communication Design 0.1277
(0.3338)
Business Support 0.0622
(0.2416)
Computer and Information Science 0.0265
(0.1607)
Construction 0.0112
(0.1051)
Other 0.0813
(0.2734)
3-Course CTE Concentration Field Indicators - "C-2" Tables
Communication Design 0.0546
(0.2272)
Business Support 0.0127
(0.1119)
Computer and Information Science 0.0057
(0.0752)
Construction 0.0019
(0.0437)
Other 0.0154
(0.1232)
Continued on next page

220
Continued:
School-Year CTE Offerings (Percentage of all courses)
% CTE Courses/All Courses 0.2090
(0.0482)
% TechPrep Courses/All Courses 0.0428
(0.0191)
% ROP Courses/All Courses 0.0701
(0.0312)
Subsample Size 33453
Notes: Means reported first. Std. deviations in parenthesis.

221
Appendix C Table 2 Means and Standard Deviations of Regressors From Sample in Tables 8.5 – 8.8 (High School Graduates from 2002 through 2005)
CTE Course Count Variables - "A" Tables
# CTE Courses Taken 5.1911
(3.3089)
# TechPrep Courses Taken 1.3767
(1.6813)
# ROP Courses Taken 1.1573
(1.7003)
CTE Concentrator Indicators - "B" Tables
3-course CTE Concentrator 0.0801
(0.2714)
Any TechPrep Taken 0.5536
(0.4971)
Any ROP Taken 0.4237
(0.4942)
2-Course CTE Concentration Field Indicators - "C-1" Tables
Communication Design 0.1183
(0.3230)
Business Support 0.0745
(0.2625)
Computer and Information Science 0.0267
(0.1611)
Construction 0.0115
(0.1067)
Other 0.0660
(0.2484)
3-Course CTE Concentration Field Indicators - "C-2" Tables
Communication Design 0.0479
(0.2136)
Business Support 0.0165
(0.1274)
Computer and Information Science 0.0066
(0.0811)
Construction 0.0018
(0.0423)
Other 0.0088
(0.0934)
Continued on next page

222
Continued:
School-Year CTE Offerings (Percentage of all courses)
% CTE Courses/All Courses 0.2183
(0.0481)
% TechPrep Courses/All Courses 0.0396
(0.0170)
% ROP Courses/All Courses 0.0689
(0.0316)
Subsample Size 18412
Notes: Means reported first. Std. deviations in parenthesis.

223
Appendix C Table 3 Means and Standard Deviations of Regressors From Sample in Appendix C Tables 14 - 19 (Students Entering Grade 9 between Fall 1998 and Fall 2001)
CTE Course Count Variables - "A" Tables
# CTE Courses Taken 5.1188
(3.2941)
# TechPrep Courses Taken 1.3753
(1.6765)
# ROP Courses Taken 1.1369
(1.6769)
CTE Concentrator Indicators - "B" Tables
3-course CTE Concentrator 0.0747
(0.2630)
Any TechPrep Taken 0.5562
(0.4968)
Any ROP Taken 0.4236
(0.4941)
2-Course CTE Concentration Field Indicators - "C-1" Tables
Communication Design 0.1116
(0.3149)
Business Support 0.0702
(0.2554)
Computer and Information Science 0.0249
(0.1559)
Construction 0.0110
(0.1044)
Other 0.0635
(0.2438)
3-Course CTE Concentration Field Indicators - "C-2" Tables
Communication Design 0.0447
(0.2067)
Business Support 0.0154
(0.1233)
Computer and Information Science 0.0061
(0.0780)
Construction 0.0017
(0.0412)
Other 0.0083
(0.0908)
Continued on next page

224
Continued:
School-Year CTE Offerings (Percentage of all courses)
% CTE Courses/All Courses 0.2179
(0.0486)
% TechPrep Courses/All Courses 0.0398
(0.0173)
% ROP Courses/All Courses 0.0688
(0.0312)
Subsample Size 19950
Notes: Means reported first. Std. deviations in parenthesis.

225
Appendix C Table 4 Means and Standard Deviations of Regressors From Sample in Tables 8.9 and 8.10 (High School Graduates from 2002 through 2005 Who Enroll at a 2-Year Institution Within the First 2 Years After High School)
CTE Course Count Variables - "A" Tables
# CTE Courses Taken 5.4937
(3.31579)
# TechPrep Courses Taken 1.4576
(1.71393)
# ROP Courses Taken 1.2512
(1.76716)
CTE Concentrator Indicators - "B" Tables
3-course CTE Concentrator 0.0869
(0.2817)
Any TechPrep Taken 0.5802
(0.49355)
Any ROP Taken 0.4454
(0.49703)
2-Course CTE Concentration Field Indicators - "C-1" Tables
Communication Design 0.1251
(0.33087)
Business Support 0.0837
(0.277)
Computer and Information Science 0.0240
(0.15296)
Construction 0.0109
(0.10372)
Other 0.0772
(0.2669)
3-Course CTE Concentration Field Indicators - "C-2" Tables
Communication Design 0.0509
(0.21979)
Business Support 0.0197
(0.13913)
Computer and Information Science 0.0058
(0.07599)
Construction 0.0019
(0.04356)
Other 0.0106
(0.10222)
Continued on next page

226
Continued:
School-Year CTE Offerings (Percentage of all courses)
% CTE Courses/All Courses 0.2204
(0.04756)
% TechPrep Courses/All Courses 0.0405
(0.01639)
% ROP Courses/All Courses 0.0708
(0.03075)
Subsample Size 9471
Notes: Means reported first. Std. deviations in parenthesis.

227
Appendix C Table 5 Distribution of Dependent Variables Used in Chapter 8
Outcome Variable Table Distribution of Variable
No Enrollment Enrollment
Postsecondary Enrollment: 1st Year After High School
8.1 and 8.2 31.61 68.39
Postsecondary Enrollment: by Fall 2009
App. C Tables 6 and 7 23.70 76.30
High School Two Year Institution Four Year Institution
Highest Level of Educational Institution Enrolled in One Year After Graduation
8.3 and 8.4 31.61 36.64 31.75
Highest Level of Educational Institution Enrolled in by Fall 2009
App. C Tables 8 and 9 23.70 35.01 41.29
No Enrollment 1 Year 2 Years 3 Years 4 Years
Number of First Four Years After High School with Postsecondary Enrollment
8.5 and 8.6 25.79 9.75 9.67 10.25 44.53
Some High
School
High School
Graduate Some 2-Year
2-Year Degree
Some 4-Year
4-Year Degree
Highest Level of Educational Attainment within Four Years After Graduating High School
8.7 and 8.8 25.54 35.49 1.27 24.26 13.44
Highest Level of Educational Attainment within Eight Years of Starting High School
App. C Tables 10 and
11 7.36 23.82 32.85 1.17 22.39 12.41
No 4-Year Enrollment 4-Year Enrollment
Transferring of 2-Year College Students to a 4-Year Institution
8.9 and 8.10 72.83 27.17

228
Appendix C Table 6 Probit Models of Whether High School Graduates Ever Enroll in Any Postsecondary Institution by 2009, in Terms of CTE Courses Taken: High School Graduates from 2002 through 2008
dp/dx dp/dx
# of CTE Courses -0.0009 -0.0003
[0.0010] [0.0013]
# of Tech Prep Courses -0.0016
[0.0020]
# of ROP Courses -0.0002
[0.0016]
Number of Observations 33381 33381
R-squared 0.1617 0.1617
P-Values from Tests
ROP=Tech Prep=0 0.688
CTE + Tech Prep=0 0.244
CTE + ROP=0 0.761
All 3 CTE Coefficients=0 0.594
Notes: Standard errors in brackets are clustered at the school level. * significant at 10%; ** significant at 5%; *** significant at 1% Average marginal effects of independent variables reported.

229
Appendix C Table 7 Linear Probability Models of Whether High School Graduates Ever Enroll in Any Postsecondary Institution by 2009, in Terms of CTE Courses Taken: High School Graduates from 2002 through 2008
OLS OLS 2SLS 2SLS
# of CTE Courses 0.000123 0.000824 0.0159 0.0035
[0.000951] [0.00123] [0.00987] [0.0171]
# of Tech Prep Courses
-0.00182
0.0281
[0.00209]
[0.0334]
# of ROP Courses
-0.00059
-0.00976
[0.00172]
[0.0155]
Instrumental Variables? No No Yes Yes
Number of Observations 33382 33382 32868 32868
R-squared 0.174 0.174 0.161 0.163
P-Values from Tests ROP=Tech Prep=0
0.607
0.66
CTE + Tech Prep=0
0.567
0.218
CTE + ROP=0
0.901
0.761
All 3 CTE Coefficients = 0
0.798
0.606
Test for Exclusion of Added IVs
(First-Stage Model) CTE
0.0105 <0.001
Tech Prep
<0.001
ROP
<0.001
Hausman Test (exogeneity)
0.0917 0.287
Overidentification Test
0.7497 0.5501
Notes: Standard errors in brackets are clustered at the school level. * significant at 10%; ** significant at 5%; *** significant at 1%
Instruments are percentage of courses offered within school and year which are CTE, Tech Prep or ROP.

230
Appendix C Table 8 Ordered Probit Models of Highest Level of Educational Institution in Which a Student Enrolled by 2009, in Terms of CTE Courses Taken: High School Graduates from 2002 through 2008
No Enrollment 2-year Institution 4-year Institution
# of CTE Courses 0.0055*** 0.0038*** 0.0027*** 0.0019* -0.0082*** -0.0057***
[0.00127] [0.00142] [0.00098] [0.00102] [0.00156] [0.00193]
# of Tech Prep Courses
0.0025
0.0012
-0.0037
[0.00176]
[0.00101]
[0.00258]
# of ROP Courses
0.0032*
0.0016
-0.0048*
[0.00173] [0.00106] [0.00247]
Number of Observations 33382 33382 33382 33382 33382 33382
R-squared 0.1793 0.1795 0.1793 0.1795 0.1793 0.1795
P-Values from Tests
ROP=Tech Prep=0
0.0148
0.0148
0.0148
CTE + Tech Prep=0 <0.001 <0.001 <0.001
CTE + ROP=0
0.0013
0.0013
0.0013
All 3 CTE Coefficients = 0
<0.001
<0.001
<0.001
Notes: Standard errors in brackets are clustered at the school level. * significant at 10%; ** significant at 5%; *** significant at 1%
Average marginal effects of independent variables on each incremental level of enrollment reported. Marginal effects estimates are localized around the mean number of CTE courses taken in the estimation sample.

231
Appendix C Table 9 Linear Models of Highest Level of Educational Institution in Which a Student Enrolled by 2009, in Terms of CTE Courses Taken: High School Graduates from 2002 through 2008
OLS OLS 2SLS 2SLS
# of CTE Courses -0.0105*** -0.00631** 0.0183 0.00968
[0.00228] [0.00268] [0.0187] [0.0262]
# of Tech Prep Courses
-0.00589
0.0738
[0.00387]
[0.0550]
# of ROP Courses
-0.00815**
-0.0564*
[0.00400]
[0.0304]
Instrumental Variables? No No Yes Yes
Number of Observations 33382 33382 32868 32868
R-squared 0.316 0.317 0.304 0.292
P-Values from Tests ROP=Tech Prep=0
0.0209
0.16
CTE + Tech Prep=0
<0.001
0.069
CTE + ROP=0
0.0055
0.205
All 3 CTE Coefficients = 0
<0.001
0.254
Test for Exclusion of Added IVs
(First-Stage Model) CTE
0.0105 <0.001
Tech Prep
<0.001
ROP
<0.001
Hausman Test (exogeneity)
0.0916 0.0786
Overidentification Test
0.3329 0.4626
Notes: Standard errors in brackets are clustered at the school level. * significant at 10%; ** significant at 5%; *** significant at 1%
Instruments are percentage of courses offered in each of grades 9th – 12th within school and year which are CTE, Tech Prep or ROP.

232
Some High
School High School
Graduate Some 2-year
2-year Degree
Some Univ.
4-year Degree
# of CTE Courses 0.0002 0.0008 0.00013 -0.000025 -0.0007 -0.0003
[0.00038] [0.00165] [0.00035] [.] [0.00155] [0.00070]
# of Tech Prep Courses 0.0005 0.0020 0.0003 -0.00006 -0.0019 -0.0009
[0.00058] [0.00262] [0.00070] [.] [0.00246] [0.00108]
# of ROP Courses -0.0003 -0.0013 -0.0002 0.00004 0.0012 0.0006
[0.00061] [0.00260] [0.00057] [.] [0.00245] [0.00111]
Number of Observations 19950 19950 19950 19950 19950 19950
R-squared 0.1815 0.1815 0.1815 0.1815 0.1815 0.1815
P-Values from Tests
ROP=Tech Prep=0 0.6870 0.6870 0.6870 0.6870 0.6870 0.6870
CTE + Tech Prep=0 0.2285 0.2285 0.2285 0.2285 0.2285 0.2285
CTE + ROP=0 0.8820 0.8820 0.8820 0.8820 0.8820 0.8820
All 3 CTE Coefficients=0 0.5224 0.5224 0.5224 0.5224 0.5224 0.5224
Notes: Standard errors in brackets are clustered at the school level. * significant at 10%; ** significant at 5%; *** significant at 1% Average marginal effects of independent variable on the probability of each incremental level of educational attainment level reported. Marginal effects estimates are localized around the mean number of CTE courses taken across the estimation sample. Dependent variable defined as highest educational attainment level four years after beginning high school.
Note: Standard errors could be calculated for the two-year institutions due to the relatively small number of students in this group.
Appendix C Table 10 Ordered Probit Models of Highest Level of Educational Attainment, in Terms of CTE Courses Taken: Students Entering Grade 9 between Fall 1998 and Fall 2001
Some High
School High School
Graduate Some 2-year
2-year Degree
Some Univ.
4-year Degree
# of CTE Courses 0.0002 0.0009 0.0002 -0.00003 -0.0009 -0.00040
[0.00042] [0.00181] [0.00038] [.] [0.00171] [0.00078]
Number of Observations 19950 19950 19950 19950 19950 19950
R-squared 0.1815 0.1815 0.1815 0.1815 0.1815 0.1815

233
Appendix C Table 11 Linear Models of Highest Level of Educational Attainment by 2009, in Terms of CTE Courses Taken: Students Entering Grade 9 between Fall 1998 and Fall 2001
OLS OLS 2SLS 2SLS
# of CTE Courses -0.0131* -0.00856 0.0718* 0.0535
[0.00710] [0.00674] [0.0391] [0.0363]
# of Tech Prep Courses
-0.0119
0.00734
[0.0108]
[0.116]
# of ROP Courses
-0.00563
-0.0747
[0.0109]
[0.111]
Instrumental Variables? No No Yes Yes
Number of Observations 19950 19950 19382 19382
R-squared 0.438 0.438 0.398 0.414
P-Values from Tests ROP=Tech Prep=0
0.403
0.531
CTE + Tech Prep=0
0.036
0.598
CTE + ROP=0
0.346
0.848
All 3 CTE Coefficients = 0
0.141
0.504
Test for Exclusion of Added IVs
(First-Stage Model) CTE
<0.001 <0.001
Tech Prep
<0.001
ROP
<0.001
Hausman Test (exogeneity)
0.0239 0.361
Overidentification Test
0.1944 0.1766
Notes: Standard errors in brackets are clustered at the school level. * significant at 10%; ** significant at 5%; *** significant at 1% Instruments are percentage of courses offered in each of grades 9th – 12th within school and year which are CTE, Tech Prep or ROP. Dependent variable is highest level of educational attainment, where ordinal levels are: some high school, high school graduate, some 2-year college education, 2-year degree, some 4-year college education, 4-year degree.

234
Appendix C Table 12 Probit Models of Whether High School Graduates Ever Enroll in Any Postsecondary Institution by 2009, in Terms of CTE Concentrator Status: High School Graduates from 2002 through 2008
dp/dx dp/dx
CTE Concentrator 0.0172 0.0189
[0.0116] [0.0119]
Any Tech Prep Courses
-0.0090*
[0.0054]
Any ROP Courses
-0.0044
[0.0082]
Number of Observations 33381 33381
R-squared 0.1618 0.1619
P-Values from Tests
ROP=Tech Prep=0
0.124
CTE + Tech Prep=0 0.436
CTE + ROP=0
0.262
All 3 CTE Coefficients = 0
0.135
Notes: Standard errors in brackets are clustered at the school level. * significant at 10%; ** significant at 5%; *** significant at 1%

235
Appendix C Table 13 Linear Probability Models of Whether High School Graduates Ever Enroll in Any Postsecondary Institution by 2009, in Terms of CTE Concentrator Status: High School Graduates from 2002 through 2008
OLS OLS 2SLS 2SLS
CTE Concentrator 0.0186* 0.0197* 0.162 -0.131
[0.0108] [0.0110] [0.298] [0.203]
Any Tech Prep Courses
-0.00561
-0.0215
[0.00491]
[0.108]
Any ROP Courses
-0.00331
0.077
[0.00797]
[0.0569]
Instrumental Variables? No No Yes Yes
Number of Observations 33382 33382 32868 32868
R-squared 0.174 0.174 0.165 0.159
P-Values from Tests ROP=Tech Prep = 0
0.392
0.399
CTE + Tech Prep = 0
0.242
0.449
CTE + ROP = 0
0.117
0.79
All 3 CTE Coefficients = 0
0.243
0.547
Test for Exclusion of Added IVs
(First-Stage Model) CTE
0.0694 <0.001
Tech Prep
0.0247
ROP
<0.001
Hausman Test (exogeneity)
0.585 0.577
Overidentification Test
0.5871 0.2313
Notes: Standard errors in brackets are clustered at the school level. * significant at 10%; ** significant at 5%; *** significant at 1%

236
Appendix C Table 14 Ordered Probit Models of Highest Level of Educational Institution in Which a Student Enrolled by 2009, in Terms of CTE Concentrator Status: High School Graduates from 2002 through 2008
No Enrollment 2-year Institution 4-year Institution
CTE Concentrator -0.0016 -0.0080 -0.0008 -0.0040 0.0023 0.0120
[0.00669] [0.00689] [0.00327] [0.00380] [0.00998] [0.01015]
Any Tech Prep Courses
0.0219***
0.0109**
-0.0327***
[0.00624]
[0.00554]
[0.00810]
Any ROP Courses
0.0266***
0.0132*
-0.0399***
[0.00896] [0.00703] [0.01194]
Number of Observations 33382 33382 33382 33382 33382 33382
R-squared 0.1780 0.1796 0.1780 0.1796 0.1780 0.1796
P-Values from Tests
ROP=Tech Prep=0
<0.001
<0.001
<0.001
CTE + Tech Prep=0 0.033 0.033 0.033
CTE + ROP=0
0.091
0.091
0.091
All 3 CTE Coefficients = 0
<0.001
<0.001
<0.001
Notes: Standard errors in brackets are clustered at the school level. * significant at 10%; ** significant at 5%; *** significant at 1%
Average marginal effects of independent variables on each incremental level of enrollment reported. Marginal effects estimates are localized around the mean number of CTE courses taken in the estimation sample.

237
Appendix C Table 15 Linear Models of Highest Level of Educational Institution in Which a Student Enrolled by 2009, in Terms of CTE Concentrator Status: High School Graduates from 2002 through 2008
OLS OLS 2SLS 2SLS
CTE Concentrator 0.00817 0.0215 0.179 -0.249
[0.0135] [0.0136] [0.593] [0.393]
Any Tech Prep Courses
-0.0415*** -0.275
[0.0113] [0.249]
Any ROP Courses
-0.0584*** 0.0379
[0.0189] [0.146]
Instrumental Variables? No No Yes Yes
Number of Observations 33382 33382 32868 32868
R-squared 0.315 0.317 0.31 0.293
P-Values from Tests
ROP=Tech Prep=0
<0.001 0.544
CTE + Tech Prep=0
0.171 0.253
CTE + ROP=0
0.132 0.56
All 3 CTE Coefficients = 0
<0.001 0.626
Test for Exclusion of Added IVs
(First-Stage Model)
CTE
0.0694 <0.001
Tech Prep
0.0247
ROP
<0.001
Hausman Test (exogeneity)
0.76 0.627
Overidentification Test
0.3253 0.3464
Notes: Standard errors in brackets are clustered at the school level. * significant at 10%; ** significant at 5%; *** significant at 1%

238
Appendix C Table 16 Ordered Probit Models of Highest Level of Educational Attainment, in Terms of CTE Courses Taken: Students Entering Grade 9 between Fall 1998 and Fall 2001
Some High
School High School
Graduate Some 2-year
2-year Degree
Some Univ.
4-year Degree
CTE Concentrator -0.0033 -0.0142 -0.0024 0.0005 0.0134 0.0061
[0.00243] [0.01057] [.] [.] [0.01023] [0.00443]
Number of Observations 19950 19950 19950 19950 19950 19950
R-squared 0.1815 0.1815 0.1815 0.1815 0.1815 0.1815
Some High
School High School
Graduate Some 2-year
2-year Degree
Some Univ.
4-year Degree
CTE Concentrator -0.0036 -0.0156 -0.00263 0.00049 0.01472 0.00665
[0.00239] [0.01088] [0.00384] [0.00155] [0.01003] [0.00488]
Any Tech Prep Courses 0.0042*** 0.0182*** 0.0031 -0.00057 -0.01717*** -0.00775**
[0.00110] [0.00702] [0.00411] [0.00178] [0.00608] [0.00335]
Any ROP Courses 0.0002 0.0009 0.00015 -0.00003 -0.00085 -0.00038
[0.00279] [0.01201] [0.00203] [0.00039] [0.01133] [0.00511]
Number of Observations 19950 19950 19950 19950 19950 19950
R-squared 0.1818 0.1818 0.1818 0.1818 0.1818 0.1818
P-Values from Tests
ROP=Tech Prep=0 0.0087 0.0087 0.0087 0.0087 0.0087 0.0087
CTE + Tech Prep=0 0.8114 0.8114 0.8114 0.8114 0.8114 0.8114
CTE + ROP=0 0.3679 0.3679 0.3679 0.3679 0.3679 0.3679
All 3 CTE Coefficients=0 0.0196 0.0196 0.0196 0.0196 0.0196 0.0196
Notes: Standard errors in brackets are clustered at the school level. * significant at 10%; ** significant at 5%; *** significant at 1% Average marginal effects of independent variables on each incremental level of educational attainment reported. Marginal effects estimates are localized around the mean number of CTE courses taken in the estimation sample. Dependent variable defined as highest educational attainment level four years after beginning high school.

239
Appendix C Table 17 Linear Models of Highest Level of Educational, in Terms of CTE Concentrator Status: Students Entering Grade 9 between Fall 1998 and Fall 2001
OLS OLS 2SLS 2SLS
CTE Concentrator 0.0294 0.0433 3.759** 2.055
[0.0414] [0.0417] [1.760] [1.558]
Any Tech Prep Courses
-0.0908*** 0.216
[0.0251] [0.442]
Any ROP Courses
-0.0542 0.062
[0.0471] [0.329]
Instrumental Variables? No No Yes Yes
Number of Observations 19950 19950 19382 19382
R-squared 0.437 0.438 0.024 0.293
P-Values from Tests
ROP=Tech Prep=0
0.004 0.882
CTE + Tech Prep=0
0.263 0.154
CTE + ROP=0
0.865 0.175
All 3 CTE Coefficients = 0
0.011 0.547
Test for Exclusion of Added IVs
(First-Stage Model)
CTE
0.105 0.044
Tech Prep
<0.001
ROP
<0.001
Hausman Test (exogeneity)
0.0247 0.205
Overidentification Test
0.4719 0.1574
Notes: Standard errors in brackets are clustered at the school level. * significant at 10%; ** significant at 5%; *** significant at 1%
Dependent variable is highest level of educational attainment eight years after starting high school, where ordinal levels are: some high school, high school graduate, some 2-year college education, 2-year degree, some 4-year college education, 4-year degree.

240
Appendix C Table 18 Ordered Probit Models of Highest Level of Educational Attainment, in Terms of 2-Course CTE Concentration Fields: Students Entering Grade 9 between Fall 1998 and Fall 2001
2-Course Concentration Fields Some High
School High
School Some 2-year
2-year Degree
Some Univ.
4-year Degree
Communication Design -0.0081*** -0.0349*** -0.0058 0.0011 0.0328*** 0.0148***
[0.0031] [0.0101] [0.0044] [0.0044] [0.0087] [0.0047]
Business Support -0.0055 -0.0239* -0.0040 0.00075 0.0225* 0.0102*
[0.0034] [0.0134] [0.0036] [0.00304] [0.0125] [0.0058]
Computer and Information Science -0.0088** -0.0380** -0.0063 0.00120 0.0358** 0.0162**
[0.0043] [0.0173] [0.0053] [0.00482] [0.0157] [0.0074]
Construction 0.0107** 0.0463*** 0.0077 -0.00146 -0.0436*** -0.0197**
[0.0048] [0.0175] [0.0061] [0.00585] [0.0154] [0.0079]
Other -0.0018 -0.0077 -0.0013 0.00024 0.0073 0.0033
[0.0028] [0.0119] [0.0022] [0.00104] [0.0112] [0.0051]
Number of Observations 19950 19950 19950 19950 19950 19950
R-squared 0.1823 0.1823 0.1823 0.1823 0.1823 0.1823
P-Values from Tests
Top 4 Fields = 0 <0.001 <0.001 <0.001 <0.001 <0.001 <0.001
Other = Top 4 = 0 <0.001 <0.001 <0.001 <0.001 <0.001 <0.001
Notes: Standard errors in brackets are clustered at the school level. * significant at 10%; ** significant at 5%; *** significant at 1% Average marginal effects of independent variable on the probability of each incremental level of educational attainment level reported. Marginal effects estimates are localized around the mean number of CTE courses taken in the estimation sample. Dependent variable defined as highest educational attainment level four years after beginning high school.
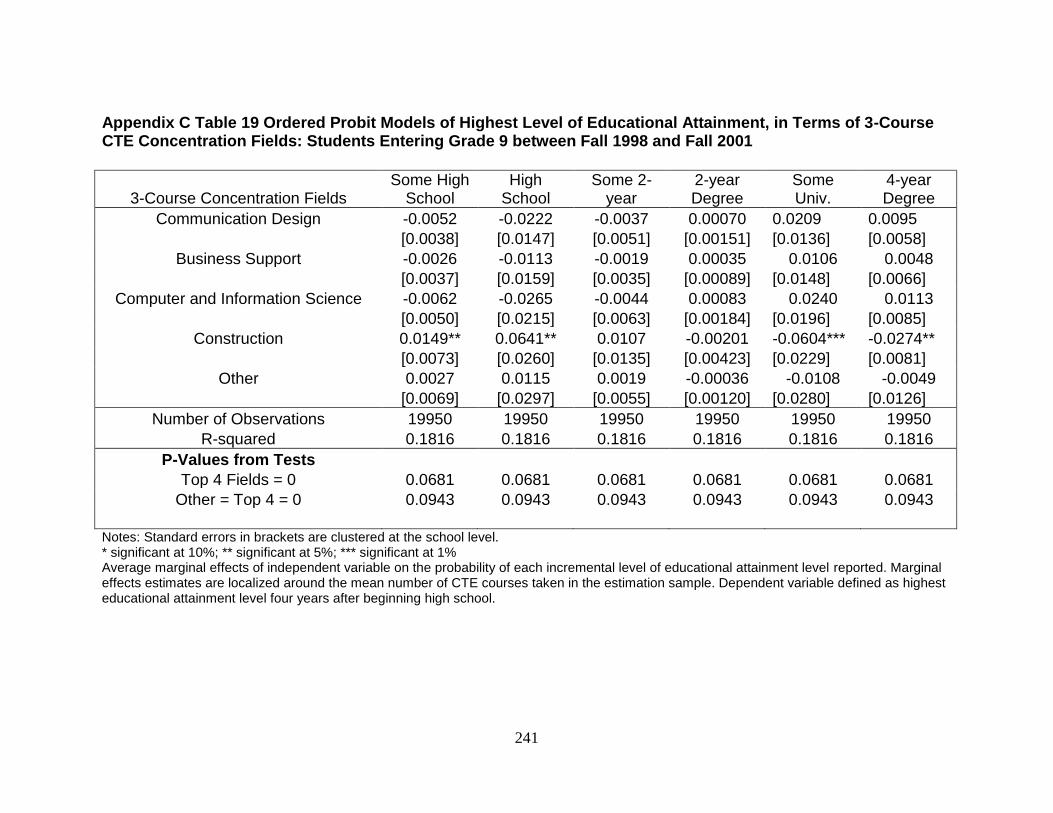
241
Appendix C Table 19 Ordered Probit Models of Highest Level of Educational Attainment, in Terms of 3-Course CTE Concentration Fields: Students Entering Grade 9 between Fall 1998 and Fall 2001
3-Course Concentration Fields Some High
School High
School Some 2-
year 2-year Degree
Some Univ.
4-year Degree
Communication Design -0.0052 -0.0222 -0.0037 0.00070 0.0209 0.0095
[0.0038] [0.0147] [0.0051] [0.00151] [0.0136] [0.0058]
Business Support -0.0026 -0.0113 -0.0019 0.00035 0.0106 0.0048
[0.0037] [0.0159] [0.0035] [0.00089] [0.0148] [0.0066]
Computer and Information Science -0.0062 -0.0265 -0.0044 0.00083 0.0240 0.0113
[0.0050] [0.0215] [0.0063] [0.00184] [0.0196] [0.0085]
Construction 0.0149** 0.0641** 0.0107 -0.00201 -0.0604*** -0.0274**
[0.0073] [0.0260] [0.0135] [0.00423] [0.0229] [0.0081]
Other 0.0027 0.0115 0.0019 -0.00036 -0.0108 -0.0049
[0.0069] [0.0297] [0.0055] [0.00120] [0.0280] [0.0126]
Number of Observations 19950 19950 19950 19950 19950 19950
R-squared 0.1816 0.1816 0.1816 0.1816 0.1816 0.1816
P-Values from Tests
Top 4 Fields = 0 0.0681 0.0681 0.0681 0.0681 0.0681 0.0681
Other = Top 4 = 0 0.0943 0.0943 0.0943 0.0943 0.0943 0.0943
Notes: Standard errors in brackets are clustered at the school level. * significant at 10%; ** significant at 5%; *** significant at 1% Average marginal effects of independent variable on the probability of each incremental level of educational attainment level reported. Marginal effects estimates are localized around the mean number of CTE courses taken in the estimation sample. Dependent variable defined as highest educational attainment level four years after beginning high school.

242
Appendix C Table 20 California Postsecondary Institutions Not Participating in NSC and Approximate Enrollment Counts, 2009
School Name Enrollment Location
BROOKS INSTITUTE OF PHOTOGRAPHY 1743 Santa Barbara, CA
CALIFORNIA COLLEGE OF TECHNOLOGY 1062 Sacramento, CA
CALIFORNIA SCHOOL OF CULINARY ARTS 1550 Pasadena, CA
EX-PRESSION COLLEGE FOR DIGITAL ARTS 1053 Emeryville, CA
FASHION INSTITUTE OF DESIGN MERCH. LA 6583 Los Angeles, CA
FULLER THEOLOGICAL SEMINARY 3024 Pasadena, CA
GAVILAN COLLEGE 6049 Gilroy, CA
GEMOLOGICAL INSTITUTE OF AMERICA 3268 Carlsbad, CA
MARIC COLLEGE† – Modesto 1112 Salida, CA
MARIC COLLEGE† – San Diego 1476 San Diego, CA
MARIC COLLEGE† – San Diego* 1380 San Diego, CA
MUSICIANS INSTITUTE 1252 Los Angeles, CA
PACIFIC COLLEGE OF ORIENTAL MED 1209 San Diego, CA
PACIFIC OAKS COLLEGE 1064 Pasadena, CA
PALO VERDE COLLEGE 3831 Blythe, CA
SAN JOAQUIN VALLEY COLLEGE 4328 Visalia, CA
SEQUOIA INSTITUTE 1499 Fremont, CA
TAFT COLLEGE 9328 Taft, CA
THE ART INSTITUTE OF CALIFORNIA 2145 San Diego, CA
THE ART INSTITUTES INTL 5843 San Francisco, CA
WESTERN CAREER COLLEGE 3880 Sacramento, CA
WEST WOOD COLLEGE 1078 Los Angeles, CA
WESTWOOD COLLEGE - LOS ANGELES * 2241 Los Angeles, CA † Now Kaplan College. * Duplicate listings of Institutions are a result of multiple federal school codes.