care & feeding of the nicu graduate - colby college · 1 care & feeding of the nicu...
TRANSCRIPT

1
Care & Feeding of the Care & Feeding of the NICU GraduateNICU Graduate
Joseph M. Bliss MD, PhDJoseph M. Bliss MD, PhD
Associate Associate Professor of PediatricsProfessor of Pediatrics
Brown Medical SchoolBrown Medical School
Dr. Bliss has no financial relationships to disclose.
Learning ObjectivesLearning Objectives
�� Learner will be able to identify unique medical Learner will be able to identify unique medical needs of former premature infants.needs of former premature infants.
�� Learner will understand underlying physiology Learner will understand underlying physiology that contributes to unique medical needs of that contributes to unique medical needs of premature infants.premature infants.
�� Learner will acquire strategies to address these Learner will acquire strategies to address these unique medical needs.unique medical needs.
OutlineOutline
�� Scope of the problemScope of the problem
�� Neurodevelopmental outcomesNeurodevelopmental outcomes
�� NutritionNutrition
–– Calories (Protein)Calories (Protein)
–– MineralsMinerals
–– IronIron
DefinitionsDefinitions
�� Convention: PostConvention: Post--menstrual age (LMP)menstrual age (LMP)
�� Length of Gestation Length of Gestation –– 40 weeks40 weeks
–– Term: 38Term: 38--42 completed weeks42 completed weeks
–– PretermPreterm
�� Late: 34Late: 34--37 completed weeks37 completed weeks
�� Moderate: 32Moderate: 32--33 completed weeks33 completed weeks
�� Early: <32 weeksEarly: <32 weeks
DefinitionsDefinitions
Weight/GrowthWeight/Growth
�� LBWLBW
�� VLBWVLBW
�� ELBWELBW
�� RLBWRLBW
�� ELGANELGAN
�� SGASGA
�� IUGRIUGR
�� TWPTWP
Preterm is less than 37 completed weeks gestation.
Source: National Center for Health Statistics, final natality data. Retrieved June 3, 2013, from www.marchofdimes.com/peristats.
Preterm birth
United States, 1995-2010

2
Not preterm is greater than or equal to 37 weeks gestation. Preterm is less than 37 completed weeks
gestation. Very preterm is less than 32 completed weeks gestation. Moderately preterm is 32-36
completed weeks of gestation.
Source: National Center for Health Statistics, final natality data. Retrieved from
www.marchofdimes.com/peristats.
Distribution of gestational age categories
United States, 2010
Prematurity in the USPrematurity in the US
�� PostPost--surfactant erasurfactant era
–– Antenatal steroidsAntenatal steroids
–– Improved ventilation techniquesImproved ventilation techniques
�� Improved survivalImproved survival
�� Managed health care guidelines lead to Managed health care guidelines lead to earlier dischargeearlier discharge
�� More premature infants and less mature at More premature infants and less mature at dischargedischarge
–– Increased burden on primary care providersIncreased burden on primary care providers
ELBW SurvivalELBW Survival
0
10
20
30
40
50
60
70
80
1991-94 1995-98 2000-02
Survival (%
)
Fanaroff et al., 2007, Am J Obstet Gynecol 196:147Wilson-Costello, 2007, Pediatrics 119:37
Severe Neurodevelopmental Severe Neurodevelopmental ImpairmentImpairment
�� Unlike survival, rates stable over past 20 Unlike survival, rates stable over past 20 yearsyears
�� One or more of the following:One or more of the following:
–– Moderate to severe CPModerate to severe CP
–– Cognitive or motor scores <2 SD below meanCognitive or motor scores <2 SD below mean
–– Bilateral hearing impairment requiring Bilateral hearing impairment requiring amplificationamplification
–– BlindnessBlindness
Stephens and Vohr, 2009, Pediatr Clin N Am 56:631
Severe Neurodevelopmental Severe Neurodevelopmental ImpairmentImpairment
�� In Neonatal Research Network centers In Neonatal Research Network centers (1990s)(1990s)
–– 2222--26 weeks: 4526 weeks: 45--50%50%
–– 2727--32 weeks: 2832 weeks: 28--40%40%
�� 21% of ELBW infants had no impairment21% of ELBW infants had no impairment
Vohr et al., 2005, Pediatrics 116:365
Cognitive ImpairmentCognitive Impairment
�� BayleyBayley Assessment Assessment –– MDIMDI
–– Mean Mean –– 100100
–– SD SD –– 1515
�� Average in NRN for ELBW at 18Average in NRN for ELBW at 18--22 22 months corrected age: 76 (70 to 83 months corrected age: 76 (70 to 83 among centers)among centers)
Vohr et al., 2000, Pediatrics 105:1216Vohr et al., 2004, Pediatrics 113:781

3
Cognitive ImpairmentCognitive Impairment
�� Scores at 18Scores at 18--22 months may not reflect later 22 months may not reflect later cognitive functioncognitive function
–– Mean MDI in one NRN cohort:Mean MDI in one NRN cohort:
�� 1818--22 months = 76 (Cognitive impairment = 39%)22 months = 76 (Cognitive impairment = 39%)
�� 8 years = 88 (Cognitive impairment = 16%)8 years = 88 (Cognitive impairment = 16%)
�� PPV of an MDI <70 at 8 years among those with MDI <70 at PPV of an MDI <70 at 8 years among those with MDI <70 at 22 months = 0.3722 months = 0.37
–– Similar improvements noted in expressive language Similar improvements noted in expressive language scores and full scale IQscores and full scale IQ
–– Many older formerly VLBW infants score in average to Many older formerly VLBW infants score in average to low average rangelow average range
�� BUT BUT -- lower on essentially every measure lower on essentially every measure relative to fullrelative to full--term peersterm peers Hack et al., 2005, Pediatrics 116:333
Ment et al., 2003, JAMA 289:705
Cerebral PalsyCerebral Palsy
�� 1515--23% of ELBW infants23% of ELBW infants
–– Large range of severityLarge range of severity
–– Up to 1/3 are ambulatoryUp to 1/3 are ambulatory
�� FormsForms
–– Spastic Spastic diplegiadiplegia –– 4040--50%50%
–– Spastic Spastic qudriplegiaqudriplegia
–– HemiplegiaHemiplegia
Stephens and Vohr, 2009, Pediatr Clin N Am 56:631
IVHIVH
http://maria.htmlplanet.com/photo.html
Normal
Grade I Grade II
IVHIVH
Grade III
Grade IV
http://maria.htmlplanet.com/photo.html
PVLPVL
radiopaedia.org
Cerebral PalsyCerebral Palsy
�� Strongest predictorsStrongest predictors
–– IntraventricularIntraventricular hemorrhage (IVH) hemorrhage (IVH) –– Grades 3 Grades 3 and 4and 4
�� 60% have CP at age 560% have CP at age 5
�� 92% require special services92% require special services
–– Hydrocephalus Hydrocephalus -- 1212--fold increased riskfold increased risk
–– PeriventricularPeriventricular leukomalacialeukomalacia (PVL) (PVL) -- 33--10 fold 10 fold increased riskincreased risk
�� 66--9% of ELBW with normal head 9% of ELBW with normal head ultrasounds have CP at 22 monthsultrasounds have CP at 22 months
Msall et al., 1991, J. Pediatr 119: 606Ment et al., 2002, Neurology 58: 1726Ment et al., 2005, Pediatrics 116:1597Laptook et al., 2005, Pediatrics 115:673
4
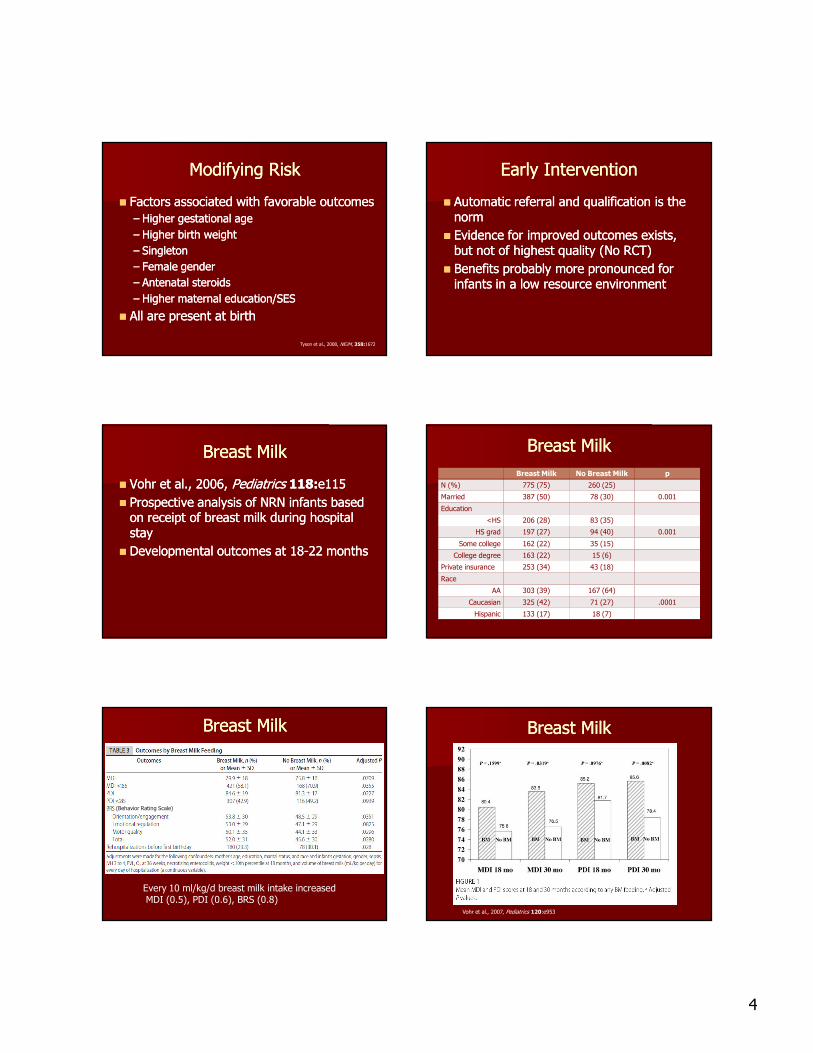
Modifying RiskModifying Risk
�� Factors associated with favorable outcomesFactors associated with favorable outcomes
–– Higher gestational ageHigher gestational age
–– Higher birth weightHigher birth weight
–– SingletonSingleton
–– Female genderFemale gender
–– Antenatal steroidsAntenatal steroids
–– Higher maternal education/SESHigher maternal education/SES
�� All are present at birthAll are present at birth
Tyson et al., 2008, NEJM, 358:1672
Early InterventionEarly Intervention
�� Automatic referral and qualification is the Automatic referral and qualification is the normnorm
�� Evidence for improved outcomes exists, Evidence for improved outcomes exists, but not of highest quality (No RCT)but not of highest quality (No RCT)
�� Benefits probably more pronounced for Benefits probably more pronounced for infants in a low resource environmentinfants in a low resource environment
Breast MilkBreast Milk
�� Vohr et al., 2006, Vohr et al., 2006, Pediatrics Pediatrics 118:118:e115e115
�� Prospective analysis of NRN infants based Prospective analysis of NRN infants based on receipt of breast milk during hospital on receipt of breast milk during hospital staystay
�� Developmental outcomes at 18Developmental outcomes at 18--22 months22 months
Breast MilkBreast Milk
Breast Milk No Breast Milk p
N (%) 775 (75) 260 (25)
Married 387 (50) 78 (30) 0.001
Education
<HS 206 (28) 83 (35)
HS grad 197 (27) 94 (40) 0.001
Some college 162 (22) 35 (15)
College degree 163 (22) 15 (6)
Private insurance 253 (34) 43 (18)
Race
AA 303 (39) 167 (64)
Caucasian 325 (42) 71 (27) .0001
Hispanic 133 (17) 18 (7)
Breast MilkBreast Milk
Every 10 ml/kg/d breast milk intake increasedMDI (0.5), PDI (0.6), BRS (0.8)
(Behavior Rating Scale)
Breast MilkBreast Milk
Vohr et al., 2007, Pediatrics 120:e953

5
Human Milk Human Milk -- Preferred feeding Preferred feeding for all infantsfor all infants
�� Challenges for preterm infantsChallenges for preterm infants�� Milk supply may be diminished Milk supply may be diminished –– long term long term pumping pumping
�� Nutrients are appropriate for full term infantsNutrients are appropriate for full term infants�� Infants are tube fed and bottle fed during Infants are tube fed and bottle fed during hospitalizationhospitalization
�� Most preterm infants cannot or will not be able Most preterm infants cannot or will not be able to breastfeed exclusively at the time of to breastfeed exclusively at the time of dischargedischarge
Fetal NutritionFetal Nutrition
�� 33rdrd trimester trimester –– rapid growth and nutrient rapid growth and nutrient accretionaccretion
�� 80% total body Calcium, Phosphorous and 80% total body Calcium, Phosphorous and Magnesium accreted between 24 Magnesium accreted between 24 –– 40 wks40 wks
�� Fetus triples in weightFetus triples in weight
�� Majority of VLBW infants become growth Majority of VLBW infants become growth restricted (<10restricted (<10thth percentile) by 36 weeks percentile) by 36 weeks corrected agecorrected age
Ehrenkranz, et al., 1999,Pediatrics 104:280
ExtrauterineExtrauterine Growth RestrictionGrowth Restriction
Ehrenkranz, et al., 1999,Pediatrics 104:280
Current growth: MorbidityCurrent growth: Morbidity
The CurvesThe Curves
�� Intrauterine Growth Curve Intrauterine Growth Curve –– up to due up to due datedate
�� Standard Growth Curve Standard Growth Curve –– after 40 weeks after 40 weeks corrected agecorrected age
�� Use “corrected age” up to 30 monthsUse “corrected age” up to 30 months
Fenton, 2003, BMC Pediatrics 3:13www.biomedcentral.com/bmcpediatr/
Intrauterine Growth CurveIntrauterine Growth Curve
�� Fetal growth to termFetal growth to term
�� Linked with WHO growth Linked with WHO growth chart after termchart after term
�� Gender neutralGender neutral
�� Modified chart available for Modified chart available for US infants US infants (Olsen et al., 2010, (Olsen et al., 2010,
Pediatrics Pediatrics 125: e214)125: e214)
�� Boys and girls separatedBoys and girls separated
�� Decreases false IUGR Decreases false IUGR diagnosis, esp. in girlsdiagnosis, esp. in girls
�� Differences are smallDifferences are small
�� Ends at 40 weeksEnds at 40 weeks

6
Standard Growth CurveStandard Growth Curve
�� CDC recommends WHO growth CDC recommends WHO growth curve through age 2curve through age 2
�� Based on growth data from 6 Based on growth data from 6 countries, including UScountries, including US
�� Better representation of breast Better representation of breast fed infantsfed infants
�� Length based on board rather Length based on board rather than standingthan standing
�� Available on CDC web siteAvailable on CDC web site
“Catch“Catch--up Growth”up Growth”
�� Sporadic episodes of accelerated growth velocitySporadic episodes of accelerated growth velocity
–– Between 4Between 4--12 months 12 months
–– Growth parameters can approach the 25Growth parameters can approach the 25thth to 50to 50thth
percentilepercentile
�� Head growth achieves catchHead growth achieves catch--up before weight up before weight and lengthand length
–– e.g. HC at 50e.g. HC at 50thth--9090thth % with weight and length still at % with weight and length still at 33rdrd--2525thth %%
“Catch“Catch--up Growth”up Growth”
•• Definitions varyDefinitions vary
•• The velocity of weight gain must be higher than what The velocity of weight gain must be higher than what is expected for age for a period of time.is expected for age for a period of time.
•• How high?How high?
•• Above the 5Above the 5thth to 10to 10thth percentile on term growth chart?percentile on term growth chart?
•• RetrackRetrack along the birth percentile?along the birth percentile?
CatchCatch--up and Outcomesup and Outcomes
•• Early catchEarly catch--up growth (by 1up growth (by 1--2 months CA) 2 months CA) associated with better neurologic associated with better neurologic outcomes. outcomes. (Cooke, 2011, (Cooke, 2011, Ann. Ann. NutrNutr. . MetabMetab. . 58:58:3232))
•• CatchCatch--up by 6up by 6--9 months CA have better 9 months CA have better outcomes than those who don’t. outcomes than those who don’t. ((LatalLatal--HajnalHajnal et al., et al.,
2003, 2003, J. Pediatr. J. Pediatr. 143:143:163163))
•• Upward trajectory crossing percentiles Upward trajectory crossing percentiles may lead to long term morbiditiesmay lead to long term morbidities
•• Metabolic syndromeMetabolic syndrome
•• Insulin resistanceInsulin resistance
Challenges at DischargeChallenges at Discharge
�� Preemies may only be taking in 11 Preemies may only be taking in 11 –– 13 oz. per day13 oz. per day
�� They may not have reached 40 weeks corrected ageThey may not have reached 40 weeks corrected age
�� At risk for osteopenia, anemia At risk for osteopenia, anemia
�� Poor suckPoor suck--swallow coordinationswallow coordination
�� Excessive tongue thrustExcessive tongue thrust
�� Problems with gag reflex; oral aversionProblems with gag reflex; oral aversion
�� Reflux; spittingReflux; spitting
�� Increased work of breathing from respiratory/cardiac Increased work of breathing from respiratory/cardiac
disease may compromise ability to eat by decreasing disease may compromise ability to eat by decreasing feeding endurance or interestfeeding endurance or interest
Growth ExpectationsGrowth ExpectationsInfants < 40 wks CAInfants < 40 wks CA
�� AAP recommends growth to be at same AAP recommends growth to be at same rate as if infant was still in rate as if infant was still in uteroutero..
��Weight: increase by 15 gm/kg/dWeight: increase by 15 gm/kg/d
�� Length: increase by 0.9 cm/wkLength: increase by 0.9 cm/wk
�� HC: increase by 0.5 HC: increase by 0.5 –– 0.9 cm/wk0.9 cm/wk

7
Enteral needs: Selected nutrientsEnteral needs: Selected nutrients
Premature infantsFeeding/growing
Full-term infantsDietary Reference Intakes
ELBW VLBW 0-6 mo (4 kg) 7-12 mo
Energy 130-150 Kcal/kg 110-130 Kcal/kg555 Kcal/d (140/kg)
694 Kcal/d
Carbohydrate 9-20 g/kg 7-17 g/kg 60 g/d (15/kg) 95 g/d
Protein* 3.8-4.4 g/kg 3.4-4.2 g/kg 9.1 g/d (2.3/kg) 11 g/d
Lipid 6.2-8.4 g/kg 5.3-7.2 g/kg 31 g/d ( 8/kg) 30 g/d
Calcium* 100-220 mg/kg 210 mg/d (52/kg) 270 mg/d
Phosphorus* 60-140 mg/kg 100 mg/d (25/kg) 275 mg/d
Vitamin D 400 International Units/d 400 International Units/d
Iron 2-4 mg/kg but not > 15 mg/d 2-4 mg/kg but not >15 mg/d
Preterm infants need fortification of Preterm infants need fortification of human milk human milk
�� ProteinProtein
�� Calcium and phosphorousCalcium and phosphorous
�� Vitamin DVitamin D
�� IronIron
�� ElectrolytesElectrolytes
Comparing IntakesComparing Intakes
Recommended HM +
HMF
HM HM + trans.
powder (24
kcal/oz)
HM alternating
with trans. Formula
Calories
(kcal/kg)
120 120 120 120 120
Volume
(ml/kg)
150 175 150 165
Protein
(g/kg)
2.8-3.4 2.9 1.6 1.9 2.5
Ca (mg/kg) 100-220 197 49 64 92
Phos (g/kg) 60-140 110 26 35 52
Zinc
(mcg/kg)
1000-3000 1470 210 412 848
Vit D (IU/D) 400 411 4 36 95
Transitional FormulaTransitional Formula
�� Recommended if HM is not available or Recommended if HM is not available or insufficient supply.insufficient supply.
�� Improved nutritional intake of key Improved nutritional intake of key nutrientsnutrients
�� Improved bone mineral contentImproved bone mineral content
�� Enhanced lean body mass accretionEnhanced lean body mass accretion
AAP and ACOG, 2007AAP and ACOG, 2007
�� The use of enriched formulas has been The use of enriched formulas has been shown to result in greater linear growth, shown to result in greater linear growth, weight gain and bone mineralization when weight gain and bone mineralization when compared with the use of term formula. compared with the use of term formula. Small, preterm neonates (born at or Small, preterm neonates (born at or before 34 week of gestation, with a birth before 34 week of gestation, with a birth weight less than or equal to 1,800g) and weight less than or equal to 1,800g) and neonates with morbidities (eg, BPD) may neonates with morbidities (eg, BPD) may benefit from the use of such formulas for benefit from the use of such formulas for up to 9 months after hospital discharge.up to 9 months after hospital discharge.
Transitional Formula Transitional Formula –– How How Long??????Long??????
�� MUST be individualized and research limitedMUST be individualized and research limited
�� Larger, healthier Larger, healthier premiespremies may require less time may require less time on transitional formula than smaller, sicker oneson transitional formula than smaller, sicker ones
�� Length, weight, and HC should show evidence of Length, weight, and HC should show evidence of catchcatch--up by three months corrected ageup by three months corrected age
�� Should gradually reach at least the 25thShould gradually reach at least the 25th--50th % 50th % at a child's own rateat a child's own rate
�� When these percentiles are maintained and at When these percentiles are maintained and at ~26 oz/d of formula, may be appropriate to ~26 oz/d of formula, may be appropriate to change to term formulachange to term formula

8
How many calories???How many calories???
�� Transitional formulas standard dilution is 22 Transitional formulas standard dilution is 22 kcal/ozkcal/oz
�� Can be mixed to other concentrationsCan be mixed to other concentrations
�� Consider 24 kcal/oz for infants with poor growthConsider 24 kcal/oz for infants with poor growth
�� Can be concentrated further to 27 kcal/ozCan be concentrated further to 27 kcal/oz
–– Caregivers must be cautioned to use as directedCaregivers must be cautioned to use as directed
–– 27 kcal/oz have high renal solute loads 27 kcal/oz have high renal solute loads
–– Require appropriate volumes, especially in hot Require appropriate volumes, especially in hot weather or when total fluids restricted to <120 weather or when total fluids restricted to <120 ml/kg/d.ml/kg/d.
• Human Milk20 kcal/oz = HM20
22 kcal/oz = 45 mL HM20 + ¼ tsp Trans formula powder24 kcal/oz = 45 mL HM20 + ½ tsp Trans formula powder27 kcal/oz = 30 mL HM20 + 1 tsp Trans formula powder30 kcal/oz = 30 mL HM20 + 1 tsp Trans formula powder + 0.45 mL corn oil30 kcal/oz = 60 mL HM20 + 1 ½ tsp Trans formula powder
• Transitional Infant Formula22 kcal/oz = 1 scoop Trans powder + 2 oz water = 2 fluid ounces24 kcal/oz = 3 scoops Trans powder + 5 oz water = 6.5 fluid ounces27 kcal/oz = 5 scoops Trans powder + 8 oz water = 9 fluid ounces30 kcal/oz = 30 mL 27 kcal/oz Transitional formula + 0.45 mL corn oil
ABBREVIATIONS� HM = human milk/breast milk� Trans = transitional infant formula� tsp = measuring teaspoon, level
RecipesRecipes
A word about soy…A word about soy…
�� Soy based formulas are problematic for Soy based formulas are problematic for preterm infantspreterm infants
–– Bind phosphorous and decrease absorptionBind phosphorous and decrease absorption
–– Serum phosphorus levels lower in preterm Serum phosphorus levels lower in preterm infants fed soy formula and alkaline infants fed soy formula and alkaline phosphatasephosphatase levels were higher.levels were higher.
–– Even with supplemental calcium and vitamin Even with supplemental calcium and vitamin D, increased D, increased osteopeniaosteopenia was present in 32%was present in 32%
–– Decreased Fe absorption as wellDecreased Fe absorption as well
Callenbach et al., 1981, J Pediatr. 98:800
What about Iron??What about Iron??
�� 25% 25% -- 85% of preterm infants develop iron 85% of preterm infants develop iron deficiency during infancydeficiency during infancy
–– Occurs earlier than term infants (first 6 postnatal Occurs earlier than term infants (first 6 postnatal months)months)
–– Old data (1970Old data (1970--80s)80s)
�� Why?Why?
–– Fetal accretion mostly during 3Fetal accretion mostly during 3rdrd trimestertrimester
–– Stores deplete rapidly with rapid catchStores deplete rapidly with rapid catch--up growthup growth
�� Requires increased blood volume, Requires increased blood volume, HgbHgb
�� Anemia is a Anemia is a latelate sign, suggesting substantial Fe sign, suggesting substantial Fe store depletionstore depletion
Rao and Georgieff., 2009,Clin Perinatol 36:27
Iron DeficiencyIron Deficiency
�� Supplementation clearly benefits shortSupplementation clearly benefits short--term hematologic parametersterm hematologic parameters
�� MayMay affect neurodevelopmentaffect neurodevelopment
–– Data relatively limitedData relatively limited
–– Study compared supplementation at 2 months Study compared supplementation at 2 months vs. 2 weeksvs. 2 weeks
–– Late groupLate group
�� Increased mild neurologic abnormalities at age 5Increased mild neurologic abnormalities at age 5
�� Trend toward poorer cognitive performanceTrend toward poorer cognitive performance
Steinmacher et al., 2007, Pediatrics 120:538
Preterm Rec. Dose Preterm Rec. Dose ––22--4 mg/kg/d4 mg/kg/d
�� To prevent Fe deficiencyTo prevent Fe deficiency
�� Even with 4Even with 4--6 mg/kg/d 15% of infants 6 mg/kg/d 15% of infants <1300 g will be deficient (non<1300 g will be deficient (non--transfused)transfused)
�� Breast milk clearly needs supplementBreast milk clearly needs supplement
�� Available vitamin with Fe adds 10 mg/mlAvailable vitamin with Fe adds 10 mg/ml
Breast Milk Transitional formula
Soy formula
Content 0.5 mg/L 13 mg/L 13 mg/L
Absorption >50% 4-12% 1-7%
Total intake (150 ml/kg)
0.075 mg/kg/d
2 mg/kg/d 2 mg/kg/d
Total absorbed
0.05 mg 0.2 mg 0.04 mg

9
Our PracticeOur Practice
�� Initiate iron supplementation in all VLBW Initiate iron supplementation in all VLBW infants when full feeds established (~2 infants when full feeds established (~2 wks.)wks.)
�� Goal 2Goal 2--4 mg/kg/d, higher OK if no 4 mg/kg/d, higher OK if no frequent transfusionsfrequent transfusions
�� Discharged on vitamin supplement with Discharged on vitamin supplement with iron at a dose to achieve that goaliron at a dose to achieve that goal
�� Approach also provides adequate vitamin Approach also provides adequate vitamin D for breast fed babiesD for breast fed babies
Iron FollowIron Follow--upup
�� Supplement to 12Supplement to 12--15 months corrected 15 months corrected ageage
�� Full term recommended at 9Full term recommended at 9--12 months12 months
�� If screened around discharge, recheck at If screened around discharge, recheck at 44--6 months chronologic age6 months chronologic age
�� Individualize further screening based on Individualize further screening based on findings, growth velocity, type of feeding, findings, growth velocity, type of feeding, dose of iron supplementdose of iron supplement
General RecommendationsGeneral Recommendations
�� Breast milk or infant formula exclusively until 4 Breast milk or infant formula exclusively until 4 to 6 months to 6 months correctedcorrected ageage
–– Developmental readiness for solid foods may appear Developmental readiness for solid foods may appear later for premature infants than term infantslater for premature infants than term infants
–– Encourage giving breast milk or formula first at meal Encourage giving breast milk or formula first at meal time and solids secondtime and solids second
�� Fruit juice between 6 to 8 months Fruit juice between 6 to 8 months correctedcorrected ageage
�� Whole cow’s milk no sooner than 1 year Whole cow’s milk no sooner than 1 year correctedcorrected ageage