cardiovascular adaptations to long duration head-down tilt ... · registered sonographer using a...
TRANSCRIPT

Cardiovascular Adaptations to Long Duration Head-Down Tilt Bed Rest
Steven H. Platts, Ph.D.; David S. Martin, M.S.; Sondra A. Perez, M.S.; L.
Christine Ribeiro, M.S.; Michael B. Stenger, Ph.D.; Richard Summers, M.D.,
Ph.D.; Janice V. Meck, Ph.D.
NASA Johnson Space Center, Houston (SH Platts, JV Meck); and Wyle
Laboratories, Inc. (DS Martin, SA Perez, LC Ribeiro, MB Stenger), University of
Mississippi (R Summers)
Running Head: Cardiovascular System During Bed Rest
Abstract Word Count: 224
Main Text Word Count: 4119
Number of References: 29
Number of Tables: 2
Number of Figures: 5
Corresponding Author:
Steven H. Platts, Ph.D.
NASA Johnson Space Center, Mail Code SK
2101 NASA Parkway
Houston, TX 77058
Phone: 281-483-8177
Fax: 281-483-4181
1
https://ntrs.nasa.gov/search.jsp?R=20080010634 2020-05-12T06:27:11+00:00Z


ABSTRACT
INTRODUCTION: Orthostatic hypotension is a serious risk for crewmembers
returning from spaceflight. Numerous cardiovascular mechanisms have been
proposed to account for this problem, including vascular and cardiac dysfunction,
which we studied during bed rest. METHODS: Thirteen subjects were studied
before and during bed rest. Statistical analysis was limited to the first 49-60 days
of bed rest, and compared to pre-bed rest data. Ultrasound data were collected
on vascular and cardiac structure and function. Tilt testing was conducted for 30
minutes or until presyncopal symptoms intervened. RESULTS: Plasma volume
was significantly reduced by day 7 of bed rest. Flow-mediated dilation in the leg
was significantly increased at bed rest day 49. Arterial responses to nitroglycerin
differed in the arm and leg, but did not change as a result of bed rest. Intimal-
medial thickness markedly decreased at bed rest days 21, 35 and 49. Several
cardiac functional parameters including isovolumic relaxation time, ejection time
and myocardial performance index were significantly increased (indicating a
decrease in cardiac function) during bed rest. There was a trend for decreased
orthostatic tolerance following 60 days of bed rest. DISCUSSION: These data
suggest that 6º head-down tilt bed rest alters cardiovascular structure and
function in a pattern similar to short duration spaceflight. Additionally, the
vascular alterations are primarily seen in the lower body, while vessels of the
upper body are unaffected.
KEY WORDS: spaceflight, orthostatic intolerance, hypotension, fluid-shift,
plasma volume
3
INTRODUCTION
Spaceflight provokes numerous untoward effects on the cardiovascular system.
These effects have been shown in spaceflight studies (1), bed rest analog
studies (20) and animal studies (18). Post-spaceflight orthostatic hypotension
has been the subject of intense study during the last 20 years, both during
spaceflight and head-down tilt bed rest investigations. This problem appears to
develop from a series of in-flight cardiovascular changes including a relative
hypovolemia, initiated by the cephalad fluid shift and a lack of arterial
baroreceptor input (2,3,10,16). Other cardiovascular alterations have also been
reported, including decreased cardiac function (21,25), decreased aerobic
capacity (13), changes in vascular structure and function (10,29) and possible
cardiac rhythm abnormalities (6,9).
Head-down tilt bed rest has become a primary research tool to examine
mechanisms and test countermeasures for cardiovascular alterations. There is
abundant literature supporting the utility of bed rest as an analog for multiple
organ systems. One of the drawbacks of bed rest literature is the lack of
standardization. This study is part of a NASA Flight Analogs Project initiative to
conduct multisystem research on bed rest subjects under strictly standardized
conditions.
We tested the hypothesis that arterial flow-mediated dilation responses, dilation
in response to nitroglycerin and arterial structure would all change during bed
4

rest. Additionally, we tested the hypothesis that arteries in the arm would follow
different patterns of change than arteries in the leg during head-down tilt bed
rest. No bed rest study to date has addressed this possibility. Finally, we tested
the hypothesis that orthostatic tolerance would decrease following bed rest.
Spaceflight and bed rest may also induce changes in cardiac function. Recent
work has shown a decrease in ventricular mass (21,24) and stroke volume
(5,15,21); however, more comprehensive measures of cardiac function are
lacking. In addition to the above standard measures, we studied the effects of
bed rest on numerous other indicators of cardiac function such as isovolumic
relaxation time and myocardial performance index. We tested the hypothesis
that cardiac function, as measured by echocardiography, would be decreased by
exposure to bed rest.
METHODS
General
Refer to Meck, et al. (17) for description of the protocol, general conditions of the
study and the use of long duration head-down tilt bed rest as a model for
spaceflight. Bed rest and test protocols were reviewed and approved by the
Johnson Space Center Committee for the Protection of Human Subjects, the
University of Texas Medical Branch (UTMB) Institutional Review Board and the
UTMB General Clinical Research Center Science Advisory Committee. Subjects
5

received verbal and written explanations of the bed rest and test protocols prior
to providing written informed consent.
Subjects
Data from 13 subjects are included in this study (eight men and five women).
Three subjects experienced 60 days of head-down tilt bed rest, six subjects
experienced 90 days of head-down tilt bed rest and four subjects experienced
44-53 days of head-down tilt bed rest (truncated due to Hurricane Rita, no post-
bed rest data were acquired on these subjects). Testing on females was timed to
always occur during the first six days of the menstrual cycle in order to minimize
the effects of estrogen and progesterone on the cardiovascular system.
Plasma Volume
Plasma volume was measured by the carbon monoxide rebreathing (CORB)
technique as previously reported (14,26). In this study, plasma volume was
corrected (plasma volume index, PVI) by body surface area (BSA).
( ) ( )725.0425.02 )()(007184.0)( cmHeightkgWeightmBSA ××=
Flow-Mediated Dilation
Subjects were placed in the supine position and instrumented with a three-lead
ECG. A Dinamap automatic blood pressure cuff (Johnson & Johnson, Arlington,
TX) was placed on the non-imaged arm to obtain a baseline blood pressure. An
occlusive pressure cuff (D. E. Hokanson, Inc., Bellevue, WA) was applied to the
6
limb used for imaging. Imaging of the brachial artery was performed by a
registered sonographer using a Philips HDI 5000 (Bothel, WA) with a 12 MHz
transducer above the antecubital fossa. When the optimal imaging site was
acquired, the site was marked with a permanent marker and the same position
was used throughout the study. In addition, ultrasound images from the initial
procedure were printed and reviewed prior to subsequent imaging sessions.
When possible, arterial branches were included as landmarks. Furthermore, a
photograph was taken during the procedure to show the position of the
transducer on the skin. This photograph was used to ensure proper placement
of the ultrasound probe for subsequent tests.
Resting diameter images of the brachial artery in the arm were optimized to allow
clear visualization of the intimal-medial borders. The images were then enlarged
to improve the accuracy of subsequent measurements. Three images at end-
diastole and three at peak systole were stored digitally for off-line analyses.
Blood flow parameters including peak systolic velocity, pulsatility index and
velocity time interval were also evaluated and stored. After acquisition of
baseline images, an occlusive cuff (Hokanson) was inflated to 50 mmHg above
the resting systolic pressure and cessation of flow was verified by Doppler
ultrasound. The cuff remained inflated for five minutes, at which point the cuff
was rapidly deflated. Pulsed Doppler of the flow response was stored at 10 and
20 seconds post-deflation. Images of the brachial artery were stored every 15
7

seconds, starting at 30 seconds post-deflation and continued until the third
minute. Additional images were acquired at minutes four and five.
Flow-mediated dilation of the anterior tibial artery in the leg was accomplished
following a similar protocol. The anterior tibial artery was chosen because it is of
similar size to the brachial artery and is superficial enough to obtain high quality
ultrasound images. The occlusive cuff was placed just proximal to the knee and
was inflated to 70 mmHg over resting systolic blood pressure. This pressure was
maintained for seven minutes on the leg prior to deflation. The remainder of the
procedure was identical to that used for the brachial artery, described above.
Preliminary results in our lab have shown that this protocol achieved a similar
hyperemic response to that seen in the arm at 50 mmHg supra-systolic pressure
for five minutes (data not shown).
Measurement and analysis of data were performed off-line on a desktop
computer using ProSolv Cardiovascular Analyzer 3.0.50 (Indianapolis, IN). .
Measurements were made during diastole for consistency. Each image was
measured by two experienced sonographers in a double-blind fashion. If a
significant (greater than 10%) discrepancy between the two analyses was found,
a third sonographer repeated the measurement. Doppler measurements and
calculations were performed by an automated analysis feature of the ultrasound
system.
8

For intimal-medial thickness measurements, three diastolic brachial artery
images were stored at the R wave and three systolic images were stored at the
end of the T wave from a superimposed ECG. The still frame images were
stored in DICOM format and analyzed off line on Prosolv Cardiovascular
Analyzer 3.0.50 (Indianapolis, IN). The posterior segment of the artery was
enhanced with a Region Of Interest (ROI) magnification tool. Intimal-medial
thickness measurements were made by two independent and blinded
sonographers from three sequential images taken at the R wave. The
measurements were made, with a caliper tool, from the central region of each
image. The anterior interface of the intima was selected as the first linear
interface echo; the second caliper was set at the medial adventitia line, defined
as the next linear interface followed by a dark separating line.
Direct Arterial Dilation
Imaging of the brachial and anterior tibial arteries after administration of
nitroglycerin (0.4 mg sublingual) was performed on the same day as, but no
sooner than one hour after the completion of, the flow-mediated dilation
procedure. The same imaging techniques and imaging locations were used as
previously described.
Three baseline images were acquired and digitally stored at end-diastole prior to
administration of sublingual nitroglycerin. The artery was imaged continuously
throughout the session to assure the same position was maintained. Starting at
9

three minutes after the nitroglycerin administration, three images per minute were
stored digitally for off-line analysis. One image per minute was measured live to
monitor the time course of dilation. Imaging was continued until two minutes
following the peak dilator response. The images were analyzed off-line by
experienced sonographers who were blinded to the subject information. Any
discrepancies greater than 10% were re-evaluated by a third sonographer.
Cardiac Function
Subjects were placed in the left lateral decubitus position. During head-down tilt
bed rest, the subjects maintained the 6° head-down tilt. American Society of
Echocardiography standards were used in acquiring images (HDI 5000, Philips
Medical, Bothel, WA). M-mode echocardiography was used to measure
interventricular septal thickness (IVST), posterior wall thickness (PWT) and left
ventricular diameter in systole (LVEDS) and diastole (LVEDD). From these
measurements, calculations of systolic function were made, including ejection
fraction, stroke volume, velocity of circumferential shortening and left ventricular
mass. Left ventricular mass was calculated as follows: LVM (g) = 0.8{1.05
[(LVEDD + IVST + PWT)3 - (LVEDD)3] + 0.6}. Myocardial performance index
(MPI), a global measure of both systolic and diastolic function, was calculated as
the ratio of left ventricular isovolumic contraction time plus isovolumic relaxation
time divided by ejection time. Assessment of all the valves was accomplished
using pulsed, continuous and color Doppler. Images were stored digitally and on
videotape for subsequent off-line analysis. The echocardiography protocol
10

utilized views consistent with standards established by the American Society of
Echocardiography (ASE).
Tilt Test
Subjects were placed on a tilt table and a Dinamap blood pressure cuff was
placed on the upper arm. A Finapres (Ohmeda Medical, Netherlands) finger
blood pressure cuff was placed on a finger of the opposite hand for continuous
blood pressure measurement. Continuous measures of heart rate, ECG, arterial
pressure and aortic blood flow [systolic velocity integral obtained by Doppler
ultrasound (2 MHz probe) of the proximal ascending aorta] were recorded for five
minutes while supine (pre-bed rest) or at 6° head-down tilt (BR44-BR60), and
during tilt. This technique has been validated by previous studies (19,23). Beat
to beat stroke volume (systolic velocity integral X cross-sectional area)
determined by two-dimensional ultrasound (2–4 MHz phased array probe) at
cusp insertion, cardiac output (stroke volume X heart rate) and total peripheral
resistance (mean arterial pressure/cardiac output) were all calculated off-line.
The subjects were then tilted upright to 80º for 30 minutes or until symptoms of
presyncope intervened.
Data and Statistical Analysis
All vascular measurements and plasma volumes were taken as close as possible
to BR-5 (baseline) and at days BR7, BR21, BR35, BR49, BR60, BR90 and at
BR+3 post-bed rest. Statistical analysis was only performed for the first 60 days
11

of the study due to the low number of subjects that completed the entire 90 day
protocol.
Data are presented as mean ± standard error unless otherwise noted. Statistics
were performed on a desktop computer using SigmaStat® commercial software
v. 3.1 (Richmond, CA). All data were tested for normality (Kolmogorov-Smirnov
test) and equal variance (Levene Median test). Plasma volume, cardiac
parameters and vital statistics were analyzed using a 1-way Repeated Measures
ANOVA with a Bonferroni corrected pairwise comparison. Intimal-medial
thickness was compared with a 2-way ANOVA with a Bonferroni correction for
pairwise comparisons. Flow-mediated dilation and nitroglycerin data failed the
normality test and were compared using Friedman’s Repeated Measures
ANOVA on ranks. Pairwise comparisons were made using Tukey’s test. Tilt
data were analyzed with a Kaplan-Meier survival analysis comparing pre-bed rest
data with data from BR44-BR60. Significance for all tests was accepted at P ≤
0.05.
RESULTS
Vital statistics and baseline hemodynamic measurements are shown in Table I.
No differences were found during bed rest for systolic or diastolic blood pressure,
heart rate, weight or body mass index.
Plasma Volumes
12

Plasma volumes index (PVI, plasma volume / body surface area), is shown in
Figure 1 for baseline through 90 days of bed rest. Baseline PVI was 1.49 ±
0.126 L/m2. By day BR7, PVI fell significantly by 15%, to 1.26 ± 0.166 L/m2 (P <
0.001). By day BR49 of bed rest, PVI was 1.22 ± 0.095 L/m2 (P < 0.001), a total
decrease of 18%. There were no differences between days BR7, BR21, BR35 or
BR49 of bed rest (P = NS).
Arterial Function
Flow-Mediated Dilation
Flow-mediated arterial dilations (Figure 2) are expressed, on the y-axis, as the
difference between the percent dilation on the bed rest day minus the percent
dilation during the pre-bed rest baseline (delta). The responses of the brachial
artery did not change (P = NS); however, dilation was significantly increased in
the anterior tibial artery by BR49 (day effect, P = 0.001).
Direct Arterial Dilation
There were no differences between bed rest days for dilations induced by the
nitric oxide (NO) donor nitroglycerin (Figure 3, P = NS in the brachial or the
anterior tibial artery). However, there was a significant difference in the dilator
response between the brachial artery and anterior tibial artery (treatment effect,
P < 0.001).
Intimal-Medial Thickness
13

The thickness of the arterial wall, shown in Figure 4, decreased significantly
during bed rest for the anterior tibial artery (P < 0.001), but not in the brachial
artery, when compared to the baseline value. This effect was seen at days
BR21, BR35 and BR49. There was also a significant difference between the
brachial and anterior tibial artery (treatment effect, P = 0.001).
Cardiac Function
Measures of cardiac function are shown in Table II. Significant decreases during
bed rest were seen in left ventricular systolic diameter (BR7, P = 0.035; BR49, P
= 0.005), left ventricular diastolic diameter (P = 0.015 at BR21), IVRT (P < 0.025
for days BR7, BR21, BR31 and BR49) and ejection time (P < 0.03 on days BR21,
BR31 and BR49). Myocardial performance index increased, which indicates a
decrease in performance, and became statistically significant by day BR7 (P <
0.033) and was also significantly higher at days BR31 and BR49 (P < 0.005).
Tilt Test
The ability of test subjects to tolerate 80° upright tilt was analyzed with a Kaplan-
Meier survival analysis (Figure 5). There was a trend (P = 0.1) for survival to be
lower following 60 days of bed rest when compared to pre-bed rest results.
DISCUSSION
Resources on the remaining Space Shuttle flights and the International Space
Station are extremely limited. It is clear that ground based analogs to spaceflight
14
will be critical to expand our understanding of the causes of spaceflight induced
decrements in cardiovascular function. Head-down tilt bed rest has been used
as a model for spaceflight, however the lack of standardization and varying
durations of bed rest complicate interpretation. Our data show that
cardiovascular alterations during longer term, head-down tilt bed rest are similar
to those seen in spaceflight
Plasma Volume
The time course and magnitude of plasma volume loss is critical to the
understanding of the mechanisms linking bed rest and spaceflight. While plasma
volume is not the separating factor in determining presyncope in crewmembers
(16,27), it is believed to be the triggering mechanism that leads to subsequent
dysfunction. Previous bed rest reports detail plasma volume losses ranging from
4% to 17%, depending on the protocol (26), which is similar to the data
presented here. Our data are also similar to those reported from spaceflight
(16,26) which show plasma volume losses ranging from 7% to 19.5%. These
new data show that the entire plasma volume loss occurs within the first seven
days (our earliest time point), and is maintained in a steady state throughout the
49 days of bed rest (Figure 1). The fluid balance data shown in the overview
section of this issue (17) shows an early, marked diuresis which confirms the
plasma volume data. These results are consistent with spaceflight data as well.
It has been shown that plasma volume is reduced by 16% by day 2 of spaceflight
and 11% at day 7-8 of spaceflight (12). In these bed rest subjects, there was a
trend for decreased orthostatic tolerance and three of these ten (30%) were
15

unable to complete ten minutes of tilt (Figure 5). This is nearly identical to the
percentage of crewmembers unable to complete ten minutes of tilt following short
duration spaceflight (27). Taken together, these data show that bed rest is a
good model for spaceflight-induced plasma volume losses in both magnitude and
time course.
Arterial Function
This study used a new approach to study arteries by measuring both structure
and function. In addition, we compared and contrasted responses from an artery
in the arm (brachial) and a similar sized artery in the leg (anterior tibial) during
bed rest. This approach has added important new information. In the brachial
artery, none of the measured responses changed over the course of bed rest.
Conversely, in the anterior tibial artery there were two important changes. First,
the intimal-medial thickness was profoundly reduced. This confirms findings in
animal studies and suggests that the vascular smooth muscle itself remodels in
response to disuse during bed rest. Prior work from this laboratory suggests that
the fluid shifts and relative hypovolemia, precipitated by both bed rest and
spaceflight, may cause a loss of interstitial fluid volume (24), which could cause a
change in function independent of contractile dysfunction. In cardiac tissue,
dehydration causes diastolic dysfunction due to ventricular stiffening (25). In
smooth muscle it could also increase stiffness. In addition, dehydration could
reduce the diffusion distance from the endothelial layer, so that a greater
concentration of NO reaches the smooth muscle.
16

Not all vascular beds respond to simulated microgravity in a parallel fashion.
There are recent reports from several groups detailing structural remodeling of
resistance vasculature in rats after hind limb suspension (8,22,29). In this model,
the rat is suspended by the tail to achieve fluid shifts similar to those in
microgravity. As a result, the forelimbs are utilized for locomotion more than
during control, and the hind limbs are utilized less. This causes changes in the
two primary mechanical forces that act on the vasculature: transmural pressures
and shear stress. During suspension, these forces increase in the forelimbs, but
decrease in the hind limbs. Both the smooth muscle and the endothelium
respond to these changes. Vasculature in the forelimbs show hypertrophic
remodeling while that in the hind limbs show atrophic remodeling (28). Following
hind limb suspension, vasodilatory responses to acetylcholine injections (an
endothelium-dependent response) are reduced in the femoral artery and soleus
arterioles (22), both of which have been exposed to reduced blood flow and
shear stress, but increased in the carotid artery, which has been exposed to
increased blood flow and shear stress (11). The media cross-sectional area in
arteries also decreases in the hind limb (8,22), but not the forelimb, suggesting
atrophic remodeling in the hind limb (8). The hind limb vessels also have a
diminished responsiveness to vasoconstrictors (7).
The second change in anterior tibial artery function over the course of bed rest
was an increase in flow-mediated dilation. This could be related to the change in
17

wall thickness discussed above, as a thinner arterial wall may allow a greater
concentration of NO to reach the smooth muscle cells. The third response,
dilation in response to sublingual nitroglycerin, was unchanged. At first glance,
these findings may seem incongruent; however, they can be reasonably
explained. Flow-mediated dilation and sublingual nitroglycerin provide the
vascular smooth muscle cells with the dilator nitric oxide by two very different
mechanisms. The first provides NO indirectly but locally via the endothelium.
The second provides NO directly but systemically. Our results show that a defect
in the signal transduction cascades in the smooth muscle is unlikely, as there is
no systemic change in endothelium-independent NO dilation.
In animal studies, arterial function is usually tested with local intra-arterial
injections of vasoactive substances or ex-vivo preparations. Unfortunately, our
institutional constraints do not allow intra-arterial injections in bed rest subjects.
Thus, we measured arterial function only from the standpoint of changes in the
dilatory function of the arteries. Rat data suggests arterial smooth muscle in the
lower body would be less able to constrict following head-down tilt (29). We are
currently assessing arterial constrictor function in a hypovolemia model which
has produced changes in left ventricular (LV) mass similar to spaceflight.
Cardiac Function
This is the most complete echocardiographic assessment of resting cardiac
structure and function during long duration bed rest of which we are aware. We
18

found several measures that indicated a decrement in cardiac structure and in
both systolic and diastolic function.
Left ventricular mass did not change during this study. Conversely, LV mass has
been reported to be decreased after spaceflight by both MRI (21) and ultrasound
techniques (24). We have previously shown, through mathematical modeling,
that the post-spaceflight decrease in LV mass is most likely due to interstitial
dehydration of the myocardium secondary to spaceflight-induced hypovolemia
(24). Unfortunately, LV mass has never been measured during spaceflight so it
is not known if the same effect would occur in the absence of gravity. In the
current study, LV mass was measured during head-down tilt, but not measured
after the subjects resumed ambulatory activity. This may explain the absence of
change in LV mass. A suggestion for future bed rest campaigns is to add a
measurement early during post-bed rest reconditioning.
Despite the lack of change in LV mass, there were several changes in cardiac
function. It is not clear which, if any of these, occurred in response to the
decrease in preload caused by the hypovolemia. However, the degree of change
suggests true changes in function. In Table II we show that some, but clearly not
all measures of cardiac performance are changed following bed rest. There is no
consensus as to which measures best represent clinically relevant dysfunction in
bed rested subjects; however, some interesting trends can be gleaned from
these data. Isovolumic relaxation time increased significantly during bed rest,
19

indicating decreased diastolic function. This is similar to results obtained
following spaceflight (24). Myocardial performance index, a global measure of
function which accounts for both systolic and diastolic parameters, showed a
decrease in performance, suggesting an overall decrease in cardiac function. It
is not unusual that echocardiographic measurements of cardiac function seem to
contradict each other (4). Each measurement corresponds to parts of the heart
which are subject to different degrees of influence by aortic, atrial and ventricular
pressures and volumes. The heterogeneous nature of these results does not
invalidate their usefulness, rather they illustrate that the effects of bed rest on
cardiac function are complex and multifactorial. We have previously reported
changes in cardiac function following long duration spaceflight that also show a
heterogeneous pattern (15); however, that study lacked some of the more
mechanistic measurements that we now present. From the data in this study, it
appears as though bed rest and long duration spaceflight both alter cardiac
function. It is not clear if these changes are the result of decreases in fluid
volume and preload, or if they represent a true change in cardiac muscle
function. Future spaceflight studies should include more detailed
echocardiograms to allow for a more direct comparison.
One primary concern is that most measures of cardiac function are somewhat
preload dependent. It is well known that preload changes during bed rest, similar
to spaceflight, due to the pronounced fluid redistribution-induced decrease in
plasma volume. This could explain the increase in MPI seen at BR7 and BR21
20

(Table II). However, it does not explain why MPI further increases on BR31 and
BR49 because plasma volume has stabilized. It could be that plasma volume
accounts for the initial response and another mechanism drives the changes
seen following 35 days of bed rest. The second mechanism could include
cardiac deconditioning due to the decreased aerobic activity required during bed
rest. This could lead to a decrease in contractility or possibly a remodeling of the
myocardium (as supported by decreases in LV diameters, but not LV mass).
While we were unable to perform statistical analysis on the time points beyond
BR49, there are obvious trends that suggest that the cardiac changes persist to
90 days. Further examination of later time points will provide more insight into
the ramifications of long term bed rest, and potentially longer term spaceflight, on
the cardiovascular system.
Limitations
A major limitation of this study is the subject number at the varying time points.
This is largely due to the forced evacuation of subjects for Hurricane Rita.
Therefore, these subjects only completed 44-53 days of the designed 90 day bed
rest protocol, and only a relatively small number of subjects completed 90 days
of bed rest. We have chosen to limit our statistical analysis in this report to the
first 60 days of bed rest (although we show all data in the figures) in order to
utilize the data points shared by the most subjects..
ACKNOWLEDGEMENTS
21

Sponsored by the NASA Flight Analogs Project; conducted at the NIH-funded
(M01 RR 0073) GCRC at the University of Texas Medical Branch, Galveston, TX
and NASA grant NAS9-97005 to JVM.
22

REFERENCES
(1) Aubert AE, Beckers F, Verheyden B. Cardiovascular function and basics of physiology in microgravity. Acta Cardiol 2005; 60(2):129-151.
(2) Buckey JC, Jr., Lane LD, Levine BD, Watenpaugh DE, Wright SJ, Moore WE et al. Orthostatic intolerance after spaceflight. J Appl Physiol 1996; 81(1):7-18.
(3) Charles JB, Lathers CM. Cardiovascular adaptation to spaceflight. J Clin Pharmacol 1991; 31(10):1010-1023.
(4) Choong CY. Left ventricle V: Diastolic function-its principles and evaluation. In: Weyman A, editor. Principles and Practice of Echocardiography. Philidelphia: Lea & Febiger, 1994: 575-624.
(5) Convertino VA. Cardiovascular consequences of bed rest: effect on maximal oxygen uptake. Med Sci Sports Exerc 1997; 29(2):191-196.
(6) D'Aunno DS, Dougherty AH, deBlock HF, Meck JV. Effect of short- and long-duration spaceflight on QTc intervals in healthy astronauts. Am J Cardiol 2003; 91(4):494-497.
(7) Delp MD. Myogenic and vasoconstrictor responsiveness of skeletal muscle arterioles is diminished by hindlimb unloading. J Appl Physiol 1999; 86(4):1178-1184.
(8) Delp MD, Colleran PN, Wilkerson MK, McCurdy MR, Muller-Delp J. Structural and functional remodeling of skeletal muscle microvasculature is induced by simulated microgravity. Am J Physiol Heart Circ Physiol 2000; 278(6):H1866-H1873.
(9) Fritsch-Yelle JM, Leuenberger UA, D'Aunno DS, Rossum AC, Brown TE, Wood ML et al. An episode of ventricular tachycardia during long-duration spaceflight. Am J Cardiol 1998; 81:1391-1392.
(10) Fritsch-Yelle JM, Whitson PA, Bondar RL, Brown TE. Subnormal norepinephrine release relates to presyncope in astronauts after spaceflight. J Appl Physiol 1996; 81(5):2134-2141.
(11) Jasperse JL, Woodman CR, Price EM, Hasser EM, Laughlin MH. Hindlimb unweighting decreases ecNOS gene expression and endothelium- dependent dilation in rat soleus feed arteries. J Appl Physiol 1999; 87(4):1476-1482.
(12) Leach CS, Alfrey CP, Suki WN, Leonard JI, Rambaut PC, Inners LD et al. Regulation of body fluid compartments during short-term spaceflight. J Appl Physiol 1996; 81(1):105-116.
23

(13) Levine BD, Lane LD, Watenpaugh DE, Gaffney FA, Buckey JC, Blomqvist CG. Maximal exercise performance after adaptation to microgravity. J Appl Physiol 1996; 81(2):686-694.
(14) Maas AHJ, Hamelink ML, de Leeuw RJ. An evaluation of the spectrophotometric determination of Hb02, HbC0, and HB in blood with the co-oximeter IL 182. Clin Chem Acta 1970; 29:303-309.
(15) Martin DS, South DA, Wood ML, Bungo MW, Meck JV. Comparison of echocardiographic changes after short- and long-duration spaceflight. Aviat Space Environ Med 2002; 73(6):532-536.
(16) Meck JV, Waters WW, Ziegler MG, deBlock HF, Mills PJ, Robertson D et al. Mechanisms of postspaceflight orthostatic hypotension: low alpha1-adrenergic receptor responses before flight and central autonomic dysregulation postflight. Am J Physiol Heart Circ Physiol 2004; 286(4):H1486-H1495.
(17) Meck JDSWL. Multisystem Responses to Long-Duration Bed Rest: Overview. Aviat Space Environ Med. In press.
(18) Morey-Holton ER, Globus RK. Hindlimb unloading rodent model: technical aspects. J Appl Physiol 2002; 92(4):1367-1377.
(19) Nishimura RA, Callahan MJ, Schaff HV, Ilstrup DM, Miller FA, Tajik AJ. Noninvasive measurement of cardiac output by continuous-wave Doppler echocardiography: initial experience and review of the literature. Mayo Clin Proc 1984; 59(7):484-489.
(20) Pavy-Le Traon A, Heer M, Narici MV, Rittweger J, Vernikos J. From space to Earth: advances in human physiology from 20 years of bed rest studies (1986-2006). Eur J Appl Physiol 2007; 101(2):143-194.
(21) Perhonen MA, Franco F, Lane LD, Buckey JC, Blomqvist CG, Zerwekh JE et al. Cardiac atrophy after bed rest and spaceflight. J Appl Physiol 2001; 91(2):645-653.
(22) Schrage WG, Woodman CR, Laughlin MH. Hindlimb unweighting alters endothelium-dependent vasodilation and ecNOS expression in soleus arterioles. J Appl Physiol 2000; 89(4):1483-1490.
(23) Shaw JG, Johnson EC, Voyles WF, Greene ER. Noninvasive Doppler determination of cardiac output during submaximal and peak exercise. J Appl Physiol 1985; 59(3):722-731.
(24) Summers RL, Martin DS, Meck JV, Coleman TG. Mechanism of spaceflight-induced changes in left ventricular mass. Am J Cardiol 2005; 95(9):1128-1130.
24

(25) Summers RL, Platts SH, Martin DS, Coleman TG. Systems analysis of the mechanisms of cardiac diastolic function changes after microgravity exposure. Acta Astronautica 2007; In submission.
(26) Waters WW, Platts SH, Mitchell BM, Whitson PA, Meck JV. Plasma volume restoration with salt tablets and water after bed rest prevents orthostatic hypotension and changes in supine hemodynamic and endocrine variables. Am J Physiol Heart Circ Physiol 2005; 288(2):H839-H847.
(27) Waters WW, Ziegler MG, Meck JV. Post-spaceflight orthostatic hypotension occurs mostly in women and is predicted by low vascular resistance. J Appl Physiol 2002; 92:586-594.
(28) Zhang J, Steiner JP. Nitric oxide synthase, immunophilins and poly (ADP-ribose) synthetase: novel targets for the development of neuroprotective drugs. Neurol Res 1995; 17(4):285-288.
(29) Zhang LF. Vascular adaptation to microgravity: what have we learned? J Appl Physiol 2001; 91(6):2415-2430.
25

Table I. Vital Statistics and Baseline Memodynamics.
pre-Bed rest BR 7 BR 21 BR 35 BR 49 BR 60 BR 75 BR 90 BR+3
1.7 ± 0.1
Height, m
72.6 ± 16.6
72.0 ± 17.0
72.9 ± 14.3
71.4 ± 16.0
Weight, kg 69.8 ± 16.1 65.8 ± 14.2 71.4 ± 24.2 62.9 ± 16.8 65.8 ± 15.2
25.4 ± 4.2
24.6 ± 4.4
25.4 ± 3.7
24.7 ± 4.3
Body Mass Index, kg/m2
24.5 ± 4.1 23.6 ± 4.2 26.5 ± 5.9 23.4 ± 4.6 23.7 ± 4.5
118.8 ± 13.2
116.1 ± 8.1
118.7 ± 16.2
115.9 ± 10.9
Systolic Pressure, mmHg
118.2 ± 13.4 116.7 ± 13.9 105.2 ± 8.2 112.7 ± 15.3 109.8 ± 12.0
67.8 ± 8.4
68.3 ± 7.2
69.4 ± 8.8
70.9 ± 6.7
Diastolic Pressure, mmHg
70.5 ± 6.9 69.1 ± 8.3 69.3 ± 7.1 73.5 ± 12.8 68.2 ± 8.8
65.3 ± 8.9
63.0 ± 10.3
65.5 ± 7.7
65.7 ± 11.0
Heart Rate, 71.5 ± 9.5 69.7 ± 10.2 69.5 ± 13.1 67.8 ± 11.9 69.3 ± 13.6
beats/min
26
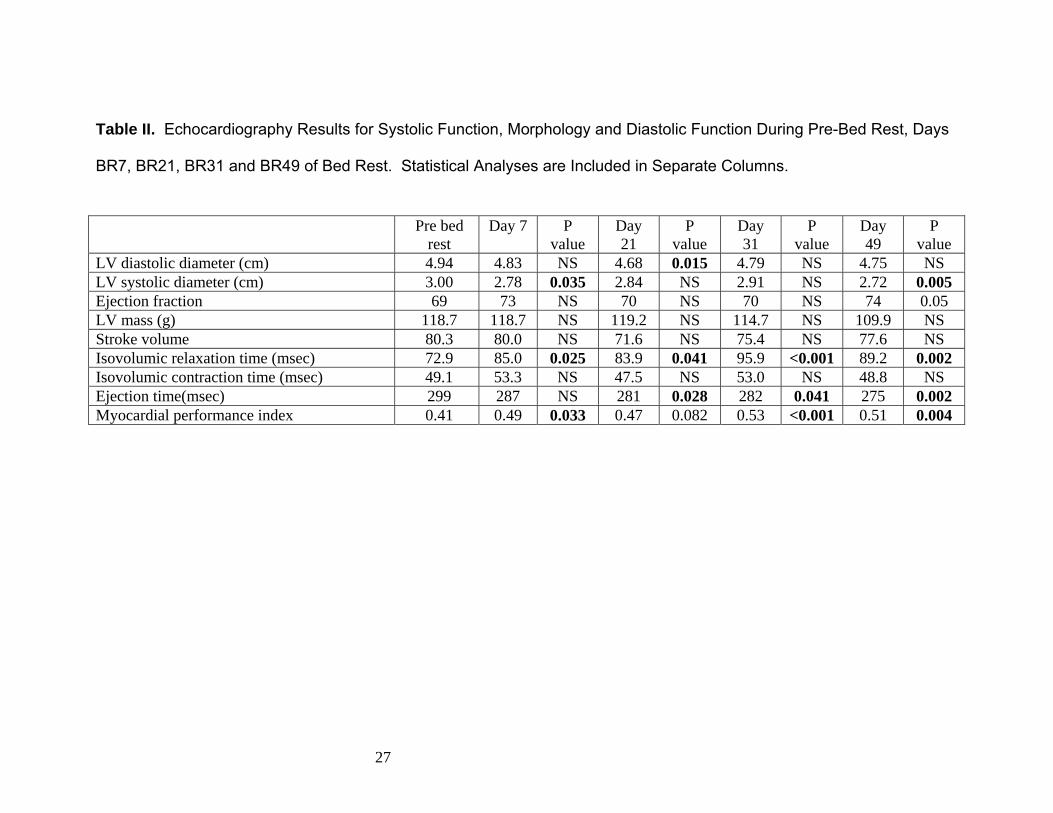
Table II. Echocardiography Results for Systolic Function, Morphology and Diastolic Function During Pre-Bed Rest, Days
BR7, BR21, BR31 and BR49 of Bed Rest. Statistical Analyses are Included in Separate Columns.
Pre bed rest
Day 7 P value
Day 21
P value
Day 31
P value
Day 49
P value
LV diastolic diameter (cm) 4.94 4.83 NS 4.68 0.015 4.79 NS 4.75 NS LV systolic diameter (cm) 3.00 2.78 0.035 2.84 NS 2.91 NS 2.72 0.005 Ejection fraction 69 73 NS 70 NS 70 NS 74 0.05 LV mass (g) 118.7 118.7 NS 119.2 NS 114.7 NS 109.9 NS Stroke volume 80.3 80.0 NS 71.6 NS 75.4 NS 77.6 NS Isovolumic relaxation time (msec) 72.9 85.0 0.025 83.9 0.041 95.9 <0.001 89.2 0.002 Isovolumic contraction time (msec) 49.1 53.3 NS 47.5 NS 53.0 NS 48.8 NS Ejection time(msec) 299 287 NS 281 0.028 282 0.041 275 0.002 Myocardial performance index 0.41 0.49 0.033 0.47 0.082 0.53 <0.001 0.51 0.004
27

CAPTIONS FOR FIGURES
Figure 1. Plasma volume changes during bed rest. Plasma volume index (PVI)
is the plasma volume corrected by body surface area. Significant differences
from pre-bed rest were seen at all timepoints. * indicates P ≤ 0.05 within group
for bed rest day.
Figure 2. Reactive hyperemic responses during bed rest. These graphs show
the difference between pre- and post-occlusion (delta) for each timepoint. There
were no statistical differences in the brachial artery (left panel) or in the anterior
tibial artery (right panel).
Figure 3. Direct arterial dilation with nitroglycerin. These graphs show the
difference between pre- and post-occlusion (delta) for each timepoint. There
were no statistical differences in the brachial artery (left panel) or in the anterior
tibial artery (right panel). There was a difference found between the brachial and
anterior tibial artery. § indicates P ≤ 0.05 between arteries.
Figure 4. Intimal medial thickness. The intimal medial thickness (cm) decreased
during bed rest in the anterior tibial artery only (right panel). * indicates P ≤ 0.05
within group for bed rest day compared to pre-bed rest.
Figure 5. Survival analysis of tilt test standing times. The solid line represents
the probability of standing at each time point of the tilt test before bed rest. The
dashed line represents the probability of standing following 44-60 days of bed
rest. There is a trend for the survival to be lower at day 44-60 than during pre-
bed rest (P = 0.1).
28

Bedrest Day
0 20 40 60 80 100
Pla
sma
Vol
ume
Inde
x (L
/BS
A)
0.8
1.0
1.2
1.4
1.6
1.8
(n=13)
(n=3)(n=12)
(n=12)(n=7)
(n=9)(n=5)
(n=6)
** * *
*
Figure 1.

Figure 2.
Brachial Artery
Bed Rest Day
Pre BR7 BR21 BR35 BR49 BR60 BR75 BR90 BR+3
Del
ta %
cha
nge
-20
-10
0
10
20
Anterior Tibial Artery
Bed Rest Day
Pre BR7 BR21 BR35 BR49 BR60 BR75 BR90 BR+3
Del
ta %
cha
nge
-20
-10
0
10
20
(13) (13) (13) (13)(9)
(6)(6) (9)
(13)
(13)
(13) (13)
(13)(8)
(5)
(6)(9)
(12)
*

Figure 3.
Brachial Artery
Bed Rest Day
Pre BR7 BR21 BR35 BR49 BR60 BR75 BR90 BR+3
Del
ta %
cha
nge
-20
-10
0
10
20
30
Anterior Tibial Artery
Bed Rest Day
Pre BR7 BR21 BR35 BR49 BR60 BR75 BR90 BR+3
Del
ta %
cha
nge
-20
-10
0
10
20
30
(13)(13)
(13)(11)
(11)
(9)
(6)
(6)
(9)(13) (13) (13)
(11) (6)
(6) (9)
(12)(11)

Brachial Artery
Bed Rest Day
Pre BR7 BR21 BR35 BR49 BR60 BR75 BR90 BR+3
Intim
al M
edia
l Thi
ckne
ss (c
m)
0.015
0.020
0.025
0.030
0.035
Anterior Tibial Artery
Bed Rest Day
Pre BR7 BR21 BR35 BR49 BR60 BR75 BR90 BR+3In
timal
Med
ial T
hick
ness
(cm
)0.015
0.020
0.025
0.030
0.035
** *
(13)(13)
(13)(13)
(12)(9)
(6)(9)(6)
(13)
(13) (13)
(13)(12) (9)
(6)
(9)(6)
Figure 4.

Figure 5.
Time0 5 10 15 20 25 30
Surv
ival
Pro
babi
lity
0.0
0.2
0.4
0.6
0.8
1.0
Pre-bed restBed rest day 60
n = 9, p = 0.1