carbon storage in mangrove and peatland ecosystems
TRANSCRIPT

W O R K I N G P A P E R
Carbon storage in mangrove and peatland ecosystemsA preliminary account from plots in Indonesia
Daniel Murdiyarso Daniel Donato J. Boone Kauffman Sofyan Kurnianto Melanie Stidham Markku Kanninen


WORKING PAPER 48
Carbon storage in mangrove and peatland ecosystemsA preliminary account from plots in Indonesia
Daniel Murdiyarso
Daniel Donato
J. Boone Kauffman
Sofyan Kurnianto
Melanie Stidham
Markku Kanninen

Working Paper 48
© 2009, Center for International Forestry Research. All rights reserved.
Printed in IndonesiaPhotos by Daniel Murdiyarso
CIFORJl. CIFOR, Situ GedeBogor Barat 16115Indonesia
T +62 (251) 8622-622F +62 (251) 8622-100E [email protected]
www.cifor.cgiar.org
Any views expressed in this publication are those of the authors. They do not necessarily represent theviews of CIFOR, the authors’ institutions or the financial sponsors of this publication.
Center for International Forestry ResearchCIFOR advances human wellbeing, environmental conservation and equity by conducting research to inform policies and practices that affect forests in developing countries. CIFOR is one of 15 centres within the Consultative Group on International Agricultural Research (CGIAR). CIFOR’s headquarters are in Bogor, Indonesia. It also has offices in Asia, Africa and South America.
Table of contents
Acknowledgements 5
Summary 6
1. Introduction 7Background 7Objectives 8
2. Study sites 9Bunaken National Park 9Tanjung Puting National Park 11Segara Anakan ecosystem 12
3. Methods 14Field sampling 14Sample analysis and allometric computations 16
4. Above and belowground biomass and C-stocks 18Mangrove ecosystems 18Riverine peat swamps: Tanjung Puting National Park 19
5. Diversity, structure and composition of riverine peat swamp forests in Tanjung Puting National Park 25
6. Implications for climate change mitigation and adaptation 28Mangrove ecosystems 28Peatland ecosystems 29
7. Conclusions 31
The way forward 32
References 33
Appendix 1. Summary of data collected by tree species 35

List of figures
1 Study sites in three provinces 9
2 Bunaken National Park, North Sulawesi 10
3 Tanjung Puting National Park, Central Kalimantan 12
4 Segara Anakan ecosystem, on the southern coast of Central Java 13
5 Field sampling design in a transect to estimate above and belowground carbon biomass 14
6 The distribution of aboveground carbon of living trees (mean ± SE) by 5 cm diameter classes in the three study areas
21
7 C-pools and total C-stock in sampled mangroves, by distance from the ocean 21
8 Depth (mean ± SE) of organic soil layers in mangroves by distance from the ocean 22
9 Above and belowground carbon pools in riverine peat swamps sampled in Tanjung Puting National Park
22
11 Ecosystem C-stocks (mean, SE) in riverine peat swamp forests of Tanjung Puting National Park, by distance from the river
23
10 Variation in ecosystem carbon storage in riverine peat swamps of Tanjung Puting National Park, according to peat depth
23
12 Distribution of riverine peat swamp forest trees by 5 cm diameter classes 24
14 Importance Value Index (IVI) of surveyed trees in riverine peat swamp forest 25
13 Basal areas of trees surveyed in riverine peat swamp forest 25
15 Relationship between Importance Value Index and aboveground carbon content of trees in riverine peat swamp forest
26

In addition to the generous support of the United States Department of Agriculture Forest Service, we would like to thank the many institutions and numerous individuals who made this work possible. Contributions by staff and students of the Tropical Forests and Climate Change Adaptation project were important. The permit provided by the Ministry of Forestry, Republic of Indonesia (c/o Directorate General for Forest Protection and Nature Conservation) facilitated our entry to Indonesia’s national parks and conservation areas. The practical support from staff of the Orangutan Foundation International (OFI) and World Education (WE), represented by Mr Fajar Dewanto and Mr Genpur Sutoyo, respectively, is gratefully acknowledged. We also extend our sincere thanks to Dr Joko Pubopuspito of Sam Ratulangi University, Manado, who provided excellent assistance in terms of both logistical arrangements and technical advice. The authors are grateful to Andrew Wardell (Program Director Forests and Governance, CIFOR) for helpful comments provided on drafts and to Imogen Badgery-Parker for her careful editing.
Acknowledgements

Coastal mangrove forests provide a broad array of ecosystem services including fisheries production, sediment regulation, wood production and protection from storms and tsunamis. Similarly, peat swamp forests harbour a diverse range of flora and fauna, regulate water regimes and store large amounts of carbon deposited in organic materials below the ground. In Southeast Asia, the conversion rates of mangrove to other land uses, such as shrimp farms and settlements, are among the highest for any forest type. Furthermore, the conversion of peat swamp forests to oil palm and pulp wood plantations and the associated fires have been the main sources of greenhouse gas (GHG) emissions in the region during the past decade.
With deforestation accounting for around 17% of global anthropogenic GHG emissions, the upcoming global mechanism known as Reducing Emissions from Deforestation and forest Degradation (REDD+) provides an important climate change mitigation option. This scheme offers economic incentives for conserving forests and associated carbon (C) stores in developing countries. Mangrove and peat swamp ecosystems are well suited to such strategies. However, although their high rates of C assimilation and export (fluxes) are known, their total C storage—the amount that may be emitted upon conversion—has not been well quantified.
We measured total ecosystem C storage (above and below ground) in mangrove ecosystems in North Sulawesi, Central Kalimantan and Central Java, Indonesia. We assessed variations in mangrove C-pools along transects running inland from the ocean edge, as well as their vulnerability to sea-level rise and land use. In addition, in Tanjung Puting National Park, Central Kalimantan, we sampled both the total aboveground biomass and the belowground peat horizons to ascertain total ecosystem C-pools.
Summary
Our measurements show that total carbon storage in mangrove ecosystems is exceptionally high compared with most forest types, with a mean of 968 Mg C ha–1 and range of 863–1073 Mg C ha–1. These carbon stocks result from a combination of large-stature forest (trees up to ~2 m in diameter) and organic-rich peat soils to a depth of 5 m or more. Aboveground C-stocks vary widely depending on stand composition and history, but belowground pools comprise a large portion of ecosystem C storage in most sites. Although mangrove composition is often stratified with distance from the ocean edge, C storage does not vary consistently along this gradient.
Ecosystem C-pools at Tanjung Puting exceed 1000 Mg ha–1 in many of the sampled locations. All sampled stands had a depth to mineral soil of less than 1 m, with a mean peat depth of 45.5 ± 6.8 cm. Mean total C-stock was 894.3 Mg C ha–1, with a range of 558–1213 Mg C ha–1. It should be noted, when considering these estimates of ecosystem pools, that peat depths of tropical peat swamp forests may be as much as 20 m (with an average depth of 3–5 m).
Projected rates of sea-level rise (~1 cm yr–1 over the next century) are ~5–10 times higher than typical mangrove sediment accrual rates (1–2 mm yr–1), suggesting high susceptibility and a potential positive feedback via loss of C-stocks. Thus, the combination of very high C-stocks, susceptibility to land use activities and numerous ecosystem services makes tropical mangroves ideal candidates for REDD+, particularly if climate change mechanisms can be applied to promoting synergies between adaptation to climate change (e.g. local migration) and mitigation.
However, additional studies to better quantify ecosystem C-pools and the potential impact of land cover change and fire are greatly needed in order to make sound policy decisions related to carbon financing through the REDD+ mechanism.

1. Introduction
1.1 BackgroundTropical mangroves and peat swamp forests provide numerous ecosystem services, including nutrient cycling, sediment trapping, protection from cyclones and tsunamis, habitat for numerous organisms (many economically important) and wood for lumber and fuel (Ellison 2008). Among the most important of these functions—but poorly quantified—is ecosystem carbon (C) storage. The estimated carbon stored in these ecosystems is so large that it makes mangrove and peatland important for climate change mitigation. However, these econsystem are especially vulnerable to climate and land use change.
The region comprising Southeast Asia and the western Pacific Islands (the Indo-Pacific) is the global epicentre of mangroves and tropical peat swamp forests (FAO 2007; Hirano et al. 2007). Approximately 40% of the world’s mangroves, or 6 million ha, occur in this region alone. Standing biomass per area reaches higher values than in any other locale (Komiyama et al. 2008). In addition, Southeast Asia has 25 million ha of peatlands, which is 60% of all tropical peatlands. Because mangroves and peat swamp forests have high root–shoot ratios and occur on organic-rich soils several metres deep (Fujimoto et al. 1999; Page et al. 2002; Komiyama et al. 2008), total C storage in these ecosystems may be among the largest forest C-pools on Earth. However, data quantifying these globally significant carbon stores are lacking.
Mangrove forests also provide important coastal protection. Following the unprecedented Indian Ocean tsunami on 26 December 2004, mangrove forests were considered to have been the most important coastal tree vegetation along the coast of Tamil Nadu, India; they had helped lessen damage caused by waves (Danielsen et al. 2005). In a more systematic study of mangroves, Alongi (2008) found that in some circumstances mangroves can offer limited protection from tsunamis, as the
magnitude of energy absorption strongly depends on tree density, stem and root diameter, shore slope, bathymetry, spectral characteristics of incident waves and tidal stage upon entering the forest. Alongi also explores the role of mangroves in responding to various climate-related hazards such as increased precipitation, increased temperature and rise of sea level.
Southeast Asia’s tropical forests are experiencing the highest rate of deforestation worldwide (Langner and Siegert 2009; Gibbs et al. 2010). Between 1980 and 2005, ~25% of the region’s mangroves were logged and converted to other land uses such as commercial aquaculture operations (FAO 2007). Lowland peat forests are also being logged and converted, experiencing still sharper declines (e.g. >56% loss in protected areas from 1985 to 2001; Curran et al. 2004), with some projections that these forests could be entirely consumed within a decade (Jepson et al. 2001). Because large quantities of carbon are released to the atmosphere when these forests are cleared and converted (Murdiyarso and Adiningsih 2007), this deforestation has significant implications for global climate change. For example, owing largely to forest conversion, Indonesia has become the world’s third largest emitter of CO2 behind industrialised USA and China (IPCC 2007). Although some regulations are in place to limit deforestation in Southeast Asia—succeeding in slowing the rate of decline slightly in recent years—local socio-economic factors continue to lead to rapid forest losses (Kanninen et al. 2007).
With deforestation accounting for almost 17% of global carbon emissions, conserving existing forest has been suggested as one of the least expensive options for mitigating human-induced climate change. Thus, Reduced Emissions from Deforestation and forest Degradation (REDD+) in developing countries has emerged as a likely component of the next international policy effort addressing climate change, to be implemented when the Kyoto
8 Daniel Murdiyarso, Daniel Donato, J. Boone Kauffman, Sofyan Kurnianto, Melanie Stidham and Markku Kanninen
Protocol expires in 2012 (Kanninen et al. 2007). This programme would offer economic incentives for conserving forests and associated C-stocks, intended to offset the short-term economic factors that promote deforestation.
However, the viability of such a programme depends heavily on having sound information on carbon storage in various forests, and how much C may be released when these forests are converted. According to Kanninen et al. (2007; see also Angelsen 2008; Angelsen et al. 2009), the design and implementation of REDD+ strategies must be informed by high-quality, independent research if they are to succeed. Research is vital to ensure that the inclusion of forests in a future climate protection regime is efficient and effective and reflects the interests of forest-dependent people in developing countries.
Because of their large carbon stores, Indonesian mangroves and peat swamp forests would make ideal candidates for REDD+ strategies. However, information on whole-ecosystem carbon storage is lacking for these forests. At the same time, a competing land use has already reached the policy sphere: early in 2009, the Government of Indonesia through the Ministry of Agriculture enacted a regulation allowing the development of oil palm plantations on peatlands that are less than 3 m deep.
This kind of policy-driven land use decision raises two fundamental questions:
• How should scientific information on carbon dynamics in peatlands be used to inform policy?
• How can sound environmental motives be balanced with sustainable development objectives, assuming that economic reasons for a decision are based on properly assessed opportunity costs?
1.2. ObjectivesThe primary objective of this study was to fill a critical information gap by working with local forestry professionals to quantify/monitor C-pools in mangroves and peat swamp forests in Indonesia. This objective may be broadened to attract the attention of the global community while promoting locally wise use of these ecosystems by:
• quantifying ecosystem C-pools of tropical mangrove and peat swamp forests in Indonesia that are highly vulnerable to climate change and land cover change;
• providing information on carbon dynamics to international processes such as the Intergovernmental Panel on Climate Change (IPCC) and the UN Framework Convention on Climate Change (UNFCCC) on these relatively understudied forest types;
• assessing options for managing C-pools of tropical mangrove and peat swamp forests in Indonesia; and
• providing information necessary in the development of REDD+ strategies for mitigating climate change and adaptation strategies for future climate regimes.
To achieve these objectives, a measurement campaign was carried out. This study was intended to establish a framework for more extensive research sites to capture a broader (regional) context of the issues and challenges.

The studies were carried out in three contrasting mangrove ecosystems, representing marine or oceanic mangroves in North Sulawesi (Bunaken National Park), river delta mangroves in Central Kalimantan (Tanjung Puting National Park) and lagoon-associated mangroves in Central Java (Segara Anakan). In addition, a riverine peat swamp ecosystem in Tanjung Puting National Park was studied (see Figure 1).
2.1 Bunaken National Park1
Bunaken National Park is located in the province of North Sulawesi, covering 79 056 ha of land and marine areas. The park consists of two sections: (1) the northern section, which encompasses five islands (Bunaken, Silaken, Manado Tua, Mantehage and Nain) and the coastal area called the Molas-Wori Coast; and (2) the southern section, which spans the Arakan-Wawontulap Coast (see Figure 2).
Climate, geology and soilsThe area experiences monsoonal wet and dry seasons (November–April and May–October, respectively). The mean annual rainfall ranges between 2500 mm and 3500 mm. The average air temperature is 27 °C with minimum and maximum temperatures of 19 °C and 34 °C, respectively.
The geological formations of the southern section of the park, which is located on mainland Sulawesi, are dominated by Tondano tuff, characterised by very porous volcanic rock. The northern section is predominantly riverine sediments and alluvial soils, especially on Mantehage Island and the eastern part of Bunaken Island. The western part of Bunaken Island, Siladen Island and parts of Nain Island are formed from coral limestone. Manado Tua was formed at the same time as the major volcanoes on the mainland.
Figure 1. Study sites in three provinces
2. Study sites
1 Most of the description of Bunaken National Park is adapted from Mehta (1999).

10 Daniel Murdiyarso, Daniel Donato, J. Boone Kauffman, Sofyan Kurnianto, Melanie Stidham and Markku Kanninen
Representative soil types for mangroves sampled in the northern section were taken from Mantehage Island, which has a beach land system composed of mainly young alluvial soils. The island is distinguished by extensive mangrove forest flats, which are partially separated by salt water channels. The coastal area in sampled portions of the southern section of the park is dominated by an intertidal land system. There is also an extensive riverine sediment land system found in this area, which forms extensive mud-sand plains. This type of soil is the supporting factor for mangrove development in this section of the park.
The park has a unique bathymetry, which is one attraction for divers. The absence of a continental shelf in the northern part of North Sulawesi allows
the coastal area of the park to drop directly down the continental slope. The sea depth between the islands of the park ranges between 200 m and 1840 m.
FloraThe trees most commonly found on the shoreline of the park are mangroves, locally known as bakau, which can tolerate saltwater or salty soil. Other common trees are bitung (Barringtonia asiatica), a waxy-leafed tree with large, sweet-smelling white flowers; pandan (Pandanus sp.); and ketapang (Terminalia catappa), which local people grow as a shade tree. There are also several species of beach grass and low creeping vines.
Figure 2. Bunaken National Park, North Sulawesi. The park is divided into northern and southern sections.

Carbon storage in mangrove and peatland ecosystems 11
Tree sampling was carried out in the extensive mangrove forests found on Mantehage Island and in the Molas-Wori and Arakan-Wawontulap coastal areas. Mangrove species in most of the park tend to be short-stature oceanic mangroves. Although some species can grow as tall as 40 m, most reach a height of only ~10 m.
Twenty-nine species of mangrove tree are found in Bunaken National Park. The dominant species are Rhizophora sp., Avicennia sp. and Sonneratia sp. Local people use mangrove trees for their daily needs, such as for construction materials, structural support for seaweed farming, firewood, fish traps and traditional medicines. Much of the mangrove forest degradation in Mantehage is due to people cutting mangrove trees to sell as firewood in Manado.
Transects were established in six locations representative of the island and mainland mangrove formations in the northern and southern sections of the park (see Figure 2). Most of these transects sampled short-stature oceanic mangroves in a variety of different soil types and parent materials.
2.2 Tanjung Puting National ParkTanjung Puting National Park is located on the southern tip of Central Kalimantan, bordered by Java Sea to the west and south, Sekonyer River to the north and Seruyan River to the east. It is between the districts of Kota Waringin Barat (whose capital city is Pangkalan Bun) and Seruyan (whose capital city is Kuala Pembuang). The two main rivers, Kumai and Seruyan, are very important for transportation and the area’s economy (Figure 3).
The park, which covers an area of around 400 000 ha, lies on alluvial and mostly peat swamp plains, as indicated by the black tannin-rich waters in most river tributaries. The park is divided into dryland forest, peat swamp forests, heath forests, mangrove forests and sandy beaches.
In the dryland areas, which cover around 30% of the park, dipterocarp species such as Shorea spp. are commonly found. Also present are Myristica sp., Lithocarpus sp., Castanopsis sp., Koompassia sp. and Scorodocarpus sp.
Typical peat swamp habitat (40%–50%) includes species such as ramin (Gonystylus bancanus), ulin (Eusideroxylon zwageri) and jelutong (Dyera costulata). In disturbed areas, gelam (Melaleuca cajuputi), Palaquium sp. and Alstonia scholaris have been found.
Species found in the heath forests (up to 10% of the park) includes Dacrydium sp., Lithocarpus sp., Eugenia sp., Castanopsis sp., Schima sp., Hoya sp., Diospyros sp. and Vatica sp.
The mangrove forests in the river deltas are most commonly composed of Rhizophora sp., Bruguiera sp., Sonneratia sp. and Xylocarpus granatum. Further inland along the brackish river water, nipah (Nypa fruticans), pandan (Pandanus sp.) and bakung (Lilium spp.) are commonly found and well developed. On the sandy seashores of the peninsular (less than 5%), patches of Casuarina sp., Barringtonia sp., Podocarpus sp. and Scaevola sp. are found.
The park is a world icon for orangutan (Pongo pygmaeus) rehabilitation and conservation efforts and is home to the world’s single largest population of orangutan (around 6000). It is also home to 220 species of birds, 17 species of reptiles and 29 species of mammals, including long-nosed monkey (Nasalis larvatus), long-tailed macaque (Macaca fascicularis), agile gibbon (Hylobates agilis), grey gibbon (Hylobates muelleri), red leaf monkey (Presbytis rubicunda) and Malayan sun bear (Helarctos malayanus).
Oil palm expansion, initiated by the private sector and local governments in the name of economic development, is challenging local forest conservation efforts. It is understood that there has been no open dialogue between these parties and the local communities whose livelihoods depend on the forests and the services they provide, including non-timber forest products, watershed protection and other goods and services.
Local NGOs led by Orangutan Foundation International (OFI) have proposed to the Indonesian Ministry of Forestry that the area between the eastern border of the park and Seruyan River be designated as a buffer zone, and that plans to expand oil palm plantations in that area be cancelled. Should the

12 Daniel Murdiyarso, Daniel Donato, J. Boone Kauffman, Sofyan Kurnianto, Melanie Stidham and Markku Kanninen
central government approve the buffer zone, the park’s legal status would be strengthened, which would eventually generate economic benefits for the local community through ecotourism and sustain wildlife sanctuaries. Part of the proposed area has been developed as a REDD+ pilot and recently successfully completed third-party dual validation under the Voluntary Carbon Standard Guidelines (Rainforest Alliance 2009; Bureau Veritas Certification 2010). This is the world’s first new Avoided Planned Peatland Conversion Methodology, which is a significant step towards protection of peatland ecosystems in Indonesia.
The field measurements were carried out in five transects representative of mangrove forests and
another five transects representative of peat swamp ecosystems (see Figure 3). All field measurements were conducted with support from local NGOs (Orangutan Foundation Indonesia and World Education) and National Park Office field staff.
2.3 Segara Anakan ecosystemThe Segara Anakan ecosystem is the only lagoon-mangrove complex in Java. Historically, the ecosystem was highly productive, supporting economically important coastal fisheries. However, due to high rates of erosion upstream and heavy sedimentation, the lagoon has rapidly filled, with mud flats and swampy lands now dominating the lagoon and causing a decline in productivity (Figure 4).
Figure 3. Tanjung Puting National Park, Central Kalimantan. Five transects each were established in mangrove and peatland ecosystems.

Carbon storage in mangrove and peatland ecosystems 13
Mangrove destruction also is threatening the Segara Anakan fishery. Fisheries dependent on mangroves could disappear within 5 to 10 years if destruction is sustained at the high rate observed in 2000 (Dudley 2000). Mangrove management is critical for the success and survival of the Segara Anakan fishery.
In the Segara Anakan lagoon, 21 tree species and 5 understorey genera have been identified (Hinrichs et al. 2009). Average tree density is 0.80 ± 0.99 individuals/m2 with 48.71% seedlings and an average basal area of 9.86 ± 10.54 cm2/m2. Tree density
and diversity are high in the eastern part of the lagoon, located near the city of Cilacap. There, the dominant tree species are Aegiceras corniculatum, Nypa fruticans and Rhizophora apiculata, the latter two of which are characteristic of mature forests. By contrast, understorey species and the pioneer species (Avicennia alba, Aegiceras corniculatum and Sonneratia caseolaris) dominate the central lagoon where several rivers discharge. Tree communities in the eastern lagoon are more stable and represent less disturbed mangrove forest.
Figure 4. Segara Anakan ecosystem on the southern coast of Central Java. Sedimentation and mangrove degradation have caused a significant decline in lagoon fisheries. Two transects were established in one of the river deltas.

3.1 Field sampling In each sampled forest ecosystem, a transect arranged perpendicular from the river or coast shoreline was established with no a priori knowledge of forest composition or structure. Six plots were established along the transect at 25-m intervals (see Figure 5). Measurements and collection of trees, saplings, woody debris, understorey/litter and soil were conducted as described below.
Trees The diameter at breast height (dbh = stem diameter at 137 cm above the ground) of each tree was measured, in 6 circular plots with a radius of 7 m in mangroves and 10 m in peat swamps. Trees include all living woody stems with dbh ≥5 cm, and any dead woody stem (snag or stump) with dbh ≥5 cm provided its angle from true vertical is less than 45°. Data on species, dbh, live/dead and height if dead or broken were recorded for all individuals.
SaplingsWoody stems with dbh <5 cm, known as saplings, were recorded in the same way as for trees, but with a sampling radius of 2 m in each plot.
Woody debris • Woody debris is defined as follows.
– Any dead woody material (twigs, branches or stems of trees or shrubs) that has fallen and lies within 2 m of the ground. Leaning snags that form an angle of > 45° from true vertical are also included. The piece must be in or above the litter layer to be included; it is not included if its central axis is buried in soil at the point of intersection.
– Uprooted stumps and roots not encased in soil.
– Dead branches and stems still attached to standing trees or shrubs are excluded.
3. Methods
Figure 5. Field sampling design in a transect to estimate above and belowground carbon biomass
Trees >5 cm dbhmeasured in 7 m radius
(all plots)
Trees >5 cm dbhmeasured in 2 m radius
(all plots)
Wood debris transects(4 per plot, all plots)
A
1
B
R = 2 m
D
C12 m
7 m
Understory/litter sample(2 per plot, all plots)
3 soil depthmeasurements and 1
nutrient core (all plots)
2
25 m
Mar
ine
ecot
one
25 m
3 4 5 6

Carbon storage in mangrove and peatland ecosystems 15
• The planar intersect technique (see Harmon and Sexton 1996) involves counting intersections of woody pieces with a vertical sampling plane.
• A survey tape is run 12 m from the plot centre in each of 4 directions, oriented at 45° angles from the main transect line. Woody debris intersecting the transect plane is recorded to a height of 2 m above the forest floor.
• CWD (coarse woody debris; pieces ≥ 7.6 cm in diameter) is recorded for its actual piece diameter and decay status (sound or rotten) along the entire 12-meter transect. FWD (fine woody debris; pieces < 7.6 cm in diameter) is sampled along subsections of each transect starting from the distal end and working towards the plot centre. Hundred-hour fuels are sampled along 10 m of transect, 10-hour fuels along 5 m of transect and 1-hour fuels along 2 m of transect. FWD is tallied by size class as follows:
1. 0–0.6 cm (1-hour fuels)
2. 0.6–2.5 cm (10-hour fuels)
3. 2.5–7.6 cm (100-hour fuels)
To determine mean down wood densities, a one-time collection was made of ~20–25 pieces of each woody debris class. Each piece was measured for volume using the water mass displacement method and oven-dried to obtain dry mass; these values were then used to compute particle density.
Understorey and litter • Understorey is defined as all standing vegetation
matter that does not reach breast height (130 cm). This includes all aboveground biomass of shrubs, tree seedlings, herbs and non-vascular plants. It does not include branches attached to saplings or trees. Litter on the forest floor is defined as the surface detritus and recognisable organic matter that lies on top of the mineral soil, excluding fragments of wood.
• Litter sampling consists of a 0.46 × 0.46 m square (using a folding ruler), placed 2 m beyond each plot centre along the site-transect line. Qualifying material within this section was collected and placed in a collection bag for drying and weighing in the laboratory.
Idul from Orangutan Foundation International measures diameter of breast height (DBH) as one parameter for estimating carbon stock.

16 Daniel Murdiyarso, Daniel Donato, J. Boone Kauffman, Sofyan Kurnianto, Melanie Stidham and Markku Kanninen
• As most mangroves have little to no litter, contributing negligible biomass (Snedaker and Lahmann 1988), litter collection was restricted to peat swamp forests.
Soil • Mangroves and peat swamps often have an
organic-rich soil layer for the first ~0.5–5 m of soil depth, with a rather abrupt boundary to mineral soils or sands underneath (especially in oceanic stand types). Three measurements were obtained to determine total soil organic carbon: organic soil depth (to obtain soil volume per area), bulk density (to obtain soil mass per area) and % organic carbon (OC) (to convert mass per area to C per area).
• Soil depth was measured at three separate locations around each plot centre. Depth was measured using a soil auger and an aluminium probe. The probe was capable of measurements to 3 m; it was inserted vertically until the sand layer was felt, and the depth then recorded. If the probe did not encounter sand, the depth was recorded as >300 cm and calculations were based on the top 300 cm of soil only (yielding a conservative estimate of soil C storage).
• A core sample was taken at each plot with a steel open-faced peat auger with a 1-m extension handle. Five 4-cm subsamples were collected, representing depth intervals 0–15, 15–30, 30–50, 50–100 and 100–300 cm. These cut-offs are based approximately on one of the few descriptions of soil horizons in Indo-Pacific mangroves (USDA 1983). Depth intervals in peat swamps were more variable depending on the arrangement of each plot’s peat and mineral horizons. Typically the subsample was taken from just above the mid-point of each depth interval, but this rule was applied flexibly in order to obtain a good, undisturbed sample.
• Coarse roots were avoided with the auger and by 2-mm sieving in the laboratory. Fine roots (<2 mm) passing through the sieve were considered part of the sample.
• Peat swamp soils were sampled using similar methodology, but due to shallow peats, sampling and inference were restricted to the top metre below the soil surface, including both peat and mineral horizons.
3.2 Sample analysis and allometric computationsOur general approach was to use well-established, relevant computational techniques from the literature to obtain the most accurate C-stock estimates possible (e.g. Pearson et al. 2005, 2007). Where multiple, equally valid techniques were available, the more conservative option was selected in order to support a generally conservative estimate of C-stock. Tree and sapling data were entered into allometric equations to estimate biomass per individual.
For mangroves, we used allometric equations from Kauffman and Cole (in press), which are specific to the species/genera and size range (>100 cm dbh) encountered in this study. Other mangrove allometries generally derive from trees <50 cm dbh and thus lead to inflated biomass estimates for large trees. Wood densities used in allometric computations came from species- and region-specific tables where possible (e.g. Oey 1951 cited in Soewarsono 1990; Hidayat and Simpson 1994; Simpson 1996); genus averages were applied otherwise. We used Clough and Scott (1989) for mangrove leaf computations. All computations included the Baskerville (1972) correction for log-transformed equations.
Tree coarse root mass was estimated using equations summarised in Komiyama et al. (2008). Fine roots <2 mm diameter, which were included in soil C estimates, were subtracted from the root mass numbers using fine/coarse root ratios summarised in Cairns et al. (1997) and Chen et al. (2004). Stilt roots of Rhizophora spp. were included as part of aboveground biomass rather than belowground, per Kauffman and Cole (in press).
For peat swamp forest trees and saplings, we used the general aboveground biomass equations for wet tropical forests in Chave et al. (2005), belowground allometries in Cairns et al. (1997) and species-, genus- or site-specific wood densities.
Dead trees were assumed to have no leaf biomass and an average of 30% density loss above and below ground due to decay. Broken-stemmed dead trees were conservatively modelled for volume as a modified cylinder of 0.8 πr2.
Carbon storage in mangrove and peatland ecosystems 17
Understorey vegetation mass per area was obtained by oven-drying the samples to constant mass and dividing by the sample area. Where samples were large, subsamples were used to determine moisture content.
Woody debris mass per area was obtained by entering diameters or tallies into the planar intercept volume equation (see Harmon and Sexton 1996), and then multiplying by wood density to convert into mass. All of the biomass estimates were converted to carbon mass using a conservative conversion factor of 0.464 g C per 1 g of biomass.
Soil samples were dried to constant mass at 60 °C, and the final mass used to compute bulk density by dividing by sample volume. (We determined that bulk density estimates derived from drying mangrove soils at 60 °C were within 1% of those derived at 105 °C.) Samples were then analysed at the Agricultural University of Bogor (IPB) analytical laboratory for OC content using the combustion method (700 °C), after pretreatment to remove carbonates (see Schumacher 2002). Soil % OC content was then multiplied by soil bulk density and soil depth to obtain total soil C storage per unit area.
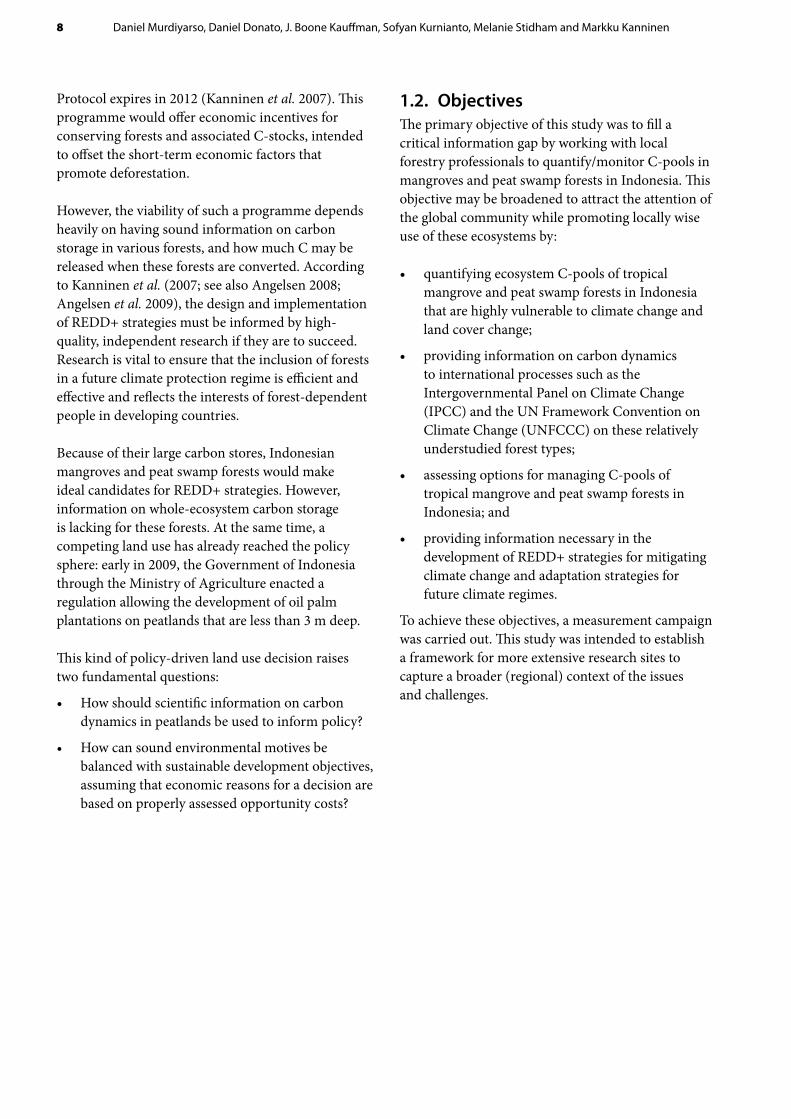
Our field team collects organic material and soil samples using a specially designed peat auger.
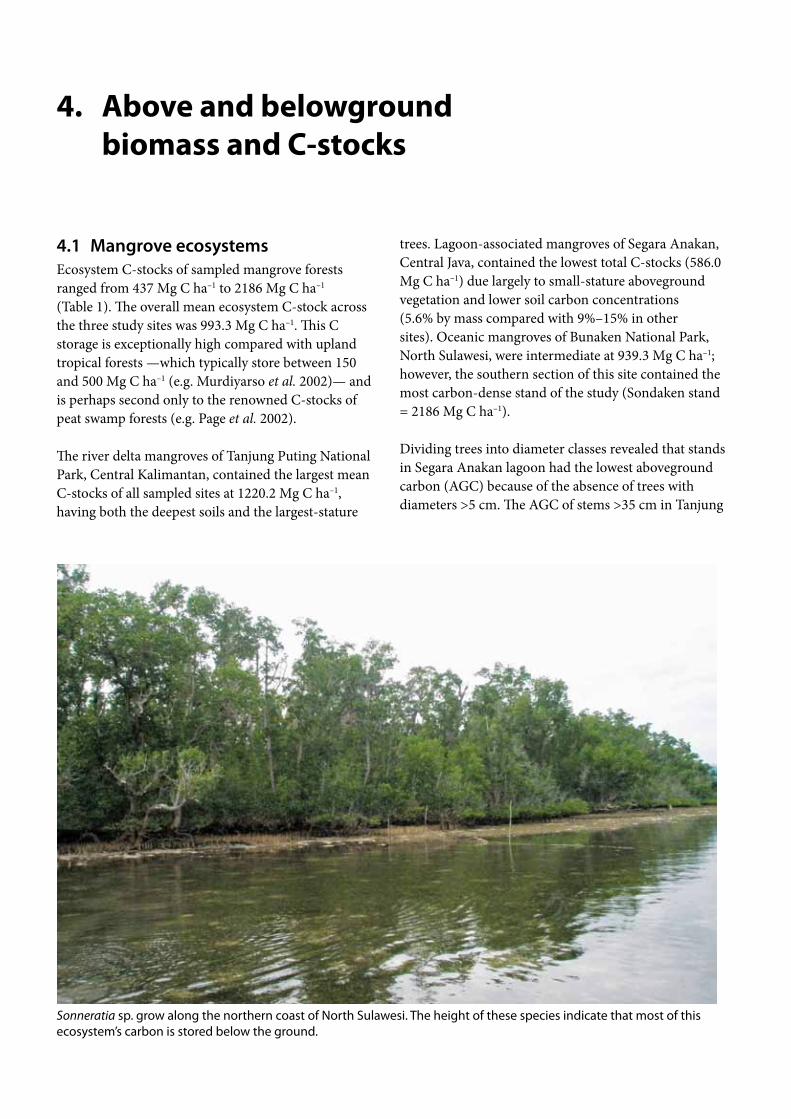
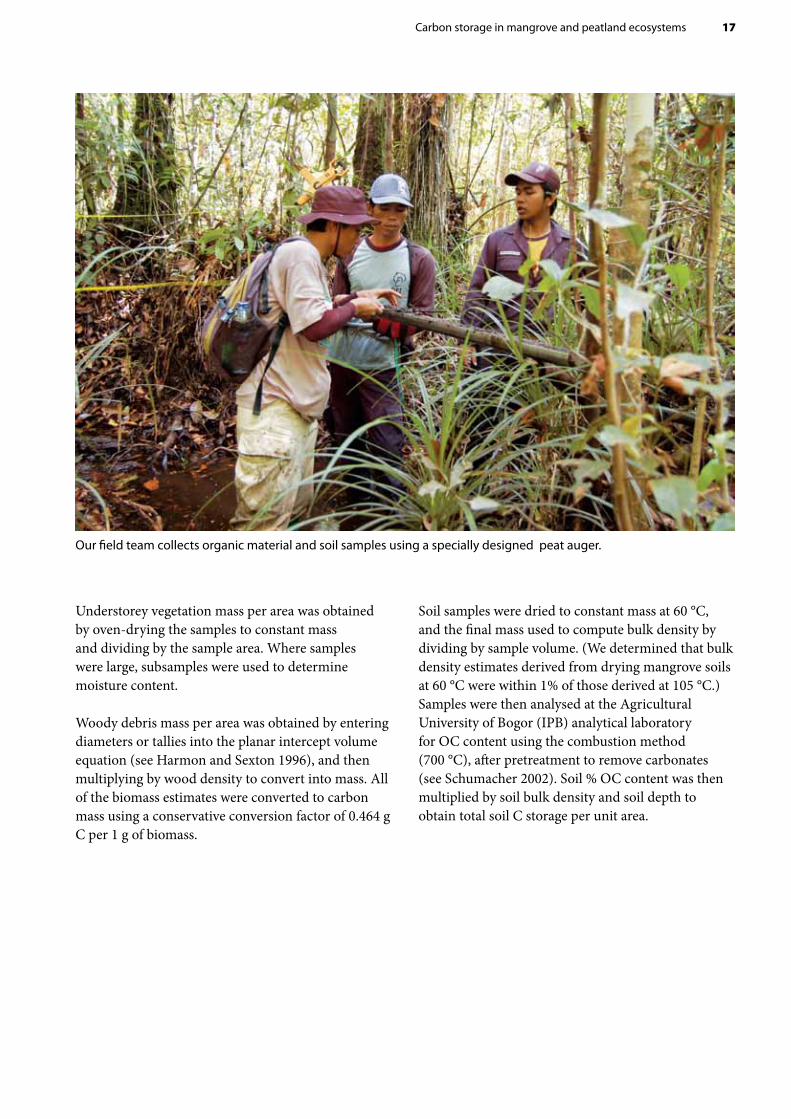
Sonneratia sp. grow along the northern coast of North Sulawesi. The height of these species indicate that most of this ecosystem’s carbon is stored below the ground.
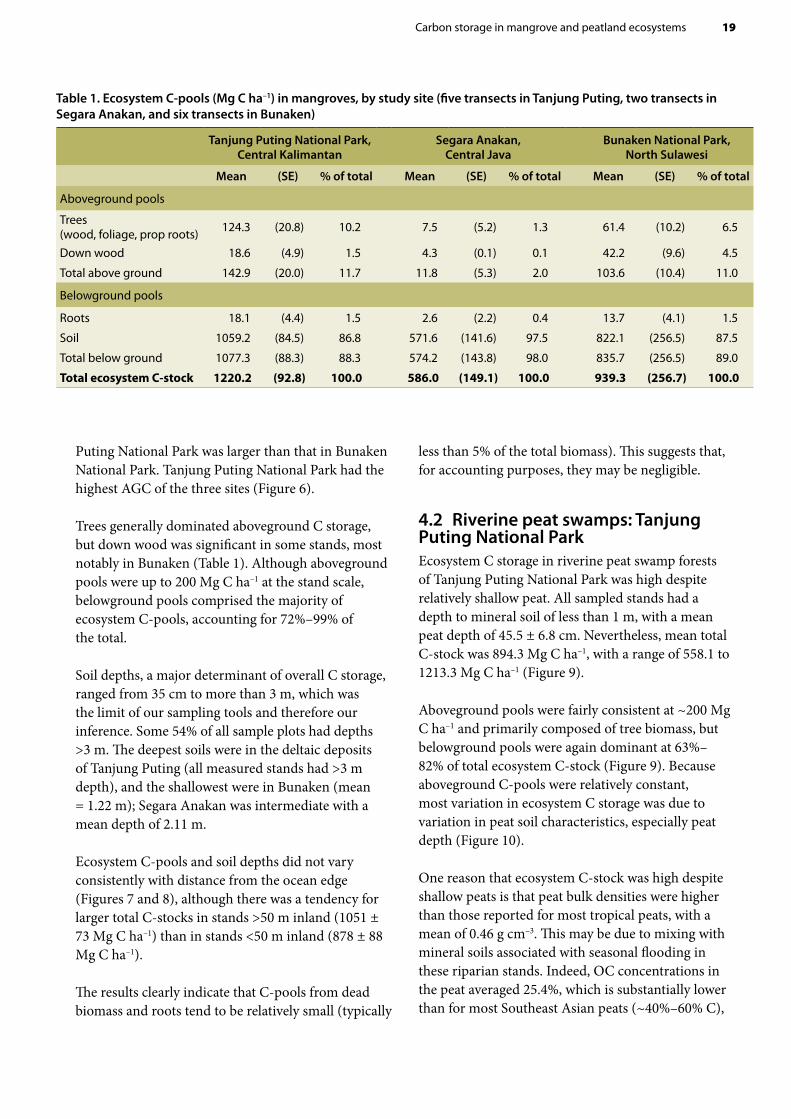
4.1 Mangrove ecosystemsEcosystem C-stocks of sampled mangrove forests ranged from 437 Mg C ha–1 to 2186 Mg C ha–1 (Table 1). The overall mean ecosystem C-stock across the three study sites was 993.3 Mg C ha–1. This C storage is exceptionally high compared with upland tropical forests —which typically store between 150 and 500 Mg C ha–1 (e.g. Murdiyarso et al. 2002)— and is perhaps second only to the renowned C-stocks of peat swamp forests (e.g. Page et al. 2002).
The river delta mangroves of Tanjung Puting National Park, Central Kalimantan, contained the largest mean C-stocks of all sampled sites at 1220.2 Mg C ha–1, having both the deepest soils and the largest-stature
trees. Lagoon-associated mangroves of Segara Anakan, Central Java, contained the lowest total C-stocks (586.0 Mg C ha–1) due largely to small-stature aboveground vegetation and lower soil carbon concentrations (5.6% by mass compared with 9%–15% in other sites). Oceanic mangroves of Bunaken National Park, North Sulawesi, were intermediate at 939.3 Mg C ha–1; however, the southern section of this site contained the most carbon-dense stand of the study (Sondaken stand = 2186 Mg C ha–1).
Dividing trees into diameter classes revealed that stands in Segara Anakan lagoon had the lowest aboveground carbon (AGC) because of the absence of trees with diameters >5 cm. The AGC of stems >35 cm in Tanjung
4. Above and belowground biomass and C-stocks
Carbon storage in mangrove and peatland ecosystems 19
Puting National Park was larger than that in Bunaken National Park. Tanjung Puting National Park had the highest AGC of the three sites (Figure 6).
Trees generally dominated aboveground C storage, but down wood was significant in some stands, most notably in Bunaken (Table 1). Although aboveground pools were up to 200 Mg C ha–1 at the stand scale, belowground pools comprised the majority of ecosystem C-pools, accounting for 72%–99% of the total.
Soil depths, a major determinant of overall C storage, ranged from 35 cm to more than 3 m, which was the limit of our sampling tools and therefore our inference. Some 54% of all sample plots had depths >3 m. The deepest soils were in the deltaic deposits of Tanjung Puting (all measured stands had >3 m depth), and the shallowest were in Bunaken (mean = 1.22 m); Segara Anakan was intermediate with a mean depth of 2.11 m.
Ecosystem C-pools and soil depths did not vary consistently with distance from the ocean edge (Figures 7 and 8), although there was a tendency for larger total C-stocks in stands >50 m inland (1051 ± 73 Mg C ha–1) than in stands <50 m inland (878 ± 88 Mg C ha–1).
The results clearly indicate that C-pools from dead biomass and roots tend to be relatively small (typically
less than 5% of the total biomass). This suggests that, for accounting purposes, they may be negligible.
4.2 Riverine peat swamps: Tanjung Puting National ParkEcosystem C storage in riverine peat swamp forests of Tanjung Puting National Park was high despite relatively shallow peat. All sampled stands had a depth to mineral soil of less than 1 m, with a mean peat depth of 45.5 ± 6.8 cm. Nevertheless, mean total C-stock was 894.3 Mg C ha–1, with a range of 558.1 to 1213.3 Mg C ha–1 (Figure 9).
Aboveground pools were fairly consistent at ~200 Mg C ha–1 and primarily composed of tree biomass, but belowground pools were again dominant at 63%–82% of total ecosystem C-stock (Figure 9). Because aboveground C-pools were relatively constant, most variation in ecosystem C storage was due to variation in peat soil characteristics, especially peat depth (Figure 10).
One reason that ecosystem C-stock was high despite shallow peats is that peat bulk densities were higher than those reported for most tropical peats, with a mean of 0.46 g cm–3. This may be due to mixing with mineral soils associated with seasonal flooding in these riparian stands. Indeed, OC concentrations in the peat averaged 25.4%, which is substantially lower than for most Southeast Asian peats (~40%–60% C),
Table 1. Ecosystem C-pools (Mg C ha–1) in mangroves, by study site (five transects in Tanjung Puting, two transects in Segara Anakan, and six transects in Bunaken)
Tanjung Puting National Park, Central Kalimantan
Segara Anakan, Central Java
Bunaken National Park, North Sulawesi
Mean (SE) % of total Mean (SE) % of total Mean (SE) % of total
Aboveground pools
Trees (wood, foliage, prop roots) 124.3 (20.8) 10.2 7.5 (5.2) 1.3 61.4 (10.2) 6.5
Down wood 18.6 (4.9) 1.5 4.3 (0.1) 0.1 42.2 (9.6) 4.5
Total above ground 142.9 (20.0) 11.7 11.8 (5.3) 2.0 103.6 (10.4) 11.0
Belowground pools
Roots 18.1 (4.4) 1.5 2.6 (2.2) 0.4 13.7 (4.1) 1.5
Soil 1059.2 (84.5) 86.8 571.6 (141.6) 97.5 822.1 (256.5) 87.5
Total below ground 1077.3 (88.3) 88.3 574.2 (143.8) 98.0 835.7 (256.5) 89.0
Total ecosystem C-stock 1220.2 (92.8) 100.0 586.0 (149.1) 100.0 939.3 (256.7) 100.0

20 Daniel Murdiyarso, Daniel Donato, J. Boone Kauffman, Sofyan Kurnianto, Melanie Stidham and Markku Kanninen
supporting the hypothesis of mixing with mineral matter. The soil C concentrations of the horizons below the peat layers were also relatively high.
There was no strong sign of variation in C-pools with distance from the river (Figure 11). Neither
One corner of peat swamp forest in Tanjung Puting National Park, Central Kalimantan, Indonesia
aboveground nor belowground pools showed systematic changes along this gradient. It is uncertain whether this trend may manifest over further distances inland; this likely depends on the presence and nature of any peat dome.

Carbon storage in mangrove and peatland ecosystems 21
Figure 6. The distribution of aboveground carbon of living trees (mean ± SE) by 5 cm diameter classes in the three study areas. The I bars indicate standard error.
5
10
15
20
25
30
Abov
egro
und
carb
on (M
g C/
ha)
-5
0
5
10
15
20
25
30
5 10 15 20 25 30 35 40 45 50 55 60 >60
Diameter classes (cm)
Segara Anakan Bunaken Tanjung Puting
Abo
vegr
ound
0
200
400
Distance from ocean in meters
0 20 40 60 80 100 120 140
Belo
wgr
ound
200
400
600
800
1000
1200
Carb
on s
tock
(M
g ha
-1)
Belowground pools
Aboveground pools
Roots
Soil
Down wood
Trees
Total C stock ( x Mg ha-1):
863.3 891.9 1044.4 1038.8 1073.4 1047.8
Figure 7. C-pools and total C-stock in sampled mangroves, by distance from the ocean

22 Daniel Murdiyarso, Daniel Donato, J. Boone Kauffman, Sofyan Kurnianto, Melanie Stidham and Markku Kanninen
0
0 35 60
Distance from ocean in meters
Org
anic
soi
l dep
th (c
m)
85 110 135
50
100
150
200
250
300
Figure 8. Depth (mean ± SE) of organic soil layers in mangroves by distance from the ocean
1200
1000
Carb
on s
tock
(Mg
ha-1
)
Site
Total C stock
558.1
Selu
ang
Sim
pang
Kan
cil
Risa
m
Pera
mua
n
Jeru
mbu
n
743.8 950.3 1005.8 1213.3
800
600
400
200
0
200
400Aboveground pools
Trees
Understory
Down wood
RootsPeatMineral spoil(to 1 m depth)
Belowground pools
Figure 9. Above and belowground carbon pools in riverine peat swamps sampled in Tanjung Puting National Park

Carbon storage in mangrove and peatland ecosystems 23
Figure 10. Variation in ecosystem carbon storage in riverine peat swamps of Tanjung Puting National Park, according to peat depth
Peat depth (cm)
Ecos
yste
m C
sto
rage
(Mg
ha-1
)
00 20 40 60 80 100
250
500
750
1000
1250
1500
Freshwater swamp,Borneo
R2 = 0.94
P = 0.006
Carb
on s
tock
(M
g ha
-1)
25 75 125 175 225 275
Distance from river (m)
1033.7 891.4 823.5 881.5 907.1 828.4
Total carbon stock ( x Mg ha-1):
-600
0
-200
200
400
-400
-800
-1000
Aboveground pools
Belowground pools
Trees
Understory
Down wood
Roots
Peat
Mineral soil(to 1 m depth)
Belo
wgr
ound
Abo
vegr
ound
Figure 11. Ecosystem C-stocks (mean, SE) in riverine peat swamp forests of Tanjung Puting National Park, by distance from the river

Across all 30 plots in Tanjung Puting National Park, we measured a total of 2390 trees, representing 55 species in 29 families. In term of species diversity, the Shannon–Wiener diversity index and Thompson’s diversity index were 3.29 and 0.94, respectively; as both these values are high compared with other swamp forest ecosystems, the diversity of the distribution of individuals across species can be described as relatively high in this area. The distribution of tree diameters revealed a typical reverse J-shaped pattern. Approximately 60% of trees have a dbh of less than 10 cm (Figure 12).
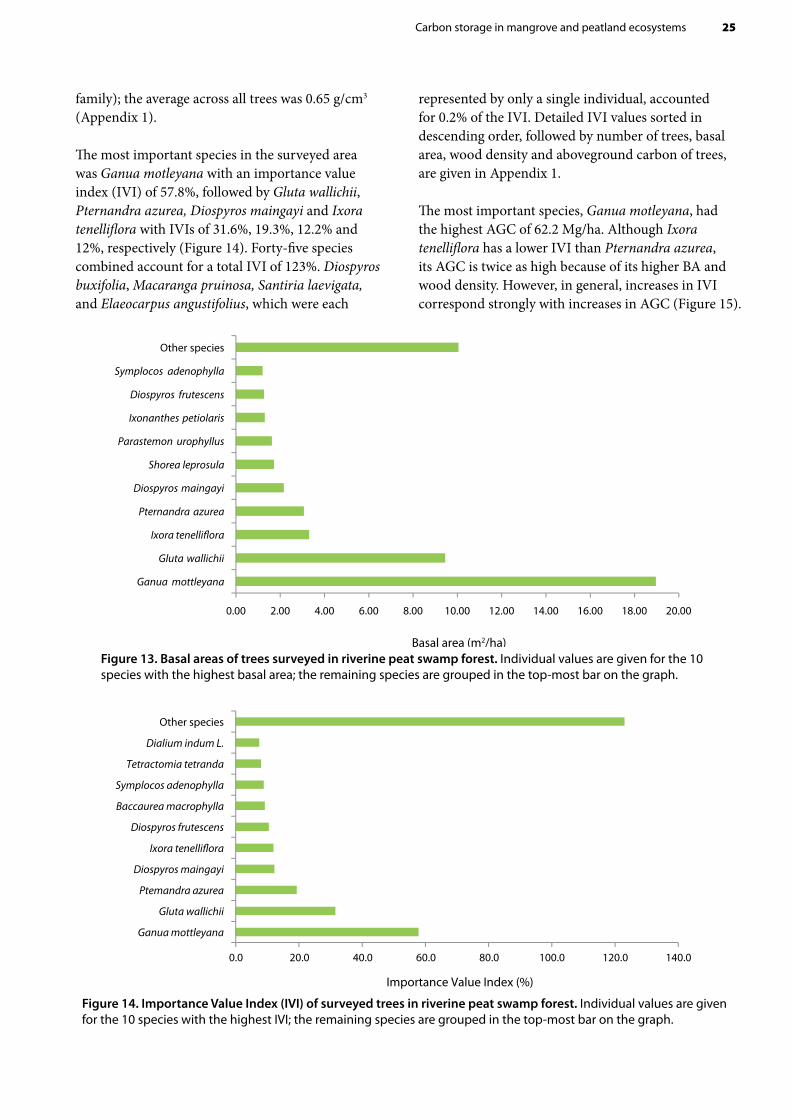
Ganua motleyana (Sapotaceae family) had the highest basal area (BA), 18.96 m2/ha, of all trees (Figure 13, Appendix 1). The total BA for all species except those with the 10 highest BAs was 10 m2/ha. Some species had a very low BA, close to zero, because they were represented by only a single individual with small dbh; among these were Diospyros buxifolia Hiern, Macaranga pruinosa and Elaeocarpus angustifolius Blume. Wood density of the trees surveyed ranged from 0.26 (Ficus drupacea of Moraceae family) to 1.05 g/cm3 (Parastemon urophyllus of Chrysobalanaceae
5. Diversity, structure and composition of riverine peat swamp forests in Tanjung Puting National Park
Figure 12. Distribution of riverine peat swamp forest trees by 5 cm diameter classes
0
100
200
300
400
500
600
700
800
900
5.0 10.0 15.0 20.0 25.0 30.0 35.0 40.0 45.0 50.0 55.0 60.0 More
Num
ber o
f tre
es
Diameter classes (cm)
Rengas (Gluta wallichii), has a high importance value index (IVI) and is frequently found in peat swamp ecosystems.
Carbon storage in mangrove and peatland ecosystems 25
Figure 13. Basal areas of trees surveyed in riverine peat swamp forest. Individual values are given for the 10 species with the highest basal area; the remaining species are grouped in the top-most bar on the graph.
Figure 14. Importance Value Index (IVI) of surveyed trees in riverine peat swamp forest. Individual values are given for the 10 species with the highest IVI; the remaining species are grouped in the top-most bar on the graph.
0.00 2.00 4.00 6.00 8.00 10.00 12.00 14.00 16.00 18.00 20.00
Ganua mottleyana
Gluta wallichii
Ixora tenelli�ora
Pternandra azurea
Diospyros maingayi
Shorea leprosula
Parastemon urophyllus
Ixonanthes petiolaris
Diospyros frutescens
Symplocos adenophylla
Other species
Basal area (m2/ha)
0.0 20.0 40.0 60.0 80.0 100.0 120.0 140.0
Ganua mottleyana
Gluta wallichii
Ptemandra azurea
Diospyros maingayi
Ixora tenelli�ora
Diospyros frutescens
Baccaurea macrophylla
Symplocos adenophylla
Tetractomia tetranda
Dialium indum L.
Other species
Importance Value Index (%)
family); the average across all trees was 0.65 g/cm3 (Appendix 1).
The most important species in the surveyed area was Ganua motleyana with an importance value index (IVI) of 57.8%, followed by Gluta wallichii, Pternandra azurea, Diospyros maingayi and Ixora tenelliflora with IVIs of 31.6%, 19.3%, 12.2% and 12%, respectively (Figure 14). Forty-five species combined account for a total IVI of 123%. Diospyros buxifolia, Macaranga pruinosa, Santiria laevigata, and Elaeocarpus angustifolius, which were each
represented by only a single individual, accounted for 0.2% of the IVI. Detailed IVI values sorted in descending order, followed by number of trees, basal area, wood density and aboveground carbon of trees, are given in Appendix 1.
The most important species, Ganua motleyana, had the highest AGC of 62.2 Mg/ha. Although Ixora tenelliflora has a lower IVI than Pternandra azurea, its AGC is twice as high because of its higher BA and wood density. However, in general, increases in IVI correspond strongly with increases in AGC (Figure 15).

26 Daniel Murdiyarso, Daniel Donato, J. Boone Kauffman, Sofyan Kurnianto, Melanie Stidham and Markku Kanninen
Figure 15. Relationship between Importance Value Index and aboveground carbon content of trees in riverine peat swamp forest
R2 = 0,912
-10,0
0,0
10,0
20,0
30,0
40,0
50,0
60,0
70,0
0.0 10.0 20.0 30.0 40.0 50.0 60.0 70.0
Abo
vegr
ound
car
bon
(Mg
C/ha
)
Importance Value Index (%)

Keeping mangroves and peat swamp forests intact has been a difficult challenge in Indonesia. Because developing and rehabilitating such ecosystems are not easy tasks, an incentive system to conserve these carbon-rich systems is urgently needed. There is a great need to raise awareness of the issue and at the same time to build partnerships among stakeholders.
6.1 Mangrove ecosystemsMangroves provide a natural physical barrier against soil erosion, tsunamis and storm surges. The threat of sea-level rise is quite prominent for small islands and low-lying coastal zones (IPCC 2007). Therefore, conserving and restoring mangrove areas should be
mainstreamed into coastal development agendas as a strategy for adapting to climate change.
In terms of marketable ecosystem services, mangroves also filter chemical and organic pollution from the water, which keeps the waters on reefs and seagrass beds cleaner. There has been scant monetisation of such regulating services, but these could potentially finance conservation activities.
Other co-benefits of maintaining mangroves are their function as a nursery for juvenile fish and shrimp as well as habitat for crabs, oysters, clams, estuarine crocodiles and snakes. Seabirds and fruit bats use mangroves as resting and breeding grounds.
6. Implications for climate change mitigation and adaptation
Rhizophora sp. grow to a low height in oceanic mangrove ecosystems in North Sulawesi. They protect the coastal zone from marine erosion.

28 Daniel Murdiyarso, Daniel Donato, J. Boone Kauffman, Sofyan Kurnianto, Melanie Stidham and Markku Kanninen
Sustaining and restoring standing mangroves would continue the flow of these important ecosystem services.
Local communities also benefit from mangroves, which they use for building materials, food, fuel and medicine. Mangrove ecosystems have an even bigger role in aiding communities to adapt to multiple stressors associated with global environmental change. Denuded mangroves could be restored by involving communities whose livelihoods depend on them.
Mangroves appear to be one of the most carbon-dense types of tropical forest on Earth, possibly second only to peat swamp. Indonesia has more mangroves than any other country, and their land area adds another 3 Mha to the existing peat area (around 22 MHa) in Indonesia. Mangroves are an important deep-organic-soil forest type that could benefit from REDD+ and should be considered among strategies for climate change mitigation.
6.2 Peatland ecosystemsMost forest conversions planned in the early 1980s were located in peatlands (Murdiyarso and Lebel 2007). Deforestation of peat forests greatly increased greenhouse gas (GHG) emissions from Indonesia in the past decade. Contributing to the large land-based emissions were large-scale drainage of peatlands, fires and vegetation clearing (Page et al. 2002; Hooijer et al. 2006).
However, there is significant uncertainty associated with emissions and other factors required to estimate system-wide emissions from peatlands. Such factors will eventually be needed for carbon accounting when benefits from conserving carbon are negotiated in fund- and market-based mechanisms. Reducing these uncertainties to develop reference levels and to project future emissions/sequestrations will make carbon trading in peatlands more attractive.
REDD+ policies have great potential to aid conservation of peatland ecosystems, which may be
Converted peatlands near Tanjung Puting National Park for oil palm plantations.

Carbon storage in mangrove and peatland ecosystems 29
especially effective candidates given their extremely high carbon stores. Incentives should be created to encourage stakeholders to conserve carbon in the same landscapes in which they are entitled to exploit timber.
To date, the accounting methodology is lacking credible numerical estimates of land conversions (activity factors) and GHG emissions and removals (emission factors). Consequently, default values are
used, which leads to inaccuracy. This makes carbon trading unattractive for both buyers and sellers.
Although this exercise was not intended to provide comprehensive information about peatlands and related emissions, it is does create better understanding of the need to prioritise the use of stratified sampling based on peat depth and peat formation.

Measurement campaigns of C-stocks in mangrove and peatland ecosystems provide a basis for further developing field assessments and monitoring. The data presented in this report show that mangroves hold C-pools that are among the largest in the tropics. We found no consistent or conclusive differences in terms of belowground C-stocks across sites and by distance from the ocean. However, the ocean does affect mangrove forest stature and hence aboveground C-stocks. Small-stature stands are more often found in oceanic (fringe) settings, while large-stature stands are found in physically protected, riverine or estuarine ecosystems.
The limited samples from peatlands prevent us from drawing any broader conclusions. Clearly, more studies across Indonesian peat forest and mangrove ecosystems would be of great value. Nevertheless, although our peatland sampling was limited to relatively shallow riverine forests, these data show
7. Conclusions
An adult orangutan with her child hangs on trees in Camp Leaky, Tanjung Puting National Park, Central Kalimantan, Indonesia.
that even shallow-soiled peat swamps contain very large C-pools because of the combination of large trees, denser peats and significant C storage in the upper mineral soil layers. Peatlands are extremely rich in belowground C-stocks, and it is not sufficient to keep the trees standing without maintaining natural inundation processes that prevent the oxidation of organic soils.
Integrating peatlands and mangrove conservation into REDD+ mechanisms would be a strategic approach to climate change mitigation in Indonesia, especially if ecosystem adaptation to global change can be mainstreamed into development agendas. Many aspects of both mangroves and peatlands make them unique ecosystems. Improving their management, including wise use of resources, would enhance collateral benefits for both global and local communities.

Wetlands are an important and often under-appreciated resource. These ecosystems include lakes and rivers, swamps and marshes, wet grasslands and peatlands, oases, estuaries, deltas and tidal flats, near-shore marine areas, mangroves and coral reefs, as well as artificial sites such as fishponds, rice paddies, reservoirs and salt-pans. Carbon accounting has been particularly difficult in wetlands because of limited information on C-stocks and on emissions and removals of other GHGs, particularly methane (CH4) and nitrous oxide (N2O).
In the IPCC (2003) Good Practice Guidance for Land Use, Land Use Change and Forestry, wetlands were treated in an annex because of limited information available at that time. The 2006 revised National Greenhouse Gas Inventory Guidelines laid out for the first time methods for GHG accounting in these ecosystems. However, these remain incomplete. As more countries take on emission reduction commitments and as the international REDD+ mechanism becomes operational, it is important that we improve our knowledge of the carbon stores of these ecosystems, notably in terms of biomass and soil organic matter pools.
Using the methodologies and findings described in this paper, CIFOR and US Forest Services plans to undertake measurement activities with a broader scope and coverage in order to provide new knowledge for international and national policy development, early demonstration of REDD+ activities and the monitoring, reporting and verification of emission reductions. These have been the major technical barriers to the implementation of the upcoming global REDD+ scheme. Lack of
The way forward
regionally and nationally appropriate default values for the IPCC equation preclude so-called Tier 2 accounting. This problem is particularly acute in wetlands.
CIFOR and US Forest Services are developing a larger project for submission to USAID with the overall goal of supporting the development of the international REDD+ mechanism in wetlands. The project will significantly reduce the above problem throughout the tropics through better characterisation of C-stocks in intact tropical wetlands and in the ecosystems that are replacing them.
The proposed project will produce maps for the tropics over four years. It will adopt a regional approach, refining the methods at each stage and updating them with new developments in remote sensing technology. The project will also develop innovative statistical approaches to large-scale assessments of carbon stocks.
The resources provided by USAID will be used to fund the work, initially in Southeast Asia. During Year 1, we will undertake the detailed conceptual work that will set the stage for the entire project. This will involve a major international workshop in early 2011. We will establish local partnerships, and all field measurements in each target country will be carried out through local partners with supervision by CIFOR and the US Forest Service (USFS). This will contribute to building local capacity to undertake carbon assessments in wetland ecosystems. As additional funding becomes available, we will move progressively to other regions.

Alongi, D.M. 2008 Mangrove forests: Resilience, protection from tsunamis, and responses to global climate change. Estuarine, Coastal and Shelf Science 76: 1–13
Angelsen, A. (ed.) 2008 Moving ahead with REDD: issues, options and implications. CIFOR, Bogor, Indonesia. 156p.
Angelsen, A. with Brockhaus, M., Kanninen, M., Sills, E., Sunderlin, W.D. and Wertz-Kanounnikoff, S. (eds.) 2009 Realising REDD+: national strategy and policy options. CIFOR, Bogor, Indonesia. 362p.
Baskerville, G. 1972 Use of logarithmic regression in the estimation of plant biomass. Canadian Journal of Forest Research 2: 49–53.
Bureau Veritas Certification. Final assessment report, version 5.2, March 2010 (http://www.us.bureauveritas.com/wps/wcm/connect/bv_usnew/Local/Footer/Home/ (10 October 2010).
Cairns, M.A., Brown, S., Helmer, E.H. and Baumgardner, G.H. 1997 Root biomass allocation in the world’s upland forests. Oecologia 111: 1–11.
Chave, J., Andalo, C., Brown, S., Cairns, M.A., Chambers, J.Q., Eamus, D., Fölster, H., Fromard, F., Higuchi, N., Kira, T., et al. 2005 Tree allometry and improved estimation of carbon stocks and balance in tropical forests. Oecologia 145: 87–99.
Chen, W., Zhang, Q., Cihlar, J., Bauhus, J. and Price, D.T. 2004 Estimating fine-root biomass and production of boreal and cool temperate forests using aboveground measurements: a new approach. Plant and Soil 265: 31–46.
Clough, B.F. and Scott, K. 1989 Allometric relationships for estimating aboveground biomass in six mangrove species. Forest Ecology and Management 27: 117–127.
Curran, L.M., Trigg, S.N., McDonald, A.K., Astiani, D., Hardiono, Y.M., Siregar, P., Caniago, I. and Kasischke, E. 2004 Lowland forest loss in protected areas of Indonesian Borneo. Science 303: 1000–1003.
Dahdouh-Guebas, F. and Koedam, N. 2006 Coastal vegetation and the Asian tsunami. Science 311: 37–38.
References
Danielsen, F., Sørensen, M.K., Olwig, M.F., Selvam, V., Parish, F., Burgess, N.D., Hiraishi, T., Karunagaran, V.M., Rasmussen, M.S., Hansen, L.B., et al. 2005 The Asian tsunami: a protective role for coastal vegetation. Science 310: 643.
Dudley, R. 2000 Segara Anakan fisheries management plan. Segara Anakan Conservation and Development Project. Asian Development Bank. 33p.
Ellison, A.M. 2008 Mangrove ecology–applications in forestry and coastal zone management. Aquatic Botany 89: 77.
FAO (Food and Agriculture Organization of the United Nations). 2007. The world’s mangroves 1980–2005. FAO Forestry Report 153, Rome.
Fujimoto, K., Imaya, A., Tabuchi, R., Kuramoto, S., Utsugi, H. and Murosushi, T. 1999 Belowground carbon storage of Micronesian mangrove forests. Ecological Research 14: 409–413.
Gibbs, H.K., Ruesch, A.S., Clayton, M.K., Holmgren, P., Ramankutty, N. and Foley, J.A. 2010 Tropical forests were the primary sources of new agricultural land in the 1980s and 1990s. PNAS 107: 16732–16737. doi: 10.1073/pnas.0910275107.
Harmon, M.E. and Sexton, J. 1996 Guidelines for measurements of woody detritus in forest ecosystems. Publication no. 20. United States Long Term Ecological Research Network Office, University of Washington, Seattle.
Hidayat, S. and Simpson, W.T. 1994 Use of green moisture content and basic specific gravity to group tropical woods for kiln drying. Research Note FPL-RN-0263, USDA Forest Service, Forest Products Laboratory.
Hinrichs, S., Nordhaus, I. and Geist, S.J. 2009 Status, diversity and distribution patterns of mangrove vegetation in the Segara Anakan lagoon, Java, Indonesia. Regional Environmental Change 9: 275–289. doi: 10.1007/s10113-008-0074-4
Hirano, T., Segah, H., Harada, T., Limin, S., June, T., Hirata, R. and Osaki, M. 2007 Carbon dioxide balance of a tropical peat swamp forest in Kalimantan, Indonesia. Global Change Biology 13: 412–425.

Carbon storage in mangrove and peatland ecosystems 33
Hooijer, A., Silvius, M., Wösten, H. and Page, S. 2006 PEAT-CO2, Assessment of CO2 emissions from drained peatlands in SE Asia. Delft Hydraulics Report Q3943.
IPCC (Intergovernmental Panel on Climate Change). 2003. IPCC Good Practice Guidance for Land Use, Land-Use Change and Forestry Prepared by the National Greenhouse Gas Inventories Programme, eds Penman J Gytarsky M Hiraishi T, et al. IGES, Hayama.
IPCC (Intergovernmental Panel on Climate Change). 2006. IPCC Guidelines for National Greenhouse Gas Inventories, Prepared by the National Greenhouse Gas Inventories Programme, eds Eggleston HS, Buendia L, Miwa K et al. IGES, Hayama.
IPCC (Intergovernmental Panel on Climate Change). 2007 Fourth IPCC assessment report: climate change 2007. Cambridge University Press, Cambridge.
Jepson, P., Jarvie, J.K., MacKinnon, K. and Monk, K.A. 2001 The end for Indonesia’s lowland forests? Science 292: 859–861.
Kanninen, M., Murdiyarso, D., Seymour, F., Angelsen, A., Wunder, S. and German, L. 2007 Do trees grow on money? The implications of deforestation research for policies to promote REDD. CIFOR, Bogor, Indonesia.
Kauffman, J.B. and Cole, T.G. 2010 Effects of a severe typhoon on Micronesian mangrove forest structure. Wetlands. In Press.
Komiyama, A., Ong, J.E. and Poungparn, S. 2008 Allometry, biomass, and productivity of mangrove forests: A review. Aquatic Botany 89: 128–137.
Langner, A. and Siegert, F. 2009 Spatiotemporal fire occurrence in Borneo over a period of 10 years. Global Change Biology 15: 48–62. doi: 10.1111/j.1365-2486.2008.01828.x
Mehta, A. 1999 Bunaken National Park Natural History. Yayasan Kelola. USAID/NRM/EPIQ Program.
Murdiyarso, D. and Adiningsih, E.S. 2007 Climate anomalies, Indonesian vegetation fires and terrestrial carbon emissions. Mitigation and Adaptation Strategies for Global Change 12: 101–112.
Murdiyarso, D. and Lebel, L. 2007 Southeast Asian fire regimes and land development policy. In: Canadell, J., Pataki, D. and Pitelka, L. (eds.). Terrestrial ecosystems in a changing world, 261–271. Springer, New York.
Murdiyarso, D., van Noordwijk, M., Wasrin, U.R., Tomich, T.P. and Gillison, A. 2002 Environmental benefits and sustainable land-use in Jambi transect, Sumatra, Indonesia. Journal of Vegetation Science 13: 429–438.
Oey, D.S. 1951. In: Soewarsono, P.H. 1990 Specific gravity of Indonesian woods and its significance for practical use. FRPDC, Forestry Dept, Bogor, Indonesia. 42p.
Page, S.E., Siegert, F., Rieley, J.O., Boehm, H.-D.V., Jaya, A. and Limin, S. 2002 The amount of carbon released from peat and forest fires in Indonesia during 1997. Nature 420: 61–65.
Pearson, T., Walker, S. and Brown, S. 2005 Sourcebook for land use, land-use change and forestry projects. Report from BioCF and Winrock International. Available at: http://www.winrock.org/ecosystems/tools.asp?BU=9086.
Pearson, T.R.H., Brown, S.L. and Birdsey, R.A. 2007 Measurement guidelines for the sequestration of forest carbon. General Technical Report-NRS-18, USDA Forest Service, Northern Research Station.
Rainforest Alliance 2009 Baseline and monitoring methodology for conservation projects that avoid planned land use conversion in peat swamp forests. First assessment report, 7 December http://www.rainforest-alliance.org/climate.cfm?id=peat_swamp (5 October 2010).
Schumacher, B. 2002 Methods for the determination of total organic carbon (TOC) in soils and sediments. NCEA-C-1282, EMASC-001, US Environmental Protection Agency, Las Vegas, NV, USA.
Simpson, W.T. 1996 Method to estimate dry-kiln schedules and species groupings: tropical and temperate hardwoods. RPL-RP-548, USDA Forest Service, Forest Products Laboratory.
Snedaker, S.C. and Lahmann, E.J. 1988 Mangrove understorey absence: a consequence of evolution? Journal of Tropical Ecology 4: 311–314.
USDA (United States Department of Agriculture). 1983 Soil survey of island of Kosrae, Federated States of Micronesia. Soil Conservation Service, Hawaii, USA.

Num
ber o
f tre
es, r
elat
ive
dens
ity
(RD
), re
lativ
e fr
eque
ncy
(RF)
, rel
ativ
e do
min
ance
(RD
om),
impo
rtan
ce v
alue
inde
x (IV
I), b
asal
are
a (B
A),
woo
d de
nsit
y (W
D) a
nd
abov
egro
und
carb
on (A
GC)
of t
he s
peci
es in
sur
veye
d pl
ots.
No
Fam
ilySp
ecie
sLo
cal N
ame
NRD
(%)
RF (%
)RD
om (%
)IV
I (%
)M
eans
BA(m
2 /ha)
WD
(g/c
m3 )
AG
C(M
g C/
ha)
1Sa
pota
ceae
G
anua
mot
leya
na P
ierr
e ex
Dub
ard
Ketia
u42
917
.34.
436
.257
.818
.96
0.55
62.2
2A
naca
rdia
ceae
G
luta
wal
lichi
i (H
ook.
f.) D
ing
Hou
Re
ngas
227
9.1
4.4
18.0
31.6
9.45
0.67
36.6
3M
elas
tom
atac
eae
Pter
nand
ra a
zure
a (D
C.) B
urki
ll Pe
sula
n24
29.
74.
45.
219
.33.
070.
719.
3
4Eb
enac
eae
Dio
spyr
os m
aing
ayi
Lam
inad
uk10
54.
23.
94.
112
.22.
160.
707.
7
5Ru
biac
eae
Ixor
a te
nelli
flora
Mer
r. Be
ntuk
a60
2.4
3.2
6.3
12.0
3.31
0.97
20.3
6Eb
enac
eae
Dio
spyr
os fr
utes
cens
Blu
me
Beku
nyit
110
4.4
3.8
2.3
10.5
1.27
0.70
4.3
7Eu
phor
biac
eae
Bacc
aure
a m
acro
phyl
la M
uell.
Arg
. Pu
ak83
3.3
4.1
1.8
9.2
0.98
0.65
2.6
8Sy
mpl
ocac
eae
Sym
ploc
os a
deno
phyl
la W
all.
Hab
u - H
abu
Raw
a72
2.9
3.6
2.3
8.9
1.20
0.78
4.2
9Ru
tace
ae
Tetr
acto
mia
spp
. (Ro
xb.)
Mer
r. Ja
mpa
ng83
3.3
2.8
1.9
8.0
0.99
0.76
3.3
10Fa
bace
ae
Dia
lium
indu
m L
. Ke
ranj
i44
1.8
3.8
1.9
7.4
0.99
0.90
4.4
11Ch
ryso
bala
nace
ae
Para
stem
on u
roph
yllu
s A
.C. D
C.
Bent
an36
1.4
2.2
3.1
6.7
1.62
1.05
10.8
12Fa
bace
ae
Crud
ia b
anta
men
sis
(Has
sk.)
Bent
h.
Mam
pai
632.
53.
11.
16.
70.
600.
932.
4
13D
ipte
roca
rpac
eae
Shor
ea le
pros
ula
Miq
. La
nan
271.
12.
33.
36.
71.
720.
525.
7
14Ix
onan
thac
eae
Ixon
anth
es p
etio
laris
Blu
me
Leba
ng38
1.5
2.6
2.5
6.7
1.30
0.82
6.2
15Ic
acin
acea
e St
emon
urus
mal
acce
nsis
(Mas
t.) S
leum
er
Beda
ru ra
wa
562.
33.
50.
76.
50.
430.
651.
0
16A
naca
rdia
ceae
Ca
mpn
ospe
rma
auric
ulat
a H
ook.
f.
Tent
alan
g51
2.1
3.1
0.7
5.8
0.50
0.38
0.7
17Cl
usia
ceae
G
arci
nia
becc
arii
Pier
re
Kem
anjin
g43
1.7
3.1
0.4
5.2
0.27
0.75
0.7
18
Sten
ochl
aena
pal
ustr
isLe
mbi
ding
953.
81.
20.
05.
00.
030.
650.
0
19Eu
phor
biac
eae
Bacc
aure
a ja
vani
ca M
uell.
Arg
. Pi
ntau
532.
12.
30.
44.
90.
370.
640.
7
20M
elas
tom
atac
eae
Mem
ecyl
on m
yrsi
noid
es B
lum
e Te
mba
ras
411.
72.
60.
34.
60.
180.
880.
5
21Ru
biac
eae
Ixor
a flu
min
alis
Rid
l. Sa
riwak
a21
0.8
2.8
0.3
4.0
0.19
0.97
0.7
22Cl
usia
ceae
Ca
loph
yllu
m s
oula
ttri
Burm
.f. e
x F.
Mue
ll Pe
naga
341.
41.
80.
83.
90.
420.
541.
2
23La
urac
eae
Endi
andr
a ru
besc
ens
Blum
e ex
Miq
. Ku
mpa
ng P
asir
351.
42.
20.
33.
90.
160.
750.
4
24A
nnon
acea
e Po
lyal
thia
late
riflor
a Ki
ng
Bani
tan
kuni
ng27
1.1
1.9
0.7
3.6
0.44
0.60
1.1
25Ct
enol
opho
nace
ae
Cten
olop
hon
parv
ifoliu
s O
liv
Tem
plaa
n25
1.0
1.6
0.9
3.5
0.45
0.89
1.9
26Pa
ndan
acea
e Pa
ndan
us m
otle
yanu
s So
lms.
Rasa
n pi
pit
451.
81.
50.
03.
30.
160.
650.
2
App
endi
x 1.
Sum
mar
y of
dat
a co
llect
ed b
y tr
ee s
peci
es

Carbon storage in mangrove and peatland ecosystems 35
No
Fam
ilySp
ecie
sLo
cal N
ame
NRD
(%)
RF (%
)RD
om (%
)IV
I (%
)M
eans
BA(m
2 /ha)
WD
(g/c
m3 )
AG
C(M
g C/
ha)
27Ic
acin
acea
e St
emon
urus
gra
ndifo
lius
Becc
. Ra
min
190.
81.
90.
63.
20.
310.
651.
1
28Le
cyth
idac
eae
Barr
ingt
onia
lanc
eola
ta (R
idl.)
Pay
ens
Puta
t34
1.3
1.8
0.0
3.1
0.06
0.65
0.1
29
Actin
odap
hne
proc
era
Med
ang
301.
21.
50.
22.
90.
140.
500.
2
30Eu
phor
biac
eae
Apo
rosa
pen
ange
nsis
(Rid
l.) A
iry S
haw
Be
kapa
s13
0.5
1.8
0.4
2.7
0.18
0.70
0.7
31Sa
pind
acea
e A
lloph
yllu
s co
bbe
(L.)
Raeu
sch.
Pa
pung
120.
51.
01.
12.
60.
550.
451.
4
32M
yris
ticac
eae
Knem
a ci
nere
a (P
OiL
) War
b Ku
mpa
ng p
utih
180.
71.
50.
22.
40.
300.
520.
6
33Aq
uifo
liace
ae
Ilex
mal
acce
nsis
Loe
s. Be
sira
200.
81.
30.
22.
30.
090.
500.
2
34A
nnon
acea
e Xy
lopi
a m
alay
ana
Hoo
k.f.
& T
hom
son
Jang
kang
150.
51.
20.
42.
10.
210.
650.
6
35Ic
acin
acea
e Pl
atea
exc
elsa
Blu
me
Jung
kung
140.
61.
00.
42.
00.
260.
450.
5
36
Pi
nang
kar
a27
1.1
0.6
0.0
1.7
2.2
0.65
2.4
37A
nnon
acea
e G
onio
thal
amus
tapi
s M
iq.
Peny
aran
g bu
kit
50.
20.
40.
00.
70.
020.
470.
0
38
Koko
ona
ochr
acea
Pene
mpl
aan
40.
20.
30.
20.
60.
100.
350.
2
39M
yrta
ceae
Sy
zygi
um s
p.
Uba
r7
0.3
0.3
0.1
0.6
0.04
0.72
0.0
40Eu
phor
biac
eae
Apo
rosa
luci
da (M
iq.)
Airy
Sha
w
Kem
anja
r4
0.2
0.4
0.0
0.6
0.01
0.72
0.0
41La
urac
eae
Als
eoda
phne
can
esce
ns B
oerl.
G
embo
r3
0.1
0.4
0.0
0.6
0.01
0.64
0.0
42Ru
biac
eae
Tim
oniu
s fla
vesc
ens
Bake
r Lu
pis
30.
10.
40.
00.
60.
010.
530.
0
43
Re
nda
30.
10.
40.
00.
60.
00.
650.
0
44
Ra
sak
30.
10.
30.
00.
40.
40.
650.
9
45M
elia
ceae
Ch
isoc
heto
n pa
tens
Blu
me
Pile
r war
ig3
0.1
0.3
0.0
0.4
0.01
0.53
0.0
46Rh
izop
hora
ceae
G
ynot
roch
es a
xilla
ris B
lum
e M
ata
keli
20.
10.
30.
00.
40.
000.
630.
0
47
Kum
pang
ara
ng1
0.0
0.1
0.0
0.2
0.5
0.52
1.1
48M
orac
eae
Ficu
s dr
upac
ea T
hunb
. Ke
raya
10.
00.
10.
00.
20.
010.
260.
0
49M
yrta
ceae
Sy
zygi
um p
ycna
nthu
m M
err.
& L
.M. P
erry
U
bar m
erah
10.
00.
10.
00.
20.
010.
72
50Lo
gani
acea
e Fa
grae
a ra
cem
osa
Jack
U
lar u
lar
10.
00.
10.
00.
20.
000.
730.
0
51A
naca
rdia
ceae
Bo
uea
oppo
sitif
olia
(Rox
b.) M
eisn
. Ra
man
ia2
0.0
0.1
0.0
0.2
0.01
0.92
0.0
52Eb
enac
eae
Dio
spyr
os b
uxifo
lia H
iern
Ri
bu1
0.0
0.1
0.0
0.2
0.00
0.70
0.0
53Eu
phor
biac
eae
Mac
aran
ga p
ruin
osa
Mue
ll. A
rg.
Mah
ang
10.
00.
10.
00.
20.
000.
390.
0
54Bu
rser
acea
e Sa
ntiri
a la
evig
ata
Blum
e Po
ga1
0.0
0.1
0.0
0.2
0.03
0.60
0.0
55El
aeoc
arpa
ceae
El
aeoc
arpu
s an
gust
ifoliu
s Bl
ume
Pina
ng ti
kus
10.
00.
10.
00.
20.
000.
500.
0
Tota
l2,
390
100.
010
010
030
0
Mea
n56
.70
0.65
199.
4


www.cifor.cgiar.org www.ForestsClimateChange.org
Center for International Forestry Research CIFOR advances human wellbeing, environmental conservation and equity by conducting research to inform policies and practices that affect forests in developing countries. CIFOR is one of 15 centres within the Consultative Group on International Agricultural Research (CGIAR). CIFOR’s headquarters are in Bogor, Indonesia. It also has offices in Asia, Africa and South America.