carbon stocks in a miombo woodland landscape: spatial distributions and controls emily woollen,...
TRANSCRIPT

Carbon stocks in a miombo woodland landscape: spatial
distributions and controls
Emily Woollen, Mathew Williams, Casey Ryan and John Grace
The University of Edinburgh, School of GeoSciences
EGU - 6th April 2011, SOC dynamics at different spatial scales
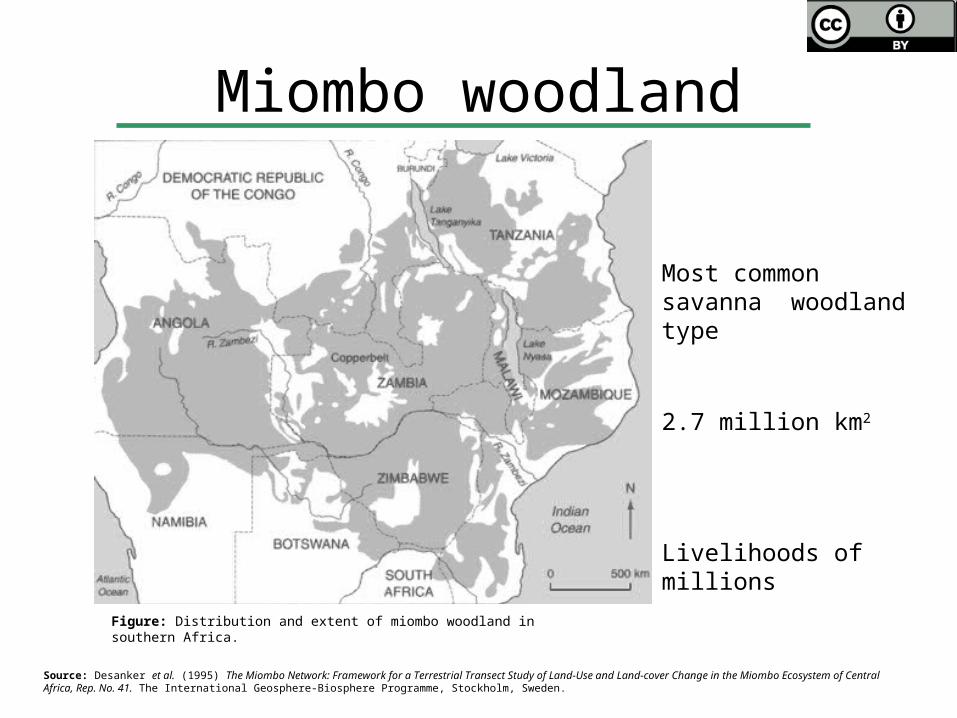
Miombo woodland
Figure: Distribution and extent of miombo woodland in southern Africa.
Source: Desanker et al. (1995) The Miombo Network: Framework for a Terrestrial Transect Study of Land-Use and Land-cover Change in the Miombo Ecosystem of Central Africa, Rep. No. 41. The International Geosphere-Biosphere Programme, Stockholm, Sweden.
Most common savanna woodland type
2.7 million km2
Livelihoods of millions

Photo: Casey Ryan
Brachystegia, Julbernardia & Isoberlinia
C4 grasses
Seasonally dry deciduous woodlands
Highly spatially heterogeneous
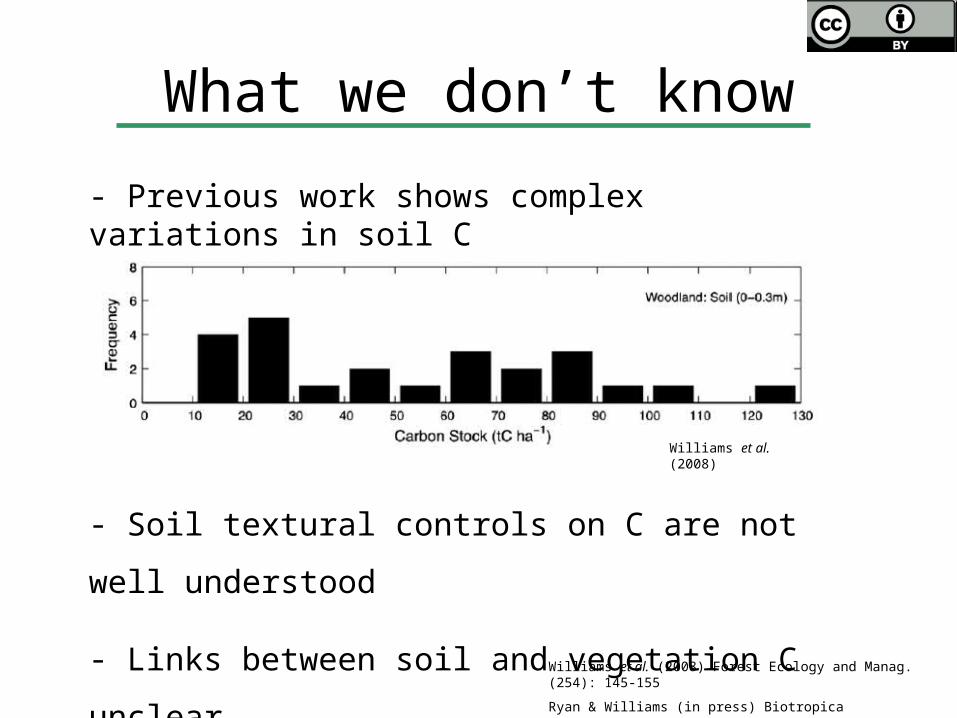
What we don’t know
- Previous work shows complex variations in soil C
- Soil textural controls on C are not well understood
- Links between soil and vegetation C unclear
Williams et al. (2008) Forest Ecology and Manag. (254): 145-155
Ryan & Williams (in press) Biotropica
Williams et al. (2008)

1) How do C stocks in soils and vegetation vary across miombo woodland landscapes?
2) To what degree and at what scales are these stocks linked?
Key questions
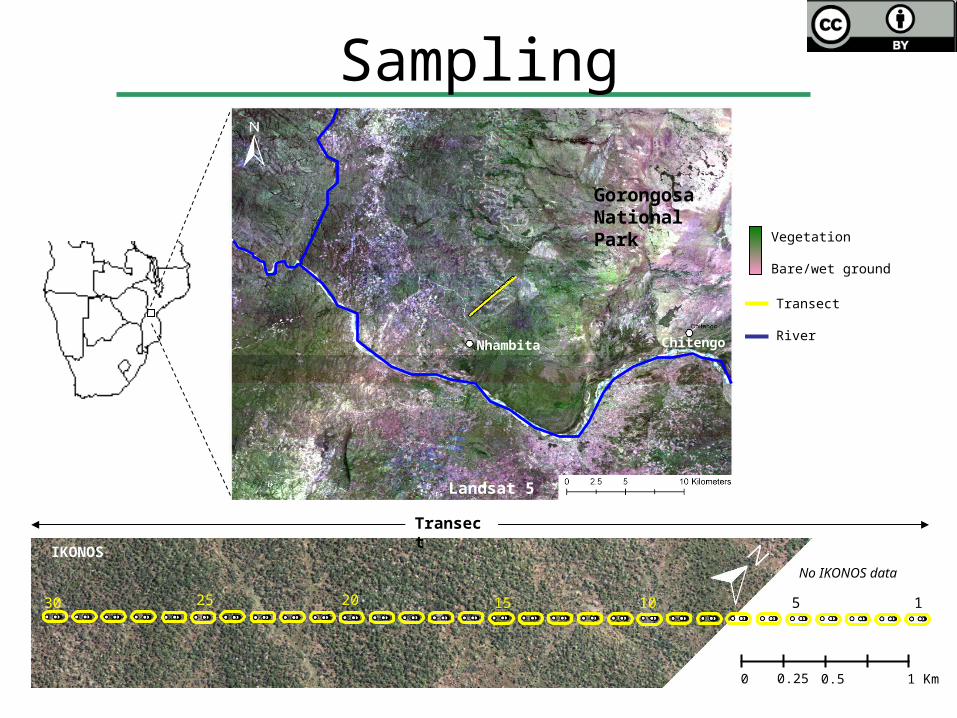
Transect
River
No IKONOS data
15 102025 5
Transect
Vegetation
Bare/wet ground
IKONOS
0 0.5 1 Km0.25
130
Nhambita Chitengo
Gorongosa National Park
Landsat 5 TM
Sampling

Cyclic Sampling
Transect continues
314 m2
1 m2
25 m radius
3 m
10m radius
25 m 50 m
9 m
0.57 ha
314 m21 m2
Fine scale- Soil 5 cm- Soil 30 cm- Litter
Medium scale- Leaf area index- Soil texture- AGB > 5 cm
Coarse scale- AGB > 30 cm- Grass biomass
100 m100 m 100 m
One cycle 75 m

Vegetation trends

Soil trends

Spatial dependence (fine scale)
Range = 14 m Range = 26 m
Range = 17 m
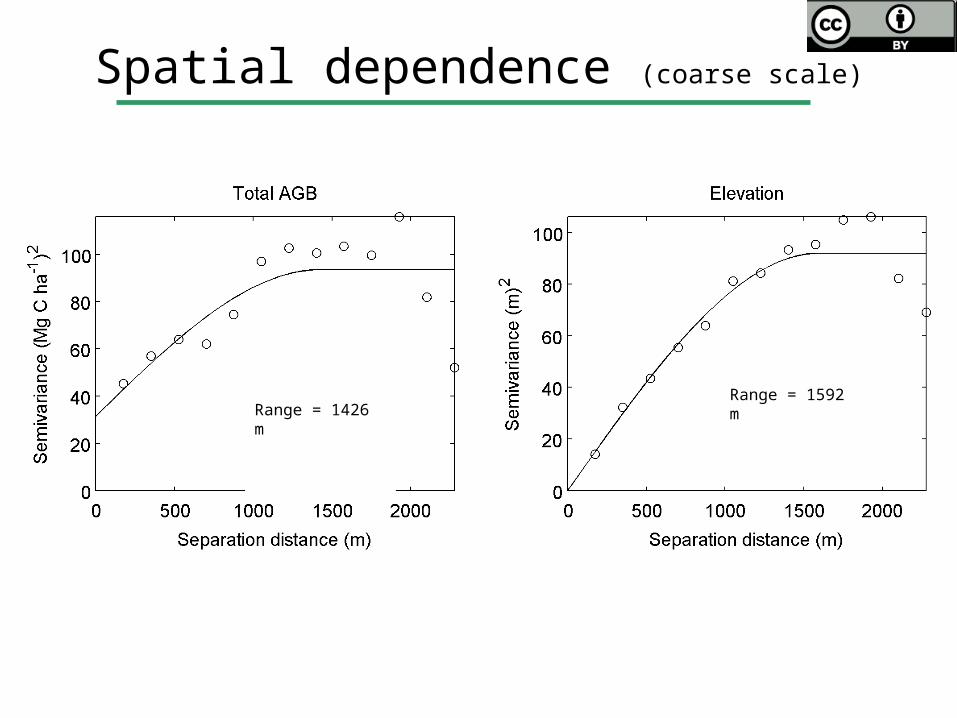
Spatial dependence (coarse scale)
Range = 1426 mRange = 1592 m
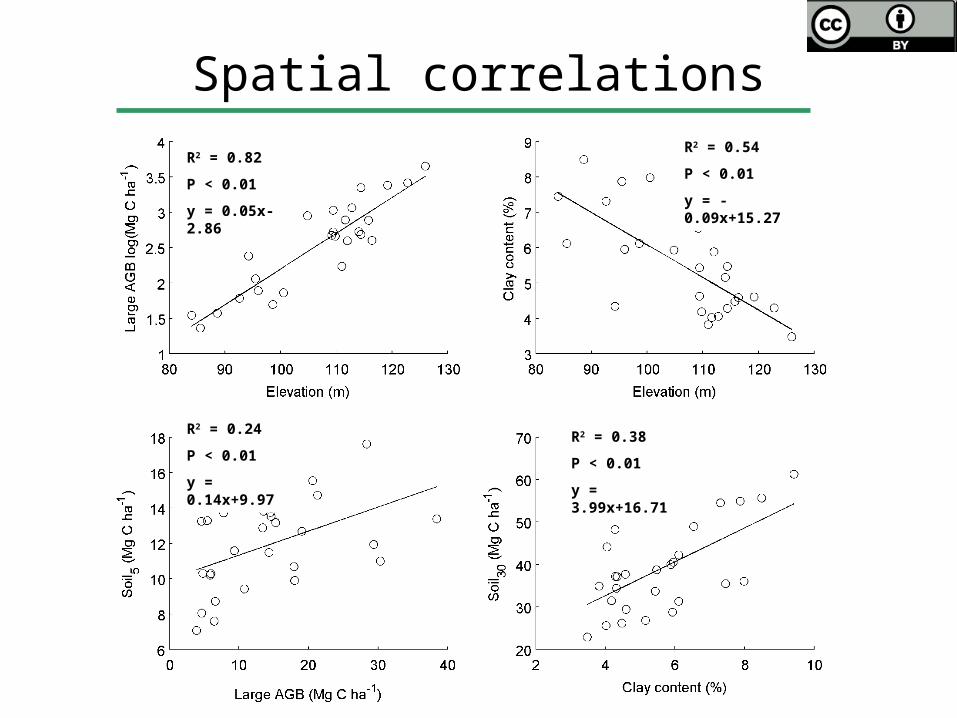
Spatial correlations
R2 = 0.82
P < 0.01
y = 0.05x-2.86
R2 = 0.54
P < 0.01
y = - 0.09x+15.27
R2 = 0.24
P < 0.01
y = 0.14x+9.97
R2 = 0.38
P < 0.01
y = 3.99x+16.71

Spatial correlations
Quantile regression Linear regression
P < 0.01

Impermeable horizon
Seasonally Saturated horizon
Higher LAI
Greater woody biomass volumes
10 -100s meters
Clay and particle
transport
Less woody biomass volumes
Greater soil C in the top 0.05 m
Conceptual model
Coarse textured soil
Less soil C in the deeper 0.3 m
Fine textured soil Greater soil C in the deeper 0.3 m
Less litter
Less soil C in the top 0.05 m
MoreLitter
1 -1
0s m
Lower LAI
Microrelief controls C stock distributions
Differing bedrock and weathering processes

Acknowledgements:
Funding: Natural Environment Research Council
Logistical support: Envirotrade
Species identification: Meg Coates-Palgrave
Field assistants: Albasine Mucavele, Alfonso Jornal, Ramaio Saimone, Neto Moulinho, Zito Lindo and Gary Goss
Contact: [email protected]