carbon stock estimation on the reclaimed forest of pt newmont … · carbon stock estimation on the...
TRANSCRIPT

Mine Closure 2012 — A.B. Fourie and M. Tibbett (eds) © 2012 Australian Centre for Geomechanics, Perth, ISBN 978-0-9870937-0-7
Contact author: H.N. Pollo; [email protected] Mine Closure 2012, Brisbane, Australia | 573
Carbon stock estimation on the reclaimed forest of PT Newmont
Minahasa Raya in Ratatotok, Southeast Minahasa
H.N. Pollo Forestry Sciences Study Programme, Faculty of Agriculture, Sam Ratulangi University, Indonesia
H.I. Mansur Faculty of Forestry, IPB, Indonesia
C.E.D. Sompie PT Newmont Minahasa Raya, Indonesia
J. Kojansow PT Newmont Minahasa Raya, Indonesia
Abstract
Describing the quality of forest ecosystems using a carbon sequestration approach is important in understanding global warming. From 1997 to 2010, PT Newmont Minahasa Raya (PTNMR) has reclaimed 215 ha bare land of ex-mining area. The area now has become a fully functioning forest ecosystem. The forest absorbs CO2 from the atmosphere and accumulates it into a living biomass. The aim of this study was to estimate carbon sink in the Ratatotok forest, an ex-mining area. The study observed: 1) species composition at the various stages of plant development; 2) tree height and diameter to estimate the standing biomass; 3) carbon content of the understorey species; 4) carbon content of the ground litters; and 5) soil carbon content. Carbon content measurement employed a loss on ignition method, while total carbon was estimated using existing allometric equations. This study was conducted in the reclaimed areas from six different years, i.e. 1997, 2000, 2001, 2002, 2003 and 2007. The results showed that between 1997 and 2007, the forests captured a total of 247 t carbon per ha, equivalent to a total sequestration of 53,180 t of carbon in the entire reclaimed area (215 ha).
1 Introduction
Reduction of forest cover is an important issue to combat global warming. As forest areas decrease, the capture of CO2 from the atmosphere is also lessened. Local programmes to increase CO2 capture from the atmosphere are essential to combat global warming. PTNMR has committed to reclaim 215 ha of bare land in an ex-mining area in Ratatotok, North Sulawesi, Indonesia, and to restore it to a fully functioning forested ecosystem (Figure 1).
Since rehabilitation, the vegetation has re-established and grown and the area has turned into a more natural ecosystem (Pollo et al., 2011). As trees planted on the area are continuing to grow and capture CO2 from the atmosphere, the forest has retained a certain carbon mass and a certain value of a growing carbon storage that sinks into its carbon pools. Hollinger (2008); Burton and Pregitzer (2008); and Scott and Brown (2008) defined carbon pools as standing trees, leaves, shrubs, litter fall, roots, soil. In order to know how much carbon is sequestered and stocked in the forest, research on carbon stock estimation is important and necessary.
2 Methodology
Field measurements were carried out on revegetated areas during 1997, 2000, 2001, 2002, 2003, and 2007 (referred to as Rec. 1997 to Rec. 2007). In each revegetated area, three different lines were determined as sampling transects. On each sampling transect, three quadrilateral sampling plots of 20 x 20 m were placed for data collecting purpose. All smaller plots were placed systematically at the beginning of the centre line in the plot of 20 x 20 m. There were 48 plots in total.
https://papers.acg.uwa.edu.au/p/1208_49_Pollo/

Carbon stock estimation on the reclaimed forest of PT Newmont Minahasa Raya in H.N. Pollo et al. Ratatotok, Southeast Minahasa
574 | Mine Closure 2012, Brisbane, Australia
Figure 1 Gold mining location of PTNMR in Ratatotok, Southeast Minahasa (source: PTNMR)
Five parameters are measured in the observation plots:
1. Species composition in various stages of plant development.
2. Tree height and its diameter for biomass calculation on standing trees.
3. Carbon content of understorey (seedlings and ground cover).
4. Carbon content of ground litter.
5. Carbon content of soil.
Tree species and plant life forms were directly identified in the field. The biomass of the standing trees was calculated using allometric equations based on tree diameter which was then multiplied by 0.47, a default fraction determined by McGroddy et al. (2004) to obtain a carbon fraction value. Carbon content of the understorey vegetation (seedlings and ground cover), ground litter, and on soil were analysed using loss on ignition, combusted in a muffle furnace at 360°C for 2 hours, and gravimetric methods (Heiri et al., 2001; Konen et al., 2002). All the work to obtain carbon fraction data was undertaken in the Soil Physics Laboratory of Faculty of Agriculture, Sam Ratulangi University, Indonesia.
2.1 Species composition at various stages of plant development
Species composition data were collected from quadrilateral plots which were systematically separated and adjusted directly in each transect. Stages of a plants life cycle consist of seedling, sapling, shrub and pole, and tree. Classification of each stage is as follows:
Seedlings were classified as herbaceous, semi-woody, and the tree species were identified by diameters ≤ 1 cm and/or height up to 1 m.
Sapling diameter was between 1–10 cm; height >1 m.
Shrubs and poles diameter was between 10–30 cm.
Tree diameter was > 30 cm (following Harlow et al., 1991).

Ecosystem reconstruction
Mine Closure 2012, Brisbane, Australia | 575
The plot size for the seedlings was 1 x 1 m, sapling was 5 x 5 m, shrub and pole was 10 x 10 m and trees were 20 x 20 m (Brower and Zar, 1984). All plants found in each plot were recorded and tabulated.
2.2 Tree height and diameter for biomass calculation on standing tree
The standing tree for biomass calculation was obtained from sapling, shrub and pole, and tree. The total height of tree was measured using a pole. Tree diameter was measured at breast height with a phi band. Recorded diameter data was then calculated using allometric equations to predict standing tree biomass in kg/ha or t/ha. The biomass value was multiplied by default carbon fraction of 0.47 to obtain carbon value in kg/ha or t/ha. Tropical forest typically contains approximately 47–50% carbon fraction deposited as terrestrial biomass (Brown, 1997; Eggleston et al., 2006; Chojnacky and Milton, 2008). By adding a time unit, forest productivity levels can be determined.
There are several allometric equations available for biomass calculation as summarised in Table 1.
Table 1 Allometric equations used for biomass calculation
No. Plant Species Equation Source
1 Paraserienthes falcataria
YAG = 0.3196 D1.9834
YR = 0.0069 D2.5651
Krisnawati et al. (2011)
2 Swietenia macrophylla
YS = 0.044D2.61
YB = 0.00059D3.46
YT = 0.0027D2.42
YSt = 0.022D1.96
YL = 0.0138D1.93
YTot = 0.048D2.68
Adinugroho and Sidiyasa (2006)
3 Gmelina arborea Y = 0.153 x D2.217 Banaticla et al. (2005)
4 Leucaena leucocephala
Y = 0.206 x D2.305 Banaticla et al. (2005)
5 Tectona grandis Y = 0.153 x D2.382 Penman et al. (2003)
6 Tree fern AGB = -4266348/(1-2792284 exp(-0.313677 x H)) Tiepolo et al. (2002)
7 Root biomass density
YR = exp(-1.0587 + 0.8836 x in AGB) Cairns et al. (1997) in Sutaryo (2009)
8 Tropical Rain Forest Y = 13,2579 - 4,8945 x (D2) + 0.6713 x (D2) Brown et al. (1989)
Notes: Y = Biomass (kg), D = Diameter at Breast Height (cm), H = Height (m), YAG = Above Ground Biomass, YS = Stem Biomass, YB = Branch Biomass, YT = Twig Biomass, YSt = Stump Biomass, YL = Leaf Biomass, YTot = Total Above Ground Biomass.
2.3 Carbon content of understorey vegetation
Understorey vegetation consists of seedlings and ground cover plants. All understorey living plants, including their roots collected on each plot of 2 x 2 m, were combusted due to loss of ignition method. The gravimetric method showed that the carbon content of understorey vegetation indicated a loss of combusted mass.
2.4 Carbon content of ground litter
Ground litter data was collected on the same plot of 1 x 1 m on the seedling’s observation plot. Methods employed for carbon content calculation were similar to those that were applied to the understorey category.
Carbon stock estimation on the reclaimed forest of PT Newmont Minahasa Raya in H.N. Pollo et al. Ratatotok, Southeast Minahasa
576 | Mine Closure 2012, Brisbane, Australia
2.5 Carbon content of soil
Soil carbon content was obtained by combusting composite soil samples. The soil bulk density value was obtained by oven drying undisturbed soil samples at 105°C. Composite soil samples were taken from the field in depths of 0–10 cm, 10–20 cm, 20–30 cm. Undisturbed soil samples were taken in depths of 0–15 cm and 15–30 cm.
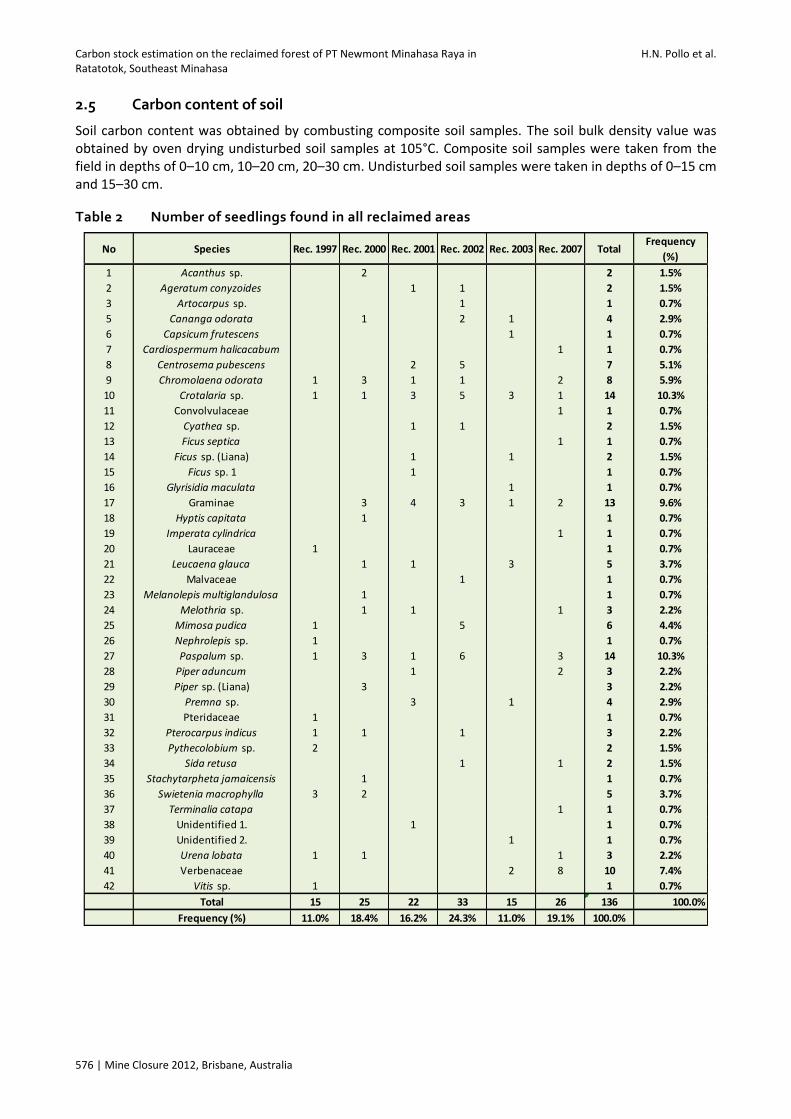
Table 2 Number of seedlings found in all reclaimed areas
Frequency
(%)
1 Acanthus sp. 2 2 1.5%
2 Ageratum conyzoides 1 1 2 1.5%
3 Artocarpus sp. 1 1 0.7%
5 Cananga odorata 1 2 1 4 2.9%
6 Capsicum frutescens 1 1 0.7%
7 Cardiospermum halicacabum 1 1 0.7%
8 Centrosema pubescens 2 5 7 5.1%
9 Chromolaena odorata 1 3 1 1 2 8 5.9%
10 Crotalaria sp. 1 1 3 5 3 1 14 10.3%
11 Convolvulaceae 1 1 0.7%
12 Cyathea sp. 1 1 2 1.5%
13 Ficus septica 1 1 0.7%
14 Ficus sp. (Liana) 1 1 2 1.5%
15 Ficus sp. 1 1 1 0.7%
16 Glyrisidia maculata 1 1 0.7%
17 Graminae 3 4 3 1 2 13 9.6%
18 Hyptis capitata 1 1 0.7%
19 Imperata cylindrica 1 1 0.7%
20 Lauraceae 1 1 0.7%
21 Leucaena glauca 1 1 3 5 3.7%
22 Malvaceae 1 1 0.7%
23 Melanolepis multiglandulosa 1 1 0.7%
24 Melothria sp. 1 1 1 3 2.2%
25 Mimosa pudica 1 5 6 4.4%
26 Nephrolepis sp. 1 1 0.7%
27 Paspalum sp. 1 3 1 6 3 14 10.3%
28 Piper aduncum 1 2 3 2.2%
29 Piper sp. (Liana) 3 3 2.2%
30 Premna sp. 3 1 4 2.9%
31 Pteridaceae 1 1 0.7%
32 Pterocarpus indicus 1 1 1 3 2.2%
33 Pythecolobium sp. 2 2 1.5%
34 Sida retusa 1 1 2 1.5%
35 Stachytarpheta jamaicensis 1 1 0.7%
36 Swietenia macrophylla 3 2 5 3.7%
37 Terminalia catapa 1 1 0.7%
38 Unidentified 1. 1 1 0.7%
39 Unidentified 2. 1 1 0.7%
40 Urena lobata 1 1 1 3 2.2%
41 Verbenaceae 2 8 10 7.4%
42 Vitis sp. 1 1 0.7%
Total 15 25 22 33 15 26 136 100.0%
Frequency (%) 11.0% 18.4% 16.2% 24.3% 11.0% 19.1% 100.0%
Rec. 2003 Rec. 2007 TotalNo Species Rec. 1997 Rec. 2000 Rec. 2001 Rec. 2002
Ecosystem reconstruction
Mine Closure 2012, Brisbane, Australia | 577
3 Results and discussion
3.1 Species composition at various stages of plant development
3.1.1 Seedlings
Table 2 lists the numbers of seedlings found during field observations. Based on this table, there were several seedling species growing on the same environment to fill the ecological niche. There were at least six plant species found during the observation: creepers, weeds, planted ground covers, shading tree, lianas and the sown plants. Of the 42 plant species found, some grew as weeds, some were planted for a specific purpose, and some species established themselves naturally. Most of them were dispersed into the area by a dispersal agent. One of the most abundant plants found was Crotalaria sp. that was sown specifically as ground cover vegetation.
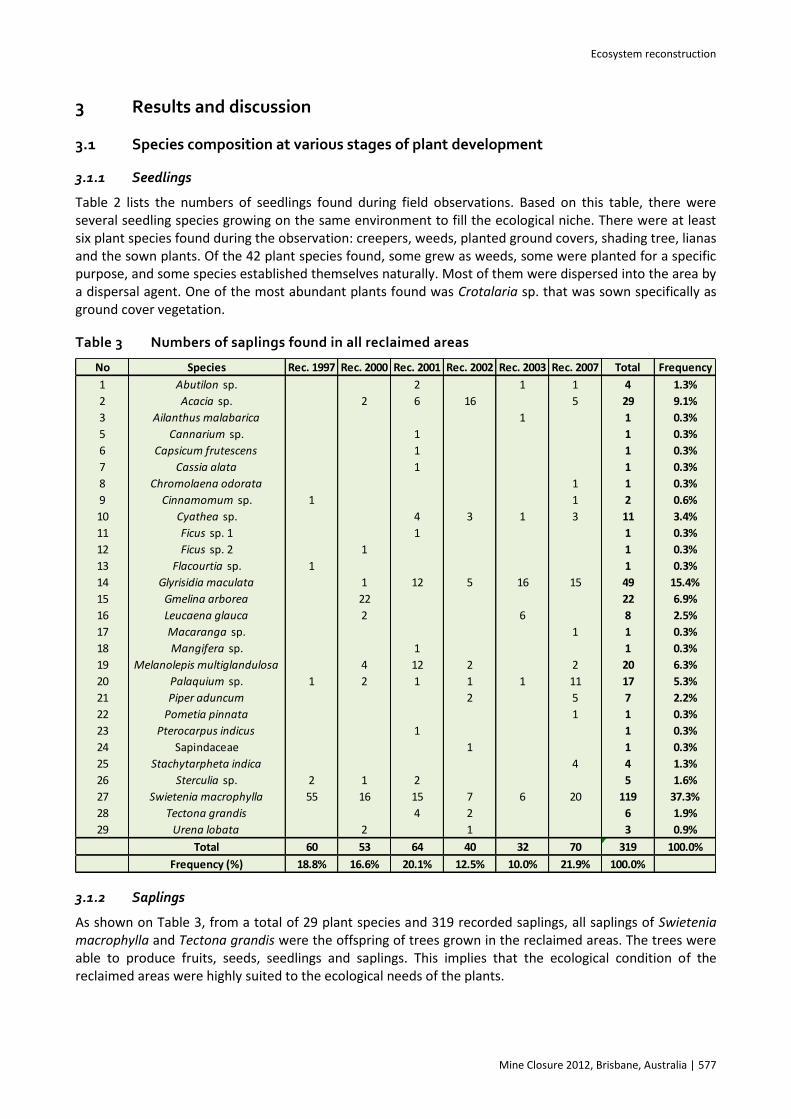
Table 3 Numbers of saplings found in all reclaimed areas
3.1.2 Saplings
As shown on Table 3, from a total of 29 plant species and 319 recorded saplings, all saplings of Swietenia macrophylla and Tectona grandis were the offspring of trees grown in the reclaimed areas. The trees were able to produce fruits, seeds, seedlings and saplings. This implies that the ecological condition of the reclaimed areas were highly suited to the ecological needs of the plants.
No Species Rec. 1997 Rec. 2000 Rec. 2001 Rec. 2002 Rec. 2003 Rec. 2007 Total Frequency
1 Abutilon sp. 2 1 1 4 1.3%
2 Acacia sp. 2 6 16 5 29 9.1%
3 Ailanthus malabarica 1 1 0.3%
5 Cannarium sp. 1 1 0.3%
6 Capsicum frutescens 1 1 0.3%
7 Cassia alata 1 1 0.3%
8 Chromolaena odorata 1 1 0.3%
9 Cinnamomum sp. 1 1 2 0.6%
10 Cyathea sp. 4 3 1 3 11 3.4%
11 Ficus sp. 1 1 1 0.3%
12 Ficus sp. 2 1 1 0.3%
13 Flacourtia sp. 1 1 0.3%
14 Glyrisidia maculata 1 12 5 16 15 49 15.4%
15 Gmelina arborea 22 22 6.9%
16 Leucaena glauca 2 6 8 2.5%
17 Macaranga sp. 1 1 0.3%
18 Mangifera sp. 1 1 0.3%
19 Melanolepis multiglandulosa 4 12 2 2 20 6.3%
20 Palaquium sp. 1 2 1 1 1 11 17 5.3%
21 Piper aduncum 2 5 7 2.2%
22 Pometia pinnata 1 1 0.3%
23 Pterocarpus indicus 1 1 0.3%
24 Sapindaceae 1 1 0.3%
25 Stachytarpheta indica 4 4 1.3%
26 Sterculia sp. 2 1 2 5 1.6%
27 Swietenia macrophylla 55 16 15 7 6 20 119 37.3%
28 Tectona grandis 4 2 6 1.9%
29 Urena lobata 2 1 3 0.9%
Total 60 53 64 40 32 70 319 100.0%
Frequency (%) 18.8% 16.6% 20.1% 12.5% 10.0% 21.9% 100.0%
Carbon stock estimation on the reclaimed forest of PT Newmont Minahasa Raya in H.N. Pollo et al. Ratatotok, Southeast Minahasa
578 | Mine Closure 2012, Brisbane, Australia
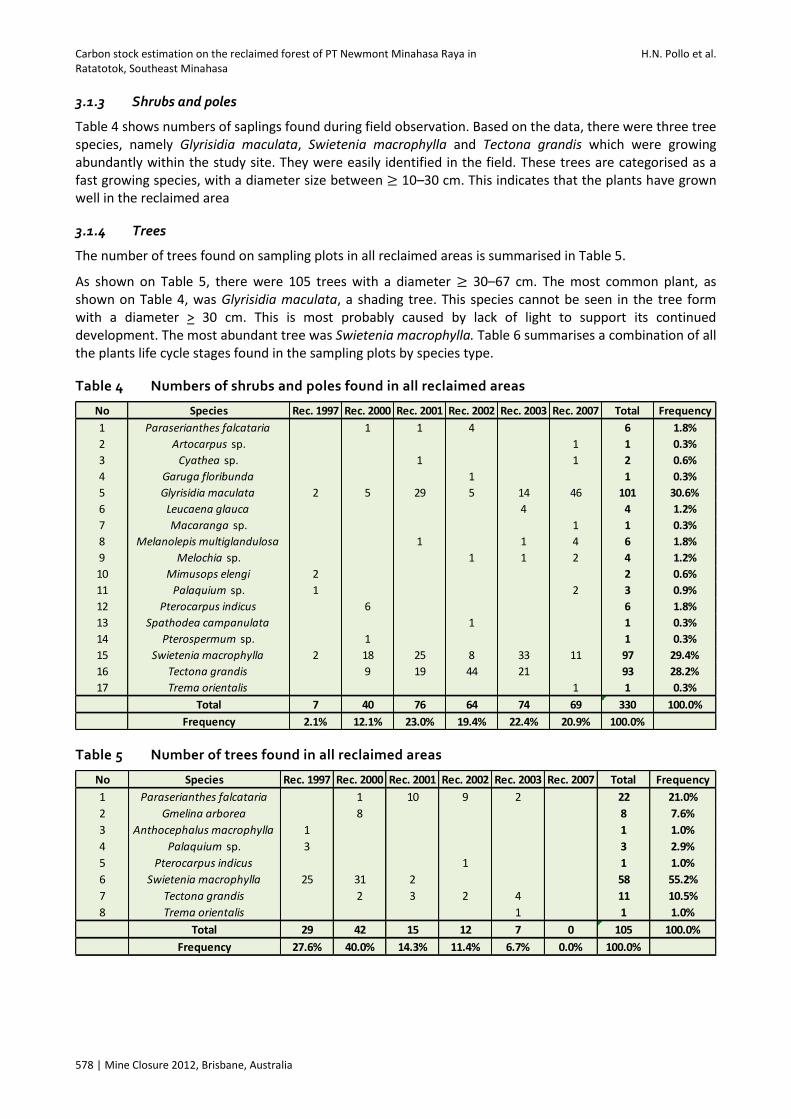
3.1.3 Shrubs and poles
Table 4 shows numbers of saplings found during field observation. Based on the data, there were three tree species, namely Glyrisidia maculata, Swietenia macrophylla and Tectona grandis which were growing abundantly within the study site. They were easily identified in the field. These trees are categorised as a fast growing species, with a diameter size between ≥ 10–30 cm. This indicates that the plants have grown well in the reclaimed area
3.1.4 Trees
The number of trees found on sampling plots in all reclaimed areas is summarised in Table 5.
As shown on Table 5, there were 105 trees with a diameter ≥ 30–67 cm. The most common plant, as shown on Table 4, was Glyrisidia maculata, a shading tree. This species cannot be seen in the tree form with a diameter > 30 cm. This is most probably caused by lack of light to support its continued development. The most abundant tree was Swietenia macrophylla. Table 6 summarises a combination of all the plants life cycle stages found in the sampling plots by species type.
Table 4 Numbers of shrubs and poles found in all reclaimed areas
Table 5 Number of trees found in all reclaimed areas
No Species Rec. 1997 Rec. 2000 Rec. 2001 Rec. 2002 Rec. 2003 Rec. 2007 Total Frequency
1 Paraserianthes falcataria 1 1 4 6 1.8%
2 Artocarpus sp. 1 1 0.3%
3 Cyathea sp. 1 1 2 0.6%
4 Garuga floribunda 1 1 0.3%
5 Glyrisidia maculata 2 5 29 5 14 46 101 30.6%
6 Leucaena glauca 4 4 1.2%
7 Macaranga sp. 1 1 0.3%
8 Melanolepis multiglandulosa 1 1 4 6 1.8%
9 Melochia sp. 1 1 2 4 1.2%
10 Mimusops elengi 2 2 0.6%
11 Palaquium sp. 1 2 3 0.9%
12 Pterocarpus indicus 6 6 1.8%
13 Spathodea campanulata 1 1 0.3%
14 Pterospermum sp. 1 1 0.3%
15 Swietenia macrophylla 2 18 25 8 33 11 97 29.4%
16 Tectona grandis 9 19 44 21 93 28.2%
17 Trema orientalis 1 1 0.3%
Total 7 40 76 64 74 69 330 100.0%
Frequency 2.1% 12.1% 23.0% 19.4% 22.4% 20.9% 100.0%
No Species Rec. 1997 Rec. 2000 Rec. 2001 Rec. 2002 Rec. 2003 Rec. 2007 Total Frequency
1 Paraserianthes falcataria 1 10 9 2 22 21.0%
2 Gmelina arborea 8 8 7.6%
3 Anthocephalus macrophylla 1 1 1.0%
4 Palaquium sp. 3 3 2.9%
5 Pterocarpus indicus 1 1 1.0%
6 Swietenia macrophylla 25 31 2 58 55.2%
7 Tectona grandis 2 3 2 4 11 10.5%
8 Trema orientalis 1 1 1.0%
Total 29 42 15 12 7 0 105 100.0%
Frequency 27.6% 40.0% 14.3% 11.4% 6.7% 0.0% 100.0%

Ecosystem reconstruction
Mine Closure 2012, Brisbane, Australia | 579
Table 6 Numbers of plant life forms found in all reclaimed areas
No Species Rec. 1997 Rec. 2000 Rec. 2001 Rec. 2002 Rec. 2003 Rec. 2007 Total Frequency
1 Abutilon sp. 1 1 1 3 1.6%
2 Acacia sp. 1 1 1 1 4 2.1%
3 Acanthus sp. 1 1 0.5%
4 Ageratum conyzoides 1 1 2 1.0%
5 Ailanthus malabarica 1 1 0.5%
6 Anthocephalus macrophylla 1 1 0.5%
7 Artocarpus sp. 1 1 2 1.0%
8 Cananga odorata 1 1 1 3 1.6%
9 Cannarium sp. 1 1 0.5%
10 Capsicum frutescens 1 1 2 1.0%
11 Cardiospermum halicacabum 1 1 0.5%
12 Cassia alata 1 1 0.5%
13 Centrosema pubescens 1 1 2 1.0%
14 Chromolaena odorata 1 1 1 1 2 6 3.1%
15 Cinnamomum sp. 1 1 2 1.0%
16 Crotalaria sp. 1 1 1 1 1 1 6 3.1%
17 Convolvulaceae 1 1 0.5%
18 Cyathea sp. 3 2 1 2 8 4.1%
19 Ficus septica 1 1 0.5%
20 Ficus sp. (Liana) 1 1 2 1.0%
21 Ficus sp. 1 2 2 1.0%
22 Ficus sp. 2 1 1 0.5%
23 Flacourtia sp. 1 1 0.5%
24 Garuga floribunda 1 1 0.5%
25 Glyrisidia maculata 1 2 2 2 3 2 12 6.2%
26 Gmelina arborea 2 2 1.0%
27 Graminae 1 1 1 1 1 5 2.6%
28 Hyptis capitata 1 1 0.5%
29 Imperata cylindrica 1 1 0.5%
30 Lauraceae 1 1 0.5%
31 Leucaena glauca 2 1 3 6 3.1%
32 Macaranga sp. 2 2 1.0%
33 Malvaceae 1 1 0.5%
34 Mangifera sp. 1 1 0.5%
35 Melanolepis multiglandulosa 2 2 1 1 2 8 4.1%
36 Melochia sp. 1 1 1 3 1.6%
37 Melothria sp. 1 1 1 3 1.6%
38 Mimosa pudica 1 1 2 1.0%
39 Mimusops elengi 1 1 0.5%
40 Nephrolepis sp. 1 1 0.5%
41 Palaquium sp. 3 1 1 1 1 2 9 4.7%
42 Paraserianthes falcataria 2 2 2 1 7 3.6%
43 Paspalum sp. 1 1 1 1 1 5 2.6%
44 Piper aduncum 1 1 2 4 2.1%
45 Piper sp. (Liana) 1 1 0.5%
46 Pometia pinnata 1 1 0.5%
47 Premna sp. 1 1 2 1.0%
48 Pteridaceae 1 1 0.5%
49 Pterocarpus indicus 1 2 1 2 6 3.1%
50 Pterospermum sp. 1 1 0.5%
51 Pythecolobium sp. 2 2 1.0%
52 Sapindaceae 1 1 0.5%
53 Sida retusa 1 1 2 1.0%
54 Spathodea campanulata 1 1 0.5%
55 Stachytarpheta indica 1 1 0.5%
56 Stachytarpheta jamaicensis 1 1 0.5%
57 Sterculia sp. 1 1 1 3 1.6%
58 Swietenia macrophylla 4 4 3 2 2 2 17 8.8%
59 Tectona grandis 2 3 3 2 10 5.2%
60 Terminalia catapa 1 1 0.5%
61 Trema orientalis 1 1 2 1.0%
62 Unidentified 1. 1 1 0.5%
63 Unidentified 2. 1 1 0.5%
64 Urena lobata 1 2 1 1 5 2.6%
65 Verbenaceae 1 1 2 1.0%
66 Vitis sp. 1 1 0.5%
Total 25 35 38 33 26 36 193 100.0%
Frequency 13.0% 18.1% 19.7% 17.1% 13.5% 18.7% 100.0%

Carbon stock estimation on the reclaimed forest of PT Newmont Minahasa Raya in H.N. Pollo et al. Ratatotok, Southeast Minahasa
580 | Mine Closure 2012, Brisbane, Australia
Table 6 Numbers of plant life forms found in all reclaimed areas continued...
As shown on Table 6, from the 66 plant species found in all sampling plots, there were four common species namely, Crotalaria sp., Glyrisidia maculata, Palaquium sp. and Swietenia macrophylla. Crotalaria sp. is a species used as a ground cover to protect bare soil from erosion. This pioneer species was planted while waiting for other tree species to form a forested area. Glyrisidia maculata was planted to serve as a shading tree to reduce sunlight intensity. This species was also planted to create suitable microclimate surrounding each main tree to allow the trees to cover the reclaimed areas. Palaquium sp. and Swietenia macrophylla were planted as the main tree vegetation in the reclaimed area.
3.2 Carbon content of standing trees
Table 7 shows that there were 753 trees with diameter ≥ 10–67 cm on a combined total of 19,200 m2 of sampling plots. If the value was converted to numbers of trees per ha, then the total number of trees per ha is 392, or 84,280 trees in an area of 215 ha. This number of trees in a commercial plantation would be considered of reasonable economic value. The biggest average tree diameter was found in the plots located in the reclaimed year of 2000. Since it was located on a hilly area, it was different from the branching free trees found on the 2002 reclaimed area which is situated on flat ground and where, on average, the tree growth reached 3.63 m. In general, the location of the tree considerably influenced its growth quality.
As shown on Table 7, there were six tree species which reached a diameter corresponding to the largest growth stage. These are considered fast growing species. Anthocephalus macrophyllus and Trema orientalis naturally invaded the reclaimed areas with an annual growth increment of 4.45 and 3.7 cm/year, respectively. The fastest growth increment was found in Paraserianthes falcataria with 5.18 cm/year during 2003.
Table 8 summarises the biomass and carbon contents in kg/ha on roots and standing trees.
As shown on Table 8, an average sum of root and standing carbon content was 240,513 kg/ha. In general, carbon content of the reclaimed forest of year 2000 was the highest compared to the others. It was even higher than the trees planted in 1997. This fits with the above explanation.
Based on research done in Indonesia by Dharmawan and Siregar (2009) in Masripatin et al. (2010), and Samsoedin et al. (2009) in Masripatin et al. (2010), above ground carbon stock in a natural lowland tropical rainforest with a diameter at breast height ranging from 7–70 cm was 230.10–264.70 t/ha. This research found that the standing stock biomass was 435,326 kg/ha or 204,603 kg/ha of carbon or 205 t/ha of carbon which indicated that the reclaimed forest functions similar to that of a natural forest.
No Species Rec. 1997 Rec. 2000 Rec. 2001 Rec. 2002 Rec. 2003 Rec. 2007 Total Frequency
1 Abutilon sp. 1 1 1 3 1.6%
2 Acacia sp. 1 1 1 1 4 2.1%
3 Acanthus sp. 1 1 0.5%
4 Ageratum conyzoides 1 1 2 1.0%
5 Ailanthus malabarica 1 1 0.5%
6 Anthocephalus macrophylla 1 1 0.5%
7 Artocarpus sp. 1 1 2 1.0%
8 Cananga odorata 1 1 1 3 1.6%
9 Cannarium sp. 1 1 0.5%
10 Capsicum frutescens 1 1 2 1.0%
11 Cardiospermum halicacabum 1 1 0.5%
12 Cassia alata 1 1 0.5%
13 Centrosema pubescens 1 1 2 1.0%
14 Chromolaena odorata 1 1 1 1 2 6 3.1%
15 Cinnamomum sp. 1 1 2 1.0%
16 Crotalaria sp. 1 1 1 1 1 1 6 3.1%
17 Convolvulaceae 1 1 0.5%
18 Cyathea sp. 3 2 1 2 8 4.1%
19 Ficus septica 1 1 0.5%
20 Ficus sp. (Liana) 1 1 2 1.0%
21 Ficus sp. 1 2 2 1.0%
22 Ficus sp. 2 1 1 0.5%
23 Flacourtia sp. 1 1 0.5%
24 Garuga floribunda 1 1 0.5%
25 Glyrisidia maculata 1 2 2 2 3 2 12 6.2%
26 Gmelina arborea 2 2 1.0%
27 Graminae 1 1 1 1 1 5 2.6%
28 Hyptis capitata 1 1 0.5%
29 Imperata cylindrica 1 1 0.5%
30 Lauraceae 1 1 0.5%
31 Leucaena glauca 2 1 3 6 3.1%
32 Macaranga sp. 2 2 1.0%
33 Malvaceae 1 1 0.5%
34 Mangifera sp. 1 1 0.5%
35 Melanolepis multiglandulosa 2 2 1 1 2 8 4.1%
36 Melochia sp. 1 1 1 3 1.6%
37 Melothria sp. 1 1 1 3 1.6%
38 Mimosa pudica 1 1 2 1.0%
39 Mimusops elengi 1 1 0.5%
40 Nephrolepis sp. 1 1 0.5%
41 Palaquium sp. 3 1 1 1 1 2 9 4.7%
42 Paraserianthes falcataria 2 2 2 1 7 3.6%
43 Paspalum sp. 1 1 1 1 1 5 2.6%
44 Piper aduncum 1 1 2 4 2.1%
45 Piper sp. (Liana) 1 1 0.5%
46 Pometia pinnata 1 1 0.5%
47 Premna sp. 1 1 2 1.0%
48 Pteridaceae 1 1 0.5%
49 Pterocarpus indicus 1 2 1 2 6 3.1%
50 Pterospermum sp. 1 1 0.5%
51 Pythecolobium sp. 2 2 1.0%
52 Sapindaceae 1 1 0.5%
53 Sida retusa 1 1 2 1.0%
54 Spathodea campanulata 1 1 0.5%
55 Stachytarpheta indica 1 1 0.5%
56 Stachytarpheta jamaicensis 1 1 0.5%
57 Sterculia sp. 1 1 1 3 1.6%
58 Swietenia macrophylla 4 4 3 2 2 2 17 8.8%
59 Tectona grandis 2 3 3 2 10 5.2%
60 Terminalia catapa 1 1 0.5%
61 Trema orientalis 1 1 2 1.0%
62 Unidentified 1. 1 1 0.5%
63 Unidentified 2. 1 1 0.5%
64 Urena lobata 1 2 1 1 5 2.6%
65 Verbenaceae 1 1 2 1.0%
66 Vitis sp. 1 1 0.5%
Total 25 35 38 33 26 36 193 100.0%
Frequency 13.0% 18.1% 19.7% 17.1% 13.5% 18.7% 100.0%

Ecosystem reconstruction
Mine Closure 2012, Brisbane, Australia | 581
Table 7 Averages of height, diameter and branch-free bole length of trees found on sampling plots
No. Area Σ Trees
Diameter (cm)
Height (m)
Branching Free (m)
Largest Diameter (cm)
Tallest (m)
1 Rec. 1997 96 14.02 8.37 2.37 67 (Anthocephalus macrophyllus)
30.25 (Palaquium sp.)
2 Rec. 2000 134 19.09 11.45 3.33 45.5 (Swietenia macrophylla)
26.5 (Gmelina arborea)
3 Rec. 2001 155 13.62 9.70 2.85 43.8 (Paraserianthes falcataria)
26 (Paraserianthes falcataria)
4 Rec. 2002 116 14.94 10.93 3.63 36 (Paraserianthes falcataria)
24.5 (Paraserianthes falcataria)
5 Rec. 2003 113 13.79 10.19 3.28 46.6 (Paraserianthes falcataria)
22 (Trema orientalis)
6 Rec. 2007 139 8.63 7.75 2.34 18.5 (Trema orientalis)
15.5 (Trema orientalis)
Total 753 84.09 58.39 17.81
Average 126 14.01 9.73 2.97
Table 8 Root and standing tree biomass and carbon content of standing trees
No. Area Width
(ha) Σ
Trees
Root Biomass (kg/ha)
Standing Biomass (kg/ha)
Σ Biomass (kg/ha)
Root to Standing Biomass
(%) Carbon (kg/ha)
Total Carbon
(t)
1 Rec. 1997 16.4 96 93,457 585,173 678,630 15.97 318,956 5,321
2 Rec. 2000 16.5 134 137,601 818,324 955,926 16.81 449,285 7,413
3 Rec. 2001 54.71 155 78,339 424,918 503,256 18.44 236,531 12,941
4 Rec. 2002 51.58 116 66,197 367,783 433,980 18.00 203,971 10,521
5 Rec. 2003 7.0 113 57,237 300,722 357,959 19.03 168,241 1,178
6 Rec. 2007 68.81 139 25,594 115,035 140,629 22.25 66,096 4,548
Total 215 753 458,424 2,611,955 3,070,380 110.50 1,443,078 41,831
Average 35.83 126 76,404 435,326 511,730 18.42 240,513 6,972
However to the contrary, the ratio between root and standing biomass was inverted, the younger the vegetation, the higher the value. This can be explained by the fact that soil formation is slower than that of root penetration into a deeper soil solum.
3.3 Carbon content of understorey
Table 8 shows an average sum of understorey carbon content of 240,513 kg/ha. As shown in the data, carbon content of understorey in 2007 was the highest. As this area was reclaimed within five years, the tree canopy had just started to grow. Therefore, there were still gaps among vegetation which allowed the sunlight to reach the forest floor. This created a niche for other plants to grow. Not surprisingly, the carbon content of this area was the lowest. The soil condition of this area was also poor as it had a high clay

Carbon stock estimation on the reclaimed forest of PT Newmont Minahasa Raya in H.N. Pollo et al. Ratatotok, Southeast Minahasa
582 | Mine Closure 2012, Brisbane, Australia
content. This affected the drainage and aeration. During the rainy season, the water inundates the area. Therefore, only plants that are tolerant to high moisture survive, especially during a long rainy season. Typically, weed plant species have a wide range of tolerance to this particular ecological condition.
Table 9 Carbon content of the understorey
No. Area Width
(ha) Dry Weight
(kg) Dry Weight
Average (kg) Dry Weight
(kg/ha) Total
Carbon (t)
1 Rec. 1997 16.4 0.83 0.275 2,750 45
2 Rec. 2000 16.5 1.81 0.2007 2,007 33
3 Rec. 2001 54.71 4.46 0.4955 4,955 271
4 Rec. 2002 51.58 5.74 0.6381 6,381 329
5 Rec. 2003 7 0.98 0.1087 1,087 8
6 Rec. 2007 68.81 8.69 0.9657 9,657 665
Total 215 22.5 2.68 26,837 1,531
Average 35.83 0.47 0.45 4,473 225
3.4 Carbon content of ground litter
Table 10 shows carbon content of the ground litter. Based on the data, an average sum of carbon content was 8,845 kg/ha. There were two areas producing high carbon content, the reclaimed areas of 1997 and 2002. These two areas had high litter decomposition as the vegetation had formed a dense canopy. The litters were produced primarily by a deciduous tree, Tectona grandis.
Table 10 Carbon content of the ground litter
No. Area Width
(ha) Dry Weight
(kg) Dry Weight
Average (kg) Dry Weight
(kg/ha) Total
Carbon (t)
1 Rec. 1997 16.4 4.03 1.3445 13,445 221
2 Rec. 2000 16.5 8.03 0.8917 8,917 147
3 Rec. 2001 54.71 6.25 0.6941 6,941 380
4 Rec. 2002 51.58 9.69 1.0769 10,769 556
5 Rec. 2003 7 6.61 0.7343 7,343 51
6 Rec. 2007 68.81 5.09 0.5653 5,653 389
Total 215 39.69 5.31 53,068 1,743
Average 35.83 6.62 0.88 8,845 291
3.5 Carbon content of soil
Based on the Table 11, the years with the highest dry weight were 1997 and 2007, when the average sum of soil carbon content was 46.38 and 41.52 kg/ha respectively.
The carbon distribution in tropical forest ecosystems is different to more temperate regions. The majority of carbon in the tropics is accumulated at the standing biomass, with only a small fraction found in the soil as a result of the more rapid decomposition in a tropical climate (Tasirin, 1994). In 1997 the high carbon content can be explained as a result of high soil retention in addition to the age of plants. High soil carbon
Ecosystem reconstruction
Mine Closure 2012, Brisbane, Australia | 583
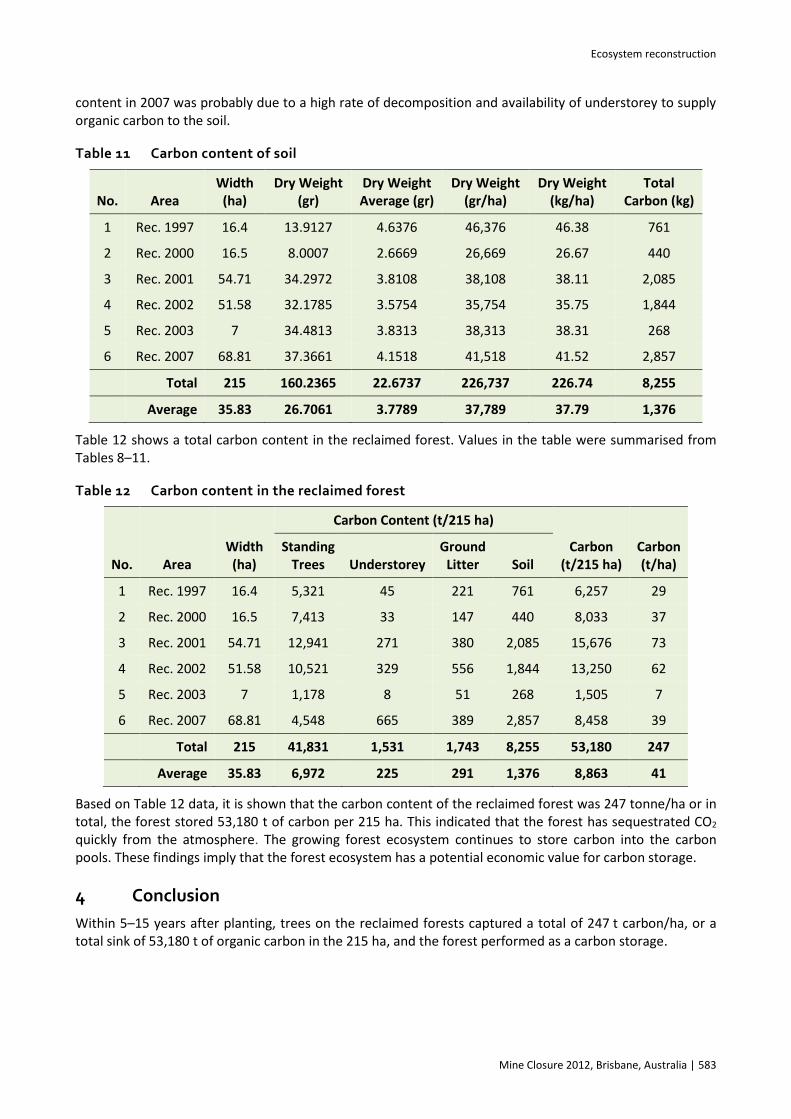
content in 2007 was probably due to a high rate of decomposition and availability of understorey to supply organic carbon to the soil.
Table 11 Carbon content of soil
No. Area Width
(ha) Dry Weight
(gr) Dry Weight Average (gr)
Dry Weight (gr/ha)
Dry Weight (kg/ha)
Total Carbon (kg)
1 Rec. 1997 16.4 13.9127 4.6376 46,376 46.38 761
2 Rec. 2000 16.5 8.0007 2.6669 26,669 26.67 440
3 Rec. 2001 54.71 34.2972 3.8108 38,108 38.11 2,085
4 Rec. 2002 51.58 32.1785 3.5754 35,754 35.75 1,844
5 Rec. 2003 7 34.4813 3.8313 38,313 38.31 268
6 Rec. 2007 68.81 37.3661 4.1518 41,518 41.52 2,857
Total 215 160.2365 22.6737 226,737 226.74 8,255
Average 35.83 26.7061 3.7789 37,789 37.79 1,376
Table 12 shows a total carbon content in the reclaimed forest. Values in the table were summarised from Tables 8–11.
Table 12 Carbon content in the reclaimed forest
No. Area Width
(ha)
Carbon Content (t/215 ha)
Carbon (t/215 ha)
Carbon (t/ha)
Standing Trees Understorey
Ground Litter Soil
1 Rec. 1997 16.4 5,321 45 221 761 6,257 29
2 Rec. 2000 16.5 7,413 33 147 440 8,033 37
3 Rec. 2001 54.71 12,941 271 380 2,085 15,676 73
4 Rec. 2002 51.58 10,521 329 556 1,844 13,250 62
5 Rec. 2003 7 1,178 8 51 268 1,505 7
6 Rec. 2007 68.81 4,548 665 389 2,857 8,458 39
Total 215 41,831 1,531 1,743 8,255 53,180 247
Average 35.83 6,972 225 291 1,376 8,863 41
Based on Table 12 data, it is shown that the carbon content of the reclaimed forest was 247 tonne/ha or in total, the forest stored 53,180 t of carbon per 215 ha. This indicated that the forest has sequestrated CO2 quickly from the atmosphere. The growing forest ecosystem continues to store carbon into the carbon pools. These findings imply that the forest ecosystem has a potential economic value for carbon storage.
4 Conclusion
Within 5–15 years after planting, trees on the reclaimed forests captured a total of 247 t carbon/ha, or a total sink of 53,180 t of organic carbon in the 215 ha, and the forest performed as a carbon storage.
Carbon stock estimation on the reclaimed forest of PT Newmont Minahasa Raya in H.N. Pollo et al. Ratatotok, Southeast Minahasa
584 | Mine Closure 2012, Brisbane, Australia
References
Adinugroho, W.C. and Sidiyasa, K. (2006) Model Pendugaan Biomassa Pohon Mahoni (Swietenia macrophyla King) di Atas Permukaan Tanah, Jurnal penelitian Hutan dan Konservasi Alam, Vol. III, No. 1, pp. 103–117.
Banaticla, M.R.N., Sales, R.F. and Lasco, R.D. (2005) Biomass Equations for Tropical Tree Plantation Species Using Secondary Data from the Philippines, in ACIAR Smallholder Forestry Project – Redevelopment of a Timber Industry Following Extensive Land Clearing: Proceedings from the End-of-Project Workshop, S.R. Harrison, J.L. Herbohn, Suh, Jungho, Mangaoang, Eduardo and J. Vanclay (eds), Ormoc City, Philippines, 19–21 August, 2004, pp. 113–128.
Brower, J.E. and Zar, J.A. (1984) Field and Laboratory Methods for General Ecology, 2nd edition, Wm. C. Brown Pub, Dubuque, Iowa, 226 p.
Brown, S. (1997) Estimating Biomass and Biomass Change of Tropical Forests: a Primer, (FAO Forestry Paper – 134), FAO, Rome, viewed 12 May 2012, http://www.fao.org/docrep/W4095E/W4095E00.htm.
Brown, S., Gillespie, A.J.R. and Lugo, A.E. (1989) Biomass Estimation Methods for Tropical Forests with Applications to Forest Inventory Data, Forest Science, The Society American Foresters, Vol. 35, No. 4, pp. 881–902.
Burton, A.J. and Pregitzer, K.S. (2008) Measuring Forest Floor, Mineral Soil, and Root Carbon Stocks, Part IV, in Field Measurements for Forest Carbon Monitoring: A Landscape-Scale Approach, C.M. Hoover (ed), Springer Science + Business Media B.V. (2008), Chapter 10, 240 p.
Chojnacky, D.C. and Milton, M. (2008) Measuring Carbon in Shrubs, Part II, in Field Measurements for Forest Carbon Monitoring: A Landscape-Scale Approach, C.M. Hoover (ed), Springer Science + Business Media B.V. (2008), Chapter 5, 240 p.
Eggleston, S., Buendia, L., Miwa, K. and Tanabe, K. (eds) (2006) IPPC Guidlines for National Greenhouse Gas Inventories, Vol. 4, Agriculture, Forestry and Other Land Use, The Institute for Global Environmental Strategies (IGES) for The Intergovernmental Panel on Climate Change (IPCC), Hayama, Kanagawa, Japan, 83 p.
Harlow, W.M., Harrar, E.S., Hardin, J.W. and White, F.M. (1991) Textbook of Dendrology, 7th Edition, McGraw-Hill Inc., Singapore, 501 p.
Heiri, O., Lotter, A.F. and Lemcke, G. (2001) Loss on Ignition as a Method for Estimating Organic and Carbonate Content in Sediments: Reproducibility and Comparability of Results, Journal of Paleolimnology, Kluwer Academic Publishers, The Netherlands, Vol. 25, pp. 101–110.
Hollinger, D.Y. (2008) Defining a Landscape-Scale Monitoring Tier for the North American Carbon Program, Part I, in Field Measurements for Forest Carbon Monitoring: A Landscape-Scale Approach, C.M. Hoover (ed), Springer Science + Business Media B.V. (2008), Chapter 1, 240 p.
Konen, M.E., Jacobs, P.M., Burras, C.L., Talaga, B.J. and Mason, J.A. (2002) Equations for Predicting Soil Organic Carbon Using Loss-On-Ignition for North Central U.S. Soils, Soil Science Society of America Journal, Vol. 66, pp. 1878–1881.
Krisnawati, H., Varis, E., Kallio, M. and Kanninen, M. (2011) Paraserienthes falcataria (L.) Nielsen: Ekologi, Silvikultur dan Produktivitas, Center for International Forestry Research, Bogor, Indonesia, 14 p.
Masripatin, N., Ginoga, K., Pari, G., Dharmawan, W.S., Siregar, C.A., Ari Wibowo, Puspasari, D., Utomo, A.S., Sakuntaladewi, N., Lugina, M., Indartik, Wulandari, W., Darmawan, S., Heryansah, I., Heriyanto, N.M., Siringoringo, H.H., Damayanti, R., Anggraeni, D., Krisnawati, H., Maryani, R., Apriyanto, D. and Subekti, B. (2010) Carbon Stocks of Various Types of Forest and Vegetation in Indonesia, Center for Climate Change and Policy Research and Development (Pusat Penelitian dan Pengembangan Perubahan Iklim dan Kebijakan), Bogor, Indonesia, 43 p.
McGroddy, M.E., Daufresne, T. and Hedin, L.O. (2004) Scaling of C:N:P stoichiometry in forests worldwide: Implications of terrestrial Redfield-type ratios, Ecology, Vol. 85(9), pp. 2390–2401.
Penman, J., Gytarsky, M., Hiraishi, T., Krug, T., Kruger, D., Riitta Pipatti, Buendia, L., Miwa, K., Ngara, T., Tanabe, K. and Wagner, F. (eds) (2003) Good Practice Guidance for Land Use, Land-Use Change and Forestry, IPCC National Greenhouse Gas Inventories Programme, The Institute for Global Environmental Strategies (IGES) for The Intergovernmental Panel on Climate Change (IPCC), Hayama, Kanagawa, Japan, 625 p.
Pollo, H.N., Sompie, D., Kojansow, J. and Mansur, H.I. (2011) Reclamation and Its Succession in the Used Mine Site of PT Newmont Minahasa Raya in Ratatotok, Southeast Minahasa – A Case Study, in Proceedings Sixth International Conference on Mine Closure (Mine Closure 2011), A.B. Fourie, M. Tibbett and A. Beersing (eds), 19–21 September 2011, Lake Louise, Canada, Australian Centre for Geomechanics, Perth, Vol. 1, pp. 281–290.
Scott, N.A. and Brown, S. (2008) Measuring the Decomposition of Down Dead-Wood, Part III, in Field Measurements for Forest Carbon Monitoring: A Landscape-Scale Approach, C.M. Hoover (ed), Springer Science + Business Media B.V. (2008), Chapter 9, 240 p.
Sutaryo, D. (2009) Penghitungan Biomassa: Sebuah Pengantar untuk Studi Karbon dan Perdagangan Karbon, Wetlands International Indonesia Programme, Bogor, 39 p.
Tasirin, J.S. (1994) The Role of Raspberry in Nutrient Cycling in a Successional Northern Hardwood Forest Ecosystem, Thesis, University of New Brunswick, Canada.
Tiepolo, G., Calmon, M. and Feretti, A.R. (2002) Measuring and Monitoring Carbon Stocks at the Guaraqueçaba Climate Action Project, Paraná, Brazil, International Symposium on Forest Carbon Sequestration and Monitoring, Taiwan Forestry Research Institute, Extension Series, No. 153, pp. 98–115.