carbon release from woody parts of trees along an
TRANSCRIPT

CARBON RELEASE FROM WOODY PARTS OF
TREES ALONG AN ELEVATION GRADIENT IN
A TROPICAL MONTANE MOIST FOREST OF
SOUTHERN ECUADOR
Dissertation
zur Erlangung des Doktorgrades
der Mathematisch-Naturwissenschaftlichen Fakultäten
der Georg-August-Universität zu Göttingen
vorgelegt von
Alexandra Zach
aus Coburg
Göttingen, im März 2008
GÖTTINGER ZENTRUM FÜR ÖKOLOGIE UND ÖKOSYSTEMFORSCHUNG
− GÖTTINGEN CENTRE FOR ECOLOGY AND ECOSYSTEM RESEARCH −

D7
Referent: Prof. Dr. Ch. Leuschner
Korreferent: apl. Prof. Dr. M. Kessler
Tag der mündlichen Prüfung: 30.April 2008

Meiner Familie

______________________________________________________________________ TABLE OF CONTENTS ______________________________________________________________________
1. Introduction 1
1.1 General introduction 2 Thesis aims & Structure 3 1.2 Plant respiration & Components 5 1.3 Forest – Atmosphere gas exchange 8 1.4 Study sites 11 1.5 References 14
2. Elevational change in woody tissue CO2 efflux in a tropical mountain forest in southern Ecuador 18
2.1 Abstract 19 2.2 Introduction 20 2.3 Materials & Methods 21
2.4 Results 26 2.5 Discussion 31 2.6 References 35
3. Diverging temperature response of tree stem CO2 efflux to dry and wet season conditions in a tropical montane moist forest 38
3.1 Abstract 39 3.2 Introduction 40 3.3 Materials & Methods 42 3.4 Results 46 3.5 Discussion 50 3.6 References 56
4. Wood CO2 efflux across an elevation transect in an Andean moist
forest: Seasonality, respiration components & stand level upscale 62 4.1 Abstract 63 4.2 Introduction 64 4.3 Materials & Methods 65 4.4 Results 69 4.5 Discussion 74 4.6 References 82

5. The C balance of three tropical montane forests, southern Ecuador
87
5.1 Introduction 88 5.2 Estimating C balance components of three tropical montane forests 89 5.3 The C balance of three tropical montane forests 94 5.4 References 99
6. Synthesis 101 6.1 Discussion of hypotheses 102 6.2 Concluding remarks 105
7. Summary 106 7.1 Summary 107 7.2 Zusammenfassung 109 7.3 Resumen 111
8. Appendix 1149. Acknowledgements 128
10. Curriculum vitae 129


Chapter 1
1
INTRODUCTION
1 Chapter

Introduction
2
1.1 General Introduction
With respect to carbon (C) fluxes, tropical montane forests (TMF) are among the least
studied terrestrial ecosystems (Brujinzeel and Veeneklaas 1998, Clark 2007). Covering an
area of 3.3 million km² globally or of 21.2% of the tropical forests worldwide (Bubb et al.
2004), TMFs extent along a large altitudinal zone (Jacobs 1988). The definition of the
lowland border of montane forests is vague and can vary between 750 and 1650 m elevation
(Jacobs 1988). Low canopy height, a high abundance of epiphytes and reduced amount of
woody climbers usually distinguish TMFs from tropical lowlands. TMFs are characterized by
high species diversity harbouring high numbers of endemic plants, which holds especially
true for the tropical Andes (Brummit and Lughadha 2003). At higher altitudes, TMFs change
into tropical montane cloud forests (TMCF) with their short-statured elfin forest vegetation.
Further upslope, TMCFs are often displaced by sparse and open páramo vegetation as the
upper limit.
Due to their large altitudinal extension, TMFs occur within a wide range of humidity
and temperature regimes. However, all TMFs are characterized by prevailing high
atmospheric humidity levels and a frequent cloud cover (Brujinzeel and Veeneklaas 1998).
With regard to structure and functionality, TMFs differ considerably from tropical lowland
forests. Most obvious is the marked decline in the aboveground biomass. The lower
aboveground productivity of TMFs compared to the tropical lowlands has frequently been
related to the lower radiation input, the lower air temperatures and the nutrient poor soils
(Tanner 1985, Brujinzeel and Veeneklaas 1998, Leuschner et al. 2007, Soethe et al. 2007,
Moser 2008). However, in contrast to tropical lowlands, but very similar to high latitude
forests, a substantial carbon allocation to the root system was found in TMFs with increasing
elevation (Brujinzeel and Veeneklaas 1998, Malhi et al. 1999, Moser et al. 2008). Our
understanding of this astonishing carbon shift in TMFs is still incomplete (Brujinzeel and
Veeneklaas 1998).
A comprehensive knowledge of the carbon allocation patterns in TMFs can not be
achieved without information on the two key processes controlling productivity: the
assimilatory CO2 uptake and the respiratory CO2 release of the forest ecosystem. Indirect
information about assimilatory capacity of TMFs is implied from more readily available
forest inventories with data on leaf area and productivity rates. Data on respiratory rates are
very scarce and for TMFs almost non-existing. The study of CO2 release from above- and

Chapter 1
3
belowground woody organs provides a convenient framework to assess the impact of altitude
and climatic fluctuations on the above- and belowground productivity of TMFs.
Thesis aims & structure
The main objective of the present study was to quantify CO2 losses from above- and
belowground woody organs (stems, coarse roots) of representative tropical montane tree
species in southern Ecuador. The study was conducted along a 2000-m elevation transect and
aimed to determine the impact of altitude and of seasonal climate variations on patters of CO2
release from functionally different woody organs of trees. The results will contribute to the
understanding of structure and functionality of TMFs as well as provide valuable data for
modeling the C dynamics of tropical ecosystems.
The following hypotheses have been tested in the context of this study:
(i) Apparent CO2 release from stems increases with increasing elevation from
1050 m to 3050 m.
Previous studies found that the aboveground biomass production declined by a factor
of 20 from 1050 m to 3050 m. At the same time, it is assumed that photosynthesis
does not decline proportionally. The question arises, if respiratory CO2 release is in
fact related to the decreasing temperature with increasing elevation, or if increasing
abiotic stress causes compensatory CO2 release from woody tissue at higher altitudes.
(ii) Apparent CO2 release from coarse roots increases with increasing elevation
from 1050 m to 3050 m.
The 5-fold increase in coarse root biomass production from 1050 m to 3050 m
reported in previous studies represents an enormous shift in carbon allocation. This
shift should be reflected in the overall respiratory activity of the coarse root system.
(iii) Apparent CO2 release rates from stems and coarse roots of TMFs at different
elevation levels remain constant through the year and do not show seasonality.
Based on the general assumption of a strong temperature-dependence of respiration, an
increase of respiratory activity with increasing ambient temperature should be
expected. However, mean monthly temperatures fluctuate little in the study area.
Additionally, tissue temperature of wood usually varies much less than air
temperature.
(iv) With increasing elevation, woody tissue respiration shows an increasing
relevance in the carbon balance of TMFs. At high elevations, maintenance
respiration from stems and growth respiration from roots are predominant.

Introduction
4
Based on hypothesis (i) and (ii), it is expected that the shift in biomass between above and
belowground components is reflected in the respiration rates at the stand level and in the
carbon balance of the TMFs.
The present study was embedded in the DFG- research unit FOR 402 “Functionality in
a tropical mountain rainforest: Diversity, dynamic processes and utilization potentials under
ecosystem perspectives” (www.bergregenwald.de). As part of an interdisciplinary research
project, the present study was closely linked to previous investigations conducted at the very
same study sites. Data about above- and belowground biomass stocks and biomass
productivity as well as detailed forest inventories (Moser 2008) could be used to estimate the
stand level carbon losses from woody tree organs. Information about soil and fine root
respiratory activity (Iost 2007) finally helped to derive first C-balances along the tropical
montane forest gradient in southern Ecuador.
This work consists of six main chapters: Chapter 1 provides general information about
plant respiration and forest gas exchange and gives an introduction of study area and sites.
Chapter 2 presents data on the variability in stem and coarse root respiration patterns
with respect to altitude. Changes in the relationship between above- and belowground
respiratory activity with increasing elevation are discussed.
Chapter 3 analyzes in further details the temperature response of stem respiration of
montane tree species at 1890 m elevation under dry and wet season conditions. Unlike
commonly expected, the changes in respiration could not be explained by differences in the
thermal regime of dry and wet season. This chapter points out that respiration is driven by
more factors than temperature alone and that diverging adaptation potentials of species might
play an important role in explaining respiratory reaction to abiotic fluctuations in a highly
diverse ecosystem.
Chapter 4 covers a whole annual cycle of respiration measurements along the
elevation gradient. A clear trend towards higher CO2 release under warmer and drier climate
conditions is shown for stems, but not for coarse roots. Changes in growth and maintenance
respiration of stems and roots with elevation are addressed and first estimates on the annual
stand carbon release of stem wood and roots are presented. Chapter 2-4 are formatted for
manuscript submission.
Chapter 5 provides a preliminary C balance of the three study sites along the elevation
gradient. Estimates are based on own measurements, literature data and previous forest
inventories and soil respiration data of the three study sites. Chapter 6 summarizes the
presented results and provides an overall discussion of hypotheses.

Chapter 1
5
1.2 Plant respiration & Components
1.2.1 Respiration in plants
Although of equal importance as photosynthetic CO2 assimilation, the respiratory CO2
release has received much less attention in the attempt to determine ecosystem productivity
(Chamber et al. 2004, Trumbore 2006). Photosynthesis is a distinct, light-dependent process
and restricted to chloroplast-containing plant organs. Respiration, in contrast, integrates
various disparate components; it is an omnipresent process, which never stops.
The respiratory activity of plants mainly comprises mitochondrial (dark-) respiration,
and photo-(light-) respiration; but also futile cycles such as the alternative pathway (cyanide-
resistant-oxidase or alternative-oxidase). In contrast to mitochondrial respiration,
photorespiration is a very specific process, which is closely linked to photosynthesis.
Therefore, photorespiration is restricted to chloroplast-containing tissue; it depends on
Rubisco, does not provide energy delivering products and it ceases by night. This study is
dedicated to mitochondrial respiration, which in the following is referred to as respiration.
At the biochemical level, respiration is defined as the CO2 release or O2 uptake
associated with the activity of glycolysis, the oxidative pentose phosphate pathway and the
tricarboxylic acid (TCA) cycle. The substrate of respiration is mainly glucose and energy
equivalents (ADP, Pi, NAD(P)+); the glycolysis may also start with other carbohydrates, fat or
sugar alcohols (Amthor 1994, Lambers et al. 2005). The product of respiration is energy
(ATP, NAD(P)H) to sustain plant life and growth. Plant respiration is thought to be controlled
by three processes: substrate availability, demand for energy and the potential enzyme
capacity (Amthor 1995, Lambers et al. 1998, Atkin et al. 2005).
However, plants sometimes respire using the alternative oxidase, which converts most
of the redox energy into heat, resulting in a much lower energy gain, but higher O2
consumption and CO2 loss than the mitochondrial respiration (Larcher 1998). Stress, injuries
or senescence of tissue is supposed to stimulate alternative respiration pathways, though the
significance and underlying mechanisms remain unclear (Larcher 1998, Lambers et al. 1998,
Lambers et al. 2005).
Plant respiration can consume between 25 and 80% of the daily assimilated
carbohydrates and hence represents an important factor in the plants´ carbon balance (Amthor
2000, Lambers et al. 2005).

Introduction
6
1.2.2 Growth & maintenance respiration
Over the past decades, respiration of plants has been partitioned into two major
components: growth and maintenance respiration. Maintenance respiration (Rm) is dedicated
to the plants´ processes for keeping the existing tissue and growth respiration (Rg) to the
processes for constructing new tissue (Amthor 1991). Rm is supposed to be strongly correlated
to the protein content of the plant. Since protein turnover and enzymatic activity is highly
temperature dependent Rm is thought to be more temperature-sensitive in contrast to the
temperature-independent Rg (Penning de Vries 1975a). Traditionally, the costs for new tissue
are calculated straightforward from tissue composition and the energy required for
constructing the components (Penning de Vries 1975b). Estimating maintenance requirements
is less clearly quantifiable and assumed to be mainly a function of temperature (Lavigne
1987), nitrogen content and the volume of the tissue (phloem and xylem) it supports (Ryan et
al. 1994).
However, the simplifications in the growth-maintenance-paradigm such as the
assumptions of constant growth rates, invariable costs of tissue or the N-dependence of Rm
have been frequently criticized (Van der Werf et al. 1992, Ryan et al. 1995, Lambers et al.
1998, Amthor 2000, Cannell and Thornley 2000, Thornley and Cannell 2000). Furthermore, it
is impossible to strictly separate the various energy demanding processes between the two
components. In this regard, the different processes, which comprise respiration (e.g. growth,
nutrient uptake, phloem loading, symbiotic N2 fixation) and the way, these processes are
partitioned among the two respiration components still require a more thorough understanding
(Cannell and Thornley 2000).
1.2.3 Respiration & temperature
Temperature has long been known to directly influence respiration (e.g. Amthor
1989). This influence was assumed to be exponential with a constant Q10 of respiration
ranging between 2.0 - 2.3 (e.g. Amthor 1989, Ryan 1991, Raich and Schlesinger 1992). The
Q10 of respiration is the factor expressing the proportional change in respiratory CO2 release
per 10K rise in temperature and is calculated from the formula (e.g. Atkin et al. 2005):
(1) Q10 = e10k
where k is the temperature coefficient derived from non-linear regression of respiration
plotted against temperature (or, alternatively, by linear regression of log-transformed
respiration plotted against temperature).

Chapter 1
7
Other studies have used the Arrhenius theory to describe the response of plant
respiration to temperature fluctuations (e.g. Crawford and Palin 1981, Lloyd and Taylor 1994,
Griffin et al. 2002). Here, log-transformed rates of respiration are plotted against the
reciprocal of temperature (1/T). In case of an exponential temperature-respiration relationship,
the regression should be strongly linear. The slope of the line is expressed as Ea/Rg, where Rg
is the universal gas constant (8.314 J mol-1 K-1) and Ea is the activation energy (J mol-1) for
the reaction (Forward 1960). The Arrhenius model is commonly used in physical chemistry to
calculate standard references of reactions. However, with regard to plant respiration this
theory incorporates a series of assumptions, which were usually not matched by a complex
physiological process such as respiration. Among these assumptions, the most critical are the
substrate saturation of the reaction, which rarely happen in intact tissue and the implication
that a single value of Ea fits to the various specific reactions respiration is composed of (Atkin
et al. 2005).
Strong respiration-temperature relationships with constant Q10 values were found
under certain controlled conditions (e.g. Maier et al. 1998, Tjoelker et al. 1999, Atkin et al.
2000, Tjoelker et al. 2001, Loveys et al. 2003, Armstrong et al. 2006, Atkin et al. 2006, Atkin
et al. 2007), while in the field, plant respiration responded neither constant nor necessarily
exponential to changes in temperature (e.g. Edwards and McLaughlin 1978, Negisi 1982,
Lavigne 1987, Gunderson et al. 2000, Teskey and McGuire 2002). Until now, neither the Q10
model nor the Arrhenius theory has been able to describe the highly variable response of
respiration to changes in temperature under field conditions (Tjoelker et al. 2001, Atkin and
Tjoelker 2003, Atkin et al. 2005). The response of plant respiration to changes in
environmental conditions may be especially complex and far-reaching with respect to highly-
diverse tropical ecosystems. In this context, the impacts of global climate change on plant
respiratory activity urgently warrant further investigation.

Introduction
8
1.3 Forest – Atmosphere gas exchange
1.3.1 Forest ecosystems & CO2 exchange
Quantifying the carbon exchange between forests and the atmosphere is a major topic
of active research due to the key role terrestrial ecosystems play for the regulation of the
anthropogenic increase in atmospheric CO2 and the associated climatic changes. The CO2
exchange of forest ecosystems is driven by two large fluxes, the photosynthetic carbon
dioxide (CO2) assimilation of green tissue and the respiratory CO2 release of autotrophic and
heterotrophic organisms. Carbon balances commonly derived from two reversely operating
approaches – the so called top-down or bottom-up models. While the former is based on
calculations of net atmospheric CO2 fluxes, the latter comprises forest or land-use change
inventories. Since the processes and carbon pools included considerably differ among both
models, results upon the world’s carbon balance differ as well (Malhi et al. 1999).
Estimates on the global carbon budget revealed a gross fixation of 90 – 130 Pg C yr-1
(Bolin and Fung 1992), while soil respiration and the CO2 efflux from terrestrial plants
released 64 – 72 Pg C yr-1 (Raich and Schlesinger 1992) and 40 – 60 Pg C yr-1 (Bolin and
Fung 1992), respectively, back to the atmosphere. Compared with these large fluxes, the
contribution of anthropogenic disturbance to the atmospheric CO2 concentration is a relatively
small value (fossil fuel combustion 5.7 Gt; cement manufacturing 0.01 Gt; Land-use changes
3.5 Gt, http://www.whole-systems.org). Even small changes in one of the two major fluxes of
carbon fixation or respiration could alter the accumulation of CO2 in the atmosphere to a
much largely extent than small changes in the anthropogenic disturbance would do (Malhi
and Grace 2000). Consequently, it is especially challenging to reduce the large uncertainties,
which still exist concerning the magnitude of ecosystem fluxes and the fluxes from single
fractions the ecosystem is composed of.
The tropical forest biome, which encompasses moist equatorial evergreen lowlands,
moist deciduous, dry deciduous, montane forests and woody savannas accounts for 50% of
the global forest area (FAO 1993). In total, these biomes are estimated to annually sequester
42 Pg C in biomass, which equals c. 70% of global terrestrial photosynthesis. However,
terrestrial carbon emission and carbon sink terms have often been estimated as a residue of
the other components comprising the global carbon budget (Malhi and Grace 2000). Applied
ecological research increasingly focused on the quantification of total ecosystem CO2 release
1Pg (1Petagram) = 1015g=1Gt (Gigatonne)

Chapter 1
9
rates, which determine net ecosystem production (NEP). Consequently, estimating ecosystem
respiration is an important item to identify the carbon source or sink strength of different
terrestrial biomes (Malhi et al. 1999, Malhi and Grace 2000, Luyssaert et al. 2007).
1.3.2 Measuring forest CO2 exchange
Principally, two technical approaches are considered for determining the amount of
CO2 exchange: the eddy covariance technique and chamber measurements. The recently
developed eddy covariance (EC) method allows for a comprehensive measurement of CO2
exchange between large terrestrial areas and the atmosphere. EC is a high-technology,
equipment-intensive method, which facilitates the quantification of net CO2 fluxes entering
and leaving a system over temporally large scales (hourly to annually); highly elaborate, only
few studies have been conducted in tropical regions. In addition, for capturing atmospheric
CO2 this technique requires sustained high atmospheric turbulences within the system. An
accumulation of CO2 below the EC measurement height due to low turbulences has often
resulted in underestimates of ecosystem respiration especially during night-time, when
airstreams cease. This factor particularly constraints night-time measurements in tropical
forests (Grace et al. 1995, Malhi et al. 1999, Chambers et al. 2004).
While the EC technique provides valuable information about net exchange rates of the
ecosystem as a whole, chamber measurements on a spatially limited area allows for the
investigation of individual respiratory sources and hence, for a more physiological
interpretation of carbon fluxes (Amthor 2000). Generally, the impacts of important
environmental factors (e.g., temperature, humidity, radiation) can be deduced from net
changes in the entire flux, but it remains unknown, which ecosystem component is the
responsive one. Underlying mechanisms of flux dynamics and its driving forces can be better
understood by breaking the net flux down into flux subcomponents. Within a forest ecosystem
such components could comprise the two large ecosystem fluxes (heterotrophic and
autotrophic), functional groups (e.g., understory, trees, palms, lianas) or single plant organs
(e.g., leaves, branches, stems, roots). Information on the CO2 exchange patterns of various
components is crucial if we want to gain deeper insight into the physiologically meaningful
processes within a plant community and its plastic response to changing environmental
conditions.
Introduction
10
1.3.3 CO2 release from woody organs
The respiration of woody parts of trees (branches, stems, coarse roots) plays a
significant role for the carbon balance of forest ecosystems, since wood volume comprises a
large fraction of the total biomass and considerably increases when trees age (Ryan et al.
1994, Carey et al. 1997). In mature evergreen tropical and subtropical forests, 80 – 90% of the
dry biomass is wood (Larcher 1998). Although constituting a substantial fraction of total
biomass, the aboveground woody organs respire comparatively less than other plant tissues
(e.g., fine roots and leaves), when based on the dry mass (Ryan et al. 1994). This is mainly a
result of the large proportion of dead tissue dominating the stem biomass, whereas the
respiratory active cambial tissue is restricted to the stem outer ring under the phloem.
Traditionally, three major problems of measuring woody tissue respiration are commonly
discussed in the literature and are summarized according to Sprugel et al. (1995):
• CO2 produced by respiratory activity in the sapwood may be carried away with the
xylem sap flow, which, in turn, would result in an underestimation of the actual CO2
release at the measured section.
• CO2 respired by roots or taken up from the soil may be transported upwards with the
xylem sap flow and additionally released somewhere further up in the stem. This
would result in an overestimation of the actual CO2 release at the measured section.
• Photosynthetically active tissue in the bark may re-assimilate the CO2 produced by
respiration resulting in an underestimation of the actual CO2 release rate at the
measured section.
Nevertheless, independent of knowing exact sources, measuring the apparent CO2
release of woody tissue in situ is an invaluable tool to gain information about the contribution
of wood to the overall carbon balance. Early studies in tropical forests estimated the fraction
of wood CO2 release to range between 23 - 50% of total plant respiration (Müller and Nielson
1965, Yoda 1967, Whitmore 1984). However, these measurements were made on excised
plant organs and wound respiration most likely contributed a considerable amount to the
respiratory CO2 release (Ryan et al. 1994). More recent estimates of woody tissue respiration
in the tropics ranged between 10-13% of gross production (Ryan et al. 1994, Meir and Grace
2002), though only few studies exist about the respiratory CO2 release from tropical tree
stems. Even less information is available about the CO2 release of branches and coarse roots
in tropical ecosystems. Small diameter wood of <10 cm (including branches) contributed 70%

Chapter 1
11
to total wood respiration in an evergreen tropical lowland forest in Costa Rica (Cavaleri et al.
2006). Root respiration was found to strongly increase with decreasing diameter for Pinus
radiata and Pseudotsuga menziesii. Further, seedling roots respired much faster than the roots
of mature trees in Pinus radiata and Pseudotsuga menziesii (Hollinger et al. 1994).
1.4 Study sites
The three study sites are located within the Podocarpus National Park at the eastern
slopes of the southern Andes of Ecuador (Figure 1.1). The park is situated between the two
provinces Loja and Zamora covering an area of 1460 km² (Calderón 2002).
Figure 1.1. Study area and location of the three study sites: 1 Bombuscaro (premontane) at 1050m asl, 2 ECSF (lower montane) at 1890 m asl, and 3 Cajanuma (upper montane) at 3050m asl. The whole area covered by the research station (ECSF) is also indicated.
At its northern limit, in the valley of the Rio San Francisco, the research station
“Reserva San Francisco” (RSF, formerly ECSF) borders the National Park. The Reserva,
covering an area of about 1000 ha, is owned by the foundation Nature and Culture
International (NCI), Ecuador and is rented by the DFG for the ongoing investigations of the
research unit FOR 402. Emerging between the humid Amazon basin and the dry inter-Andean
valley, the area encloses various tropical montane forest ecosystems (Richter 2003). The
Introduction
12
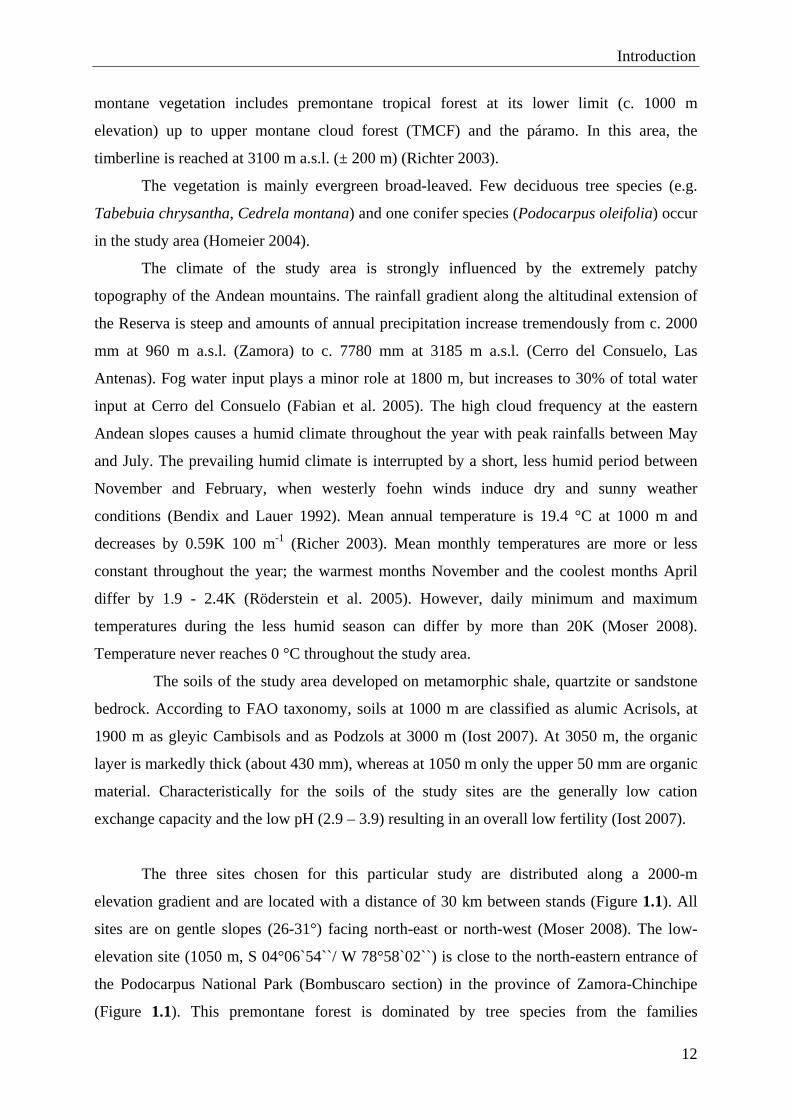
montane vegetation includes premontane tropical forest at its lower limit (c. 1000 m
elevation) up to upper montane cloud forest (TMCF) and the páramo. In this area, the
timberline is reached at 3100 m a.s.l. (± 200 m) (Richter 2003).
The vegetation is mainly evergreen broad-leaved. Few deciduous tree species (e.g.
Tabebuia chrysantha, Cedrela montana) and one conifer species (Podocarpus oleifolia) occur
in the study area (Homeier 2004).
The climate of the study area is strongly influenced by the extremely patchy
topography of the Andean mountains. The rainfall gradient along the altitudinal extension of
the Reserva is steep and amounts of annual precipitation increase tremendously from c. 2000
mm at 960 m a.s.l. (Zamora) to c. 7780 mm at 3185 m a.s.l. (Cerro del Consuelo, Las
Antenas). Fog water input plays a minor role at 1800 m, but increases to 30% of total water
input at Cerro del Consuelo (Fabian et al. 2005). The high cloud frequency at the eastern
Andean slopes causes a humid climate throughout the year with peak rainfalls between May
and July. The prevailing humid climate is interrupted by a short, less humid period between
November and February, when westerly foehn winds induce dry and sunny weather
conditions (Bendix and Lauer 1992). Mean annual temperature is 19.4 °C at 1000 m and
decreases by 0.59K 100 m-1 (Richer 2003). Mean monthly temperatures are more or less
constant throughout the year; the warmest months November and the coolest months April
differ by 1.9 - 2.4K (Röderstein et al. 2005). However, daily minimum and maximum
temperatures during the less humid season can differ by more than 20K (Moser 2008).
Temperature never reaches 0 °C throughout the study area.
The soils of the study area developed on metamorphic shale, quartzite or sandstone
bedrock. According to FAO taxonomy, soils at 1000 m are classified as alumic Acrisols, at
1900 m as gleyic Cambisols and as Podzols at 3000 m (Iost 2007). At 3050 m, the organic
layer is markedly thick (about 430 mm), whereas at 1050 m only the upper 50 mm are organic
material. Characteristically for the soils of the study sites are the generally low cation
exchange capacity and the low pH (2.9 – 3.9) resulting in an overall low fertility (Iost 2007).
The three sites chosen for this particular study are distributed along a 2000-m
elevation gradient and are located with a distance of 30 km between stands (Figure 1.1). All
sites are on gentle slopes (26-31°) facing north-east or north-west (Moser 2008). The low-
elevation site (1050 m, S 04°06`54``/ W 78°58`02``) is close to the north-eastern entrance of
the Podocarpus National Park (Bombuscaro section) in the province of Zamora-Chinchipe
(Figure 1.1). This premontane forest is dominated by tree species from the families

Chapter 1
13
Myrtaceae, Sapotaceae (mainly Pouteria), Annonaceae (Guatteria), Moraceae (Ficus) and
Mimosaceae (Inga) (Figure 1.2). Trees are taller than further upslope, reaching a canopy
heights of 31.8 m, with maximum stem length of 39.7 m (mean: 15.6 m ± 0.7 SE, Moser
2008).
The mid-elevation site (1890 m, S 03°58`345``/ W 79°04`648``) is close to the
Reserva San Francisco (RSF), 30 km from Loja on the road to Zamora, Province of Zamora-
Chinchipe (Figure 1.1). In this lower montane vegetation the tree families Melastomataceae
(mainly Graffenrieda emarginata and Miconia), Lauraceae (Ocotea), Euphorbiaceae
(Alchornea), Rubiaceae (Palicourea) and Chletraceae (Chlethra) are most abundant (Figure
1.2). Canopy height is 18.9 m, with a maximum stem length of 24.8 m (mean: 10.1 m ± 0.4
SE, Moser 2008).
The upper site (3050 m, S 04°06`711``/ W 79°10`581``) was situated in the the north-
western section of the Park, Cajanuma, Province of Loja (Figure 1.1). This upper montane
vegetation is charcterized by trees from the families Cunnoniaceae (Weinmannia), Rubiaceae
(Faramea), Clusiaceae (Clusia), Ericaceae and Symplocacaceae (Figure 1.2). Canopy height
is 9.0 m, with a maximum stem length of 19.2 m (mean: 5.2 m ± 0.3 SE, Moser 2008).
Figure 1.2. The three study sites at 1050 m (premontane), 1890 m (lower montane) and 3050 m (upper montane). Views from outside (above) and inside (below) the sites.

Introduction
14
1.5 References
Amthor JS (1989) Respiration and crop productivity. Springer-Verlag, New York, USA, pp.
215.
Amthor JS (1991) Respiration in a future, higher-CO2 world. Plant Cell and Environment 14, 13-20.
Amthor JS (1994) Plant respiratory responses to the environment and their effects on the carbon balance. In: Plant-environment interactions. (ed. Wilkinson RE). Marcel Dekker, New York, pp. 501-554.
Amthor JS (1995) Terrestrial higher-plant response to increasing atmospheric CO2 in relation to the global carbon cycle. Global Change Biology 1, 243-274.
Amthor JS (2000) The McCree-de Wit-Penning de Vries-Thornley respiration paradigms: 30 years later. Annals of Botany 86, 1-20.
Armstrong AF, Logan DC, Atkin OK (2006) On the developmental dependence of leaf respiration: responses to short- and long-term changes in growth temperature. American Journal of Botany 93, 11, 1633-1639.
Atkin OK, Holly C, Ball MC (2000) Acclimation of snow gum (Eucalyptus pauciflora) leaf respiration to seasonal and diurnal variations in temperature: the importance of changes in capacity and temperature sensitivity of respiration. Plant Cell and Environment 23, 15-26.
Atkin OK, Tjoelker MG (2003) Thermal acclimation and the dynamic response of plant respiration to temperature. Trends in Plant Science 8, 343-351.
Atkin OK, Bruhn D, Hurry VM, Tjoelker MG (2005) The hot and the cold: unravelling the variable response of plant respiration to temperature. Functional Plant Biology 32, 87-105.
Atkin OK, Scheurwater I, Pons TL (2006) High thermal acclimation potential of both photosynthesis and respiration in two lowland Plantago species in contrast to an alpine congeneric. Global Change Biology 12, 500-515.
Atkin OK, Scheurwater I, Pons TL (2007) Respiration as a percentage of daily photosynthesis in whole plants is homeostatic at moderate, but not high, growth temperatures. New Phytologist 174, 367-380.
Bendix J, Lauer W (1992) Die Niederschlagsjahreszeiten in Ecuador und ihre klimadynamische Interpretation. Erdkunde 46, 118-134.
Bolin B, Fung I (1992) Report: the carbon cycle revisited. In: Modelling the earth system. (ed: Boulder OD), USA: UCAR/Office for Interdisciplinary Earth Studies, 151-164.
Brujinzeel LA, Veneklaas EJ (1998) Climatic conditions and tropical montane forest productivity: The fog is not lifted yet. Ecology 79, 3-9.
Brummit N, Lughadha EN (2003) Biodiversity: where´s hot and where´s not hot. Conservation Biology 17, 1442-1448.
Bubb P, May I, Miles L, Sayer J (2004) Cloud forest agenda. URL:http//www.unepwcmc.org/resources/publications/UNEP_WCMC_bio_series/20.htm. Hamilton LS, Juvik JO, Scatena F (1995) Tropical montane cloud forests. Springer, New York.
Chapter 1
15
Calderón S (2002) El Parque Nacional Podocarpus y fundamentos legales que lo respaldan. In: Botánica Austroecuadoriana. Estudios sobre los recursos vegetales en la provincial de el Oro, Loja y Zamora-Chinchipe. (eds.: Aguirre MZ, Madsen JE, Cotton E, Balslev H), Ediciones Bya-Yala, Quito, Ecuador, pp. 433-451.
Cannell MGR, Thornley JHM (2000) Modelling the components of plant respiration: some guiding principles. Annals of Botany 85, 45-54.
Carey EV, Callaway RM, DeLucia EH (1997) Stem respiration of ponderosa pines grown in contrasting climates: implications for global climate change. Oecologia 111, 19-25.
Cavaleri MA, Oberbauer SF, Ryan MG (2006) Wood CO2 efflux in a primary tropical rain forest. Global Change Biology 12, 2442-2458.
Chambers JQ, Tribuzy ES, Toledo LC, Crispim BF, Higuchi N, Dos Santos J, Araújo AC, Kruijt B, Nobre AS, Trumbore SE (2004) Respiration from a tropical forest ecosystem: Partitioning of sources and low carbon use efficiency. Ecological Applications 14, 72-88.
Clark DA (2007) Detecting tropical forests´ responses to global climatic and atmospheric changes: current challenges and a way forward. Biotropica 39, 4-19.
Crawford RMM, Palin MA (1981) Root respiration and temperature limits to the north-south distribution of four perennial maritime plants. Flora 171, 338-354.
Edwards NT, McLaughlin SB (1978) Temperature-independent diel variations of respiration rates in Quercus alba and Liriodendron tulipifera. Oikos 31, 200-2006.
Fabian P, Kohlpaintner M, Rollenbeck R. (2005) Biomass burning in the Amazon – Fertilizer for the mountaineous rain forest in Ecuador, Environmental Science and Pollution Research 12, 290-296.
Forward DF (1960) Effect of temperature on respiration. In: Encyclopedia of plant physiology Vol 12. (ed. Ruhland W), Springer-Verlag, Berlin, Germany, pp. 234-258.
Grace J, Lloyd J, McIntyre J, Miranda AC, Meir P, Miranda HS, Nobre C, Moncreiff J, Massheder J, Malhi Y, Wright I, Gash J (1995) Carbon dioxide uptake by an undisturbed tropical rain forest in southwest Amazonia, 1992 to 1993. Science 270, 778-780.
Griffin KL, Turnball M, Murthy R (2002) Canopy position affects the temperature response of leaf respiration in Populus deltoides. New Phytologist 154, 609-619.
Gunderson CA, Norby RJ, Wullschläger SD (2000) Acclimation of photosynthesis and respiration to simulated climatic warming in northern and southern populations of Acer saccharum: laboratory and field evidence. Tree Physiology 20, 87-96.
Hollinger DY, Kelliher F M, Byers JN, Hunt JE, McSeveny TM, Weir PL (1994) Carbon dioxide exchange between an undisturbed old-growth temperate forest and the atmosphere. Ecology 75, 134-150.
Homeier J (2004) Baumdiverstät, Waldstruktur und Wachstumsdynamik zweier tropischer Bergregenwälder in Ecuador und Costa Rica. Dissertationes Botanicae 391, pp. 207.
Iost S (2007) Soil respiration, microbial respiration and mineralization in soils of montane rainforests of southern Ecuador: influence of altitude. PhD Thesis, TU Dresden, Germany, pp. 171.
Jacobs M (1988) The tropical rain forest – a first encounter. Springer-Verlag, Berlin, Germany, pp. 295.
Lambers H, Chapin FS, Pons TI (1998) Plant physiological ecology. Springer-Verlag, New York, pp. 540.

Introduction
16
Lambers H, Ribas-Carbo M (eds.) (2005) Advances in photosynthesis and respiration. Volume 18: Plant respiration: From cell to ecosystem. Springer, Netherlands, pp. 250.
Lavigne MB (1987) Differences in stem respiration response to temperature between balsam fir trees in thinned and unthinned stands. Tree Physiology 3, 225-233.
Larcher W (1998) Physiological plant ecology. Springer Verlag, Berlin, Germany, pp. 513.
Lloyd J, Taylor JA (1994) On the temperature dependence of soil respiration. Functional Ecology 8, 315-323.
Loveys BR, Atkinson LJ, Sherlock DJ, Roberts RL, Fitter AH, Atkin OK (2003) Thermal acclimation of leaf and root respiration: an investigation comparing inherently fast- and slow-growing plant species. Global Change Biology 9, 895-910.
Luyssaert S, Inglima I, Jung M, Richardson AD, Reichstein M, Papale D, Piao SL, Schulze ED, Wingate L, Matteucci G, Aragao L, Aubinet M, Beer C, Bernhofer C, Black KG, Bonal D, Bonnefond FM, Chambers J, Ciais P, Cook B, Davis KJ, Dolman AJ, Gielen B, Goulden M, Grace J, Granier A, Grelle A, Griffis T, Grünwald T, Guidolotti G, Hanson PJ, Harding R, Hollonger DY, Hutyra LR, Kolari P, Kruijt B, Kutsch W, Lagergen F, Laurila T, Law BE, LeMaire G, Lindroth A, Loustau D, Malhi Y, Mateus J, Migliavacca M, Misson L, Montagnani L, Moncrieff J, Moors E, Munger, Nikinmaa E, Ollonger SV, Pita G, Rebmann C, Roupsard O, Saigusa N, Sanz MJ, Seufert G, Sierra C, Smith ML, Tang J, Valentini R, Vesala T, Janssens IA (2007) CO2 balance of boreal, temperate, and tropical forests derived from a global database. Global Change Biology 13, 2509-2537.
Maier TA, Zarnoch SJ, Dougherty PM (1998) Effects of temperature and tissue nitrogen on dormant season stem and branch respiration in a young loblolly pine (Pinus tadea) plantation. Tree Physiology 18, 11-20.
Meir P, Grace J (2002) Scaling relationship for woody tissue respiration in two tropical rain forests. Plant, Cell and Environment 25, 963-973.
Moser G (2008) Elevation effects on key processes of carbon cycling in South Ecuadorian mountain forests. PhD Thesis. University of Göttingen, Germany, pp.125.
Müller D, Nielson J (1965) Production brute, pertes par respiration e production nette dans la foret ombrophile tropicale. Forstlige Forsøgsvaesen i Danmark 29, 69-160.
Negisi K (1982) Dirunal fluctuations in the stem bark respiration in relationship to the wood temperature in standing young Pinus densiflora, Chamaecyparis obtusa and Quercus myrsinaefolia trees. Journal of Japanese Forest Society 64, 315-319.
Penning de Vries FWT (1975a) The cost of maintenance processes in plant cells. Annals of Botany 39, 77-92.
Penning de Vries FWT (1975b) Use of assimilates in higher plants. In: Photosynthesis and productivity in different environments. (ed: Cooper JG). Cambrigde University Press, Cambridge, pp. 459-480.
Raich JW, Schlesinger WH (1992) The global carbon-dioxide flux in soil respiration and its relationship to vegetation and climate. Tellus, Series B – Chemical and Physical Meteorology 44, 81-99.
Richter M (2003) Using epiphytes and soil temperature for eco-climatic interpretation in southern Ecuador. Erdkunde 57, 161-181.
Röderstein M, Hertel D, Leuschner C (2005) Above- and below-ground litter production in three tropical mountain forests (South Ecuador). Journal of Tropical Ecology 21, 483-492.

Chapter 1
17
Ryan MG (1991) Effect of climate change on plant respiration. Ecological Applications 1, 157-167.
Ryan MG, Hubbard RM, Clark DA, Sanford RL Jr (1994) Woody-tissue respiration of Simarouba amara and Minquartia guinensis, two wet forest trees with different growth habits. Oecologia 100, 213-220.
Ryan MG, Gower ST, Hubbard RM, Waring RH, Gholz HL, Cropper WP, Running SW, (1995) Woody tissue maintenance respiration of four conifers in contrasting climates. Oecologia 101, 133-140.
Sprugel DG, Ryan MG, Brooks JR, Vogt KA, Martin TA (1995) Respiration from the organ to the stand. In: Resource physiology of conifers. Acquisition, allocation and utilization. (eds: Smith WK, Hickley TM). Academic press, San Diego, pp. 255-299.
Teskey RO, McGuire MA (2002) Carbon dioxide transport in xylem causes errors in estimation of rates of respiration in stems and branches of trees. Plant Cell and Environment 25, 1571-1577.
Thornley JHM, Cannell MGR (2000) Modelling the components of plant respiration: representation and realism. Annals of Botany 85, 55-67.
Tjoelker MG, Oleksyn J, Reich PB (1999) Acclimation of respiration to temperature and CO2 in seedlings of boreal tree species in relation to plant size and relative growth rate. Global Change Biology 49, 679-691.
Tjoelker MG, Oleksyn J, Reich PB (2001) Modelling respiration of vegetation: evidence for a general temperature-dependent Q10. Global Change Biology 7, 223-230.
Trumbore S (2006) Carbon respired by terrestrial ecosystems – recent progress and challenges. Global Change Biology 12, 141-153.
Van der Werf A, Van den Berg G, Ravenstein HJL, Lambers H, Eisberg R (1992) Protein turnover: A significant component of maintenance respiration in roots? In: Molecular, biochemical and physiological aspects of plant respiration. (eds. Lambers H, Van der Plas LHW). SPB Academic Publishing, The Hague, pp. 61-77.
Whitmore TC (1984) Tropical rainforests of the Far East. 2nd Edn. Clarendon Press Oxford, pp. 351.
Yoda K (1967) Comparative ecological studies on three main types of forest vegetation in Thailand. III. Community Respiration. Nature Life SE Asia 5, 83-148.

Chapter 2
18
ELEVATIONAL CHANGES IN WOODY TISSUE CO2 EFFLUX
IN A TROPICAL MOUNTAIN RAIN FOREST IN
SOUTHERN ECUADOR
ALEXANDRA ZACH, VIVIANA HORNA AND CHRISTOPH LEUSCHNER
TREE PHYSIOLOGY 28: 67–74 (2008)
2 Chapter
Wood CO2 efflux and elevation
19
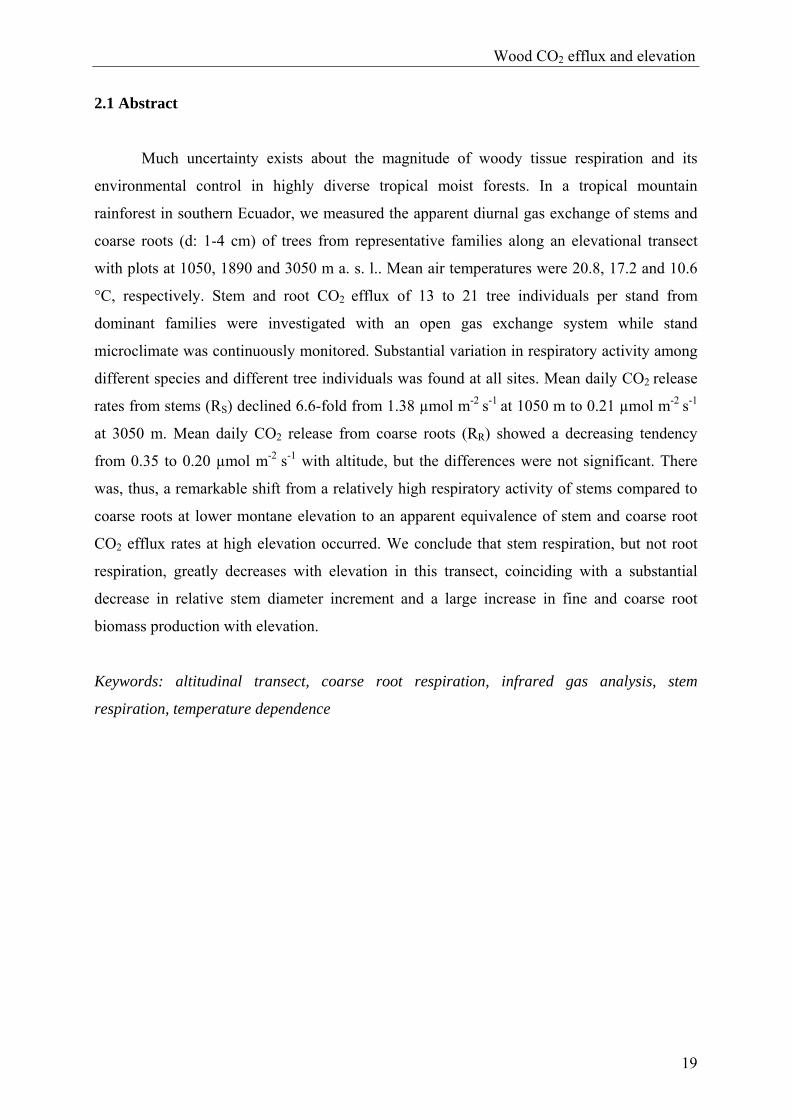
2.1 Abstract
Much uncertainty exists about the magnitude of woody tissue respiration and its
environmental control in highly diverse tropical moist forests. In a tropical mountain
rainforest in southern Ecuador, we measured the apparent diurnal gas exchange of stems and
coarse roots (d: 1-4 cm) of trees from representative families along an elevational transect
with plots at 1050, 1890 and 3050 m a. s. l.. Mean air temperatures were 20.8, 17.2 and 10.6
°C, respectively. Stem and root CO2 efflux of 13 to 21 tree individuals per stand from
dominant families were investigated with an open gas exchange system while stand
microclimate was continuously monitored. Substantial variation in respiratory activity among
different species and different tree individuals was found at all sites. Mean daily CO2 release
rates from stems (RS) declined 6.6-fold from 1.38 µmol m-2 s-1 at 1050 m to 0.21 µmol m-2 s-1
at 3050 m. Mean daily CO2 release from coarse roots (RR) showed a decreasing tendency
from 0.35 to 0.20 µmol m-2 s-1 with altitude, but the differences were not significant. There
was, thus, a remarkable shift from a relatively high respiratory activity of stems compared to
coarse roots at lower montane elevation to an apparent equivalence of stem and coarse root
CO2 efflux rates at high elevation occurred. We conclude that stem respiration, but not root
respiration, greatly decreases with elevation in this transect, coinciding with a substantial
decrease in relative stem diameter increment and a large increase in fine and coarse root
biomass production with elevation.
Keywords: altitudinal transect, coarse root respiration, infrared gas analysis, stem
respiration, temperature dependence

Chapter 2
20
2.2 Introduction
Plant tissue respiratory activity is thought to consume 30-80% of the daily assimilated
carbon gain (Amthor 2000), constituting one of the main sources of CO2 released to the
atmosphere (Trumbore 2006). Although the carbon balance of forests is in the focus of
current global change research, the respiration of stems, branches and coarse roots is one of
the least studied processes (Sprugel and Benecke 1991). Knowledge of tropical forest
respiration is particularly sparse, despite their acknowledged importance of tropical forests in
the global carbon balance (Meir and Grace 2002, Chambers et al. 2004). For reliable
modeling of the carbon sink strength of tropical forests in a changing climate, a detailed
knowledge of plant respiration is needed, particularly its variability among forest types, and
its dependence on the environment. The few in situ measurements of respiration of tropical
forest trees indicate that woody tissue respiration accounted for 10-13% of gross
photosynthesis (Ryan et al. 1994, Meir and Grace 2002). Earlier measurements in tropical
forests based on observations of CO2 release from excised plant organs yielded values
between 23 and 50% (Müller and Nielson 1965, Yoda 1967, Whitmore 1984).
To our knowledge, only one gas exchange study has been conducted in tropical high-
elevation forests until now: Cavieres et al. (2000) measured leaf gas exchange of two tree
species in the Venezuelan Andes. Studies quantifying woody tissue respiration along
altitudinal transects in tropical mountain forests are lacking. Information from such studies
would help to predict effects of temperature change on plant respiration in tropical
ecosystems. Woody tissue CO2 release rates can vary enormously, not only among different
forest types (Lavigne et al. 1996, Ryan et al. 1997), but also among species within a stand and
among individuals of the same species (Meir and Grace 2002). Information on the spatial
variability of woody tissue respiration is indispensable when extrapolating gas flux data from
tree to stand. This information is particularly important in tropical forests with their high
species richness and large structural variability across environmental gradients (Meir and
Grace 2002, Chambers et al. 2004).
The current study was undertaken to: (1) quantify species-specific differences in
woody tissue respiration in tropical mountain forests; (2) compare the respiratory activity of
stems and coarse roots; and (3) analyze changes in stem and root respiration along an
altitudinal span of 2000 m in a tropical mountain rainforest in southern Ecuador.

Wood CO2 efflux and elevation
21
2.3 Materials & Methods
2.3.1 Study sites
The study was carried out in Podocarpus National Park (PNP) in the surroundings of
Loja on the eastern slopes of the southern Ecuadorian Andes. We chose three forest stands
along an altitudinal gradient ranging from 1050 m to 3050 m a. s. l. The maximum distance
between the stands was about 30 km. The low-elevation stand (1050 m, S 04°06`54``/ W
78°58`02``) is located in the northeastern part of PNP (Bombuscaro section) in the Province
of Zamora-Chinchipe. The mid-elevation stand (1890 m, S 03°58`345``/ W 79°04`648``) is
close to the Estacion Cientifica San Francisco (ECSF), 30 km from Loja on the road to
Zamora, Province of Zamora-Chinchipe. The high-elevation stand (3050 m, S 04°06`711``/ W
79°10`581``) is in the Cajanuma area in the northwestern part of PNP, Province of Loja. All
stands were selected on gentle slopes (26-31°) facing northeast to northwest, covering an area
of 20 x 20 m.
The climate of the area is mainly influenced by easterly winds that bring frequent
rainfall throughout the year with peaks from May to July. During our study, conducted from
October to December 2005, westerly winds strongly influenced the local weather causing a
relatively dry and sunny period in the study area.
The soils of the area developed either from grandiosities (low-elevation stand), or
metamorphic shale, quartzite and sandstone bedrock (mid- and high-elevation stands).
Throughout the study region, the soils are relatively infertile (Schrumpf et al. 2001).
Forest structure and selection of tree individuals
The stands were selected to: a) be representative of the vegetation type at each
elevation; b) have a closed canopy within a surrounding area of 100 x 100 m; and c) be free of
recent anthropogenic influence or landslide disturbance. The low-elevation stand (1050 m)
represents the transitional zone between tropical lowland and lower montane rainforest. The
mid-elevation stand (1890 m) is a typical lower montane rain forest, and the high-elevation
stand (3050 m) is located close to the timberline and represents a typical “elfin forest”
characterized by stunted trees with warped stem forms. Further details on forest structure are
given in Table 2.1. All plots have been previously studied and described by Röderstein et al.
(2005), Leuschner et al. (2007) and Moser et al. (2008).
Chapter 2
22
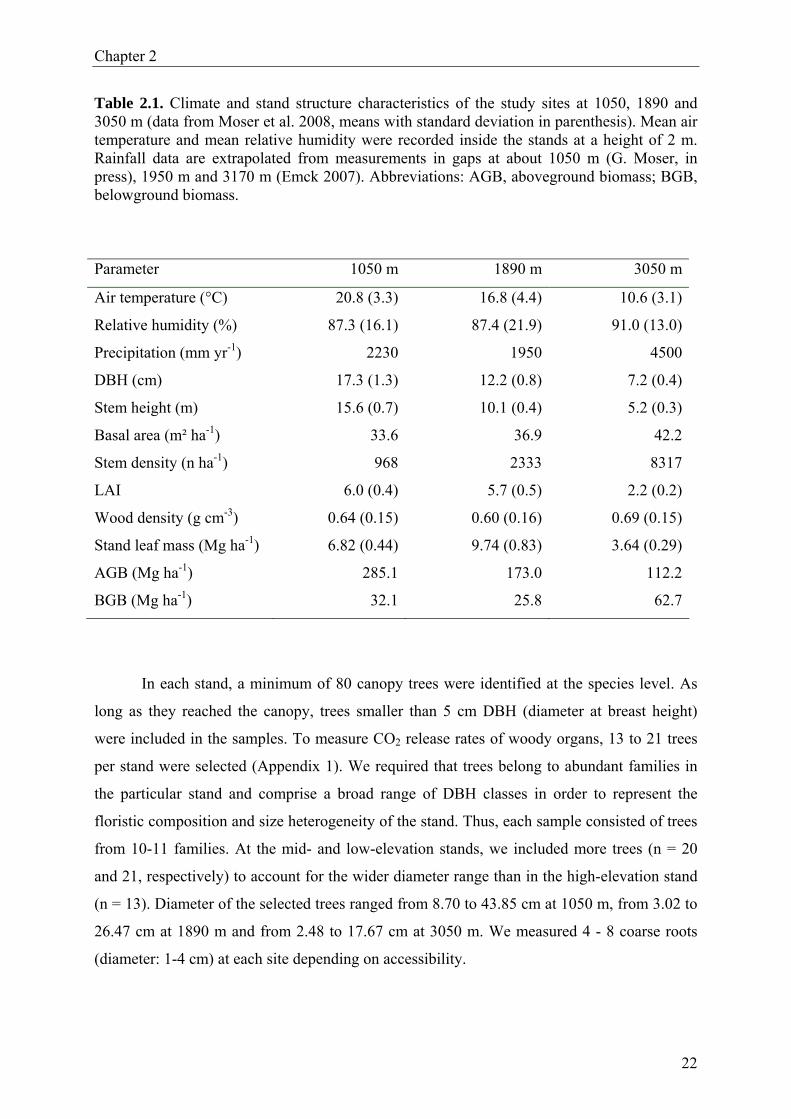
Table 2.1. Climate and stand structure characteristics of the study sites at 1050, 1890 and 3050 m (data from Moser et al. 2008, means with standard deviation in parenthesis). Mean air temperature and mean relative humidity were recorded inside the stands at a height of 2 m. Rainfall data are extrapolated from measurements in gaps at about 1050 m (G. Moser, in press), 1950 m and 3170 m (Emck 2007). Abbreviations: AGB, aboveground biomass; BGB, belowground biomass.
Parameter 1050 m 1890 m 3050 m
Air temperature (°C)
Relative humidity (%)
Precipitation (mm yr-1)
DBH (cm)
Stem height (m)
Basal area (m² ha-1)
Stem density (n ha-1)
LAI
Wood density (g cm-3)
Stand leaf mass (Mg ha-1)
AGB (Mg ha-1)
BGB (Mg ha-1)
20.8 (3.3)
87.3 (16.1)
2230
17.3 (1.3)
15.6 (0.7)
33.6
968
6.0 (0.4)
0.64 (0.15)
6.82 (0.44)
285.1
32.1
16.8 (4.4)
87.4 (21.9)
1950
12.2 (0.8)
10.1 (0.4)
36.9
2333
5.7 (0.5)
0.60 (0.16)
9.74 (0.83)
173.0
25.8
10.6 (3.1)
91.0 (13.0)
4500
7.2 (0.4)
5.2 (0.3)
42.2
8317
2.2 (0.2)
0.69 (0.15)
3.64 (0.29)
112.2
62.7
In each stand, a minimum of 80 canopy trees were identified at the species level. As
long as they reached the canopy, trees smaller than 5 cm DBH (diameter at breast height)
were included in the samples. To measure CO2 release rates of woody organs, 13 to 21 trees
per stand were selected (Appendix 1). We required that trees belong to abundant families in
the particular stand and comprise a broad range of DBH classes in order to represent the
floristic composition and size heterogeneity of the stand. Thus, each sample consisted of trees
from 10-11 families. At the mid- and low-elevation stands, we included more trees (n = 20
and 21, respectively) to account for the wider diameter range than in the high-elevation stand
(n = 13). Diameter of the selected trees ranged from 8.70 to 43.85 cm at 1050 m, from 3.02 to
26.47 cm at 1890 m and from 2.48 to 17.67 cm at 3050 m. We measured 4 - 8 coarse roots
(diameter: 1-4 cm) at each site depending on accessibility.
Wood CO2 efflux and elevation
23
2.3.2 Gas exchange measurements
Woody tissue CO2 release rates were measured in situ between October to December
2005, which corresponds to the drier season of the year, although each month received at least
80 mm of rain. In each stand, the measurements were made over a 10-day period, during
which continuous measurements were made of CO2 efflux from woody organs (stems and
coarse roots). Stem CO2 release was monitored at breast height (1.3 m) using transparent
plexiglas chambers (95.1 cm3 volume) tightly fitted onto the bark surface (Appendix 2). When
necessary, mosses and lichens were cautiously removed from the measured stem segment
using a soft brush, carefully avoiding damage to the bark. Segments of coarse roots were
enclosed in transparent plexiglas chambers of 473.8 cm³ volume fixed around the organ with
staunching rings and sealed using Terostat® VII (Teroson, Henkel AG, Düsseldorf,
Germany). The cylindrical chamber design allows for the measurement of organ sections
ranging in diameter from 1 to 4 cm. Both types of chambers have a relatively small volume
and are designed with inlet and outlet nozzles at opposite sides in order to ensure adequate
mixing of the incoming air. Air-tightness of the measurement chambers was controlled via
electronic air flow meters.
The diameter of the stems or roots was measured in the middle of the organ section
enclosed in the chamber. The surface temperature of the measured organ section was recorded
with thermocouples attached on the outside of the stem surface next to the chamber. We
selected coarse roots (d: 1-4 cm) growing a few centimetres beneath the soil surface and
uncovered the root section to be measured with a soft brush.
Gas exchange system
Net exchange of CO2 across stem or root surfaces was measured with a mobile 6-
chamber respiration system ANARESY 2 (Walz, Effeltrich, Germany; Appendix 2) with an
integrated infrared gas analyzer for CO2 and H2O (LI-7000, Li-Cor, Inc., Lincoln, NE). The
open gas exchange system was operated in differential mode (Ryan et al. 1995) and allows for
continuous diurnal measurements of the apparent CO2 release rate in six plexiglas chambers
(Horna and Zimmermann 2000). Buffered incoming air permanently passed all six chambers
with a maximum flow rate of 1 l min-1.
Every 6 min, the system switched automatically from one chamber to the next, thus
recording about two CO2 release values per chamber per hour. The six chambers were moved
to different tree individuals after completing a 24-hour measurement cycle. Electrical power

Chapter 2
24
was supplied by a generator that charged car batteries connected in series (24 V DC). The
generator was placed at a distance of over 100 m from the measuring system to avoid any
influence of the fumes on the measurement. For every 10-day measurement interval, the entire
set up was moved to the next site. The weather conditions during the measuring period from
October to December 2005 were sufficiently stable to allow for a comparison of the three
stands.
Calculation of respiration rates
The LI-7000 infrared gas analyzer continuously determines both the absolute CO2
concentration ([CO2]) and the difference between ambient atmospheric CO2 concentration
[CO2] and the concentration inside the chamber corrected for atmospheric pressure. Air flow
rate is expressed as a molar flow rate. The woody tissue CO2 release rates are then calculated
as:
(1) R = D [CO2] * F/ Ac
where R is the respiration rate in µmol CO2 m-2 s-1, D [CO2] is the difference between ambient
(reference gas) and chamber (sample gas) [CO2] concentration, F is the air flow rate (mol s-1)
which passes through the chamber, and Ac is the surface area (m2) of the enclosed organ
segment.
Depending on the diameter of the measured object, CO2 release rates of woody
biomass in tropical forests have been related either to surface area (Levy and Jarvis 1998,
Chambers et al. 2004), tissue volume (Ryan et al. 1994), or to a combination of both (Meir
and Grace 2002). Recently, Cavaleri et al. (2006) found the proper unit of expression of CO2
release by tropical woody tissue is dependent on the position within the tree, with canopy
rates related to surface area, but efflux rates in the bottom 2 m of the canopy related to both
volume and surface area. Nevertheless, since the volume of living tissue in stems and woody
roots may be differ considerably among tropical trees of different systematic classifications
and ages (Meir and Grace 2002, Chambers et al. 2004), we used the surface area of the
measured wood sections as a basis for calculation.
Despite evidence that dissolved CO2 is transported in substantial quantities in the
xylem sap of certain tree species (Levy and Jarvis 1998, Levy et al. 1999, Horna and
Zimmermann 2000, Teskey and McGuire 2002, McGuire and Teskey 2002, Gansert and
Burgdorf 2005), we ignored this flux in the current measuring program and interpreted our
stem and root efflux data as woody tissue respiration rates.

Wood CO2 efflux and elevation
25
Thermal regimes differ greatly along the altitudinal gradient, with little overlap in
temperature between the low- and high-elevation sites. Converting respiration rates to a
common temperature (e.g., 15-20 °C) would yield extrapolated release rates beyond naturally
given amplitudes and would result in the comparison of efflux rates at lowest night
temperatures at 1050 m with rates at the upper daytime temperature limit at 3050 m.
Therefore, we decided to underpin our comparison of mean stand respiration rates with results
of individual regression analyses rather than adjusting apparent efflux rates to a common
temperature.
Stand microclimate
During the 10-day measurement intervals, air temperature and relative air humidity at
2 m height inside the stands were monitored synchronously using a Rotronic sensor (Rotronic
AG, Bassersdorf, Switzerland) connected to the data logger of the ANARESY system (CR 10,
Campbell Scientific, Logan, UT). Annual means of air temperature and air humidity for each
site were computed from daily climate data from instruments located in each stand (1.5 m
above ground).
Statistical analysis
Mean stem respiration rates of individual trees were log-transformed for homogeneity
of variances before analysis of variance (ANOVA) testing for significant differences between
sites (Scheffé test for unbalanced data sets, p< 0.05). Root respiration data matched
parametric assumptions without transformation.
Carbon dioxide release rates were regressed against tissue surface temperature with
the 45 half-hour respiration rates (0100-2300 h) of all measured stems and roots per site.
Additionally, we determined the regression coefficients for each individual tree and root
segment and for all stems and roots per site. We ran an ANOVA based on the results of the
regression analysis of the various stem and root individuals to test for significant differences
in respiration rates at 0 °C (intercept) and responsiveness to temperature (slope) between the
three study sites. We used the coefficient of determination (r²) to quantify the influence of the
independent variable (temperature) on the dependent variable (CO2 efflux).
Chapter 2
26
2.4 Results
Microclimate
The study months October to December 2005 were characterized by westerly foehn
winds causing relatively dry weather conditions. In this period, 20-30% less rain fell per
month as compared to 2004. As a consequence, relative air humidity (RH) and air temperature
(Ta) showed considerable variation during the 10-d measurement periods at all study sites
(Table 2.2).
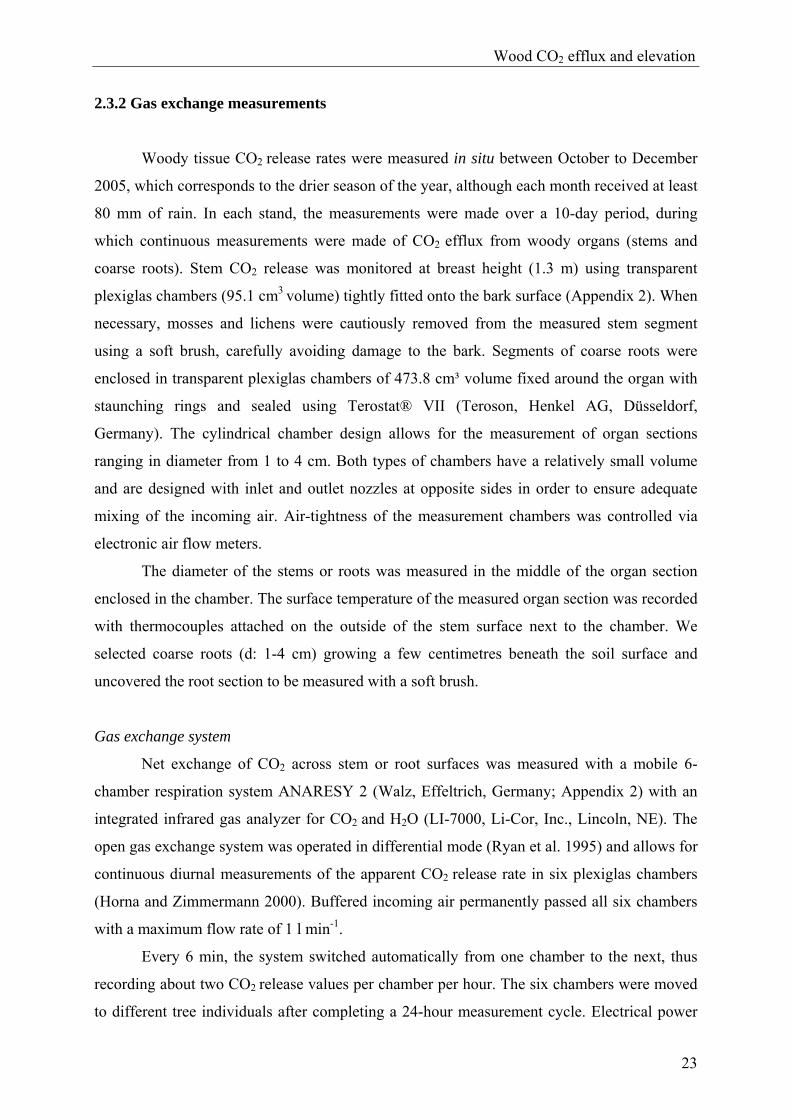
Table 2.2. Stand mean air temperature (Ta) and relative humidity (RH) during the 10-day-measurement campaigns at the study sites at 1050, 1890 and 3050 m elevation. Overall ranges are given in parenthesis.
Elevation (m) Ta (°C) RH (%)
1050 m
1890 m
3050 m
20.8 (16.1 – 30.3)
17.2 (9.5 – 25.5)
10.6 (4.5 – 19.9)
87.1 (39.6 – 99.9)
77.6 (15.1 – 99.9)
91.1 (43.4 – 99.7)
Woody tissue CO2 efflux along the altitudinal transect
Mean daily CO2 release rates from stems (RS) differed significantly between all sites.
Values decreased from 1.38 µmol m-2 s-1 at 1050 m to 0.21 µmol m-2 s-1 at 3050 m, with an
average RS of 0.76 µmol m-2 s-1 at 1890 m (Table 2.3). Thus, average stem respiration
declined by a factor of 6.6 over an altitudinal span of 2000 m. Parallel to RS, mean root CO2
efflux (RR) also tended to decrease along the elevational transect (Table 2.3). Mean RR
decreased by 20% from 1050 to 1890 m and by 29% from 1890 to 3050 m, resulting in a 43%
reduction along the whole transect, but differences were not significant.
There was considerable variation in R among the trees within the three stands (Figure
2.1 - 2.3). The overall range of R values was higher at the lower and mid-elevation stand (two
orders of magnitude) than at the upper site (one order of magnitude). Coarse root respiration
varied over one order of magnitude within all study sites (data not shown).

Wood CO2 efflux and elevation
27
Stems 1050 m
0 3 6 9 12 15 18 21
R (µ
mol
CO
2 m
-2 s
-1)
0
1
2
31890 m
0 3 6 9 12 15 18 21
3050 m
0 3 6 9 12 15 18 21
Tem
pera
ture
(°C
)
5
10
15
20
25
30
Coarse roots
0 3 6 9 12 15 18 21
R (µ
mol
CO
2 m
-2 s
-1)
0.0
0.2
0.4
0.6
0.8
1.0
Time of day (hrs)0 3 6 9 12 15 18 21 0 3 6 9 12 15 18 21
Tem
pera
ture
(°C
)
5
10
15
20
25
30
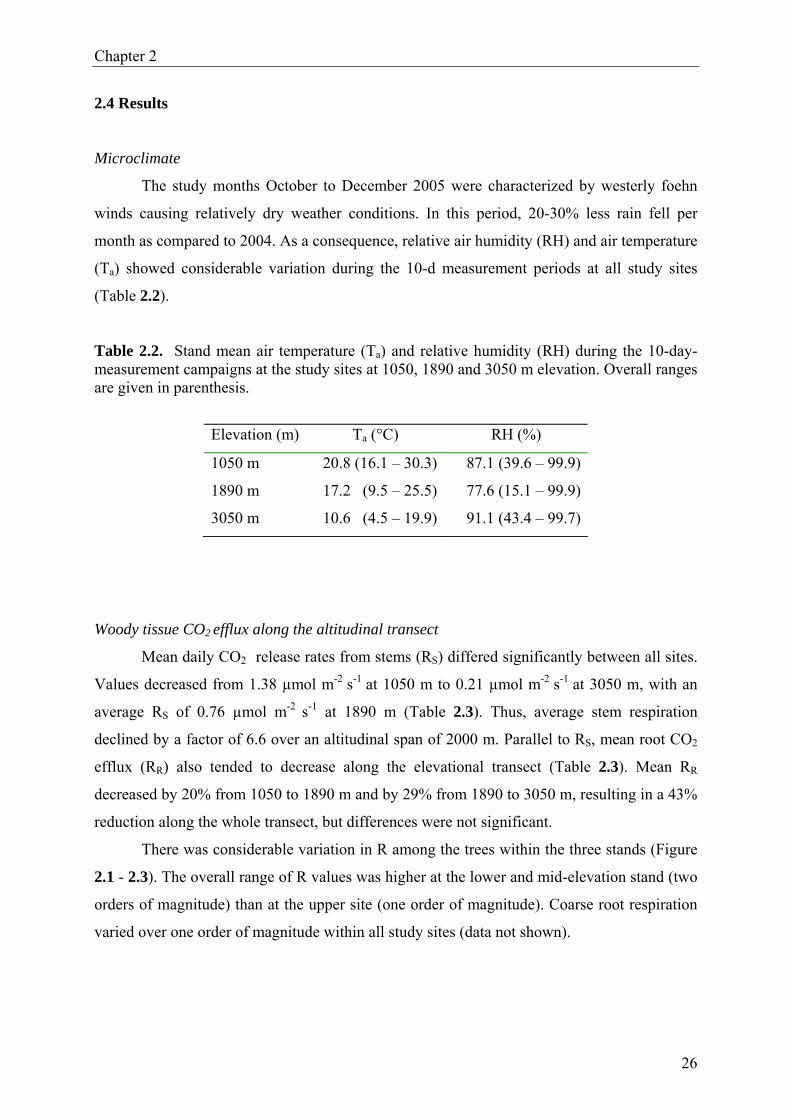
Figure 2.1. Diurnal course of stem and coarse root (d: 1-4 cm) respiration together with air temperature (solid line) at the study sites at 1050 m (n=21 stems, n=8 roots), 1890 m (n=20 stems, n=7 roots) and 3050 m (n=13 stems, n=4 roots). Each daily course consists of 45 half-hour measuring points. The 45 half-hour respiration data points are the mean of the diurnal values of 13 to 21 trees or 4 to 8 roots. Error bars equal 1 standard deviation. Air temperature was measured at 2 m height inside the stands. Note the different scales of the y-axis for stem and root respiration.
Woody tissue CO2 efflux and dependence on temperature
Mean diurnal RS and RR exhibited little if any change with temperature over the course
of the day in all three stands (Figure 2.1). Despite contrasting diurnal temperature regimes at
the lower and the upper montane sites, the slopes of the regression analysis of the integrated
data sets of stems and coarse roots were similar and remarkably flat (Figure 2.2). ANOVA
conducted for intercept and slope of the regression lines of every individual stem (n= 13-21)
and root segment measured (n= 4-8) confirmed that significant differences in temperature
responsiveness (coefficient b) for stems and coarse roots between the three study sites did not
exist (Table 2.3). Parallel to the apparent respiration rates at ambient temperature, the mean y-
axis intercept (coefficient a) of the individual regression lines significantly decreased for stem
respiration between 1050 m and 3050 m. For coarse root CO2 efflux, the intercept (i.e., the
respiration rate at 0 °C) also tended to decrease with elevation, but the differences between
the sites were not significant.

Chapter 2
28
1050 mR
(µm
ol C
O2
m-2
s-1
)
0
1
2
3
4
5 y= 0.5743 + 0.0391 xr²adj= 0.021, p < 0.0001
15 20 25 30
R (µ
mol
CO
2 m
-2 s
-1)
0.0
0.5
1.0
1.5 y= 0.1798 + 0.0081 xr²adj= 0.008, p= 0.045
1890 my= 0.4590 + 0.0177 xr²adj= 0.017, p < 0.0001
Temperature (°C)10 15 20 25
y= 0.1565 + 0.0074 xr²adj= 0.011, p= 0.036
3050 my= 0.0942 + 0.0115 xr²adj= 0.064, p < 0.0001
5 10 15 20
y= 0.0321 + 0.0158 xr²adj= 0.052, p= 0.001
a
b
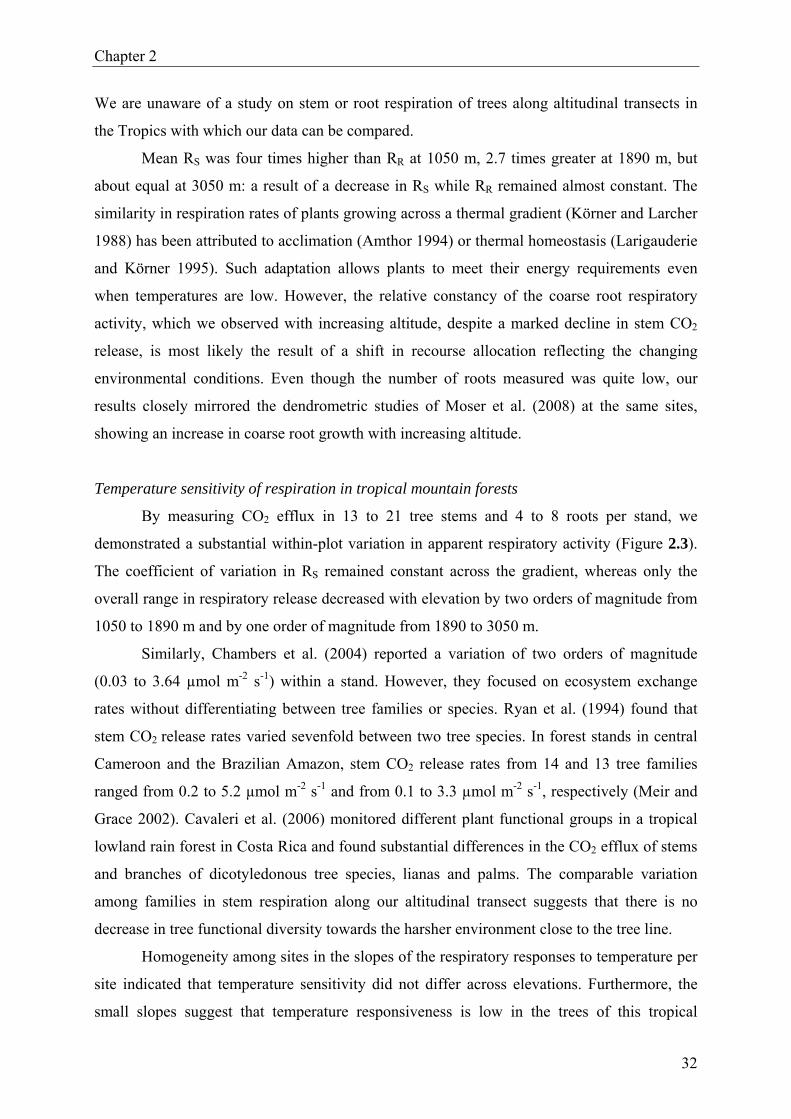
Figure 2.2. Dependence of the CO2 efflux rates (R) of all investigated stems (a) and coarse roots (b) on air temperature at the three study sites (• = 1050 m, ∇ = 1890 m and ▲ = 3050 m a.s.l.). Data points are 45-half-hour values of the 13 - 21 different stems or 4 - 8 roots measured during a certain measurement day at ambient temperature. The mean respiration rate at ambient temperature is marked () for each stands. Note the different scales of R-axis in panels a and b.
Although pooling data at stand level resulted in no major differences in temperature
responsiveness between sites, regression analysis of individual trees and root segments
showed exceptionally high variation in temperature response and respiration rates at 0 °C
(intercept; data not shown) between individuals as well as within sites. Furthermore, we found
remarkable discrepancies among individuals in the direction and strength of the temperature
dependence of RS and RR. Highly significant positive as well as negative relationships were
found at 1050 m and 1890 m, but also no temperature response was detected (Appendix 3a-b).
Only in the high-elevation stand (3050 m) did the regression analysis for individual stems
reveal significant positive correlations of RS and temperature in most cases, but no negative
relationships were detected (Appendix 3c). Similarly, RR at 3050 m mainly showed a
significant positive relation to temperature. In contrast at the two lower sites, most of the
coarse roots did not show any relationship to temperature. The direction of response was not
related to taxonomic groups (family) in any of the stands.

Wood CO2 efflux and elevation
29
Figure 2.3. Stem CO2 efflux rate (R) of individuals from various families in the stands at 1050, 1890, and 3050 m elevation. Data are daily means of R from all measured trees, each consisting of 45 half-hourly values during one day. Error bars equal 1 standard deviation. The families included are those with the greatest number of individuals at the particular site. Abbreviations: Mora1-4 = Ficus sp; Mela1-2 and 7-9 = Miconia punctata; Mela3 = indet.; Sapo 1 = Chrysophyllum sp; 3-2 = Pouteria cf; Anno1-2 = indet.; Laur1-2 = indet.; Mimo1 = Inga sp; Mimo2 = indet.; Aral1 = Schefflera sp; Cecr = Pourouma cf; Euph1 = Alchornea sp; Myri = Virola cf; Myrt = indet.; Mela4-6 = Graffenrieda emarginata; Laur3 = Nectandra sp; Laur4 = Endlicheria oreocola; Laur5 = Ocotea aciphylla; Sapi1-3 = Matayba inelegans; Rubi1 = Palicaurea sp; Rubi2 = Ladenbergia cf oblongifolia; Aqui1 = Ilex cf amboroica; Aral2 = Schefflera sp; Clet = Clethra revoluta cf; Euph2 = Hyeronima morisiana; Myrs1= Myrsine cf; Sapo = Micropholis guyanensis; Clus1 = Clusia sp 1; Clus2 = Clusia sp 2; Eric1 = Cerotostema cf; Eric2 = indet.; Myrs2 = Myrsine sp; Mysr3 = indet.; Aqui2 = Ilex weberlingii; Chlo = Hedyosmum sp; Cuno = Weinmannia loxensis; Mela10 = Axinea sp; Rubi3 = Faramea sp; Styr = Styrax foveolaria; Symp = Symplocos sp.

Chapter 2
30
Tab
le 2
.3. M
ean
daily
CO
2 eff
lux
rate
s (R
, µm
ol m
-2 s-1
) of s
tem
s and
coa
rse
root
s at a
mbi
ent t
empe
ratu
re a
t 10
50, 1
890
and
3050
m e
leva
tion.
Ana
lysi
s of
var
ianc
e w
as p
erfo
rmed
on
daily
mea
n ef
flux
rate
s an
d on
re
gres
sion
coe
ffic
ient
s (i.
e., a
= in
terc
ept,
b =
slop
e of
the
incr
ease
in R
with
tem
pera
ture
) as
det
erm
ined
w
ith li
near
regr
essi
on a
naly
sis
for
each
indi
vidu
al s
tem
and
root
seg
men
t. St
anda
rd d
evia
tions
are
giv
en in
pa
rent
hesi
s. D
iffer
ent l
ette
rs in
dica
te s
igni
fican
t diff
eren
ces
betw
een
site
s (p
< 0
.05,
Sch
effé
test
). D
ata
on
chan
ges
in b
asal
are
a (in
crem
ent p
er e
xist
ing
basa
l are
a pe
r ye
ar in
%) o
f ste
ms
(n=8
0 pe
r site
) and
coa
rse
root
s (n
=20
per s
ite) w
ere
supp
lied
by G
. Mos
er (U
nive
rsity
of G
öttin
gen,
Ger
man
y). R
ange
s in
dia
met
er a
t br
east
hei
ght o
f the
stem
s or r
oot d
iam
eter
(d, c
m) a
nd m
ean
diam
eter
s of t
he in
crem
ent s
tudi
es a
re s
how
n in
pa
rent
hesi
s.
Site
n
R
a b
Bas
al a
rea
chan
ge
Stem
s
1050
m
1890
m
3050
m
Roo
ts
1050
m
1890
m
3050
m
21
20
13
8 7 4
1.38
(0.8
8) a
0.76
(0.5
2) b
0.21
(0.1
2) c
0.35
(0.2
3) a
0.28
(0.2
0) a
0.20
(0.1
5) a
1.28
99 (1
.201
1) a
0.63
36 (0
.631
7) a
b
0.12
69 (0
.126
4) b
0.35
39 (0
.207
8) a
0.27
28 (0
.402
3) a
0.04
34 (0
.078
1) a
0.00
48 (0
.045
8) a
0.00
76 (0
.028
6) a
0.00
84 (0
.007
2) a
-0.0
030
(0.0
160)
a
0.0
004
(0.0
256)
a
0.0
148
(0.0
124)
a
2.11
(d: 5
.34-
69.3
2, m
ean:
17.
3)
1.34
(d: 4
.20-
35.2
6, m
ean:
12.
2)
0.47
(d: 2
.91-
16.4
7, m
ean:
7.
2)
0.40
(d: 3
.21-
32.2
3, m
ean:
7.9
3)
1.26
(d: 4
.52-
10.0
6, m
ean:
7.1
1)
1.92
(d: 3
.57-
6.7
7, m
ean:
4.5
6)

Wood CO2 efflux and elevation
31
2.5 Discussion
Elevational changes of stem and root respiration – evidence for shifts in the relative
importance of root versus shoot growth with altitude
To our knowledge, our respiration data are the first reported values for tropical
mountain forests. Along our 2000-m elevational transect from 1050 to 3050 m, mean RS
decreased more than sixfold, whereas RR did not decrease significantly. Because we
investigated a large number of stems from different species representing the most abundant
families in the three forest stands, this marked decrease in CO2 efflux rates must be a general
trend across the altitudinal transect. Moreover, the altitudinal change in RS across the transect
coincides with a pronounced shift in the aboveground:belowground biomass ratio from 9:1 at
1050 m to 2:1 at 3050 m (Moser et al. 2008). Therefore, the apparent belowground shift of
respiratory activity may reflect differences in the ratio of growth respiration versus
maintenance respiration, with a priority of stem growth at lower elevations and a priority of
root growth and root activity at higher elevations.
Dendrometric measurements of stem and coarse woody root growth at our study sites
(G. Moser, unpublished data, Table 2.3) revealed a 4.5-fold decrease of relative basal area
increment per year for stems from 1050 to 3050 m, counteracted by a 4.8-fold increase in
annual coarse root basal area increment along the altitudinal gradient.
The reduction in stem growth and thus the decrease in stem respiratory activity with
increasing elevation is most likely a consequence of decreasing nitrogen availability and
reduced photosynthetic gain as a result of decreases in leaf area index and foliar nitrogen
concentration at high elevations (Leuschner et al. 2007). The observed coarse root biomass
increment along the gradient was paralleled by a pronounced increase in fine root biomass
(Moser et al. 2008). Increasing allocations of carbon and nutrients to belowground organs is
likely an adaptation to decreasing nutrient availability (Bloom et al. 1985). Soethe et al.
(2006) concluded that the large investment in the coarse woody root stock at the high-
elevation site is an adaptation ensuring tree anchorage on waterlogged and steep slopes at
3050 m elevation.
The lower values of RR relative to RS that were observed at all stand elevations
contrast with results commonly reported for coniferous forests. In pine forests, for example,
coarse root respiration was found to exceed stem and branch CO2 efflux two- to seven-fold
(Pinus radiata: Ryan et al. 1996, Ryan et al. 1997) or even up to ten-fold (Pinus strobus:
Vose and Ryan 2002). However, these data come from very different biomes.
Chapter 2
32
We are unaware of a study on stem or root respiration of trees along altitudinal transects in
the Tropics with which our data can be compared.
Mean RS was four times higher than RR at 1050 m, 2.7 times greater at 1890 m, but
about equal at 3050 m: a result of a decrease in RS while RR remained almost constant. The
similarity in respiration rates of plants growing across a thermal gradient (Körner and Larcher
1988) has been attributed to acclimation (Amthor 1994) or thermal homeostasis (Larigauderie
and Körner 1995). Such adaptation allows plants to meet their energy requirements even
when temperatures are low. However, the relative constancy of the coarse root respiratory
activity, which we observed with increasing altitude, despite a marked decline in stem CO2
release, is most likely the result of a shift in recourse allocation reflecting the changing
environmental conditions. Even though the number of roots measured was quite low, our
results closely mirrored the dendrometric studies of Moser et al. (2008) at the same sites,
showing an increase in coarse root growth with increasing altitude.
Temperature sensitivity of respiration in tropical mountain forests
By measuring CO2 efflux in 13 to 21 tree stems and 4 to 8 roots per stand, we
demonstrated a substantial within-plot variation in apparent respiratory activity (Figure 2.3).
The coefficient of variation in RS remained constant across the gradient, whereas only the
overall range in respiratory release decreased with elevation by two orders of magnitude from
1050 to 1890 m and by one order of magnitude from 1890 to 3050 m.
Similarly, Chambers et al. (2004) reported a variation of two orders of magnitude
(0.03 to 3.64 µmol m-2 s-1) within a stand. However, they focused on ecosystem exchange
rates without differentiating between tree families or species. Ryan et al. (1994) found that
stem CO2 release rates varied sevenfold between two tree species. In forest stands in central
Cameroon and the Brazilian Amazon, stem CO2 release rates from 14 and 13 tree families
ranged from 0.2 to 5.2 µmol m-2 s-1 and from 0.1 to 3.3 µmol m-2 s-1, respectively (Meir and
Grace 2002). Cavaleri et al. (2006) monitored different plant functional groups in a tropical
lowland rain forest in Costa Rica and found substantial differences in the CO2 efflux of stems
and branches of dicotyledonous tree species, lianas and palms. The comparable variation
among families in stem respiration along our altitudinal transect suggests that there is no
decrease in tree functional diversity towards the harsher environment close to the tree line.
Homogeneity among sites in the slopes of the respiratory responses to temperature per
site indicated that temperature sensitivity did not differ across elevations. Furthermore, the
small slopes suggest that temperature responsiveness is low in the trees of this tropical

Wood CO2 efflux and elevation
33
mountain rain forest. By contrast, regressions for individual trees revealed highly variable
response patterns within and between sites. The variability in response and the occurrence of
inverse temperature responses among coexisting trees could not be explained by taxonomic
status (family) or tree size (authors´ unpublished observations). Negative respiration-
temperature relationships as found at 1050 and 1890 m elevation may be attributable to
climatic effects on xylem sap flow which, in turn, affected the amount of CO2 released
through the bark (Gansert and Burgdorf 2005). It is also possible that the exceptionally dry
and hot weather during the measurement periods induced changes in respiratory activity. The
capacity to acclimate to short- (hours) or medium-term (days) changes, or both, in
temperature can vary greatly among individual plant species (Larigauderie and Körner 1995,
Atkin et al. 2005). Additionally, plants or organs able to acclimate rapidly by short-term
weather fluctuations may even show continuously changing temperature responsiveness as
found by Atkin et al. (2000) for leaf dark respiration of Eucalyptus pauciflora Sieb. ex
Spreng..
Based on absolute values, the mean slopes of the stem and coarse root response to
temperature were steeper at the higher elevation site, indicating a more pronounced thermal
sensitivity of the cold-grown plants. Higher Q10 values in plants grown in cold environments
compared with warm-grown ones were found by Tjoelker et al. (2001), whereas Larigauderie
and Körner (1995) found that the variability of leaf Q10 was unrelated to plant origin. Atkin et
al. (2005) concluded that a systematic variation in Q10 values does not exist and that
differences among contrasting biomes are relative and thus do not reflect an inherent variable
temperature responsiveness of characteristic plant species. However, our results showed that
the mean temperature sensitivity of stems and coarse roots was similar among the contrasting
thermal environments along the gradient, whereas the analyses of individual plant responses
showed that large differences in temperature responsiveness exist within the three study sites.
Given the homogeneity of mean slopes across the differing growth environments, any
differences in CO2 release rates across our gradient resulted from differences in the y-axis
intercept or respiration rate at 0 °C. Removing temperature as a confounding factor still
yielded a marked decrease in stem CO2 efflux from 1050 to 3050 m, indicating that
temperature might not be the primary influencing factor as underpinned by the low
temperature sensitivity found along the altitudinal gradient.

Chapter 2
34
Conclusions
Our respiration measurements along a tropical mountain transect indicate a shift from
high respiratory activity of stems compared with coarse roots at lower elevation (1050 m) to
an apparent equivalence of stem and coarse root CO2 efflux rates at 3050 m. The observed
decrease in the ratio of stem to root efflux rates with altitude may be explained by the
substantial decrease in stem growth, while coarse root growth increased with increasing
elevation. We found that responses of CO2 release rates of woody tissue to changes in
temperature differed greatly between study sites, as well as among species and plant organs,
with the underlying mechanisms remaining unclear. The remarkable variation in respiratory
activity and, most importantly, in temperature response of respiration suggests that
predictions at the community level or even estimates for entire ecosystems on the basis of few
point measurements of selected plant species must be interpreted cautiously. Because there
was great variation in acclimation pattern among plants and between sites, questions about the
response of plant community CO2 efflux to climate change should principally be answered at
the community level (Larigauderie and Körner 1995).
Acknowledgements
For helpful advice and technical support during the field measurements we thank
Reiner Zimmermann and Manfred Küppers (University of Hohenheim). We thank Florian
Werner (University of Goettingen) for invaluable contributions on early versions of the
manuscript. We are grateful to Gerald Moser (University of Goettingen) for contributing data
on tree growth and general stand characteristics. We also thank our field assistants Tati,
Polivio, Abraham and others for their patient and careful help in carrying the heavy
equipment. We gratefully acknowledge the financial support obtained from DFG (German
Science Foundation) through a grant in the Research Unit 402 (Functionality in a Tropical
Mountain Rainforest, subproject B6). We thank the Ministerio del Ambiente Loja-Zamora for
the research permit, and the Fundación Científica San Francisco (Nature and Culture
International) for the ongoing support at Estación Científica San Francisco.

Wood CO2 efflux and elevation
35
2.6 References
Amthor JS (1994) Plant respiratory responses to the environment and their effects on the
carbon balance. In: Plant-environment interactions. (ed. Wilkinson RE). Marcel Dekker,
New York, pp. 501-554.
Amthor JS (2000) The McCree-de Wit-Penning de Vries-Thornley respiration paradigms: 30
years later. Annals of Botany 86, 1-20.
Atkin OK, Holly C, Ball MC (2000) Acclimation of snow gum (Eucalyptus pauciflora) leaf
respiration to seasonal and diurnal variations in temperature: the importance of changes in
capacity and temperature sensitivity of respiration. Plant Cell and Environment 23, 15-26.
Atkin OK, Bruhn D, Hurry VM, Tjoelker MG (2005) The hot and the cold: unravelling the
variable response of plant respiration to temperature. Functional Plant Biology 32, 87-
105.
Bloom AJ, Chapin FS III, Mooney HA (1985) Resource limitation in plants – an economic
analogy. Annual Review of Ecological Systematic 16, 363-392.
Cavaleri MA, Oberbauer SF, Ryan MG (2006) Wood CO2 efflux in a primary tropical rain
forest. Global Change Biology 12, 2442-2458.
Cavieres AL, Rada F, Azócar A, García-Núnez C, Cabrera HM (2000) Gas exchange and low
temperature resistance in two tropical high mountain tree species from the Venezuelan
Andes. Acta Oecologia 21, 203-211.
Chambers JQ, Tribuzy ES, Toledo LC, Crispim BF, Higuchi N, Dos Santos J, Araújo AC,
Kruijt B, Nobre AS, Trumbore SE (2004) Respiration from a tropical forest ecosystem:
Partitioning of sources and low carbon use efficiency. Ecological Applications 14, 72-88.
Emck P (2007) A climatology of South Ecuador. PhD Thesis, University of Erlangen,
Germany, pp. 272.
Gansert D, Burkdorf M (2005) Effects of xylem sap flow on carbon dioxide efflux from stems
of birch (Betula pendula Roth). Flora 200, 444-455.
Horna V, Zimmermann R (2000) Carbon release from stems and branches of two tree species
with contrasting phenology in a seasonally flooded Amazon forest. In: Neotropical
Ecosystems, Proceedings of the German-Brazilian Workshop. (eds. Lieberei R, Bianchi
H-K, Boehm V, Reisdorff C). GKSS-Geesthacht, Hamburg, pp. 579-587.
Körner C, Larcher W (1988) Plant life in cold environments. In: Plants and Temperature.
Symposium of the Society of Experimental Biology Vol. 42. (eds. Long SP, Woodward
FI). The Company of Biologists, Cambridge, pp. 25-57.

Chapter 2
36
Larigauderie A, Körner C (1995) Acclimation of dark leaf respiration in alpine and lowland
plant species. Annals of Botany 76, 245-252.
Lavigne MB, Franklin SE, Hunt ER Jr. (1996) Estimating stem maintenance respiration rates
of dissimilar balsam fir stands. Tree Physiology 16, 687-695.
Leuschner C, Moser G, Bertsch C, Röderstein M, Hertel D (2007) Large altitudinal increase
in the tree root/shoot ratio in tropical mountain forests of Ecuador. Basic and Applied
Ecology 8, 219-230.
Levy PE, Jarvis PG (1998) Stem CO2 fluxes in two Sahelian shrub species (Guiera
sengalensis and Combretum micranthum). Functional Ecology 12, 107-116.
Levy PE, Meir P, Allen SJ, Jarvis PG (1999) The effect of aqueous transport of CO2 in xylem
sap on gas exchange of woody plants. Tree Physiology 19, 53-59.
McGuire MA, Teskey RO (2002) Microelectrode technique for in situ measurement of carbon
dioxide concentrations in xylem sap of trees. Tree Physiology 22, 807-811.
Meir P, Grace J (2002) Scaling relationship for woody tissue respiration in two tropical rain
forests. Plant, Cell and Environment 25, 963-973.
Moser G (2008) Elevation effects on key processes of carbon cycling in south Ecuadorian
mountain forests. PhD Thesis, University of Göttingen, Germany, pp. 125.
Moser G, Roederstein M, Soethe N, Hertel D, Leuschner C (2008) Altitudinal changes in
stand structure and biomass allocation of tropical mountain forests in relation to
microclimate and soil chemistry: a transect study in Ecuador and a neotropical meta-
analysis. In: Gradients in tropical mountain ecosystems of Ecuador. (eds. Beck E, J
Bendix, I Kottke, F Makeschin, R Mosandl). Springer Verlag, Berlin Heidelberg,
Ecological Studies 198, 229-242.
Müller D, J Nielson (1965) Production brute, pertes par respiration e production nette dans la
foret ombrophile tropicale. Fortsliche Forsogsvaes Danmark 29, 69-160.
Röderstein M, Hertel D, Leuschner C (2005) Above- and below-ground litter production in
three tropical mountain forests (South Ecuador). Journal of Tropical Ecology 21, 483-492
Ryan MG, Hubbard RM, Clark DA, Sanford RL Jr (1994) Woody-tissue respiration of
Simarouba amara and Minquartia guinensis, two wet forest trees with different growth
habits. Oecologia 100, 213-220.
Ryan MG, Gower ST, Hubbard RM, Waring RH, Gholz HL, Cropper WP, Running SW,
(1995) Woody tissue maintenance respiration of four conifers in contrasting climates.
Oecologia 101, 133-140.
Wood CO2 efflux and elevation
37
Ryan MG, Hubbard RM, Pongracic S, Raison RJ, McMurtie RE (1996) Foliage, fine-root,
woody-tissue and stand respiration in Pinus radiata in relation to nitrogen status. Tree
Physiology 16, 333-343.
Ryan MG, Lavigne MB, Gower ST (1997) Annual carbon costs of autotrophic respiration in
boreal forest ecosystems in relation to species and climate. Journal of Geophysical
Research 102, 28, 871-883.
Schrumpf M, Guggenberger G, Schubert C, Valarezo C, Zech W (2001) Tropical montane
rain forest soils - development and nutrient status along an altitudinal gradient in the south
Ecuadorian Andes. Die Erde 132, 43-59.
Soethe N, Lehmann J, Engels C (2006) The vertical pattern of rooting and nutrient uptake at
different altitudes of a south Ecuadorian montane forest. Plan and Soil 286, 287-299.
Sprugel DG, Benecke U (1991) Measuring woody-tissue respiration and photosynthesis. In:
Techniques and approaches in forest tree ecophysiology (eds. Lassoie JP, Hinckley T)
CRC-Press Inc, Boston, pp. 329-355.
Teskey RO, McGuire MA (2002) Carbon dioxide transport in xylem causes errors in
estimation of rates of respiration in stems and branches of trees. Plant Cell and
Environment 25, 1571-1577.
Tjoelker MG, Oleksyn J, Reich PB (2001) Modelling respiration of vegetation: evidence for a
general temperature-dependent Q10. Global Change Biology 7, 223-230.
Trumbore S (2006) Carbon respired by terrestrial ecosystems – recent progress and
challenges. Global Change Biology 12, 141-153.
Voss JM, Ryan MG (2002) Seasonal respiration of foliage, fine roots, and woody tissue in
relation to growth, tissue N, and photosynthesis. Global Change Biology, 8, 182-193.
Whitmore TC (1984) Tropical rainforests of the Far East. 2nd Edn. Clarendon Press Oxford,
pp. 351.
Yoda K (1967) Comparative ecological studies on three main types of forest vegetation in
Thailand. III. Community Respiration. Nature Life SE Asia 5, 83-148.

Chapter 3
38
DIVERGING TEMPERATURE RESPONSE OF
TREE STEM CO2 EFFLUX TO DRY AND WET SEASON CONDITIONS
IN A TROPICAL MONTANE MOIST FOREST
ALEXANDRA ZACH, VIVIANA HORNA AND CHRISTOPH LEUSCHNER SUBMITTED TO: TREES - STRUCTURE AND FUNCTION
3 Chapter

Temperature response of stem CO2 efflux
39
3.1 Abstract
It is commonly presumed that plant respiratory CO2 release increases with increasing
temperature. However, we report on very contrasting stem CO2 release (RS)-temperature
relationships of trees in a species-rich tropical montane forest of southern Ecuador under dry
and wet season conditions. Rates of RS were low and completely uncoupled from the dial
temperature regime during the humid season. In contrast, during the dry season, RS was
generally higher and temperature sensitivity of RS differed greatly in degree and even in the
direction of response, indicating that temperature might not be the only determinant of RS. In
order to explain the heterogeneity of RS, we related RS to vapour pressure deficit, wind speed
and solar radiation as important abiotic drivers influencing transpiration and photosynthesis.
Stepwise multiple regression analyses with these meteorological predictors were either biased
by high collinearity of the independent variables or could not enhance the ability to explain
the variability of RS. We assume maintenance respiration to dominate under humid conditions
unfavourable for energy acquisition of the tree, thus explaining the pronounced uncoupling of
RS from atmospheric parameters. In contrast, the drier and hotter climate of the dry season
seems to favour RS via enhanced assimilatory substrate delivery and stem respiratory activity
as well as elevated xylem sap CO2 imports with increased transpiration. In addition, tree
individual differences in the temperature responses of RS may mirror diverging climatic
adaptations of co-existing moist forest tree species which have their distribution centre either
at higher or lower elevations.
Keywords: climatic adaptation, Ecuador, stem respiration, temperature sensitivity of
respiration, tree species richness

Chapter 3
40
3.2 Introduction
Temperature has long been identified as the most important abiotic factor influencing
plant respiratory activity due to its well known affect on enzymatic reactions (e.g. Amthor
1989). A strong relationship between temperature and plant tissue respiration has been
exhaustively proved and verified under controlled conditions (e.g. Maier et al. 1998, Tjoelker
et al. 1999, Atkin et al. 2000, Tjoelker et al. 2001, Loveys et al. 2003, Armstrong et al. 2006,
Atkin et al. 2006, Atkin et al. 2007). However, in the field, a consistent relationship is often
not found (e.g. Edwards and McLaughlin 1978, Negisi 1982, Lavigne 1987, Gunderson et al.
2000, Teskey and McGuire 2002). Especially woody tissue respiration is reported not to be
exclusively related to temperature since other sources of CO2 than the respiratory activity of
living wood cells (inner bark, cambium, xylem parenchyma) alone can influence the apparent
amount of CO2 escaping through the bark. Imports of dissolved CO2 via the transpiration
stream can add substantial amounts to the stem internal carbon dioxide. The quantitative
contribution of the different sources to the internal flux of CO2 was found to vary
considerably on a seasonal as well as daily basis. Consequently, stem internal CO2
concentrations can constantly fluctuate, which in turn can affect the amount of CO2 diffusing
out of the bark (e.g. McGuire and Teskey 2004, Teskey et al. 2008, Saveyn et al. 2008ab).
Stem respiration usually depends on substrate availability, the demand for energy
equivalents and the enzymatic activity (Amthor 1995, Lambers et al. 1998, Pruyn et al. 2002,
2005, Atkin et al. 2005). However, it is still barely understood how stem CO2 release (RS) is
finally controlled and how internally circulating CO2 is influencing the apparent efflux. High
rates of RS coincided with high xylem sap fluxes (Levy and Jarvis 1998, Levy et al. 1999,
Horna and Zimmermann 2000). Other studies reported a negative correlation between xylem
flux and radial CO2 efflux (Negisi 1979, Edwards and Hanson 1996, Teskey and McGuire
2002, Gansert and Burgdorf 2005, Teskey and McGuire 2007). All these studies suggested
that RS might be linked to canopy water use. However, removing the foliage had little effect
on the dial pattern of RS in an experiment of Maier and Clinton (2006). No relationship
between sap flow and RS was found by Ceschia (2001), Carey et al. (1996) and Edwards and
Wullschleger (2000). Studies of xylem sap flow were mainly conducted on coniferous (Carey
et al. 1996, Maier and Clinton 2006) or deciduous (Edwards and Hanson 1996, Ceschia 2001,
Gansert and Burgdorf 2005, Teskey and McGuire 2007) tree species of temperate climates.
Results of one single tree (Ceschia et al. 2006, Gansert and Burgdorf 2005, McGuire and
Teskey 2002, Saveyn et al. 2008a) or of few individuals of the same species (McGuire and

Temperature response of stem CO2 efflux
41
Teskey 2007, Maier and Clinton 2006, Saveyn et al. 2008b) have been used to generalize
trends in the influence of internal CO2 on apparent CO2 efflux rates.
However, on the ecosystem level the picture gets more complicated due to the fact that
co-occurring plants are responding individualistically to their specific environment and
probably even more so to shifts in the environmental setting (Larigauderie and Körner 1995,
Arnone and Körner 1997, Amthor 1989, Oren and Pataki 2001, Reich et al. 2003, Atkin et al.
2005, Kerkhoff et al. 2005, Enquist et al. 2007). A better understanding of the variability in
RS among different individuals in a population, different species in a stand, and different
patches of the forest is therefore crucial to predict changes in the carbon dioxide exchange
between tree wood and the atmosphere, in particular in highly diverse tropical forests
(Kerkhoff et al. 2005, Enquist et al. 2007).
In this paper, we report on in situ-measurements of the diurnal rates of RS of
representative tree species in a tropical montane moist forest in southern Ecuador during two
hydrologically contrasting seasons of the year. Under the prevailing moist conditions, mean
annual temperature is relatively low and diurnal temperature amplitudes are small. In contrast,
the short dry season climate is characterized by exceptionally high day-time and low night-
time temperatures. Trees of this ecosystem have to cope with constantly low temperatures,
compared to lowland forests, while being exposed to unpredictable short-term microclimatic
shifts. The objectives of this study were (i) to analyse the temperature-response of RS of
adapted moist forest tree species during two contrasting seasons, i.e sunny-dry versus cloudy-
moist weather conditions, and (ii) to compare patterns of RS of eight co-existing tree species
from seven families for quantifying variability between trees. Linear regression analyses and
stepwise multiple regressions with selected meteorological factors (vapour pressure deficit,
wind speed, solar radiation) were used to take account of abiotic drivers controlling
transpiration and photosynthesis, which may affect RS under contrasting climatic conditions.
We hypothesize that plant inherent factors and external variables apart from temperature are
playing an important role in determining the apparent RS at the level of individual trees.
Chapter 3
42
3.3 Materials & Methods
Study area and tree selection
The study was conducted in the Reserva San Francisco (RSF) adjacent to the
Podocarpus National Park (PNP) on the eastern slopes of the southern Ecuadorian Andes. The
study site (S 03°58`345``/ W 79°04`648``) is located at 1890 m elevation and covered by a
species-rich lower montane forest of about 12 m in height. Forest structure and species
composition are described in more detail by Röderstein et al. (2005) and Leuschner et al.
(2007). The soils of the region developed from metamorphic shale, quartzite and sandstone
bedrock; they are characterized by low fertility (Schrumpf et al. 2001).
Within the stand we selected 20 mature canopy trees representing abundant families
and comprising a broad range of stem diameters. Further details on tree selection are given in
Zach et al. (2008) (see Chapter 2 and Appendix 1).
For the exemplary study on the impacts of the dry season conditions on stem
respiratory activity we restricted analysis to 10 out of the 20 mature canopy trees sampled
(Table 3.1). These 10 trees had been measured during a pronounced dry season period
characterized by high ambient temperature, high vapour pressure deficits (D) and declining
soil water availability (Figure 3.1). The remainder 10 trees were measured one week earlier,
when some rain fell, which did not allow for an appropriate comparison of wet and dry season
respiratory patterns. The tree selection comprised canopy tree species of 7 families (Table
3.1). Most of the tree species were represented by only one individual, except Miconia
punctata and Matayba inelegans of which each two individuals of similar size were sampled
(Table 3.1). Trees were equipped with dendrometer bands for increment measurements.
Rates of stem CO2 release (RS) of the selected tree individuals were measured during
four days in the dry period in November 2005(DOY 324-327; Figure 3.1) and four days
during the humid season in April 2006 (DOY 117-120). For each tree we conducted one 24-
hrs-course of RS. Diurnal values were averaged to calculate the mean daily rate of RS of each
tree (Table 3.1), while the entire dataset was used for regression analysis (Table 3.2, Figure
3.2). RS was monitored at breast height (1.3 m) using the mobile 6-chamber respiration
system ANARESY 2 (Walz, Effeltrich, Germany) and an integrated LI-7000 infrared gas
analyzer for CO2 and H2O (Li-Cor, Inc., Lincoln, NE, USA) running in differential mode.
Details of the technical equipment are provided in Zach et al. (2008; Chapter 2).

Temperature response of stem CO2 efflux
43
Tab
le 3
.1. M
ean
stem
CO
2 rel
ease
rate
(RS,
µmol
CO
2 m-2
s-1) o
f ind
ivid
ual t
rees
at t
he st
udy
site
at
189
0 m
ele
vatio
n as
mea
sure
d du
ring
the
dry
(RS d
ry) a
nd d
urin
g th
e hu
mid
(RS w
et) s
easo
n of
th
e ye
ar. R
elat
ive
stem
dia
met
er in
crem
ent (
in %
) as
det
erm
ined
bet
wee
n Se
ptem
ber
2005
and
A
pril
2006
. d=
stem
dia
met
er in
cm
, h=
stem
hei
ght i
n m
, SD
in p
aren
thes
es.
Abb
r.
Spec
ies
Fam
ily
d
h
R
S dry
R
S wet
St
em d
iam
eter
in
crem
ent
Cr
Cle
thra
revo
luta
C
leth
race
ae
23.4
512
.69
0.99
(0.1
0)
0.41
(0.0
9)
0.68
Eo
Endl
iche
ria
oreo
cola
La
urac
eae
20.8
010
.00
0.87
(0.2
4)
0.14
(0.0
7)
0.05
Ge
Gra
ffenr
ieda
em
argi
nata
M
elas
tom
atac
eae
26.1
116
.54
0.61
(0.1
8)
0.07
(0.1
0)
0
Hm
H
yero
nim
a m
oritz
iana
Eu
phor
biac
eae
9.52
13.7
00.
39 (0
.13)
0.
22 (0
.07)
1.
17
Ia
Ilex
am
boro
ica
Aqu
ifolia
ceae
9.
637.
500.
18 (0
.11)
0.
33 (0
.07)
?
Lo
Lade
nber
gia
cf o
blon
gifo
lia
Rub
iace
ae
9.48
7.92
0.28
(0.0
8)
0.19
(0.0
8)
?
Mi1
M
atay
ba in
eleg
ans
Sapi
ndac
eae
8.17
8.30
0.85
(0.2
2)
0.40
(0.1
1)
0.98
Mi2
M
atay
ba in
eleg
ans
Sapi
ndac
eae
10.5
312
.70
1.04
(0.3
4)
0.64
(0.1
8)
?
Mp1
M
icon
ia p
unct
ata
Mel
asto
mat
acea
e 10
.62
14.0
51.
34 (0
.26)
0.
52 (0
.07)
?
Mp2
M
icon
ia p
unct
ata
Mel
asto
mat
acea
e 12
.00
7.06
0.57
(0.1
1)
0.64
(0.1
1)
0

Chapter 3
44
Air temperature (TA) and relative air humidity at 2 m height inside the stand were monitored
using a Rotronic sensor (Rotronic AG, Bassersdorf, Switzerland) connected to the data logger
of the ANARESY system (CR 10, Campbell Scientific, Logan, UT, USA). Thermocouples
(diameter: 3 mm, length: 20 mm, Siemens, Munich, Germany) for tissue temperature (TT)
measurement were installed at breast height (depth: 10 mm) at two arbitrarily chosen tree
stems (DBH: 15 and 20 cm) in July 2006 for continuous measurements. We used data from
July/August 2006 and November 2006 to establish relationships between the continuously
recorded air temperature and tissue temperature:
(1) wet season: TT = 19.74 * (1- exp(-0.0888 TA
)) (adj r² = 0.83, p < 0.0001)
(2) dry season: TT = 23.13 * (1- exp(-0.0736 TA
)) (adj r² = 0.87, p < 0.0001)
where TA is the air temperature measured inside the stand. These equations were used to
calculate tissue temperature from air temperature in all periods where tissue temperature was
not recorded.
Climatic conditions of the measurement periods
In general, the climate of the study area is humid throughout the year. However, an
extremely wet period (April to July) is followed by several months with less frequent rainfall
(September to December) (Bendix et al. 2006). Mean annual precipitation at 1960m a.s.l. is
ca. 2200 mm (Emck 2007), annual mean air temperature is 15.7 °C and relative humidity
90.7% (Moser et al. 2008).
During November 2005, foehn winds caused an exceptionally dry and sunny period
throughout the study area. Fires occurred frequently throughout the wider region during this
period. Only 90 mm of rainfall were recorded in November, which fell during the first two
weeks (M. Richter, unpublished data). When we started respiration measurements end of
November, the rainless period had already lasted for seven days. The lack of rainfall resulted
in a substantial decrease of air humidity and an increase of daily temperature amplitudes
compared to the wet season conditions. Vapour pressure deficit (D) continuously increased
during the three consecutive measurement days in November (Figure 3.1, data recorded by M.
Richter at a nearby climate station, unpublished). Substantially higher wind speeds were
recorded during the dry period compared to the humid days (Figure 3.1).

Temperature response of stem CO2 efflux
45
The average soil water matric potential (ψS) as measured in adjacent forest sites at
2000 m progressively decreased during the measurement days in November from -0.15 (±
0.13) to -0.24 (± 0.12) MPa at 15 cm depth and from - 0.10 (± 0.09) to - 0.19 (± 0.12) MPa at
30 cm (S. Engelhardt, unpublished data). Minimum values of – 0.60 MPa (15 cm) and – 0.49
MPa (30 cm) were recorded at the end of the measurements (Figure 3.1).
The measurement campaign in the wet period was conducted at the beginning of the
humid season in April 2006. During this month precipitation was frequent. Low diurnal
temperature amplitudes and a moderate vapour pressure deficit were characteristic for this
season (Figure 3.1). Data of the soil matric potential were only available for the last two
measurement days. This data indicates that soil moisture exceeded field capacity with
potential values greater than -0.1 MPa (S. Engelhardt, unpublished data).
Data treatment
The stem CO2 release rates (RS) were calculated as:
(3) RS = D [CO2] * F/ Ac
where RS is the CO2 release rate (µmol CO2 m-2 s-1), D [CO2] is the difference between
ambient (reference gas) and chamber (sample gas) CO2 concentration, F is the molar air flow
rate (mol s-1) which passes through the chamber, and Ac is the surface area (m2) of the
enclosed stem segment. In an earlier study (Zach et al. 2008, Chapter 2) we found better
agreement when relating the apparent CO2 efflux rates to stem surface area than to volume.
We chose the slope of the regression curve of RS on temperature as a measure of the
temperature sensitivity of respiration instead of the commonly used Q10 value. The Q10 of
respiration (i.e., the factor expressing the proportional change in respiratory CO2 release per
10 °C rise in temperature) basically compares the CO2 efflux rate at a given temperature to
that at a 10 °C lower temperature (Atkin et al. 2005). Plant respiration is a process influenced
by various environmental factors. Consequently, neither the Arrhenius nor the Q10 model has
been found to adequately describe the observed temperature response of respiration under
field conditions. For that reason, reported measures of temperature responsiveness have to be
treated with caution (Tjoelker et al. 2001, Atkin and Tjoelker 2003). In addition, there is
evidence that the respiratory response to temperature is neither constant nor necessarily
exponential (Atkin et al. 2000, Atkin and Tjoelker 2003, Atkin et al. 2005). Instead of
focussing on two single data points on the temperature axis, we used the entire diurnal dataset
of RS for analysing the temperature dependency of RS.

Chapter 3
46
One important source of variation in diurnal and seasonal RS is the internal transport of
dissolved CO2 in the transpiration stream influencing the apparent CO2 release through the
bark (Edwards and Hanson 1996, Levy and Jarvis 1998, Teskey and McGuire 2002, Gansert
and Burgdorf 2005, Teskey and McGuire 2007). Because we did not measure xylem sap flow
directly, we used D, wind speed and solar radiation as the main determinants of transpiration
in our regression analysis in the attempt to explain the large heterogeneity of RS.
By means of linear regression we analyzed the temperature responsiveness of RS for
each tree individual during the dry and humid season. For each tree, rates of RS were plotted
against the respective courses of TT and TA using either the diurnal dataset, or by considering
only day-time or night-time values. To improve the explanatory power of the regression
equation, we conducted linear regression analyses with the three additional meteorological
predictor variables (D, wind speed, solar radiation). Using coefficient of determination (r²),
we quantified the influence of these four variables on RS. If more than one predictor showed
significant effects we conducted stepwise multiple regression analyses (α = 0.05 for tolerance,
collinearity |ζ| < 0.6) to determine main causes of diurnal, day-time and night-time stem CO2
efflux variability. Subsequently, multiple regression analyses were repeatedly applied by
removing factors with no significant influence (p < 0.05) until each individual tree model
reached maximum likelihood (F-test, p-value).
3.4 Results
Stem CO2 release and its temperature responsiveness under dry and humid conditions
Mean daily RS was highly variable and ranged from 0.18 to 1.34 µmol m-2s-1 during
the dry, and between 0.07 and 0.64 µmol m-2s-1 during the humid period (Table 3.1). Mean
daily TT ranged between 15.7 and 16.8 °C during the dry (minimum 10.1 °C, maximum 19.9
°C), and between 14.5 and 14.9 °C during the humid season (minimum 10.8 °C, maximum
17.5 °C). In most cases, RS was higher during the dry period than under cooler and more
humid conditions. Between September 2005 and April 2006, stem diameter increment was
very low (Table 3.1). Due to dendrometer defects diameter increment could not be determined
for all trees.
Among regression models, we found linear regression to give the most appropriate fit
for the relationship between RS and temperature for both periods (Figure 3.2). The respective
correlation between RS and TT or TA did not differ (not shown).

Temperature response of stem CO2 efflux
47
Under dry season conditions, the response of RS to TT was highly divergent and
showed strong discrepancies in the direction of response between different tree individuals.
Moreover, the eight measured species showed contrasting patterns in their temperature
response of RS. Besides the commonly expected positive relationship, RS was significantly
negative correlated with temperature or completely uncoupled from changes in temperature in
certain cases (Figure 3.2). In the dry season, the temperature responsiveness of RS differed
between day-time and night-time periods. In most of the cases, we found better correlations
with data separated into day-time and night-time values than with the diurnal datasets. While
most of the tree stems were more responsive to temperature during day-time hours, we found
three tree species showing a higher temperature coupling during the night (Ia, Mi1, Cr; Table
3.2). The general temperature responsiveness of RS was unexpectedly low. For most of the
tree individuals, plotting diurnal RS against TT yielded r² values of less than 0.5. In two of the
ten measured tree species, TT could explain more than 70% of the variability in the diurnal RS.
One tree of the species, Hyeronima moritziana (Hm) showed no significant relation to TT
under dry season conditions neither during the day nor the night (Table 3.2).
In the humid season, RS was mostly uncoupled from temperature; only in some cases a
very weak correlation was observed (Table 3.2). Two trees showed significant relationships in
the diurnal dataset (r²= 0.13 and 0.23). Two other trees were weakly, though significantly,
correlated with TT during night-time only (r²= 0.22 and 0.23). For the remainder species, no
differences in the temperature sensitivity of RS between day- and night-time were apparent in
the humid season.

Chapter 3
48
Figure 3.1. Climate data for the measurement periods in November 2005 (dry season) and April 2006 (wet season) as recorded at a nearby climate station at 2000 m a.s.l. (M. Richter, unpublished data). Vapour pressure deficit (D) was calculated from the climate station data (Dout) and from climate data recorded inside the forest site at 2 m above ground (Din). Soil matric potential (ψS) was measured at adjacent forest sites at 2000 m (S. Engelhardt, unpublished data).
Dependence of stem CO2 release on other meteorological predictors under dry and humid
conditions
RS was linearly related to all four selected meteorological parameters (not shown).
Nevertheless, neither D nor wind speed or solar radiation improved the explanatory power of
the regressions with respect to RS variability under dry or humid conditions. Trees showing a
significant relationship to TT also yielded comparable correlations to the other climatological
parameters, most likely as a result of tight intercorrelation between the parameters. In most
cases, stepwise multiple regression analysis was not applicable due to the high collinearity of
the meteorological variables (ζ > 0.6). An exception was wind speed, which was generally
less correlated to TT, D or solar radiation (ζ < 0.5).

Temperature response of stem CO2 efflux
49
Figure 3.2. Stem CO2 release rates of 10 tree individuals at 1890 m elevation plotted against tissue temperature. Tissue temperature was calculated from air temperature with equation (1) and (2). Separate regression lines are given for the dry season (November 2005, ○) and the humid season (April 2006, ●) for each tree individual. Coefficients of determination are given in Table 3.2. For key to species abbreviations see Table 3.1.

Chapter 3
50
Wind speed and radiation were the main determinants of the diurnal variation in RS of
Graffenrieda emarginata (Ge) during the dry season, explaining half of the variability (model
adj. r² = 0.497, F = 23.25, p < 0.0001); the correlation with radiation was a negative one
(Table 3.2). Wind speed alone was the most important factor controlling the diurnal variation
in RS of Matayba inelegans (Mi1) during the dry season (model adj. r² = 0.337, F = 24.45, p <
0.0001); again, the relation was a negative one. Wind speed improved the regression model
by explaining further 10.2% of the diurnal variation in RS in Miconia punctata (Mp1).
Together with TT, both parameters could explain 57.7% of the variability in diurnal RS in the
dry period (F = 31.07, p < 0.0001). For the remaining tree species, multiple regression
analysis either was not appropriate or could not improve the explanatory power of the model
in comparison to a single-factor model with TT alone (Table 3.2).
Under humid conditions, the variability of RS could not be explained by any of the
meteorological parameters. A few tree species showed significant, yet very weak, correlations
to some of the predictors (Table 3.2). An exception was the night-time variability in RS in
Matayba inelegans (Mi1), which was strong and negatively related to D (r² = 0.59).
3.5 Discussion
Sources of variation in humid season stem respiration
During the humid measurement period, RS was independent of TT (Figure 3.2), and
also seemed to be unaffected by any of the other investigated meteorological parameters
(Table 3.2). Plant respiratory activity is thought to be determined by three processes, substrate
supply, demand for respiratory products and potential enzyme capacity (Amthor 1995,
Lambers et al. 1998, Atkin et al. 2005). Limited light availability due to cloud cover is known
to strongly reduce net carbon gain of tropical forests on a seasonal as well as daily basis
(Hollinger et al. 1994, Chen et al. 1999, Graham et al. 2003). In the humid season with
frequent cloudiness and rainfall in the Ecuadorian Andes, assimilation rates must have been
impeded, thus restricting carbohydrate supply. Porometric measurements conducted on
mature canopy trees at nearby forest sites in the Podocarpus National Park showed that leaf
transpiration and xylem sap flow of the tropical montane trees were substantially repressed
during cloudy days and under high atmospheric humidity (Motzer et al. 2005). This may
reduce the transport of dissolved CO2 with xylem water from the roots to the stem.

Temperature response of stem CO2 efflux
51
Tab
le 3
.2. P
ears
on´s
coe
ffic
ient
s of
det
erm
inat
ion
(r²)
of li
near
regr
essi
on a
naly
ses
of s
tem
CO
2 rel
ease
of 1
0 tre
es o
n m
eteo
rolo
gica
l pre
dict
ors
(TT
= tis
sue
tem
pera
ture
, °C
; D =
vap
our p
ress
ure
defic
it as
cal
cula
ted
from
tem
pera
ture
and
air
hum
idity
from
a c
limat
e st
atio
n at
196
0 m
a.s.
l.,
kPa;
w =
win
d sp
eed
as re
cord
ed a
t a c
limat
e st
atio
n ou
tsid
e th
e fo
rest
, m s
-1; r
ad =
sol
ar ra
diat
ion
as re
cord
ed o
utsi
de th
e fo
rest
, W m
-2).
Giv
en
are
resu
lts o
f reg
ress
ion
anal
yses
of t
he d
iurn
al (d
ay),
day-
time
(dt)
and
nigh
t-tim
e (n
t) da
ta s
et o
f eac
h tre
e in
divi
dual
mea
sure
d fo
r the
dry
and
th
e w
et se
ason
. Sig
nific
ant c
orre
latio
ns (p
< 0
.05)
are
prin
ted
in b
old.
Mi1
*- d
ata
calc
ulat
ed b
y om
ittin
g tw
o ou
tlyin
g da
ta p
oint
s mea
sure
d du
ring
nigh
t-tim
e. F
or k
ey to
spec
ies a
bbre
viat
ions
see
Tabl
e 3.
1.
T T
D
w
ra
d
Dry
da
y dt
nt
day
dt
nt
day
dtnt
day
dt
C
r 0.
38
0.26
- 0
.30
0.
56
0.42
0.
07
0.31
0.
090
0.
55
0.38
Eo
0.
49
0.53
0.
34
0.
45
0.51
0.
31
0.18
0.
190.
21
0.
19
0.16
G
e - 0
.31
0.12
0.
05
- 0
.24
0.03
0
0.
25
0.36
0.18
- 0.2
1 0.
03
Hm
0.
02
0 0.
01
0.
03
0 0
0.
01
0.04
0
0.03
0
Ia
- 0.2
2 0.
14
- 0.5
6
- 0.1
3 0.
09
- 0.4
9
- 0.1
3 0.
10- 0
.23
0.
01
0 Lo
0.
10
0.12
0.
02
0.
11
0.16
0.
04
0.01
0
0.03
0.01
0
Mi1
0.
23
0.23
0.
36
0.
05
0.04
0.
1
- 0.3
5 - 0
.37
- 0.3
2
0.02
0
Mi1
*
0.
80
0.09
- 0
.62
M
i2
0.87
0.
89
0.67
0.68
0.
66
0.05
0.
27
0.05
0.03
0.49
0.
30
Mp1
0.
49
0.68
0.
55
0.
39
0.65
0.
39
0.38
0.
420.
39
0.
14
0.26
M
p2
0.77
0.
76
0.31
0.64
0.
53
0
0.22
0.
020
0.
37
0.11
Wet
C
r 0
0.1
0
0.04
- 0
.31
0.02
0.
03
0.02
0
0 0.
02
Eo
0.13
0.
27
0.13
0.16
0.
25
0.11
0.
03
0.25
- 0.2
3
0.20
0.
29
Ge
0 0.
01
0.11
0 0.
06
0
0.10
0.
020.
04
0.
06
0.02
H
m
0 0.
04
0.05
0.02
0.
09
0.07
0.
08
0.11
- 0.4
3
0.03
0.
15
Ia
0.03
0
0.06
0.02
0
0.01
0
00.
09
0.
01
0 Lo
0
0.02
0.
22
0
0 0.
17
0.11
0.
010.
24
0
0 M
i1
0 0.
09
0.04
0 0.
11
- 0.5
9
0 0.
080.
21
0.
01
0.08
M
i2
0.03
0.
03
0.23
0 0.
04
0.03
0.
03
- 0.3
60.
07
0.
09
- 0.4
1 M
p1
0.08
0.
04
0.15
- 0.1
6 0.
02
0.11
0.
06
0.13
0
- 0.1
9 0.
08
Mp2
0.
21
0.28
0.
06
0.
24
0.42
0.
03
0 0.
200
0.
18
0.26

Chapter 3
52
However, amount and concentration of xylem sap CO2 mainly depend on the
respiratory activity of the root system involved, while smaller amounts of CO2 may also be
taken up with the soil water. Differences in fine root respiration among the measured tree
individuals remain unknown as well as the quantitative contribution of root respiratory CO2
release to the transpiration stream, which might finally lower or raise rates of CO2 release
through the bark. We assume that several factors have contributed to a slowed down RS and a
low temperature sensitivity of RS, among which reduced substrate supply from
photosynthesis, less demand for respiratory products under somewhat cooler temperatures,
and a probably lower contribution of CO2 from the transpiration stream are the most likely.
Sources of variation in dry season stem CO2 release
The dry-season RS exceeded the wet-season rates in most of the measured trees
(Figure 3.2). Overall higher rates of RS in the dry season may in part be explained by an
assumed higher photosynthetic carbon gain accompanied by a higher carbon investment under
the sunnier and hotter conditions of the dry period. However, in the Ecuadorian montane
forest, annual wood production was generally low (Moser et al. 2008; Table 3.1) and distinct
stem growth periodicities were not visible (Homeier 2004), implying that pronounced
differences in growth related respiratory activity between dry and wet season were unlikely.
Temperature coupling was stronger during the dry season, though considerable scatter
in the data was also evident (Figure 3.2). Although the diurnal amplitude of TT and TA
differed between the dry compared to the humid season (Figure 3.1), the temperature response
of RS to variations in TT and TA did not differ within periods (data not shown). Hence, thermal
differences between TT and TA could not account for the observed discrepancies in the
temperature response of RS between the two seasons. However, the actual TT of our tree stems
could differ from the calculated TT values, since the continuous measurements of TT on the
two stems used for the extrapolation started later in the year. Higher actual values of TT than
the modelled ones could be one reason for the better temperature coupling of RS in the dry
season.
Attempts to explain deviations from the common relationship between RS and
temperature also focussed on time lags between temperature variation and CO2 release (Ryan
1990, Lavigne 1996, Stockfors and Linder 1998), the significance of stem photosynthetic
activity (Sprugel and Benecke 1991, Gansert 1995, Pfanz 1999, Strobel 2004), and / or the
CO2 transport with xylem sap flux (Edwards and Hanson 1996, Levy and Jarvis 1998, Teskey
and McGuire 2002, Gansert and Burgdorf 2005).

Temperature response of stem CO2 efflux
53
In three of our trees (Cr, Ge, Hm; Table 3.1), the correlation coefficients between
diurnal TT and RS were higher when a time lag of 1.5 to 2 hrs was considered in the analysis
(data not shown). At least in two of the stems (Cr, Ge), RS might indeed show a delayed
temperature response, which should be related to the bigger tree size prolonging the radial
diffusion pathway of CO2 (Lavigne 1996), while in the smaller stem, a lowered thermal
conductivity could be the reason for the observed time delay (Hm) (Gries 2004). Bark
photosynthetic activity as a significant factor could be excluded in our tree sample by
comparative measurements of RS in shaded and unshaded chambers (data not shown).
Taking account of a possible influence of xylem sap CO2 to explain the large
heterogeneity in RS, we related RS to D, wind speed and solar radiation. These parameters
affect stomatal conductance and transpiration and thus the xylem sap flow with its assumed
CO2 transport capacity. Motzer et al. (2005) measured leaf transpiration and xylem sap flow
in mature trees nearby found high stomatal sensitivities to D and strong stomatal control of
sap flux in these trees. Even on short time scales (i.e. passing clouds) a sudden decline in leaf
transpiration could be detected. Thus, the measurements of Motzer et al. (2005) evidenced a
great diurnal and seasonal variation in sap flux rates which could well have resulted in large
differences of CO2 transport in the xylem sap. This could explain why D, radiation and wind
speed indeed showed a significant effect on RS in a number of tree species, in particular in the
dry season (Table 3.2). Xylem sap effects could also account for the high release rates despite
low temperature sensitivities evident for most of the tree individuals.
Several authors have argued that reduced cell turgor in the stem of droughted trees
could cause a transient reduction in the respiratory activity of the living tissue (e.g. Saveyn et
al. 2007). This effect would offer an explanation for the apparent day-time depression of RS in
Graffenrieda emerginata and Ilex amboroica (Ge, Ia; Figure 3.2) during the dry season.
However, eight of the ten tree individuals showed higher, and not lower, rates of RS
during the sunny/hot period. Although higher rates of RS could not be directly related to
growth in case of the measured trees, the enhanced RS very likely indicated that the dry
season climate principally favoured photosynthetic carbon gain and xylem sap flow, hence the
delivery of substrate for plant respiratory activity as well as of dissolved CO2 from the
transpiration stream, and thereby enhancing stem CO2 release.

Chapter 3
54
Atmospheric uncoupling of stem respiration versus temporal efficiency in energy acquisition -
evidence for climate-sensitive and climate-tolerant tree species?
Differences in rates of RS and temperature sensitivity of RS between the measured
trees were much more pronounced in the dry than in the wet season (Table 3.1) indicating a
diverging response of the trees to hotter weather conditions in this species-rich montane
forest. The RSF forest with its high species diversity consists of a mixture of different tree
functional types and includes typical climax and pioneer tree species co-occurring in the same
stand (Homeier 2004). Moreover, our study site at 1890 m may represent a melting point of
tree species which usually occur predominantly at higher or lower elevations, thus
representing different climatic adaptations. This assumed variety in tree physiological types
may offer an additional explanation for the large differences in patterns of RS. For example,
Ilex amboroica and Graffenrieda emarginata, the two individuals with a significant negative
RS-temperature response, are mostly recorded above 2000 m elevation in neotropical montane
forests (www.mobot.org, Jorgensen and Yanis 1999) and thus are growing at their lower
distribution limit in the RSF (J. Homeier, personal communication). Distribution preferences
towards cooler and more humid climates at higher elevations would account for a stress-
induced adverse reaction to the dry season conditions at RSF (Table 3.2, Figure 3.2). In
contrast, Clethra revoluta is most abundant between 1500 and 3500 m a.s.l. in Ecuador
(Jorgensen and Yanis 1999). This species seemed to be well adapted to the local climate
variability, if the strong positive temperature response during the dry season is used as a
criterion to assess performance under varying thermal regimes (Figure 3.2). Miconia punctata
and Matayba inelegans are usually occurring in tropical lowland forests below 500 and 1000
m elevation, respectively (www.mobot.org, Jorgensen and Yanis 1999). Thus, they are
growing at their upper distribution limit in a rather cold environment in the RSF. These
species from hotter environments responded to the dry season by a relatively large increase in
RS with increasing temperature, probably revealing a better adaptation to warmer climates. In
contrast, Ladenbergia oblongifolia, one of the more abundant tree species between 1800 and
1900 m a.s.l. in the RSF (Homeier 2004), is mainly recorded below 1000 m elevation in the
Neotropics (www.mobot.org). This tree individual showed a very weak RS response to
increasing temperature (Table 3.2).

Temperature response of stem CO2 efflux
55
Conclusion
Our study reports on the substantial variability in stem CO2 release between seasons
and among tree individuals in a species-rich tropical montane forest. Xylem sap flow effects
and species-specific differences in respiratory activity or the sensitivity of RS to atmospheric
factors could be influential. The plastic response in RS of adapted moist forest tree species to a
drier climate could help to gain insights into the acclimation potential of a mega-diverse plant
community to cope with the expected climate warming. In this context, tropical montane
forests are of increasing relevance, since the predicted warming by 2 to 4 K during this
century will most likely force mesic lowland taxa to migrate upwards (Mahli and Phillips
2004, Mayle et al. 2004). Understanding and monitoring of the present forest community
composition and the species-specific responses to environmental changes are a crucial basis
for conservation options and will provide clues for reliable future projections.
Acknowledgements
This study was funded by the DFG (German Science Foundation) through a grant in
the Research Unit 402 (Functionality in a Tropical Mountain Rainforest, subproject B6). We
gratefully acknowledge the Ministerio del Ambiente Loja-Zamora for the research permit, and
the Fundación Científica San Francisco (Nature and Culture International) for the ongoing
support at Estación Científica San Francisco. We thank Florian Werner (University of
Goettingen) for invaluable contributions on early versions of the manuscript. We are also
grateful to Stefan Engelhardtt (University of Bayreuth), Rütger Rollenbeck (University of
Marburg), Michael Richter and Thorsten Peters (University of Erlangen) as well as to Gerald
Moser (University of Goettingen) for contributing data on soil water, climate and general
stand characteristics, respectively.

Chapter 3
56
3.6 References
Amthor JS (1989) Respiration and crop productivity. Springer-Verlag, New York, USA, pp.
215.
Amthor JS (1995) Terrestrial higher-plant response to increasing atmospheric CO2 in relation
to the global carbon cycle. Global Change Biology 1, 243-274.
Armstrong AF, Logan DC, Atkin OK (2006) On the developmental dependence of leaf
respiration: responses to short- and long-term changes in growth temperature. American
Journal of Botany 93, 11, 1633-1639.
Arnone JA, Körner C (1997) Temperature adaptation and acclimation potential of leaf dark
respiration in two species of Ranunculus from warm and cold habitats. Arctic and Alpine
Research 29, 122-125.
Atkin OK, Holly C, Ball MC (2000) Acclimation of snow gum (Eucalyptus pauciflora) leaf
respiration to seasonal and diurnal variations in temperature: the importance of changes in
capacity and temperature sensitivity of respiration. Plant Cell and Environment 23, 15-26.
Atkin OK, Tjoelker MG (2003) Thermal acclimation and the dynamic response of plant
respiration to temperature. Trends in Plant Science 8, 343-351.
Atkin OK, Bruhn D, Hurry VM, Tjoelker MG (2005) The hot and the cold: unravelling the
variable response of plant respiration to temperature. Functional Plant Biology 32, 87-
105.
Atkin OK, Scheurwater I, Pons TL (2006) High thermal acclimation potential of both
photosynthesis and respiration in two lowland Plantago species in contrast to an alpine
congeneric. Global Change Biology 12, 500-515.
Atkin OK, Scheurwater I, Pons TL (2007) Respiration as a percentage of daily photosynthesis
in whole plants is homeostatic at moderate, but not high, growth temperatures. New
Phytologist 174, 367-380.
Bendix J, Homeier J, Ortiz EC, Emck P, Breckle SW, Richter M, Beck E (2006) Seasonality
of weather and tree phenology in a tropical evergreen mountain rain forest. International
Journal of Biometeorology 50, 370-384.
Carey EV, DeLucia EH, Ball JT (1996) Stem maintenance and construction respiration in
Pinus ponderosa grown in different concentrations of atmospheric CO2. Tree Physiology
16: 125-130.

Temperature response of stem CO2 efflux
57
Ceschia E (2001) Environmental effects on spatial and seasonal variations of stem respiration
in European beech and Norway spruce. PhD thesis. Uppsala, Sweden: Swedish University
of Agricultural Science
Chen JM, Liu J, Cihlar J, Goulden ML (1999) Daily canopy photosynthesis model through
temporal and spatial for remote sensing applications. Ecological Modelling 124: 99–119.
Edward NT, Hanson PJ (1996) Stem respiration in a closed-canopy oak forest. Tree
Physiology 16: 433-439.
Edwards NT, McLaughlin SB (1978) Temperature-independent diel variations of respiration
rates in Quercus alba and Liriodendron tulipifera. Oikos 31: 200-206.
Edwards NT, Wullschleger SD (2000) Carbon dioxide efflux rates from stems of mature
Quercus prinus L. and Acer rubrum L. trees do not appear to be affected by sapflow
rates. Journal of Sustainable Forestry 10: 125-131.
Emck P (2007) A climatology of South Ecuador. PhD Thesis, University of Erlangen,
Germany, pp. 272.
Enquist BJ, Kerkhoff AJ, Huxman TE, Economo EP (2007) Adaptive differences in plant
physiology and ecosystem paradoxes: insights from metabolic scaling theory. Global
Change Biology 13, 591-609.
Gansert D (1995) Die Wurzel- und Sprossrespiration junger Buchen (Fagus sylvatica L.) in
einem montanen Moder-Buchenwald. PhD thesis. University of Göttingen, Germany, pp.
164.
Gansert D, Burkdorf M (2005) Effects of xylem sap flow on carbon dioxide efflux from stems
of birch (Betula pendula Roth). Flora 200, 444-455.
Graham EA, Stephen SM, Kitajima K, Phillips NG, Wright SJ (2003) Cloud cover limits net
CO2 uptake and growth of a rainforest tree during tropical rainy seasons. Philosophical
Transactions of the Royal Society of London, Series B 100, 572-576.
Gries D (2004) Ökophysiologische Grundlagen und biophysikalische Steuerung von der
Kohlenstoffbilanz zweier edapisch gegensätzlicher Altbuchenbestände. Habilitation
thesis, University of Göttingen, Germany, pp. 589.
Gunderson CA, Norby RJ, Wullschläger SD (2000) Acclimation of photosynthesis and
respiration to simulated climatic warming in northern and southern populations of Acer
saccharum: laboratory and field evidence. Tree Physiology 20, 87-96.
Hollinger DY, Kelliher F M, Byers JN, Hunt JE, McSeveny TM, Weir PL (1994) Carbon
dioxide exchange between an undisturbed old-growth temperate forest and the
atmosphere. Ecology 75, 134-150.

Chapter 3
58
Homeier J (2004) Baumdiverstät, Waldstruktur und Wachstumsdynamik zweier tropischer
Bergregenwälder in Ecuador und Costa Rica. Dissertationes Botanicae 391, pp. 207.
Horna V, Zimmermann R (2002) Carbon release from stems and branches of two tree species
with contrasting phenology in a seasonally flooded Amazon forest. In: Lieberei R, Bianchi
H-K, Boehm V, Reisdorff C (eds) Neotropical Ecosystems, Proceedings of the German-
Brazilian Workshop, Hamburg 2000, GKSS-Geesthacht, Germany, pp 579-587.
Jorgensen PM, Yánez SL (eds) (1999) Catalogue of the vascular plants of Ecuador. Missouri
Botanical Garden Press, St. Louis, Missouri, pp. 1181.
Kerkhoff AJ, Enquist BJ, Elser JJ, Fagan WF (2005) Plant allometry, stoichiometry and the
temperature-dependence of primary productivity. Global Ecology and Biogeography 14,
585-598.
Lambers H, Chapin FS, Pons TI (1998) Plant physiological ecology. Springer-Verlag, New
York, pp. 540.
Larigauderie A, Körner C (1995) Acclimation of dark leaf respiration in alpine and lowland
plant species. Annals of Botany 76: 245-252.
Lavigne MB (1987) Differences in stem respiration response to temperature between balsam
fir trees in thinned and unthinned stands. Tree Physiology 3, 225-233.
Lavigne MB (1996) Comparing stem respiration and growth of jack pine provenances from
northern and southern locations. Tree Physiology 16, 847-852.
Leuschner C, Moser G, Bertsch C, Röderstein M, Hertel D (2007) Large elevation increase in
the tree root/shoot ratio in a tropical mountain forest in Ecuador. Basic and Applied
Ecology 8, 219-230.
Levy PE, Jarvis PG (1998) Stem CO2 fluxes in two Sahelian shrub species (Guiera
sengalensis and Combretum micranthum). Functional Ecology 12, 107-116.
Levy PE, Meir P, Allen SJ, Jarvis PG (1999) The effect of aqueous transport of CO2 in xylem
sap on gas exchange of woody plants. Tree Physiology 19 53-59.
Loveys BR, Atkinson LJ, Sherlock DJ, Roberts RL, Fitter AH, Atkin OK (2003) Thermal
acclimation of leaf and root respiration: an investigation comparing inherently fast- and
slow-growing plant species. Global Change Biology 9, 895-910.
Malhi Y, Phillips OL (2004) Tropical forests and global atmospheric change: a synthesis.
Philosophical Transactions of the Royal Society of London, Series B 359, 549-555.
Maier TA, Zarnoch SJ, Dougherty PM (1998) Effects of temperature and tissue nitrogen on
dormant season stem and branch respiration in a young loblolly pine (Pinus tadea)
plantation. Tree Physiology 18, 11-20.

Temperature response of stem CO2 efflux
59
Maier CA, Clinton BD (2006) Relationship between stem CO2 efflux, stem sap velocity and
xylem CO2 concentration in young loblolly pine trees. Plant, Cell and Environment 29:
1471-1483.
Mayle FE, Beerling DJ, Gosling WD, Bush MB (2004) Responses of Amazonian ecosystems
to climatic and atmospheric carbon dioxide changes since the last glacial maximum.
Philosophical Transactions of the Royal Society of London, Series B 359, 499-514.
McGuire MA, Teskey RO (2004) Estimating stem respiration in trees by a mass balance
approach that accounts for internal and external fluxes of CO2. Tree Physiology 24: 571-
578.
Moser G, Roederstein M, Soethe N, Hertel D, Leuschner C (2008) Altitudinal changes in
stand structure and biomass allocation of tropical mountain forests in relation to
microclimate and soil chemistry: a transect study in Ecuador and a neotropical meta-
analysis. In: Gradients in tropical mountain ecosystems of Ecuador. (eds. Beck E, J
Bendix, I Kottke, F Makeschin, R Mosandl). Springer Verlag, Berlin Heidelberg,
Ecological Studies 198, pp 229-242.
Motzer T, Munz N, Küppers M, Schmitt D, Anhuf D (2005) Stomatal conductance,
transpiration and sap flow of tropical montane rain forest trees in the Southern Ecuadorian
Andes. Tree Physiology 25, 1283-1293.
Negisi K (1979) Bark respiration rate in stem segments detached from young Pinus densiflora
trees in relation to velocity of artificial sap flow. Journal of Japanese Forest Society 61:
88-93.
Negisi K (1982) Dirunal fluctuations in the stem bark respiration in relationship to the wood
temperature in standing young Pinus densiflora, Chamaecyparis obtusa and Quercus
myrsinaefolia trees. Journal of Japanese Forest Society 64, 315-319.
Oren R, Pataki DE (2001) Transpiration in response to variation in microclimate and soil
moisture in southeastern deciduous forests. Oecologia 127, 549-559.
Pfanz H (1999) Photosynthetic performance of twigs and stems of trees with and without
stress. Phyton Annales Rei Botanicae 39, 29-33.
Reich PB, Wright IJ, Cavender-Bares J, Craine JM, Oleksyn J, Westoby M, Walters MB
(2003) The evolution of plant functional variation: traits, spectra, and strategies.
International Journal of Plant Science 164, 3, S143-S164.
Röderstein M, Hertel D, Leuschner C (2005) Above- and below-ground litter production in
three tropical mountain forests (South Ecuador). Journal of Tropical Ecology 21, 483-492

Chapter 3
60
Pruyn ML, Gartner BL, Harmon ME (2002) Respiratory potential in sapwood of old versus
young ponderosa pine trees in the Pacific Northwest. Tree Physiology 22: 105-116.
Pruyn ML, Gartner BL, Harmon ME (2005) Storage versus substrate limitation to bole
respiratory potential in two coniferous tree species of contrasting sapwood width. Journal
of Experimental Botany 56: 2637-2649.
Ryan MG (1990) Growth and maintenance respiration in stems of Pinus contorta and Pinus
engelmannii. Canadian Journal of Forest Research 20, 48-57.
Saveyn A, Steppe K, Lemeur R (2007) Daytime depression in tree stem CO2 efflux rates: Is it
caused by low stem trugor pressure? Annals of Botany 99, 477-485.
Saveyn A, Steppe K, Lemeur R (2008a) Report on non-temperature related variations in CO2
efflux rates from young tree stems in the dormant season. Trees 22: 165-174.
Saveyn A, Steppe K, McGuire MA, Lemeur R, Teskey RO (2008b) Stem respiration and
carbon dioxide efflux of young Populus deltoides trees in relation to temperature and
xylem carbon dioxide concentration. Oecologia 154: 637-649.
Schrumpf M, Guggenberger G, Schubert C, Valarezo C, Zech W (2001) Tropical montane
rain forest soils - development and nutrient status along an altitudinal gradient in the south
Ecuadorian Andes. Die Erde 132, 43-59.
Sprugel DG, Benecke U (1991) Measuring woody-tissue respiration and photosynthesis. In:
Techniques and approaches in forest tree ecophysiology (eds. Lassoie JP, Hinckley T),
CRC-Press Inc, Boston, pp. 329-355.
Stockfors J, Linder S (1998) Effect of nitrogen on the seasonal course of growth and
maintenance respiration in stems of Norway spruce trees. Tree Physiology 18, 155-166.
Strobel J (2004) Die Atmung der verholzten Organe von Altbuchen (Fagus sylvatica L.) in
einem Kalk- und einem Sauerhumusbuchenwald. Unpublished PhD thesis, University of
Göttingen, Germany, pp. 170.
Teskey RO, McGuire MA (2002) Carbon dioxide transport in xylem causes errors in
estimation of rates of respiration in stems and branches of trees. Plant Cell and
Environment 25, 1571-1577.
Teskey RO, McGuire MA (2007) Measurement of stem respiration of sycamore (Plantanus
occidentalis L.) trees involves internal and external fluxes of CO2 and possible transport
of CO2 from roots. Plant Cell and Environment 30, 570-579.
Tjoelker MG, Oleksyn J, Reich PB (1999) Acclimation of respiration to temperature and CO2
in seedlings of boreal tree species in relation to plant size and relative growth rate. Global
Change Biology 49, 679-691.

Temperature response of stem CO2 efflux
61
Tjoelker MG, Oleksyn J, Reich PB (2001) Modelling respiration of vegetation: evidence for a
general temperature-dependent Q10. Global Change Biology 7, 223-230.
Zach A, Horna V, Leuschner C (2008) Elevational changes in woody tissue CO2 efflux rates
in a tropical mountain rainforest in southern Ecuador. Tree Physiology 28, 67-74.
http://www.mobot.org/mobot/Research/ecuador/search.shtml; Missouri Botanical Garden.

Chapter 4
62
WOOD CO2 EFFLUX ACROSS AN ELEVATION TRANSECT
IN AN ANDEAN MOIST FOREST:
SEASONALITY, RESPIRATION COMPONENTS AND
STAND LEVEL UPSCALE
ALEXANDRA ZACH, VIVIANA HORNA AND CHRISTOPH LEUSCHNER SUBMITTED TO: OECOLOGIA
4 Chapter

Seasonality of wood CO2 efflux
63
4.1 Abstract
The carbon (C) economy of tropical montane forests (TMF) is controlled by frequent
cloudiness hampering assimilatory CO2 uptake, while only short periods of clear-sky
conditions throughout the year allow for high assimilatory C gain. However, TMFs are well
known for their high C allocation shift from above- to belowground plant parts with
increasing altitude. Altitudinal changes in C allocation patterns must be reflected in the
respiratory CO2 efflux from above- and belowground woody organs. Studying the impact of
climate seasonality on wood CO2 release provides a convenient framework to understand the
C use efficiency of TMFs. Seasonality of wood CO2 release from tropical evergreen forest
trees has received little attention, but has never been studied for tropical evergreen montane
trees. We used a portable CO2 measurement system, which allowed us to monitor the
respiratory CO2 release from stems (RS) and coarse roots (RR) across an elevation transect
with study sites at 1050, 1890 and 3050 m a.s.l. in an Andean moist forest in Southern
Ecuador. The study aimed to (1) assess the seasonal variability of RS and RR and the impact of
elevation, (2) separate woody tissue respiration into the two functional components of growth
and maintenance respiration, and (3) extrapolate wood C fluxes to the forest stands. RS, but
not RR showed a clear seasonality within the measurement year. Highest rates of RS were
measured during the dry season, though the increase in RS could not be simply related to
temperature variation. We assumed a high degree of climate sensitivity of RS, since increased
RS measured under dry season conditions could not satisfactorily be related to stimulated cell
growth, but could also indicate C losses via futile cycles. The increasing C allocation to the
root system with elevation was associated with a large increase of the coarse root carbon use
efficiency from 0.17 at 1050 m to 0.55 at 3050 m. Annual carbon efflux from stems decreased
from 167.1 g C m-2 yr-1 at 1050 m to 37.7 g C m-2 yr-1 at 3050 m, while coarse root carbon
release changed little from 1050 m (40.9 g C m-2 yr-1) to 3050 m (36.8 g C m-2 yr-1) reflecting
the increasing importance of belowground organs at high altitudes.
Keywords: altitudinal gradient, coarse root respiration, Ecuador, growth respiration,
maintenance respiration, stem respiration, tropical montane forest

Chapter 4
64
4.2 Introduction
At present, very limited data are available on the carbon (C) fluxes in tropical montane
ecosystems (Brujinzeel and Veneklaas 1998). Studies quantifying the carbon dioxide (CO2)
efflux from woody parts of tropical montane forest trees are entirely missing. However, such
information is essential if we are to gain insights into structure and productivity of the tropical
montane biome.
Tropical montane forests (TMF) typically show lower aboveground productivity,
lower nutrient concentrations in the soil and hence in plant organs and a slower nutrient
turnover than tropical lowland forests. This has been related not only to lower temperatures,
but also to the frequent cloud cover and high atmospheric humidity that limit photosynthesis
and transpiration and hence assimilate supply and nutrient uptake (Bruijnzeel and Veneklaas
1998, Graham et al. 2003). On the other hand, TMFs are known to invest increasing amounts
of C into the root system with increasing elevation (Brujinzeel and Veneklaas 1998,
Röderstein et al. 2005, Leuschner et al. 2007, Moser et al. 2008). However, the underlying C
allocation processes are still unclear (Brujinzeel and Veneklaas 1998). As is typical for the
moist tropics, climate seasonality is not very pronounced in TMFs, which experience a
perhumid climate throughout the year, interrupted by few drier weeks with less rainfall
(Bendix et al. 2006). In this regard, the question remains of how do tropical montane
communities manage to cope with prevailing low light conditions and soil nutrient
restrictions. A thorough understanding of the environmental factors influencing carbon gain
and carbon losses of evergreen montane trees is still lacking. To date, few studies exist on the
influence of climate seasonality on physiological or ecological processes in evergreen tropical
forests. For an Andean moist forest of southern Ecuador, phenology was found to be mainly
triggered by cloudiness, hence by light intensity and temperature (Cueva et al. 2006).
Recently, Bräuning et al. (2008) found highly inconsistent growth dynamics among several
abundant tree species of the same study area, which could not simply be related to certain
climatic events.
The present study aimed to analyze carbon losses from woody plant organs in relation
to site characteristics and climate variations across an Andean moist forest transect in
southern Ecuador. During a 1-year-measurement period we recorded stem and coarse root
respiratory CO2 release at three study sites at 1050, 1890 and 3050 m a.s.l.. Characterized by
prevailing humid climatic conditions, we could take advantage of a pronounced dry season
period during our measurements to study the seasonal variability in stem and coarse root
respiration of several montane tree species. In addition, we were able to profit from previous

Seasonality of wood CO2 efflux
65
inventory studies conducted at the same sites to make use of standing above-and belowground
biomass and annual increment data of single components.
The study has the foci to: (1) examine the seasonal variability of stem and coarse root
CO2 release at three different elevations to learn about climate effects on the respiratory
activity of woody organs, (2) separate woody tissue respiration into the two functional
components of growth and maintenance respiration which may provide insight into patterns of
C use of tropical montane tree species and (3) make first estimates on net annual C fluxes
from woody parts of trees in an Andean moist forest.
4.3 Materials & Methods
Study area
The study was conducted within and close to Podocarpus National Park on the eastern
slopes of the southern Ecuadorian Andes between August 2005 and September 2006. Across
an elevational transect of 2000 m, we chose three forest sites of 400 m² each and with a
maximum distance of 30 km between the sites. The sites were a premontane forest at 1050 m,
a lower montane forest at 1890 m and an upper montane forest at 3050 m elevation (Table
4.1). The three sites have been studied previously for above- and belowground biomass and
productivity (Röderstein et al. 2005, Leuschner et al. 2007, Moser et al. 2008).
The study area experiences a humid climate with a rain peak from May to July and a
less humid period between November and February (Bendix et al. 2006). While easterly
winds are responsible for the prevailing humid climate for most of the year, westerly foehn
winds frequently cause dry and sunny days between November and February. Foehn winds
were especially pronounced during our measurement period between October and December
2005, causing a marked dry season throughout the study area. The nutrient-poor soils of the
area developed from granodiorite (1050 m), or metamorphic shale, quartzite and sandstone
bedrock (1890 m, 3050 m) (Schrumpf et al. 2001).

Chapter 4
66
Table 4.1. Characteristics of the three study sites at 1050, 1890 and 3050 m elevation (means ± SE; Moser 2008). Stem area index (SAI) is derived from a cone-shaped tree model.
1050 m 1890 m 3050 m Forest type premontane lower montane upper montane Coordinates
S 04°06`54`` W 78°58`02``
S 03°58`345`` W 79°04`648``
S 04°06`711`` W 79°10`581``
Inclination (°) 26 31 27 Rainfall (mm) c. 1900 c. 2200 c. 4500 RH (%) 88.7 90.7 93.5 TAir (°C) 19.4 15.7 9.4 Canopy height (m) 31.8 18.9 9.0 Tree height (m) 15.6 (0.7) 10.1 (0.4) 5.2 (0.3) DBH (cm) 17.3 (1.3) 12.2 (0.8) 7.2 (0.4) Basal area (m2 ha-1) 33.6 36.9 42.2 Stem density (n ha-1) 968 2333 8317 Wood density (g cm-3) 0.64 (0.03) 0.60 (0.04) 0.69 (0.03) LAI (m2 m-2) 6.0 5.7 2.2 SAI (m2 m-2) 0.52 0.51 0.52
Sampling
For measuring rates of wood CO2 release we chose 13 - 21 canopy trees per site. The
tree selection at each site comprised 13 - 16 different species belonging to 10 - 11 abundant
families. The range of DBH (at 1.3 m height) was 8.7 - 43.8 cm at 1050 m, 3.0 - 26.5 cm at
1890 m, and 2.5 - 17.7 cm at 3050 m (Zach et al. 2008, Appendix 1). In addition, 4 - 8 woody
coarse roots (diameter: 1 - 4 cm) growing a few centimetres below the soil surface were
measured at each site. The trees were equipped with dendrometer bands at breast height (1.3
m) for stem increment measurements (accuracy: 0.01 cm). Tree diameter was taken initially
and at the end of the last measurement campaign to determine annual increment rates. Coarse
root diameter was measured in the middle of the section enclosed by the measurement
chamber at the beginning of the study.
CO2 efflux measurements
Between August 2005 and September 2006, we conducted four measurement
campaigns at each site to monitor the diurnal rates of CO2 release from stems (RS) and coarse
roots (RR) (Figure 4.1). The individual campaigns lasted for 10 – 21 days with the
measurement system rotating between the three sites. The annual cycle included a pronounced
dry season between October and December 2005, which in the following will be referred to as
D1, and three measurement campaigns conducted under more humid climate conditions

Seasonality of wood CO2 efflux
67
between August and September 2005 (H1) and from March to September 2006 (H2 and H3;
Figure 4.1). The measurement campaign conducted at 1890 m in April 2006 (H2) was done
twice; we repeated measurements when the first unusually dry part of April (H2dry) was
followed by more typical rainy weather (H2wet; Figure 4.1). Due to equipment failure at the
beginning of the campaigns in August 2005, we had to reject the dataset of the first campaign
(H1) from the site at 3050 m, and the first measurements on coarse roots (H1) at 1890 m.
Rates of CO2 release were measured using the mobile 6-chamber respiration system
ANARESY 2 (Walz, Effeltrich, Germany; Appendix 2) with an integrated infrared gas
analyzer for CO2 and H2O (LI-7000, Li-Cor, Inc., Lincoln, NE, USA) running in differential
mode. Stem CO2 release was measured at breast height (1.3 m) using tightly fitted plexiglas
chambers (95.1 cm3); coarse root sections of 15 cm were enclosed in cylindrical plexiglas
chambers (473.8 cm³). We recorded air temperature and relative air humidity at 2 m height
inside the stand using a Rotronic sensor (Rotronic AG, Bassersdorf, Switzerland) connected
to the data logger of the ANARESY system (CR 10, Campbell Scientific, Logan, UT, USA).
For further details on the technical equipment see Zach et al. (2008) (Chapter 2).
We used tissue temperature data logged since July 2006 to extrapolate the stem (TTS)
and coarse root tissue temperatures (TTR) of our measurement periods. Thermocouples for
tissue temperature (Ø: 3 mm, length: 20 mm, Siemens, München, Germany) were installed at
10 mm depth in the stem wood (at breast height) of 2 - 3 randomly chosen trees at 1050 and
1890 m (DBH: 15 - 20 cm) and at 3050 m (DBH: 10 - 15 cm). We related tissue temperature
to air temperature and used this relationship to calculate TTS and TTR of the measurement
campaigns from site microclimate records (Zach et al. submitted; Chapter 3).
After measurements, we extracted wood cores from all tree individuals using an
increment borer (5 mm diameter, Haglöf, Långsele, Sweden) by coring horizontally from the
bark to the centre of the bole. Cores were taken in the section where CO2 release was
measured on the stem. Root samples were taken by cutting segments of 3 – 4 cm lenght. We
recorded the fresh weight of all samples and used their length and diameter to calculate the
sample volume. After drying the samples to constant weight at 70° C, we determined wood
density as the dry mass per volume of fresh wood. The dry samples were analysed for their
nutrient contents (Appendix 4).

Chapter 4
68
Data treatment
Rates of CO2 release were calculated as:
(1) R = D [CO2] * F/ Ac
where R is the CO2 release rate (µmol CO2 m-2 s-1), D [CO2] is the difference between ambient
(reference gas) and chamber (sample gas) CO2 concentration, F is the molar air flow rate (mol
s-1) which passes through the chamber, and Ac is the surface area (m2) of the enclosed stem or
root segment. Due to a better relation of the CO2 efflux to surface area than to volume, we
based our release rates on the surface area (Zach et al. 2008; Chapter 2).
Separating growth and maintenance respiration
In tropical moist forests, where maintenance respiration (Rm) cannot be determined by
dormant season measurements as in temperate forests (Ryan 1990, Sprugel 1990, Sprugel and
Benecke 1991), Rm is estimated by subtracting the calculated growth respiration from total
CO2 efflux rates. Growth respiration (Rg) of the tree stems (RSg) was determined following
Ryan et al. (1994):
(2) Rg = 0.248* p*VG*(Csample * (106 µmol/12g C) * (1/ 365 days*86400s day-1))
where 0.248 is the estimated mean carbon cost per gram carbon incorporated (Meir and Grace
2002), p is the wood specific gravity (g cm-3), VG is the volume of annual wood growth under
the measurement chamber (cm3m-2) and Csample is the wood carbon content (g C g biomass-1).
The annual increment of the woody tissue under the chamber was estimated from diameter
increment measurements and wood specific gravity as determined for each tree stem from the
wood cores. We then calculated the production of woody biomass from the sample carbon
content and by assuming an ash-free dry matter content of 99.3% (Ryan et al. 1994).
Estimates of coarse root growth respiration (RRg) were based on mean annual RR
efflux rates (unit: µmol CO2 m-3 s-1) and annual coarse root biomass production (Moser 2008).
Coarse root biomass was assumed to contain 50% carbon in the ash-free dry matter and
growth respiration was assumed to account for 25% of the carbon content of the dry-matter
production (Penning de Vries 1975, Sprugel and Benecke 1991).
Up scaling of wood CO2 efflux
Estimates of annual total carbon release at stand level were based on wood CO2 efflux
measurements and forest inventories of the study sites (Moser 2008). Because there were no
significant relationships between basal area and RS of the measured trees at any of the sites,
we did not separate size classes (Figure 4.2a). Instead, we assumed that rates of stem

Seasonality of wood CO2 efflux
69
respiration were constant across tree sizes for extrapolating stem C release to stand level.
Carbon release for each tree stem was calculated assuming a cone-shaped stem and using tree
height as a measure for stem length from the ground to the top of the tree. The calculated
totals of carbon release for each tree were summed up to the stand. The cumulative vertical
stand C fluxes were projected to the ground area by dividing the total site area (i.e., by
multiplying vertical stand C flux with the stem area index, SAI). Site areas were corrected by
slope angle (Table 4.1). Up-scaling did not include estimates of branch or leaf carbon release.
Coarse roots total respiration estimates were based on mean annual RR efflux rates
(µmol CO2 m-3 s-1) and the standing coarse root biomass stock as determined by Moser
(2008). Volume-based release rates were converted to biomass using the specific wood
gravity as determined for the measured roots (data not shown). Coarse root biomass was
assumed to consist by 50% of carbon, and ash-free matter to represent 99.3% of the biomass.
Statistical analysis
Differences between mean rates of stem respiration in the different measurement
campaigns conducted at each site (1050 m, 1890 m, 3050 m) were tested for significance
using analysis of variance (ANOVA). For the sites at 1050 m and 1890 m, the daily mean RS
values of the individual trees were log-transformed prior to ANOVA to achieve homogeneity
of variances (Scheffé test, p < 0.05). Stem CO2 release data of individual trees at 3050 m
matched parametric assumptions without transformation. We tested for significant differences
in coarse root CO2 release (RR) between the measurement campaigns at each site using the
same procedure as for stem CO2 efflux (Scheffé test, p < 0.05). Root respiration data matched
parametric assumptions without transformation. We used coefficient of determination (r²) to
quantify the influence of predictor variables (basal area, stem increment, nitrogen content) on
stem respiration.
4.4 Results
Seasonality of wood CO2 efflux across the elevation transect
Mean rates of RS at 1050 m were significantly higher during D1 compared to more
humid campaigns (Figure 4.1). Differences between campaigns were not significant at the
sites at 1890 and 3050 m.

Chapter 4
70

Seasonality of wood CO2 efflux
71
Figure 4.1. Meteorological conditions and stem (RS) and coarse root (RR) CO2 efflux rates (mean ± SD) in the measurement campaigns conducted between August 2005 and September 2006at the three study sites at 1050 m, 1890 m, and 3050 m elevation. At each site, measurements were conducted during three humid season periods (H1 to H3) and during one dry season period (D1). At 1890 m, the measurement campaign H2 was done twice; we repeated measurements when the first unusually dry part of April (H2dry) was follow by more typical rainy weather (H2wet). For all sites, daily means of air temperature (TAir) and relative air humidity (RH) and diurnal precipitation (P) are given for the study sites at 1890 and 3050 m as far as available. Global radiation (Rad) is provided for the site at 1890 m and photosynthetic active radiation (PAR) for the site at 3050 m. Given are mean daily CO2 efflux rates for each individual tree and coarse root measured as well as the mean stand efflux per measurement campaign (). Different letters indicate significant differences (Scheffé, p< 0.05) between measurement campaigns for mean stand rates of stem and coarse root CO2 efflux at each study site.
Nevertheless, highest mean rates of RS were measured during the driest and warmest
period of the measurement year at all three sites (D1 and H2dry; Figure 4.1). During the
measurement year, mean stand RS ranged from 0.54 - 1.38 µmol CO2 m-2 bole surface area s-1
at 1050 m, from 0.28 - 0.79 at 1890 m and from 0.16 - 0.21 at 3050 m; minimum rates of RS
were measured under more humid conditions (H1 to H3). Between tree individuals, the
variability in rates of RS was higher during D1 compared to H1, H2 and H3 at all sites
(Appendix 5). This seasonal contrast was especially pronounced at 1890 m (Figure 4.1).
Chapter 4
72
Differences in stand RS between campaigns were less apparent at 3050 m (Figure 4.1).
Annual mean rates of RS decreased with increasing elevation from 0.86 ± 0.40 (SD) µmol
CO2 m-2 bole surface area s-1 at 1050 m to 0.54 ± 0.23 at 1890 m and 0.19 ± 0.03 at 3050 m.
Elevational differences were most pronounced during D1 and least marked during H1, H2 and
H3 (Figure 4.1; Appendix 5).
Mean annual rates of coarse root respiration (RR) decreased from 0.36 ± 0.09 µmol
CO2 m-2 surface area s-1 at 1050 m to 0.26 ± 0.04 at 1890 m and to 0.16 ± 0.01 at 3050 m.
Rates of RR did not show any seasonal trend at the three sites (Figure 4.1; Appendix 5 and 6).
Growth and maintenance respiration
Based on absolute values stem growth respiration (RSg) decreased continuously with
increasing elevation (Table 4.2). However, the average proportion of RSg on total RS
decreased only slightly with altitude and accounted for 14.2% (0.11 ± 0.12 µmol CO2 m-2 s-1,
SD) at 1050 m, 13.2% (0.05 ± 0.06) at 1890 m and 10.3% (0.01 ± 0.02) at 3050 m. At tree
level, the fraction of RSg on total RS ranged from 0 - 75% at 1050 m, from 0 - 52% at 1890 m
and from 0 - 70% at 3050 m. We did not find any correlation between stem maintenance
respiration (RSm) and tissue nitrogen content at any of the sites (Figure 4.2b). Mean annual RS
was weakly correlated with annual wood increment at 1890 m, whereas no relationship was
found at 1050 and 3050 m (Figure 4.2c).
The fraction of coarse root growth respiration (RRg) on total RR continuously increased
with increasing elevation and amounted to 5.2% at 1050 m, 14.6% at 1890 m and 29.9% at
3050 m (Table 4.2).
Annual C losses from woody tissue across the elevation transect
Stand carbon release from stems accounted for 167.1 g C m-2 ground area yr-1 at 1050
m, 102.6 g C m-2 ground area yr-1 at 1890 m and 37.7 g C m-2 ground area yr-1 at 3050 m
based on the stem surface area of a cone-shaped trunk model (Table 4.2). Using cylinder-
shaped tree stems would exactly double the annual carbon flux estimation derived from the
cone model.
Stand carbon release from coarse roots was 40.9, 19.2 and 36.8 g C m-2 root surface
area y-1 at 1050 m, 1890 m and 3050 m, respectively (Table 4.2).

Seasonality of wood CO2 efflux
73
Chapter 4
74
4.5 Discussion
Seasonality of wood CO2 efflux across the elevation transect
Few studies have been conducted on the annual variability in wood CO2 efflux of
tropical plants, and most are related to drought-deciduous tree species. In habitats with
strongly seasonal rainfall, woody tissue respiration is highest during the wet season of the
year. This is little surprising, since leaves are shed with the onset of the dry season and wood
production and associated stem growth respiration ceases (Levy and Jarvis 1998, Nepstad et
al. 2002, Silva et al. 2002, Chen et al. 2003, Chambers et al. 2004). In this respect, drought-
deciduous forests are similar to cold-deciduous temperate broadleaved communities and do
not allow for a direct comparison with the evergreen vegetation of the moist tropics. To our
knowledge, the only study addressing the seasonality of wood CO2 efflux from tropical
evergreen trees was conducted in an aseasonal wet lowland forest and found no indication of
seasonality in wood carbon release (Cavaleri et al. 2006).
Our study of stem CO2 release across an Andean moist forest transect revealed that RS
considerably augmented under dry season conditions, while rates of RS were comparatively
low under the prevailing more humid climate (Figure 4.1). The increase in RS under dry
season conditions was especially pronounced at 1050 m and 1890 m. The environmental
sensitivity of RS at 1890 m was corroborated by two consecutive measurement campaigns
conducted in April 2006. While high rates of RS were recorded during the first exceptionally
dry part of April (H2dry) with weather conditions comparable to the D1 campaign, mean RS
dropped by 65% of the previous intensity during the rainy second part of the month (H2wet;
Figure 4.1). The results clearly indicate that the monitored trees were very responsive to
climatic variations.
However, the higher respiration rates could not simply be explained by the higher
ambient temperatures recorded during D1 (Figure 4.1). In contrast to general belief, the
respiratory response to temperature was neither exponential nor clearly linear for the
measured moist forest trees throughout our measurement campaigns (Appendix 3a-c). Even
during D1, plotting RS against temperature yielded a highly scattered picture at all three sites
(r² = 0.017 – 0.064: Zach et al. 2008; Chapter 2). In a previous study on diverging temperature
response patterns at 1890 m (Zach et al. submitted; Chapter 3) we found that the RS-
temperature relationship varied considerably in degree and direction of response between tree
individuals during the dry season campaign (r² = 0.02 – 0.87), while RS was mostly uncoupled
from temperature under wet season conditions (r² = 0 – 0.21). The diverging temperature

Seasonality of wood CO2 efflux
75
reactions between dry and humid season were not related to lower temperatures or diminished
diurnal temperature amplitudes under humid conditions, since RS was related to stem tissue
temperature and the diurnal amplitude of tissue temperature was equally weak for both
seasons (Zach et al. submitted). Therefore, Zach et al. (submitted) proposed a complex
interaction of abiotic factors (incoming PAR, mean daily temperature, wind speed, vapour
pressure deficit, soil water availability), which affect assimilation, enzymatic activity or the
demand for respiratory products and hence RS in these tropical montane forests. Further, an
influence of CO2 supplied by xylem sap flux is possible (e.g., Teskey and McGuire 2002,
Teskey and McGuire 2007). In conclusion, periods of highest respiratory activity were
exceptionally dry and warm, but respiration was not related to temperature in a simple way.
At 3050 m, differences in rates of RS between campaigns were less pronounced than at
1050 and 1890 m. However, the climatic differences in terms of incoming solar radiation or
mean daily temperature between campaign D1 and H3 affected RS at this high-elevation stand
as well (Figure 4.1). On the other hand, the RS-temperature relationship was highly variable
between campaigns and between individuals showing much scatter in the data of this site in
most cases (data not shown). We measured one unexplainable high rate of RS during H2
(Figure 4.1), which substantially increased mean rates of RS at 3050 m and hence lowered the
difference between humid and dry season results. Omitting this value would yield a more
clear trend of higher respiratory activity under favourable radiation and temperature
conditions as are indicated by D1.
Coarse roots respiration did not vary between campaigns, probably as a result of low
changes in soil temperature regime throughout seasons at the same depth roots were (S.
Graefe, personal communication). To our knowledge, there are no comparable studies on RR
in tropical montane forests.
Growth and maintenance respiration
Tropical lowland forests that are dominated by slow-growing, tall climax tree species
are assumed to use about 80% of the total respired carbon for maintenance processes (Meir
and Grace 2002). Ryan et al. (1994) reported RSg values of 18% and 46% in slow- and fast-
growing tropical lowland species, respectively. In an afrotropical lowland forest, 20% of the
CO2 released by tree stems was used for tissue construction (Meir and Grace 2002). Stem
growth respiration in a seasonally flooded Varzea forest was below 15% of total CO2 release
for most of the trees measured (Horna 2002). A proportion of 10 - 14% for stem growth
respiration as found in our study is in the lower range of literature data. We explain this low

Chapter 4
76
figure mainly from the fact that the existing data are exclusively from tropical lowland sites
with a much higher aboveground productivity than montane forests.
Table 4.2. Standing carbon stocks, productivity and C flux components of the sites at 1050, 1890 and 3050 m elevation. Total aboveground (AG) and belowground (BG) biomass, stem (S) and coarse root (CR) biomass (g C m-2), component and total net primary (NPP) productivity (g C m-2 yr-1) and annual stem (RS) and coarse root (RR) C fluxes (g C m-2 ground area yr-1). Given are stand-level C flux calculations (RS and RR) based on own CO2 release measurements and forest inventory data (G. Moser, unpublished data), and estimates of the C costs of stem growth (RSg) and coarse root growth (RRg) respiration.
1050 m 1890 m 3050 m AG-biomass 14255 8650 5610 S-biomass 13915 8160 5430 Stand-level RS (cone-based) * 167.12 102.62 37.66 S-growth 141 43.5 7 % of total S-biomass 1.0 0.5 0.1 RSg (%) 14.2 13.2 10.3 RSg 23.73 13.55 3.88 CUES 0.46 0.30 0.16 RS/S-biomass 0.012 0.013 0.007 BG-biomass 1605 1305 3135 CR-biomass 1470 995 2595 Stand-level RR 40.9 19.2 36.8 CR-growth 8.44 11.40 44.20 % of total CR-biomass 0.6 1.2 1.7 Estimated RRg 2.11 2.80 11.00 Estimated costs (%) 5.2 14.6 29.9 CUECR 0.17 0.37 0.55 Total NPP 652 621 653
* Cylinder-based calculations would result in double the amount of the cone-based values
The proportion of RSg on total RS of our montane tree species remained constant with
elevation. This is surprising, since stem growth declined 10-fold from 1050 m to 3050 m
(Table 4.2). At 3050 m, aboveground tree growth was rather low, which is thought to result
mainly from unfavourable environmental conditions such as low light intensity, lower
temperatures and waterlogged soils, reducing C gain and nutrient supply (Leuschner et al.
2007, Soethe et al. 2007). On the other hand, a higher wood density and growth-hampering
conditions may result in higher construction costs of new tissue at 3050 m as found for high
elevation trees (Brujinzeel and Veneklaas 1998). This could have counteracted low rates of
RSg. As a consequence, rates of RSg were more uniform across the elevation transect. A
different picture is found for rates of coarse root growth respiration (RRg). In parallel to the

Seasonality of wood CO2 efflux
77
enormous five-fold increase in coarse root growth from 1050 m to 3050 m, the fraction of RRg
on total RR increased markedly from 5% (1050 m) to 30% (3050 m) in our transect,
emphasizing the increasing importance of root growth with elevation (Table 4.2). However,
our root respiration estimates were based on very few records on roots with diameters
between 1 and 4 cm, while the root biomass data and dry matter production values also
included large woody roots (> 4 cm) as well as smaller size fractions (2-10 mm). Therefore,
our calculated values can only provide a rough approximation of the actual amount of RR.
Maintenance respiration is often strongly correlated with tissue nitrogen content
(McCree 1983, Waring et al. 1985, Irving and Silsbury 1987, Ryan 1990, Ryan 1991), based
on the assumption that metabolic activity for maintenance functions is dependent on the
protein content of plant tissue (Penning de Vries 1975). However, the strong dependence of
maintenance respiration on nitrogen is a theoretical construct based on biochemical principles,
which still has to be validated under field conditions (Van der Werf et al. 1992). In fact, we
could not find a close relationship between RSm and tissue N-content at our sites (Figure
4.2b).
The calculation of growth respiration is typically based on the assumption of constant
growth rates throughout the year. This assumption may be overly simplifying, since even tree
species of the moist tropical lowlands show marked seasonal growth trends, triggered by
changes in temperature, rainfall and nutrient availability (Clark and Clark 1994, Devall et al.
1995, Clark et al. 2003, Verheyden et al. 2004, Bräuning and Burchardt 2006). In the study
area, cambial activity (and hence growth) typically ceased during periods of heavy rainfall
and low light intensity (Bräuning et al. 2008, Bräuning et al. in press). On the other hand,
Bräuning et al. (2008) found that cambial activity was mainly controlled by soil water
availability. Even after only few rainless days, growth has halted and stem diameter started to
shrink as a result of a decrease in the stem water status. Interestingly, the stem respiratory
activity of our trees decreased under wet season conditions, but seemed to be stimulated by
drier and warmer periods when the soil matrix potential may drop to -0.5 MPa (at 30 cm
depth; S. Engelhardt, unpublished data). In this context, it is unclear if the high stem
respiratory activity measured during the driest and warmest campaign (D1, Figure 4.1) was
indeed related to enhanced cambial activity as previously assumed, or if higher rates of
woody tissue respiration were the result of internal stress due to fluctuations in cell water
status.
In a tropical evergreen lowland forest of Costa Rica, growth declined with increasing
temperature and the decrease in productivity was strongest during the hottest year (El Niňo).

Chapter 4
78
At the same time, the ecosystem CO2 efflux increased (Clark and Clark 1994). Other recent
studies consistently confirmed the trend of decreasing NPP in tropical forests during warmer
years (Worbes 1999, Clark et al. 2003, Feeley et al. 2007). In addition, carbon respired via the
alternative pathway of respiration was found to increase exponentially with increasing
temperature in the humid tropics (Keller and Lerdau 1999, Lerdau and Throop 1999). A high
climate sensitivity of tropical forest productivity would have serious implications for future
rates of CO2 enrichment in the atmosphere under the ongoing global warming.
Error propagation in extrapolating chamber measurements
Methods for estimating stand C release are not standardized and uncertainties exist
concerning the choice of scalar (ground area, surface area, sapwood volume) and of the
allometric equations used or the representativeness (tree diameter size distribution, tree
density) of the study site (Levy and Jarvis 1998, Meir and Grace 2002, Cavaleri et al. 2006).
Consequently, errors can propagate considerably when chamber measurements are
extrapolated to the stand level (e.g., Damesin et al. 2001). Chave et al. (2004) illustrated that
the largest source of error in estimating tropical forest biomass was the allometric tree model
used. The vertical stem CO2 efflux is commonly projected to a ground surface unit by
multiplying with the stem area index (i.e., unit bark surface area per unit ground area; SAI).
Differences in the tree model used to calculate the SAI exist (cylindrical: e.g., Levy and Jarvis
1998; cone-shaped: e.g., Meir and Grace 2002; truncated cone: e.g., Yoneda 1993) and can
considerably alter efflux results. The cone-based tree model yielded 50% lower values of stem
C efflux than the cylindrical trunk model (Table 4.2, Table 4.3). In our study, the cone-based
calculation may slightly underestimate the actual ground-projected stem C efflux. However,
the latter must conceivably overestimate rates of bole C release per unit ground. Any other
alternative method or allometry is not available for accurate determination of stem surfaces.
We found no significant relationship between rates of RS and stem diameter size or
basal area at any of the sites (Figure 4.2a). This may indicate that tree size is less important
for rates of RS than species identity or demographic positions in this species-rich tropical
montane forest. Several studies calculating stand-level CO2 release in temperate (Strobel
2004, Gansert 2002, Gries 2004) and tropical forests (Ryan et al. 1994, Horna 2002, Meir and
Grace 2002, Nepstad et al. 2002, Cavaleri et al. 2006) distinguished different diameter size
classes prior to up-scaling. However, Ryan et al. (1994) found stem diameter to explain only
20% of the variability in the stem CO2 release of one single tropical lowland tree species.

Seasonality of wood CO2 efflux
79
Tab
le 4
.3. A
nnua
l woo
d (s
tem
onl
y) c
arbo
n re
leas
e (R
Sann
ual,
g C
m-2
gro
und
area
yr-1
), st
em b
iom
ass
and
sele
cted
site
cha
ract
eris
tics
of n
ine
tropi
cal,
thre
e te
mpe
rate
and
one
bor
eal f
ores
t site
. Sta
ndin
g w
ood
biom
ass
is a
ssum
ed to
con
tent
50
% c
arbo
n. G
iven
are
ann
ual p
reci
pita
tion
(PPT
, mm
), m
ean
annu
al
tem
pera
ture
(TA
ir, °C
), le
af a
rea
inde
x (L
AI)
, sta
nd b
asal
are
a (m
² ha-1
) and
mea
n st
and
tree
heig
ht (h
mea
n, m
). A
ltitu
de in
m a
.s.l..
A
ltitu
de
Fore
st ty
pe
Site
PP
T
TA
irL
AI
Bas
al
area
h m
ean
RSa
nnua
l St
em
Bio
mas
s R
S / S
tem
bi
omas
s So
urce
10
50
prem
onta
ne
Ecua
dor
1900
19
.46.
033
.6
15.6
167.
1*
1391
50.
012
this
stud
y
1890
m
onta
ne
Ecua
dor
2200
15
.75.
736
.9
10.1
102.
6*
8160
0.01
3th
is st
udy
30
50
uppe
r-m
onta
ne
Ecua
dor
4500
9.
42.
242
.2
5.2
37.7
* 54
300.
007
this
stud
y
lo
wla
nd, s
econ
dary
C
amer
oon
1520
24
.54.
4
3621
4 87
00**
0.03
0**M
eir &
Gra
ce 2
002
lo
wla
nd
Bra
zil
2200
25
.55.
529
30
390
1170
00.
033
Mei
r et a
l. 19
96
50-1
50
low
land
, old
-gro
wth
B
razi
l c.
290
0 26
.75.
7
42
0
C
ham
bers
et a
l. 20
04
50
wet
, old
-gro
wth
C
osta
Ric
a 38
80
26.2
6.5
220-
360
1245
00.
018-
0.02
9R
yan
et a
l. 19
94
37-1
50
wet
, old
-gro
wth
C
osta
Ric
a 40
00
266.
524
20
508
8100
0.06
3C
aval
eri e
t al.
2004
woo
d <1
0 cm
35
9 12
000.
299
woo
d >1
0 cm
14
9 69
000.
022
Sahe
lian-
shru
b-fa
llow
N
iger
56
2 33
-41
0.63
2.
247
.2
Le
vy &
Jarv
is19
98
tem
pera
te, m
ixed
A
lber
ta
1400
5-
234.
920
.1
2619
6 57
100.
034
Mah
li et
al.
1999
30
0
tem
pera
te, b
eech
Fr
ance
82
0 9.
25.
6
1322
5
D
ames
in e
t al.
2001
tem
pera
te, m
ixed
Te
nnes
see
1400
13
.35.
021
.5
149-
204
6500
0.02
3-0.
031
Edw
ards
& H
anso
n 19
96
bo
real
, con
ifero
us
Can
ada
400
-20-
173.
331
.5
987
36
300.
024
Lavi
gne
& R
yan
1997
*
Cyl
inde
r-ba
sed
calc
ulat
ions
resu
lt in
dou
ble
the
amou
nt o
f the
pre
sent
ed c
one-
base
d va
lues
**
Giv
en a
re a
bove
grou
nd b
iom
ass a
nd R
abov
egro
und /
Bio
mas
s abo
vegr
ound
- rat
io

Chapter 4
80
Annual wood carbon release across the elevation transect
In terms of standing carbon stocks, wood productivity and rates of stem respiration,
our premontane site (1050 m) was similar to a wet tropical lowland forest in Costa Rica (Ryan
et al. 1994, Cavaleri et al. 2006). We are not aware of any study on wood C release in a
tropical montane forest. We found annual RS at 1890 m slightly lower than data reported for
broadleaved temperate forests (Table 4.3). Annual RS at 3050 m was even lower than found
for other sites with low aboveground productivity such as semi-arid shrub forests in the Sahel-
zone (Levy and Jarvis 1998) or a Canadian boreal forest (Lavigne and Ryan 1997). The
unexpectedly large gap between our results from tropical montane forests and the results from
temperate, boreal and subtropical forests may partly be a consequence of the use of different
up-scaling procedures.
In Ecuador, annual RS declined 4.4-fold over 2000-m elevation distance. In contrast,
the annual RR did not change between 1050 m and 3050 m as the lower specific rates of RR
measured at 3050 m were compensated by the high coarse root biomass stock (Table 4.2).
This shift in carbon partitioning was mirrored by a sharp increase of the coarse root carbon
use efficiency (CUE: i.e., ratio of production [e.g., coarse root] to gross carbon fixation [e.g.,
coarse root production + RR]). On the other hand, stem CUE declined with elevation (Table
4.2). At ecosystem level, CUE gives the fraction of carbon invested into growth relative to the
total amount of carbon assimilated (i.e., ratio of net primary production to gross primary
production). Based on our data of annual RS and RR and annual stem and coarse root
increment, we calculated a CUE at the stem level of 0.46 and a coarse root CUE of 0.17 at
1050 m. An opposite relationship was found at 3050 m, where stem CUE was 0.16, whereas
coarse root CUE amounted to 0.55 (Table 4.2). Low CUE values could indicate restricted
nutrient availability which would hamper the use of assimilates for growth. Nutrient
limitation typically leads to higher C costs of constructing new tissue (Chambers et al. 2004).
A preferential C investment into stem growth and respiration in the premontane forest is an
expression of more favourable growth conditions and more fierce competition for light at
1050 m. The upper montane forests are thought to be primarily limited by N shortage (Soethe
et al. 2007, Leuschner et al. 2007). A high CUE of the coarse roots at 3050 m reflects that tree
anchorage and nutrient acquisition are priority tasks in this environment.

Seasonality of wood CO2 efflux
81
Conclusions
(1) The evergreen tree species of this tropical montane moist forest showed a clear
seasonal pattern in stem respiratory activity.
(2) Periods of highest rates of stem respiration were particularly warm and dry, but
changes in respiratory activity showed no simple relation to temperature.
(3) Our findings raise the question if the elevated rates of stem respiration measured
under dry season conditions are a consequence of stimulated cell growth as was
previously assumed, or if excessive carbon was respired via the alternative pathway of
respiration.
(4) The degree of climate sensitivity found in this study indicates that tropical montane
forests could be strongly affected by global climate change.
(5) The increasing carbon allocation to the root system with increasing elevation is
associated with a large increase of the coarse root carbon use efficiency (CUE),
indicating a higher belowground sink activity at high elevations.
Acknowledgements
We are grateful to the Ministerio del Ambiente Loja-Zamora for granting the research
permit, and the Fundación Científica San Francisco (Nature and Culture International) for the
ongoing support at Estación Científica San Francisco. We thank Gerald Moser (University of
Goettingen) for contributing data on climate and general stand characteristics. We are also
grateful to Florian Werner (University of Goettingen) for fruitful discussions during earlier
stages of the manuscript. This study was funded by DFG (German Science Foundation)
through a grant in the Research Unit 402 (Functionality in a Tropical Mountain Rainforest,
subproject B6).

Chapter 4
82
4.6 References
Bendix J, Homeier J, Ortiz EC, Emck P, Breckle SW, Richter M, Beck E (2006) Seasonality
of weather and tree phenology in a tropical evergreen mountain rain forest. International
Journal of Biometeorology 50, 370-384.
Bräuning A, Burchardt I. (2006) Detection of growth dynamics in tree species of a tropical
mountain rain forest in southern Ecuador. TRACE - Tree Rings in Archaeology,
Climatology and Ecology 4, 127-131.
Bräuning A, von Schnakenburg P, Volland-Voigt F, Peters T (2008) Seasonal growth
dynamics and its climate forcing in tropical mountain rain forest in southern Ecuador.
TRACE- Tree Rings in Archeaology, Climatology and Ecology 6
Bräuning A, Homeier J, Cuevas EO, Beck E, Günter S (2008) Growth dynamics of trees in
tropical mountain ecosystems. In: Gradients in a tropical mountain ecosystem of Ecuador.
(eds.: Beck E, Bendix J, Kottke I, Makeschin F, Mosandl R). Springer Verlag, Berlin,
Germany. Ecological Studies 198, in press.
Brujinzeel LA, Veneklaas EJ (1998) Climatic conditions and tropical montane forest
productivity: The fog is not lifted yet. Ecology 79, 3-9.
Cavaleri MA, Oberbauer SF, Ryan MG (2006) Wood CO2 efflux in a primary tropical rain
forest. Global Change Biology 12, 2442-2458.
Chambers JQ, Tribuzy ES, Toledo LC, Crispim BF, Higuchi N, Dos Santos J, Araújo AC,
Kruijt B, Nobre AS, Trumbore SE (2004) Respiration from a tropical forest ecosystem:
Partitioning of sources and low carbon use efficiency. Ecological Applications 14, 72-88.
Chave J, Condit R, Aguilar S, Hernandez A, Lao S, Perez R (2004) Error propagation and
scaling for tropical forest biomass estimates. Philosophical Transactions of the Royal
Society of London Series B 359, 409-420.
Chen X, Hutley LB, Eamus D (2003) Carbon balance of a tropical savanna of northern
Australia. Oecologia 137, 405-416.
Clark DA, Piper SC, Keeling CD, Clark DB (1993) Tropical rain forest tree growth and
atmospheric carbon dynamics linked to interannual temperature variation during 1984–
2000. Philosophical Transactions of the Royal Society of London Series B 100, 5852–
5857.
Clark DA, Clark DB (1994) Climate-induced annual variation in canopy tree growth in a
Costa Rican tropical rain forest. The Journal of Ecology 82, 865-872.

Seasonality of wood CO2 efflux
83
Cueva EO, Homeier J, Breckle SW, Bendix J, Emck P, Richter M, Beck E (2006) Seasonality
in an evergreen tropical mountain rainforest in southern Ecuador. Ecotropica 12, 69-85.
Damesin C, Ceschia E, Le Groff N, Ottorini JM, Dufrene E (2001) Stem and branch
respiration of beech: from tree measurements to estimations at the stand level. New
Phytologist 153, 159-172.
Devall MS, Parresol BR, Wright S J (1995) Dendroecological analysis of Cordia alliodora,
Pseudobombax septenatum and Annona spraguei in central Panama. IAWA Journal 16,
411-424.
Edwards NT, Hanson PJ (1996) Stem respiration in a closed-canopy oak forest. Tree
Physiology 16, 433-439.
Feeley KJ, Wright SJ, Supardi MNN, Kassim AR, Davies SJ (2007) Decelerating growth in
tropical forest trees. Ecology Letters 10, 461-469.
Gansert D (1995) Die Wurzel- und Sprossrespiration junger Buchen (Fagus sylvatica L.) in
einem montanen Moder-Buchenwald. PhD thesis. University of Göttingen, Germany,
pp.164.
Graham EA, Stephen SM, Kitajima K, Phillips NG, Wright SJ (2003) Cloud cover limits net
CO2 uptake and growth of a rainforest tree during tropical rainy seasons. Philosophical
Transactions of the Royal Society of London Series B 100, 572-576.
Gries D (2004) Ökophysiologische Grundlagen und biophysikalische Steuerung der
Kohlenstoffbilanz zweier edapisch gegensätzlicher Altbuchenbestände. Habilitation
thesis, University of Göttingen, Germany, pp. 589.
Homeier J (2004) Tree diversity, forest structure and growth dynamic of two tropical montane
rain forests in Ecuador und Costa Rica. Dissertationes Botanicae 391, pp. 207.
Horna V (2002) Carbon release from woody parts of trees from a seasonally flooded Amazon
forest near Manaus, Brazil. PhD Thesis, University of Bayreuth, pp.138.
Irving DE, Silsbury JH (1987) A comparison of the rate of maintenance respiration in some
crop legumes and tobacco determined by three methods. Annals of Botany 59, 257-264.
Keller M, Lerdau M (1999) Isoprene Emission from tropical forest canopy leaves. Global
Biogeochemical Cycles 13, 19–29.
Lambers H, Chapin FS, Pons TI (1998) Plant physiological ecology. Springer-Verlag, New
York, pp. 540.
Lavigne MB, Ryan M.G. (1997) Growth and maintenance respiration rates of aspen, black
spruce and jack pine stems ate northern and southern BOREAS sites. Tree Physiology 17,
543-551.

Chapter 4
84
Lerdau MT, Throop HL (1999) Isoprene emission and photosynthesis in a tropical forest
canopy: Implications for model development. Ecological Applications 9, 1109–1117.
Leuschner C, Moser G, Bertsch C, Röderstein M, Hertel D (2007) Large altitudinal increase
in the tree root/shoot ratio in tropical mountain forests of Ecuador. Basic and Applied
Ecology 8, 219-230.
Levy PE, Jarvis PG (1998) Stem CO2 fluxes in two Sahelian shrub species (Guiera
sengalensis and Combretum micranthum). Functional Ecology 12, 107-116.
Malhi Y, Baldocchi DD, Jarvis PG (1999) The carbon balance of tropical, temperate and
boreal forests. Plant, Cell and Environment 22, 715-740.
Meir P, Grace J (2002) Scaling relationship for woody tissue respiration in two tropical rain
forests. Plant, Cell and Environment 25, 963-973.
Meir P, Grace J, Miranda AC, Lloyd J (1996) Soil respiration measurements in a Brazil forest
and cerrado vegetation during the wet season. In: Amazonian Deforestation and Climate
(eds. Gash JHC, Nobre CA, Roberts JM, Victoria RL), Wiley, Chichester, 319-330.
Moser G (2008) Elevation effects on key processes of carbon cycling in South Ecuadorian
mountain forests. PhD Thesis. University of Göttingen, Germany, pp. 125.
Moser G, Roederstein M, Soethe N, Hertel D, Leuschner C (2008) Altitudinal changes in
stand structure and biomass allocation of tropical mountain forests in relation to
microclimate and soil chemistry: a transect study in Ecuador and a neotropical meta-
analysis. In: Gradients in tropical mountain ecosystems of Ecuador. (eds. Beck E, J
Bendix, I Kottke, F Makeschin, R Mosandl). Springer Verlag, Berlin Heidelberg,
Ecological Studies 198, 229-242.
Nepstad DC, Moutinho P, Dias MB et al. (2002) The effects of partial throughfall exclusion
on canopy processes, above-ground production, and biogeochemistry of an Amazon
forest. Journal of Geophysical Research–Atmospheres 107, 1-8.
Penning de Vries FWT (1975) Use of assimilates in higher plants. In: Photosynthesis and
productivity in different environments. (ed. Cooper JP). Cambridge University Press,
Cambridge.
Röderstein M, Hertel D, Leuschner C (2005) Above- and below-ground litter production in
three tropical mountain forests (South Ecuador). Journal of Tropical Ecology 21, 483-492.
Ryan MG (1990) Growth and maintenance respiration in stems of Pinus contorta and Pinus
engelmannii. Canadian Journal of Forest Research 20, 48-57.
Ryan MG (1991) Effect of climate change on plant respiration. Ecological Applications 1,
157-167.

Seasonality of wood CO2 efflux
85
Ryan MG, Hubbard RM, Clark DA, Sanford RL Jr (1994) Woody-tissue respiration of
Simarouba amara and Minquartia guinensis, two wet forest trees with different growth
habits. Oecologia 100, 213-220.
Schrumpf M, Guggenberger G, Schubert C, Valarezo C, Zech W (2001) Tropical montane
rain forest soils - development and nutrient status along an altitudinal gradient in the south
Ecuadorian Andes. Die Erde, 132, 43-59.
Silva RP, Santos J, Tribuzy ES, Chambers JQ, Nakamura S, Higuchi N (2002) Diameter
increment and growth patterns of individual trees in Central Amazon, Brazil. Forest
Ecology and Management 116, 295-301.
Soethe N, Lehmann J, Engels C (2006) Root morphology and anchorage of six native tree
species from a tropical montane forest and an elfin forest in Ecuador. Plan and Soil 279,
173-185.
Soethe N, Lehmann J, Engels C (2007) Carbon and nutrient stocks in roots of forests at
different altitudes in the Ecuadorian Andes. Journal of Tropical Ecology 23, 319-328.
Sprugel DG (1990) Components of woody-tissue respiration in young Abies amabilis trees.
Trees 4, 88-98.
Sprugel DG, Benecke U (1991) Measuring woody-tissue respiration and photosynthesis. In:
Techniques and approaches in forest tree ecophysiology (eds. Lassoie JP, Hinckley T),
CRC-Press Inc, Boston. pp. 329-355.
Strobel J (2004) Die Atmung der verholzten Organe von Altbuchen (Fagus sylvatica L.) in
einem Kalk- und einem Sauerhumusbuchenwald. PhD thesis, University of Göttingen,
Germany, pp. 170.
Tanner EVJ (1985) Jamaican montane forests: nutrient capital and costs of growth. Journal of
Ecology 73, 553-568.
Teskey RO, McGuire MA (2002) Carbon dioxide transport in xylem causes errors in
estimation of rates of respiration in stems and branches of trees. Plant, Cell and
Environment 25, 1571-1577.
Teskey RO, McGuire MA (2007) Measurement of stem respiration of sycamore (Plantanus
occidentalis L.) trees involves internal and external fluxes of CO2 and possible transport
of CO2 from roots. Plant, Cell and Environment, 30, 570-579.
Van der Werf A, Van den Berg G, Ravenstein HJL, Lambers H, Eisberg R (1992) Protein
turnover: A significant component of maintenance respiration in roots? In: Molecular,
biochemical and physiological aspects of plant respiration. (eds. Lambers H, Van der Plas
LHW). SPB Academic Publishing, The Hague, pp. 61-77.

Chapter 4
86
Verheyden A, Kairo JG, Beeckman H., Koedam N (2004) Growth rings, growth ring
formation and age determination in the mangrove Rhizophora mucronata. Annals of
Botany 94, 59-66.
Waide RB, Zimmermann JK, Scatena FN (1998) Controls of primary productivity: lessons
from the Luquillo mountains in Puerto Rico. Ecology 79, 31-37.
Waring RH, McDonald JS, Larssen S, Ericsson T, Wiren A, Arwidsson E, Ericsson A,
Lohammar T (1985) Differences in chemical composition of plants grown at constant
relative growth rates with stable mineral nutrition. Oecologia 66, 157-160.
Worbes M (1999) Annual growth rings, rainfall-dependent growth and long-term growth
patterns of tropical trees from the Caparo forest reserve in Venezuela. Journal of Ecology
87, 391-403.
Yoneda T (1993) Surface area of woody organs of an evergreen broadleaf forest tree in Japan
Southeast Asia. Journal of Plant Research 106, 229-237.
Zach A, Horna V, Leuschner C (2008) Elevational changes in woody tissue CO2 efflux rates
in a tropical mountain rainforest in southern Ecuador. Tree Physiology 28, 67-74.
Zach A, Horna V, Leuschner C (submitted) Diverging temperature response of tree stem CO2
efflux to dry season conditions in a tropical montane moist forest. Trees.

Chapter 5
87
THE C BALANCE OF THREE TROPICAL MONTANE FORESTS,
SOUTHERN ECUADOR
5 Chapter

C balance of tropical montane forests
88
5.1 Introduction
The carbon (C) balance of forest ecosystems is primarily controlled by assimilatory
CO2 uptake (AC) and the release of CO2 via autotrophic respiration (Ra). Part of the C is
transferred to the soil either in form of aboveground tree litter or via belowground processes
such as root turnover, the exudation of organic compounds to the rhizosphere (Luyssaert et al.
2007) and mycorrhizal hyphal turnover (Godbold et al. 2006). This fraction maintains the soil
organic carbon (SOC) pool and the microbial biomass, which, in turn, releases CO2 back to
the atmosphere via heterotrophic respiration (Rh). Although comprehensive estimates exist of
the C balance of differing forest biomes most of these studies combine data from a number of
sources using different methods in order to reveal a generalized C balance of the tropical,
temperate and boreal biome (Malhi et al. 1999, Malhi and Grace 2000, Luyssaert et al. 2007).
Few studies have been conducted determining all above-and belowground components
of a forests´ C balance within one study site, especially with regard to tropical forests (Malhi
and Grace 2000). Even today, establishing a complete C balance is mainly constrained by the
lack of data on the C dynamics belowground (Malhi and Grace 2000). While aboveground
biomass is usually directly measured empirical data on the belowground counterpart are often
missing. Instead, their estimates are based on simple assumptions. For example, Fearnside
(1997) assumed belowground biomass to be 33% of aboveground biomass in a tropical
lowland forest. Root production was assumed to be proportional to aboveground productivity
and the above- to belowground biomass ratio (Malhi et al. 1999). However, it is commonly
accepted that such assumptions have often led to underestimate the fraction of belowground
carbon fluxes in forest C balances. Despite the lack of exact data on belowground C stocks
and dynamics, it can be expected that a large fraction of assimilated C has to be transferred to
the root system in order to allow forest ecosystems to maintain steady state conditions (Malhi
and Grace 2000); this may especially apply to tropical montane forest (TMF) ecosystems,
which are known to substantially invest into their belowground biomass with increasing
altitude similar to high latitude forests (Brujinzeel and Veeneklaas 1998, Moser 2008). Boreal
forests sequester 84% of their C below the ground and only 16% in the aerial parts, whereas
in tropical lowland forests above-and belowground biomass is more or less equally partitioned
(Malhi et al. 1999). The question as of how high-elevation tropical montane forests manage
this substantial belowground productivity is a central topic in the ongoing debate about TMF
forest structure and functionality.

Chapter 5
89
This chapter presents first C balances for the three tropical montane forest sites
described in the previous chapters (Chapters 1 to 4) in an attempt to shed some light on the
frequently discussed above- and belowground C partitioning patterns of TMFs and their
changes with altitude. Therefore, the CO2 efflux measurements presented above are combined
with detailed forest inventory data (Moser 2008) and data on soil respiration (Iost 2007).
5.2 Estimating C balance components of three tropical montane forests
Above- and belowground biomass and biomass production
Data on standing above- and belowground biomass (Table 5.1) and annual biomass
production (Table 5.2) were provided by G. Moser (Moser 2008, unpublished data). These
data refer to the very same study sites and have been assessed during an intensive
measurement period from May 2003 to July 2004. Biomass data are given as Mg C ha-1 and
increment data as g C m-2 yr-1 assuming a carbon content of dry matter of 50% (Penning de
Vries 1975).
Leaf area index
The leaf area index (LAI) of the study sites was determined using two optical (LAI-
2000, hemispherical photographs) and one direct method (leaf mass-related, Table 5.3; Moser
et al. submitted, Moser 2008). Moser et al. (submitted) pointed to several constraints
associated with the optical methods and concluded that the direct approach (based on leaf
litter production, leaf lifespan and specific leaf area data) provided the most reliable estimate
of LAI for the three study sites. Consequently, we based our calculations on the directly
determined LAI (Table 5.2 and Figure 5.1). Since the results of the three methods differ
considerably, we summarized changes in LAI-dependent values (canopy CO2 assimilation,
ecosystem respiration) in Table 5.3.
Canopy CO2 assimilation
Photosynthetic capacity (Amax) was measured at the three sites using a portable open
system infrared gas analyser with an integrated blue-red light source inside the leaf chamber
(Li-6400, Li-Cor, Inc.). Concentration of CO2 was kept constant at 360 ppm and air flow was
0.5 l min-1. We measured Amax at a light saturation of 1500 µmol photons m-2 s-1
(photosynthetic photon flux density, PPFD). Data were recorded when values stabilized (after
2-3 minutes). At 3050 m, we were able to measure attached, sun-exposed canopy leaves from

C balance of tropical montane forests
90
trees within the study site for Amax measurements. At 1050 m and 1890 m, the tall stature of
trees did not allow for in situ measurement of Amax. We therefore used representative, small-
stature trees in the vicinity of the study sites for Amax measurements on attached, sun-exposed
leaves (Appendix 7).
The Amax of sun-exposed leaves averaged 6.67 ± 1.83 (SD) µmol CO2 m-2 leaf s-1, 6.39
± 0.98 and 4.66 ± 1.74 at 1050, 1890 and 3050 m, respectively, and did not differ significantly
between sites (Scheffé, p < 0.05). Canopy CO2 assimilation (AC) of the sites was extrapolated
based on the measured mean Amax values of sunlit leaves and LAI (Table 5.2 and 5.3). In
dense tropical forests, most of the canopy leaves are not directly sun-exposed. Based on a
“sun/shade” model for photosynthesis simulation, Mercado et al. (2006) calculated the
fraction of shaded leaves to account for 70-85% of the canopy LAI in a mature tropical
lowland forest in Brazil (LAI 5.7). We therefore assumed a fraction of 80% of the LAI to be
shade-leaves and 20% to be sunlit-leaves at 1050 m (LAI 6.0) and 1890 m (LAI 5.7). In
contrast, the lower leaf density at 3050 m (LAI 2.2) allows most of the leaves to receive full
sunlight (personal observation). Here, we assumed sunlit-leaves to account for a fraction of
80%, while the shaded leaf fraction constitutes 20% of the canopy LAI. We could not find
any reference for the relationship between Amax of sun leaves and Amax of shade leaves in
multilayered tropical canopy trees. To account for the lower photosynthetic activity of shade
leaves, we instead used the proportional difference found between the Amax of leaves from
tropical tree seedlings grown under high (1000 µmol photons m-2 s-1) and low (100 µmol
photons m-2 s-1) light intensities (Veneklaas and Poorter 1998). Here, Amax of leaves from
low-light environments was 23% lower than the Amax of leaves grown under high-light
conditions. We therefore reduced the Amax of the sun-exposed leaves as measured at the sites
for 23% and used this value as a measure of the Amax of the shaded canopy fraction. Since we
used data on photosynthetic capacity (Amax), we assumed a 6-h-day for assimilation activity
instead of using the entire 12 hours of daylight in order to partially compensate for the high
assimilation rates.
Leaf dark respiration
At 3050 m, leaf dark respiration rates were used as derived from light-response curves
of photosynthesis (Appendix 8). We recorded light-response curves of 35 attached leaf
samples of 10 canopy tree species abundant at the study site. Leaf dark respiration (RL) was
measured in the dark chamber and recorded after values have stabilized. The RL values were
averaged for mean stand RL. At 3050 m, mean RL was 0.53 ± 0.49 (SD) µmol CO2 m-2 leaf s-1.

Chapter 5
91
For the sites at 1050 m and 1890 m we calculated RL by using the relationship between leaf
dark respiration and photosynthetic capacity as described by Cavaleri et al. (2008):
(1) Amax = (10.9*RL) / (0.52*RL)
We calculated rates of leaf dark respiration of 0.47 and 0.44 µmol CO2 m-2 leaf s-1 at 1050 and
1890 m, respectively. To account for differences in RL of sun and shade leaves, we used the
proportional difference in RL measured by Veneklaas and Poorter (1998) for tropical tree
seedlings as mentioned in the previous section. The authors found RL to be 53% lower in
seedlings grown under low-light than under high-light conditions. Leaf dark respiration of the
sun- and shade-leaf fraction was summed and extrapolated to the annual foliage dark
respiration by using the LAI and assuming constant 24-h respiration rates.
Woody tissue respiration
Stem wood tissue efflux values as derived from our measurements at the three study
sites were used (Chapter 4). Since branch respiration rates had not been assessed, estimates of
branch CO2 release for the three study sites are based on a rough approximation. Data on
wood biomass of the three sites did not distinguish between stem and branch wood, therefore
a biomass-based extrapolation was not possible. Branch CO2 efflux differs from stem CO2
efflux (Sprugel and Benecke 1991); branch respiration was found to increase with increasing
height in the canopy (Maier et al. 1998, Ryan et al. 1996, Cavaleri et al. 2006) and was higher
than efflux rates of stems of the same diameter (Cavaleri et al. 2006). Cavaleri et al. (2006)
found wood <10 cm to account for 70% of the total wood CO2 efflux from various functional
groups (trees, lianas, palms) in a tropical lowland forest. Lianas contributed substantially to
this portion. However, half of total wood CO2 efflux derived from small diameter wood (0-2
cm) from the upper-, mid- and lower-canopy. Based on these finding we assumed branch
respiration to account for 50% of total wood respiration (i.e., stem and branches), which
presumably underestimate the actual branch CO2 release rates at the three sites. However,
equal respiration rates of branch and stem respiration rates has also been assumed by other
studies (e.g., Ryan et al. 1995).
Root and soil respiration
We used estimates of annual coarse root carbon release as measured and extrapolated
above (Chapter 4). Data of total soil organic carbon (SOC) stocks, soil respiration,
heterotrophic respiration and fine root respiration have been gained at the very same study

C balance of tropical montane forests
92
sites (Iost 2007). Annual root litter production was assumed to equal annual root production at
the three sites (G. Moser, personal communication).
Missing components
The forest C balance consists of several more components which are difficult to
quantify and were not available for the study sites. Such “missing values” include e.g., data
on coarse woody debris, understory growth and respiration, respiration of reproductive
organs, C losses through herbivory, exudation from roots, transfer of C to mycorrhiza and
emission of volatile organic compounds or methan. These fractions may account for 11-20%
of total NPP in tropical forests (Luyssaert et al. 2007), but were omitted from our C balance
approach.
Structure of results
The standing biomass stocks of the three sites are summarized in Table 5.1. Annual C
fluxes and flux components are given in Table 5.2. Differences in total CO2 influx (AC) and
total ecosystem CO2 efflux (Rtotal) when based on the three different LAI are presented in
Table 5.3. Using different LAI would result in changes of items (1), (6), (11), and (29) to (41)
of Table 5.2. Figure 5.1 showed simplified diagrams of the annual C balance of the three
study sites (based on Table 5.2). Rather than presenting precise values, the flux diagrams aim
to illustrate altitudinal changes and to demonstrate principle differences between the three
diverging montane forest systems.
Table 5.1. Estimated stocks of C (Mg ha-1) at the three sites at 1050, 1890 and 3050 m elevation. Biomass data from Moser (2008). Stocks of soil organic carbon (SOC) from Iost (2007).
1050 m 1890 m 3050 m Above ground: Tree foliage 3.4 4.9 1.8 Tree wood 139.2 81.6 54.3 Total AG 142.6 86.5 56.1 Below ground: Coarse roots 14.7 10.0 26.0 Fine roots 1.3 2.9 5.6 Total BG 16.1 13.1 31.4 SOC 48.9 68.0 126.2 Total tree biomass 158.6 99.4 87.5 Root/total biomass 10% 13% 36%
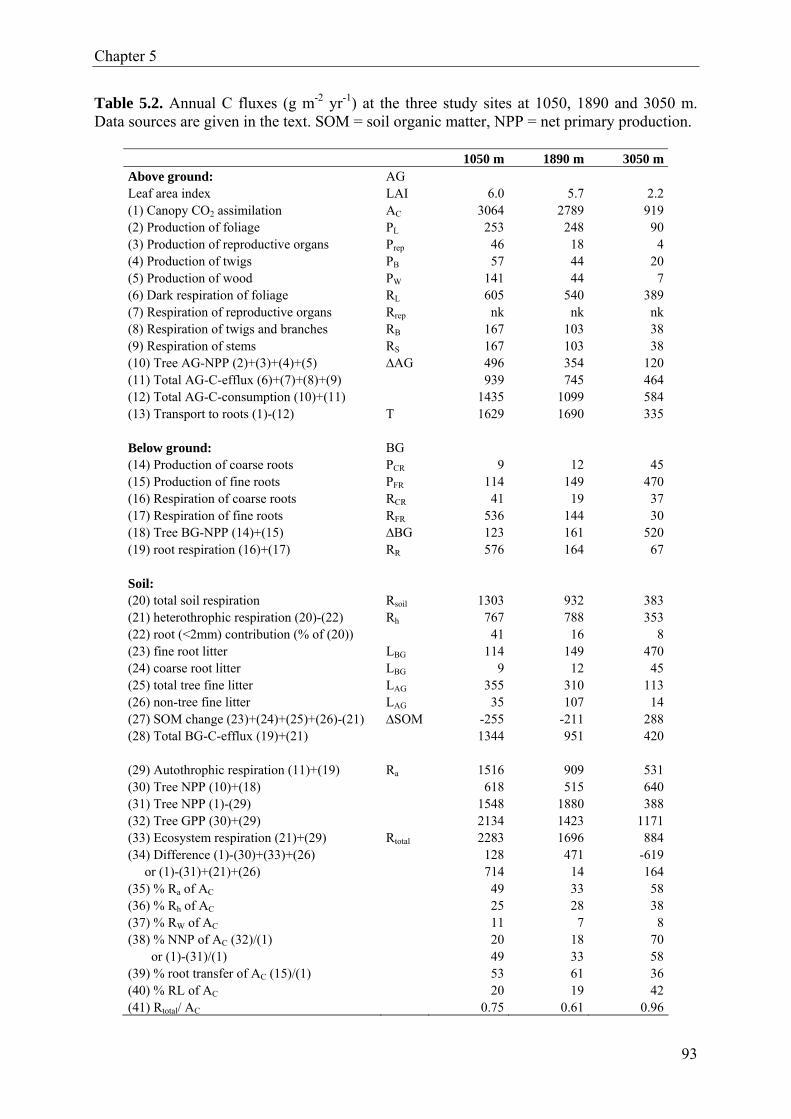
Chapter 5
93
Table 5.2. Annual C fluxes (g m-2 yr-1) at the three study sites at 1050, 1890 and 3050 m. Data sources are given in the text. SOM = soil organic matter, NPP = net primary production.
1050 m 1890 m 3050 mAbove ground: AG Leaf area index LAI 6.0 5.7 2.2(1) Canopy CO2 assimilation AC 3064 2789 919(2) Production of foliage PL 253 248 90(3) Production of reproductive organs Prep 46 18 4(4) Production of twigs PB 57 44 20(5) Production of wood PW 141 44 7(6) Dark respiration of foliage RL 605 540 389(7) Respiration of reproductive organs Rrep nk nk nk(8) Respiration of twigs and branches RB 167 103 38(9) Respiration of stems RS 167 103 38(10) Tree AG-NPP (2)+(3)+(4)+(5) ∆AG 496 354 120(11) Total AG-C-efflux (6)+(7)+(8)+(9) 939 745 464(12) Total AG-C-consumption (10)+(11) 1435 1099 584(13) Transport to roots (1)-(12) T 1629 1690 335 Below ground: BG (14) Production of coarse roots PCR 9 12 45(15) Production of fine roots PFR 114 149 470(16) Respiration of coarse roots RCR 41 19 37(17) Respiration of fine roots RFR 536 144 30(18) Tree BG-NPP (14)+(15) ∆BG 123 161 520(19) root respiration (16)+(17) RR 576 164 67 Soil: (20) total soil respiration Rsoil 1303 932 383(21) heterothrophic respiration (20)-(22) Rh 767 788 353(22) root (<2mm) contribution (% of (20)) 41 16 8(23) fine root litter LBG 114 149 470(24) coarse root litter LBG 9 12 45(25) total tree fine litter LAG 355 310 113(26) non-tree fine litter LAG 35 107 14(27) SOM change (23)+(24)+(25)+(26)-(21) ∆SOM -255 -211 288(28) Total BG-C-efflux (19)+(21) 1344 951 420 (29) Autothrophic respiration (11)+(19) Ra 1516 909 531(30) Tree NPP (10)+(18) 618 515 640(31) Tree NPP (1)-(29) 1548 1880 388(32) Tree GPP (30)+(29) 2134 1423 1171(33) Ecosystem respiration (21)+(29) Rtotal 2283 1696 884(34) Difference (1)-(30)+(33)+(26) 128 471 -619 or (1)-(31)+(21)+(26) 714 14 164(35) % Ra of AC 49 33 58(36) % Rh of AC 25 28 38(37) % RW of AC 11 7 8(38) % NNP of AC (32)/(1) 20 18 70 or (1)-(31)/(1) 49 33 58(39) % root transfer of AC (15)/(1) 53 61 36(40) % RL of AC 20 19 42(41) Rtotal/ AC 0.75 0.61 0.96
C balance of tropical montane forests
94
5.3 The C balance of three tropical montane forests
Canopy CO2 assimilation
Canopy CO2 assimilation (AC) was considerably lower at 3050 m than at the other two
sites (item (1) in Table 5.2). Including foliage respiration to estimate gross photosynthesis (AC
+ RL) resulted in values very similar to values of gross photosynthesis found for humid boreal
forests (653-999 g C m-2 yr-1) ( Luyssaert et al. 2007). However, the measured Amax of sunlit
leaves did not decline significantly along the gradient, indicating that the capacity of single
leaves to assimilate C is not the major constraint of C gain at high altitudes. Instead, annual
AC at 3050 m appeared to be restricted by a combination of several limitations, such as a low
LAI, light availability due to more frequent cloudiness (Bendix et al. 2008), low temperatures
and soil nutrient supply compared to 1050 and 1890 m (Moser et al. 2007, Leuschner et al.
2007, Moser 2008).
Depending on the LAI used for calculation, AC continuously declined with increasing
elevation (items (B) in Table 5.3) or showed little changes from 1050 to 1890 m ((A) and
(C)). Estimates of gross photosynthesis (AC + RL, Table 5.2) based on the mass-related LAI
(A)were in the range of values on gross photosynthesis reported for tropical lowland forests
(Malhi et al. 1999: 3040 g C m-2 yr-1; Luyssaert et al. 2007: 3145 and 3735 g C m-2 yr-1). LAI
of 5-6 are typical for tropical lowland forests (Ryan et al. 1994, Malhi et al. 1999, Meir and
Grace 2002). Chambers et al. (2004) even reported a LAI of only 4.7 for a tropical lowland
forest near Manaus, Brazil. Differences in the methods used to determine the LAI in tropical
forests has been found to result in large uncertainties when extrapolating photosynthetic CO2
assimilation or leaf dark respiration to the stand (Cavaleri et al. 2008). However, the
comparatively high AC estimated for the two TMF sites at 1050 and 1890 m most likely
derived from the theoretical assumptions used to calculate the cumulative assimilatory C gain
of sunlit and shaded leaves in the complex, multilayered canopy strata of tropical forest trees.
Net primary production (NPP)
More surprising than the decline in AC with increasing elevation was the contrasting
result with respect to NPP along the elevational transect. Previous studies based on direct
measurements of above- and belowground biomass increments have suggested that NPP
remains largely constant (30) with increasing elevation from 1050 to 3050 m (Moser 2008),
while our estimates based on AC and Ra suggest that NPP declines considerably from 1050 to
3050 m (31). Moser (2008) has found an enormous shift in C allocation from predominately
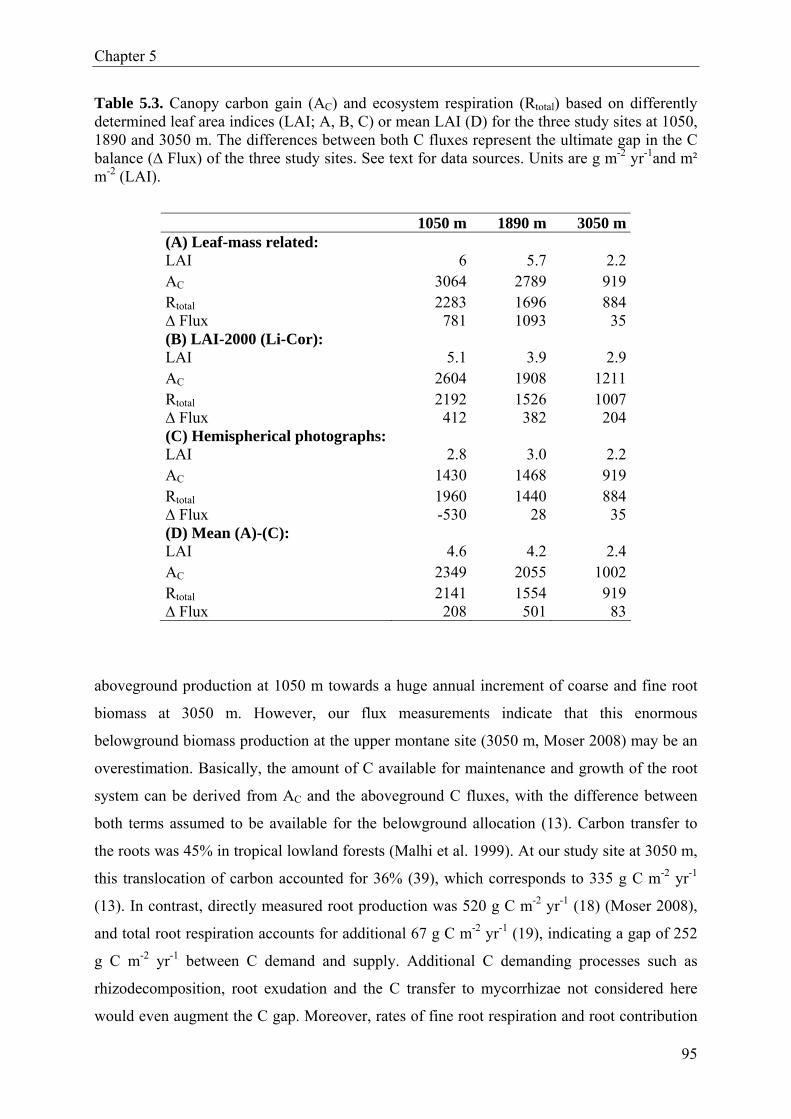
Chapter 5
95
Table 5.3. Canopy carbon gain (AC) and ecosystem respiration (Rtotal) based on differently determined leaf area indices (LAI; A, B, C) or mean LAI (D) for the three study sites at 1050, 1890 and 3050 m. The differences between both C fluxes represent the ultimate gap in the C balance (∆ Flux) of the three study sites. See text for data sources. Units are g m-2 yr-1and m² m-2 (LAI).
1050 m 1890 m 3050 m (A) Leaf-mass related: LAI 6 5.7 2.2 AC 3064 2789 919 Rtotal 2283 1696 884 ∆ Flux 781 1093 35 (B) LAI-2000 (Li-Cor): LAI 5.1 3.9 2.9 AC 2604 1908 1211 Rtotal 2192 1526 1007 ∆ Flux 412 382 204 (C) Hemispherical photographs: LAI 2.8 3.0 2.2 AC 1430 1468 919 Rtotal 1960 1440 884 ∆ Flux -530 28 35 (D) Mean (A)-(C): LAI 4.6 4.2 2.4 AC 2349 2055 1002 Rtotal 2141 1554 919 ∆ Flux 208 501 83
aboveground production at 1050 m towards a huge annual increment of coarse and fine root
biomass at 3050 m. However, our flux measurements indicate that this enormous
belowground biomass production at the upper montane site (3050 m, Moser 2008) may be an
overestimation. Basically, the amount of C available for maintenance and growth of the root
system can be derived from AC and the aboveground C fluxes, with the difference between
both terms assumed to be available for the belowground allocation (13). Carbon transfer to
the roots was 45% in tropical lowland forests (Malhi et al. 1999). At our study site at 3050 m,
this translocation of carbon accounted for 36% (39), which corresponds to 335 g C m-2 yr-1
(13). In contrast, directly measured root production was 520 g C m-2 yr-1 (18) (Moser 2008),
and total root respiration accounts for additional 67 g C m-2 yr-1 (19), indicating a gap of 252
g C m-2 yr-1 between C demand and supply. Additional C demanding processes such as
rhizodecomposition, root exudation and the C transfer to mycorrhizae not considered here
would even augment the C gap. Moreover, rates of fine root respiration and root contribution

_ C balance of tropical montane forests
96
to soil respiration declined with increasing altitude, while the opposite would be expected if
the transfer of C to below the ground was to increase with elevation (Iost 2007). On the other
hand, when AC and RL were based on the higher LAI derived from LAI-2000 (B, Table 5.3),
carbon delivery from aboveground amounted to 504 g C m-2 yr-1 and would hence match the
C demand of belowground processes slightly better (data not shown).
The fine root productivity at the three study sites was quantified by means of
minirhizotrons (Moser 2008). At 3050 m, some of the measurements may have been taken
before a new equilibrium was reached, since the time needed to establish steady state is
especially long at the upper montane site due to unfavourable growth conditions (i.e., low
temperature, periodically waterlogged soils, low nutrient availability). This could have
resulted in an overestimation of the fine root productivity at 3050 m (G. Moser, personal
communication). Furthermore, extrapolating root growth from the uppermost soil layer to the
total soil profile may have overestimated fine root productivity (Moser et al. submitted).
Gaps in the C balance and implications
Considering the two major fluxes AC and Rtotal, the upper montane site (3050 m) was
close to equilibrium (Table 5.2; (A) and (C) in Table 5.3). A close to steady state condition
may indicate that at 3050 m the flux-calculated NPP (31) may be more robust than the
directly measured one (item (30); Figure 5.1). Compared to the site at 3050 m, differences
between AC and Rtotal at 1050 and 1890 m were much higher, ranging between -37% (i.e.,
efflux is greater than influx) and 25% of AC at 1050m and between 2 and 39% at 1890 m
dependent on LAI. Using the averaged LAI seemed to be most robust in terms of a balanced
C exchange for all three study sites (Table 5.3).
Negative changes in the SOM stock at 1050 m and 1890 m (27) indicate that Rh
exceeded annual litter production. Soil respiration at 1050 m is indeed within the upper range
of values reported for the humid tropics (Iost 2007). At 1890 m, litter accumulation was
visibly higher than at 1050 m (personal observation), so that the calculated depletion could be
the result of missing litter data (e.g., coarse woody debris). At 3050 m the calculated changes
in SOM fairly agree with the observed accumulation of SOM at the upper montane forest
mainly resulting from lower temperatures and the lack of primary decomposers (Maraun et al.
2008).

Chapter 5 _
97
Figure 5.1. Estimated annual carbon fluxes for the three study sites at 1050, 1890 and 3050 m elevation. All units are g C m-2 yr-1. Abbreviations are given in Table 5.2.
_ C balance of tropical montane forests
98
Conclusions
All three study sites are considered intact, old-growth forests, which are assumed to be
in C flux equilibrium. Consequently, C efflux should more or less reflect C influx. While at
3050 m this assumption was almost matched, values calculated for the two lower sites implied
a large C sink (Figure 5.1). Apart from the mentioned sources of errors (e.g., extrapolation,
LAI), the missing values of several components of the C balance (see above) and
uncertainties in the quantity of other components urgently require additional and more exact
observations, such as on fine root production, branch wood production and respiration, day-
time and night-time respiration of sunlit and shaded leaves, and, most importantly, on the
canopy CO2 fixation. Establishing complete C balances is challenging and the (artificial) gaps
to close in C balances can be substantial; ranging in magnitude between 10-60% of AC for
different studies and forest biomes (Luyssaert et al. 2007). A balanced C budget of a forest is
the equilibrium between NPP and Rh, since changes in the former results in changes in the
latter after a certain time lag (Malhi and Grace 2000). However, on time scales shorter than
the carbon residence times of biomass or SOM, an increase in one of the two fractions (higher
nutrient input and favourable PAR increases NPP, or increasing soil temperature increases Rh)
will result in either a source or sink character of a given stand, especially in stands of small
sizes. The magnitude of uncertainties in the balance may be related negatively to plot size,
which is small in the case of our study when compared to the extent of ecosystems a C
balance is usually referred to. Interannual fluctuations in the regional climatic or the use of
data derived from different years may have also caused uncertainties in the annual net C flux
of the investigated TMF ecosystems. In this context, short-time variability in the components
of TMFs´ C balance as a result of local climate variation still needs to be resolved if we want
to assess the possible impact of global climate changes on C fluxes in TMFs or the degree of
the expected C fertilization effect of increasing atmospheric CO2 on NPP.

Chapter 5 _
99
5.4 References
Bendix J, Rollenbeck R, Richter M, Fabian P, Emck P (2008) The altitudinal gradient - climate. In: Gradients in a tropical mountain ecosystem of Ecuador. (eds.: Beck E, Bendix J, Kottke I, Makeschin F, Mosandl R). Springer Verlag, Berlin, Germany. Ecological Studies 198, in press.
Brujinzeel LA, Veneklaas EJ (1998) Climatic conditions and tropical montane forest productivity: The fog is not lifted yet. Ecology 79, 3-9.
Cavaleri MA, Oberbauer SF, Ryan MG (2006) Wood CO2 efflux in a primary tropical rain forest. Global Change Biology 12, 2442-2458.
Cavaleri MA, Oberbauer SF, Ryan MG (2008) Foliar and ecosystem respiration in an old-growth tropical rain forest. Plant Cell and Environment (online early article) 1-11.
Chambers JQ, Tribuzy ES, Toledo LC, Crispim BF, Higuchi N, Dos Santos J, Araújo AC, Kruijt B, Nobre AS, Trumbore SE (2004) Respiration from a tropical forest ecosystem: Partitioning of sources and low carbon use efficiency. Ecological Applications 14, 72-88.
Fearnside PM (1997) Greenhouse gases from deforestation in Brazilian Amazonia: net committed emission. Journal of Climate Change 35, 321-360.
Godbold D L, Hoosbeek M R, Lukac M, Cotrufo M F, Janssens I A, Ceulemans R, Polle A, Velthorst E F, Scarascia-Mugnozza G, De Angelis P, Miglietta F, Peressotti A (2006) Mycorrhizal hyphal turnover as a dominant process for carbon input into soil organic matter. Plant and Soil 281, 15-24.
Grayston SJ (1997) Rhizosphere carbon flow in trees, in comparison with annual plants: the importance of root exudation and its impact on microbial activity and nutrient availability. Journal of Applied Soil Ecology 5, 29-56.
Iost S (2007) Soil respiration, microbial respiration and mineralization in soils of montane rainforests of southern Ecuador: influence of altitude. PhD Thesis, TU Dresden, Germany, pp. 171.
Larcher W (1998) Physiological plant ecology. Springer Verlag Berlin, Germany, pp. 513.
Leuschner C, Moser G, Bertsch C, Röderstein M, Hertel D (2007) Large altitudinal increase in the tree root/shoot ratio in tropical mountain forests of Ecuador. Basic and Applied Ecology 8, 219-230.
Luyssaert S, Inglima I, Jung M, Richardson AD, Reichstein M, Papale D, Piao SL, Schulze ED, Wingate L, Matteucci G, Aragao L, Aubinet M, Beer C, Bernhofer C, Black KG, Bonal D, Bonnefond FM, Chambers J, Ciais P, Cook B, Davis KJ, Dolman AJ, Gielen B, Goulden M, Grace J, Granier A, Grelle A, Griffis T, Grünwald T, Guidolotti G, Hanson PJ, Harding R, Hollonger DY, Hutyra LR, Kolari P, Kruijt B, Kutsch W, Lagergen F, Laurila T, Law BE, LeMaire G, Lindroth A, Loustau D, Malhi Y, Mateus J, Migliavacca M, Misson L, Montagnani L, Moncrieff J, Moors E, Munger, Nikinmaa E, Ollonger SV, Pita G, Rebmann C, Roupsard O, Saigusa N, Sanz MJ, Seufert G, Sierra C, Smith ML, Tang J, Valentini R, Vesala T, Janssens IA (2007) CO2 balance of boreal, temperate, and tropical forests derived from a global database. Global Change Biology 13, 2509-2537.
Maier TA, Zarnoch SJ, Dougherty PM (1998) Effects of temperature and tissue nitrogen on dormant season stem and branch respiration in a young loblolly pine (Pinus tadea) plantation. Tree Physiology 18, 11-20.
_ C balance of tropical montane forests
100
Malhi Y, Baldocchi DD, Jarvis PG (1999) The carbon balance of tropical, temperate and boreal forests. Plant Cell and Environment 22, 715-740.
Malhi Y, Grace J (2000) Tropical forests and atmospheric carbon dioxide. Tree 15, 332-336.
Maraun M, Illig J, Sandman D, Krashevskaya V, Norton RA, Scheu S (2008) Soil fauna. In: Gradients in a tropical mountain ecosystem of Ecuador. (eds.: Beck E, Bendix J, Kottke I, Makeschin F, Mosandl R). Springer Verlag, Berlin, Germany. Ecological studies 198, in press.
Meir P, Grace J (2002) Scaling relationship for woody tissue respiration in two tropical rain forests. Plant, Cell and Environment 25, 963-973.
Mercado L, Lloyd J, Carswell F, Malhi Y, Meir P, Nobre AD (2006) Modelling Amazonian forest eddy covariance data: a comparison of big leaf versus sun/shade models for the C-14 tower at Manaus. I. Canopy photosynthesis. Acta Amazonica 36, 69-82.
Moser G, Hertel D, Leuschner C (2007) Altitudinal change in LAI and stand leaf biomass in tropical montane forests: a transect study in Ecuador and a pan-tropical meta-analysis. Ecosystems 10, 924-935.
Moser G, Röderstein M, Graefe S, Soethe N, Hertel D, Leuschner C (submitted) Fine and coarse root dynamics of tropical montane forests along an altitudinal transect in southern Ecuador. Plant and Soil.
Moser G (2008) Elevation effects on key processes of carbon cycling in South Ecuadorian mountain forests. PhD Thesis. University of Göttingen, Germany, pp.125.
Penning de Vries FWT (1975) Use of assimilates in higher plants. In: Photosynthesis and productivity in different environments. (ed: Cooper JG). Cambrigde University Press, Cambridge, pp. 459-480.
Ryan MG, Hubbard RM, Clark DA, Sanford RL Jr (1994) Woody-tissue respiration of Simarouba amara and Minquartia guinensis, two wet forest trees with different growth habits. Oecologia 100, 213-220.
Ryan MG, Gower ST, Hubbard RM, Waring RH, Gholz HL, Cropper WP, Running SW, (1995) Woody tissue maintenance respiration of four conifers in contrasting climates. Oecologia 101, 133-140.
Ryan MG, Hubbard RM, Pongracic S, Raison RJ, McMurtie RE (1996) Foliage, fine-root, woody-tissue and stand respiration in Pinus radiata in relation to nitrogen status. Tree Physiology 16, 333-343.
Sprugel DG, Benecke U (1991) Measuring woody-tissue respiration and photosynthesis. In: Techniques and approaches in forest tree ecophysiology (eds. Lassoie JP, Hinckley T) pp. 329-355. CRC-Press Inc, Boston.
Veneklaas EJ, Poorter L (1998) Growth and carbon partitioning of tropical tree seedlings in contrasting light environments. In: Inherent variation in plant growth. Physiological mechanisms and ecological consequences (eds. Lambers H, Poorter H, Van Vuren MMI), Backhuys Publishers, Leiden, pp. 337–355.

Chapter 6
101
SYNTHESIS
6 Chapter

Synthesis
102
6.1 Discussion of hypotheses
In Chapter 1, a number of hypotheses were introduced concerning altitudinal patterns
in the CO2 release from above- and belowground plant organs to be tested in this study. The
present section aims to discuss these hypotheses with respect to the previously described
results and recent findings. The four hypotheses were as follows:
(i) Apparent CO2 release from stems increases with increasing elevation from 1050 m
to 3050 m.
(ii) Apparent CO2 release from coarse roots increases with increasing elevation from
1050 m to 3050 m.
(iii) Apparent CO2 release rates from stems and coarse roots of tropical montane
forests (TMF) at different elevation levels remain constant through the year and do
not show seasonality.
(iv) With increasing elevation, woody tissue respiration shows an increasing relevance
in the carbon balance of TMFs. At high elevations, maintenance respiration from
stems and growth respiration from roots are predominant.
Previous intensive studies on above- and belowground biomass production found that
with increasing elevation an increasing proportion of the available carbon (C) was
translocated below the ground. While the aboveground annual biomass increment decreased
4.2-fold from 1050 to 3050 m, the annual C allocation to the root system increased 4.2-fold
from the premontane (1050 m) to the upper montane forest (3050 m). This enormous shift in
the relative importance of above- to belowground plant organs should have been reflected in
the respiratory activity of the respective plant organs. Mean annual rates of stem respiration
(based on the bark surface area) declined 4.5-fold from 1050 to 3050 m, while coarse root
respiration decreased only by a factor of 2.2. The dissimilar decline in stem and coarse root
respiration with increasing elevation resulted in a very similar level of respiratory activity of
stems and coarse roots at the upper montane site, indicating the higher relative importance of
belowground organs at higher altitudes (Chapter 2). Since absolute root biomass increased
with increasing altitude, the extrapolation of coarse root respiration to the stand finally
yielded a similar amount of C losses from the coarse root biomass at 1050 and 3050 m.
Annual stem wood C losses at the stand-level, in turn, showed the same 4.5-fold decline as
found at tree-level as a result of the parallel decline in the aboveground biomass with
increasing altitude. We therefore reject hypothesis (i) and accept hypothesis (ii).

Chapter 6
103
Hypothesis (i) was initially based on the assumption of a stress-induced compensatory
CO2 release counterbalancing an assimilatory carbon gain which was assumed to be similar to
the CO2 fixation at lower altitudes. In fact, annual C gain declined from 1050 to 3050 m. On
the other hand, this decline was mainly a function of the lower leaf area index (LAI) at high
elevations accompanied by several less favourable abiotic conditions (e.g., low light intensity,
temperature, nutrient availability), whereas the photosynthetic capacity of single leaves did
not change significantly along the elevation transect (Chapter 5). At 3050 m, a proportionally
high C allocation to below the ground despite of a lower C gain compared to the lower-
elevated sites can only be guaranteed at the expense of aboveground growth and hence
aboveground respiration. We found no indication for a generally higher aboveground
respiration at 3050 m as a result of abiotic stress throughout the year. However, the role of
abiotic factors in driving the respiratory CO2 release from tree stems could not be resolved
satisfactorily (Chapter 3) - leading to hypothesis (iii).
Respiration of a certain tissue type is commonly expected to increase strongly with
increasing temperature. This response is more strongly related to variations in tissue
temperature than to changes in ambient air temperature (Chapter 3). In a prevailing humid
climate of TMFs, where seasonality is usually less pronounced and mean monthly air
temperature, and hence tissue temperature fluctuates little throughout the year, we
hypothesized that the respiratory activity of stems and coarse roots remain more or less
constant through the year. Taking advantage of an exceptional dry season period within the 1-
year-measurement cycle we could show clear seasonal patterns in the respiratory CO2 release
of stems, though not of coarse roots, along the elevation gradient (Chapter 4). Highest rates of
stem respiration were found under the drier and warmer conditions of the dry season period at
all three study sites, whereas measurements during the more humid periods yielded much
lower stem CO2 release rates. Root respiration was less responsive as a result of minor
fluctuations in the abiotic conditions (temperature, relative humidity, vapour pressure deficit)
at the buffered environment of the soil surface where coarse roots were measured. Based on
our findings we can prove a climate-sensitivity of stem respiration along the elevation transect
that leads us to reject hypothesis (iii).
On the other hand, higher rates of stem respiration could not be simply related to
temperature alone, rather we proposed that a complex interaction of several climate factors
(light incidence, vapour pressure deficit, wind speed, soil water availability) might play a role
in controlling plant respiratory activity (Chapter 3). Even more challenging is the remaining
uncertainty with respect to the underlying mechanisms driving stem respiration to augment

Synthesis
104
under dry season conditions. Stem cell growth in various tree species of the study area has
been found to cease when soil water availability drops below a certain threshold during the
dry season. In this context, we were not able to conclusively relate higher rates of stem
respiration to higher cambial activity. On the contrary, the possibility exists that the higher
respiratory activity might indeed be stress-induced resulting in an increasing release of CO2
via the less productive alternative pathway of respiration, with plant growth being unaffected.
A decline in net primary production despite higher CO2 efflux under higher temperatures has
been frequently observed for tropical lowland forests during the last decades. Higher rates of
CO2 release without implications for the biomass increment under warmer climate conditions
would have marked consequences for the atmospheric CO2 accumulation over tropical biomes
under the expected global climate change.
Based on hypothesis (i) and (ii), we initially assumed that the shift in the relative
importance of above- and belowground plant components with elevation should be reflected
in the carbon balance of the TMFs and hypothesized that at higher elevations, maintenance
respiration from stems and growth respiration from roots are predominant. We indeed found
the fraction of coarse root growth respiration to increase markedly from 1050 to 3050 m
(Chapter 4). On the other hand, the proportional partitioning between stem growth and stem
maintenance respiration changed only slightly with increasing altitude, resulting in
comparatively low fractions of stem growth respiration at the three sites than values found in
the literature. Considering the entire C balance of the three TMFs, a shift in the relevance of
above- versus belowground plant organs could not be found (Chapter 5). The proportion of C
available for the belowground components (i.e., the proportion of C allocated to the roots as
percentage of total CO2 fixation) did not increase with increasing elevation as it would be
expected in order to maintain a higher below- than aboveground biomass and biomass
production at 3050 m. Our first estimate of above- and belowground C partitioning at the
three TMFs indicated that the belowground production might have been overestimated to a
certain extent, at least at the upper montane site. However, our C balances were not complete
and some estimates of C balance components were based on very simple assumptions. In this
regard, additional and more exact investigations are still needed until hypothesis (iv) can be
conclusively answered, especially with respect to the total assimilatory C gain, the respiratory
CO2 release from twigs and branches or from sunlit and shaded leaves, and the belowground
biomass production.

Chapter 6
105
6.2 Concluding remarks
Measuring the respiratory CO2 release from stems and coarse roots was a convenient
tool to reproduce patterns of above- and belowground C allocation of the three Andean moist
forests. Furthermore, the organ-level CO2 efflux measurements could be used to quantify
whole tree as well as stand-level C losses; though existing up scaling methods still lack
standardization, which hampers comparison of literature data.
The impact of altitude and climatic fluctuations on the respiratory activity of woody
plant organs studied at the level of single trees offered additional insight into the diverse
response patterns of different tree species in a species-rich tropical forest community.
However, the importance of diverging adaptation strategies of species and the affect of
species origin warrant further investigation if we are to better understand species co-existence
in the current and future structure of highly diverse tropical ecosystems. Such information
would be particularly crucial with respect to global warming expecting to force mesic lowland
taxa to migrate upwards in the tropics. In this context, tropical montane forests are of
particular relevance and the portable chamber technique was shown to provide a suitable
framework to assess species-specific patterns of woody tissue CO2 release to changes in
climatic conditions in logistically difficult montane regions.
The highly differing climate-sensitivity found for the measured tree species already
indicated that the present forest structure and functionality of tropical montane forests could
be strongly affected by global climate change. A better understanding of plant respiratory
responses towards warmer conditions is therefore challenging.

Chapter 7
106
SUMMARY
7 Chapter
Summary
107
7.1 Summary
Tropical montane forests (TMF), which account for 21.2% of tropical forests
worldwide, are among the least studied ecosystems with respect to their C balance. TMFs are
mainly characterized by high atmospheric humidity and frequent cloudiness driving the
structure and functionality of these highly diverse ecosystems across a large altitudinal
extension. One of the most marked changes with increasing elevation is the shift in C
allocation from above- to belowground plant organs leading to a considerable decline in
average tree height towards higher altitudes. Information on the key processes controlling the
plant internal C use, the assimilatory C gain and the respiratory CO2 loss from single plant
organs, is missing.
The present study aimed to quantify CO2 losses from above- and belowground woody
organs of representative tree species of a tropical montane moist forest in southern Ecuador.
Moreover, we wanted to extrapolate rates of woody tissue respiration to the stand level and
bring them in the frame of a carbon balance. We used a portable CO2 measurement system to
monitor the respiratory CO2 release from stems (RS) and coarse roots (RR) along a 2000 m-
elevation transect with three study sites at 1050, 1890 and 3050 m a.s.l. In an intensive 1-
year-measurement period we determined the impact of altitude and of seasonal climate
variations on patterns of CO2 release from woody organs. We found substantial variation in
the stem respiratory activity among different species and different tree individuals at all three
study sites. Mean RS declined significantly from the premontane forest (1050 m) to the upper
montane site (3050 m). Mean RR did not change significantly with altitude, though showing a
decreasing tendency. The results corroborated the remarkable shift in the relative importance
of above- to belowground plant organs with increasing altitude as it has already been found
for the biomass allocation patterns along the elevation gradient.
Temperature has long been known to be the most important abiotic driver of plant
respiration. In the field, however, a consistent relationship between temperature and
respiratory CO2 efflux is often not found. Comparing dry and wet season patterns in stem CO2
release we found RS to be largely uncoupled from changes in the dial temperature regime
under humid season conditions. During the dry season, the respiration-temperature
relationship was generally stronger, though temperature sensitivity of RS differed greatly in
degree and even in the direction of response among individual trees. Integrating additional
influencing abiotic factors (vapour pressure deficit, wind speed and solar radiation) could not
enhance the ability to explain the variability of RS. We assumed maintenance respiration to

Chapter 7
108
dominate under humid conditions unfavourable for photosynthetic carbon gain of the tree,
whereas the dry season conditions principally favoured stem respiratory activity, and most
likely energy acquisition. Differences in species distribution centres and hence in the level of
climatic adaptation of co-existing moist forest tree species could provide an alternative tool to
explain diverging temperature responses of RS during the dry season.
Information about seasonal patterns of woody tissue CO2 release from evergreen
tropical montane trees has received little attention. We found RS, but not RR to show a clear
seasonality within the measurement year. Highest rates were measured during the dry season,
though the increase in RS could not be simply related to changes in the temperature regime.
On the other hand, the high degree of climate sensitivity of RS of the studied montane forest
trees could also indicate C losses via the alternative pathway (cyanide-resistant oxidase),
since the higher respiratory activity could not satisfactorily be related to stimulated cell
growth. Along the elevation transect, annual carbon efflux from stems decreased from 167.1 g
C m-2 yr-1 at 1050 m to 37.7 g C m-2 yr-1 at 3050 m, while coarse root carbon release changed
little from 1050 m (40.9 g C m-2 yr-1) to 3050 m (36.8 g C m-2 yr-1). Stem growth respiration
accounted for a comparatively small fraction of total stem respiration at all three sites,
whereas coarse root growth respiration was of increasing importance with increasing altitude.
A first C balance of the three study sites confirmed the expected decline in the total
canopy carbon gain from premontane to upper montane forests. However, with respect to the
altitudinal changes in above- and belowground C allocation patterns, discrepancies between
flux measurements and direct biomass assessments emerged. The enormous C translocation to
the root system at 3050 m as previously found could not be matched by the amount of C
available as derived from C influx and efflux estimates. On the other hand, the C balances
were incomplete and uncertainties still exist with regard to the magnitude of important flux
components such as the canopy C gain and the canopy respiratory C losses (including
branches and twigs).
7.2 Zusammenfassung
Die Bergregenwälder der Tropen bedecken etwa 21.2 % der Fläche tropischer Wälder
weltweit; im Hinblick auf ihre Kohlenstoff-(C)-Bilanz gehören sie dennoch zu den am
wenigsten untersuchten terrestrischen Ökosystemen. Die Struktur und Funktionalität
tropischer Bergregenwälder wird über weite Flächen- und Höhenausdehnungen vorwiegend
geprägt durch vergleichsweise hohe atmosphärische Feuchtigkeit und häufige

Summary
109
Wolkenbedeckung. Eine der markantesten Veränderungen mit zunehmender Meereshöhe
stellt die vermehrte Verlagerung von Kohlenstoff von oberirdischen zu unterirdischen
Pflanzenorganen dar, welche in eine beachtliche Abnahme der durchschnittlichen Baumhöhe
mit zunehmender Meereshöhe resultiert. Informationen über die Schlüsselprozesse der
internen C-Nutzung der Pflanze, der assimilatorische C-Gewinn und der respiratorische C-
Verlust einzelner Pflanzenorgane fehlen weitestgehend.
Die vorliegende Arbeit hat zum Ziel, die respiratorischen Kohlenstoffdioxid-(CO2)-
Verluste verholzter ober- und unterirdischer Pflanzenorgane repräsentativer Baumarten in
einem tropischen Bergregenwald im Süden Ecuadors zu quantifizieren. Weiterhin sollten C-
Abgaberaten verholzter Organe auf Bestandesebene hochgerechnet werden und in eine C-
Bilanz eingebunden werden. Mit Hilfe einer tragbaren CO2-Messapparatur wurde entlang
eines 2000-m-Höhentransektes an drei Untersuchungsflächen auf 1050, 1890 und 3050 m
üNN die respiratorische CO2-Abgabe von Stämmen und Grobwurzeln gemessen. In einer
intensiven 1-Jahres-Messkampagne wurde der Einfluss der Meereshöhe und der saisonalen
Klimaunterschiede auf die respiratorische Aktivität der verholzten Organe untersucht. An
allen drei Untersuchungsflächen wurde eine beträchtliche Variabilität in der Stammatmung
zwischen den verschiedenen Baumarten und zwischen einzelnen Individuen gefunden. Die
mittlere Stammatmung nahm mit zunehmender Höhe vom prämontanen (1050 m) zum
hochmontanen (3050 m) Standort signifikant ab. Die mittlere Grobwurzelatmung verringerte
sich mit zunehmender Meereshöhe zwar tendenziell, diese Veränderung war jedoch nicht
signifikant. Somit bestätigen die vorliegenden Ergebnisse eine Verschiebung der relativen
Wichtigkeit von oberirdischen zu unterirdischen Pflanzenorganen mit der Meereshöhe, wie
sie bereits in vorangegangenen Studien zur Verlagerung der Biomasse mit zunehmender
Meershöhe gefunden wurde.
Es ist seit langem bekannt, dass die Respiration der Pflanze vor allem durch die
Temperatur als grössten abiotischen Einflussfaktor bestimmt wird. Jedoch konnte gerade im
Feldversuch häufig keine konsistente Beziehung zwischen Temperatur und Atmung bestätigt
werden. In einer vergleichenden Studie der Stammatmung unter Regen- und
Trockenzeitbedingungen auf den Untersuchungsflächen wurde während der Regenzeit eine
weitestgehende Entkopplung der Atmung von Veränderungen im täglichen Temperaturverlauf
festgestellt. Unter Trockenzeitbedingungen war der Temperaturbezug der Atmung generell
stärker ausgeprägt, jedoch fanden sich grosse Unterschiede in der Temperatursensitivität der
einzelnen Baumindividuen im Hinblick auf Ausprägung und Richtung der Temperatur-
antwort. Auch unter Einbezug weiterer einflussnehmender abiotischer Faktoren

Chapter 7
110
(Sättigungsdefizit der Luft, Wind, Strahlung) konnte die Variabilität der Stammatmung nicht
erklärt werden. Es wurde daher schlussfolgernd angenommen, dass unter den
strahlungsextensiven und damit assimilationshemmenden Witterungsverhältnissen der
Regenzeit die Erhaltungsatmung dominiert. Dahingegen scheint unter strahlungsgünstigen,
und daher assimilationsfördernden Witterungsbedingungen der Trockenzeit die
respiratorische Aktivität angeregt zu werden. Weiterhin könnten Unterschiede im
Verbreitungsschwerpunkt einzelner Arten und daraus folgende Unterschiede in
Adaptionsmechanismen einen alternativen Erklärungsansatz für die grosse Variabilität in der
Temperaturantwort der Atmung co-existierender Baumarten unter extremen
Trockenzeitbedingungen bieten.
Saisonale Unterschiede in der CO2-Abgabe von verholztem Gewebe tropischer
immergrüner Baumarten wurde bislang wenig untersucht. Im Verlauf der einjährigen
Messkampagne wurde eine stark ausgeprägte Saisonalität der Stammatmung, jedoch nicht der
Wurzelatmung gefunden. Die höchsten Stamm CO2-Abgaberaten wurden während der
Trockenzeit gemessen, jedoch konnten die erhöhten Atmungsraten nicht ausschliesslich auf
die höhere Umgebungstemperatur zum Messzeitpunkt zurückgeführt werden. Vielmehr
könnte die erhöhte Atmungsaktivität auch einen Hinweis auf C-Verluste über die alternative
Oxidase (cyanidresistente Oxidase) liefern, da die erhöhte Respiration nicht überzeugend mit
stimuliertem Zellwachstum in Verbindung gebracht werden konnte. Entlang des
Höhentransektes nahm die jährliche C-Abgabe der Stämme von 167.1 g C m-2 yr-1 auf 1050
m zu 37.7 g C m-2 yr-1 auf 3050 m ab, wohingegen sich die jährliche C-Abgabe der
Grobwurzeln im Höhenverlauf von 1050 m (40.9 g C m-2 yr-1) auf 3050 m (36.8 g C m-2 yr-1)
wenig änderte. Die Wachstumsatmung der Stämme nahm nur einen vergleichsweise geringen
Anteil der Gesamtatmung ein, wohingegen die Wachstumsatmung der Grobwurzeln mit
zunehmender Meereshöhe an Wichtigkeit gewann.
Eine erste Gesamt-C-Bilanz der drei Bergregenwald-Standorte bestätigte die erwartete
Abnahme des assimilatorischen C-Gewinns von der prämontanen zur hochmomtanen
Untersuchungsfläche. Im Hinblick auf die Veränderungen in der ober- und unterirdischen C-
Verlagerung mit zunehmender Meereshöhe zeigten sich jedoch Diskrepanzen zwischen der
direkten Bestimmung der Biomasse und der indirekten Berechnung über gemessene C-Flüsse.
Die enorme C-Verlagerung zum Wurzelsystem, wie sie in vorausgegangen Studien ermittelt
wurde, konnte quantitativ nicht durch die ein- und ausgehenden C-Flüsse bestätigt werden.
Jedoch ist zu beachten, dass die aufgestellten C-Bilanzen nicht vollständig sind und dass
weiterhin grosse Unsicherheiten bestehen im Hinblick auf die Quantität der C-Flüsse

Summary
111
wichtiger Komponenten wie etwa der C-Gewinn und –Verlust des Kronendaches (inklusive
der Äste und Zweige).
7.3 Resumen
Los bosques tropicales montanos (TMF), cubren el 21.2% de los bosques tropicales a
nivel mundial, sin embargo son uno de los ecosistemas menos investigados especialmente con
respecto a su balance de carbono. TMFs se caracterizan primeramente por la alta humedad
atmosférica y la frequente nubosidad costituyendo los factores que determinan la estructura y
funcionamiento de este ecosistema de diversidad complexa y amplia distribución altitudinal.
Uno de los cambios más remarcables con el aumento de altitud es la redistribución de C entre
los órganos aéreos y subterráneos, conduciendo a una reduccción considerable en la estatura
de los árboles que crecen a mayores elevaciones. En general, existe muy poca información
sobre los procesos clave en las plantas que controlan la asimilación de C y su emisión a través
de la actividad respiratoria de diferentes órganos. El presente estudio tuvó como objetivo la
cuantificación de las pérdidas de CO2 a través de los troncos (RS) y de las raíces gruesas (RR)
de especies de árboles representativas del bosque tropical montano húmedo del sur de
Ecuador. Para las medidas de CO2 usamos un sistema portátil de intercambio de gases y
monitoreamos las emisiones de CO2 de troncos y raíces gruesas a lo largo de un transecto de
2000 m-de elevación y en tres localidades ubicadas a 1050, 1890 y 3050 m s.n.m. Durante el
periodo de un año, llevamos a cabo medidas intensivas para determinar el impacto del cambio
altitudinal y variación climática estacional en los patrones de emisión de CO2 de diferentes
órganos leñosos.
En cada una de las tres localidades estudiadas encontramos considerable variación en
la actividad respiratoria de troncos entre las diferentes especies e individuos seleccionados. La
tasa promedio de emisión de CO2 de los troncos (RS) disminuyó significativamente del bosque
premontano (1050 m) al bosque montano alto (3050 m). La tasa promedio de emisión de CO2
de las raíces gruesas (RR) no mostro variación altitudinal significativa, sin embargo se pudo
observar una tendencia decreciente. Los resultados de este estudio corroboran el cambio
remarcable en la importancia relativa de los órganos aéreos con respecto a los órganos
subterráneos de árboles del bosque tropical montano con el aumento altitudinal. Tal cambio
ha sido reportado previamente mediante observaciones sobre los patrones de distribución de
biomasa a lo largo del mismo gradiente altitudinal.

Chapter 7
112
La temperatura ha sido siempre identificada como el factor abiotico más importante
responsable por la variación en las tasas de respiración. Sin embargo, en el campo, no siempre
es possible encontrar una relación consistente entre la temperatura y las tasas de emisión de
CO2. Mediante la comparación de los patrones de emisión de CO2 de los troncos durante las
estaciones húmeda y seca, observamos que RS no respondió a los cambios del regimén diario
de temperatura bajo las condiciones de la estación húmeda. Durante la estación seca, la
relación repiración-temperatura fue más fuerte, aunque la sensibilidad de RS fué altamente
variable en magnitud e incluso en la dirección de la respuesta. Aún con la adición de
información sobre la variación de otros factores abióticos, (deficit de presión de vapor de
agua, dirección del viento y radiación solar), no se logro obtener una mejor estimación para
los valores de RS. Bajo condiciones húmedas, poco favorables para la actividad fotosintética
de asimilacion de carbono, se puede asumir que la respiración de mantenimiento domina la
tasa total de emisión de CO2. Mientras que condiciones secas con alta radiación y temperatura
favorecen la actividad respiratoria y adquisición de energía. Diferencias en los centros de
distribución y consecuentemente en la adaptación climática de especies arbóreas podrían
proporcionar una herramienta alternativa para explicar la divergencia en la respuesta de RS a
las variaciones en temperatura durante la época seca.
En las investigaciones de especies arbóreas del bosque tropical montano, se ha dado
poca atención al estudio de los patrones estacionales de emisión de CO2 de la biomasa leñosa.
En este estudio y durante el periodo de un año de observacion se pudo identificar una clara
variabilidad estacional en RS, pero no en RR. Las tasas más altas de emisión de CO2 fueron
registradas durante la época seca, aunque el aumento en RS no pudo ser relacionado
únicamente a cambios en temperatura. Por otro lado, el alto grado de sensibilidad climática de
RS de los árboles del bosque montano estudiado podrían indicar pérdida de C por medio de
ciclos vanos, ya que la tasa más alta de actividad respiratoria no pudo ser relacionada
satisfactoriamente con una estimulación del crecimiento a nivel celular. A lo largo del
transecto altitudinal, la emisión anual de carbono de los troncos disminuyó de167.1 g C m-2 a-
1 a 1050 m a 37.7 g C m-2 a-1 a 3050 m, mientras que la emisión anual de las raíces gruesas se
mantuvo constante entre 1050 m (40.9 g C m-2 a-1) y 3050 m (36.8 g C m-2 a-1). La respiración
de crecimiento de los troncos constituyó una fraccion mínima de la tasa total de emisión de
los troncos en las tres elevaciones. A nivel de raíces gruesas, la fracción correspondiente a la
respiración de crecimiento mostró un incremento con la altitud.
Un primer balance de C de los tres sitios confirmó una disminución en la tasa neta de
asimilación de carbono del bosque premontano al bosque montano alto. Sin embargo, con

Summary
113
respecto a los cambios altitudinales en los patrones de distribución de C entre la biomasa
aérea y subterránea, diferentes discrepancias emergieron entre las estimaciones de flujo de C
basadas en medidas de asimilación de CO2 y las estimaciones basadas en medidas de
biomasa. La asignación de grandes cantidades de carbono al sistema radicular a 3050 m
observada en previas investigaciones, no pudo ser explicada por la cantidad de C disponible
de acuerdo a nuestras estimaciones del balance entre el flujo de C. Por otro lado, se debe tener
en cuenta que nuestro balance de C no esta completo ya que todavía se tienen muchas
incertidumbres sobre la magnitud e importancia de componentes importantes del flujo de C,
como es el caso de la asimilación y pérdida de C en el dosel (incluyendo ramas gruesas y
finas).

Chapter 8
114
APPENDIX
8 Chapter

Appendix
115
Appendix 1. Species list of the measured tree stems at 1050, 1890 and 3050 m a.s.l. Some trees could not be determined to species level (indet). Given are DBH (cm) at the beginning (August 2005) and end (September 2006) of the measurement campaigns, tree height (tree, m; G. Moser) and clear bole length (bole, m; own measurements). Abbr. Species Family DBH DBH tree bole
2005 2006 1050m An1 indet Annonaceae 10.05 10.47 9.90 5.8An2 indet Annonaceae 21.37 21.53 14.50 9.2Sc1 Schefflera sp. Araliaceae 27.67 27.74 18.80 9.6Pou Pourouma cf. Cecropiaceae 14.32 14.65 13.40 9.9Al Alchornea sp. Euphorbiaceae 8.75 9.3 13.30 5.7La1 indet Lauraceae 13.66 13.67 12.30 9.9La2 indet Lauraceae 17.07 17.07 11.90 10.7Mp1 Miconia punctata Melastomataceae 9.8 - 14.04 -Mp2 Miconia punctata Melastomataceae 11.93 12.03 10.51 10.5Mp3 indet Melastomataceae 15.35 15.53 11.80 5.2In Inga sp. Mimosaceae 16.34 16.41 17.80 10.5Mi indet Mimosaceae 10.08 10.1 18.10 13.3Fi1 Ficus sp. Moraceae 14.16 - 16.20 5Fi2 Ficus sp. Moraceae 14.64 14.64 14.20 9.9Fi3 Ficus sp. Moraceae 16.03 16.43 14.20 13.1Fi4 Ficus sp. Moraceae 43.85 43.99 29.90 11.85Vi Virola cf. Myristicaceae 14.17 14.17 15.00 12Myt indet Myrtaceae 10.96 11.1 11.20 8.95Ch Chrysophyllum sp. Sapotaceae 8.84 9.08 11.20 7.6Po1 Pouteria cf. Sapotaceae 20.79 20.78 16.80 11.1Po2 Pouteria cf. Sapotaceae 43.72 43.72 26.60 15 1890 m Ia Ilex amboroica Aquifoliaceae 9.63 9.64 7.50 5.65Sc2 Schefflera sp. Araliaceae 9.16 - 14.55 6.70Cr Clethra revoluta Clethraceae 23.45 23.65 12.69 4.98Hm Hyeronima moritziana Euphorbiaceae 9.52 9.53 13.70 8.24Eo Endlicheria oreocola Lauraceae 20.8 20.82 10.00 6.17Ne Nectandra sp. Lauraceae 11.64 11.71 12.45 1.60Oa Ocotea aciphylla Lauraceae 10.21 10.26 10.50 6.43Ge1 Graffenrieda emarginata Melastomataceae 24.91 25 17.40 10.54Ge2 Graffenrieda emarginata Melastomataceae 26.11 26.1 16.54 8.72Ge3 Graffenrieda emarginata Melastomataceae 26.47 26.5 19.82 8.18Mp4 Miconia punctata Melastomataceae 10.62 10.64 14.05 6.28Mp5 Miconia punctata Melastomataceae 12 12 7.06 12.14Mp6 Miconia punctata Melastomataceae 14.45 14.56 12.53 8.84Mc Myrsine coriacea Myrsinaceae 3.76 3.82 7.10 4.38Lo Ladenbergia oblongifolia Rubiaceae - 12.14 9.70 4.10Pa Palicourea sp. Rubiaceae 3.02 - 3.70 2.14Mi1 Matayba inelegans Sapindaceae 4.46 4.5 5.60 3.92Mi2 Matayba inelegans Sapindaceae 8.17 8.25 8.30 4.20Mi3 Matayba inelegans Sapindaceae 10.53 10.67 12.70 6.50Mg Micropholis guyanensis Sapotaceae 8.35 8.46 7.80 4.60

Chapter 8
116
Abbr. Species Family DBH DBH tree bole 2005 2006
3050 m Iw Ilex weberlingii Aquifoliaceae 8.2 8.2 5.72 4.49He Hedyosmum sp. Chloranthaceae 9.36 9.36 4.19 1.81Cl1 Clusia sp.1 Clusiaceae 17.67 17.67 5.80 1.50Cl2 Clusia sp.2 Clusiaceae 8.94 9.01 6.79 1.63Wl Weinmannia loxensis Cunoniaceae 10.5 10.5 6.13 3.34Ce Cerotostema cf. Ericaceae 3.6 3.61 3.74 1.93Er indet Ericaceae 15.6 15.6 6.22 1.64Ax Axinea sp. Melastomataceae 8.99 8.99 4.80 2.60Ma Myrsine andina Myrsinaceae 9.55 9.55 7.74 1.27Mys indet Myrsinaceae 3.92 3.92 4.80 2.87Mo Monnina sp. Polygalaceae 2.48 2.58 3.51 2.32Sf Styrax foveolaria Styracaceae 12.06 12.08 3.43 1.71Sy Symplocos sp. Symplocaceae 9.8 9.81 6.68 3.30

Appendix
117
Appendix 2. The mobile 6-chamber respiration system ANARESY 2 (Walz, Effeltrich, Germany) with measurement equipment at one of the study sites (1050 m) (top left); tree stem respiration chamber with bark surface temperature sensor on the left hand side of the chamber at the study site at 1890 m (top right); coarse root respiration chamber with bark surface temperature sensor (mid left) and a coarse root tissue temperature sensor (bottom left). The author and a portable infrared gas analyzer (Li-6400, Li-Cor, Inc.) at 1050 m (bottom right).

Chapter 8
118
App
endi
x 3a
. D
iurn
al c
ours
es o
f st
em C
O2
rele
ase
(RS)
and
the
rel
atio
nshi
p be
twee
n te
mpe
ratu
re a
nd c
arbo
n re
leas
e fr
om 3
sel
ecte
d tre
ein
divi
dual
s du
ring
the
dry
seas
on c
ampa
ign
(D1,
left
pane
l) an
d du
ring
a m
ore
hum
id c
ampa
ign
(H3,
righ
t pan
el) a
t 105
0 m
. Err
or b
ars
repr
esen
t 1st
anda
rd d
evia
tion.
Spe
cies
abb
revi
atio
n is
giv
en in
App
endi
x 1.
Not
e di
ffer
ent s
cale
s of t
he y
-axi
s for
the
thre
e tre
e in
divi
dual
s.

Appendix
119
App
endi
x 3b
. D
iurn
al c
ours
es o
f st
em C
O2
rele
ase
(RS)
and
the
rel
atio
nshi
p be
twee
n te
mpe
ratu
re a
nd c
arbo
n re
leas
e fr
om 3
sel
ecte
d tre
ein
divi
dual
s du
ring
the
dry
seas
on c
ampa
ign
(D1,
left
pane
l) an
d du
ring
a m
ore
hum
id c
ampa
ign
(H3,
righ
t pan
el) a
t 189
0 m
. Err
or b
ars
repr
esen
t 1st
anda
rd d
evia
tion.
Spe
cies
abb
revi
atio
n is
giv
en in
App
endi
x 1.
Not
e di
ffer
ent s
cale
s of t
he y
-axi
s for
the
thre
e tre
e in
divi
dual
s.

Chapter 8
120
App
endi
x 3c
. D
iurn
al c
ours
es o
f st
em C
O2
rele
ase
(RS)
and
the
rel
atio
nshi
p be
twee
n te
mpe
ratu
re a
nd c
arbo
n re
leas
e fr
om 3
sel
ecte
d tre
ein
divi
dual
s du
ring
the
dry
seas
on c
ampa
ign
(D1,
left
pane
l) an
d du
ring
a m
ore
hum
id c
ampa
ign
(H3,
righ
t pan
el) a
t 305
0 m
. Err
or b
ars
repr
esen
t 1st
anda
rd d
evia
tion.
Spe
cies
abb
revi
atio
n is
giv
en in
App
endi
x 1.
Not
e di
ffer
ent s
cale
s of t
he y
-axi
s for
the
thre
e tre
e in
divi
dual
s.

Appendix
121
Appendix 4. Contents of carbon and nitrogen and mineral concentrations (mg g-1) of wood cores from the measured tree stems of the three sites at 1050, 1890 and 3050 m elevation. See Appendix 1 for species abbreviation. Coarse roots are described by their diameter (d, cm).
C N Ca K Na Mg P Stems 1050 m An1 88.08 0.42 0.81 3.79 0.06 0.30 0.18An2 91.28 0.50 0.64 3.13 -0.04 0.31 -0.27Sc1 97.53 0.60 1.18 2.63 0.00 0.29 -0.09Pou 89.21 0.40 1.33 1.96 0.00 0.70 -0.09Al 77.49 0.37 1.44 2.22 -0.02 0.70 -0.18La1 88.91 0.54 0.79 0.71 -0.05 0.07 -0.26La2 87.82 0.59 2.54 1.65 -0.04 0.14 0.00Mp1 Mp2 88.61 0.54 0.97 3.37 -0.04 0.65 -0.44Mp3 79.48 0.49 2.33 2.45 -0.02 0.18 -0.27In 89.39 0.67 1.24 2.89 -0.05 0.02 -0.44Mi 94.33 0.65 2.26 4.04 -0.02 0.19 -0.26Fi1 85.96 0.35 2.12 9.16 0.01 0.63 0.35Fi2 83.50 0.43 1.97 2.74 0.05 0.28 -0.09Fi3 88.69 0.38 5.09 6.64 -0.03 3.39 -0.18Fi4 94.83 1.14 1.60 1.30 -0.02 0.17 -0.09Vi 89.15 0.64 1.77 1.74 0.00 0.23 -0.35Myt 83.47 0.33 2.09 2.23 0.05 0.76 -0.27Ch 90.50 0.58 0.72 3.16 -0.05 0.27 -0.35Po1 89.49 0.69 0.44 1.43 -0.03 0.14 -0.09Po2 104.14 0.82 0.44 1.04 0.01 0.20 0.09
1890 m Ia 89.96 0.26 0.52 1.92 0.02 0.60 0.09Sc2 91.09 0.30 0.99 3.68 0.03 0.57 0.35Cr 82.69 0.21 0.69 1.69 0.03 0.33 0.26Hm 82.96 0.26 0.25 0.98 -0.03 0.11 0.27Eo 91.76 0.72 0.38 1.73 -0.02 0.15 0.35Ne 91.05 0.47 0.25 1.34 -0.03 0.15 0.26Oa 89.68 0.41 0.00 0.86 -0.04 0.07 0.35Ge1 93.89 0.27 0.31 1.49 0.00 0.21 0.26Ge2 81.86 0.29 0.04 1.30 0.17 0.17 0.18Ge3 80.82 0.23 0.34 1.20 0.00 0.14 0.00Mp4 91.07 0.44 0.46 3.30 0.00 0.39 0.00Mp5 91.67 0.45 0.30 1.52 0.00 0.27 0.44Mp6 91.68 0.45 0.26 2.27 0.04 0.26 0.18Mc 82.07 0.28 0.46 1.93 0.00 0.17 0.44Lo 94.88 0.35 0.22 2.09 -0.02 0.15 0.35Pa 91.61 0.60 1.49 5.81 0.01 1.32 0.35Mi1 77.70 0.43 0.14 2.96 0.00 0.32 0.35Mi2 89.77 0.55 1.92 1.48 -0.01 0.57 0.35Mi3 86.68 0.36 0.38 1.38 0.01 0.28 0.27Mg 83.25 0.46 0.50 0.85 0.01 0.17 0.53

Chapter 8
122
C N Ca K Na Mg P 3050 m Iw 93.02 0.27 0.72 1.93 0.04 0.94 0.26He 84.64 0.23 0.35 1.62 0.00 0.28 0.26Cl1 80.22 0.17 0.79 1.72 0.06 0.70 0.26Cl2 79.57 0.15 0.65 1.30 0.01 0.16 0.26Wl 86.97 0.18 1.04 2.67 0.52 0.72 0.27Ce 92.22 0.22 0.69 1.61 -0.06 0.33 0.09Er 84.30 0.16 1.39 2.70 0.01 0.42 0.18Ax Ma 92.05 0.20 0.26 1.54 0.00 0.14 0.18Mys 90.91 0.20 0.59 1.61 0.05 0.27 0.26Mo 76.55 0.25 0.31 2.44 0.02 0.18 0.18Sf 88.94 0.19 0.55 1.25 0.01 0.20 0.26Sy 86.02 0.31 0.65 1.93 0.02 0.27 0.09Roots d 1050 m 1.1 110.3 2.68 7.42 2.16 0.04 0.22 0.531.4 122.2 3.71 4.20 3.73 0.08 0.33 0.531.7 151.1 2.32 1.06 1.23 0.00 0.50 0.442.0 152.4 2.17 1.36 3.86 -0.01 0.37 0.442.5 128.0 1.57 11.90 -0.56 0.12 1.50 0.262.6 132.3 1.62 9.48 6.48 -0.03 0.49 0.533.0 103.4 1.38 8.50 4.09 0.13 0.77 0.533.7 136.9 3.26 4.48 1.33 0.00 0.60 0.711890 m 1.3 143.1 3.01 0.72 1.86 0.00 0.33 0.531.5 113.9 1.22 1.66 2.59 -0.04 0.58 0.621.6 113.6 0.85 0.53 1.85 -0.05 0.42 0.702.0 122.7 1.23 0.78 6.34 -0.03 0.66 0.442.2 139.7 1.61 0.58 2.02 0.00 0.27 0.532.9 134.7 1.45 3.82 3.55 -0.02 0.77 0.443.0 122.4 1.54 0.66 2.59 -0.03 0.31 0.533050 m 1.5 114.1 0.97 1.77 4.04 0.02 2.79 0.441.8 125.4 1.07 6.01 5.49 0.00 1.02 0.532.3 106.9 0.62 1.68 3.99 -0.02 1.04 0.442.9 130.4 0.80 0.30 0.74 0.00 0.15 0.18

Appendix
123
Appendix 5. Rates of CO2 release (µmol CO2 m-2 s-1) of the measured tree individuals and coarse roots (SD in parenthesis). Given are mean diurnal rates of CO2 efflux from each measurement campaigns (H1, D1, H2 and H3). At 1890 m one measurement campaign was done twice, during the first unusual dry part of April 2006 (H2dry) and when more typical rainy weather started two weeks later (H2wet). See Appendix 1 for species abbreviation. Coarse roots are described by their diameter (d, cm). H1 D1 H2
(H2dry)H2wet
H3
Stems 1050 m An1 1.02 (0.18) 2.40 (0.47) 0.63 (0.12) 0.25 (0.07)An2 1.82 (0.13) 0.78 (0.05) 0.69 (0.07)Sc1 0.79 (0.14) 2.18 (0.37) 0.93 (0.12) 0.80 (0.10)Pou 0.63 (0.28) 0.22 (0.10) 0.29 (0.08) 0.37 (0.04)Al 0.41 (0.10) 0.75 (0.13) 0.41 (0.10)La1 0.27 (0.26) 1.71 (0.33) 0.38 (0.08) 0.28 (0.08)La2 1.38 (0.25) 0.29 (0.07) 0.19 (0.05)Mp1 0.90 (0.19) 0.41 (0.14) Mp2 1.65 (0.17) 0.80 (0.06) 0.68 (0.15)Mp3 1.39 (0.13) 0.84 (0.29) 0.49 (0.08) 0.73 (0.13)In 1.06 (0.19) 0.34 (0.15) 0.68 (0.13) 0.88 (0.09)Mi 1.19 (0.21) 1.32 (0.18) 0.44 (0.09) 0.58 (0.07)Fi1 0.44 (0.17) 2.32 (0.51) Fi2 0.79 (0.17) 0.49 (0.15) 0.20 (0.06) 0.08 (0.10)Fi3 0.66 (0.09) 0.54 (0.12) 1.14 (0.08) 1.33 (0.14)Fi4 1.71 (0.25) 2.71 (0.30) 0.51 (0.09) 0.37 (0.11)Vi 0.78 (0.18) 0.21 (0.08) 0.20 (0.09)Myt 1.34 (0.14) 1.00 (0.15) 0.90 (0.06) 1.00 (0.12)Ch 1.40 (0.15) 1.70 (0.20) 0.31 (0.06) 0.53 (0.07)Po1 1.17 (0.15) 3.20 (0.38) 0.40 (0.09) 0.67 (0.10)Po2 0.77 (0.22) 1.60 (0.29) 0.25 (0.08) 0.30 (0.08)
1890 m
Ia 0.12 (0.20) 0.18 (0.11) 0.40 (0.09) 0.29 (0.06)Sc2 -0.005 (0.11) 0.11 (0.06) 0.17 (0.17) Cr 0.93 (0.15) 0.99 (0.10) 0.65 (0.08) 0.42 (0.10) 0.48 (0.11)Hm 0.35 (0.10) 0.39 (0.13) 0.38 (0.21) 0.24 (0.08) 0.11 (0.06)Eo 0.11 (0.08) 0.87 (0.24) 0.44 (0.16) 0.15 (0.07) 0.15 (0.08)Ne 2.12 (0.33) 1.70 (0.19) 0.32 (0.09) 1.05 (0.11)Oa 0.53 (0.11) 1.13 (0.27) 1.68 (0.18) 0.37 (0.07) 0.19 (0.09)Ge1 0.73 (0.13) 0.55 (0.14) 0.51 (0.12) 0.03 (0.07) 0.03 (0.05)Ge2 0.74 (0.24) 0.61 (0.18) 1.21 (0.14) 0.05 (0.13) 0.19 (0.22)Ge3 0.22 (0.09) 0.96 (0.08) 0.31 (0.09) 0.14 (0.08) 0.04 (0.03)Mp4 0.79 (0.33) 1.34 (0.26) 1.05 (0.10) 0.52 (0.07) 0.14 (0.04)Mp5 0.58 (0.11) 1.02 (0.11) 0.66 (0.11) 0.38 (0.06)Mp6 0.17 (0.10) 0.91 (0.13) 0.97 (0.13) 0.31 (0.07) 0.23 (0.03)Mc 0.02 (0.05) 0.09 (0.07) 0.00 (0.04) 0.06 (0.05) 0.06 (0.03)Lo 0.28 (0.09) 0.60 (0.12) 0.19 (0.08) 0.64 (0.09)Pa 0.03 (0.07) 0.18 (0.06) 0.17 (0.05) 0.17 (0.07) Mi1 0.18 (0.06) 1.02 (0.21) 0.59 (0.11) 0.51 (0.12)Mi2 2.13 (0.22) 0.85 (0.22) 1.24 (0.17) 0.40 (0.11) 0.91 (0.13)Mi3 1.19 (0.20) 1.04 (0.34) 1.78 (0.42) 0.64 (0.18) 0.53 (0.07)Mg 0.42 (0.11) 1.06 (0.11) 0.37 (0.11) 0.29 (0.19) 0.18 (0.06)

Chapter 8
124
H1 D1 H2 (H2dry)
H2wet
H3
3050 m Iw 0.22 (0.06) 0.04 (0.03) 0.12 0.02He 0.22 (0.05) 0.90 (0.08) 0.09 0.02Cl1 0.23 (0.05) 0.02 (0.02) 0.51 0.02Cl2 0.03 (0.04) -0.04 (0.03) 0.24 0.04Wl 0.30 (0.05) 0.14 0.02Ce 0.19 (0.06) 0.20 0.03Er 0.11 (0.05) 0.05 (0.05) 0.02 0.01Ax 0.39 (0.06) 0.26 (0.03) 0.28 0.04Ma 0.11 (0.03) 0.07 (0.03) 0.02 0.01Mys 0.09 (0.01) 0.09 (0.04) Mo 0.19 (0.10) 0.27 (0.04) 0.05 0.02Sf 0.42 (0.05) 0.27 (0.02) 0.07 0.03Sy 0.28 (0.04) 0.29 (0.10) 0.18 0.03Roots d 1050 m 1.1 0.45 (0.24) 0.37 (0.15) 0.40 (0.18) 0.37 (0.17)1.4 0.07 (0.32) 0.76 (0.14) 0.23 (0.15) 0.30 (0.15)1.7 0.17 (0.15) 0.22 (0.12) 0.10 (0.09) 0.35 (0.09)2.0 0.31 (0.15) 0.38 (0.19) 0.35 (0.09) 0.43 (0.13)2.5 0.73 (0.19) 0.09 (0.10) 2.6 0.48 (0.13) 0.47 (0.09) 0.43 (0.14) 0.39 (0.07)3.0 0.31 (0.10) 0.21 (0.06) 3.7 0.34 (0.10) 0.14 (0.05) 0.82 (0.22) 1890 m 1.3 0.15 (0.13) 0.12 (0.16) 0.08 (0.14) 0.05 (0.13)1.5 0.50 (0.16) 0.24 (0.12) 0.46 (0.12)1.6 0.07 (0.15) 2.0 0.14 (0.04) 0.08 (0.07) 0.15 (0.10) 0.12 (0.05)2.1 0.52 (0.07) 0.15 (0.07) 0.33 (0.15) 2.9 0.23 (0.08) 0.15 (0.04) 0.18 (0.08) 0.18 (0.06)3.0 0.34 (0.06) 0.78 (0.07) 0.59 (0.12) 0.42 (0.06) 3050 m 1.5 0.11 (0.05) 0.33 (0.07) 0.17 (0.04)1.8 0.36 (0.11) 0.02 (0.02)2.3 0.28 (0.06) 0.20 (0.04) 0.28 (0.03)2.9 0.06 (0.05) 0.01 (0.04) -0.02 (0.01)

Appendix
125
Appendix 6. Diurnal courses of coarse root CO2 release (RR) from four selected root individuals measured during the dry season (D1) and during one of the more humid campaigns (H3) at the three study site at 1050, 1890 and 3050 m. Error bars represent 1SD. d = diameter.

Chapter 8
126
Appendix 7. Mean photosynthetic capacity (Amax, µmol CO2 m-2 leaf s-1), leaf nitrogen content (mg g-1) and C/N ratio of measured leaves nearby the study sites at 1050, 1890 m and within the site at 3050 m elevation (SD in parenthesis). n= number of leaves measured
Species Family n Amax N C/N 1050 m indet indet (Leguminoseae) 3 5.09 (0.73) 8.82 (1.24) 15.47 Lectandra cf Lauraceae 5 6.31 (0.73) 9.18 (0.79) 15.78 Miconia sp Melastomataceae 4 8.31 (2.49) 4.37 (0.36) 30.16 Psammisa cf Ericaceae 4 3.73 (1.37) 2.57 (0.50) 53.52 Hedyosmum sp Chlorantaceae 4 8.86 (2.35) 4.66 (0.34) 27.89 indet Myrtaceae 4 6.58 (1.78) 4.45 (0.19) 29.78 Vismia sp Clusiaceae 4 7.83 (1.08) 3.56 (0.58) 43.11 2000 m Cavendishia zamorensis Ericaceae 3 8.47 (1.10) 3.43 (0.03) 46.24 Myrica pubescens Myricaceae 3 6.43 (2.61) 5.01 (0.61) 26.37 indet Asteraceae 3 4.28 (0.76) 4.66 (0.24) 29.42 3050 m Miconia Melastomataceae 4 5.98 (0.85) 4.15 (0.13) 28.99 indet Chlorantaceae 3 3.84 (1.43) 4.45 (0.52) 27.36 indet Cunnoniaceae 1 1.76 3.26 38.01 Faramea Rubiaceae 2 6.10 (0.24) 5.45 (0.43) 21.67 indet indet 4 3.40 (1.81) 6.27 (2.65) 26.36 Clusia sp1 Clusiaceae 3 4.36 (1.84) 3.19 (0.34) 44.71 Axinea Melastomataceae 4 5.45 (2.02) 3.77 (0.46) 37.87 indet Melastomataceae 1 5.97 2.84 53.62 Cerotostema cf Ericaceae 2 3.92 (1.82) 2.58 (0.06) 57.15 Styrax foveolaria Stryracaceae 3 8.69 (2.70) 2.82 (0.38) 55.74 Cybianthus maginatus Myrsinaceae 1 4.21 4.02 31.46

Appendix
127
Appendix 8. Light response curve of photosynthesis (A, µmol CO2 m-2 leaf s-1) at 3050 m. Given are mean values of light curves of 35 measured leaves (10 species). Error bars represent 1SD. PAR = photosynthetic active radiation.

128
9. ACKNOWLEDGEMENTS
Looking back, the last three years working on that PhD thesis have been a very
intensive time. There was not only knowledge and understanding about topics that grew, you
have never been in touch with; not only lots of experiences you made and pictures you added
to your imaginary pictorial – it was also one of those chances in life you grew by yourself.
This would never have happen without the following people around.
First of all, I want to mention Prof. Christoph Leuschner for providing this unique
opportunity to get in touch with undisturbed tropical forests and to pass my fieldwork at that
marvellous place in the Andes of Southern Ecuador. I am thankful for his trust, interest and
great support throughout that time.
Secondly, I am more than thankful having met Viviana Horna as my “personal”
adviser; without her experience and patience I would have never come up with all the
technical stuff and the problems thereafter. In that context, I want to mention Reiner
Zimmermann for his invaluable knowledge, encouragement and great humour, making
various joint field stays unforgettable. I also thank Manfred Küppers for his valuable advices
and great interest.
For the great cooperation, data exchange and fruitful discussions I am very thankful to
Sophie Graefe, Gerald Moser and Jürgen Homeier. Special thanks to Boris Rewald for shared
office times.
Thanks to the following people for making my time at the ECSF a really great time:
Manuela Müller, Beate and Alex Zimmermann, Rütger Rollenbeck, Sven Günther, Simone
Radesma, Thorsten Peters, Pablo Ramirez, Fabian Brambach and especially Folkert Bauer.
Above all, I am more than lucky to have met Florian Werner, changing a lot of things over the
course of the last years. Thanks also to the Ecuadorians Tati and Rocio and kids, Maria and
her family, Janeth, Abrahan and Polivio.
Special thanks to my friends, for supporting and encouraging me here and elsewhere:
Ina, Julia, Daniela, Doris and Britt.
I am very thankful to my family Barbara, Wolfgang, Andrea and Matthias for plentiful
love and patience.

129
10. CURRICULUM VITAE
PERSONAL DETAILS Date of birth Place of birth Nationality EDUCATION 2005 – 2008 2002 – 2004 2000 – 2002 1997 – 2000 1986 – 1996 WORK EXPERIENCE 2005 – 2007 2003 - 2004 2001 1998 – 2000 2005 – 2008 2003 – 2005 1998 – 1999
21. July 1976 Coburg, Germany German
PhD study at the Department of Plant Ecology, Albrecht von Haller Institute for Plant Sciences, University of Göttingen, Germany M.Sc. Program “ Tropical and International Agriculture” at the University of Göttingen, Germany Degree obtained: M. Sc. agr. Study of „ Ecological Agriculture in the Tropics and Subtropics” at the University of Kassel, Germany Degree obtained: Dipl. Agr. Ing. Study of Agricultural Sciences at the Christian Albrechts University of Kiel, Germany Gymnasium Albertinum, Coburg, Germany High school graduation: Allgemeine Hochschulreife
PhD field work in Podocarpus National Park (Loja, Ecuador) MSc. thesis in Santa Rosa (Argentina)
Field assistance in Adana (Turkey)
Study-related (agricultural sciences) internships in South-Africa, Nicaragua and Germany Scientific assistant at the Department of Plant Ecology, University of Göttingen, Germany Graduate assistant at the Institute of Agricultural Chemistry, University of Göttingen, Germany Graduate assistant at the Institute of Plant Nutrition and Soil Science, University of Kiel, Germany