carbon formation frorl carbon rionoxide-hydroges
TRANSCRIPT
140 P. L. WALKER, JR., J. I?. RAICSZAWSKI AND G. R. IMPERIAL Vol. 63
surface area (0.8 m."g.) as compared to that of the carbon from the carbon monoxide-hydrogen mix- ture (120 m."g.), agreeing with the findings of Schneffer and co-workersZ0 on the effect of surface area on graphitiaability for a series of carbon blacks. As expected, heat treatinelit to 2500' and above is effective in removing the majority of the impurities from the carbons.
Conclusions
Carbons formed from various carbon monoxide- hydrogen mixtures over iron catalysts are highly crystalline, considering the relatively low forma- tion temperatures a t which they can be produced. For each carbon monoxide-hydrogen mixture used, the crystallinity of the carbon shows a maximum in the temperature range of ca. 576 to 630". The
maximum crystallite height of the carbon increases with increasing hydrogen content in the gas mix- ture, a t least up to 19.9% Hz. The specific surface areas of the carbons show tl maxiinurn in the teni- perature range of ea. 500 to 576'. The atomic C-H ratio of the cnrboiis is found to increase monoton- ically with increasing formation temperatures over the entire temperature range for each carbon mon- oxide-hydrogen mixture investigated and to de- crease with increasing amounts of hydrogen in the gas mixture up to formation temperatures of ca. 600". The electrical resistivity of the carbons is found to be a complex function of their crystal- linity, surface area and C-H ratio. The properties of the carbon are found to be affected by the amount formed over the iron catalyst; in particular the crystallinity decreases markedly with increasing amount formed.
CARBON FORMATION FRORl CARBON RIONOXIDE-HYDROGES MIXTURES OVER IRON CATALYSTS.'s2 11.
RATES OF CARBON FORMATION BY P. L. WALKER, JR., J. F. RAKSZAWSKI AND G. R. IMPERIAL
Department of Fuel Technology The Pennsylvania State Uniuersity, UniversilIj Park, Pennsylvania
Received Apn'l 8 , 1958
The effect of temperature and inlet carbon monoxide-hydrogen composition on the rate of carbon formation and amount of carbon which can be formed over iron catalysts before the catalysts nre deactivated has been investigated. As the hydro- gen content of the gas mixture is increased, the temperature a t which the maximum rate of carbon deposition occurs also increases, this temperature ranging from ca. 528' for a 99.2% C0-0.8% H2 mixture to ca. 630" for a 80.1% CO-19.9yo H2 miuture. Change in mixture composition has a relatively small effect on rate of carbon deposition or total amount of carbon which can be formed from a given catalyst weight a t lower temperatures (470 to 528") but has a mnjor effect a t higher tem-
At the higher temperatures, the maximum rate of carbon formation increases with increasing E ydrogen content in the gas up to a point and then decreases. Also, increases in hydrogen content in the gas markedly increase the total amount of carbon which can be formed before catalyst deactivation occurs. The type of catalyst pre- treatment and nature of catalyst used is also seen to affect carbon deposition. A spent catalyst consists primarily of cemen- tite. Upon hydrogen treatment the cementite is converted to iron and the spent catalyst is reactivated for additional carbon production. I t is proposed that iron, on which carbon monoxide can chemisorb and dissociate, is the active catalyst for carbon deposition and that complete conversion of iron to cementite, on which carbon monoxide cannot chemisorb a t elevated temperatures, is responsible for stopping carbon deposition.
eratures (above ca. 576").
Introduction There is general agreement in the literature that
the rate of carbon formation from carbon monoxide decomposition over iron catalysts is significant between ca. 400 and 750°, with the maximum rate occurring between 500 and 600°.a-8 Considerable uncertainty exists, however, as to why the rate of carbon deposition decreases above ca. 600°, but it is known not to be caused by equilibrium in the
(1) Based, in par t , on an M.S. thesis submitted by G. R. Imperial to the Graduate School of tlle Pennsylvania State University, August, 1957.
(2) At different stages, this work wa9 supported by the Reading Anthracite Coinpnny and the Atoinio Energy Cointnission under Con- t ract No. AT(30-1)-1710. (3) W. Barikloh and B. Edwin, .4rch. EisPnhuttenzn.. 16, 107 (1942). (4) Francois Olmer, Tim J O U R N A L , 46, 40.; (1942). (5) G. I. Chufrtrov and RI. F. Antonova. Bull. acad. sci. U.R.S.S.,
(6) W. Baukloh, B. Chatterjee and P. P. Das, Trans . Ind ian Inst .
(7) B. Fleureau and A. Sanceline, Compt. rend., 2311, 801 (1952). (8) T. F. Berry, R. N. Aines and R. B. Snow, J . 4rn. Cerarn. Sac.,
Classe se i . tech., 381 (1947).
Metals, 4, 271 (1950).
39, 308 (1956).
reaction 2CO C + COe. Some explanations offered for this diminution in rate are decreasing chemisorption of carbon monoxide on the cata- l y ~ t , ~ beginning of appreciable catalyst si i~tering,~J and absence of carbide formation.8 There is some suggestion that the rate of carbon formation in- creases again a t higher temperatures (850°),9 but this has not been well confirmed.
It has been shown that the addition of small amounts of sulfur compounds to cnrbon monoxide greatly retards the decomposition of the latter over iron.5,s,lo-13 Also, selected nitrogen com- pounds, particularly cyanogen and ammonia, have been shown to be powerful retarders of car- bon deposition.s~11~12 On the other hand, hydro-
(9) J . Taylor, J . Iron Steel Ins t . (London), 184, 1 (1956). (10) T. Watanabe, Bull. Inst . PADS. Chem. Research (Tokyo), 7,
(11) W. Baukloh and G. Henke, I l i e t ~ Z l ~ i ~ t ~ ~ h ~ f t , 19, 4G3 (1940). (12) S. Klemantaski, J . I ron Steel Inst. (London). 171, 176 (1952). (13) B. Chatterjee and P. P. Das, J . Bci. I n d . Research ( I n d i a ) ,
1078 (1928).
UB, 412 (1956).

Feb., 1859 RATES OF CARBON FORMATION FROM CARBON MOSOXIDE-HYDROGEN MIXTURES
I 0 50 100 150 xx) 250 350 400
REACTION TIME, minutes.
141
Fig. 1.-Three typical rate curves showing carboil formation from a 98.GyO c0-1.4% 112 mixture over 0.10 g. of reduced carbonyl iron Lit 570".
geii hns been shown to be an accelerator of carbon monoxide decomposition over iron c a t a l y ~ t s . * , ~ ~ ~ ~ ~ , ~ ~ Water yapor has been found to both a ~ c e l e r a t ~ e ~ ~ ' ~ and retard'l carbon monoxide decomposition.
There is considerable disagreement as to what the active form of the iron catalyst is in the de- composition of carbon monoxide, but it is generally agreed that an oxide of iron alone is not the active catalyst. Various investigators have attributed t8he catalytic activity to one or more of the carbides of iron (Fe2C, Fe3C, FezoCg),8+-18 to metallic ir011,~J~J~ or t o the iron-iron oxide interface.$ This disagreement as to the active catalyst is caused primarily by the concurrent production of free carbon and carbidic carbon, which raises the question as to whether or not t'he carbidic carbon is a precursor of the free carbon.
I n this research, a detailed investigation of the effect of hydrogel1 on the rate of carbon deposition froin carbon monoxide-hydrogen mixtures was conducted. This iniyolved, in many cases, the obtaining of rate data until the deposition of carbon
(1-1) TV. .4. Bone, H. L. Sounders and H. .J. Tress, J. I ron Slec l Ins l . ( L o r i d o n ) . 137, 8.7 (1938).
(15) W. Bnuliloli and E. spetzler, Arch. Eise?i / , z?!!enu. , 13, 223 (10391.
(10) H. Tutiya, ,Sri . P a p e r s l n s l . Plirp. Cliem. Resenrch ( T o k y o ) , 10, 69 (192R).
( 1 7 ) l'. H n f l n x n n and E. Groll. Z. n i io rg . nl lge i i i . C h r n t . , 191, 414 ( I n n o ) .
(18) \V. R. Davis. R. J . Slnwaon and G. R. Rigby. T i n i i s . Brit. C e m m . Soc., 66, 67 (1957).
(19) A . P. Lyulinn, S f a l . 7 , 109 (1R.17) . (30) B. Chattorjee and P. P. Das, A'alure, 173, 104G (1954).
ceased, since it was of interest to know not only the maximum rate of carbon deposition but also the amount of carbon which could be formed from n starting catalyst weight. Othw factors affecting the rate of carbon deposition which were investi- gated include catalyst pretreatment, gas flow rate past the catalyst, different starting catalyst ma- terials and reactivation of a spent catalyst. Ex- perimental details describing the apparatus, the catalysts used, and operating procedures have been included in an accompanying paper,*l which presents the properties of the carbons formed froin the carbon monoxide-hydrogen mixtures used in this paper.
Results Determination of Carbon Depositioii Rate.-As was dis-
cussed,2' the cumulative weight of carbon formed during a run was determined from the cumultitive volumes of gas passing through the wet test meters before and after the reactor. Before the gas entered tlie exit wet test meter, it was passed through an Ascarite tower to remove carboii dioxide. The gas wns saturated with water prior to etiter- iiig both wet test meters. From the difference in gasvolumes between the entering and exit wet test meters, thc amount, of carbon formed was calculated (predicted), nssumiiig tlie difference in volumes to he caused ~ J Y only two reartions, 2CO +. C + COS and CO + Hs - C .+ €LO. For both of tlicse ieactions, the wet-test-meter iwtiings iiitliwte a de- crease of two moles of gas for endl niole of c:ti,I)on formrd. For this c:ilculation the ertent of tlir: wnter-g:Ls shift 1e:w tioii, CO + H20 e HP + COz, is uninil>oi,tnnt.
This simj)lifietl approiich to determining the rsrbon deposi- tion rate is incorrect insohr as reactions producing hydro-
(21) P. L. Walker, ,Jr., J. F. Raksaawski and G . R. Iiiiperial, THLB JOURNAL, 63, 133 (1959).

142 P. L. WALKER, JR., J. F. RAKSZAWSICI AND G. R. IMPERIAL Vol. 63
I I I I , I 93 2 % M - 0 8 % H. 6.0
9 6 6 % C O - 1 4 % H t
5 0 b
40k
3 0-
I
I
2ot I oc
I d
a 9 4 8 9 0 C O - 5 2 9 0 H ,
$ 0 a 100
cI 9 0
i 80.1 % CO - 19.9 % H,
0 50 100 150 200 250 REACTION TIME, MINUTES
Fig. 2.--Effect of variation i n teinperatii~o 0x1 cnhoii de- osition for different CO-€1, niisturcs ovcr 0.10 g. of car- f: onyl iron.
carbons cause crrors in the pi,cdicted nniouiit of carbon formed. The reaction of' hydrogen nith free and cahidic
O < 005 % H, 0 - 0 8 v - 1 5
a - 5 2
0 - 1 9 3 5 o t
4 o t 301
2ot
5 7 6 ' C .
9.0
0 5 0 100 150 200 250 300 REACTION TIME, MINUTES,
Fig. S.-EKect of variation in carbon monoxide-hydrogen composition on carbon deposition a t different temperatures over 0.10 g. of carbonyl iron. carbon to produce methane (C + 2Hz +. CH,) and the re- action CO + 3Hn -f CHI + HsO are the most likely to produce errors. In addition, the chemisorption of hydrogen a t the edges of the carbon crystallites Rill produce a de- crease in gas volume which is not attributable to carbon formation. Results show, however, that for gas mixtures containing less than 40% hydrogen, extraneous reactions have relatively little effect on distorting the true picture of carbon deposition, with agreement between predicted and actual amounts of carbon formed invariably being within 10%. Considering the large variations in carbon deposition rates found for different gas mixtures, temperatures and catalysts, the above agreement is quite satisfactory to allow major conclusions to be made.
Figwe 1 prcsents data for the rate of carbon deposition from a 98.13% C0-1.4% Hz mixture over 0.10 g. of carbonyl iron21 n t 5 i 6 O . The gas flow rate was 5.8 cc./sec. (STP) and the catalyst was pretreated in hydrogen, as previously described.21VZZ The shape of the deposition curves is typical
(22) These conditions were used tliroughout the work unless other- wise specified.

Feb., 1959 RATES OF CARBON FORMATION FROM C A R B ~ N MONOXIDE-HYDROGEN :MIXTURES 143
0 - 5 0 0 ' C .
M - 630
0 50 100 150 200 250 309 REACTION TIME, minutes ,
Fig. &--Effect of vsrintioii in c:wl)on iiiuiioxide-hydl.og.en composition on carbon deposition a t 500 and G30" over 0.02 g. of carbonyl iron.
of those usunlly found--an initial induction period, n period of essentially constant rate of carboil deposition and a period of decrensing rate of carbon deposition until deposition com- pletely stops. The agreement between runs, as shown in Fig. 1, is also fairly typicnl, with the maximum deposition rates varying by ca. =!=3yo. The predicted weights of car- bon formed in the runs, 0.05, 6 15 and 6.47 g . , can be com- pared with the weights actually obtained, 5.94, 6.18 and 6.27 g., respectively. The final carbons contain ca. 2y0 iron by weight.
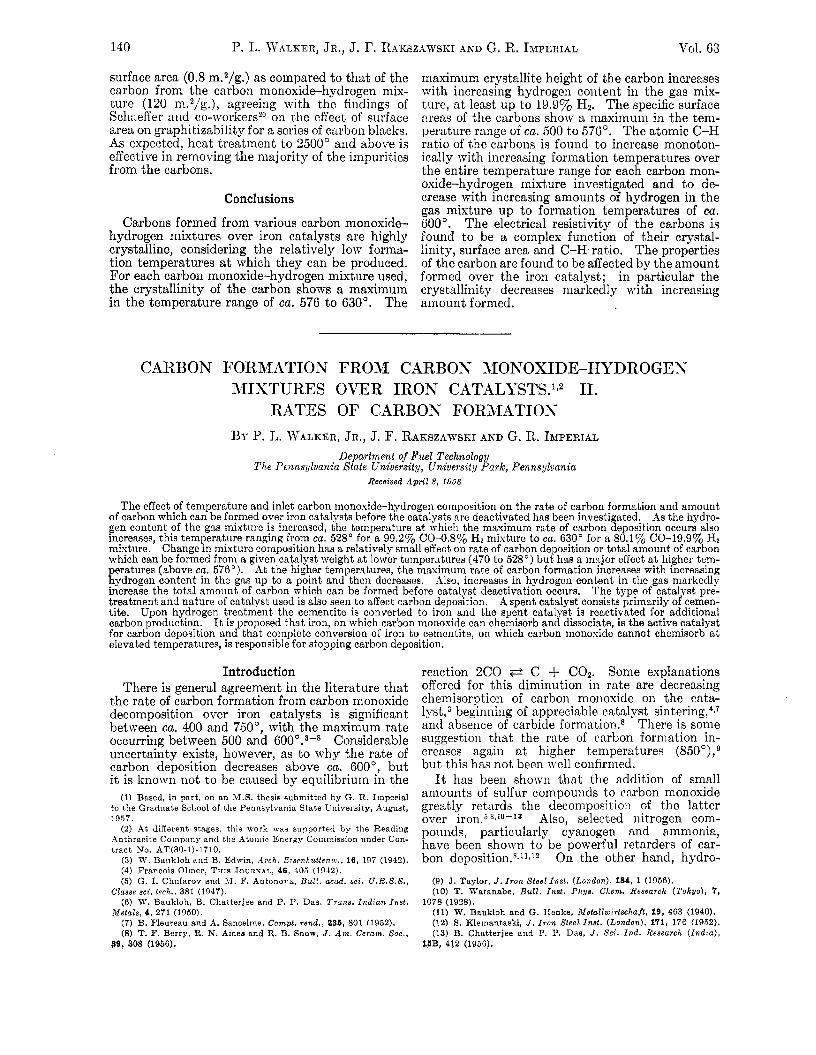
Effect of Variation in Carbon Monoxide-Hydro- gen Composition on Carbon Deposition at Different Temperatures.-Figures 2 and 3 present the results of carbon deposition as a function of gas composi- tion and temperature. From Fig. 2, it is seen that as the hydrogen content of the gas mixture is increased, the temperature a t which the maximum rnte of carbon deposition occurs also increases, i t ranging from ea. 528" for the 0.8% Hz mixture to ca. 630" for the 19.9% Hz mixture. Also, the deposition tempei'ature is seen to affect markedly the total amount of carbon which can be produced from a starting catalyst weight. For example, for the gas mixture containing OBYG Hz, carbon deposition has stopped after formation of 2.4 aiid 1.0 g. of carbon at 576 and G02", respectively; whereas at the temperature of 528", 6.0 g. of carbon has been deposited with deposition still continuing. It is seen that incrensiiig the hydrogen content of the gas niixture markedly increases the amount of carbon v-hich can be formed from a given cata- lyst weight, particularly at the higher tempera- tures. For hydrogen conteiits of 5.2% or greater, the reaction a t all temperatures had to be discon- tinued before carboil deposition had ceased be- cause of either plugging of the reactor ivith carbon or undue duration of a reaction run.
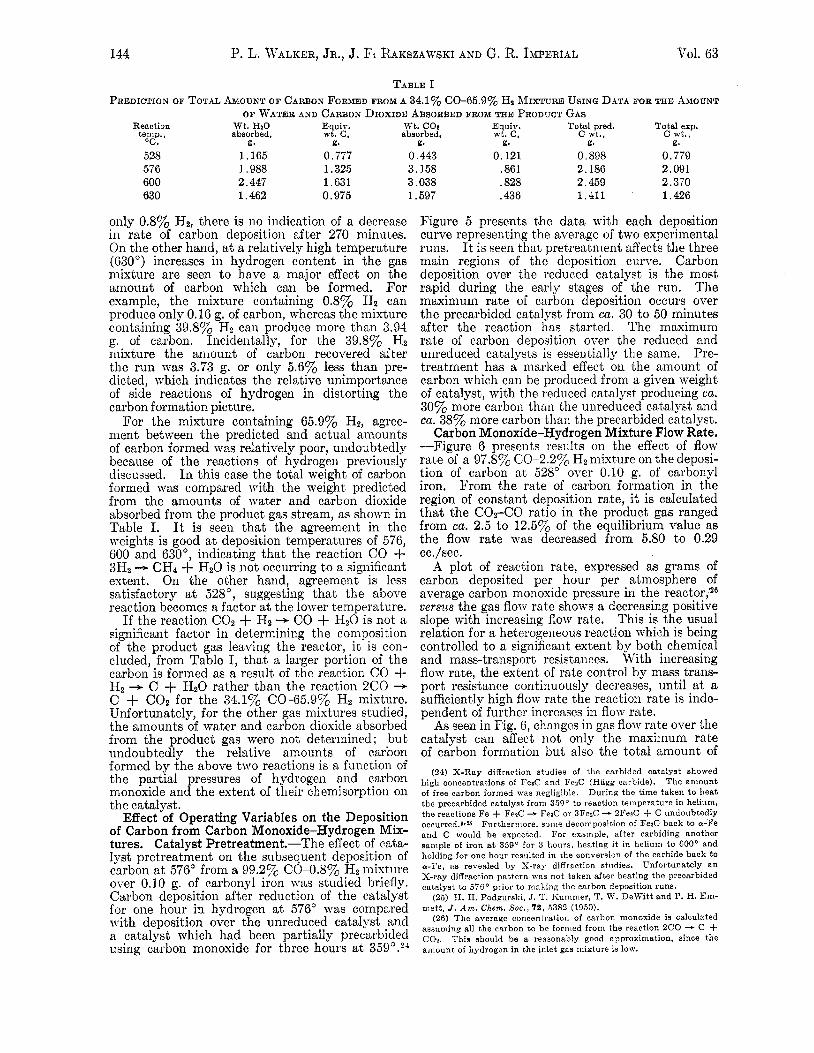
Figure 3 clearly shows the effect of increasing the hydrogen content in the gas mixture on carbon deposition rates a t particular temperatures. It is seen that a change in gas composition has a rela- tively small effect on maximum rate oi carbon deposition or amount of carbclii which can be formed at the lower temperatures (470 to 528') but has a major effect a t the higher temperatures (above 576"). At the higher temperatures it is seen that the maximum rate of carbon formation increases with increasing hydrogen content in the gas up to a point and then decreases. Also a t the higher temperatures, increasing additions of hy- drogen to the gas markedly increase the total amount of carbon which can he formed.
Of particular interest in Fig. 3 is the run made with a gas mixture containing less than 0.057G HP, which clearly shows the relatively high stability of carbon nionoxide which is dry and low in hydro- gen, even o17er iron.
In order to show more clearly the effect of change in mixture composition aiid temperature on the total amount of carbon which can be formed from a given catalyst weight, a series of runs were made using a starting iveight of carbonyl iron of only 0.02 g. From Fig. 4, it is again seen that a t a relatively low temperature (500") variations in gas cornposition have little effect on the extent of car- bon deposition and that the catalyst remains active to catalyze carbon deposition for extended periods.23 Even for the gns iiiixture containing
(23) T h e deposition curves s t 500' for 9.0 and 30.8% H,-contnining niixtures are r e i ' y similar to those for 19.9 :rnd 0.8% tIz-containing mixtures, respectively. T h e experimental points have been omitted from Fig. 4 to a ro id confusion.
144 P. L. WALKER, JR., J. F: RAKSZAWSKI AND G. R. IMPERIAL VOl. 63
TABLE I PREDICTION OF TOTAL AMOUNT OF CARBON FORMED FROM A 34.1y0 C0-65.9010 Hz R~IXTURE USING DATA FOR THE AMOUNT
OF WATER AND CARBON DIOXIDE ABSORBED FROM THE PRODUCT GAS Reaction Wt. Ha0 Equiv. Wt. con Equiv. Total pred. Total exp.
tenip., absorbed, wt. c, absorbed, wt. c, c wt., c wt., OC. g. g. K . K . g. g. 528 1.1G5 0.777 0.443 0.121 0.808 0.779 576 1.988 1.325 3.158 .861 2.186 2.091 600 2.447 1.631 3.038 .828 2.450 2.370 630 1.462 0.975 1.597 .436 1.411 ' 1.426
only 0.8% Hz, there is no indication of a decrease in rate of carbon deposition after 270 minutes. On the other hand, a t a relatively high temperature (G30") increases in hydrogen content in the gas mixture are seen to have a major effect on the amount of carbon which can be formed. For example, the mixture containing 0.8% Hz can produce only 0.10 g. of carbon, whereas the mixture containing 39.8% HZ can produce more than 3.91 g. of carbon. Incidentally, for the 39.8% Hz mixture the amount of carbon recovered after the run was 3.73 g. or only 5.6% less than pre- dicted, which indicates the relative unimportance of side reactions of hydrogen in distorting the carbon formation picture.
For the mixture containing 65.9% Hz, agree- ment between the predicted and actual amounts of carbon formed was relatively poor, undoubtedly because of the reactions of hydrogen previously discussed. I n this case the total weight of carbon formed was compared with the weight predicted from the amounts of water and carbon dioxide absorbed from the product gas stream, as shown in Table I. It is seen that the agreement in the weights is good a t deposition temperatures of 576, 600 and 630°, indicating that the reaction CO + 3Hz + CH4 + HzO is not occurring to a significant extent. On the other hand, agreement is less satisfactory a t 528", suggesting that the above reaction becomes a factor a t the lower temperature.
If the reaction COZ + Hz --t CO + HzO is not a significant factor in determining the composition of the product gas leaving the reactor, it is con- cluded, from Table I, that a larger portion of the carbon is formed as a result of the reaction CO + Hz + C + HzO rather than the reaction 2CO -+ C + COz for the 34.1% C0-65.9% Hz mixture. Unfortunately, for the other gas mixtures studied, the amounts of water and carbon dioxide absorbed from the product gas were not determined; but undoubtedly the relative amounts of carbon formed by the above two reactions is a function of the partial pressures of hydrogen and carbon monoxide and the extent of their chemisorption on the catalyst.
Effect of Operating Variables on the Deposition of Carbon from Carbon Monoxide-Hydrogen Mix- tures. Catalyst Pretreatment.-The effect of cata- lyst pretreatment on the subsequent deposition of carbon a t 576" from a 99.2% CO4.8% HZ mixture over 0.10 g. of carbonyl iron was studied briefly. Carbon deposition after reduction of the catalyst for one hour in hydrogen at 576" was compared with deposition over the unreduced catalyst and a catalyst which had been partially precarbided using carbon monoxide for three hours a t 359°.24
Figure 5 presents the data with each deposition curve representing the average of two experimental runs. It is seen that pretreatment affects the three main regions of the deposition curve. Carbon deposition over the reduced catalyst is the most rapid during the early stages of the run. The maximum rate of carbon deposition occurs over the precarbided catalyst from ea. 30 to 50 minutes after the reaction has started. The maximum rate of carbon deposition over the reduced and unreduced catalysts is essentially the same. Pre- treatment has a marked effect on the amount of carbon which can be produced from a given weight of catalyst, with the reduced catalyst producing ea. 30% more carbon than the unreduced catalyst and ea. 38% more carbon than the precarbided catalyst.
Carbon Monoxide-Hydrogen Mixture Flow Rate. -Figure 6 presents results on the effect of flow rate of a 97.8y0 C0-2.2Y0 Hz mixture on the deposi- tion of carbon at 528" over 0.10 g. of carbonyl iron. From the rate of carbon formation in the region of constant deposition rate, it is calculated that the C02-C0 ratio in the product gas ranged from ea. 2.5 to 12.5% of the equilibrium value as the flow rate was decreased from 5.80 to 0.29 cc./sec.
A plot of reaction rate, expressed as grams of carbon deposited per hour per atmosphere of average carbon monoxide pressure in the reactor,'z6 versus the gas flow rate shows a decreasing positive slope with increasing flow rate. This is the usual relation for a heterogeneous reaction which is being controlled to a significant extent by both chemical and mass-transport resistances. With increasing flow rate, the extent of rate control by mass trans- port resistance continuously decreases, until at a sufficiently high flow rate the reaction rate is inde- pendent of further increases in flow rate.
As seen in Fig. 6, changes in gas flow rate over the catalyst can affect not only the maximum rate of carbon formation but also the total amount of
(24) X-Ray diffrartion studies of the oarbided catalyst showed high concentrations of FeaC and Fed2 (Hagg carbide). T h e amount of free carbon formed was negligible. During the time taken t o heat the precarbided catalyst f rom 330O to reactlon temperature in helium, the reactions F e + FeaC -f FeaC OT 3FerC -4. 2FeaC + C undoubtedly ocourred.Q*s Furthermore, some decomposition of FeaC back to u-Fe and C would b e expected. For example, after carbiding m o t h e r sample of iron at 359O for 3 hours, heating i t in helium to GOOo and holding for one hour resulted in the conversion of the carhide back to u-Fe, as revealed b y X-ray diffraction stndies. Unfortunately an X-ray diffraction pattern was not taken after heating tho precarbided catalyst to 57G0 prior to makinn the carbon deposition iuns.
(25) H. H. Podgurski, J. T. Rutnnier, T. W. DeWitt and P. H. Em- mett , J . A m . Chem. S o c . , 72, 5382 (1050).
(26) The average concentration of carbon monoxide is calculated assuming all the carbon to be fornied from the reaction 2CO -+ C -k Cot. This should be a reasonably good npproximation, since the arnount of hydiogen in the inlet gas inixture is low.

Feb.,
.3Q m E
p” W 0- NO REDUCTION WITH Ha k 0 2.0 n
m a
LC 1.0 0 I- I
W
V - CARBIDING AT 359’ C. WITH C Q
0- REDUCTION AT 576OC. WITH
g
v)
a w
z 0
4
2 3
0 0 50 I00 150 200
REACTION TIME, minutes Fig. B.-Effect of pret’reatment of 0.10 g. of carbonyl iron samples on subsequent carbon deposition from a 99.2% CO-O.SOJ,
of carbon and uiidoubtedly stops after formation of ~ Q O
carboii which can be formed. For a flow rate of 12.0
5.80 cc./sec., the rate of carbon deposition pro- ll,o
gressively decreases after production of ca. 3.5 g.
cn. 7 g. On the other hand, for a flow rate of 2.08 cc./Gec., carbon deposition remains a t a maximum g9’0
rate up to ca. 7 g. of carbon formed and then de- z 8 . 0
creases in rate very slowly, with the total amount E 7,0
of carbon which can be formed being considerably g
Catalyst Type.--The rate of carbon deposition 5,0
from a 99.270 CO-O.S% Hz mixture a t 528” over ; 0.10 g. of “Sinter B” catalyst was investigated. z 4 . 0
“Sinter B” is a sinter of fine iron-containing powder 3,0
which comes from the top of open hearths and blast furnaces, as previously descrihed.21 The carbon 2.0 -
deposition rate was investigated over both the reduced (the same reduction procedure being used as for carbonyl iron) and the raw catalyst for two dif-
Hs mixture a t 57G0.
above 12 g. ‘ 6.0 -
-
-
-
,,o
O 500 600
ferent particle sizes. As was found for carbon REACTION TIME, minutel.
(leposition ojier carbonyl iron, the iliitial rate of Fig. &-Effect of gas flow rate through reactor on carhon carbon depositioll and tile total deposition from a 97.8‘& C0-2.2%, H, miat)ure at 528” over
0.10 g. of carbonyl iron. i\.hich can be formed is appreciably greater over the reduced than over the raw catalyst. Also, in this reduced “Sinter B” (2 .3 g.) is found to be con- case, the maximuin deposihioii rate over the reduced siderably less than over reduced carbonyl iron catalyst is considerably greater than tha,t over the (greater than 6.0 g.). raw catalyst. Change in particle size (representing The importance of a major diffcreiice in state of n change in initial B.E.T. surface area from only subdivision of the starting catalyst 011 its activity 0.41 to 0.46 m2/g.) is found to have a minor effect t o formation of cnrbon from carbon moiioxide- 011 rate of carbon deposition. hydrogen mixtures has been brought out by using
Comparison of carbon deposition over reduced an iron rod, containing only 0.02% nickel as a “Sinter B” with that over reduced carbonyl iron major impurity, as a catalyst. ’The rod had an under the same experimental coiiditions sho~vs thnt apparent density of 7.85 g./cc., agreeing well with the niaximum carbon deposition rate over t’he the true density of iron, 7.86 g;./cc., indicating carbonyl iron is ca. 25y0 higher. However, since negligible internal porosity. Following hydrogen t,he specific surface area of carbonyl iroii?l is CCG. reduction, a 98.670 C0-1.4YO H, mixture was twice that of the “Sinter B,” the specific activity passed (5.80 cc./sec.) over a piece of the iron rod of “Sinter B,” a t the inaximuni carbon deposition (5.1 mm. in diameter and 1 nim. long) for 230 rate, is higher. ‘rota1 carbon production over minutes at 576”. A total weight increase of
of
P. L. WALKER, JR., J. F. RAKSZAWSKI AND G. R. IMPERIAL Vol. 63
RUN "I - 600" C.
-
RUN 1 2 - 6W C.
RUN "3 - 576" C
-
100 150 200 250 300 REACTION TIME, MINUTES
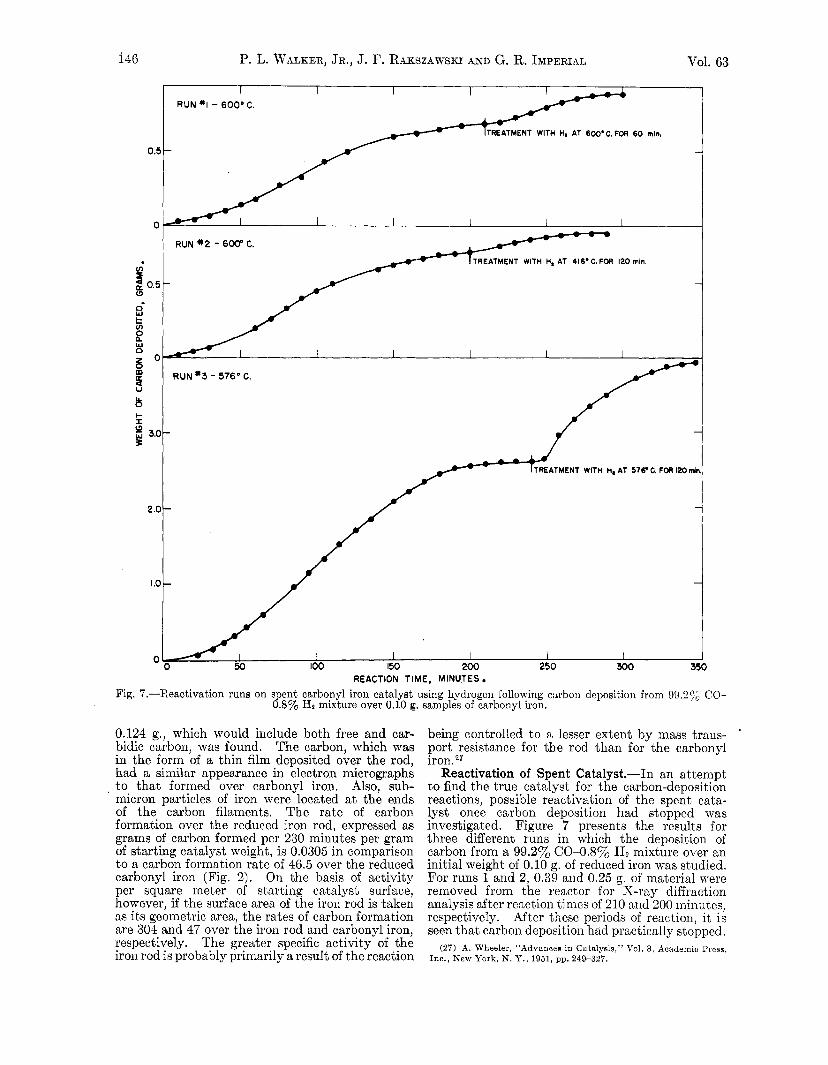
Fig. 7.-Reactivation runs on spent carbonyl iron catalyst using hydrogen following carbon deposition from 99,2yo CO- 0.8% Hz mixture over 0.10 g. samples of carbonyl iron.
0.124 g., which would include both free and car- bidic carbon, mas found. The carbon, which was in the form of a thin film deposited over the rod, had a similar appearance in electron micrographs
, t o that formed over carbonyl iron. Also, sub- micron particles of iron were located a t the ends of the carbon filaments. The rate of carbon formation over the reduced iron rod, expressed as grams of carbon formed per 230 minutes per gram of starting catalyst weight, is 0.0305 in comparison to a carbon formation rate of 46.5 over the reduced carbonyl iron (Fig. 2). On the basis of activity per square meter of starting catalyst surface, however, if the surface area of the iron rod is taken as its geometric area, the rates of carbon formation are 304 and 47 over the iron rod and carbonyl iron, respectively. The greater specific activity of the iron rod is probably primarily a result of the reaction
being controlled to a lesser extent by mass trans- port resistance for the rod than for the carbonyl
Reactivation of Spent Catalyst.-In an attempt to find the true catalyst for the carbon-deposition reactions, possible reactivation of the spent cata- lyst once carbon deposition had stopped was investigated. Figure 7 presents the results for three different runs in which the deposition of carbon from a 99.2% (204.8% Ha mixture over an initial weight of 0.10 g. of reduced iron was studied. For runs 1 and 2, 0.39 and 0.25 g. of material were removed from the reactor for X-ray diffraction analysis after reaction times of 210 and 200 miniites, respectively. After these periods of reaction, it is seen that carbon deposition had practically stopped.
(27) A. Wheeler, "Advances in Catalysis," Vol. 3, Academic Press, Ino., New York, N. Y . , 1951, pp. 240-327.

Feb., 1959 RATES OF CARBON FORMATION FROM CARBON MONOXIDE-HYDROGEN MIXTURES 147
X-Ray diffraction patterns of the products, in both cases, showed strong peaks for cementite (Fe3C) and carbon. No diffraction peaks were found for Fe304, Fez03 or a-Fe.28 Since it is known that hydrogen. readily converts Fe3C to a-Fe,29t30 possible reactivation of the spent catalyst by passing 6.5 cc./sec. of hydrogen through the reactor a t different temperatures and for different times was attempted. For run 1, an additional 0.05 g. of the product was taken for X-ray diffrac- tion analysis after hydrogen treatment. Analysis showed that the cementite present before treat- ment with hydrogen had been completely con- verted to a-Fe. From Fig. 7, it is evident thak hydrogen treatment reactivates the catalyst to a marked extent. Indeed, in run 3 the maximum rate of carbon formation after reactivation of the catalyst with hydrogen is greater than in the first carbon deposition cycle. It is seen for each run, however, that the reaction time which elapses before carbon deposition again stops is much less than in the initial cycle. X-Ray diffraction patterns of the product taken a t the end of runs 1 and 2 once again show strong cementite peaks and no Fe304, Fe203 or a-Fe peaks. No X-ray diffraction patterns were taken of the carbon during run 3, but similar results are expected.
For runs 1 and 3, where hydrogen reactivation was conducted at, the relatively high temperatures of 600 and 576", respectively, wet-test-meter readings indicated that hydrogen was reacting to a considerable extent with the free carbon. If it is assumed that the cumulative increase in difference between the wet-test-meter readings mas caused by the reaction C + 2Hz + CH4, i t is calculated that 0.50 and 0.49 g. of carbon had reacted in runs 1 and 3, respectively. The addition of these weights to the amounts of carbon recovered from runs 1 and 3 give total weights of carbon formed of 0.89 and 3.91 g.-in excellent agreement with 0.89 and 3.94 g., the weights predicted from the reactions 2CO += C + C02 and HZ + CO + C + H2O.
For run 2, where hydrogen treatment was con- ducted a t 416") there was no detectable difference in cumulative wet-test-meter readings during the treatment. If, prior to treatment, all of the iron existed as cementite, total conversion of i t to a-Fe and methane would result in a difference of only 0.0004 ft.3 in the wet-test-meter readings. This difference could :not be detected. Unfortunately an X-ray diffraction analysis was not made on a sample after hydrogen treatment in run 2, but con- version of cementite to a-Fe is suggested because of the subsequent significant increase in carbon deposition rate over the rate just prior to hydrogen treatment. Since the maximunl rate of carbon deposition and the amount of carbon formed following hydrogen treatment in run 2 is seen to be not as great as that for run 1, probably decnrburiza- tion was not complete.
(28) This does not necessarily mean t h a t these substances were not present in s i n d l concentrntions, since i t is usually not possible to pick up peaks for constituents present in concentrations of less than 5% b y X-ray diflrnctioll.
(29) H. Pichler aitd H. Merkel , U. S. Bureau of Mines Tech. Paper 718, 1949.
(30) L. C. Browning, T. W. DeWit t and P. H. Emmet t , J . Am. Chem. Soc. , 72, 4211 (1950).
Discussion On the basis of results presented in this and an
accompanying paper,z1 in addition t o key findings by other workers, a qualitative mechanism for carbon formation from carbon monoxide-hydrogen mixtures over iron catalysts is proposed. First, Fischer and Bahra' appear to have adequately ex- plained how the iron catalyst is able to permeate the carbon formed. They report that an iron- copper catalyst, when heated with carbon mon- oxide a t 500" results in the formation of a carbon which contains copper as well as iron, well separated from the main catalyst mass. They conclude that if the iron were carried into the carbon phase as volatile carbonyls of iron, the copper, which forms no carbonyl, would be left behind. The copper and presumably the iro.11, therefore, must be carried into the carbon phase by some other method, probably mechanical. The key point in the mechanism is the supposition that carbon monoxide chemisorbs on iron but not on cementite, a t the temperatures employed in this research. Emmett and c o - ~ o r k e r s ~ ~ find that iron chemisorbs carbon monoxide extensively a t 100' but a t 150" the iron begins to carbide with carbon monoxide rapidly enough so as to make adsorption measure- ments on pure iron difficult. 'They find that a t 200" pure carbon monoxide does not chemisorb on Hagg carbide (Fe2C). As Hagg carbide and cementite have essentially the sa,me ferro-magnetic moment, it is expected that their capacities for chemisorption are essentially th.e same. 32 There- fore, carbon monoxide is not expected to chemisorb on cementite a t elevated temperatures.
Consider the case of the passage of a carbon monoxide-hydrogen mixture over reduced carbonyl iron. After reduction, the carbonyl iron contains chemisorbed hydrogen, probably in atomic form.33 Since chemisorption of carbon monoxide on iron is only slightly inhibited by chemisorbed hydro- gen,a3 carbon monoxide will adsorb on iron atoms occupied by hydrogen, as well as 011 free iron atoms. A fraction of the chemisorbed carbon monoxide will react with chemisorbed hydrogen by the reac- tions CO + Hz --+ C + HzO and CO + 3Hz --t CH4 + H20, decreasing the amount of hydrogen chemisorbed on the surface, the extent of the de- crease being a function of the hydrogen content in the carbon monoxide-hydrogen mixture and the changing nature of the surface. Another fraction of the chemisorbed carbon monoxide will dissociate into carbon and oxygen atoms (the amount and the rate of dissociation depending upon the tempera- ture and the crystallographic plane of iron on which chemisorption takes place,34 among other factors). The majority of the oxygen atoms produced by the decomposition of carbon monoxide will react rapidly with additional undecomposed carbon monoxide to produce carbon dioxide or with hydro- gen to produce water, which leave the iron surface.
(31) F. Fischer and H. A. Balir, Ges. Abhandl. Kenntnis Kohle, 8,
(32) Private coniinunicntion froiii R. B. Anderson. (33) S. Brunauer and P. H. E m n e t t , J . A m . Clicm. Soc., 62, 1732
(34) V. J. Kelirer, J r . , and H. Leidheiser, Jr., THIS JOURNAL, 68,
225 (1928).
(1 940).
550 (1954).
148 P. L. WALKER, JR., J. F. RAKSZAWSKI AND G. R. IMPERIAL Vol, 63
The carbon atoms produced from carbon monoxide dissociation have a high mobility and the majority of them (some react with hydrogen to form methane) migrate across the surface to a nucleating center (probably a dislocation), where they begin forming coiicurrently both free carbon and carbidic carbon (cementite). The production of free carbon will stop when the catalyst has been completely carbided to cementite, since the necessary chemi- sorption of carbon monoxide also will stop.
This general picture of carbon deposition from carbon monoxide-hydrogen mixtures is consistent with the major findings reported in this research. X-Ray diffraction studies clearly show that the major constituent in a spent catalyst is cementite. Following reduction of the cementite to a-Fe by hydrogen, the activity of the catalyst for carbon deposition is restored.
As was seen in Figs. 2, 3 and 4, hydrogen addition to carbon monoxide can also result in marked in- creases in maximum carbon deposition rate and total amount of carbon formed. At 630", the rate of production of carbidic carbon is high and rela- tively little free carbon can be produced from a carbon monoxide-hydrogen mixture low in hydro- gen (0.8% Hz, for example) before the catalyst is completely carbided. As the hydrogen content in the gas mixture is increased, the rate of conversion of cementite back to iron is increased; and this results in an increasing rate of free carbon forma- tion and a prolonging, or perhaps removing, of the time of complete conversion of the iron to cementite. The optimum hydrogen content to produce a maximum amount of free carbon is a balance be- tween the fraction of surface which is iron and the concentration of carbon monoxide in the inlet gas. Obviously, in the limit, the complete absence of carbon monoxide will result in the production of no free nor carbidic carbon. That the addition of hydrogen, up to a point, can result in an increase in the net amount of free carbon recovered is a consequence of the considerably higher reactivity of carbidic carbon than free carbon with hydro- gen.2g$30
From Fig. 4, it was seen that additions of hydro- gen to carbon monoxide have little effect on the carbon deposition rate a t 500". At this relatively low deposition temperature, the rate of formation of carbidic carbon is low and, therefore, the presence of a large amount of hydrogen to prevent early catalyst deactivation is not necessary. The fact that the carbon deposition rate a t 500" is so insensi- tive to gas composition also indicates that the reac- tions 2CO -t C + COn and CO + HZ - C + H20 have very similar rates; this primarily implies similar rates for the reactions of carbon monoxide and hydrogen with an oxygen atom to produce carboii dioxide and water, respectively.
The fact that in many runs extended periods of constant carbon deposition rates are found in spite of a probahle build-up of carbidic carbon content in the catalyst should be noted. It is suggested that during these periods, disintegration of the catalyst into smaller particle sizes is taking place. This can result in the total surface area of the iron reiriaiiiing constant, even though the percentage of
the total surface which is iron continues to de- crease. At some point, probably when the crystal- lite size of the catalyst equals the particle size, disintegration of the particles stops and a gradual reduction in carbon deposition rate is' noted, as conversion of iron to cementite continues.
The effect which reduction of particle size (greater specific surface area) of the catalyst can have on carbon deposition rate is perhaps best seen in the reactivation runs, shown in Fig. 7. For run 3, following reactivation, the maximum rate of car- bon deposition is considerably higher than in the initial deposition cycle. Furthermore, the time for deactivation of the catalyst following its reactivation is considerably less than in the initial cycle. This is consistent with a catalyst of greater surface area on which greater rates of production of both free and carbidic carbon occur. Runs 2 and 3 in Fig. 7 also shorn a very much shorter catalyst deactivation-time following reactivation. They do not show a greater maximum carbon dep- osition rate following catalyst reactivation because of the removal of part of the catalyst for X-ray diffraction analysis and/or lack of complete reactivation.
Partially precarbiding a carbonyl iron catalyst wvns shown in Fig. 5 to decrease the time for catalyst deactivation, when using a gas mixture low in hydrogen. This is consistent with the over- all picture. The fact that an unreduced catalyst also is deactivated in a shorter time than a reduced catalyst, resulting in less free carbon formation should be noted. This is possibly a result of the stabilizing influence of oxygen on cementite, as noted by Emmett and co-workers.2s
It is interesting to compare the qualitative mechanism proposed by the authors for the forma- tion of free carbon over an iron catalyst with that proposed by H ~ f e r ~ ~ and Hofer, Peebles and Bean36 for the formation of fyee carbon over a cobalt- thoria-kieselguhr catalyst. Hofera6 proposes that free carbon formation follows two routes, one a surface process and the other process passing through a carbide intermediate. He bases his statement on the findings of the latter workersaa who studied carbon formation over two identical catalyst specimens, except that the cobalt in one had been converted to CozC by carburization with carbon monoxide. These two specimens were then carburized with carbon monoxide a t 285" for 22 hours. Carbon deposition initially was 20 times faster on the metallic catalyst than on the carbided catalyst. During the carburization proc- ess, the rate of carbon deposition on the metallic specimen decreased markedly, whereas the rate 011 the carbided catalyst remained constant. It is concluded that the carbide inhibits the deposition of free carbon in line with the conclusion expTessed in this paper; but, unlike the present conclusions, a completely carbided catalyst is still considered partially active to carboii formation. Because of the complexity and possible differences in these
(3.5) L. J. E. Hofer, "Catalysis," Vol. 4. Reinbold Publ. Corp.,
(36) L. J. E. Hofer, W. C. Peebles and E. H. Bean, J . A n . Chem. New York, N. Y., 1950, pp. 373-441.
SOC., 71, 2 ~ 9 8 (1950).

Feb., 1050 HEAT CAPACITIES AXD THERMODYNAMIC h N C T I O N S OF HYDROUS SODIUM PALMITATE 140
two systems, however, it is difficult to rationalize completely these two viewpoints a t present.
Alternate explanations for the final termination of carbon formation which were considered are (a) blocking of the catalyst by carbon, (b) possibility of a minimum catalyst crystallite size being re- quired and (c) sulfur poisoning.
The first explanation v7as ruled out for two reasons. First, the carbon produced is highly porous, and, therefore, its ability to block reacting gas molecules from reaching the catalyst is doubt- ful. Second, the final termination of carbon formation was not dependent upon the amount of carbon formed. If physical blockage of the cata- lyst by carbon was significant, it is difficult to understand, for example, why the reaction was terminated after the production of only one gram of carbon a t (502" and still not terminated after
the production of 6 g. of carbon u t 528' (see Fig. 2 for the 98.6% C0-1.4% HO mixture).
The second explanation mas ruled out because of the experimental fact that the catalyst can be reactivated with hydrogen. It would not be ex- pected that significant, if any, growth in catalyst crystallite size mould be possible during hydrogen reactivation. This is particularly true where the reactivation temperature is even lower than the carbon deposition temperature.
The third explanation, sulfur poisoning, was ruled out because of the marked effect of the hydro- gen content in the carbon monoxide in determin- ing the rate of catalyst deactivation. That is, to the authors' knowledge, i t has not been reported that hydrogen addition to a gas stream reduces the extent of poisoning of iron catalysts by sulfur compounds.
LOW TEMPERATURE HEAT CAPACITIES AND THERMO1)YWARIIC :FUNCTIONS OF HYDROUS SODIUM PALMITATE
BY HENRY E. WIRTH, JOHN H. WOOD AND JOHN W. DROEGE Contribution f r o m the Cryogenic Laboratory and the Department of Chewtistry, The Ohio Stale University, Col imbus, Ohio, and
the Department of Chemistry, Syracuse University, Syracuse, New York Received Apri l 28, 1968
The heat capacities ?f p-sodium palmitate (Nap) containing 0.064% HzO. and 2.5G% HzO and of €-Nap containing 4.48% H,O mere determined in the temperature range 15-300'K. The heat capacity of e-NaP (3.02% Hp0) was determined in the range 60-300'K. The calculated entropies at 298.16"K. are 113.0 zk 0.5 e.u. (p-NaP.0.010H20), 119.3 f 0.5 e.u. @-Nap. 0.409 H20) 119.7 f 0.5 e.u. (e-NaP.0.482HpO) and 123.9 f 0.5 e.u. (~-NnP.0.715H~O). The first half mole of water per mole of NaP IS strongly bound to the soap, and its heat capacity in the temperature range 270-3OO0K. is strong evidence for the assumption that this water is present as a hydrate. The additional water is adsorbed on the surface of the soap.
Introduction The water present in sodium palmitate (NaP)
containing 0-3.170 HzO has been shownlJ to be strongly bound to the soap. Above 3.1% HzO the water is probably weakly adsorbed on the surface of soap crystallites. The upper limit of 3.1% for the strongly bound water suggested a definite hydrate, NaP.1/2H20 (3.14% HzO), but other interpretations were not excluded by the experimental results.
To obtain further information on the nature of the strongly bound water, heat capacities of NnP containing 04.5% HzO were determined. The original intention mas to make all determinat'ions on the same phase of the soap, but it ivas found subsequently that the phase chosen, the /3-phase13 undergoes an irreversible traiisition to the €-phase when cooled to low temperature and when the moisture content is grenter than 3%. D a h were therefore obtained on two samples of low moisture @-Nap (0.OG-l 2nd 2.56% HSO) and on two samples of e-NaP (3.02 and 4.48% HzO).
Experimental Materials.-Palmitic acid (99.8%), from the same sample
used for heat capacity deteriniriations,4 was dissolved in 85y0 -~ (1) H. E. Wirtli and W. 'AT. Wallinnn, THIS JOURNAL, 60 , 919 (19RTr).
(2) H. E. Wirtli and W. L. Kosihn. {bid. , 60, 943 (1950). (3) T h e phase designations u w d are disoiiased in reference 2. (4) H. E. Wirtli, J. W . Droese and J. €1. Wood, THIE J O W R N A L , 60,
This article gives references to other work in t h i s field.
917 (1956).
CZHSOH and less than the theoretical a,mount of carbonate- free NaOH was added t'o the hot solution. The solution wa8 evaporated, the recovered soap was ground to a fine powder and heated to 180' under vacuum for 1% hours to remove ex- cess palmitic acid. This treatment gave the anhydrous w-phase.
A mixture of G5 parts of w-NaP and 35 parts of HzO was converted to neat soap by holding it a t 8. temperature of 100' for 1 hour. The neat soap was cooled to 67" and held at this temperature for 24 hours to give "tempered" P-Nap. This material Ras cooled to room temperature and dried over 60% H?SOd until its moisture content was reduced to 4.5%. Port,ions of this sample were dried over 65% HzSOI and over P.05 in a vacuum desiccator to obtain samples containing 2.56 and 0.064% HzO, respectively. All sani- ples were equilibrated for several months in closed contain- ers before use. Water content was determined with an av- erage deviation of 5~0.05% by loss of weight a t 105' for sis hours under vacuum.
All solutions and high-moisture soaps were rotected from atmospheric COS by keeping them under a Elanltet of Np. Tests for carbonate in the final samples were negative.
A fourth sample coiitaining 3.02% Hi0 was from the lot used for dielectric constant measurements 1 The palmit,ic acid regenerated from this sample was 98% pure, bu t the ex- perimentally determined equivalent weight indicated the impurit8ies to be about equally divided between higher and lower molecular weight fatty acids.
The molecular weight of NaP was taken as 278.42. X-Ray powder patterns of samples before and after the
heat capacity runs were taken and interpreted for us by Dr. F. B. Rosevear of the Procter and Gamble Co.
Procedure.-Measurements were made in a copper calo- rimeter (laboratory designation No. 5) using procedures de- scribed previously.6 All samples had a ].ow bulk density and
(5) H. L. Johnston and E. C. Rem, J . Am. C h e n . Soc., 73, 4733 (1950).