carbon footprint and the management of supply chains saif benjaafar, center for supply chain...
TRANSCRIPT
Carbon Footprint and the Management of Supply Chains
Saif Benjaafar, Center for Supply Chain Research, Industrial and Systems Engineering, University of Minnesota
Presented at the World Bank, December 13, 2010


Carbon Footprint and the Management of Supply Chains
Saif Benjaafar, Center for Supply Chain Research, Industrial and Systems Engineering, University of Minnesota
Presented at the World Bank, December 13, 2010

Research team
Faculty: Mark Daskin, Shaun Kennedy, Wallace Hopp, Yanzhi Li, and Zhongsheng Hua
Students and postdocs: David Chen, Nicole Chen, Xi Chen, Adel Elomri, Sorour Talebi, Lejun Qi, and Rowan Wang, Wei Zhang

Funding
NSF grant # CMMI096723: Optimizing the supply chain for carbon footprint (with Mark Daskin)
USDOT grant # 097809, Low carbon logistics
USDA grant: Carbon footprint of the dairy supply chain (with Shaun Kennedy)
Hong Kong RGC grant: Addressing Carbon Emissions through Operational Excellence and Supply Chain Coordination (with Yanzhi Li)

Benjaafar, S., Y. Li and M. Daskin, “Carbon Footprint and the Management of Supply Chains: Insights from Simple Models”
Chen, X. and S. Benjaafar, “The Carbon-Constrained EOQ”
Chen et al., “Stochastic Inventory Management with Carbon Constraints”
Qi, L., S. Benjaafar, and S. Kennedy, “The Carbon Footprint of UHT Milk”
Daskin, M., S. Talebi and S. Benjaafar, “Facility Location and Carbon Footprint”
Related papers
Background
Growing consensus that carbon emissions is a leading cause of global warming
Growing pressure to enact legislation to curb the amount of these emissions
Increased consumer awareness and demand for low carbon footprint products
Growing number of voluntary industry initiatives (carbon labeling, climate exchanges, voluntary emission reporting, energy efficiency certification, etc)
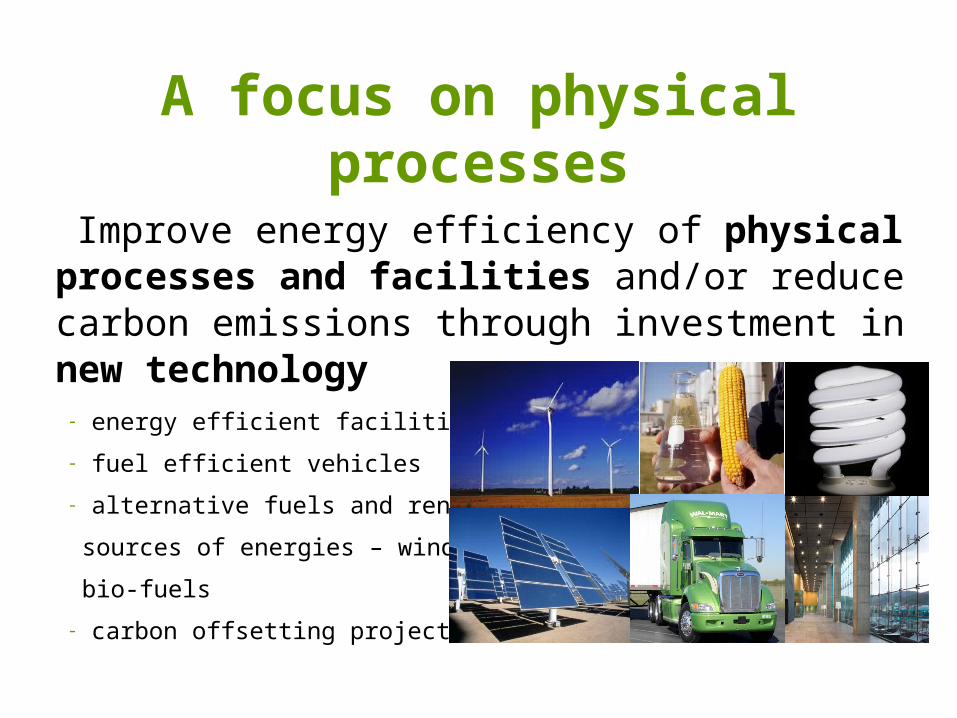
A focus on physical processes
Improve energy efficiency of physical processes and facilities and/or reduce carbon emissions through investment in new technology- energy efficient facilities
- fuel efficient vehicles
- alternative fuels and renewable
sources of energies – wind, solar,
bio-fuels
- carbon offsetting projects
A focus on physical processes overlooks causes of carbon emissions rooted in business processes and operational practices

Transportation-related emissions are driven by business decisions as much as they are (if not more) by the fuel efficiency of vehicles used
Inventory
Inventory

Examples of other business decision
Facility location and facility size
Mode of transportation
Supplier selection
Vehicle routing, loading/unloading, and cross-docking

A single large distribution center
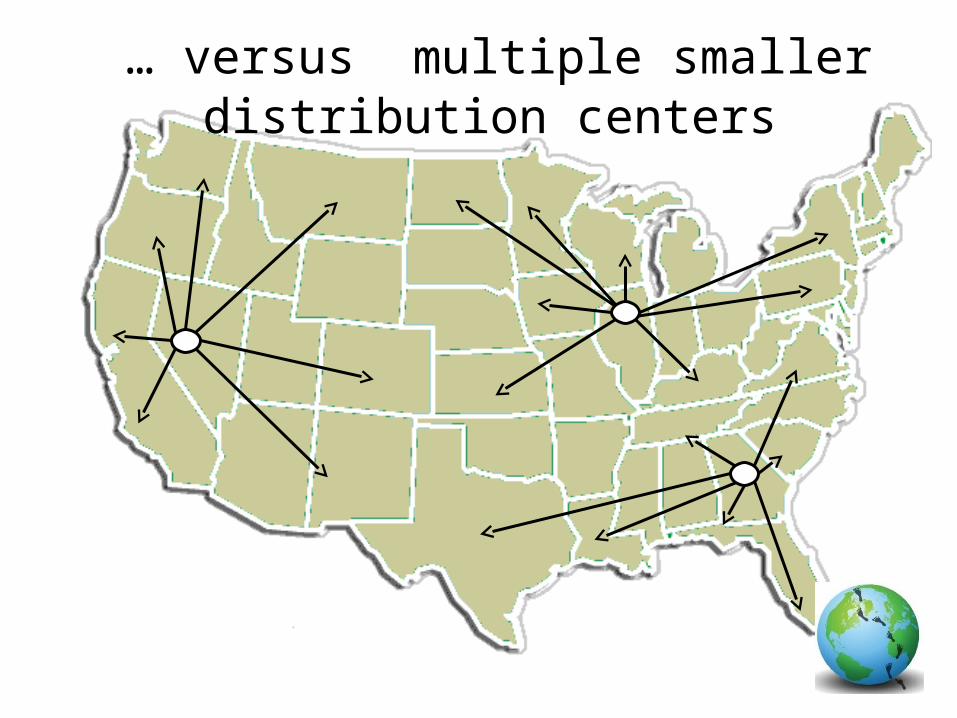
… versus multiple smaller distribution centers
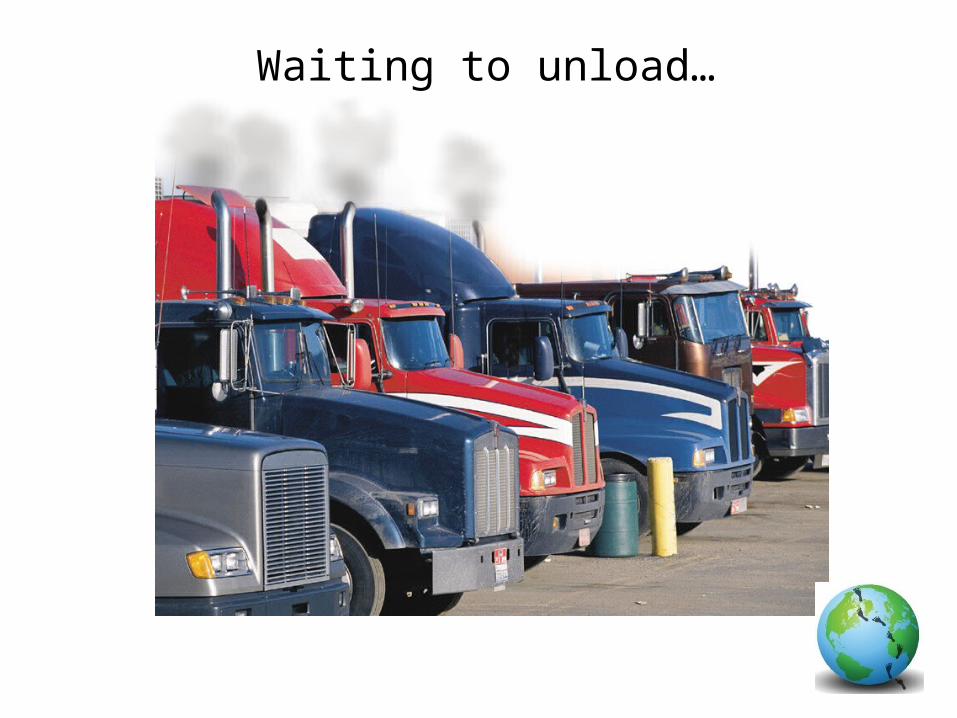
Waiting to unload…
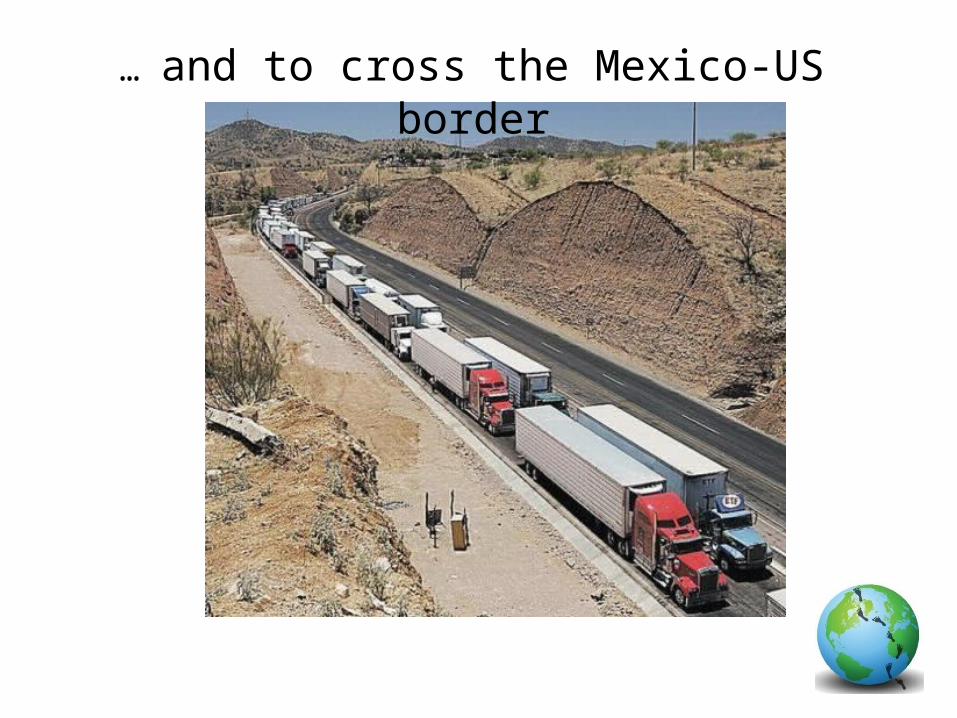
… and to cross the Mexico-US border

The lean bandwagon
Reduce inventory, shipment sizes, production batches
Implement frequent deliveries with little or no advance notice in a just-in-time mode
Use rapid-response logistics (trucking, air freight, courier)
Outsource everything you can
Source from the lowest-cost supplier
Increase product variety and mass customize
Centralize warehousing

A focus on individual firms
A focus on individual firms ignores important factors that emerge from the interaction among the multiple firms that constitute each supply chain
Emissions by one firm are often driven by business decisions made by other firms
Firm-level initiatives do not recognize the potential of supply chain-wide emission reductions from collaboration among firms within the same supply chain
A need for decision support tools that incorporate carbon emission concerns
To understand how accounting for carbon emissions (either as a constraint or as a decision criterion) might affect operational decisions
To inform operations managers on how government policies (e.g., mandatory emission caps, taxes on carbon emissions, and emission cap-and-trade) might affect operational decision-making
To study how the scope of emission carbon responsibilities and how these responsibilities are allocated among members of the same supply chain could affect the costs and emissions of various firms
Our agenda Show how carbon emission concerns could be
integrated into operational decision-making
Investigate the extent to which concerns about carbon emissions can be addressed by adjusting operational decisions
Study the impact of different government policies on operational decisions and on overall carbon emissions in the supply chain
Investigate the impact of incorporating carbon emissions on the structure of optimal operational decisions
Examples of operational decisions
Replenishment order sizing and frequency
Capacity management under uncertainty
Facility location
Supplier selection
Staffing and scheduling in the presence of congestion
Policy instruments for limiting carbon emissions
Quantity-based: strict emission caps (time-based versus output-based)
Price-based: carbon tax, cap-and-trade
Hybrid instruments: cap-and-offset; cap-and-price (systems with safety valve)
Other instruments: subsidies
…also, market incentives: carbon-dependent market share or pricing
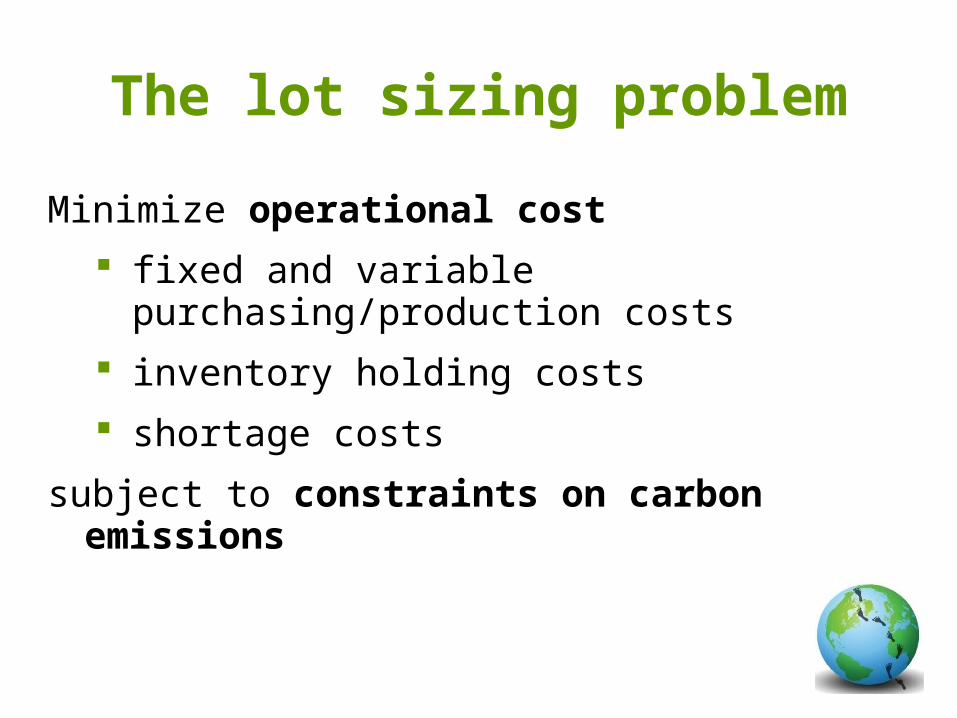
The lot sizing problem
Minimize operational cost
fixed and variable purchasing/production costs
inventory holding costs
shortage costs
subject to constraints on carbon emissions
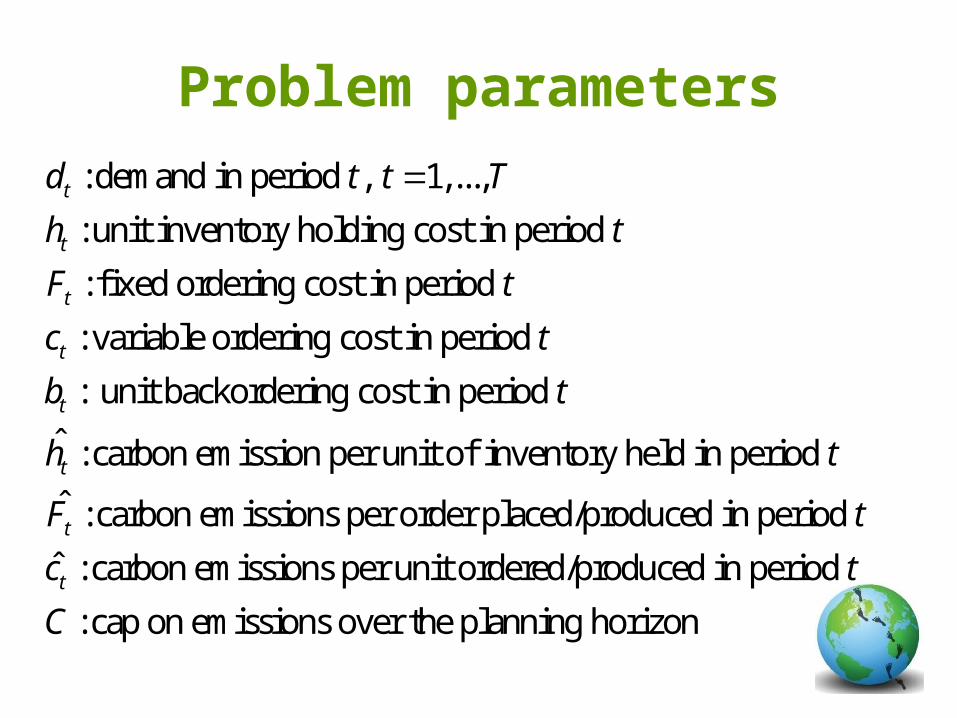
Problem parameters
: demand in period , 1,...,
: unit inventory holding cost in period
: fixed ordering cost in period
: variable ordering cost in period
: unit backordering cost in period
ˆ : carbon emissi
t
t
t
t
t
t
d t t T
h t
F t
c t
b t
h
on per unit of inventory held in period
ˆ : carbon emissions per order placed/produced in period
ˆ : carbon emissions per unit ordered/produced in period
: cap on emissions over the planning horizo
t
t
t
F t
c t
C n
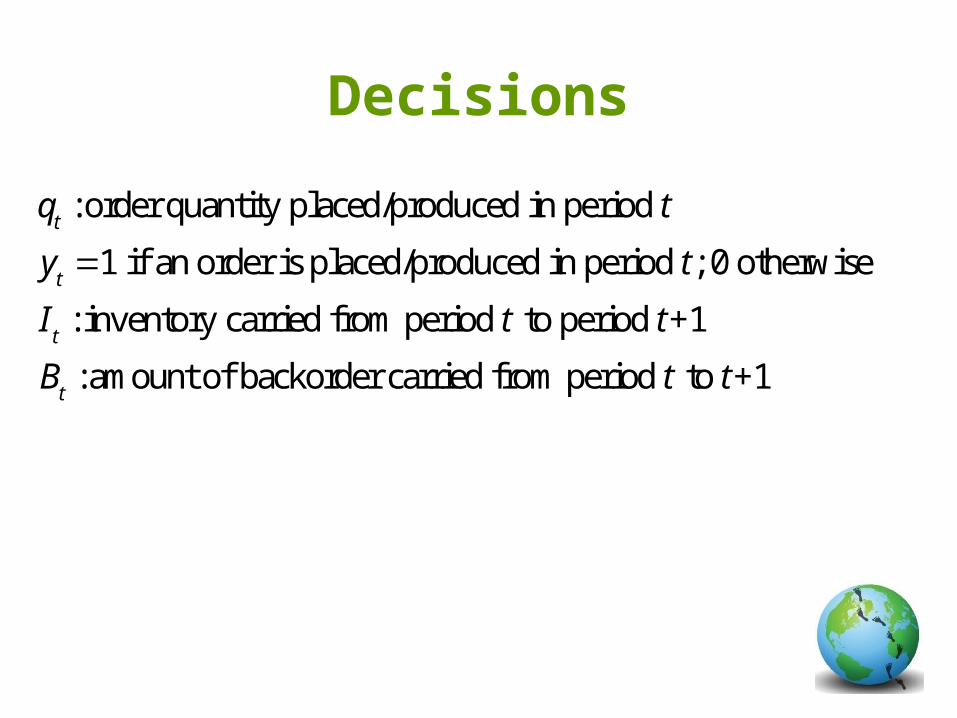
Decisions
qt: order quantity placed/produced in period t
yt1 if an order is placed/produced in period t; 0 otherwise
It: inventory carried from period t to period t+1
Bt: amount of backorder carried from period t to t+1
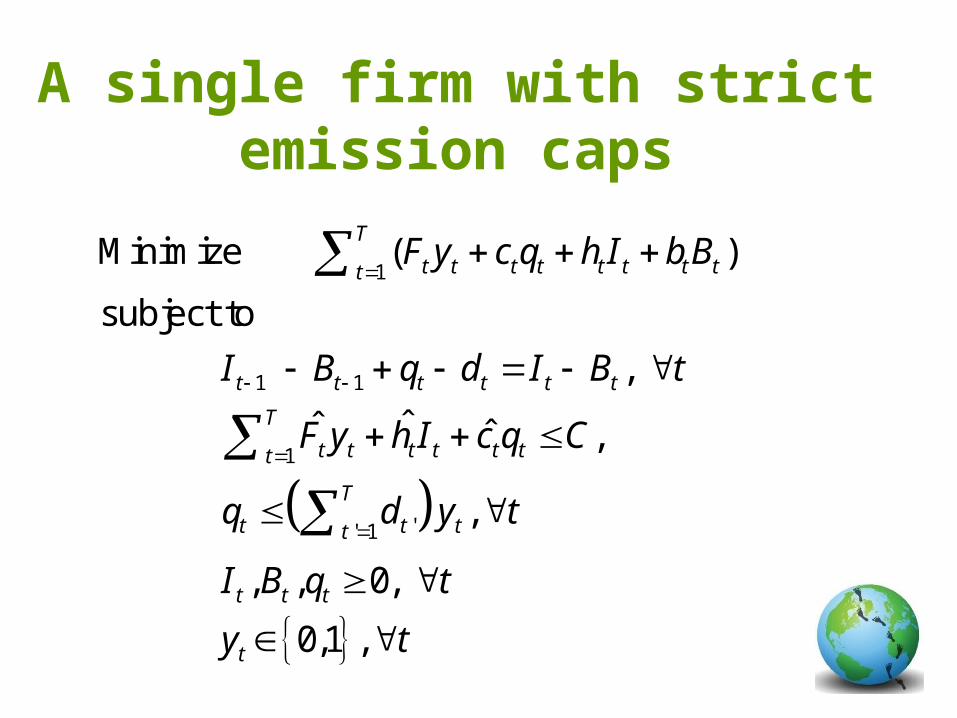
A single firm with strict emission caps
1
1 1
1
'' 1
( )
,
ˆˆ ˆ ,
,
, , 0,
0,1 ,
T
t t t t t t t tt
t t t t t t
T
t t t t t tt
T
t t tt
t t t
t
F y c q h I b B
I B q d I B t
F y h I c q C
q d y t
I B q t
y t
Minimize
subject to

A single firm with strict emission caps
1
1 1
1
'' 1
( )
,
ˆˆ ˆ ,
,
, , 0,
0,1 ,
T
t t t t t t t tt
t t t t t t
T
t t t t t tt
T
t t tt
t t t
t
F y c q h I b B
I B q d I B t
F y h I c q C
q d y t
I B q t
y t
Minimize
subject to
Operational cost
Emission constraint
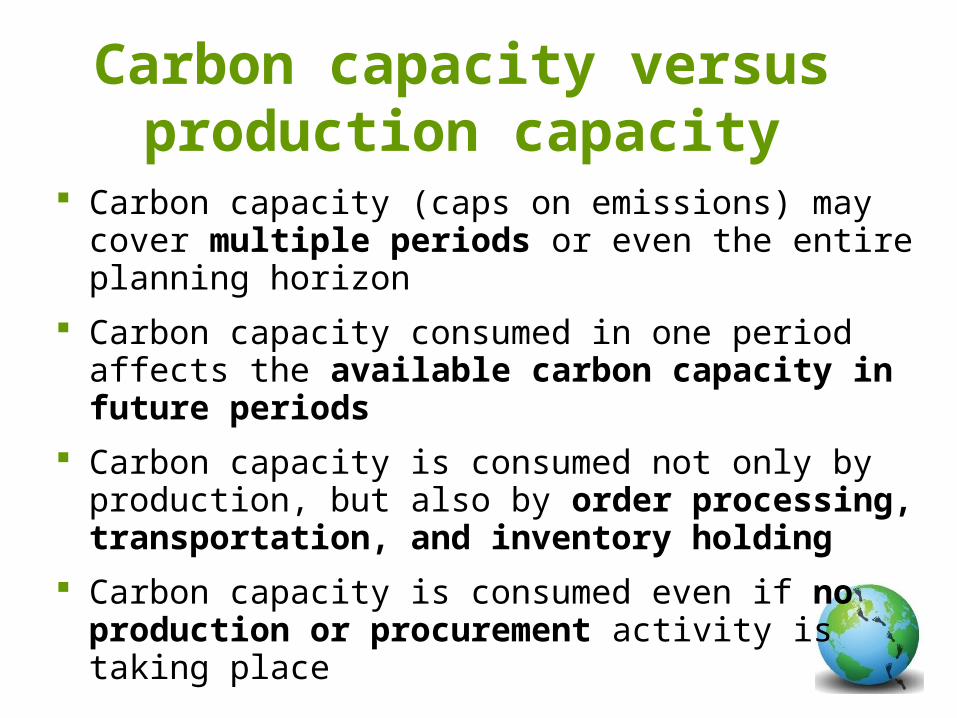
Carbon capacity versus production capacity
Carbon capacity (caps on emissions) may cover multiple periods or even the entire planning horizon
Carbon capacity consumed in one period affects the available carbon capacity in future periods
Carbon capacity is consumed not only by production, but also by order processing, transportation, and inventory holding
Carbon capacity is consumed even if no production or procurement activity is taking place
Similar formulations for systems with …
carbon tax, cap-and-offset, cap-and-trade, etc
systems with choice of technology and subsidies
systems with carbon-dependent demand/pricing
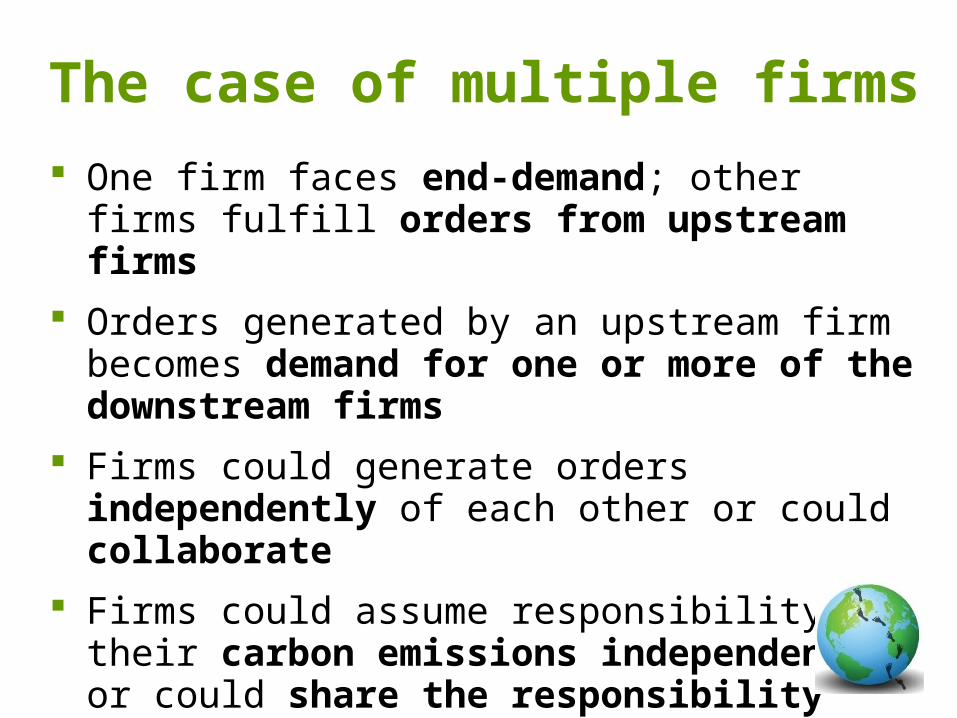
The case of multiple firms
One firm faces end-demand; other firms fulfill orders from upstream firms
Orders generated by an upstream firm becomes demand for one or more of the downstream firms
Firms could generate orders independently of each other or could collaborate
Firms could assume responsibility for their carbon emissions independently or could share the responsibility
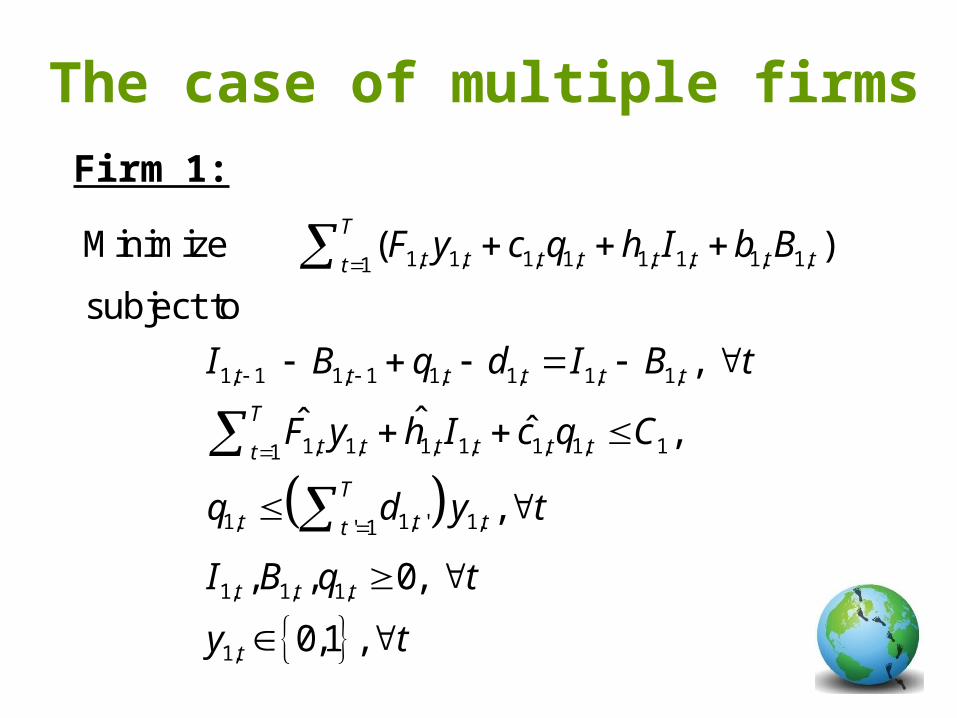
The case of multiple firms
1, 1, 1, 1, 1, 1, 1, 1,1
1, 1 1, 1 1, 1, 1, 1,
1, 1, 1, 1, 1, 1, 11
1, 1, ' 1,' 1
( )
,
ˆˆ ˆ ,
,
T
t t t t t t t tt
t t t t t t
T
t t t t t tt
T
t t tt
F y c q h I b B
I B q d I B t
F y h I c q C
q d y t
Minimize
subject to
1, 1, 1,
1,
, , 0,
0,1 ,
t t t
t
I B q t
y t
Firm 1:
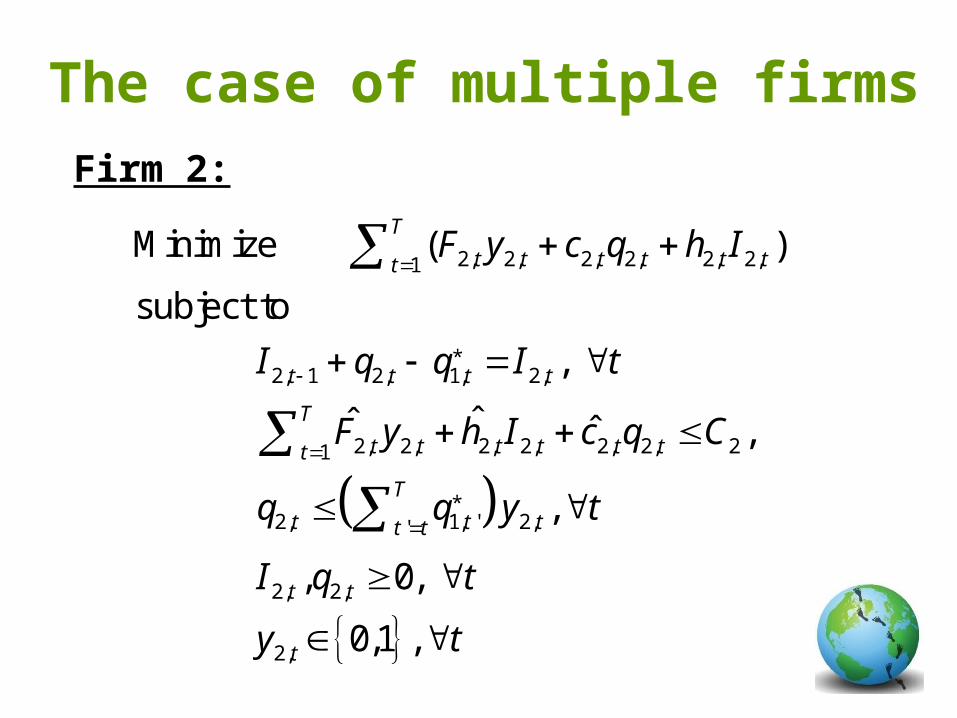
The case of multiple firms
2, 2, 2, 2, 2, 2,1
*2, 1 2, 1, 2,
2, 2, 2, 2, 2, 2, 21
*2, 1, ' 2,'
2, 2
( )
,
ˆˆ ˆ ,
,
,
T
t t t t t tt
t t t t
T
t t t t t tt
T
t t tt t
t
F y c q h I
I q q I t
F y h I c q C
q q y t
I q
Minimize
subject to
,
2,
0,
0,1 ,
t
t
t
y t
Firm 2:

Multiple firms with cooperation
2
, , , , , ,1 1
1, 1 1, 1 1, 1, 1, 1,
2, 1 2, 1, 2,
, , , , , ,1
( )
,
,
ˆˆ ˆ ,
T
i t i t i t i t i t i ti t
t t t t t t
t t t t
T
i t i t i t i t i t i t it
F y c q h I
I B q d I B t
I q q I t
F y h I c q C i
Minimize
subject to
1, 1, ' 1, 2, 1, ' 2,' '
2, 2, 2, 2,
1.2
, ,
, , 0, 0,1 ,
T T
t t t t t tt t t t
t t t t
q d y q q y t
I B q y t
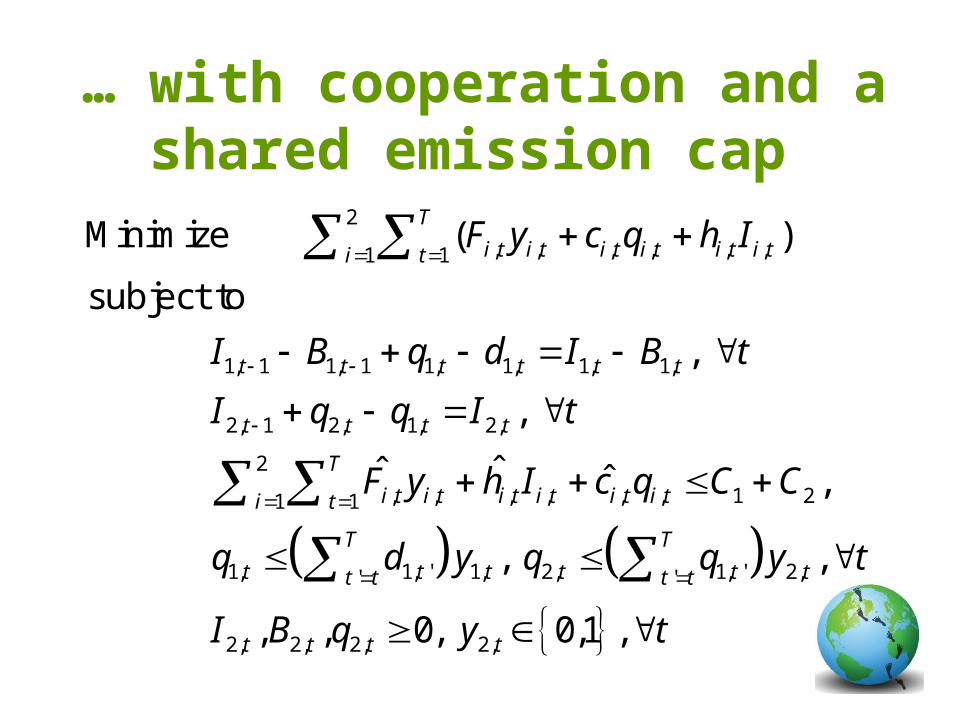
… with cooperation and a shared emission cap
2
, , , , , ,1 1
1, 1 1, 1 1, 1, 1, 1,
2, 1 2, 1, 2,
2
, , , , , ,1 1
( )
,
,
ˆˆ ˆ
T
i t i t i t i t i t i ti t
t t t t t t
t t t t
T
i t i t i t i t i t i ti t
F y c q h I
I B q d I B t
I q q I t
F y h I c q C
Minimize
subject to
1 2
1, 1, ' 1, 2, 1, ' 2,' '
2, 2, 2, 2,
,
, ,
, , 0, 0,1 ,
T T
t t t t t tt t t t
t t t t
C
q d y q q y t
I B q y t
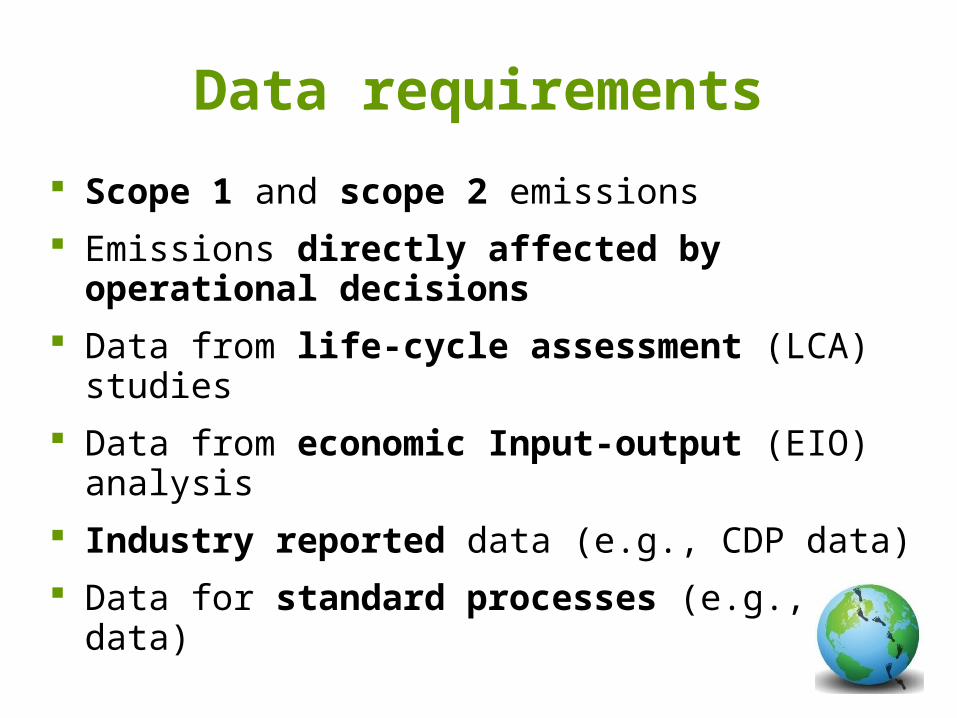
Data requirements
Scope 1 and scope 2 emissions
Emissions directly affected by operational decisions
Data from life-cycle assessment (LCA) studies
Data from economic Input-output (EIO) analysis
Industry reported data (e.g., CDP data)
Data for standard processes (e.g., EPA data)

Emerging Standards
Green House Gas Protocol (WRI)
PAS 2050 (BSI British Standards)
ISO 14064 (ISO)


Insights from the models
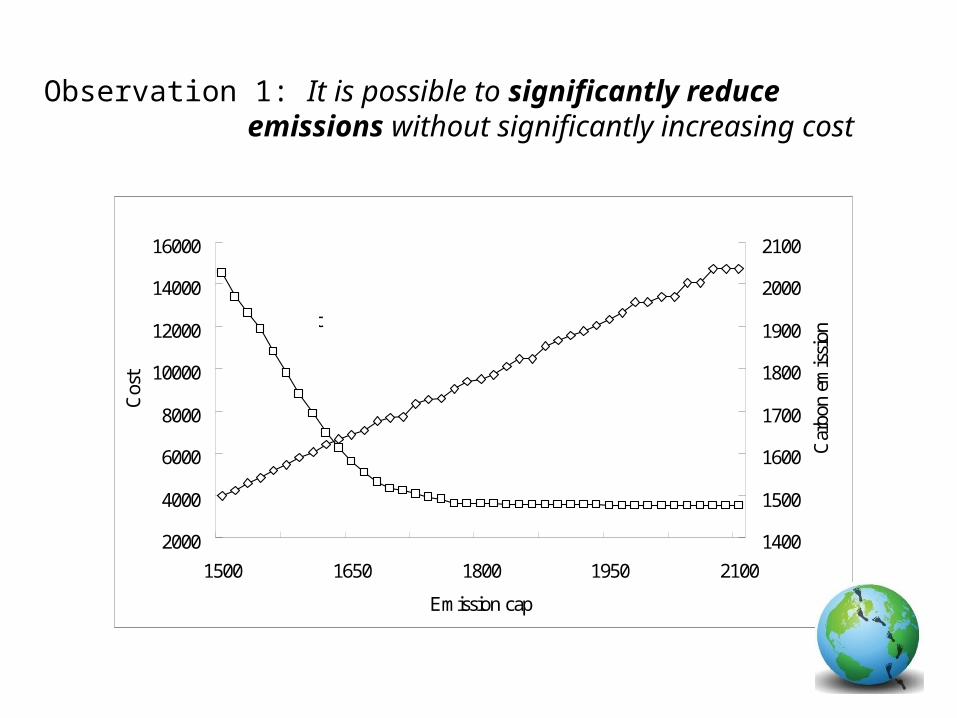
Observation 1: It is possible to significantly reduce emissions without significantly increasing cost
2000
4000
6000
8000
10000
12000
14000
16000
1500 1650 1800 1950 2100
Emission cap
Cos
t
1400
1500
1600
1700
1800
1900
2000
2100
Car
bon
emis
sion
Cost Carbon emission
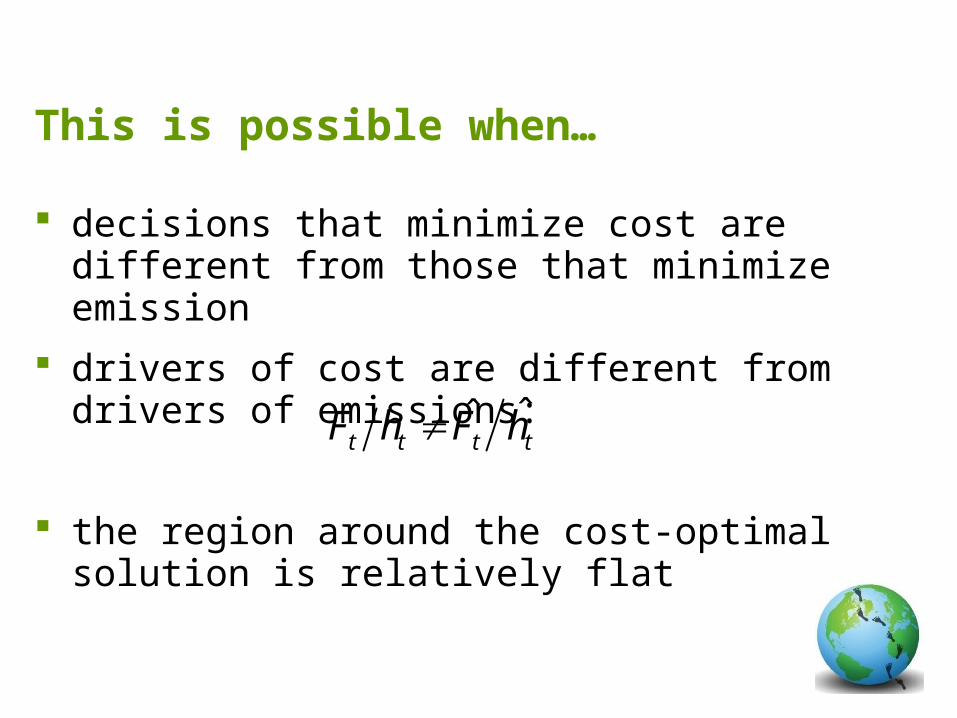
This is possible when…
decisions that minimize cost are different from those that minimize emission
drivers of cost are different from drivers of emissions:
the region around the cost-optimal solution is relatively flat
ˆˆt t t tF h F h

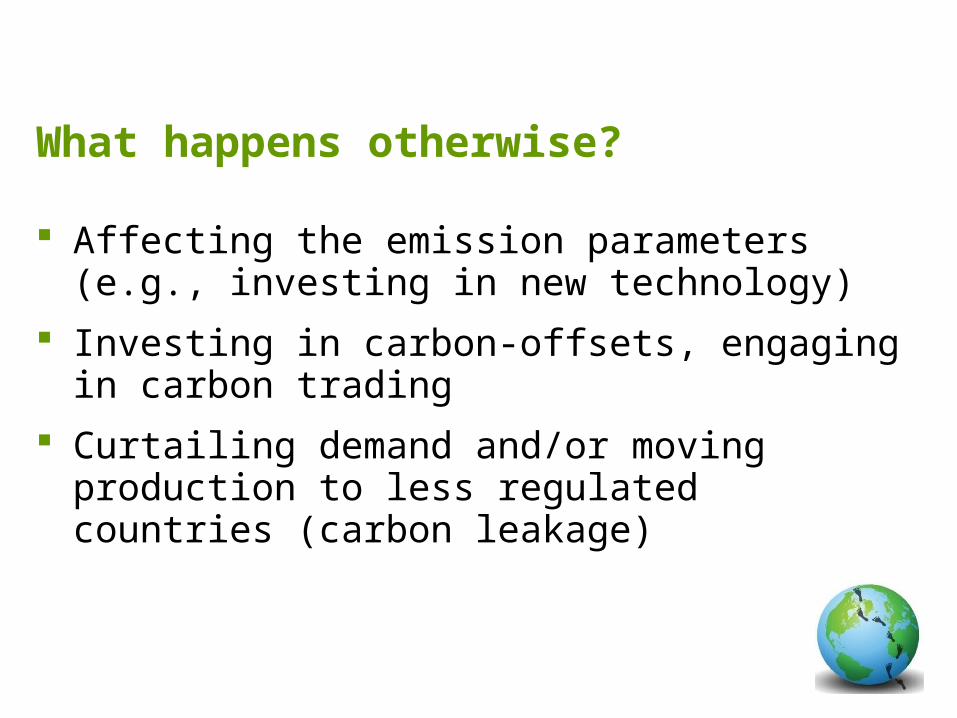
What happens otherwise?
Affecting the emission parameters (e.g., investing in new technology)
Investing in carbon-offsets, engaging in carbon trading
Curtailing demand and/or moving production to less regulated countries (carbon leakage)
Similar insights apply to …
facility location problems
stochastic inventory problems
Staffing and scheduling in the presence of congestion
0
10000
20000
30000
40000
50000
60000
1200 1350 1500 1650 1800 1950 2100
Emission cap
Cos
t
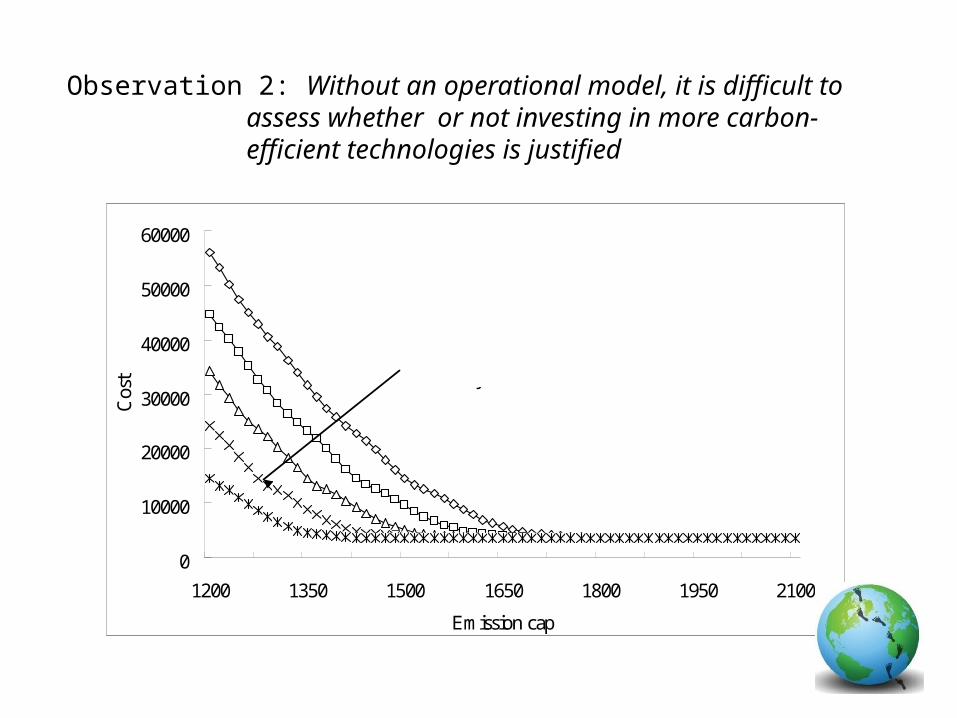
Technologies withincreasing carbonefficiency
Observation 2: Without an operational model, it is difficult to assess whether or not investing in more carbon-efficient technologies is justified
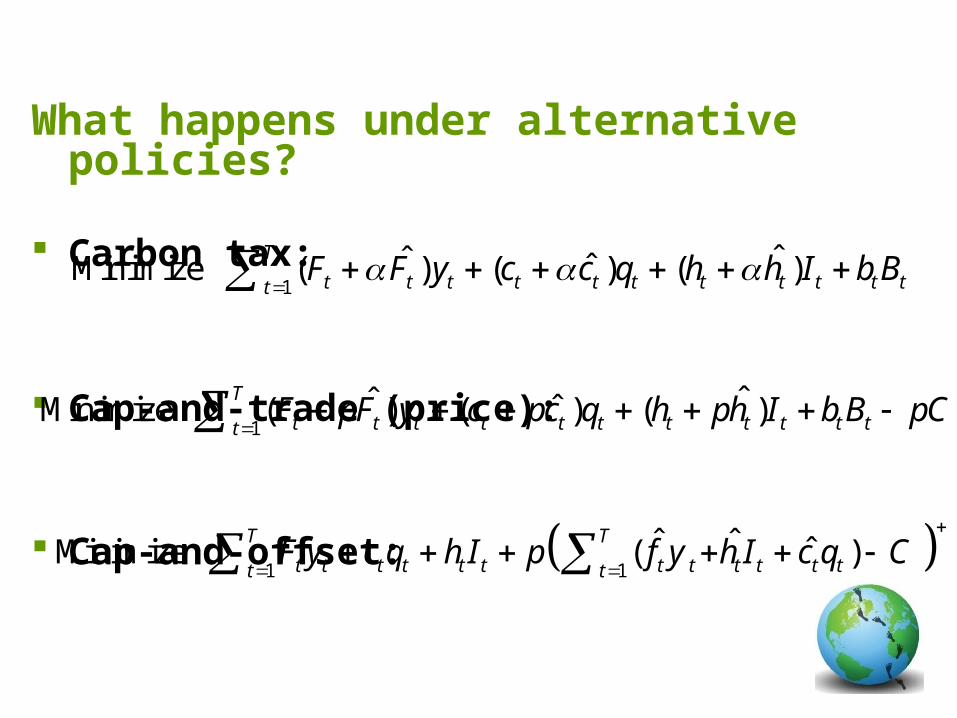
What happens under alternative policies?
Carbon tax:
Cap-and-trade (price):
Cap-and-offset:
1ˆˆ ˆ( ) ( ) ( )
T
t t t t t t t t t t ttF F y c c q h h I b B
Minimize
1ˆˆ ˆ( ) ( ) ( )
T
t t t t t t t t t t ttF pF y c pc q h ph I b B pC
Minimize
1 1ˆ ˆ ˆ( )
T T
t t t t t t t t t t t tt tF y c q h I p f y h I c q C
Minimize
2000
2500
3000
3500
4000
4500
1500 1650 1800 1950 2100
Emission cap
Cos
t
1650
1675
1700
1725
Car
bon
emis
sion
Carbon emission when price p =1
Carbon emission when price p =2
Cost when price p =1
Cost when price p =2
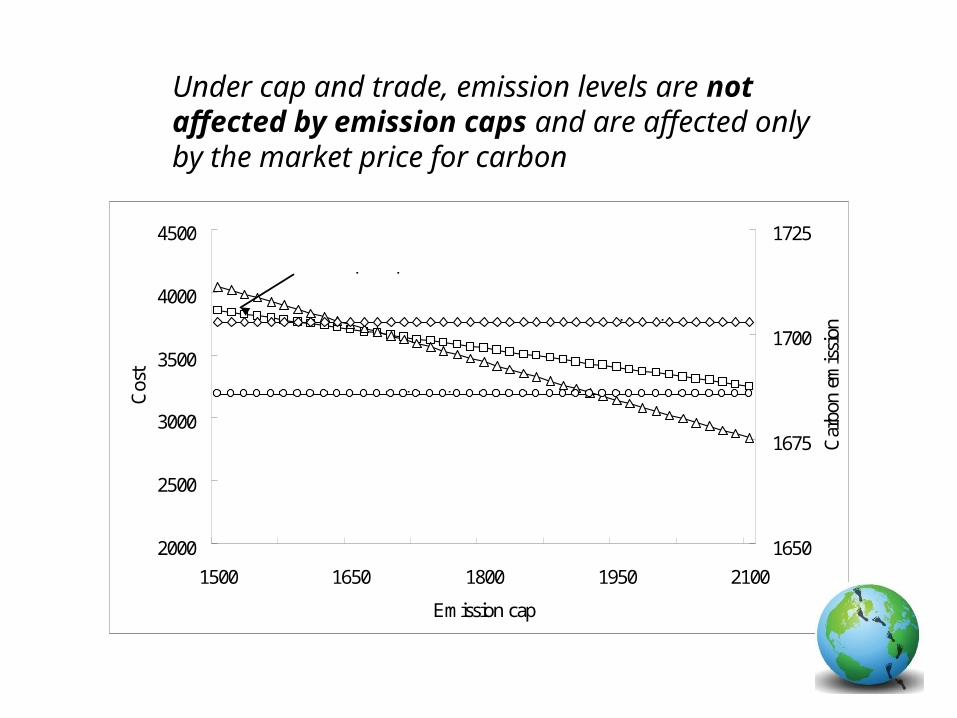
Under cap and trade, emission levels are not affected by emission caps and are affected only by the market price for carbon
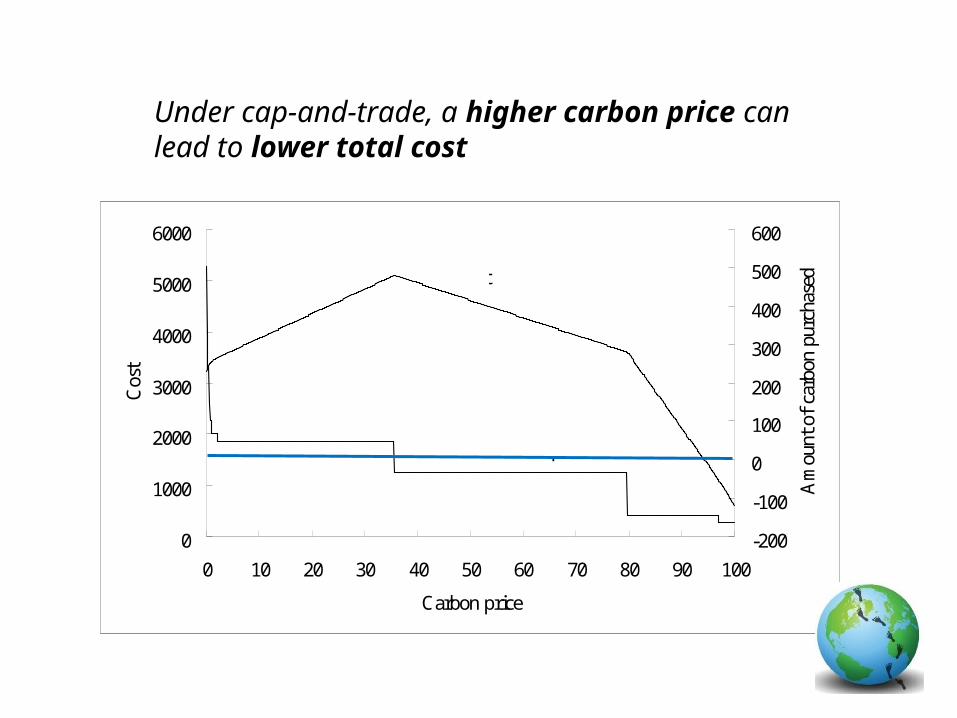
Under cap-and-trade, a higher carbon price can lead to lower total cost
0
1000
2000
3000
4000
5000
6000
0 10 20 30 40 50 60 70 80 90 100
Carbon price
Cos
t
-200
-100
0
100
200
300
400
500
600
Am
ount
of
carb
on p
urch
asedCost
Amount of carbon purchased
0
1000
2000
3000
4000
5000
1500 2100 2700 3300
Emission cap
Cos
t
1640
1680
1720
1760
1800
Car
bon
emis
sionCost
Carbon emission
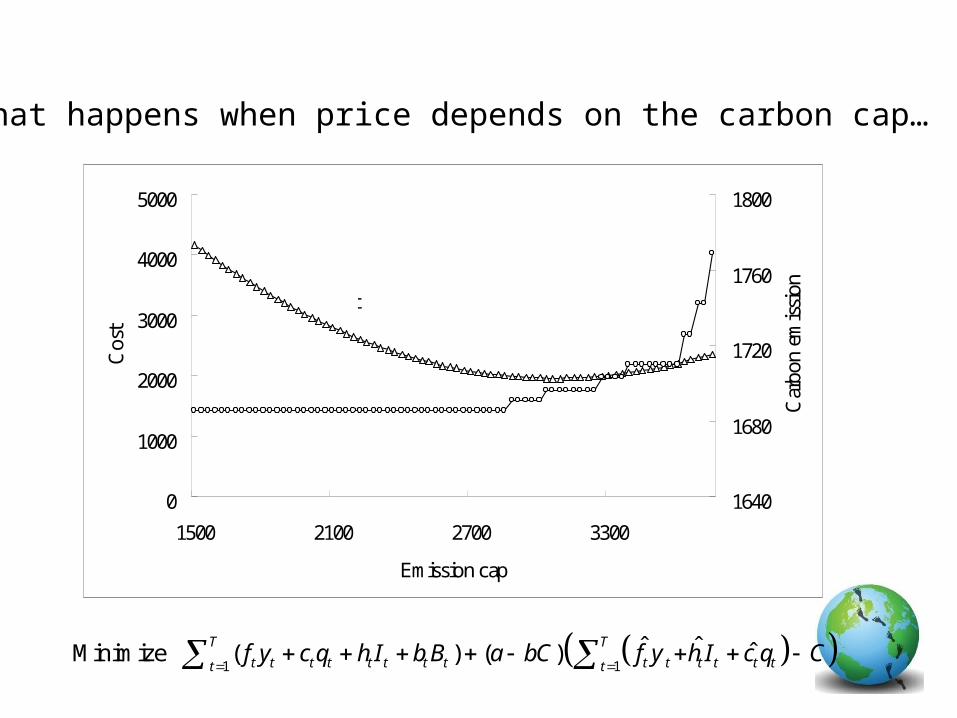
What happens when price depends on the carbon cap…
1 1ˆ ˆ ˆ( ) ( )
T T
t t t t t t t t t t t t t tt tf y c q h I b B a bC f y h I c q C
Minimize
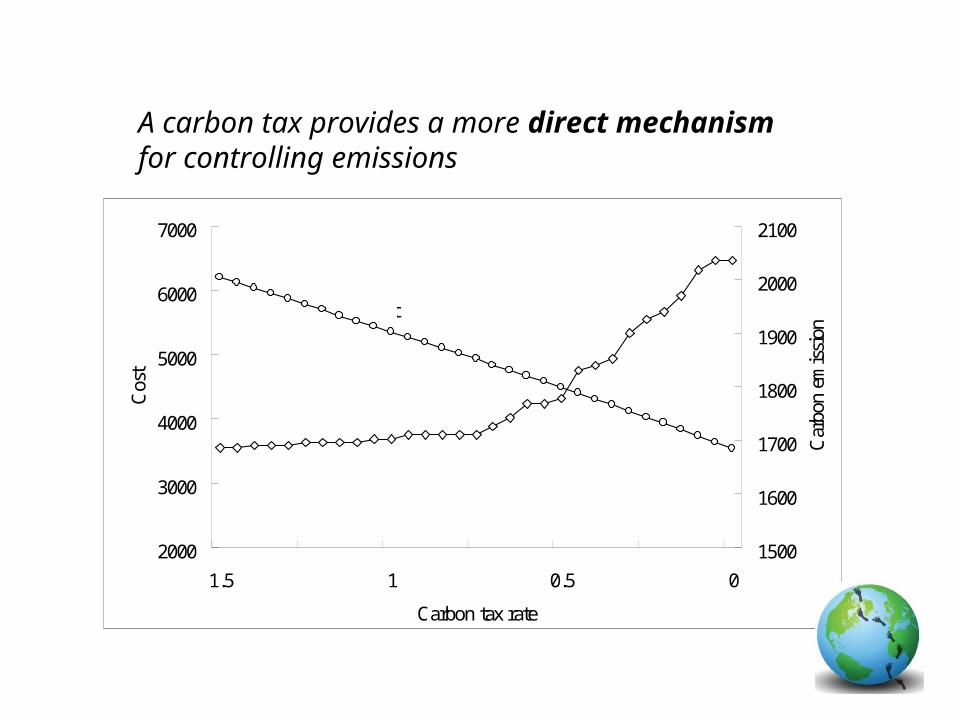
2000
3000
4000
5000
6000
7000
1.5 1 0.5 0
Carbon tax rate
Cos
t
1500
1600
1700
1800
1900
2000
2100
Car
bon
emis
sion
Cost
Carbon emission
A carbon tax provides a more direct mechanism for controlling emissions
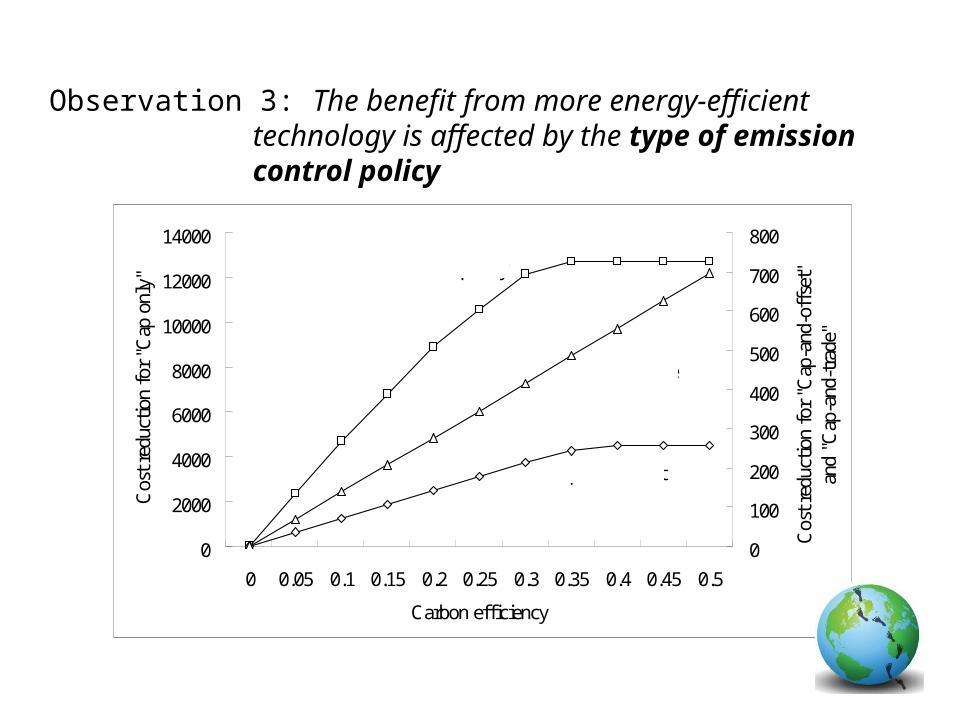
0
2000
4000
6000
8000
10000
12000
14000
0 0.05 0.1 0.15 0.2 0.25 0.3 0.35 0.4 0.45 0.5
Carbon efficiency
Cos
t red
ucti
on f
or "
Cap
onl
y"
0
100
200
300
400
500
600
700
800
Cos
t red
ucti
on f
or "
Cap
-and
-off
set"
and
"Cap
-and
-tra
de"
Cap only
Cap-and-trade(Carbon tax)
Cap-and-offset
Observation 3: The benefit from more energy-efficient technology is affected by the type of emission control policy

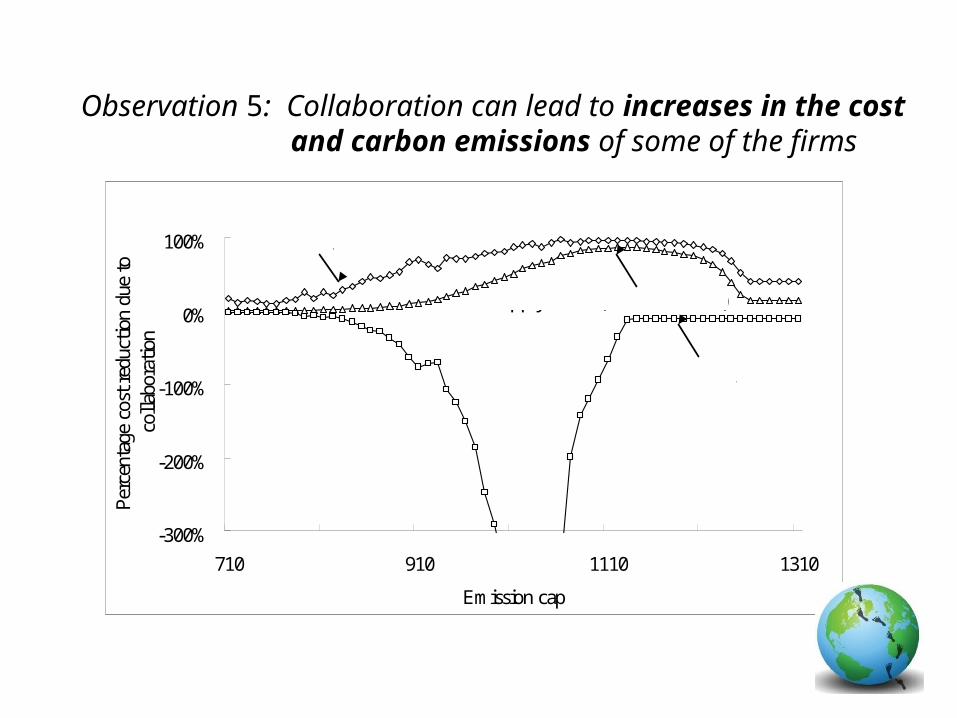
-300%
-200%
-100%
0%
100%
710 910 1110 1310
Emission cap
Per
cent
age
cost
red
ucti
on d
ue to
coll
abor
atio
n
Firm 2
Firm 1
Supply chain (Firm 1+Firm 2)
Observation 4: The presence of carbon constraints increases the value of supply chain collaboration
-300%
-200%
-100%
0%
100%
710 910 1110 1310
Emission cap
Per
cent
age
cost
red
ucti
on d
ue to
coll
abor
atio
n
Firm 2
Firm 1
Supply chain (Firm 1+Firm 2)
Observation 5: Collaboration can lead to increases in the cost and carbon emissions of some of the firms

0
100
200
300
400
500
-0.5 -0.4 -0.3 -0.2 -0.1 0 0.1 0.2 0.3 0.4 0.5
γ
Ave
rage
inve
ntor
y le
vel
Firm 1
Firm 2
1 2ˆ ˆ1 , 1h h
Collaboration affects operational responsibility across the supply chain
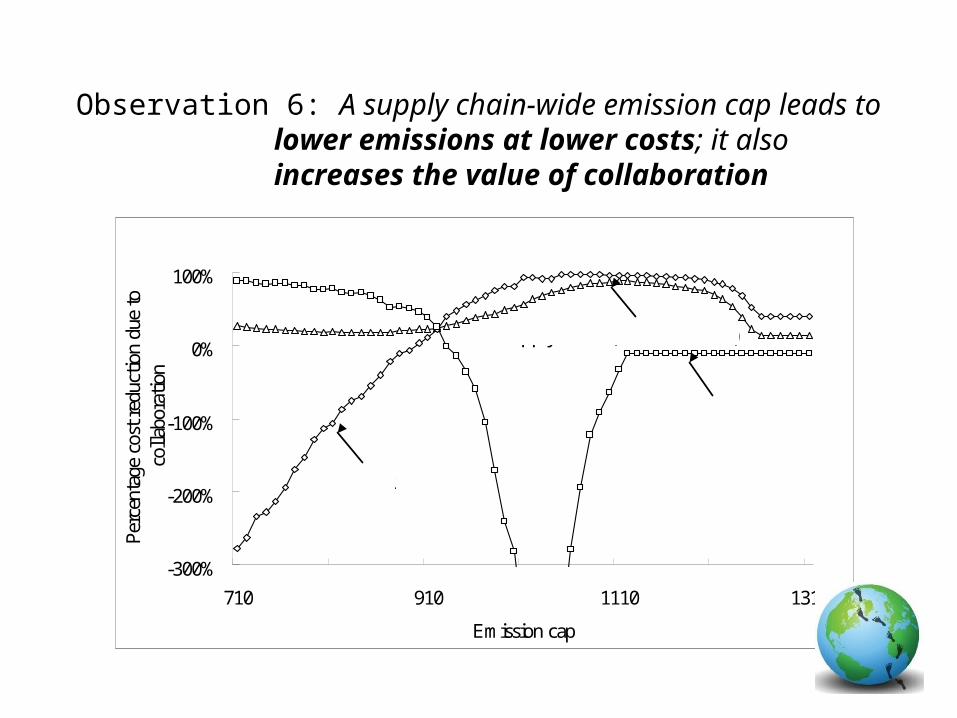
-300%
-200%
-100%
0%
100%
710 910 1110 1310
Emission cap
Per
cent
age
cost
red
uctio
n du
e to
coll
abor
atio
n
Supply chain (Firm 1+Firm 2)
Firm 1
Firm 2
Observation 6: A supply chain-wide emission cap leads to lower emissions at lower costs; it also increases the value of collaboration
0%
20%
40%
60%
80%
100%
710 810 910 1010 1110 1210 1310
Emission cap
Per
cent
age
cost
red
ucti
on d
ue t
oco
llab
orat
ion
Cap only
Cap-and-trade
Cap-and-offset
Carbon tax
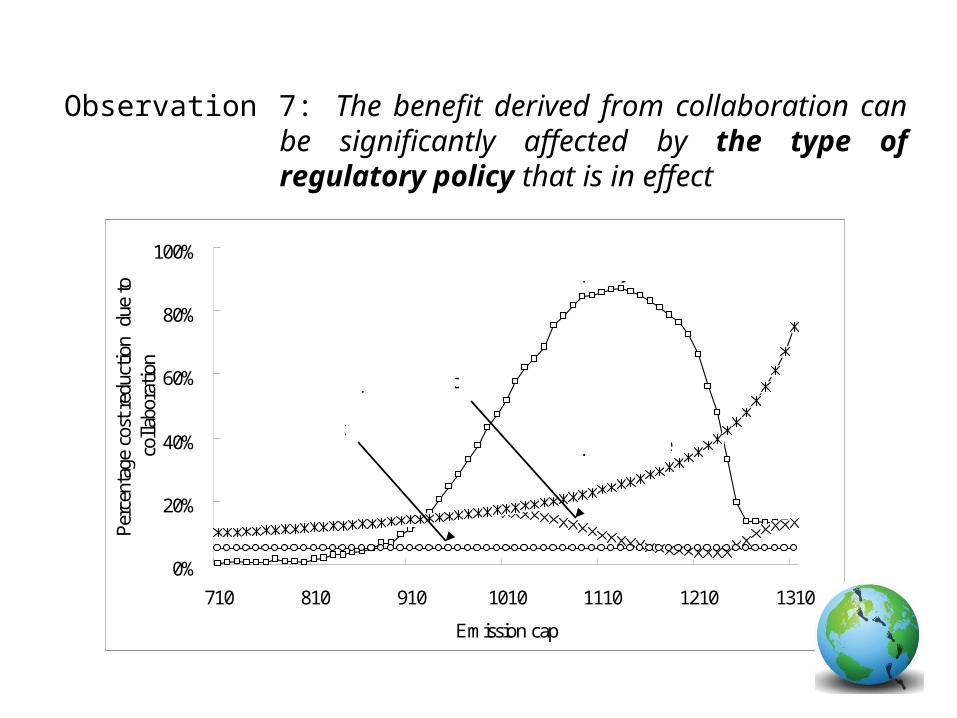
Observation 7: The benefit derived from collaboration can be significantly affected by the type of regulatory policy that is in effect
0%
100%
200%
300%
400%
950 960 970 980 990 1000
Emission cap of firm 1
Per
cent
age
cost
inc
reas
e fo
r fi
rm 3
0%
1%
2%
3%
Per
cent
age
emis
sion
incr
ease
for
firm
3
Cost
Carbon emission
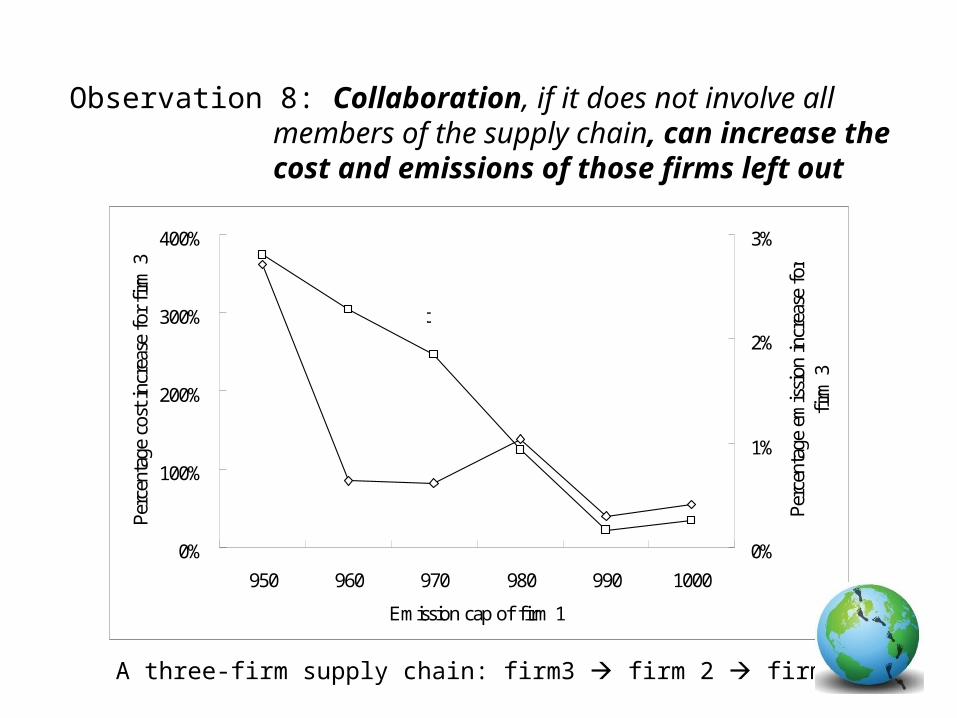
Observation 8: Collaboration, if it does not involve all members of the supply chain, can increase the cost and emissions of those firms left out
A three-firm supply chain: firm3 firm 2 firm1
More in the papers… There are more insights and theory
More models with carbon footprint considerations- problems with more complex structures (multiple
stages, multiple products, multiple suppliers)
- Other types of models (multi-period stochastic inventory models, facility location models, and congestion models)
- Other features (supplier selection, coalition formation, carbon-dependent demand, carbon market dynamics)
Empirical work on carbon footprint measurement and carbon footprint parameter estimation

Main Takeaways
There are ways to reduce emissions without resorting to expensive technological fixes
There are settings where it is possible to reduce emissions significantly without significantly increasing cost
Both emission and cost can be significantly reduced with supply chain collaboration and coordination
Sharing emission responsibility across the supply can be a win-win proposition
Incentives for collaboration can be significantly affected by the adopted policy instrument
Lessons learned from the EU experience
Reductions in carbon emissions in the covered sectors of approximately 5%
Limited economic impact, with the imposed caps estimated to cost less than 1% of total GDP by 2020
Firms in nearly all sectors covered by emission caps have been able to profit from the introduction of a cap-and trade system - Sale of emission allowances, undertaking cost-efficient emission
reduction measures, passing the cost of carbon to consumers
Despite generous emission caps, firms in many sectors have found simple and cheap ways to significantly reduce their energy consumption

A Role for the World Bank?
Getting the word out about the impact of business practices and policy instruments
Support the development of decision support tools and the publicizing of best practices
Getting involved in the development of carbon footprint measurement standards and their adoption
Working with small and medium sized companies in developing countries in redesigning their supply chains
Some future directions
Extensions to other operational decisions and other models of operations
Supply chain carbon footprint measurement (scope, boundaries, allocation), reporting, and auditing
Firm cooperation when carbon footprint responsibility is shared
Competition among firms, when market share is affected by carbon footprint
Some future directions
Integrated operations and carbon management (carbon trading, managing investments in offsets, hedging against carbon price volatility)
Empirical research (e.g., impact of environmental regulation on firm behavior; impact of standards; impact of allocation schemes)

Want to learn more?
NSF Symposium on Carbon Footprint and Supply Chains, Washington DC, October 14-15, 2010 (www.ie.umn.edu/NSFsympsoium)
Benjaafar. S. and M. Daskin (editors), Carbon Footprint and the Management of Supply Chains, Springer, forthcoming in 2011

Questions, comments, ideas?