carbon dioxide emissions from international air freight · 2011-10-27 · carbon dioxide emissions...
TRANSCRIPT
Personal revised version of: Howitt et al. (2011), Carbon dioxide emissions from international air freight. Paper to appear in Atmospheric Environment. NOTE: Final official version can be found using the Digital Object Identifier (DOI) listed here: doi:10.1016/j.atmosenv.2011.09.051
1
Carbon dioxide emissions from international air freight
Oliver J. A. Howitt, Michael A. Carruthers, Inga J. Smith*, and Craig J. Rodger
Department of Physics, University of Otago, P.O. Box 56, Dunedin 9054, New Zealand
* Corresponding author
Tel.: +64 3 479 7755
Fax: +64 3 479 0964
E-mail address: [email protected]
Abstract
Greenhouse gas emissions from international air transport were excluded from reduction
targets under the Kyoto Protocol, partly because of difficulties with quantifying and
apportioning such emissions. Although there has been a great deal of recent research
into calculating emissions from aeroplane operations globally, publicly available emissions
factors for air freight emissions are scarce. This paper presents a methodology to
calculate the amount of fuel burnt and the resulting CO2 emissions from New Zealand’s
internationally air freighted imports and exports in 2007. This methodology could be
applied to other nations and/or regions. Using data on fuel uplift, air freight and air craft
movements, and assumptions on mean passenger loadings and the mass of passengers
and air freight, CO2 emissions factors of 0.82 kg CO2 per t-km and 0.69 kg CO2 per t-km
for short-haul and long-haul journeys, respectively, were calculated. The total amount of
fuel consumed for the international air transport of New Zealand’s imports and exports
was calculated to be 0.21 Mt and 0.17 Mt respectively, with corresponding CO2 emissions
of 0.67 Mt and 0.53 Mt.
Keywords
International air freight, carbon dioxide emissions, greenhouse gas emissions, New
Zealand trade, aeroplane passenger emissions, aeroplane emission factors.
Personal revised version of: Howitt et al. (2011), Carbon dioxide emissions from international air freight. Paper to appear in Atmospheric Environment. NOTE: Final official version can be found using the Digital Object Identifier (DOI) listed here: doi:10.1016/j.atmosenv.2011.09.051
2
1. Introduction
1.1. Aim of the present research
This paper presents a methodology for calculating international air freight CO2 emissions
factors for a particular nation or region and the total CO2 emissions associated with the
nation’s or region’s international air freight. New Zealand is used as a case-study in the
present research for which emissions factors and total emissions are calculated, based on
the 2007 calendar year. This case study will be useful for other researchers and policy
analysts performing similar studies at national or regional levels as well as helping guide
New Zealand policy on international transport emissions.
Currently, there is no internationally accepted methodology for apportioning international
aviation emissions (Wood et al., 2010). There is little peer-reviewed literature available
for calculating the CO2 emissions from international air freight. A core issue surrounding
the accurate quantification of international aviation emissions lies in the commercially-
sensitive nature of accurate, activity-based data on fuel use by international aeroplanes.
Agencies such as the UK Department for Environment, Food and Rural Affairs (DEFRA)
have used other input data, such as specific fuel-oil consumption rates, to calculate CO2
emissions factors (DEFRA, 2008), which have subsequently been used in aviation
emissions studies (e.g., Andersen et al., 2010; Saunders and Hayes, 2007). The
alternative to activity-based quantification of aviation emissions is bunker fuel sales
statistics, but these lead to discrepancies which were discussed in the global context by
Owen et al. (2010), and in the New Zealand context by Smith and Rodger (2009).
The present research obtained commercially-sensitive fuel uplifts for aeroplanes
refuelling in New Zealand to derive CO2 emissions factors for air freight. These were
combined with a dataset containing all of New Zealand’s imports and exports transported
by air freight to quantify the CO2 emissions associated with their international transport.
Due to the commercially-sensitive nature of the data needed, calculating air freight CO2
emissions factors as was done in the present research is rare. The international aviation
sector is heavily reliant on aeroplanes built by only two manufacturers, who also produce
the dominant aircraft used to fly into and out of New Zealand. There is a high rotation of
the global aeroplane fleet, meaning that the aeroplanes which service New Zealand also
operate in other regions around the world. For these reasons, the emissions factors
derived in the present research are likely to be applicable to other nations; however,

Personal revised version of: Howitt et al. (2011), Carbon dioxide emissions from international air freight. Paper to appear in Atmospheric Environment. NOTE: Final official version can be found using the Digital Object Identifier (DOI) listed here: doi:10.1016/j.atmosenv.2011.09.051
3
more research is required to verify this. Comparisons with the few publicly available
emissions factors for air freight are discussed.
1.2. Global aviation fuel burn and carbon dioxide emissions
The global aviation industry consumed approximately 200-250 Mt of kerosene per year in
the mid-2000s (Kim et al., 2007; Nygren et al., 2009; Lee et al., 2010), resulting in the
emission of 733 million tonnes (Mt) of CO2 in the year 2005 (Lee et al., 2009). This
contribution represents approximately 3% of the total CO2 emissions from the
combustion of fossil fuels and is slightly less than Germany’s national contribution in
2005, the 6th largest contribution by a country (International Energy Agency, 2010).
Aviation accounted for 12% of the CO2 emissions from the global transport sector in the
year 2000, the third largest contributor after road and maritime transport (Lee et al.,
2009).
The contribution of the aviation sector to global radiative forcing takes into account
historical emissions and, therefore, provides a more accurate representation of the
sector’s contribution to anthropogenic climate change than considering CO2 emissions
alone (Penner et al., 1999). In 2005, the radiative forcing due to aviation was estimated
to be between 23 and 87 mW/m2 (excluding cirrus cloud enhancement, 90% likelihood
range with a best estimate value of 55 mW/m2), equivalent to 1.3 - 10% (3.5% best
estimate) of the total anthropogenic radiative forcing (Lee et al., 2010). This contribution
is especially significant when considering that the sector has only been commercially
active since about the 1950s, whereas some other CO2-producing sectors have been
active for over one hundred years (e.g., the coal industry). While radiative forcing
provides a more accurate representation of historical emissions, it is a difficult metric to
use in estimating future impacts.
1.3. Aviation emissions and international policy
Under the Kyoto Protocol, Annex I countries are only liable for domestic aviation
emissions that are included in a country’s National Greenhouse Gas Inventory, whilst
international aviation emissions are only required to be reported (Eggleston et al., 2006).
Under Article 2.2 of the Kyoto Protocol, Annex I parties ―shall pursue limitation or
reduction‖ of greenhouse gas emissions by working through the International Civil
Aviation Organization (ICAO) (United Nations, 1998).
It is uncertain whether global climate change agreements will include international
aviation emissions in the foreseeable future. The introduction of the aviation sector into
the European Union Emissions Trading Scheme (EU ETS) in 2012 will be the first

Personal revised version of: Howitt et al. (2011), Carbon dioxide emissions from international air freight. Paper to appear in Atmospheric Environment. NOTE: Final official version can be found using the Digital Object Identifier (DOI) listed here: doi:10.1016/j.atmosenv.2011.09.051
4
international policy measure to use binding targets that aim to reduce CO2 emissions
from aviation (Anger and Köhler, 2010). Accurate quantification should always precede
policy decisions, and it is in this regard that the present research will be informative.
1.4. Radiative forcing and metrics
Quantifying the non-CO2 climate effects that emissions have on radiative forcing is an
area of active research (Sausen et al., 2005; Forster et al., 2006; Forster et al., 2007;
Lee et al., 2009, 2010; Fuglestvedt, 2010; Wuebbles et al., 2010). Aviation emissions
cause both positive and negative changes to radiative forcing in the atmosphere. There is
currently no internationally standardised approach for accounting for the non-CO2 effects
of aviation emissions. It is for this reason that no radiative forcing metric is applied to the
calculations carried out in the present research.
1.5. Estimates of national emissions from air freight
Discussions on the regional- or product-level determination of CO2 emissions from
aviation have increased in the literature recently, particularly as part of life cycle
assessments and the sector being introduced into the EU ETS in 2012. However, there
are few peer-reviewed papers that calculate the CO2 emissions associated with a single
country’s imports and/or exports from air freight, with Andersen et al. (2010) and
Cadarso et al. (2010) being two rare examples. In both of those papers, the calculation
of air freight emissions was not the focus of the paper and neither developed a unique air
freight emissions factor. This highlights the need for more research to be done in
developing emissions factors for air freight.
1.6. Aviation and New Zealand
New Zealand is a geographically isolated island nation, and is therefore dependent on air
and maritime transport for all international movement of people and goods. For the year
ended June 2007, air freight accounted for only 0.56% and 0.45% of New Zealand’s
imports and exports, respectively, by mass (Statistics New Zealand, 2007a). However,
for the same year, air freight accounted for 21% and 15% of New Zealand’s imports and
exports, respectively, by value (Statistics New Zealand, 2007a). This indicates that high
value, low mass goods are traded internationally by air freight, with lower value, heavier
items shipped by sea. Air freight is also the preferred mode of transport for time-
sensitive goods (Sankaran, 2000).

Personal revised version of: Howitt et al. (2011), Carbon dioxide emissions from international air freight. Paper to appear in Atmospheric Environment. NOTE: Final official version can be found using the Digital Object Identifier (DOI) listed here: doi:10.1016/j.atmosenv.2011.09.051
5
Air freight can either be transported in dedicated freighters or in the lower holds of
passenger aeroplanes (―belly-hold‖, as it is referred to herein). New Zealand air freight is
mostly transported in the belly-holds of scheduled passenger services (Ministry of
Economic Development, 2005; Air New Zealand, pers. comm., 19 November 2010).
2. Methodology
2.1. Overview
The present research utilises a general methodology of multiplying the mass-distance of
commodities transported by international airfreight by CO2 emissions factors. The
authors are not aware of any other peer-review sources that outline how this
methodology is specifically applied in a global, national or regional context. Previous air
freight emissions factors that have been derived are found in non-peer reviewed sources.
There are many inputs that are used in calculating both the mass-distance of
commodities and emissions factors, some of which vary widely between sources. The
present research details one approach to calculating the mass-distance of commodities
transported by international air freight and air freight emissions factors. Many of the
important inputs and their varying quantities found in the literature are discussed, aiding
other researchers carrying out similar calculations in the future.
The 2007 calendar year was chosen as the reference year to be consistent with
international transport emissions research by other authors (Buhaug et al., 2009) as well
as the authors of the present research (Howitt et al., 2010; Fitzgerald et al., 2011a;
Fitzgerald et al., 2011b).
CO2 emissions factors were derived based on commercially-sensitive fuel uplift data from
internationally-bound aeroplanes departing Auckland, New Zealand’s largest international
airport. ―Fuel uplift‖ is an aviation industry term for the total amount of fuel taken
onboard the aeroplane before its departure (see sections 2.3 and 2.4). A comprehensive
dataset which included all of New Zealand’s air freighted imports and exports in 2007
was used to identify the mass of goods and the two airports which each good was
transported between. From this, the amount of air freight tonne-kilometres in 2007 could
be determined. The CO2 emissions factor derived from New Zealand data was then
applied to calculate the total CO2 emissions associated with New Zealand’s air freight.
2.2. Equations
Eq. 1 was used to calculate the mean CO2 emissions factor for each of the aeroplane
models represented in the fuel uplift data. Eq. 1 was applied separately for city pairs

Personal revised version of: Howitt et al. (2011), Carbon dioxide emissions from international air freight. Paper to appear in Atmospheric Environment. NOTE: Final official version can be found using the Digital Object Identifier (DOI) listed here: doi:10.1016/j.atmosenv.2011.09.051
6
which represented short- and long-haul journeys. This resulted in a mean short- and
long-haul CO2 emissions factor for each aeroplane model being calculated.
r
mmLFNd
EFm
EF
r
c fpac
fuelCOfuel
aupliftCO
c
1 max
,
),(
)(
2
2 (Eq. 1)
Where:
a (subscript) denotes a particular aeroplane model.
c (subscript) denotes a particular city pair of origin and destination airports.
r denotes the total number of city pairs of origin and destination airports.
EF(CO2,uplift)a is the emissions factor for each of the given fuel uplifts (kg CO2 per t-
km);
mfuel is the fuel uplift (kg);
EFCO2,fuel is the CO2 emissions generated from the combustion of mfuel (kg CO2 per
kg fuel);
dc is the distance flown between the origin and destination airports (km);
Nmaxa is the passenger capacity of the aeroplane (number of passengers);
LF is the passenger load factor, presented as a fraction of Nmaxa of the aeroplane;
mp is the average mass per passenger plus their luggage (t per passenger);
mf is the average mass of freight carried per passenger (t per passenger).
Eq. 2 was used to weight the mean CO2 emissions factors for each model of aeroplane
with respect to the proportions of the total journeys undertaken by each model. This was
also applied separately for short- and long-haul journeys to obtain a weighted mean CO2
emissions factor for both distance brackets.
p
a
aaupliftCOjCO XEFEF1
),( 22 (Eq. 2)
Where:
j (subscript) denotes the product journey.
EFCO2,j is the emissions factor for either a short-haul or long-haul journey
(kg CO2 per t-km).
a (subscript) denotes a particular aeroplane model.
p denotes the total number of aeroplane models.
EF(CO2,uplift)a is the emissions factor for each of the given fuel uplifts (kg CO2 per t-
km);

Personal revised version of: Howitt et al. (2011), Carbon dioxide emissions from international air freight. Paper to appear in Atmospheric Environment. NOTE: Final official version can be found using the Digital Object Identifier (DOI) listed here: doi:10.1016/j.atmosenv.2011.09.051
7
Xa is the proportion of the total aeroplane movement numbers for aeroplane
model a.
Eq. 3 was used to calculate the total CO2 emissions from New Zealand’s international air
freight.
n
j
jCOjjCO EFdmE1
,2209.1 (Eq. 3)
Where:
ECO2 is the total emissions of CO2 (kg);
mj is the mass of air freighted cargo on each journey (tonnes (t));
dj is the distance travelled by an aeroplane on each journey (km);
1.09 is the correction factor for indirect flights and circling at airports (see section
2.4);
EFCO2,j is the emissions factor for either a short-haul or long-haul journey
(kg CO2 per t-km).
2.3. Data Sources
Three main datasets were used in the present research to calculate the CO2 emissions
from New Zealand’s international air freight. The central dataset contained all of New
Zealand’s imports and exports in 2007 which were transported by air freight. This
dataset was obtained from Statistics New Zealand in the form of Harmonised System
(HS) data, specifically the ten-digit HS code (HS10) level of data. The Harmonised
System (HS) was originally developed by the World Customs Organization (WCO) as a
way of internationally standardising global merchandise (Statistics New Zealand, n.d.). In
this dataset, individual air freight journeys could not be separated out from the data, but
the total mass of HS10 goods traded between two airports was represented accurately.
Therefore, the dataset provided the required mass component of Eq. 3, as well as
providing the origin and destination airport pairs from which the air freight distance could
be calculated.
The second dataset contained typical fuel uplifts for six different aeroplane models flying
from Auckland to 31 different overseas airports. In total, 53 aeroplane’s uplifts were
represented by the data with each of the six aeroplane models having between 5 and 14
fuel uplifts each. Fuel uplift details the total amount of fuel taken onboard an aeroplane
before its departure. Such commercially-sensitive data are usually difficult for
researchers to obtain because fuel use is where airlines can gain a competitive advantage

Personal revised version of: Howitt et al. (2011), Carbon dioxide emissions from international air freight. Paper to appear in Atmospheric Environment. NOTE: Final official version can be found using the Digital Object Identifier (DOI) listed here: doi:10.1016/j.atmosenv.2011.09.051
8
(Air BP, pers. comm., 20 July 2009). In addition, confidential data were obtained from
other sources on fuel use on particular journeys by two different airlines. The confidential
data were not used in the calculations, but were used to verify that the ―typical‖ values in
the commercially-sensitive dataset were representative.
The third dataset contained aeroplane movements from Auckland, Wellington and
Christchurch international airports over two one-week periods in 2007 (March and
September), obtained from the New Zealand Ministry of Transport. Aeroplane schedules
at a given airport are kept reasonably constant within the two major seasons that the
international aviation industry observes: northern hemisphere winter and summer
(Ministry of Transport, pers. comm., 12 August 2009). The two one-week periods of
aeroplane movements included in the dataset were representative of each of those two
seasons. This dataset was used to weight each of the aeroplane-specific CO2 emissions
factors derived from the fuel uplift data with respect to each aeroplane’s relative
utilisation in New Zealand in 2007.
2.4. Calculation of air freight emissions factors
The proportion of air freight transported by dedicated freighters and belly-hold could not
be determined from the HS10 dataset due to Customs New Zealand and Statistics New
Zealand not recording which mode air freight is transported by (Statistics New Zealand,
pers. comm., 19 November 2010). The methodology of the current research considers all
of New Zealand’s air freight to be transported as belly-hold cargo, and this is represented
by the formulation of Eq. 1. This assumption will be discussed in section 2.6.
The following paragraphs discuss each of the variables in Eq. 1 for calculating the CO2
emissions factor for each fuel uplift, followed by how these emissions factors were
weighted to get an overall short- and long-haul CO2 emissions factor for New Zealand’s
air freight.
The fuel uplift for each aeroplane’s journey was provided directly from the data obtained.
Generally, aeroplanes carry only the amount of fuel required to get them from their point
of departure to destination, plus a given amount of extra fuel as a safety margin. This is
because carrying any additional fuel unnecessarily increases the mass of the aeroplane,
increasing the amount of fuel required during the flight. Aeroplanes bound for an
international destination from Auckland airport would generally refuel before departure,
unless there was the unusual problem of there being a lack of supply (Auckland Airport,
pers. comm., 20 July 2009).

Personal revised version of: Howitt et al. (2011), Carbon dioxide emissions from international air freight. Paper to appear in Atmospheric Environment. NOTE: Final official version can be found using the Digital Object Identifier (DOI) listed here: doi:10.1016/j.atmosenv.2011.09.051
9
If it is assumed that aeroplanes hold a constant amount of additional fuel as a safety
margin, then the fuel uplift should be equivalent to the amount of fuel consumed on each
journey. However, when the fuel uplifts were weighted by the distance travelled for each
of the six aeroplane models, six of the 53 aeroplane uplifts were noticeable outliers as
their fuel uplift per km was approximately twice as large as the smallest values for the
same aeroplane model. These six fuel uplifts each represented journeys from Auckland to
an airport in a small Pacific Island country or territory; Norfolk Island, Noumea, Tonga,
Rarotonga and Papeete. There are three plausible explanations which could lead airlines
to uplift more fuel than what is required for only the one-way journey to these locations:
due to their small size, these airports have no, or a limited supply of, aviation fuel; the
fuel at these locations is more expensive than at Auckland, making it more economical to
uplift fuel for the return journey also; and/or they may have to carry an additional
amount of fuel to reach a different Pacific Island airport in case of emergency. These six
outliers were therefore excluded from the calculation of CO2 emissions factors due to
their fuel uplifts not representing the fuel consumed during the one-way leg.
The CO2 emissions factor for the combustion of aviation fuel used in the present research
was 3.157 kg CO2 per kg fuel (ICAO, 2009a; Jardine, 2009).
The distance each aeroplane travelled between a New Zealand airport and the given
overseas airport was determined from the airport pair’s latitudes and longitudes and the
Great Circle Distance between the two (see section 2.5). There is currently no
internationally standardised methodology for accounting for the deviation of actual flights
from Great Circle Distances. Penner et al. (1999) state an average factor of 1.09, citing
EUROCONTROL (1992). ICAO endorse three discrete correction factors which depend on
the distance of the flight (ICAO, 2009a), which has subsequently been adopted by the
Australian Department of Infrastructure, Transport, Regional Development and Local
Government for official reporting purposes (Department of Infrastructure, Transport,
Regional Development and Local Government, 2010). The Civil Air Navigation Services
Organisation (CANSO) report a 92% - 94% global average Air Traffic Management (ATM)
efficiency in 2007 (CANSO, 2008), which correspond to correction factors of 1.087 –
1.064, respectively. EUROCONTROL (2010) state an average route extension from the
Great Circle Path of 5.8% (corresponding to a factor of 1.058) in Europe in 2007. The
present research has adopted the recommendation from the Ministry for the Environment
of using the factor of 1.09 from Penner et al. (1999), which is recognised to represent a
conservative (over)estimate for New Zealand (Ministry for the Environment, 2011).
The passenger capacity of each of the six aeroplane models were obtained from their
respective manufacturer’s websites (Boeing, 2009; Airbus S.A.S., 2010). If there was

Personal revised version of: Howitt et al. (2011), Carbon dioxide emissions from international air freight. Paper to appear in Atmospheric Environment. NOTE: Final official version can be found using the Digital Object Identifier (DOI) listed here: doi:10.1016/j.atmosenv.2011.09.051
10
more than one version of aeroplane per model operating to and from New Zealand (e.g.,
B737-300, B737-700 and B737-800), an average passenger capacity for the model was
obtained from weighting each version’s capacity relative to the New Zealand aeroplane
movement datasets.
All aeroplane journeys were assumed to have a passenger load factor of 79%. Passenger
load factor represents the percentage of the passenger capacity which is occupied and
this average value was based on load factors presented in Air New Zealand’s 2008
Annual Financial Report (Air New Zealand, 2008). This load factor lies between the values
used by DEFRA (2008) for short-haul (81%) and long-haul (78%) and is the same as the
average passenger load factor in 2007 in the US (79%) reported by Hileman et al.
(2008). It is also compares well with the 80% passenger load factor given by the
Singapore Airlines and Qantas annual reports for the 2007-2008 period (Singapore
Airlines, 2008; Qantas, 2008).
Each passenger, including luggage, was assumed to have a mass of 100 kg. This is the
average passenger mass recommended by ICAO (ICAO, 2009b) and is the same
assumption used in ICAO (2009a), DEFRA (2008) and Ross (2009). A 2003 study of New
Zealand domestic airline passengers’ masses quantified a mean mass of 88.2 kg per
passenger, including carry-on luggage (NFO New Zealand, 2003). Due to that study
excluding the mass of non carry-on luggage, it was not able to be incorporated into the
present research. However, an average mass of around 88 kg per passenger does leave
a plausible mean mass of 12 kg of non-carry-on luggage per passenger.
Both ICAO (2009a) and DEFRA (2008) add a certain amount of mass per passenger
(50 kg and approximately 200 kg, respectively) to account for passenger facilities
onboard, such as seats and galleys, when accounting for air freight. However, in the
methodology adopted in the present research it was decided not to include a mass factor
for the passenger facilities on the aeroplane. This is because most of New Zealand’s
international cargo is transported as belly-hold on scheduled passenger services, and so
the mass of seats and galleys were considered to be an essential part of the operation of
the service. In a similar way, the additional mass embedded in the freight facilities of the
belly-hold, such as containers and machinery, was not taken into account.
The mass of air freighted cargo onboard each aeroplane was assumed to be 24 kg per
passenger. This was calculated by assuming that all air freight was transported as belly-
hold on scheduled passenger services. The total mass of New Zealand’s air freight in the
2007 calendar year was calculated from the HS10 dataset to be 206,547 tonnes. The
total number of international arrivals and departures in 2007 from Auckland, Wellington

Personal revised version of: Howitt et al. (2011), Carbon dioxide emissions from international air freight. Paper to appear in Atmospheric Environment. NOTE: Final official version can be found using the Digital Object Identifier (DOI) listed here: doi:10.1016/j.atmosenv.2011.09.051
11
and Christchurch International Airports was 8.668 million passengers (Statistics New
Zealand, 2007b). Therefore the 2007 mean amount of air freight per passenger was
calculated as 24 kg per passenger (2 s.f.). Jardine (2009) notes that publicly available
industry data on freight loads are rare, but states that freight factors are typically 15-
30% for wide-bodied aeroplanes, and the value of 24% (24 kg freight per 100 kg
passenger) found in the current research lies within this range.
Data on aeroplane movements over two representative one-week periods in 2007
provided a break-down of the models of aeroplane which fly short- and/or long-haul
routes to and from New Zealand. There is currently no internationally standardised
definition for short- and long-haul air travel. DEFRA (2008) defines a cut-off between
short- and long-haul flights at 3700 km and Jardine (2005) defines the cut-off to be at
3500 km. The present research uses the DEFRA (2008) definition for short- and long-
haul aeroplane journeys. The relative proportions of each aeroplane model to the total
journeys made by short- or long-haul journeys in New Zealand were calculated and were
used to represent the weighting of each aeroplane model (Xa in Eq. 2).
From the inputs discussed in this section, Equations 1 and 2 were used to calculate the
CO2 emissions factor for air freight for short- and long-haul journeys.
2.5. Calculation of New Zealand’s air freight emissions
Auckland (AKL), Christchurch (CHC), and Wellington (WLG) international airports account
for almost all of the air freight that is imported to and exported from New Zealand
(Statistics New Zealand, 2008). These three airports accounted for 99.999% of all
imports and 99.99% of all exports by gross mass in the 2007 HS10 dataset. Therefore, it
was decided that the calculation of CO2 emissions from air freight would use AKL, CHC
and WLG as the New Zealand origin/destination airports, with the remaining New Zealand
airports being ignored, as their contribution to the final result was considered to be
negligible.
In total, the HS10 dataset contained 1,868 airports which were the previous departure
point for imports and 1,118 airports which were the next destination for exports in the
year 2007. It was decided that it would be more manageable to use the representative
airports in the origin or destination countries or territories rather than the detailed listing
of airports. There were 205 countries or territories of origin for both imports and exports
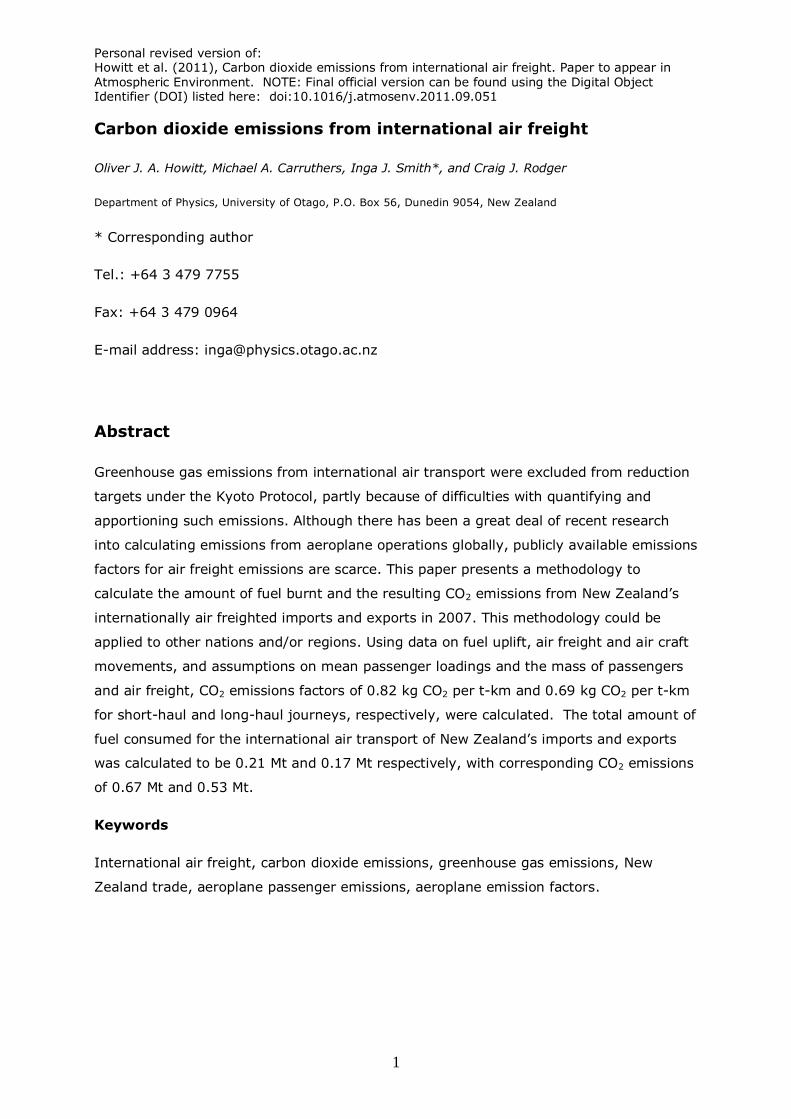
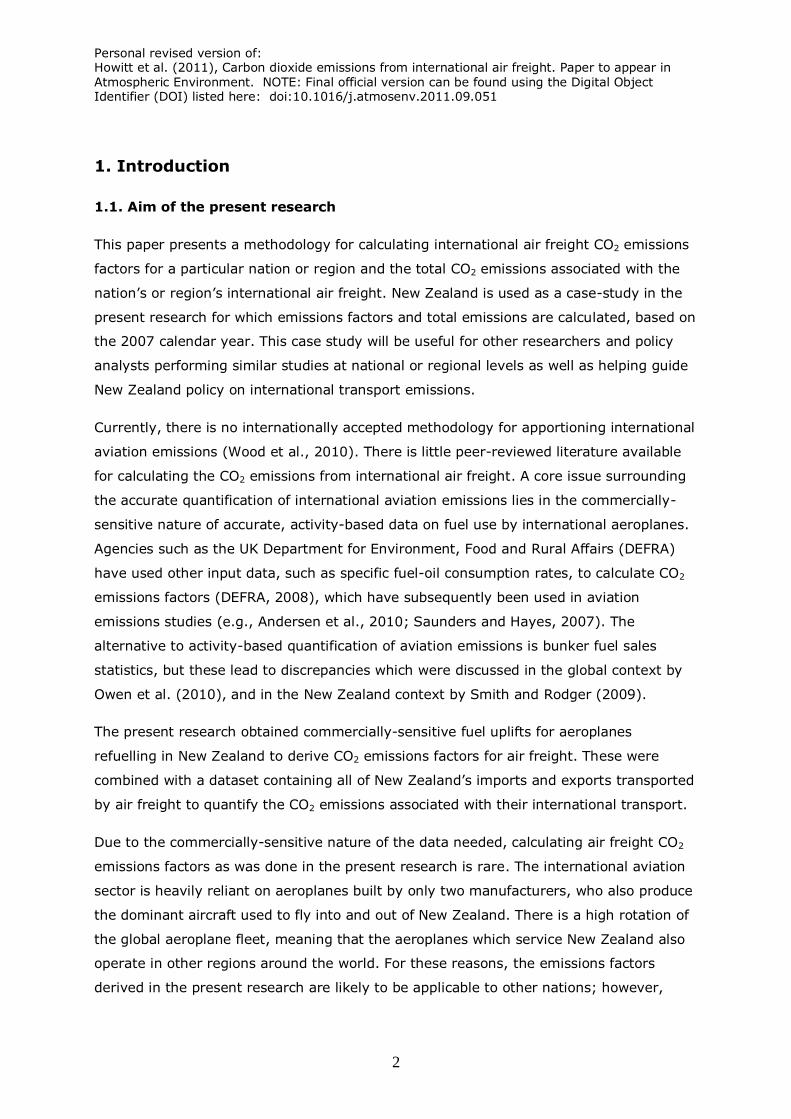
in the year 2007. Of these 205 countries or territories, it was calculated that 20 countries
or territories accounted for over 92% of the imports and exports in terms of gross mass
(shown by Figures 1 and 2, respectively). Mass, rather than value or volume, was used in
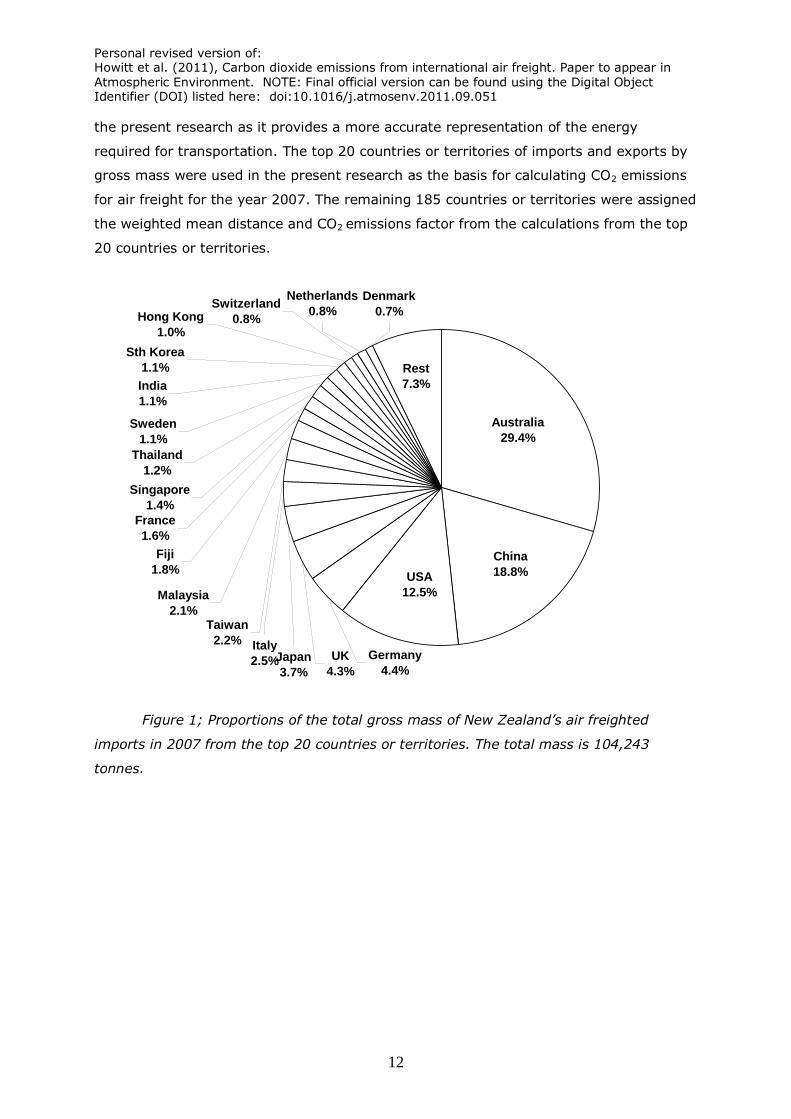
Personal revised version of: Howitt et al. (2011), Carbon dioxide emissions from international air freight. Paper to appear in Atmospheric Environment. NOTE: Final official version can be found using the Digital Object Identifier (DOI) listed here: doi:10.1016/j.atmosenv.2011.09.051
12
the present research as it provides a more accurate representation of the energy
required for transportation. The top 20 countries or territories of imports and exports by
gross mass were used in the present research as the basis for calculating CO2 emissions
for air freight for the year 2007. The remaining 185 countries or territories were assigned
the weighted mean distance and CO2 emissions factor from the calculations from the top
20 countries or territories.
Rest
7.3%
Australia
29.4%
China
18.8%USA
12.5%
Germany
4.4%
UK
4.3%Japan
3.7%
Italy
2.5%
Taiwan
2.2%
Malaysia
2.1%
Fiji
1.8%
France
1.6%
Singapore
1.4%
Thailand
1.2%
Sweden
1.1%
India
1.1%
Sth Korea
1.1%
Hong Kong
1.0%
Switzerland
0.8%
Netherlands
0.8%
Denmark
0.7%
Figure 1; Proportions of the total gross mass of New Zealand’s air freighted
imports in 2007 from the top 20 countries or territories. The total mass is 104,243
tonnes.

Personal revised version of: Howitt et al. (2011), Carbon dioxide emissions from international air freight. Paper to appear in Atmospheric Environment. NOTE: Final official version can be found using the Digital Object Identifier (DOI) listed here: doi:10.1016/j.atmosenv.2011.09.051
13
Rest
7.8%
Australia
42.3%
USA
12.7%
Japan
9.7%
Hong Kong
6.0%UK
3.0%
Singapore
2.1%
Switzerland
2.0%
Sth Korea
1.7%
Fiji
1.6%
Taiwan
1.5%
Germany
1.4%
China
1.1%
Cook Islands
1.0%
French Polynesia
0.9%
Malaysia
0.9%
Canada
0.9%
Thailand
0.9%
France
0.8%
UAE
0.8%
Italy
0.7%
Figure 2; Proportions of the total gross mass of New Zealand’s air freighted
exports in 2007 to the top 20 countries or territories. The total mass is 102,303 tonnes.
Figures 1 and 2 show that the four most dominant international trading partners by mass
for air freight in New Zealand in 2007 were Australia, USA, Japan and China, together
accounting for approximately two-thirds of imports and exports.
The representative airport for each country or territory was chosen by the combination of
three factors: the passenger volume of each airport, accessibility of New Zealand airlines
to each airport and the geographical location of each airport. Airports with a larger
passenger volume were favoured over airports with smaller passenger volumes.
Passenger volumes were used because of the fact that international air freight carried as
belly-hold on passenger flights accounts for nearly five times more tonne-kilometres than
air freight carried on international dedicated long-haul cargo services (DEFRA, 2008), and
accounts for an even higher proportion in New Zealand (Air New Zealand, pers. comm.,
19 November 2010). Representative airports also had to be accessible to airlines that
service New Zealand; therefore some airports with a lower passenger volume were
chosen over the countries’ busiest international airports because they were the entry
point for airlines that service New Zealand. The representative airport for each country or
territory had to also be one of the closest to New Zealand, therefore making it the most

Personal revised version of: Howitt et al. (2011), Carbon dioxide emissions from international air freight. Paper to appear in Atmospheric Environment. NOTE: Final official version can be found using the Digital Object Identifier (DOI) listed here: doi:10.1016/j.atmosenv.2011.09.051
14
likely entry point for airlines servicing New Zealand. This is justified in the context of the
present research as the aim is to quantify the emissions associated with international
transport, which are not liable under the Kyoto Protocol. The emissions associated with
any domestic air freight journeys undertaken after the goods enter the overseas country
of destination for exports and New Zealand for imports are currently liable under the
Kyoto Protocol and should be accounted for in national greenhouse gas inventories
already. As an example of these selection criteria, the representative airport for the USA
in the present research was Los Angeles International Airport (LAX), while the busiest
international passenger airport in the USA is John F. Kennedy International Airport (JFK)
(US Department of Transportation, 2006). LAX was chosen because it is closer to New
Zealand and more accessible to the airlines which service New Zealand.
By making use of the three New Zealand international airports and the 20 representative
overseas airports, journey distances were calculated between each appropriate airport
pair for each commodity imported or exported by air freight in the year 2007. Distances
between each of the airport pairs were calculated using the WGS-84 method. To
determine these distances, the latitude and longitude coordinates of the airport pairs
were required. These data were obtained from the Global Airport Database, an online
database that provided latitude and longitude coordinates for 9,300 airports worldwide
(Partow, 2003). This was used in the absence of a publicly available database of this
information from regulatory or industry bodies, such as ICAO.
The derived short- or long-haul CO2 emissions factor was assigned to each of the 20
countries or territories and the CO2 emissions for each imported or exported good’s
journey was calculated by using Eq. 3. Using the total mass and mass-distance of air
freighted imports and exports from the top 20 overseas countries or territories, a
weighted average distance was calculated and applied to the remaining 185 countries or
territories. Similarly, from the total CO2 emissions and mass-distance of the top 20
countries or territories a weighted mean CO2 emissions factor could be calculated and
applied to the remaining countries or territories.
The total CO2 emissions was converted back into the mass of fuel consumed by using the
conversion factor of 3.157 kg CO2 per kg of aviation fuel burnt. The gross energy content
of the fuel burn was calculated from the conversion factor of 46.23 MJ per kg of
aviation fuel (Ministry of Economic Development, 2009).
2.6. Uncertainties

Personal revised version of: Howitt et al. (2011), Carbon dioxide emissions from international air freight. Paper to appear in Atmospheric Environment. NOTE: Final official version can be found using the Digital Object Identifier (DOI) listed here: doi:10.1016/j.atmosenv.2011.09.051
15
An assumption was made in the present research that all air freight was transported as
belly-hold on scheduled passenger services. This is a simplification due to some unknown
fraction of air freight being transported by dedicated air-freighters. In 2007 there were at
least five airlines which included dedicated freight services in and out of New Zealand (Air
New Zealand, pers. comm., 19 November 2010). However, by mass, these services only
accounted for approximately 5% of New Zealand’s air freight in the same year (Air New
Zealand, pers. comm., 19 November 2010). Therefore, it was considered that the belly-
hold assumption provided a very good first-order approximation for the calculation of CO2
emissions from New Zealand’s air freight.
The dominant uncertainty in the calculation of the total emissions from New Zealand’s air
freight was the distance between the origin and destination of the goods (dj in Eq. 3).
Due to the methodology of the present research, air freighted imports or exports which
included one or more stopover would have their total distance, and therefore CO2
emissions, underestimated.
The distance, and CO2 emissions, for air freighted imports or exports originating from or
destined to an overseas airport which was not the representative airport chosen for the
country or territory, would be underestimated. This is because the closest major
overseas airport to New Zealand was chosen.
The present research used the mean distance and emissions factor from the top 20
countries or territories by mass to calculate the CO2 emissions from the remaining 185
countries or territories, representing about 7.5% of the total mass of goods. These
approximations would be inaccurate if the mean distance and emissions factor from the
top 20 countries were not representative of the remaining countries.
Due to one country’s export being another country’s import, if the methodology of the
present research was applied to all the countries that traded with New Zealand then the
total calculated emissions would be twice the real total due to double-counting. Note that
the emissions from the aviation sector included in the EU ETS could also be double-
counted if other countries took a similar approach. Dividing up these emissions
internationally is a policy issue rather than a science issue, and therefore is not explored
in this paper.
3. Results
3.1. New Zealand aeroplane movements

Personal revised version of: Howitt et al. (2011), Carbon dioxide emissions from international air freight. Paper to appear in Atmospheric Environment. NOTE: Final official version can be found using the Digital Object Identifier (DOI) listed here: doi:10.1016/j.atmosenv.2011.09.051
16
The geographical location of New Zealand results in the average distance needed to fly
between New Zealand and an overseas destination being considerably larger than for
many other countries. As a result of this, of the top 20 countries or territories for imports
and exports, only Australia, Fiji and the Cook Islands were short-haul international
journeys. These countries combined accounted for 34% and 49% of the gross mass of air
freighted imports and exports, respectively, from the top 20 countries. Therefore, 66%
and 51% of the gross mass of New Zealand’s air freighted exports and imports,
respectively, from the top 20 countries travel long-haul distances.
The analysis of the two representative one-week periods of international aeroplane
movements to and from three New Zealand airports in 2007 is shown by Figure 3 for
short-haul journeys and by Figure 4 for long-haul journeys.
Airbus 320
44.2%
Boeing 737
22.6%
Boeing 767
21.0%
Boeing 747
5.3%
Airbus 340
3.6%
Boeing 777
3.2%
Figure 3; Proportions of international short-haul aeroplane movements from six
aeroplane models in New Zealand in 2007. The total number of movements
represented in the two weeks covered by the dataset was 561.

Personal revised version of: Howitt et al. (2011), Carbon dioxide emissions from international air freight. Paper to appear in Atmospheric Environment. NOTE: Final official version can be found using the Digital Object Identifier (DOI) listed here: doi:10.1016/j.atmosenv.2011.09.051
17
Boeing 767
11.5%
Boeing 747
13.6%
Airbus 320
14.0%
Boeing 737
14.7%
Airbus 340
16.8%
Boeing 777
29.4%
Figure 4; Proportions of international long-haul aeroplane movements from six
aeroplane models in New Zealand in 2007. The total number of movements
represented in the two weeks covered by the dataset was 470.
Figures 3 and 4 show that the Airbus 320 and Boeing 777 undertook the greatest share
of New Zealand international short- and long- haul journeys, respectively. The proportion
of journeys shown by Figures 3 and 4 were used in Eq. 2 to calculate the New Zealand-
specific emissions factor.
3.2 Air Freight CO2 emissions factors
The present research calculated CO2 emissions factors for international air freight to be
0.82 kg CO2 per tonne-kilometre (kg CO2 per t-km) for short-haul journeys and
0.69 kg CO2 per t-km for long-haul journeys, based on New Zealand fuel uplift data.
Table 1 shows the air freight emissions factors calculated in the present research
compared with other emissions factors from various sources.

Personal revised version of: Howitt et al. (2011), Carbon dioxide emissions from international air freight. Paper to appear in Atmospheric Environment. NOTE: Final official version can be found using the Digital Object Identifier (DOI) listed here: doi:10.1016/j.atmosenv.2011.09.051
18
Table 1; Air freight emissions factors calculated in the present research and from
other sources.
Source
Emissions Factor (kg CO2 per t-km) Comments
1 2
This research
0.82 0.69 1) Short-haul; 2) Long-haul. Specific to the aeroplane fleet flying to and from New Zealand in 2007. Based on fuel uplift data.
Defra (2008)
1.32 0.61 1) Short-haul; 2) Long-haul. Based on the UK's aeroplane fleet and uses specific fuel-oil consumption rates.
Cadarso et
al. (2010) 0.54
Value taken from an online calculator which
does not disclose its methodology.
Buhaug et al. (2009)
0.435-0.474
1.1-1.8 Calculations based on particular freighter aeroplanes: 1) Boeing 747 F; 2) Ilyushin IL 76T.
Facanha and Horvath (2006)
0.66
Calculated for Boeing 747's and average utilisation factors (value converted from 68% of 1410 g CO2 per ton-mile, where 68% was
used to exclude other life-cycle components in the original value)
Hileman et al. (2008)
1.0
2007 US Fleet-wide average, calculated based on data from the US Department of Transportation, Bureau of Transportation Statistics (value converted from 66 kg-km/MJ)
The DEFRA (2008) methodology has been applied in many studies worldwide, including
being used in air freight life-cycle analyses (e.g., Saunders and Hayes, 2007). With
respect to the emissions factors derived in DEFRA (2008), the emissions factors
calculated in the present research are 38% lower and 13% higher for short-haul and
long-haul air freight journeys, respectively. These differences arise from the different
calculation methodologies and the different characteristics of the aviation industry in New
Zealand and in the UK.
Although the air freight emissions factors calculated in the present research were specific
to the fleet of aeroplanes which serviced New Zealand in 2007, they could be used in
future studies in other regions and for different time periods; however more research is
required to verify this.
In addition to this, the emissions factors derived in the present research could be applied
equally to passengers and be used to calculate the CO2 emissions resulting from
passenger flights. This is because both passengers and air freight were treated on an

Personal revised version of: Howitt et al. (2011), Carbon dioxide emissions from international air freight. Paper to appear in Atmospheric Environment. NOTE: Final official version can be found using the Digital Object Identifier (DOI) listed here: doi:10.1016/j.atmosenv.2011.09.051
19
equal mass basis and the cargo was treated as if it was in the belly-hold of scheduled
passenger services. Since each passenger was assumed to weigh 100 kg (including
luggage), the CO2 emissions factors for passengers are equal to 82 g CO2 per passenger-
km (g CO2 per p-km) and 69 g CO2 per p-km for short- and long-haul flights,
respectively.
3.3 CO2 Emissions from New Zealand’s air freight
International air freight between New Zealand and the top 20 countries or territories for
imports and exports were calculated to travel a weighted mean distance of 8504 km and
6695 km, respectively (not including the factor of 1.09 for circling/indirect routes). Due
to the greater mass-distance travelled by long-haul journeys compared to short-haul, the
weighted mean emissions factors for the top 20 countries or territories were close to that
for long-haul journeys at 0.70 kg CO2 per t-km and 0.71 kg CO2 per t-km for imports and
exports, respectively. These are the mean values which were used for all distances, dj,
and emissions factors, EFCO2,j, in Eq. 3 for the remaining 185 countries or territories.
Through this research, 0.67 Mt and 0.53 Mt of CO2 emissions were estimated to have
been generated by air freighted imports and exports, respectively, to and from New
Zealand in the year 2007. A summary of the results for the fuel consumption and CO2
emissions is shown in Table 2.
Table 2; Results for the calculation of the amount of fuel consumed and CO2
emissions from New Zealand’s international air freight in 2007. Values to 2 s.f.
Aviation Fuel Consumed (Million L)
Aviation Fuel Consumed (Mt)
Aviation Fuel Gross Energy (PJ)
CO2 Emissions (Mt)
Imports 260 0.21 9.7 0.67
Exports 200 0.17 7.7 0.53
Total 460 0.38 17.4 1.2
Imports contributed 56% to the overall CO2 emissions and fuel consumption, and exports
the remaining 44%.
A breakdown of the top 10 countries or territories for CO2 emissions from New Zealand’s
imports and exports in 2007 is shown by Figures 5 and 6, respectively. Due to the direct
conversion of aviation fuel to CO2 emissions, Figures 5 and 6 are identical (with a
different total) for the fuel consumed per country.

Personal revised version of: Howitt et al. (2011), Carbon dioxide emissions from international air freight. Paper to appear in Atmospheric Environment. NOTE: Final official version can be found using the Digital Object Identifier (DOI) listed here: doi:10.1016/j.atmosenv.2011.09.051
20
China
20.4%
USA
15.2%
UK
9.2%
Australia
8.7%
Germany
8.0%
Italy
5.3%Japan
3.7%
France
3.4%
Taiwan
2.3%
Sweden
2.2%
Rest
21.4%
Figure 5; Top 10 countries for the CO2 emissions generated from the air freight of
New Zealand’s imports in 2007. The total CO2 emissions are 0.67 Mt.

Personal revised version of: Howitt et al. (2011), Carbon dioxide emissions from international air freight. Paper to appear in Atmospheric Environment. NOTE: Final official version can be found using the Digital Object Identifier (DOI) listed here: doi:10.1016/j.atmosenv.2011.09.051
21
Rest
20.7%USA
19.4%
Australia
15.7%
Japan
12.5%
Hong Kong
8.1%
UK
7.9%
Switzerland
5.4%
Germany
3.1%
Singapore
2.6%
Sth Korea
2.4%
France
2.2%
Figure 6; Top 10 countries for the CO2 emissions generated from the air freight of
New Zealand’s exports in 2007. The total CO2 emissions are 0.53 Mt.
Tables 3 and 4 show the breakdown of CO2 emissions generated by commodity for
imports and exports, respectively. Note that the breakdown is based on the chapter titles
(HS2) of each of the commodities and each value of CO2 emissions can be converted into
fuel consumed by dividing by the conversion factor of 3.157 kg CO2 per kg of aviation
fuel.

Personal revised version of: Howitt et al. (2011), Carbon dioxide emissions from international air freight. Paper to appear in Atmospheric Environment. NOTE: Final official version can be found using the Digital Object Identifier (DOI) listed here: doi:10.1016/j.atmosenv.2011.09.051
22
Table 3; CO2 emissions generated from the top 10 air freighted import commodities to
New Zealand in 2007. Values rounded to 3 s.f., but percentages calculated based on
unrounded values.
Chapter Title
Description CO2 (tonnes)
%
84 Boilers, Machinery and Mechanical Appliances
142,000 21.0%
85 Electrical Machinery 91,600 13.6%
49 Books, Newspapers, Manuscripts & Plans
46,900 6.9%
61 Knitted Apparel 28,600 4.2%
39 Plastics 26,800 4.0%
62 Non-Knitted Apparel 25,800 3.8%
90 Surgical and Medical Instruments
25,500 3.8%
30 Pharmaceutical Products 23,400 3.5%
87 Vehicle Accessories 18,600 2.8%
33 Essential Oils and Cosmetics
18,100 2.7%
Rest 228,000 33.8%
TOTAL 675,000 100.0%

Personal revised version of: Howitt et al. (2011), Carbon dioxide emissions from international air freight. Paper to appear in Atmospheric Environment. NOTE: Final official version can be found using the Digital Object Identifier (DOI) listed here: doi:10.1016/j.atmosenv.2011.09.051
23
Table 4; CO2 emissions generated from the top 10 air freighted export commodities from
New Zealand in 2007. Values rounded to 3 s.f., but percentages calculated based on
unrounded values.
Chapter Title
Description CO2 (tonnes)
%
03 Fish, Crustaceans and Molluscs
102,000 19.3%
02 Meat 61,800 11.7%
07 Vegetables 50,600 9.6%
08 Fruit and Nuts 40,900 7.7%
84 Boilers, Machinery and Mechanical Appliances
36,600 6.9%
04 Dairy Produce 28,600 5.4%
85 Electrical Machinery 22,400 4.2%
06 Live Trees and Plants 21,500 4.1%
90 Surgical and Medical Instruments
20,500 3.9%
39 Plastics 13,800 2.6%
Rest 130,000 24.6%
TOTAL 529,000 100.0%
As shown by Table 3, mechanical appliances, electrical machinery and books,
newspapers, manuscripts and plans were the three largest contributors to CO2 emissions
from imports, contributing over 40% of the total. For exports, five of the top six
contributors were food products, together contributing to over half of the total CO2
emissions. Mechanical appliances and electrical machinery often have a high value-to-
mass ratio and books, newspapers, manuscripts and plans, and food products are often
time-sensitive, perhaps explaining the choice of air freight over maritime transportation.
3.4 Intercomparison of CO2 emissions from international transport modes to
and from New Zealand
The CO2 emissions calculated in the current research can be compared to the emissions
from international maritime transportation and international aviation passenger
transport.
Fitzgerald et al. (2011a) calculated the CO2 emissions from the international maritime
transportation of New Zealand’s imports and exports in 2007 to be 2.9 Mt and 4.8 Mt of
CO2, respectively, totalling 7.7 Mt. Therefore, including the results from the present
research, the international transport of New Zealand’s imports and exports in 2007
generated approximately 8.9 Mt of CO2 in total, of which 3.6 Mt and 5.3 Mt was from

Personal revised version of: Howitt et al. (2011), Carbon dioxide emissions from international air freight. Paper to appear in Atmospheric Environment. NOTE: Final official version can be found using the Digital Object Identifier (DOI) listed here: doi:10.1016/j.atmosenv.2011.09.051
24
imports and exports, respectively (air freight comprising 13%, 19%, and 10%, of the
three totals, respectively). Maritime transportation accounted for 99.5% of the total mass
of New Zealand’s imports and exports in 2007 (i.e. 200 times more mass than air
freight), but only 87% of the CO2 emissions. This difference is predominantly because of
the relative CO2 efficiencies of the two modes of transportation; the mean emissions
factor in Fitzgerald et al. (2011a) was 17 g CO2 per t-km for maritime transportation,
compared to 820 g CO2 per t-km and 690 g CO2 per t-km for short- and long-haul air
freight, respectively, in the present research.
Smith and Rodger (2009) calculated the CO2 emissions for tourists travelling to and from
New Zealand, and for New Zealand residents travelling overseas and returning, by air in
2005. In order to compare with the present research, it was necessary to gather
additional data on the number of tourists entering New Zealand in the year 2007, as well
as updating the emissions factors used by the model to utilise the emissions factors
derived in the present research. As outlined in section 3.2, the emissions factors derived
in the present research are applicable to passengers also and were calculated to be
82 g CO2 per p-km and 69 g CO2 per p-km for short- and long-haul flights, respectively.
The updated data were entered into the Smith and Rodger (2009) model, which
calculated the total emissions to be 4.3 Mt CO2 emissions for the year 2007 (2.9 Mt from
international visitors and 1.4 Mt from New Zealand residents). Combined with the results
from the present research, the international aviation transportation of people and goods
to and from New Zealand in 2007 produced 5.5 Mt CO2 emissions, 22% of which was
from international air freight.
4. Conclusion
The climate impacts of international aviation due to the emissions of CO2 are currently
not liable under any global agreements. An increase in research into the CO2 emissions
from aviation in recent years has been due to interest in quantifying air transport’s
climate impacts, as well as increased use of product life-cycle assessments and the
impending addition of the aviation sector into the EU ETS. However, there is minimal
peer-reviewed literature on air freight CO2 emissions factors and the CO2 emissions from
a single country. The present research calculated CO2 emissions factors and the total
emissions from one country’s air freighted imports and exports, based on New Zealand in
the year 2007.
Fuel uplift data, which are usually difficult for researchers to obtain due to commercial
sensitivity, were used in the present research to calculate CO2 emissions factors for air
freight. The New Zealand international aviation industry transports most of its air freight

Personal revised version of: Howitt et al. (2011), Carbon dioxide emissions from international air freight. Paper to appear in Atmospheric Environment. NOTE: Final official version can be found using the Digital Object Identifier (DOI) listed here: doi:10.1016/j.atmosenv.2011.09.051
25
as belly-hold in aeroplanes carrying out scheduled passenger services. New Zealand’s air
freighted imports and exports travelled from and to 205 countries or territories in 2007;
however 20 countries and territories together accounted for over 92% of the total mass
of imports and exports. These 20 countries or territories were used as the basis for
calculating the total CO2 emissions from New Zealand’s air freight in 2007.
International air freight emissions factors of 0.82 kg CO2 per t-km for short-haul journeys
and 0.69 kg CO2 per t-km for long-haul journeys were derived in the current research
from New Zealand fuel uplift data, air freight and aeroplane movements data, and
assumptions on mean passenger loadings and the mass of passengers and air freight.
These emissions factors were applied to all New Zealand’s air freighted imports and
exports for the year 2007, from which it was calculated that a total of 460 million litres or
0.38 Mt of fuel was used. This fuel use resulted in the emission of 1.2 Mt of CO2. Of these
totals, 44% was attributable to air freighted exports and 56% to air freighted imports.
The high level of rotation of aeroplanes on international routes, and the relatively long
life of aeroplanes, means that the New Zealand-specific emissions factors should be
relevant to research in other countries and regions. Further, this paper lays out a
methodology for researchers who wish to carry out a similar regional analysis, including
highlighting potential uncertainties and data access barriers.
Acknowledgements
The authors acknowledge the Statistics New Zealand Student Assistance Scheme for
providing HS10 data for the present research through a data scholarship awarded to
M.A.C. The authors thank the Transport Research and Educational Trust for providing
funding at an early stage in this research. The University of Otago Department of Physics
2009 Summer Research Bursary scheme, the Tertiary Education Commission and
University of Otago 2010 Matched Funding Summer Scholarship scheme and the Otago
Energy Research Centre 2010 Summer Research Bursary Scheme provided financial
support for O.J.A.H.’s involvement in this research. In addition, the authors wish to
acknowledge all the external organisations that have facilitated access to the data which
was used in this study. These organisations include Statistics New Zealand, the New
Zealand Ministry of Transport, Air BP and Air New Zealand. Thanks specifically to Vincent
Revol, David Duval and John Macilree for their help throughout the present research.
Sincere thanks to the two anonymous reviewers who provided valuable insight into an
earlier version of the manuscript. Whilst acknowledging the contribution of these people
and organisations, the results presented in this paper are solely the responsibility of the
authors.

Personal revised version of: Howitt et al. (2011), Carbon dioxide emissions from international air freight. Paper to appear in Atmospheric Environment. NOTE: Final official version can be found using the Digital Object Identifier (DOI) listed here: doi:10.1016/j.atmosenv.2011.09.051
26
References
Air New Zealand, 2008. 2008 Annual Financial Results. Downloaded from:
<www.airnewzealand.co.nz/assets/Resources-AirNZ/Investor-Centre/2008-
annual-financial-report.pdf> [accessed 5th November 2010].
Airbus S.A.S., 2010. Airbus – Aircraft Families: Product Viewer [online]. Available from:
<www.airbus.com/en/aircraftfamilies/productcompare/> [accessed 25th
November 2010].
Andersen, O., Gössling, S., Simonsen, M., Walnum, H.J., Peeters, P., Neiberger, C.,
2010. CO2 Emissions from the Transport of China’s Exported Goods, Energy
Policy, 38, 5790-5798, doi:10.1016/j.enpol.2010.05.030.
Anger, A., Köhler, J., 2010. Including Aviation Emissions in the EU ETS: Much ado about
Anything? A Review, Transport Policy, 17, 38-46.
Boeing, 2009. Boeing: Commercial Airplanes – Products [online]. Available from:
<www.boeing.com/commercial/products.html> [accessed 14th December 2009].
Buhaug, Ø., Corbett, J. J., Endresen, Ø., Eyring, V., Faber, J., Hanayama, S., Lee, D. S.,
Lee, D., Lindstad, H., Markowska, A. Z., Mjelde, A., Nelissen, D., Nilsen, J.,
Pålsson, C., Winebrake, J. J., Wu, W. Q., Yoshida, K., 2009. Second IMO GHG
study 2009. International Maritime Organization, London.
Cadarso, M-A., López, L-A., Gómez, N., Tobarra, M-Á., 2010. CO2 Emissions of
International Freight Transport and Offshoring: Measurement and Allocation,
Ecological Economics, 69, 1682-1694, doi: 10.1016/j.ecolecon.2010.03.019.
Civil Air Navigation Services Organisation (CANSO), 2008. ATM Global Environment
Efficiency Goals for 2050. Downloaded from:
<www.canso.org/xu/document/cms/streambin.asp?requestid=603FD1CA-6CDB-
44D4-B75C-5FDF8A1E54D4> [accessed 19th May 2011].
Department of Environment, Food and Rural Affairs UK (DEFRA), 2008. 2008 Guidelines
to Defra’s GHG Conversion Factors: Methodology Paper for Transport Emission
Factors (July 2008). Downloaded from:
<www.defra.gov.uk/environment/business/reporting/pdf/passenger-
transport.pdf> [accessed 7th May 2009].

Personal revised version of: Howitt et al. (2011), Carbon dioxide emissions from international air freight. Paper to appear in Atmospheric Environment. NOTE: Final official version can be found using the Digital Object Identifier (DOI) listed here: doi:10.1016/j.atmosenv.2011.09.051
27
Department of Infrastructure, Transport, Regional Development and Local Government,
2010. Transparent Noise Information Package (TNIP), Carbon Counter, Carbon
Footprint Analysis & Reporting Tool for Aircraft Operations – User Manual.
Downloaded from:
<http://infrastructure.gov.au/aviation/environmental/pdf/TNIP_Carbon_Counter_
User_Manual_v1_0.pdf> [accessed 19th May 2011].
Eggleston, S., Buendia, L., Miwa, K., Ngara, T., Tanabe, K. (Eds.), 2006. 2006 IPCC
Guidelines for National Greenhouse Gas Inventories, vol.2, Energy [online].
Available from: <www.ipcc-nggip.iges.or.jp/public/2006gl/vol2.htm> [accessed
5th August 2009].
EUROCONTROL, 1992. Penalties to Air Traffic Associated with the ATS Route Network in
the Continental ECAC States Area, Document No. 921016, EUROCONTROL,
Brussels, Belgium, 26 pp. þ appendices (As cited in Penner et al., 1999).
EUROCONTROL, 2010. Performance Review Report – An Assessment of Air Traffic
Management in Europe during the Calendar Year 2009. Downloaded from:
<http://www.eurocontrol.int/prc/gallery/content/public/Docs/PRR_2009.pdf>
[accessed 20th May 2011].
Facanha, C., Horvath, A., 2006. Environmental Assessment of Freight Transportation in
the US, The International Journal of Life Cycle Assessment, 11(4), 229-239, doi:
10.1065/lca2006.02.244.
Fitzgerald, W.B., Howitt, O.J.A., Smith, I.J., 2011a. Greenhouse Gas Emissions from the
International Maritime Transport of New Zealand’s Imports and Exports, Energy
Policy, 39 (3), 1521-1531, doi: 10.1016/j.enpol.2010.12.026.
Fitzgerald, W.B., Howitt, O.J.A., Smith, I.J., Hume, A., 2011b. Energy Use of Integral
Refrigerated Containers in Maritime Transportation, Energy Policy, 39 (4), 1885-
1896, doi: 10.1016/j.enpol.2010.12.015.
Forster, P.M.de F., Shine, K.P., Stuber, N., 2006. It is premature to include non-CO2
effects of aviation in emission trading schemes, Atmospheric Environment, 40(6),
1117-1121, doi:10.1016/j.atmosenv.2005.11.005.
Forster, P.M.de F., Shine, K.P., Stuber, N., 2007. Corrigendum to ―It is premature to
include non-CO2 effects of aviation in emission trading schemes‖, Atmospheric
Environment, 41(18), 3941, doi: 10.1016/j.atmosenv.2005.11.081.

Personal revised version of: Howitt et al. (2011), Carbon dioxide emissions from international air freight. Paper to appear in Atmospheric Environment. NOTE: Final official version can be found using the Digital Object Identifier (DOI) listed here: doi:10.1016/j.atmosenv.2011.09.051
28
Fuglestvedt, J.S., Shine, K.P., Berntsen, T., Cook, J., Lee, D.S., Stenke, A., Skeie, R.B.,
Velders, G.J.M., Waitz, I.A., 2010. Transport impacts on atmosphere and climate:
metrics, Atmospheric Environment, 44(37), 4648-4677, doi:
10.1016/j.atmosenv.2009.04.044.
Hileman, J.I., Katz, J.B., Mantilla, J.G., Fleming, G., 2008. Payload fuel energy efficiency
as a metric for aviation environmental performance, presented at the 26th
International Congress of the Aeronautical Sciences, downloaded from:
<http://web.mit.edu/hileman/www/Publications/ICAS2008A.pdf> [accessed 22nd
November 2010].
Howitt, O.J.A., Revol, V.G.N., Smith, I.J., Rodger, C.J., 2010. Carbon emissions from
international cruise ship passengers' travel to and from New Zealand. Energy
Policy. 38(5), 2552-2560, doi:10.1016/j.enpol.2009.12.050.
International Civil Aviation Organization (ICAO), 2009a. ICAO Carbon Emissions
Calculator Methodology, Version 2. Downloaded from:
<http://www2.icao.int/en/carbonoffset/Documents/ICAO%20MethodologyV2.pdf>
[accessed 22nd November 2010].
International Civil Aviation Organization (ICAO), 2009b. Available Capacity and Average
Passenger Mass. Downloaded from:
<www.icao.int/STA10/Docs/Sta10_Wp005_en.pdf> [accessed 18th November
2010].
International Energy Agency, 2010. CO2 Emissions from Fuel Combustion – Highlights.
Downloaded from: <www.iea.org/co2highlights/co2highlights.pdf> [accessed 15th
November 2010].
Jardine, C.N., 2005. Calculating the Environmental Impact of Aviation Emissions.
Downloaded from:
<www.jpmorganclimatecare.com/media/documents/pdf/aviation_emissions__offs
ets.pdf> [accessed 23rd November 2010].
Jardine, C.N., 2009. Calculating the Carbon Dioxide Emissions from Flights. Downloaded
from: <www.eci.ox.ac.uk/research/energy/downloads/jardine09-
carboninflights.pdf> [accessed 19th November 2010].
Kim, B.Y., Fleming, G.G., Lee, J.J., Waitz, I.A., Clarke, J-P., Balasubramanian, S.,
Malwitz, A., Klima, K., Locke, M., Holsclaw, C.A., Maurice, L.Q., Gupta, M.L.,
2007. System for assessing Aviation’s Global Emmissions (SAGE), Part 1: model

Personal revised version of: Howitt et al. (2011), Carbon dioxide emissions from international air freight. Paper to appear in Atmospheric Environment. NOTE: Final official version can be found using the Digital Object Identifier (DOI) listed here: doi:10.1016/j.atmosenv.2011.09.051
29
description and inventory results, Transportation Research Part D, 12(5), 325-
346, doi: 10.1016/j.trd.2007.03.007.
Lee, D.S., Fahey, D.W., Forster, P.M., Newton, P.J., Wit, R.C.N., Lim, L.L., Owen, B.,
Sausen, R., 2009. Aviation and global climate change in the 21st Century,
Atmospheric Environment, 43(22-23), 3520-3537, doi:
10.1016/j.atmosenv.2009.04.024.
Lee, D.S., Pitari, G., Grewe, V., Gierens, K., Penner, J.E., Petzold, A., Prather, M.J.,
Schuman, U., Bais, A., Berntsen, T., Iachetti, D., Lim, L.L., Sausen, R., 2010.
Transport impacts on atmosphere and climate: aviation, Atmospheric
Environment, 44(37), 4678-4734, doi: 10.1016/j.atmosenv.2009.06.005.
Ministry for the Environment, 2011. Guidance for Voluntary, Corporate Greenhouse Gas
Reporting – Data and Methods for the 2009 Calendar Year. Wellington: Ministry
for the Environment.
Ministry of Economic Development, 2005. Infrastructure Stocktake: Infrastructure Audit
[online]. Available from:
<www.med.govt.nz/templates/MultipageDocumentPage____9038.aspx#P5725_4
25058> [accessed 21st July 2009].
Ministry of Economic Development, 2009. New Zealand Energy Data File - 2008 Calendar
Year Edition. Downloaded from:
<www.med.govt.nz/upload/68617/1_Energy%20Data%20File%202009LR.pdf>
[accessed 16th November 2010].
NFO New Zealand, 2003. 2003 Survey of Passenger Weights Market Research Report.
Downloaded from: <www.caa.govt.nz/pubdocs/2003_pax_weight_survey.pdf>
[accessed 7th May 2011].
Nygren, E., Aleklett, K., Höök, M., 2009. Aviation fuel and future oil production scenarios,
Energy Policy, 37 (10), 4003-4010, doi: 10.1016/j.enpol.2009.04.048.
Owen, B., Lee, D. S., and Lim, L., 2010. Flying into the future: aviation emissions
scenarios to 2050, Environmental Science and Technology, 44(7), 2255-2260,
doi: 10.1021/es902530z.
Partow, A., 2003. The Global Airport Database [online]. Available from:
<www.partow.net/miscellaneous/airportdatabase/index.html> [accessed 21st May
2009].

Personal revised version of: Howitt et al. (2011), Carbon dioxide emissions from international air freight. Paper to appear in Atmospheric Environment. NOTE: Final official version can be found using the Digital Object Identifier (DOI) listed here: doi:10.1016/j.atmosenv.2011.09.051
30
Penner, J.E., Lister, D.H., Griggs, D.J., Dokken, D.J., McFarland, M. (Eds.), 1999.
Aviation and the global atmosphere—a special report of IPCC working groups I
and III. Intergovernmental panel on climate change. Cambridge University Press,
Cambridge, UK and New York, NY, USA.
Qantas, 2008. Qantas 2008 Annual Report. Downloaded from:
<www.qantas.com.au/infodetail/about/investors/2008AnnualReport.pdf>
[accessed 26th November 2010].
Ross, D., 2009. GHG Emissions Resulting from Aircraft Travel, version 9.2. Downloaded
from:
<www.carbonplanet.com/downloads/Flight_Calculator_Information_v9.2.pdf>
[accessed 14th December 2009].
Sankaran, J., 2000. Freight Logistics in the New Zealand Context, International Journal of
Physical Distribution and Logistics Management, 30(2), 145-164, doi:
10.1108/09600030010318856.
Saunders, C., Hayes, P., 2007. Air Freight Transport of Fresh Fruit and Vegetables,
Downloaded from:
<http://researcharchive.lincoln.ac.nz/dspace/bitstream/10182/248/1/aeru_rr_29
9.pdf> [accessed 25th November 2010].
Sausen, R., Isaksen, I., Grewe, V., Hauglustaine, D., Lee, D.S., Myhre, G., Köhler, M.O.,
Pitari, G., Schumann, U., Stordal, F., Zerefos, C., 2005. Aviation radiative forcing
in 2000: An update on IPCC (1999), Meteorologische Zeitschrift, 14(4), 555-561,
doi: 10.1127/0941-2948/2005/0049.
Singapore Airlines, 2008. Singapore Airlines 2007-2008 Annual Report. Downloaded
from:
<www.singaporeair.com/saa/en_UK/docs/company_info/investor/annual/SIA_Ann
Report0708.pdf> [accessed 26th November 2010].
Smith, I.J., Rodger, C.J., 2009. Carbon emission offsets for aviation-generated emissions
due to international travel to and from New Zealand. Energy Policy, 37(9), 3438–
3447, doi: 10.1016/j.enpol.2008.10.046.
Statistics New Zealand, n.d. Harmonised System [online]. Available from:
<www.stats.govt.nz/surveys_and_methods/methods/classifications-and-
standards/classification-related-stats-standards/harmonised-system.aspx>
[accessed 18th November 2010].

Personal revised version of: Howitt et al. (2011), Carbon dioxide emissions from international air freight. Paper to appear in Atmospheric Environment. NOTE: Final official version can be found using the Digital Object Identifier (DOI) listed here: doi:10.1016/j.atmosenv.2011.09.051
31
Statistics New Zealand, 2007a. Overseas Cargo Statistics: Year Ended June 2007 –
Microsoft Excel Data Tables. Downloaded from:
<www.stats.govt.nz/browse_for_stats/industry_sectors/imports_and_exports/Ove
rseasCargo_HOTPYeJun07.aspx> [accessed 17th November 2010].
Statistics New Zealand, 2007b. International Air Passengers by New Zealand Airport
(Table 1.02). Downloaded from:
<www.stats.govt.nz/browse_for_stats/industry_sectors/tourism/tourism-
migration-2007.aspx> [accessed 19th November 2010].
Statistics New Zealand, 2008. New Zealand Official Yearbook 2008. North Shore City,
David Bateman Ltd.
United Nations, 1998. Kyoto Protocol to the United Nations Framework Convention on
Climate Change. Downloaded from:
http://unfccc.int/resource/docs/convkp/kpeng.pdf [accessed 16th November
2010].
US Department of Transportation, 2006. U.S.-International Travel and Transportation
Trends: 2006 Update. Downloaded from:
<www.bts.gov/publications/us_international_travel_and_transportation_trends/20
06/pdf/entire.pdf> [accessed 25th November 2010].
Wood, F.R., Bows, A., Anderson, K., 2010. Apportioning aviation CO2 emissions to
regional administrations for monitoring and target setting, Transport Policy, 17(4),
206-215, doi: 10.1016/j.tranpol.2010.01.010.
Wuebbles, D., Forster, P., Rogers, H., Herman, R., 2010. Issues and Uncertainties
Affecting Metrics for Aviation Impacts on Climate, Bulletin of the American
Meteorological Society, 91(4), 491-496, doi:10.1175/2009BAMS2840.1.