carbon consequences of western us droughts, fires, bark ... · combined with area of forest...
TRANSCRIPT

Carbon Consequences of Western US Droughts, Fires, Bark Beetles, and Harvests:
Comparative Analysis and Synthesis
AGU Fall Meeting ‘12 San Francisco, CA
Christopher A. Williams1, Bardan Ghimire1
Christopher Schwalm2, G. James Collatz3, Jeff G. Masek3
1Geography, Clark Univ. 2Earth Sciences, Northern Arizona U 3NASA GSFC Biospheric Sciences Laboratory
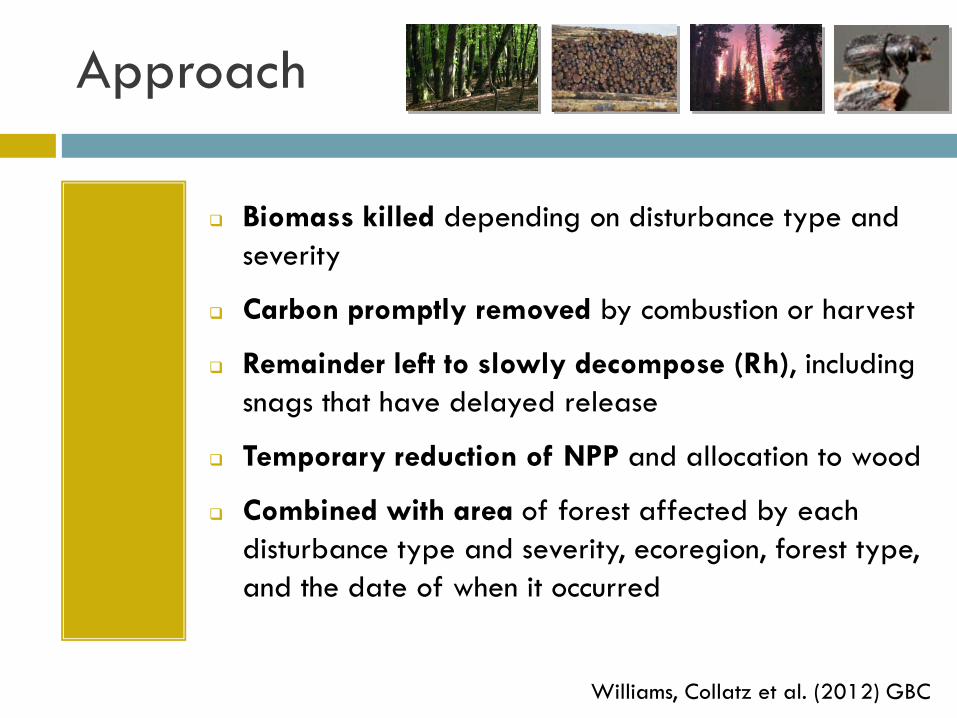
Approach
Biomass killed depending on disturbance type and severity
Carbon promptly removed by combustion or harvest
Remainder left to slowly decompose (Rh), including snags that have delayed release
Temporary reduction of NPP and allocation to wood
Combined with area of forest affected by each disturbance type and severity, ecoregion, forest type, and the date of when it occurred
Williams, Collatz et al. (2012) GBC
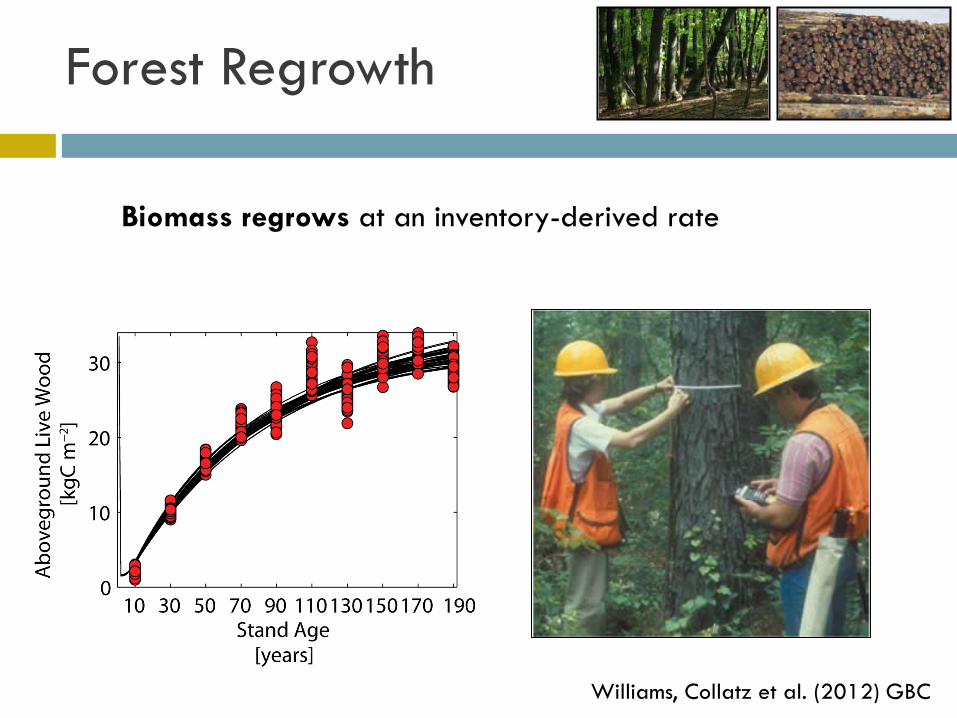
Forest Regrowth
Biomass regrows at an inventory-derived rate
Williams, Collatz et al. (2012) GBC

Williams, Collatz et al. (2012) GBC
Yields unique trajectories of NPP, Rh, NEP, Biomass across forest types, and climate settings
Post-Harvest (clearcut)

Ghimire, Williams et al. (2012) JGR-B
PNW Douglas fir
Post-Fire C Dynamics
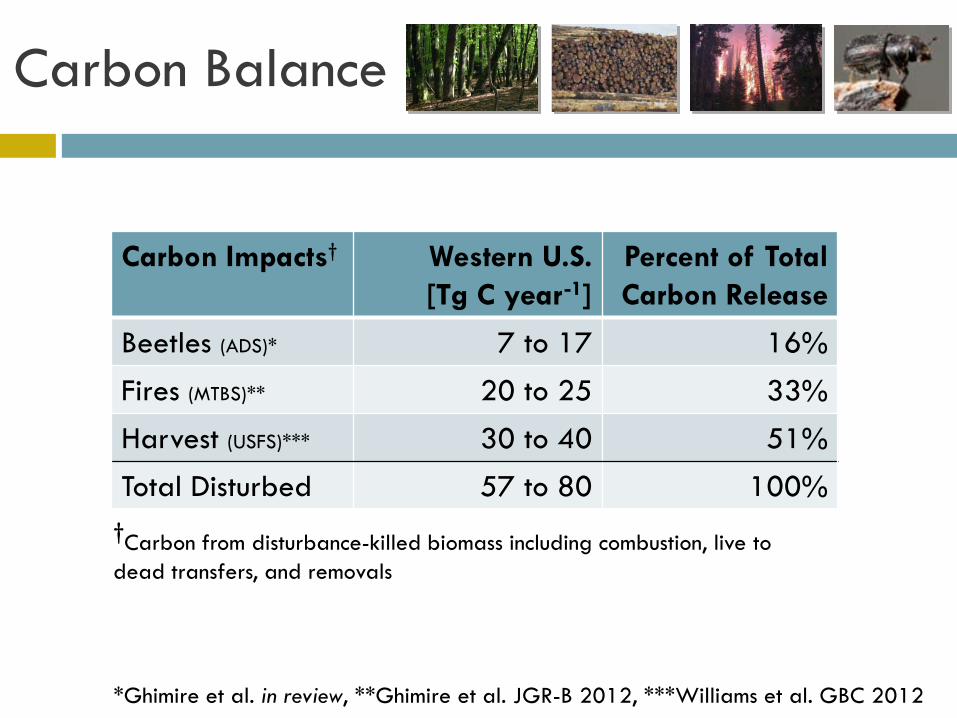
Carbon Impacts† Western U.S. [Tg C year-1]
Percent of Total Carbon Release
Beetles (ADS)* 7 to 17 16%
Fires (MTBS)** 20 to 25 33%
Harvest (USFS)*** 30 to 40 51%
Total Disturbed 57 to 80 100% †Carbon from disturbance-killed biomass including combustion, live to dead transfers, and removals
*Ghimire et al. in review, **Ghimire et al. JGR-B 2012, ***Williams et al. GBC 2012
Carbon Balance

Challenges and Opportunities
Areal Extent by Disturbance Type and Severity
MTBS, NAFD, ADS, FIA + USFS
Biomass Kill and Pathway of Release
Harvest Removals, MTBS & ADS + Field Calibration
Snags, Decomposition Rates
Forest Regeneration Rate and Composition
FIA on Age-Accumulation of Forest Stocks
Growth Enhancements Effects on Stock Accumulation
Stand Demography Effects, Particularly w/ Partial D

Perspective
What matters most for C balance of the region? If regrowth is incomplete…
• the total area disturbed is the key (or the mean annual rate) • like land cover conversions
If regrowth is complete (full stock recovery)
• trends become the key • rise to a new steady rate, transient net release never recovered • drop to a new steady rate, transient net uptake stored

Satellite-Based Burned Area and Severity 1984-2008 from MTBS
Biscuit fire in Oregon (Running 2008, Science)
Monitoring Trends in Burn Severity, USGS
Ghimire, Williams et al. (2012) JGR-B

Post-Bark Beetles
Ghimire, Williams et al. (in review)
Range of beetle-killed biomass represented by 1400 simulations for each forest type
NEP [gC m-2 y-1]
High Severity Low Severity PNW
PSW
RMN
RMS
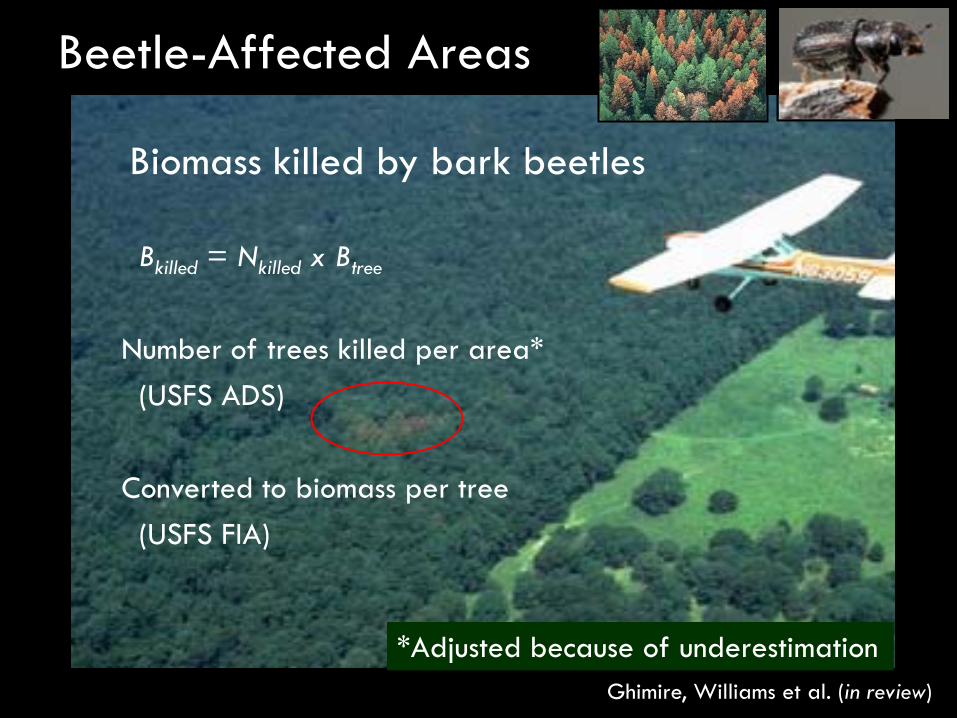
Biomass killed by bark beetles
Bkilled = Nkilled x Btree Number of trees killed per area* (USFS ADS) Converted to biomass per tree (USFS FIA)
Beetle-Affected Areas
Ghimire, Williams et al. (in review)
*Adjusted because of underestimation
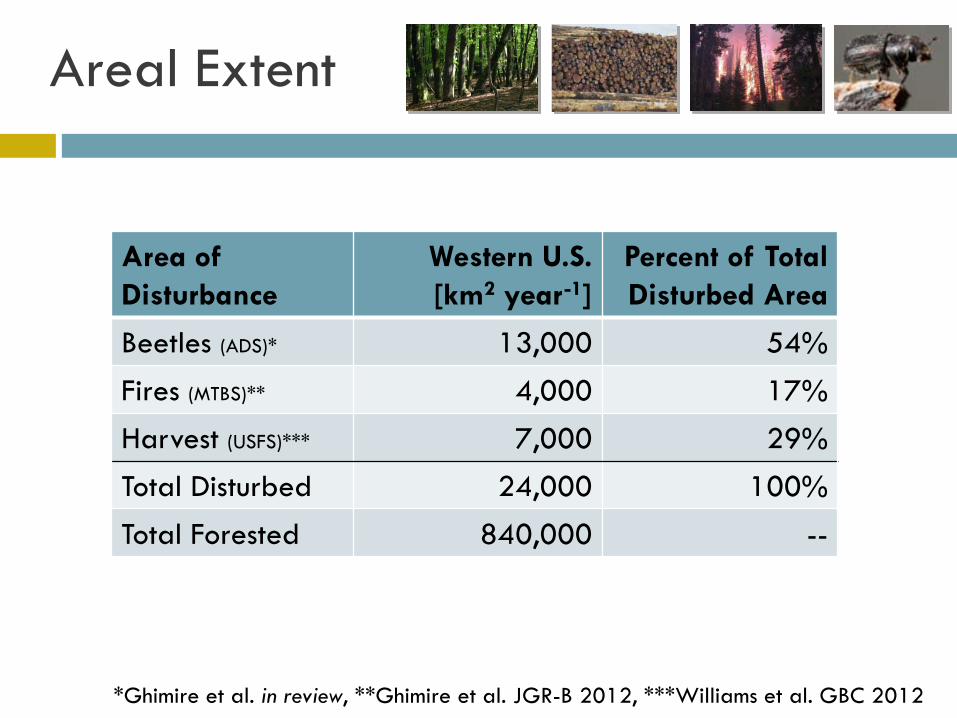
Area of Disturbance
Western U.S. [km2 year-1]
Percent of Total Disturbed Area
Beetles (ADS)* 13,000 54%
Fires (MTBS)** 4,000 17%
Harvest (USFS)*** 7,000 29%
Total Disturbed 24,000 100%
Total Forested 840,000 --
Areal Extent
*Ghimire et al. in review, **Ghimire et al. JGR-B 2012, ***Williams et al. GBC 2012
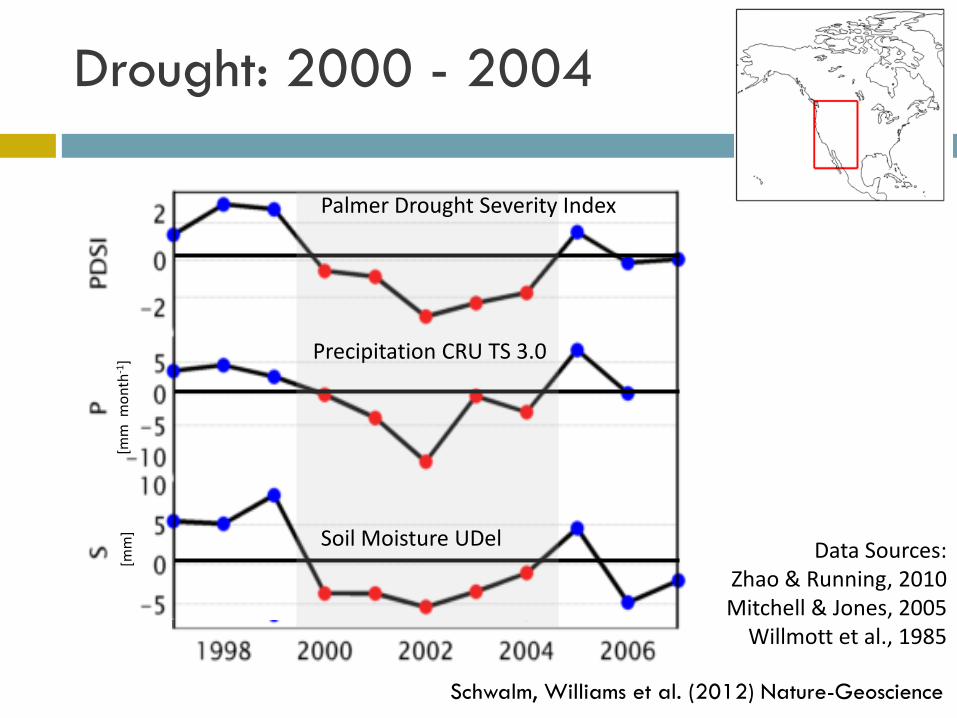
Data Sources: Zhao & Running, 2010 Mitchell & Jones, 2005
Willmott et al., 1985
Palmer Drought Severity Index
Precipitation CRU TS 3.0
Soil Moisture UDel
[mm
mon
th-1
] [m
m]
Drought: 2000 - 2004
Schwalm, Williams et al. (2012) Nature-Geoscience

Drought
Schwalm, Williams et al. (2012) Nature-Geoscience
Term [Tg C y-1]
Source Drought Anomaly
Percent Reduction
GPP MODIS -234 10%
GPP Upscaled FLUXNET -182 8%
NEP Inversions -30 -83
17% 44%
NEP Flux Tower Network -298 48%
--Assessment Does Not Include Drought-Induced Mortality--
Reduction in Carbon Uptake During Turn of the Century Drought

[TgC y-1] Direct
Emissions I.
Biomass Killed & Left
II.
Biomass Removed
III.
Source to Atmos.
IV.
Beetles* 0 5 to 15 0 7 to 10
Fires** 10 20 0 12
Harvests† 0 20 30 0
Droughts# 0 ? 0 30 to 80
Western U.S. only, circa 2008, from disturbances since 1984
Synthesis
-50 TgC y-1 uptake from age structure legacy for forests disturbed pre-1980s† -50 TgC y-1 uptake from growth enhancement†
*Ghimire et al. in review, **Ghimire et al. JGR-B 2012, †Williams et al. GBC 2012, #Schwalm et al. 2012
= Rh + F - NPP

Trends
Large Increase in Burned Area across Wildlands of the Western US in Recent Decades
1500 3800
2.5x increase
Ghimire, Williams et al. (2012) JGR-B

Trends
Major Increase in Beetle Outbreaks across
Western North America (Raffa et al. 2008
Consistent with U.S. ADS data

Trends
Harvest Removal Has Slowed in recent decades for Western U.S. …accelerated in the South until recently
Smith et al. 2007 GTR

Trends
World Climate Research Programme's Coupled Model Intercomparison Project 5 (CMIP5) multi-model dataset of summer precipitation with 21st Century forced by a business as usual high emissions scenario (Representative Concentration Pathway, RCP8.5)
TCD June – August Only (Data Source: Meehl et al., 2007)
Schwalm, Williams et al. (2012) Nature-Geoscience
Drought and Dryness Expected to Intensify Over Coming Decades

Conclusions
Carbon legacies from forest disturbances are highly diverse
Field based observations of post-disturbance C stocks needed
Regeneration / regrowth is a key unknown: a) will it happen b) over what time frame
Carbon balance assessments need to consider: a) prompt emissions b) committed emissions c) net regrowth
Expansion of disturbance frequency and area
Acknowledgements
Clark Research Team Bardan Ghimire, Christopher Williams, Melanie Vanderhoof, John Rogan, Dominik Kulakowski, Christopher Schwalm (now @NAU)
NASA Collaborators and Funding G. James Collatz, Jeff G. Masek Terrestrial Ecology Program