carbon capture and utilization for sodium bicarbonate ... · carbon capture and utilization for...
TRANSCRIPT

Carbon capture and utilization for Sodium Bicarbonate production
assisted by solar thermal power 2
4 D. Bonaventura1,2, R. Chacartegui*1, J. M. Valverde1, J. A. Becerra 1, V. Verda*2
6 1University of Seville, Spain. 2Politecnico di Torino, Italy. 8
10
Abstract 12
In this paper, a novel carbon capture and utilization process is proposed. It is based on using a fraction
of the captured carbon dioxide to produce sodium bicarbonate (NaHCO3), a widely used product in 14 the chemical and food industries. The process couples the Dry Carbonate process for CO2 capture
with NaHCO3 production. Raw material is trona or sodium sesquicarbonate dehydrate 16 (Na2CO3·NaHCO3.2H2O) which is a relatively abundant mineral composed by approximately 46%
sodium carbonate (Na2CO3) and 35% sodium bicarbonate (NaHCO3) by weight. In the process trona 18
is firstly converted into Na2CO3 in a fluidized bed reactor operated at 180-200°C and 1 bar. Heat
required in the fluidized bed reactor for decomposing trona can be supplied by renewable sources 20 such as low/medium temperature solar energy or biomass. A fraction of the Na2CO3 generated is
recirculated for CO2 capture by means of the dry carbonate process. The rest is converted to 22 NaHCO3 in a carbonating tower through the reaction with CO2 and H2O. After separation of
NaHCO3 and other salts from water, NaHCO3 is suitable for direct sale. The use of renewable sources 24 for the energy required at the sorbent regenerator and trona decomposition yields a near-zero CO2
emissions global system. As case of study, CO2 capture coupled to NaHCO3 production has been 26
analysed for a 15 MWel coal fired power plant. Heat required in the carbon capture process penalizes
the global system efficiency by a 10.2%, which is reduced just to the electricity parasitic consumption 28 for solids transport and CO2 compression (~3%) if renewable energy sources are integrated. From an
economic perspective, the penalty in electricity consumption is fully compensated by the new by-30 product sales. Taking into account the reduction of electricity sales and current prices of trona and
NaHCO3 a return of investment is obtained in the range between 3 and 8.7 years with an internal rate 32 of return over 12%. These values improve the current forecast of any other carbon capture and storage
process up to date, which suggests a high interest of the proposed conceptual integrations for regions 34 where trona is widely available.
36
Keywords:
CO2 capture, Coal fired power plant, CCS, CCU, Dry carbonate process, Trona, Sodium bicarbonate. 38

1. Introduction 2
A complete replacement of fossil fuels by renewable energies is not feasible in the short-term. Thus,
fossil fuel power plants should be urgently retrofitted with CO2 capture and sequestration (CCS) 4 processes as a necessary measure to limit global warming below 2ºC [1]. CCS would allow continuing
the use of fossil fuel until a deeper penetration of renewable energy sources into the grid is attained 6 in an orderly fashion. CO2 capture and utilization (CCU) for commercial purposes would help
mitigating capture costs that mainly hinder the commercial deployment of state of the art CO2 capture 8 technologies. Current anthropogenic CO2 emissions (around 35 Gt/y) largely exceed the amount of
CO2 used in chemical processes (~200 Mt/y). However, promoting CO2 utilization routes for the 10 production of valuable chemicals could be a starting point to promote the deployment of CO2 capture
technologies [2]. According to International Energy Agency (IEA) projections, the CCS share of 12
cumulative emissions reduction to achieve the 2°C target would require about 3500 large-scale CCS
projects in operation by 2050. Only about 15 large-scale CCS commercial projects are in operation 14 to this date of which Boundary Dam in Canada is the only coal fired power plant applying CCS in
the power sector. Yet, it is estimated that abandoning CCS in the power sector would increase the 16 investment required over 40% in the 2ºC scenario [3]. Moreover, post-combustion capture
technologies have the greatest potential for reduction of CO2 emissions in the short term because they 18
can be retrofitted to existing fossil fuel power plants and are also applicable to other industrial
processes. 20
Up to date the only post-combustion capture technology commercially available at the necessary 22 large-scale of coal fired power plants is based on chemical absorption by amines dissolved in water.
In this post-combustion capture system, the exhaust gases stream from the power plant is passed 24 through an absorber column where it comes into contact with the liquid amine flowing downwards,
which allows CO2 to be chemically absorbed by the amine. The CO2 rich amine solvent is then 26
pumped to a regenerator, where heat is supplied to reverse the chemical reaction and release relatively
pure CO2 for its compression, transport and storage while the CO2 lean liquid amine is pumped back 28 into the absorber to be reused [4]. Although temperatures for CO2 desorption are not high (~ 130°C)
sorbent regeneration in this process requires a relatively high amount of energy to heat the large 30
volume of water where amines are dissolved. Thus, the energy required per ton of CO2 captured is
about 3.3 GJ/tonCO2 for an advanced monoethanolamines (MEA) system whereas 3.9 GJ/tonCO2 are 32 required for a typical aqueous MEA system [5]. On the other hand, post-combustion capture by MEA
suffers from other serious issues related to toxicity, corrosion and degradation [6]. Furthermore, 34 amines have a relatively high cost (>1000 €/ton), which is a major problem taking into account the
large scale of commercial CCS applications [1,7]. 36
Thus, there is a need to develop novel post-combustion capture processes using cheap, widely 38 available and non-toxic materials at reduced cost and energy penalty. In this line, novel amine-based
solid sorbents based on direct steam stripping desorption have shown an improved performance [8]. 40 In ref. [9] an organic solvent was added to a CO2 rich, aqueous ammonia/CO2 solution under room
temperature and pressure conditions. The sorbent was regenerated by using low-temperature heat, 42
with a reduced thermal energy requirement. In ref. [10] novel absorbents were studied using both
single and mixed amine-based absorbents. Experimental results indicate that most absorbents tested 44 have a poor performance as compared to MEA except for aqueous 2-(2-Aminoethylamine)ethanol
(AEEA), which shows a promising performance. Ref. [11] presents a review about the impact of 46 uncertainty in the sorbent thermo-physical properties on the design and operation of components and
processes involved in CO2 capture. 48
CO2 capture processes using dry solid sorbents capable of capturing CO2 from flue gas streams by 50
physical adsorption show potential advantages compared with other conventional CO2 capture

systems using aqueous amine solvents [12]. Thus, a variety of promising adsorbents such as activated
carbonaceous materials, microporous/mesoporous silica or zeolites, carbonates, and polymeric resins 2 have been proposed in the recent literature [12]. As a common feature, these solid sorbents require
very small amounts of heat for regeneration although their capture capacity is generally low. Ref [13] 4
proposes the use of power plant's waste heat for CO2 capture by nanomaterials porperly designed to
overcome the competitive adsorption of CO2 and H2O. 6
The Calcium-Looping process is a promising 2nd generation post-combustion process validated at the 8 pilot level (1-2 MWth) that uses Calcium Oxide (CaO) derived from cheap (~10 €/ton) and abundant
natural limestone to capture CO2 from flue gas. The process is based on the reversible 10 carbonation/calcination chemical reaction at high temperatures [14]:
12
𝐶𝑎𝑂(𝑠) + 𝐶𝑂2(𝑔) 𝐶𝑎𝐶𝑂3(𝑠) ∆𝐻298𝐾 = −178𝑘𝐽
𝑚𝑜𝑙 (1)
14 Carbonation proceeds at a satisfactory fast rate at temperatures in the range 625–680°C while the
reverse calcination reaction should be carried out at 900–950°C under high CO2 partial pressure [14]. 16 The dry sorbent is repeatedly cycled between two reactors. In one reactor (carbonator) carbonation
of CaO particles serves to capture CO2 from the flue gas. The carbonated particles are then circulated 18 into another reactor (calciner) where sorbent regeneration takes place by calcination. To close the
cycle, the regenerated CaO particles are returned back into the carbonator, leaving a concentrated 20 stream of CO2 in the calciner ready for compression, transport and sequestration. However, a main
drawback of this process is the progressive deactivation of CaO particles mainly due to marked 22 sintering in the high temperature calcination stage, which requires a large make-up of fresh limestone
thus increasing the energy penalty of the process taking into account the high temperatures at which 24
it must be carried out to enhance the reaction kinetics.
26
Concerning the penalty imposed by the capture system, ref [15] examines potential design routes for
the capture, transport and storage of CO2 in power plants. Around 90% of operational carbon 28
emissions could be captured with an energy penalty between 14 and 300% and rises by 27-142% of
electricity cost [16]. However, CO2 capture system integration, with an adequate heat and work 30
integration would result in significant energy savings [17] . The CO2 capture installation requires
large amounts of heat for solvent regeneration in appropriate quantity and quality, a cooling system 32 to discharge waste heat and additional power to drive CO2 compressor and auxiliary equipment
(pump, fans). In [18] the steam to CCU is extracted from IP/LP crossover pipe showing the high 34 impact of the design IP/LP crossover pressure on the power unit efficiency.
36
Integration with solar could by a driving factor to favor CO2 capture implementation at the
commercial scale. Ref [19] studies flexible operation of solvent-based capture for three types of 38 plants obtaining the highest revenue to electricity ratio in the case where solar repowering was used
for power boosting. Ref [20] analyzes the use of solar energy to provide the energy of the capture 40
system. A CaL based capture system assisted by solar energy is assessed in [20] for reducing the
global system efficiency penalty. 42
CCS feasibility could be fostered by integration of the capture system with other processes and 44 valuable chemicals. Ref [21] suggests a method for combining CCS and biofuel production using
CO2 as a feedstock. [22]. A significant part of the cost for CCS is related to the compression of the 46 captured CO2 , however the conditions for carbon capture and utilization (CCU) can reduce the
parasitic energy consumption. Ref [27] addresses the critical technologies in CO2 capture, transport, 48 utilization and storage and proposes technical priorities by evaluating critical indexes such as the
objective contribution rate and technical maturity. 50

Among the carbon capture technologies in a research and development (R&D) phase [23], one of the 2 most promising CO2 capture processes is the dry carbonate process, which uses Na2CO3 (sodium
carbonate also known as soda ash) as sorbent to separate CO2 from others flue gases. The process is 4
based on the reversible chemical reaction [24]:
6
𝑁𝑎2𝐶𝑂3(𝑠) + 𝐶𝑂2(𝑔) + 𝐻2𝑂(𝑔) 2𝑁𝑎𝐻𝐶𝑂3 ∆𝐻 = −129,1𝑘𝐽
𝑚𝑜𝑙 (2)
8 Equal molar quantities of CO2 and H2O are produced during sorbent regeneration, and pure CO2
suitable for use or sequestration is available after condensation of the H2O. In contrast with the 10 Calcium-Looping process, the carbonation reaction in the dry carbonate process takes place
efficiently at relatively low temperatures (60-70°C), which is below the typical flue gas temperature. 12 At these temperatures, the capture efficiency can be as large as 90%. Moreover, the required sorbent
regeneration temperature is not high (120-200ºC) allowing the use of medium temperature heat 14
sources. Na2CO3 is an abundant and relatively cheap (~100 €/ton) natural mineral lacking serious
problems of degradation, toxicity or corrosiveness at the working temperatures of the process [1,25]. 16 The research triangle institute (RTI) has designed and constructed a Dry Carbonate based prototype
unit [26] showing a number of potential advantages over MEA systems such as [30] : i) lower total 18
regeneration energy requirement; ii) less energy requirement also to operate due to lower pressure
drop; iii) Modest temperatures of operation and noncorrosive reactants allowing standard equipment 20
and materials of construction; iv) more stable and cheaper sorbent than amines.
22
Reaction (2) is also at the basis of the Solvay process to produce sodium bicarbonate (NaHCO3 also
known as baking soda) through the reaction of calcium carbonate, sodium chloride, ammonia, and 24 carbon dioxide in water. In this process (Solvay), the initial reaction of CO2 with an aqueous solution
of sodium hydroxide to produce sodium carbonate is: 26
CO2 + 2NaOH → Na2CO3 + H2O (3) 28
Further addition of CO2 yields NaHCO3 through reaction (2), which at sufficiently high concentration 30 precipitates out of the solution. Sodium hydroxide (NaOH) is mainly produced from electrolysis
(2NaCl(aq) + 2H2O(l) → H2(g) + Cl2(g) + 2NaOH(aq), ΔH298K= 422 kJ/mol) [27]. This involves a 32 certain amount of waste energy to produce NaHCO3 as benefit. NaHCO3 is also produced
commercially by a similar method using Na2CO3 obtained from naturally occurring mineral trona, 34 which is dissolved in water and treated with CO2 [25]. This process avoids the use of electrolysis for
NaOH production, but a little amount of energy is still required for trona dissociation (133,9 kJ/mol). 36
In the present manuscript a novel CCU concept is introduced, which combines the production of 38 NaHCO3 with the dry carbonation process for CO2 capture and is assisted by renewable energy
sources for sorbent regeneration (solar thermal power or biomass). The structure of the manuscript is 40 the following. First, the current state of the art technology for sodium bicarbonate production from
trona decomposition is described. Then the concept of CO2 capture and sodium bicarbonate 42
production for CO2 fixation in a valuable chemical product is described. Na2CO3, CO2 and H2O are
obtained from trona decomposition. These three components, together with a relevant fraction of CO2 44 from the capture system are used for sodium bicarbonate production. The integration scheme is
applied to a small 15 MWel coal power plant or, equivalently, to a fraction of the flue gas from a 46 bigger size plant. The novel concept of this manuscript consists of the synergistic combination of the
dry carbonate process with sodium bicarbonate production starting from a raw natural material such 48 as trona. This study shows that the penalty imposed by the capture system can be mitigated from the
production of a valuable material such as sodium bicarbonate with an economic return. The results 50

obtained in this preliminary analysis demosntrate the environmental and economic interest of the
proposed concept 2
2. Trona mineral 4
Trona consists mainly of sesquicarbonate sodium (systematic name is trisodium 6 hydrogendicarbonate) having the chemical formula:
8
𝑁𝑎2𝐶𝑂3 ∙ 𝑁𝑎𝐻𝐶𝑂3 ∙ 2𝐻2𝑂 (4)
10 As specified in Table 1, natural trona is composed of approximately 46% Na2CO3 and 35% NaHCO3
being relatively abundant in nature. They are widely distributed around the world. Among other 12 places they are found in Wyoming [28,29] , Tanzania [30], Namib [31], Turkey [32], China [33].
Calcination and dehydration of raw trona in industrial processes are applied for different purposes: to 14 eliminate carbonate for reducing acid consumption if an acidic treatment is to be applied, to decrease
the weight of the material for reducing transportation costs in the case that it involves hydration in 16 large quantities, or as a necessary step in a chemical process such as the production of Na2CO3, which
is the main focus of the current manuscript. 18
In the production of Na2CO3 from trona, the monohydrate process is the most commonly used
method. The first step of this method is thermal decomposition of the mineral, which yields Na2CO3 20
via the following reaction [34,35]:
22
2(𝑁𝑎2𝐶𝑂3 ∙ 𝑁𝑎𝐻𝐶𝑂3 ∙ 2𝐻2𝑂)(𝑠) → 3𝑁𝑎2𝐶𝑂3(𝑠) + 𝐶𝑂2(𝑔)+ 5 𝐻2𝑂(𝑔) (5)
∆𝐻298𝐾 = 133,9 𝐾𝐽
𝑚𝑜𝑙 24
Table 1. Natural trona composition [34] 26
Component Wt%
Na2CO3 46,53
NaHCO3 34,82
Na2SO4 0,568
insolubles 2,98
hydration water 14,92
others 0,182
Trona-phase equilibrium diagrams for low and high temperature regions have been analysed in detail 28 in [36]. Trona is stable at temperatures up to 57 °C under dry conditions. Intermediate salts such as
wegschiderite (Na2CO3·3NaHCO3) and sodium monohydrate (Na2CO3·H2O) are produced between 30
57 °C and 160 °C [34,37]. Above 160 °C, trona decomposes into Na2CO3 and NaHCO3. NaHCO3
decomposes to Na2CO3, H2O and CO2 in the temperature range of 100°C–200 °C [38]. Reaction 32 kinetics is fast at 200°C [39]:
34
2𝑁𝑎𝐻𝐶𝑂3 → 𝑁𝑎2𝐶𝑂3 + 𝐻2𝑂 + 𝐶𝑂2 (6)
36 Thus, the final decomposition of trona generates Na2CO3, CO2 and H2O.
38
3. Sodium bicarbonate production 40

The novel concept presented in this manuscript combines CO2 capture and the production of NaHCO3
at low temperature using for both processes natural trona as raw material. CO2 capture is realized via 2 the reaction expressed by Eq. (2). This section briefly reviews NaHCO3 production from raw trona
as currently applied in industry and the reactions involved that will be used in this work. 4
In the NaHCO3 production process, crushed raw trona is fed into a vertical hollow tubular vessel with a 6 perforated bottom that separates an upper fluidizing chamber from a lower plenum chamber. A gas
stream is introduced into the plenum chamber through the perforated bottom to fluidize crushed trona. 8 Part of the charge remains in suspension while the decomposition gases such as H2O and CO2 are
redirected to the carbonator for NaHCO3 production. The fluidized bed reactor acts both as a calciner for 10 the crushed trona and as a separator to remove fine particles of crushed trona from the coarse portion of
the charge remaining in fluid suspension in the fluidized bed reactor. Thus, fine particles of crushed trona 12 become entrained in the effluent gas and exit the fluidized bed before they become calcined. The thermal
energy required to achieve the conversion of crude trona to Na2CO3 is supplied by heating the fluidizing 14
gas or by placing heating means within or around the bed in order to attain a temperature of 125°- 225°C
[40]. The next step is to take the intermediate Na2CO3 solution into a centrifuge, which separates the 16
liquid from the crystals. The crystals are then dissolved in a soda ash solution made by the manufacturer
in a rotary dissolver, thereby becoming a saturated solution. This solution is filtered to remove any non-18 soluble materials and is then pumped through a feed tank to the top of a carbonating tower. Purified CO2
is introduced into the bottom of the tower and held under pressure. As the saturated sodium solution 20
moves through the tower, it cools down and reacts with CO2 to form NaHCO3 crystals. These crystals
are collected at the bottom of the tower and transferred to another centrifuge, where the excess solution 22
(filtrate) is filtered out. The crystals are then washed in a bicarbonate solution, forming a cake-like
substance ready for drying. The filtrate removed from the centrifuge is recycled to the rotary dissolver, 24 where it is used to saturate more intermediate soda ash crystals. The washed filter cake is then dried on
either a continuous belt conveyor or in a vertical tube drier. 26
A key step in the process occurs in the carbonating tower. Here, the saturated Na2CO3 solution moves 28 from the top of the tower downwards. As it falls, the solution cools down and reacts with CO2 to form
NaHCO3 crystals. After filtering, washing, and drying, the crystals are sorted by particle size and 30 packaged appropriately. Trona decomposition and Na2CO3 carbonation involve several reactions.
Dissociation reactions of trona and NaHCO3 are: 32
2(𝑁𝑎2𝐶𝑂3 ∙ 𝑁𝑎𝐻𝐶𝑂3 ∙ 2𝐻2𝑂)(𝑠) 3𝑁𝑎2𝐶𝑂3(𝑠) + 𝐶𝑂2(𝑔)
+ 5 𝐻2𝑂(𝑔) 34
3𝑁𝑎+ + 𝐶𝑂3−− + 𝐻𝐶𝑂3
− + 2𝐻2𝑂 (7) 36
𝑁𝑎𝐻𝐶𝑂3 𝑁𝑎+ + 𝐻𝐶𝑂3− (8)
38 In the process, a number of other salts can be also formed such as sodium carbonate decahydrate
(Na2CO3.10H2O), sodium carbonate heptahydrate (Na2CO3.10H2O), sodium carbonate monohydrate 40
(Na2CO3.10H2O) and Wegsheider’s salt (Na2CO3.3NaHCO3). Thus, other possible reactions are:
42
𝑁𝑎2𝐶𝑂3 ∙ 10𝐻2𝑂 2𝑁𝑎+ + 𝐶𝑂3− + 10 𝐻2𝑂 (9)
44
𝑁𝑎2𝐶𝑂3 ∙ 7𝐻2𝑂 2𝑁𝑎+ + 𝐶𝑂3− + 7𝐻2𝑂 (10)
46
𝑁𝑎2𝐶𝑂3 ∙ 𝐻2𝑂 2𝑁𝑎+ + 𝐶𝑂3− + 𝐻2𝑂 (11)
48
𝑁𝑎2𝐶𝑂3 ∙ 3𝑁𝑎𝐻𝐶𝑂3 5𝑁𝑎+ + 𝐶𝑂3−− + 3𝐻𝐶𝑂3
− (12) 50
2(𝑁𝑎2𝐶𝑂3 ∙ 𝑁𝑎𝐻𝐶𝑂3 ∙ 2𝐻2𝑂) 3𝑁𝑎+ + 𝐶𝑂3−− + 𝐻𝐶𝑂3
− + 2𝐻2𝑂 (13)
𝑁𝑎𝐻𝐶𝑂3 𝑁𝑎+ + 𝐻𝐶𝑂3− (14) 2
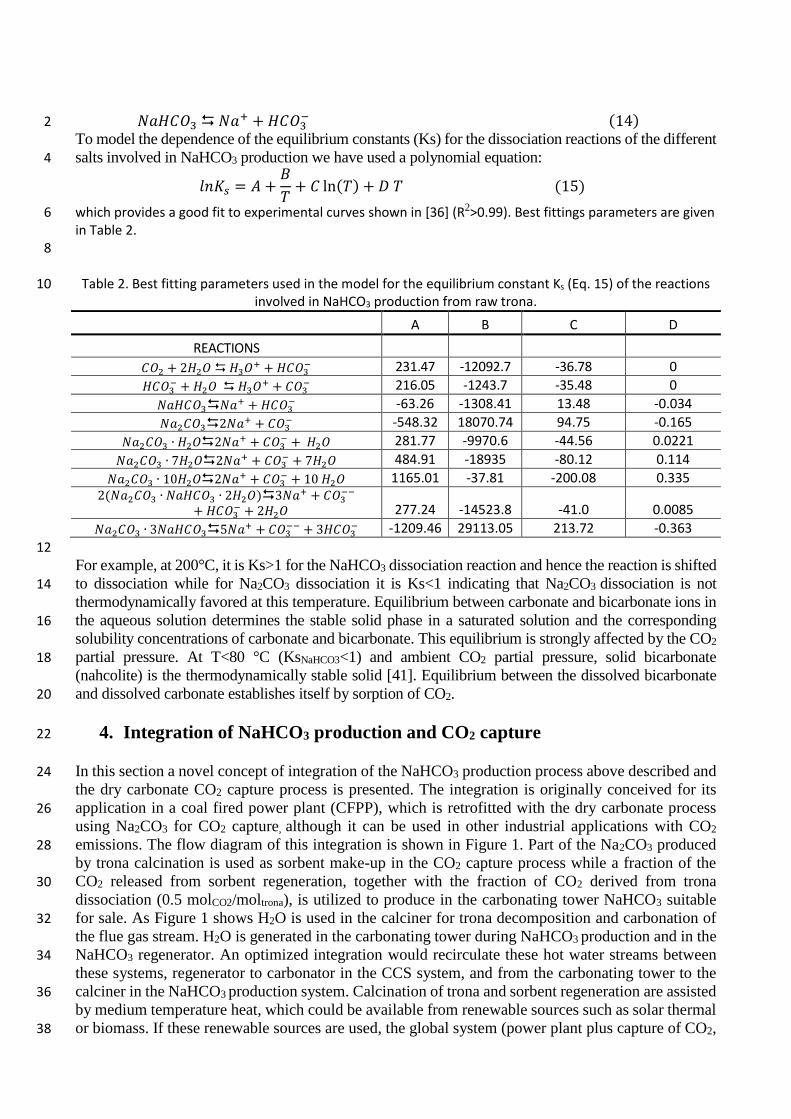
To model the dependence of the equilibrium constants (Ks) for the dissociation reactions of the different
salts involved in NaHCO3 production we have used a polynomial equation: 4
𝑙𝑛𝐾𝑠 = 𝐴 +𝐵
𝑇+ 𝐶 ln(𝑇) + 𝐷 𝑇 (15)
which provides a good fit to experimental curves shown in [36] (R2>0.99). Best fittings parameters are given 6 in Table 2.
8
Table 2. Best fitting parameters used in the model for the equilibrium constant Ks (Eq. 15) of the reactions 10 involved in NaHCO3 production from raw trona.
A B C D
REACTIONS 𝐶𝑂2 + 2𝐻2𝑂 𝐻3𝑂+ + 𝐻𝐶𝑂3
− 231.47 -12092.7 -36.78 0
𝐻𝐶𝑂3− + 𝐻2𝑂 𝐻3𝑂+ + 𝐶𝑂3
− 216.05 -1243.7 -35.48 0
𝑁𝑎𝐻𝐶𝑂3𝑁𝑎+ + 𝐻𝐶𝑂3− -63.26 -1308.41 13.48 -0.034
𝑁𝑎2𝐶𝑂32𝑁𝑎+ + 𝐶𝑂3− -548.32 18070.74 94.75 -0.165
𝑁𝑎2𝐶𝑂3 ∙ 𝐻2𝑂2𝑁𝑎+ + 𝐶𝑂3− + 𝐻2𝑂 281.77 -9970.6 -44.56 0.0221
𝑁𝑎2𝐶𝑂3 ∙ 7𝐻2𝑂2𝑁𝑎+ + 𝐶𝑂3− + 7𝐻2𝑂 484.91 -18935 -80.12 0.114
𝑁𝑎2𝐶𝑂3 ∙ 10𝐻2𝑂2𝑁𝑎+ + 𝐶𝑂3− + 10 𝐻2𝑂 1165.01 -37.81 -200.08 0.335
2(𝑁𝑎2𝐶𝑂3 ∙ 𝑁𝑎𝐻𝐶𝑂3 ∙ 2𝐻2𝑂)3𝑁𝑎+ + 𝐶𝑂3−−
+ 𝐻𝐶𝑂3− + 2𝐻2𝑂 277.24 -14523.8 -41.0 0.0085
𝑁𝑎2𝐶𝑂3 ∙ 3𝑁𝑎𝐻𝐶𝑂35𝑁𝑎+ + 𝐶𝑂3−− + 3𝐻𝐶𝑂3
− -1209.46 29113.05 213.72 -0.363
12 For example, at 200°C, it is Ks>1 for the NaHCO3 dissociation reaction and hence the reaction is shifted
to dissociation while for Na2CO3 dissociation it is Ks<1 indicating that Na2CO3 dissociation is not 14
thermodynamically favored at this temperature. Equilibrium between carbonate and bicarbonate ions in
the aqueous solution determines the stable solid phase in a saturated solution and the corresponding 16 solubility concentrations of carbonate and bicarbonate. This equilibrium is strongly affected by the CO2
partial pressure. At T<80 °C (KsNaHCO3<1) and ambient CO2 partial pressure, solid bicarbonate 18 (nahcolite) is the thermodynamically stable solid [41]. Equilibrium between the dissolved bicarbonate
and dissolved carbonate establishes itself by sorption of CO2. 20
4. Integration of NaHCO3 production and CO2 capture 22
In this section a novel concept of integration of the NaHCO3 production process above described and 24
the dry carbonate CO2 capture process is presented. The integration is originally conceived for its
application in a coal fired power plant (CFPP), which is retrofitted with the dry carbonate process 26
using Na2CO3 for CO2 capture, although it can be used in other industrial applications with CO2
emissions. The flow diagram of this integration is shown in Figure 1. Part of the Na2CO3 produced 28 by trona calcination is used as sorbent make-up in the CO2 capture process while a fraction of the
CO2 released from sorbent regeneration, together with the fraction of CO2 derived from trona 30 dissociation (0.5 molCO2/moltrona), is utilized to produce in the carbonating tower NaHCO3 suitable
for sale. As Figure 1 shows H2O is used in the calciner for trona decomposition and carbonation of 32 the flue gas stream. H2O is generated in the carbonating tower during NaHCO3 production and in the
NaHCO3 regenerator. An optimized integration would recirculate these hot water streams between 34 these systems, regenerator to carbonator in the CCS system, and from the carbonating tower to the
calciner in the NaHCO3 production system. Calcination of trona and sorbent regeneration are assisted 36 by medium temperature heat, which could be available from renewable sources such as solar thermal
or biomass. If these renewable sources are used, the global system (power plant plus capture of CO2, 38

part of which is stored and the rest used for NaHCO3 production) becomes a near zero CO2 emissions
system. 2
4 Figure 1. Flow diagram of the research triangle institute (RTI) dry carbonate process for CO2
capture coupled to NaHCO3 production using raw trona and assisted by medium temperature solar 6
thermal power.
8
Figure 2 illustrates a Sankey diagram where the different routes followed by the CO2 are detailed.
10 Figure 2. Sankey diagram of CO2 routes in the overall process
12 As Figure 2 shows an amount of about 35% of CO2 produced by the CFPP is employed for NaHCO3
production while the rest is sent to the compression system and could be stored or eventually utilized 14 for others purposes.
16
18

Reference power plant 2
This section describes the main characteristics of the CFPP used in this work as reference case. CFPP
flue gases are characterized by a dilute concentration of CO2 at large volumetric flow and ambient 4
pressure, which poses a technological challenge for CO2 capture For the 15 MWel generated in the
pulverized coal-fired (PC) power plant used in our study, the exhaust gases stream is 830 m3 per 6 minute with a CO2 concentration between 10% and 15% in volume [42]. Assuming standard
performance of equipment, the pulverized coal-fired boiler combusts 6.1 tons per hour (tph) of coal 8 and generates 44.7 MWth (HHV). The boiler output provides 39.7 MWth, which yields a boiler
efficiency of 88.6%. Since the present work is focused on the postcombustion system analysis and 10 given the complexity and proprietary nature of power plant steam turbine cycles, a general 42%
thermal to electric steam cycle efficiency is assumed [43], which leads to 16.67 MWel generated. In 12 addition, a 10% in-house power plant electricity is consumed resulting in a net electrical generation
of 15 MWel delivered to the grid. 14
The relatively small size of the reference CFPP (15 MWel) has been chosen with the purpose of storing 16
the captured CO2 in tanks of reasonable volume to be ready for utilization. This size can be
representative of small coal power plants or for dealing with a fraction of the exhaust gases of bigger 18 plants. Main data for a plant of this reference CFPP are shown in Table 3. Composition of the flue
gas from the plant used for the analysis is detailed in Table 4. 20
Table 3: Power consumption for the reference CFPP [42,43] 22
Item Magnitude Unit
Coal consumption 6.1 t/h
Air in 69.2 t/h
Gross power introduced 44.7 MWth
Net power introduced 39.7 MWth
Net Power Produced 15 MWel
Net efficiency 33.5 %
24 Table 4: Flue gas flow composition from the reference CFPP [42,43].
Coal flue gas component Mole Flow(kmol/h) Mass Flow(t/h)
N2 1715.42 52.97
CO2 308.56 13.60
H2O 147.19 2.94
O2 78.18 2.76
CO 14.07 0.39
NO 13.54 0.45
SO2 3.75 0.26
26
The use of the dry carbonate process in a CFPP for CO2 capture is described in [10]. An optimized 28 integration with solar thermal energy is schematized in figure 3. Alternatively, the heat source could
be either biomass or coal. Overall, the dry carbonate process yields a CO2 removal efficiency of 92% 30 (assuming a fixed value for Na2CO3 conversion to NaHCO3 of X=0.75) and utilizes 43 ton/hr of
Na2CO3 as CO2 sorbent to remove 12.5 t/h of CO2 in a continuous cycle. A heat exchanger 32 (HEATEX1) between the flue gas leaving the power coal plant and the flow exiting the carbonator is
used for cooling the flue gas. Another heat exchanger (HEATEXCH) is interposed between the 34

incoming and the outgoing flow in the regenerator. Both heat exchangers serve to increase
significantly the total efficiency of the plant. They allow to reduce the heat required for sorbent 2 regeneration by about 10% with a thermal flow exchanged of 1,45 MWth (0.8 MWth+ 0.65 MWth).
This makes possible working with different operating conditions in the regenerator (200 °C in the 4
best case scenario and 140°C with solar radiation support). With this configuration the heat
requirement, in the case the working condition in the regenerator are set equal to T=200 °C and p=1,01 6
bar, is about 11,4 MWth (the theoretical value for the heat required using ∆𝐻 = 129,09𝑘𝐽
𝑚𝑜𝑙 at T=298
K is 10,25 MWth ). 8 The Na2CO3 make-up flow rate is 0.3 ton/hr, the heat required for Na2CO3 regeneration is around 11.4 MWth and the power consumption for CO2 compression and solid conveying is 1.58 MWel 10 (Table 5). Power demand for solid separation in two stages centrifugation can be estimated as 0.3
MWel by taking as reference a high efficiency centrifuge used as salt separator. Thus, the total 12 efficiency of the CFPP retrofitted with the dry carbonate process drops from 33.5% to 24% due to the
penalty in power and additional heat required. If medium temperature solar thermal energy is used as 14
energy input for sorbent regeneration, and taking thus into account only the penalty in power
consumption, the economic efficiency, defined in basis of the operation costs including fuel, 16 decreases just to about 30%.
18
Figure 3. Integration of the RTI dry carbonate process into a CFPP for CO2 capture [44]. 20
Table 5. Power consumption for a 15 MWel CFPP with integrated RTI dry carbonate process for 22
CO2 capture.
Power production Power consumption
CFFP 15 MWel 44.7 MWth
Regenerator 11.4 MWth
COMP 1.33 MWel
Wsolid 0.25 MWel
Centrifugation 0.3 MWel
Net Power 13.12 MWel
Total heat requirement 56.1 MWth
24

To achieve a near zero CO2 emissions global system, renewable energy must be used for heating the
calciner, either solar or biomass. In the case of solar, and to take into account its discontinuous 2 availability, different options for heat storage can be considered such as: i) heat storage using tanks
with pressurized water/steam. For instance a thermal storage of about 3 hours of steam can be 4
obtained with the support of three tanks of 350 m3; ii) molten salts tanks; iii) synthetic oils; iv) a
combination with a biomass boiler for supporting heat requirements of the post-combustion system. 6
Regarding the required CO2 storage volume, a total flow rate of 68000 m3/h in the carbonator must 8 be processed. Assuming a residence time of 15 s, a total storage volume of 270 m3 would be sufficient
for the carbonator working at low pressure. This can be achieved in practice using a CO2 storage tank 10 of 6 m in diameter and 10 m high, which is affordable with current technologies. For greater power a
sequence of standardized tanks could be used. 12
5. Na2CO3 and NaHCO3 production from trona 14
This section analyses production of Na2CO3 and NaHCO3 from trona decomposition in a fluidized 16 bed reactor working at 220 °C and 1 bar using solar thermal power as heat source. A schematic layout
of the process is shown in figure 4. For the temperatures needed in this application, medium 18
temperature parabolic troughs collectors coupled with a thermal energy storage system (i.e. with
pressurized water tanks), are suitable to provide the necessary energy input. 20
22 Figure 4. Na2CO3 and NaHCO3 production from trona assisted by solar energy.
24 As seen in figure 4, the stream of trona (CRUSHED TRONA), initially at 25°C and 1 bar, passes,
before entering the fluidized bed reactor, through a solid–solid heat exchanger (HEATEXT) where it 26 exchanges heat with the effluent Na2CO3 stream from the fluidized bed reactor (Na2CO3 HOT),
which raises trona temperature up to 127°C. Another heat exchanger (HEATEXW) transfers heat 28 from the gases and water vapor stream (CO2+STEAM) exiting the fluidized bed reactor to the water
stream (WATER IN) entering the fluidized bed, which raises up its temperature to 205 °C. The total 30
heat recovered by means of these heat exchangers amounts is 1.85 MWth as detailed in Table 6. Flow
rates of the streams entering and exiting the fluidized bed reactor are summarized in Table 7. 32
34

Table 6. Heat exchanged in NaHCO3 production according to Fig. 3.
MWth Tincold ( °C ) Touthot ( °C ) Tinhot ( °C ) Toutcold ( °C )
HEATEXCT 1.15 20 95 219 205
HEATEXW 0.7 20 40 219 127
Total Thermal Power 1.85
2

Table 7. Flow rates of streams entering and exiting the fluidized bed reactor in the NaHCO3
production according to Fig. 3. 2
Units TRONA WATIN FLUIDOUT
TRONA kmol/h 84.709 0 0
WATER kmol/h 0.387 85 307.5
CO2 kmol/h 0.002 0 42.5
WEGSC(S) kmol/h 0.096 0 0
NaHCO3 kmol/h 0.198 0 0
Na2CO3 kmol/h 0 0 127.5
Mole Flow kmol/h 146.391 85 613.5
Temperature °C 127 204 219
Pressure bar 1.01 1.01 1,01
Vapor Fraction 0 1 0.733
Solid Fraction 1 0 0.267
Mass Density kg/cum 2029 0.454 1.209
Average Molecular Weight 224 18.015 43.81
The heat required in the fludized bed reactor for decomposing 19.2 t/h of trona is 5.1 MWth at 220° 4
(the theoretical value to decompose 85 kmol/h of trona at T= 25 ° C is 3.15 MWth from the reaction
enthalpy ∆𝐻298𝐾 = 133.9𝐾𝐽
𝑚𝑜𝑙 [11][25]). Such amount of heat, which can be provided by medium 6
temperature solar thermal power, warrants the production of 13.55 t/h of Na2CO3 (Na2CO3 COLD in
Fig. 6) plus 1.85 ton/h of CO2 and 4 t/h of water (CO2 + STEAM) of which 300 kg/h are used as 8 makeup in the dry carbonate process for CO2 capture (MAKE UP) while the rest is sent to a
carbonating tower (Na2CO3 IN) to produce sodium bicarbonate (NAHCO3) using a 3.75 t/h stream 10 of pure CO2 from the carbon capture system (CO2 IN) and the CO2 and water streams released from
the fluidized bed reactor (CO2 + STEAM). From the Na2CO3 carbonation reaction (Eq. 2) it turns out 12
that 20.75 t/h of NaHCO3 are produced at a total flow rate of about 9.5 m3/h. In this way, a commercial
chemical product is produced using captured CO2 from the power plant with a higher economic value 14 than the raw mineral.
16
Overall system efficiency 18
The CFPP efficiency is reduced due to the heat employed for the production of NaHCO3, albeit an 20
economic revenue is obtained. Considering the 5.1 MWth needed in the fluidized bed reactor, the total
heat requirement is 61.2 MWth (Table 8). 22
Table 8. Heat requirement in different components for the production of NaHCO3. 24
T ( ° C ) Thermal Power consumption
CFFP 850 44.7 MWth
Regenerator 200 11.4 MWth
Fluidized bed reactor 220 5.1 MWel
Total heat requirement 61.2 MWth
By avoiding storage of part of the CO2 captured for half a day (considering 12 hours of daylight) the 26 total power consumption for compression decreases to 0.879 MWel (Table 9).
28

Table 9. Compression power for NaHCO3 production.
Component Wcomp ( MWel )
Compressor 1 ( 4.2 bar ) 0.295
Compressor 2 ( 17.5 bar ) 0.289
Compressor 3 ( 75 bar ) 0.295
Total Wcomp ( from 1 to 75 bar ) 0.879
2
For the reference CFPP with integrated CO2 capture, and considering a power consumption of 0.247
MWel for solids conveying and 0.3 MW for centrifuge stages, the global efficiency penalty is -10.2 4 % over the baseline plant and the mean global electricity production is decreased by -9%. It results
in a net efficiency of the global plant of 23 %: 6
𝜂𝑁𝐸𝑇 =13,123𝑀𝑊𝑒𝑙 ∙ 12ℎ + 13,574 𝑀𝑊𝑒𝑙 ∙ 12ℎ
56,1𝑀𝑊𝑡ℎ ∙ 12ℎ + 61,2 𝑀𝑊𝑡ℎ ∙ 12ℎ= 0.23 (16) 8
𝜂𝑁𝐸𝑇𝑒𝑙=
13,123𝑀𝑊𝑒𝑙 ∙ 12ℎ + 13,574 𝑀𝑊𝑒𝑙 ∙ 12ℎ
15 𝑀𝑊𝑒𝑙 ∙ 24ℎ= 0.89 (17) 10
If the low temperature heat required in the calciner and regenerator is provided from renewables a 12
near zero emissions system is obtained. By using solar energy for heating, that penalty on the original
plant economic efficiency amounts to only 3%, which is associated to the parasitic power 14 consumption of the post-combustion system. 16
6. Economic Analysis 18
For the economic analysis of the integrated process different scenarios are defined to analyze the
competitiveness of the technology[45]. These scenarios are defined in terms of: 20
- NaHCO3 production, to take into account the variability of demand in the market. 22 - Variation of trona costs, taking into account trona cost variability.
- Variation of NaHCO3 sale prices on the market. 24 - Different plant installation costs. To consider uncertainty in equipment cost evolution a
maximum deviation has been considered for the scenario. The variation range was taken as 26
±9% of the average installation price.
28
Attending to these criteria three scenarios are considered:
Scenario P (Pessimistic Scenario): it takes into consideration a combination of diverse factors such 30
as the highest penalty in electricity generation (it has been taken as the maximum error in estimating
parasitic electricity losses), the highest plant installation costs, the highest cost of trona, and lowest 32
sale price of NaHCO3 in the market.
Scenario BE (Best Estimation Scenario): In this scenario the values derived from the simulation 34 above described were used to define the efficiency of the system. It considers a capital cost of 3 M€
for the CCS technology [25]. This scenario uses current values of trona cost and NaHCO3 sale price 36 in the market.
Scenario O (Optimistic Scenario): this optimistic scenario implies minor trona and plant installation 38 costs.
Considering that the price of trona is in the range 80-120 $/ton [46] and that the sale price of NaHCO3 40 is around 200-240 $/ton, the economic profit for production of NaHCO3 can be calculated as:

𝐸𝑃 = 𝑝𝑁𝑎𝐻𝐶𝑂3 ∙ �̇�𝑁𝑎𝐻𝐶𝑂3 − 𝑝𝑡𝑟𝑜𝑛𝑎 ∙ �̇�𝑡𝑟𝑜𝑛𝑎 (18) 2
Here EP is the economic profit derived from NaHCO3 production, pNaHCO3 and ptrona are the selling 4
price of NaHCO3 and purchase price of trona, respectively, and �̇�𝑁𝑎𝐻𝐶𝑂3 and �̇�𝑡𝑟𝑜𝑛𝑎are the NaHCO3
and trona mass flow rates, respectively. Table 10 shows the prices calculated for the different 6 scenarios considered.
8
Table 10. Different prices for different scenarios.
Units Scen. P Scen. BE Scen. O
ptrona €/ton 120 100 80
pNaHCO3 €/ton 200 220 240
Gain €/ton 80 120 160
EGAIN €/day 22000 32000 44000
10
The investment cost of the solar technology is in the range 2.5-3.5 M€/MWth for a parabolic trough
collectors plant with thermal energy storage [47] whereas the fluidized bed reactor cost is about 0.25 12
M€/MWth with an error margin of +/-25% [48]. Operation & maintenance costs are taken as 10 % of
the baseline cost. The costs of other components of the solar field are estimated as 15% of the solar 14 capital expenditures. Table 11 summarizes the investment costs of the plant for the different scenarios
considered and according to different prices of the solar thermal technology. The total investment 16 cost (ETOT) takes into account the cost of solar technology (ESOLAR), the cost of the fluidized bed
reactor used for trona conversion (EFLUID), the cost of reactors for dry carbonate process (EDRY) and 18
the cost of operation & maintenance (EO&M).
20
Table 11: Total investment cost: NaHCO3 production + Solar Thermal.
Solar Thermal 2.5 M€/MW
Units Scen. P Scen. BE Scen. O
ESOLAR (FLUID+DECARB) M€ 42.5 41.25 40.5
EDRY M€ 4 3 2
EFLUID M€ 1.9 1.5 1.15
EO&M M€ 4.84 4.58 4.37
ETOT M€ 51.34 48.83 46.87
Units Scen. P Scen. BE Scen. O
Solar Thermal 3 M€/MW
ESOLAR (FLUID+DECARB) M€ 51 49.5 48.6
EDRY M€ 4 3 2
EFLUID M€ 1.9 1.5 1.15
EO&M M€ 5.69 5.4 5.18
ETOT M€ 60.69 57.9 55.78
Solar Thermal 3.5 M€/MW
Units Scen. P Scen. BE Scen. O
ESOLAR (FLUID+DECARB) M€ 59.5 57.75 56.7
EDRY M€ 4 3 2
EFLUID M€ 1.9 1.5 1.15
EO&M M€ 6.54 6.23 5.98
ETOT M€ 70.04 66.98 64.68
22 As can be seen in Table 11 the total investment costs are highly dependent on solar installation costs.
Total investment of the CCU system varies from 15.3 M€ to 37.15 M€ and is strongly affected by the 24

solar technology cost. Table 12 shows the total investment costs and estimated annual profit for
different scenarios and different solar technology costs. 2
Table 12: Total Investment costs and yearly revenue for scenarios of analysis. 4
TOTAL INVESTMENT SCENARIO P SCENARIO BE SCENARIO O
SOLAR THERMAL COST 2.5 M€/MW 51.34 M€ 48.83 M€ 46.87 M€
SOLAR THERMAL COST 3 M€/MW 60.69 M€ 57.90 M€ 55.78 M€
SOLAR THERMAL COST 3.5 M€/MW 70.04 M€ 66.98 M€ 64.69 M€
ANNUAL ECONOMIC PROFIT 8.08 M€ 11.58 M€ 15.08 M€
Using these data, CCU investment's simple payback period (SPB) can be evaluated. SPB is the time 6 for recovering the initial investment, which is given by:
8
𝑆𝑃𝐵 =𝐸𝑇𝑂𝑇
𝐸𝑃 (19)
Figure 5 shows estimated SPB values for the different scenarios as a function of solar thermal 10 technology investment cost and for a constant production of 7470 ton/month of NaHCO3.
12 Figure 5. SPB as a function of solar thermal technology costs for the different scenarios analyzed.
14 Figure 5 shows that relatively short SPB periods are obtained. In the worst case (Pessimistic Scenario)
the SPB period is equal to 8.7 years while in the best case it amounts to only 3 years (Optimistic 16 Scenario). These values suggest a high interest of the integration proposed in this paper, combining
the dry carbonate CO2 capture and sodium bicarbonate production using trona as raw material where 18 it is available. However, the SPB does not address the time value of money, inflation, project lifetime
or operation. For this reason, it is important to evaluate internal rate of return (IRR), which can be 20
evaluated from the definition of net present value (NPV). NPV is the sum of the discounted cash flow
minus the total investment cost: 22
𝑁𝑃𝑉 = ∑𝐸𝑁𝐸𝑇,𝐺𝐴𝐼𝑁,𝑦𝑒𝑎𝑟
(𝐼𝑅 + 1)𝑘
𝑁
𝑘=0
− 𝐸𝑇𝑂𝑇 (20) 24
26 where k represents the year number, N is the total number of years, and IR is the discount rate.
Assuming different values of the discount rate NPV value is calculated for the different scenarios and 28 as function of the solar thermal technology cost. Figures 6, 7 and 8 show the NPV calculated curves
as a function of the discount rate and for different solar thermal technology costs for a life plant of 20 30
0
1
2
3
4
5
6
7
8
9
10
2.5 3 3.5
Sim
ple
Pay
Bac
k P
erio
d
Solar Thermal Cost [M€/MW]
SCENARIO P
SCENARIO BE
SCENARIO O

years. It can be seen how consistent revenues from the sale of NaHCO3 are obtained for realistic
values of the discount rate (IR=0.08 – 0.12) in all the Scenarios. 2
4 Figure 6. Best Estimate Scenario: NPV in 20 years as function of internal rate value and solar
thermal technology costs. 6
8 Figure 7. Optimistic Scenario: NPV in 20 years as function of internal rate value and solar thermal
technology costs. 10
12 Figure 8. Pessimistic Scenario: NPV in 20 years as function of internal rate value and solar thermal
technology costs. 14
15.00
25.00
35.00
45.00
55.00
65.00
75.00
0.075 0.08 0.085 0.09 0.095 0.1 0.105 0.11 0.115 0.12 0.125
NP
V(2
0 Y
EAR
S) [
M€
]
IR
BEST ESTIMATE SCENARIO - REVENUES FROM NaHCO3 Production
SOLAR COST = 2500 €/KW
SOLAR COST = 3000 €/KW
SOLAR COST = 3500 €/KW
40.00
50.00
60.00
70.00
80.00
90.00
100.00
110.00
0.075 0.08 0.085 0.09 0.095 0.1 0.105 0.11 0.115 0.12 0.125
NP
V(2
0 Y
EAR
S) [
M€
]
IR
OPTIMISTIC SCENARIO - REVENUES FROM NaHCO3 Production
SOLAR COST = 2500 €/KW
SOLAR COST = 3000 €/KW
SOLAR COST = 3500 €/KW
0.00
5.00
10.00
15.00
20.00
25.00
30.00
0.075 0.08 0.085 0.09 0.095 0.1 0.105 0.11 0.115 0.12 0.125
NP
V(2
0 Y
EAR
S) [
M€
]
IR
PESSIMISTIC SCENARIO - REVENUES FROM NaHCO3 Production
SOLAR COST = 2500 €/KW
SOLAR COST = 3000 €/KW
SOLAR COST = 3500 €/KW

The internal rate of return (IRR) is the discount rate at which NPV is equal to zero or, in other words,
the rate at which an investment breaks even. It can be seen in Figures 6 and 7 that high values of 2 internal rate of return (IRR>0.12) are obtained, while for the pessimistic scenario the value of
IRR=0.12 is reached for a solar thermal cost of 3 M€/MW. Considering the life of the plant equal to 4
20 years the investment would be always of interest having current ordinary IR values of 0.08-0.1.
Moreover, considering an IR of 0.1 higher values of NPV are obtained. Also considering a solar 6 technology cost of 3.5 M€/MWth , it results a NPV value of 31.6 M€ with an investment cost of 67
M€ referred to the best estimate scenario. These values have been obtained assuming a constant 8 production for sale of NaHCO3. Figure 9 shows NPV values as a function of the produced NaHCO3
for the Best Estimate Scenario and using a fixed discount rate value (IR=0.1). 10
12
Figure 9. NPV in 20 years as function of NaHCO3 production and solar technology costs for a fixed 14 discount rate IR=0.1.
As shown in Figs. 8 a minimum production of sodium bicarbonate per month is needed to ensure the 16 return of the investment cost (NPV= 0). In the worst case, which comprises the maximum cost of
solar thermal technology, at least 5080 ton/month (68%) of sodium bicarbonate must be produced to 18 cover the investment with a discount rate of IR=0.1. On the other extreme, for the best case (a
minimum cost of solar thermal technology), a production of 3585 ton/month would be needed. 20
Carbon taxes 22 The previous analysis does not include any benefit in terms of taxes due to avoided CO2 emissions.
However, this technology would dramatically reduce emissions of the plant, which would result in 24 additional cost savings that would increase the interest of the investment. Table 13 summarizes the
data used for calculating the costs according to the different scenarios for a total amount of 108.9 26 kton/year avoided CO2 emissions using the dry carbonation system.
Table 13: CO2 emission data for different scenarios. 28
REFERENCE
PLANT
DRY CARBONATE
(P)
DRY CARBONATE
(BE)
DRY CARBONATE
(O)
Power (MWel) 15 15 15 15
CCS Power consumption (MWel) 2.5 1.6 1.5
Regenerator Heat requirement (MWth) 11.9 11.4 11.1
Net power (MWel) 15 12.5 13.35 13.5
CO2 Emissions (tons/hr) 13.5 1.07 1.07 1.07
CO2 Emissions (kmol/hr) 308 24.32 24.32 24.32
CO2 Avoided Emissions (kton/year) 108.9 108.9 108.9
CO2 Emissions (tons/ MWhel) 0.9 0.085 0.08 0.079
0
10
20
30
40
50
60
50 60 70 80 90 100
NP
V (
20
YEA
RS)
[M
€]
Sodium Bicarbonate Production Level (%)
BEST ESTIMATE SCENARIO - IR=0.1
SOLAR THERMAL COST 2,5 M€/MW
SOLAR THERMAL COST 3 M€/MW
SOLAR THERMAL COST 3,5 M€/MW

The carbon tax is assumed as constant during the next years in the worst scenario (Scenario P) while 2 is supposed that will increase in the future years for the optimistic scenario (Scenario O). Average
values of carbon tax are taken into account for the analysis. The gain from avoided CO2 emission is 4 given by:
6
𝐸𝐶𝑂2,𝐴𝑉𝑂𝐼𝐷𝐸𝐷 = (𝑡𝑜𝑛𝐶𝑂2,𝑟𝑒𝑓 − 𝑡𝑜𝑛𝐶𝑂2,𝐶𝐶𝑆) ∙ 𝑐𝐶𝑂2 (21)
8 Where cCO2 is the carbon tax expressed in €/tonCO2. The economic benefits derived from CO2 avoided
emissions under the different carbon tax scenarios are shown in Table 14. 10
Table 14: Revenues due to CO2 emission reduction for different scenarios (20 years). 12
SCENARIO P SCENARIO BE SCENARIO O
Carbon Tax 10 €/tonCO2 18 €/tonCO2 25 €/tonCO2
Yearly Economic Gain 1.09 M€/year 1.96 M€/year 2.72 M€/year
IR =0.08 10.89 M€ 19.60 M€ 29.00 M€
IR =0.1 8.72 M€ 15.70 M€ 23.18 M€
IR =0.12 7.71 M€ 13.88 M€ 20.33 M€
Figures 10, 11 and 12 show the economic impact due to CO2 avoided emission for different scenarios 14 and different values of IR.
16
Figure 10. Best Estimated Scenario: Economic Gain due to CO2 avoided emissions. 18
20 Figure 11. Optimistic Scenario: Economic Gain due to CO2 avoided emissions.
0
5
10
15
20
25
0 5 10 15 20
ECO
2,A
VO
IDED
[M
€]
Years
Best Estimate - Carbon Tax = 18 €/tonCO2
ir=0,12ir=0,1ir=0,08
0
5
10
15
20
25
30
35
0 5 10 15 20
ECO
2,A
VO
IDED
[M
€]
Years
Optimistic - Carbon Tax = 25 €/tonCO2
ir=0,12
ir=0,1
ir=0,08

2 Figure 12. Pessimistic Scenario: Economic Gain due to CO2 avoided emissions.
4
Under carbon taxes scenarios the NPV of the CCU investment can be recalculated adding cost savings
due to carbon taxes. Results, considering a production level of 7470 ton/month, are shown in Table 6
15, where only in the worst case (Pessimistic Scenario, maximum cost of solar thermal technology
and IR=0.12) NPV negative values are obtained. Considering the Best Estimate Scenario, with a mean 8
cost of solar technology (3M€/MW), and IR 0.1, the NPV goes up to 56.4 M€ in 20 years.
10 Table 15:NPV(20 years) values including savings from CO2 emission reduction.
IR SOLAR COST(M€/MW) SCENARIO P SCENARIO BE SCENARIO O
0,08
2.5 38.93 84.51 130.24
3 29.58 75.44 121.33
3.5 19.87 66.34 112.41
0,1
2.5 26.22 65.50 104.73
3 16.87 56.43 95.82
3.5 7.6 47.33 86.90
0,12
2.5 16.77 51.58 86.14
3 7.42 42.51 77.23
3.5 -2.29 33.41 68.31
12
Sodium bicarbonate prices 14
In figures 13 to 15 NPV data are plotted for different investment costs as a function of the sale price 16 of NaHCO3 and trona in the market and taking into account a variable production (from 50% to
100%). A fixed IR=0.1 is considered in these analyses. 18
0
2
4
6
8
10
12
0 5 10 15 20
ECO
2,A
VO
IDED
[M
€]
Years
Pessimistic - Carbon Tax = 10 €/tonCO2
ir=0,12
ir=0,1
ir=0,08

Figure 13. NPV in 20 years as function of investment costs and NaHCO3 price with 100% of 2
NaHCO3 total production.
4
Figure 14. NPV in 20 years as function of investment costs and NaHCO3 price with 75% of 6
NaHCO3 total production.
8
Figure 15. NPV in 20 years as function of investment costs and NaHCO3 price with 50% of 10
NaHCO3 total production.
12 Figures 13 to 15, give a map of CCU investment profitability as function of sodium bicarbonate price
and demand (linked to production). In this sense, production capacity depends on solar energy input. 14 For periods without solar resource availability thermal storage can be used to assure CO2 capture and
0
20
40
60
80
100
120
15 20 25 30 35 40 45 50 55 60
NP
V (
20
YEA
RS)
[M
€]
CAPEX [M€]
Revenues due to different price market for NaHCO3 and Trona - IR=0.1 - 100% Production
CNaHCO3=220€/ton - CTrona = 100€/ton
CNaHCO3=200€/ton - CTrona = 120€/ton
CNaHCO3=250€/ton - CTrona = 80€/ton
0
20
40
60
80
100
15 20 25 30 35 40 45 50 55 60
NP
V (
20
YEA
RS)
[M
€]
CAPEX [M€]
Revenues due to different price market for NaHCO3 and Trona -
IR=0.1 - 75% ProductionCNaHCO3=220€/ton - CTrona = 100€/ton CNaHCO3=200€/ton - CTrona = 120€/ton CNaHCO3=250€/ton - CTrona = 80€/ton
0
10
20
30
40
50
60
15 20 25 30 35 40 45 50 55 60
NP
V (
20
YEA
RS)
[M
€]
CAPEX [M€]
Revenues due to different price market for NaHCO3 and Trona -
IR=0.1 - 50% ProductionCNaHCO3=220€/ton - CTrona = 100€/ton
CNaHCO3=200€/ton - CTrona = 120€/ton
CNaHCO3=250€/ton - CTrona = 80€/ton

sodium bicarbonate production. The use of biomass would maintain the near zero emissions condition
and could support capture when the stored thermal energy is not able to deal with it. Another 2 important factor to consider is how NaHCO3 demand could vary on the market. For example, if the
demand raises constantly, production could be maintained at the maximum capacity but it must be 4
kept in mind that a massive introduction of the concept proposed in this paper necessarily would
affect to the sodium bicarbonate production price by reducing it. In any case this is not pretended to 6 be a global solution but one for locations with trona availability. From an economic perspective, the
market is expected to grow at 4% per year in the next few years and will reach 4.2 million tonnes by 8 2018 driven mainly by the Asia region and China in particular. The European market is expecte to
grow a 2% per year [49]. A plant of 15 MWel could produce about 40 kton of NaHCO3. Thus, such 10 production would have a relatively low impact at the global scale although the local sale impact could
be significant. Independently of sodium bicarbonate sale, the CC system results in a permanent CO2 12 fixing in the sodium bicarbonate and its integration with renewables (solar, biomass) drives to a near
CO2 emissions technology. In addition, CO2 avoided emission reduction has an economic return 14
where carbon taxes are applied.
16
Conclusions
18
In this work a novel Carbon Capture and Utilization concept is presented based on the integration of
a CO2 post-combustion system using the dry carbonate process assisted by renewables for sodium 20
bicarbonate production. Results suggest a potentially high interest of the integration. Main aspects of
the concept are: 22
Sodium bicarbonate is produced for sale and for make-up in the dry carbonate CO2 capture
process. 24
An abundant, non-toxic and cheap raw material (trona) is used.
When coupled with renewables for heating, biomass or medium temperature solar thermal, 26 technology to regenerate the sorbent and calcination of trona, the global system results in a
near to zero CO2 emissions technology with a reduced penalty in power generation. 28
NaHCO3 production could allow permanent CO2 storage.
As concept application it has been applied to the flue gases stream equivalent to a small coal 30 power plant of 15 MW, or for a fraction of flue gases of a bigger coal power plant.
Energy analysis show a minor penalty in power consumption (<3%). 32
According to the economic analysis with different Scenarios the Simple Pay Back time (SPB)
for the integrated solution has very short periods (8.7 years in the worst case and 3 years in 34 the best case) remarking the interest of the concept.
The preliminary study shows an interesting potential for advancing in this technology in 36 further studies (kinetics, sorbent deactivation, optimization of integration, equipment design,
byproducts usage, etc…). 38
When heat supply is based on solar, the proposed technology requires heat storage or support
from other sources as biomass to work continuously. Various storage technologies (phase 40 change liquid, thermal oils, molten salt) are already present on the market and a thorough
study on the relative volumes of accumulation and on the exploitation of renewable sources 42 is required to define in the best way the effective feasibility of this system.
44
46
48
50

Nomenclature 2
Components
CARBONATING TOWER CO2 capture and NaHCO3 production reactor
CARBONATOR CO2 capture reactor
COAL FIRED PLANT Coal fired plant for electricity production
COMP1 Compressor CO2 (1-10 bar)
COMP2 Compressor CO2 (10-25 bar)
COMP3 Compressor CO2 (25-75 bar)
COOL CO2 (20°C) intercooler
FLUIDIZED BED Fluidized bed reactor
HEATEX1 H2O-flue gas heat exchanger
HEATEXCH NaHCO3-Na2CO3
HEATEXT Trona - Na2CO3 heat exchanger
HEATEXW H2O - steam+CO2 heat exchanger
INTERC1 CO2 (20°C) intercooler
INTERC2 CO2 (20°C) intercooler
INTERC3 CO2 (20°C) intercooler
REGENARATOR Sorbent regenerator
SEPA1 Solid-gas separator
SEPA2 Solid-gas separator
Streams
CARBOUT Final product from carbonator
CO2 CO2 recovered from the system
CO2 IN CO2 entering the system
CO2 TO STORAGE CO2 to the storage system (20 °C, 75 bar)
CO2+STEAM CO2 and steam (220°C)
CO2+WATER CO2 and water( 95 °C)
CRUSHED TRONA Crushed Trona
FGPLANT Flue gas exits the coal fired plant
FLUE Flue gas exits the carbonator
FLUID OUT Chemical products exits the fluidized bed reactor
HOT STEAM Super heated steam (205°C)
HOT TRONA Hot Trona (125°C) entering the fluidized bed reactor
MAKE UP Sorbent Make up
NA2CO3 COLD (Fig.5) Regenerated Na2CO3 (80°C)
NA2CO3 COLD (Fig.6) Cooled Na2CO3 (40 °C)
NA2CO3 HOT (Fig.5) Regenerated Na2CO3 (200°C)
NA2CO3 HOT (Fig.6) Hot Na2CO3 (220°C)
NA2CO3 IN Chemical products enteing the NaHCO3 production reactor
NAHCO3 NaHCO3 produced by the system

NAHCO3 COLD Solids exits the carbonator ( 60°C)
NAHCO3 HOT Solits entering the regenerator(140°C)
WATER IN (Fig.5) Water CO2 capture reactor
WATER IN (Fig.6) Cold water (35 °C)
WATER OUT Process water
2
References 4
6
[1] Abanades JC, Rubin ES, Anthony EJ. Sorbent Cost and Performance in CO2 Capture
Systems. Ind Eng Chem Res 2004:3462–6. doi:10.1021/ie049962v. 8
[2] Aresta M, Dibenedetto A, Angelini A. The changing paradigm in CO2 utilization. J CO2 Util
2013;3–4:65–73. doi:10.1016/j.jcou.2013.08.001. 10 [3] IEA. Carbon Capture and Storage Technologies 2016. http://www.iea.org/topics/ccs/
(accessed December 1, 2016). 12
[4] Zhang X, Singh B, He X, Gundersen T, Deng L, Zhang S. Post-combustion carbon capture
technologies: Energetic analysis and life cycle assessment. Int J Greenh Gas Control 14
2014;27:289–98. doi:10.1016/j.ijggc.2014.06.016.
[5] Zhang W, Liu H, Sun Y, Cakstins J, Sun C, Snape CE. Parametric study on the regeneration 16 heat requirement of an amine-based solid adsorbent process for post-combustion carbon
capture. Appl Energy 2016;168:394–405. doi:10.1016/j.apenergy.2016.01.049. 18 [6] Lai S, Mani F, Passaponti M, Stoppioni P. Studio dei processi chimico-fisici di upgrading del
biogas a biometano con separazione di CO 2 mediante assorbimento con soluzioni 20 amminiche in solvente organico 2013.
[7] BAILEY RT, MCDONALD MM. CO2 CAPTURE AND USE FOR EOR IN WESTERN 22 CANADA .1. GENERAL OVERVIEW. ENERGY Convers Manag 1993;34:1145–50.
doi:10.1016/0196-8904(93)90063-G. 24
[8] Fujiki J, Chowdhury FA, Yamada H, Yogo K. Highly efficient post-combustion CO2 capture
by low-temperature steam-aided vacuum swing adsorption using a novel polyamine-based 26
solid sorbent. Chem Eng J 2017;307:273–82. doi:10.1016/j.cej.2016.08.071.
[9] Novek EJ, Shaulsky E, Fishman ZS, Pfefferle LD, Elimelech M. Low-Temperature Carbon 28 Capture Using Aqueous Ammonia and Organic Solvents. Environ Sci Technol Lett
2016;3:291–6. doi:10.1021/acs.estlett.6b00253. 30
[10] Ma’mun S, Svendsen HF, Hoff KA, Juliussen O. Selection of new absorbents for carbon
dioxide capture. Energy Convers Manag 2007;48:251–8. 32 doi:10.1016/j.enconman.2006.04.007.
[11] Tan Y, Nookuea W, Li H, Thorin E, Yan J. Property impacts on Carbon Capture and Storage 34
(CCS) processes: A review. Energy Convers Manag 2016;118:204–22.
doi:10.1016/j.enconman.2016.03.079. 36 [12] Samanta A, Zhao A, Shimizu GKH, Sarkar P, Gupta R. Post-Combustion CO 2 Capture
Using Solid Sorbents: A Review. Ind Eng Chem Res 2012;51:1438–63. 38 doi:10.1021/ie200686q.
[13] Joos L, Lejaeghere K, Huck JM, Van Speybroeck V, Smit B. Carbon capture turned upside 40 down: high-temperature adsorption & low-temperature desorption (HALD). Energy
Environ Sci 2015;8:2480–91. doi:10.1039/C5EE01690H. 42 [14] Fennell PS, Davidson JF, Dennis JS, Hayhurst AN. Regeneration of sintered limestone
sorbents for the sequestration of CO2 from combustion and other systems. J Energy Inst 44 2007;80:116–9. doi:10.1179/174602207X189175.

[15] Hammond GP, Spargo J. The prospects for coal-fired power plants with carbon capture and
storage: A UK perspective. Energy Convers Manag 2014;86:476–89. 2 doi:10.1016/j.enconman.2014.05.030.
[16] Hammond GP, Akwe SSO, Williams S. Techno-economic appraisal of fossil-fuelled power 4
generation systems with carbon dioxide capture and storage. Energy 2011;36:975–84.
doi:10.1016/j.energy.2010.12.012. 6 [17] Fu C, Gundersen T. Heat and work integration: Fundamental insights and applications to
carbon dioxide capture processes. Energy Convers Manag 2016;121:36–48. 8 doi:10.1016/j.enconman.2016.04.108.
[18] Stępczyńska-Drygas K, Łukowicz H, Dykas S. Calculation of an advanced ultra-supercritical 10 power unit with CO2 capture installation. Energy Convers Manag 2013;74:201–8.
doi:10.1016/j.enconman.2013.04.045. 12 [19] Qadir A, Sharma M, Parvareh F, Khalilpour R, Abbas A. Flexible dynamic operation of
solar-integrated power plant with solvent based post-combustion carbon capture (PCC) 14
process. Energy Convers Manag 2015;97:7–19. doi:10.1016/j.enconman.2015.02.074.
[20] Zhai R, Li C, Qi J, Yang Y. Thermodynamic analysis of CO2 capture by calcium looping 16
process driven by coal and concentrated solar power. Energy Convers Manag 2016;117:251–
63. doi:10.1016/j.enconman.2016.03.022. 18 [21] Rahman FA, Aziz MMA, Saidur R, Bakar WAWA, Hainin M., Putrajaya R, et al. Pollution
to solution: Capture and sequestration of carbon dioxide (CO2) and its utilization as a 20
renewable energy source for a sustainable future. Renew Sustain Energy Rev 2017;71:112–
26. doi:10.1016/j.rser.2017.01.011. 22
[22] Joos L, Huck JM, Van Speybroeck V, Smit B. Cutting the cost of carbon capture: a case for
carbon capture and utilization. Faraday Discuss 2016;192:391–414. 24 doi:10.1039/C6FD00031B.
[23] Meisen A, Shuai X. Research and development issues in CO2 capture. Energy Convers 26 Manag 1997;38:S37–42. doi:10.1016/S0196-8904(96)00242-7.
[24] Swaddle TW (Thomas W. Inorganic chemistry : an industrial and environmental perspective. 28 Academic Press; 1997.
[25] Nelson TO, Coleman LJI, Green DA, Gupta RP. The dry carbonate process: Carbon dioxide 30 recovery from power plant flue gas. Energy Procedia, vol. 1, Elsevier; 2009, p. 1305–11.
doi:10.1016/j.egypro.2009.01.171. 32
[26] Nelson TO, Coleman LJI, Green DA, Gupta RP. The dry carbonate process: Carbon dioxide
recovery from power plant flue gas. Energy Procedia 2009;1:1305–11. 34
doi:10.1016/j.egypro.2009.01.171.
[27] Intratec Solutions. Chlorine Production from Sodium Chloride - Cost Analysis - Chlorine 36 E11A - Intratec Solutions - Google Libros. 2016.
[28] Wyoming Mining Association. Wyoming Mining Association: Trona Mining n.d. 38 http://www.wyomingmining.org/minerals/trona/ (accessed December 1, 2016).
[29] Harris RE. Fifty Years of Wyoming Trona Mining 1997:177–82. 40
[30] Manega PC, Bieda S. Modern sediments of Lake Natron, Tanzania. Sci Geol - Bull
1987;40:83–95. 42 [31] Eckardt FD, Drake N, Goudie AS, White K, Viles H. The role of playas in pedogenic
gypsum crust formation in the Central Namib Desert: A theoretical model. Earth Surf Process 44 Landforms 2001;26:1177–93. doi:10.1002/esp.264.
[32] Helvaci C. The Beypazari trona deposit, Ankara Province, Turkey. Proc First Int Soda Ash 46
1998.
[33] Zhang Y. Geology of the Wucheng trona deposit in Henan, China - Google Académico. 48 Sixth Int. Symp. salt, 1985, p. 67–73.
[34] Vanderzee E. 1982, 14, 219-238. J Chem Thermodyn 1982;14:219–38. doi:10.1016/0021-50 9614(82)90013-1.

[35] Berg RL, Vanderzee CE. Enthalpies of dilution of sodium carbonate and sodium hydrogen
carbonate solutions, and the standard enthalpies of ionization of aqueous carbonic acid, at 2 298.15 K. J Chem Thermodyn 1978;10:1049–75. doi:10.1016/0021-9614(78)90080-0.
[36] Haynes HW. Thermodynamic solution model for trona brines. AIChE J 2003;49:1883–94. 4
doi:10.1002/aic.690490724.
[37] Gärtner RS, Witkamp GJ. Wet calcining of trona (sodium sesquicarbonate) and bicarbonate 6 in a mixed solvent. J Cryst Growth 2002;237:2199–204. doi:10.1016/S0022-0248(01)02275-
8. 8 [38] Heda PK, Dollimore D, Alexander KS, Chen D, Law E, Bicknell P. A method of assessing
solid state reactivity illustrated by thermal decomposition experiments on sodium 10 bicarbonate. Thermochim Acta 1995;255:255–72. doi:10.1016/0040-6031(94)02154-G.
[39] Otsubo, Y., & Yamaguchi K. THERMOCHEMICAL PROPERTIES AND REACTION 12 PROCESSES OF ALKALI CARBONATE-FERRIC OXIDE SYSTEMS AS
INVESTIGATED BY MEANS OF DIFFERENTIAL THERMAL METHOD. Nippon 14
Kagaku Zasshi, 1961;82:557–60.
[40] Jared Sanford Sproul ER. US 3869538 A Process for producing sodium carbonate from 16
trona. US3869538 A, 1973.
[41] R. S. GÄRTNER. MIXED SOLVENT REACTIVE RECRYSTALLIZATION OF SODIUM 18 CARBONATE. Universität Dortmund, 2005.
[42] Ciferno JP, Fout TE, Jones AP, Murphy JT. Capturing Carbon from Existing Coal-Fired 20
Power Plants. Chem Eng Prog 2009;105:33–41.
[43] Romeo LM, Abanades JC, Escosa JM, Paño J, Giménez A, Sánchez-Biezma A, et al. 22
Oxyfuel carbonation/calcination cycle for low cost CO2 capture in existing power plants.
Energy Convers Manag 2008;49:2809–14. doi:10.1016/j.enconman.2008.03.022. 24 [44] D. Bonaventura, R. Chacartegui, J.M Valverde JAB. Dry Carbonate process for CO2 capture,
SDEWES.SEE2016.0073. 2nd SDEWES SEE, Piran: SDEWES Centre; 2016. 26 [45] J. Carlos Abanades *,†, G. Grasa ‡, M. Alonso †, N. Rodriguez †, E. J. Anthony § and,
Romeo‖ LM. Cost Structure of a Postcombustion CO2 Capture System Using CaO 2007. 28 doi:10.1021/ES070099A.
[46] FMC Soda Ash Plant, Wyoming - Chemicals Technology n.d. http://www.chemicals-30 technology.com/projects/sodaash/ (accessed December 1, 2016).
[47] Solare Termodinamico Fonte Enea 2016. http://energia.regione.emilia-32
romagna.it/documenti/doc-fonti-rinnovabili/solare-termodinamico-fonte-enea (accessed
December 1, 2016). 34
[48] Guo Z, Wang Q, Fang M, Luo Z, Cen K. Thermodynamic and economic analysis of
polygeneration system integrating atmospheric pressure coal pyrolysis technology with 36 circulating fluidized bed power plant. Appl Energy 2014;113:1301–14.
doi:10.1016/j.apenergy.2013.08.086. 38 [49] Market Pubblisher. Global Sodium Bicarbonate Industry Market Research 2016. 2016.
40

Figures Captions 2
Figure 1. Flow diagram of the research triangle institute (RTI) dry carbonate process for 4 CO2 capture coupled to NaHCO3 production using raw trona and assisted by medium temperature solar thermal power. 6
Figure 2. Sankey diagram of CO2 patterns in the overall process 8
Figure 3. Integration of the RTI dry carbonate process into a CFPP for CO2 capture [44]. 10
Figure 4. Na2CO3 and NaHCO3 production from trona assisted by solar energy. 12
Figure 5. SPB as a function of solar thermal technology costs for the different scenarios 14
analyzed. 16
Figure 6. Best Estimate Scenario: NPV in 20 years as function of internal rate value and solar thermal technology costs. 18
Figure 7. Optimistic Scenario: NPV in 20 years as function of internal rate value and solar 20
thermal technology costs. 22 Figure 8. Pessimistic Scenario: NPV in 20 years as function of internal rate value and solar
thermal technology costs. 24
Figure 9. NPV in 20 years as function of NaHCO3 production and solar technology costs 26 for a fixed discount rate IR=0.1.
28 Figure 10. Best Estimated Scenario: Economic Gain due to CO2 avoided emissions. 30 Figure 11. Optimistic Scenario: Economic Gain due to CO2 avoided emissions. 32
Figure 12. Pessimistic Scenario: Economic Gain due to CO2 avoided emissions. 34
Figure 13. NPV in 20 years as function of investment costs and NaHCO3 price with 100% of NaHCO3 total production. 36
Figure 14. NPV in 20 years as function of investment costs and NaHCO3 price with 75% of 38
NaHCO3 total production. 40 Figure 15. NPV in 20 years as function of investment costs and NaHCO3 price with 50% of NaHCO3 total production. 42
44

Tables Captions
Table 1. Natural trona composition [20]. 2 Table 2. Best fitting parameters used in the model for the equilibrium constant Ks (Eq. 15) 4
of the reactions involved in NaHCO3 production from raw trona. 6
Table 3: Power consumption for the reference CFPP [42,43] 8 Table 4: Flue gas flow composition from the reference CFPP [42,43]. 10
Table 5. Power consumption for a 15 MWel CFPP with integrated RTI dry carbonate process for CO2 capture. 12
Table 6. Heat exchanged in NaHCO3 production according to Fig. 3. 14 Table 7. Flow rates of streams entering and exiting the fluidized bed reactor in the NaHCO3 16
production according to Fig. 3. 18
Table 8. Heat requirement in different components for the production of NaHCO3. 20
Table 9. Compression power for NaHCO3 production. 22
Table 10. Different prices for different scenarios. 24
Table 11: Total investment cost: NaHCO3 production + Solar Thermal. 26
Table 12: Total Investment costs and yearly revenue for scenarios of analysis. 28
Table 13: CO2 emission data for different scenarios. 30
Table 14: Revenues due to CO2 emission reduction for different scenarios (20 years). 32 Table 15:NPV(20 years) values including savings from CO2 emission reduction. 34
36

2
Figures
4
Figure 1. Flow diagram of the research triangle institute (RTI) dry carbonate process for CO2 capture coupled to NaHCO3 production using raw 6
trona and assisted by medium temperature solar thermal power. 8

2
4
6
8 Figure 2. Sankey diagram of CO2 routes in the overall process
10
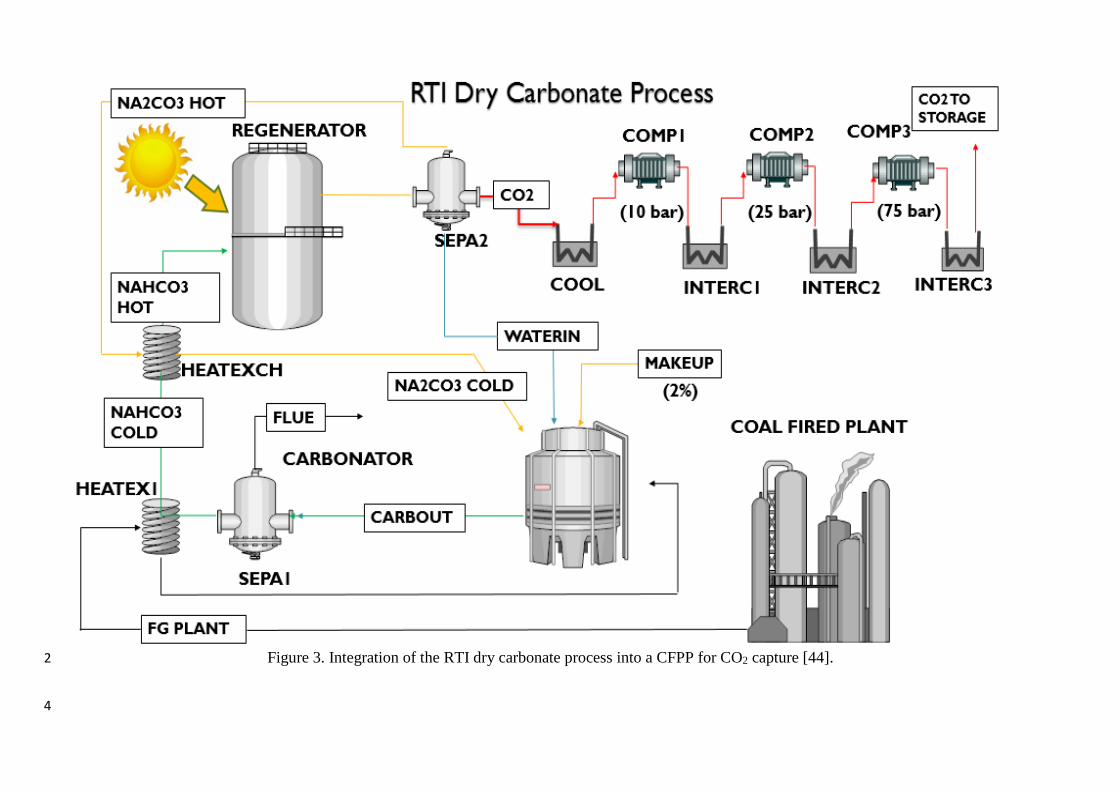
Figure 3. Integration of the RTI dry carbonate process into a CFPP for CO2 capture [44]. 2
4

2
4
Figure 4. Na2CO3 and NaHCO3 production from trona assisted by solar energy. 6

2
Figure 5. SPB as a function of solar thermal technology costs for the different scenarios analyzed. 4
0
1
2
3
4
5
6
7
8
9
10
2.5 3 3.5
Sim
ple
Pay
Bac
k P
erio
d
Solar Thermal Cost [M€/MW]
SCENARIO P
SCENARIO BE
SCENARIO O

2 Figure 6. Best Estimate Scenario: NPV in 20 years as function of internal rate value and solar
thermal technology costs. 4
6 Figure 7. Optimistic Scenario: NPV in 20 years as function of internal rate value and solar thermal
technology costs. 8
10 Figure 8. Pessimistic Scenario: NPV in 20 years as function of internal rate value and solar thermal
technology costs. 12
15.00
25.00
35.00
45.00
55.00
65.00
75.00
0.075 0.08 0.085 0.09 0.095 0.1 0.105 0.11 0.115 0.12 0.125
NP
V(2
0 Y
EAR
S) [
M€
]
IR
BEST ESTIMATE SCENARIO - REVENUES FROM NaHCO3 Production
SOLAR COST = 2500 €/KW
SOLAR COST = 3000 €/KW
SOLAR COST = 3500 €/KW
40.00
50.00
60.00
70.00
80.00
90.00
100.00
110.00
0.075 0.08 0.085 0.09 0.095 0.1 0.105 0.11 0.115 0.12 0.125
NP
V(2
0 Y
EAR
S) [
M€
]
IR
OPTIMISTIC SCENARIO - REVENUES FROM NaHCO3 Production
SOLAR COST = 2500 €/KW
SOLAR COST = 3000 €/KW
SOLAR COST = 3500 €/KW
0.00
5.00
10.00
15.00
20.00
25.00
30.00
0.075 0.08 0.085 0.09 0.095 0.1 0.105 0.11 0.115 0.12 0.125
NP
V(2
0 Y
EAR
S) [
M€
]
IR
PESSIMISTIC SCENARIO - REVENUES FROM NaHCO3 Production
SOLAR COST = 2500 €/KW
SOLAR COST = 3000 €/KW
SOLAR COST = 3500 €/KW

2
4
6
8
10
Figure 9. NPV in 20 years as function of NaHCO3 production and solar technology costs for a fixed
discount rate IR=0.1. 12
14
0
10
20
30
40
50
60
50 60 70 80 90 100
NP
V (
20
YEA
RS)
[M
€]
Sodium Bicarbonate Production Level (%)
BEST ESTIMATE SCENARIO - IR=0.1
SOLAR THERMAL COST 2,5 M€/MW
SOLAR THERMAL COST 3 M€/MW
SOLAR THERMAL COST 3,5 M€/MW

Figure 10. Best Estimated Scenario: Economic Gain due to CO2 avoided emissions. 2
4 Figure 11. Optimistic Scenario: Economic Gain due to CO2 avoided emissions.
6
Figure 12. Pessimistic Scenario: Economic Gain due to CO2 avoided emissions. 8
0
5
10
15
20
25
0 5 10 15 20
ECO
2,A
VO
IDED
[M
€]
Years
Best Estimate - Carbon Tax = 18 €/tonCO2
ir=0,12
ir=0,1
ir=0,08
0
5
10
15
20
25
30
35
0 5 10 15 20
ECO
2,A
VO
IDED
[M
€]
Years
Optimistic - Carbon Tax = 25 €/tonCO2
ir=0,12
ir=0,1
ir=0,08
0
2
4
6
8
10
12
0 5 10 15 20
ECO
2,A
VO
IDED
[M
€]
Years
Pessimistic - Carbon Tax = 10 €/tonCO2
ir=0,12
ir=0,1
ir=0,08

Figure 13. NPV in 20 years as function of investment costs and NaHCO3 price with 100% of 2
NaHCO3 total production.
4
Figure 14. NPV in 20 years as function of investment costs and NaHCO3 price with 75% of 6
NaHCO3 total production.
8
Figure 15. NPV in 20 years as function of investment costs and NaHCO3 price with 50% of 10
NaHCO3 total production. 12
0
20
40
60
80
100
120
15 20 25 30 35 40 45 50 55 60
NP
V (
20
YEA
RS)
[M
€]
CAPEX [M€]
Revenues due to different price market for NaHCO3 and Trona - IR=0.1 -100% Production
CNaHCO3=220€/ton - CTrona = 100€/ton CNaHCO3=200€/ton - CTrona = 120€/ton CNaHCO3=250€/ton - CTrona = 80€/ton
0
10
20
30
40
50
60
70
80
90
15 20 25 30 35 40 45 50 55 60
NP
V (
20
YEA
RS)
[M
€]
CAPEX [M€]
Revenues due to different price market for NaHCO3 and Trona - IR=0.1 -
75% ProductionCNaHCO3=220€/ton - CTrona = 100€/ton CNaHCO3=200€/ton - CTrona = 120€/ton CNaHCO3=250€/ton - CTrona = 80€/ton
0
10
20
30
40
50
60
15 20 25 30 35 40 45 50 55 60
NP
V (
20
YEA
RS)
[M
€]
CAPEX [M€]
Revenues due to different price market for NaHCO3 and Trona - IR=0.1 -
50% Production
CNaHCO3=220€/ton - CTrona = 100€/ton
CNaHCO3=200€/ton - CTrona = 120€/ton
CNaHCO3=250€/ton - CTrona = 80€/ton

Tables 2
Table 1. Natural trona composition [20].
Component Wt%
Na2CO3 46,53
NaHCO3 34,82
Na2SO4 0,568
insolubles 2,98
hydration water 14,92
others 0,182
4
Table 2. Best fitting parameters used in the model for the equilibrium constant Ks (Eq. 15) of the reactions 6 involved in NaHCO3 production from raw trona.
A B C D
REACTIONS 𝐶𝑂2 + 2𝐻2𝑂 𝐻3𝑂+ + 𝐻𝐶𝑂3
− 231.47 -12092.7 -36.78 0
𝐻𝐶𝑂3− + 𝐻2𝑂 𝐻3𝑂+ + 𝐶𝑂3
− 216.05 -1243.7 -35.48 0
𝑁𝑎𝐻𝐶𝑂3𝑁𝑎+ + 𝐻𝐶𝑂3− -63.26 -1308.41 13.48 -0.034
𝑁𝑎2𝐶𝑂32𝑁𝑎+ + 𝐶𝑂3− -548.32 18070.74 94.75 -0.165
𝑁𝑎2𝐶𝑂3 ∙ 𝐻2𝑂2𝑁𝑎+ + 𝐶𝑂3− + 𝐻2𝑂 281.77 -9970.6 -44.56 0.0221
𝑁𝑎2𝐶𝑂3 ∙ 7𝐻2𝑂2𝑁𝑎+ + 𝐶𝑂3− + 7𝐻2𝑂 484.91 -18935 -80.12 0.114
𝑁𝑎2𝐶𝑂3 ∙ 10𝐻2𝑂2𝑁𝑎+ + 𝐶𝑂3− + 10 𝐻2𝑂 1165.01 -37.81 -200.08 0.335
2(𝑁𝑎2𝐶𝑂3 ∙ 𝑁𝑎𝐻𝐶𝑂3 ∙ 2𝐻2𝑂)3𝑁𝑎+ + 𝐶𝑂3−−
+ 𝐻𝐶𝑂3− + 2𝐻2𝑂 277.24 -14523.8 -41.0 0.0085
𝑁𝑎2𝐶𝑂3 ∙ 3𝑁𝑎𝐻𝐶𝑂35𝑁𝑎+ + 𝐶𝑂3−− + 3𝐻𝐶𝑂3
− -1209.46 29113.05 213.72 -0.363
8
10
Table 3: Power consumption for the reference CFPP [42,43]
Item Magnitude Unit
Coal consumption 6.1 t/h
Air in 69.2 t/h
Gross power introduced 44.7 MWth
Net power introduced 39.7 MWth
Net Power Produced 15 MWel
Net efficiency 33.5 %
12

2
Table 4: Flue gas flow composition from the reference CFPP [42,43]. 4
Coal flue gas component Mole Flow(kmol/h) Mass Flow(t/h)
N2 1715.42 52.97
CO2 308.56 13.60
H2O 147.19 2.94
O2 78.18 2.76
CO 14.07 0.39
NO 13.54 0.45
SO2 3.75 0.26
6
Table 5. Power consumption for a 15 MWel CFPP with integrated RTI dry carbonate process for 8 CO2 capture.
Power production Power consumption
CFFP 15 MWel 44.7 MWth
Regenerator 11.4 MWth
COMP 1.33 MWel
Wsolid 0.25 MWel
Centrifugation 0.3 MWel
Net Power 13.12 MWel
Total heat requirement 56.1 MWth
10
12
Table 6. Heat exchanged in NaHCO3 production according to Fig. 3. 14
MWth Tincold ( °C ) Touthot ( °C ) Tinhot ( °C ) Toutcold ( °C )
HEATEXCT 1.15 20 95 219 205
HEATEXW 0.7 20 40 219 127
Total Thermal Power 1.85
16

2
4
Table 7. Flow rates of streams entering and exiting the fluidized bed reactor in the NaHCO3 6 production according to Fig. 3.
Units TRONA WATIN FLUIDOUT
TRONA kmol/h 84.709 0 0
WATER kmol/h 0.387 85 307.5
CO2 kmol/h 0.002 0 42.5
WEGSC(S) kmol/h 0.096 0 0
NaHCO3 kmol/h 0.198 0 0
Na2CO3 kmol/h 0 0 127.5
Mole Flow kmol/h 146.391 85 613.5
Temperature °C 127 204 219
Pressure bar 1.01 1.01 1,01
Vapor Fraction 0 1 0.733
Solid Fraction 1 0 0.267
Mass Density kg/cum 2029 0.454 1.209
Average Molecular Weight 224 18.015 43.81
8
10
Table 8. Heat requirement in different components for the production of NaHCO3.
T ( ° C ) Thermal Power consumption
CFFP 850 44.7 MWth
Regenerator 200 11.4 MWth
Fluidized bed reactor 220 5.1 MWel
Total heat requirement 61.2 MWth
12
14
Table 9. Compression power for NaHCO3 production.
Component Wcomp ( MWel )
Compressor 1 ( 4.2 bar ) 0.295
Compressor 2 ( 17.5 bar ) 0.289
Compressor 3 ( 75 bar ) 0.295
Total Wcomp ( from 1 to 75 bar ) 0.879
16
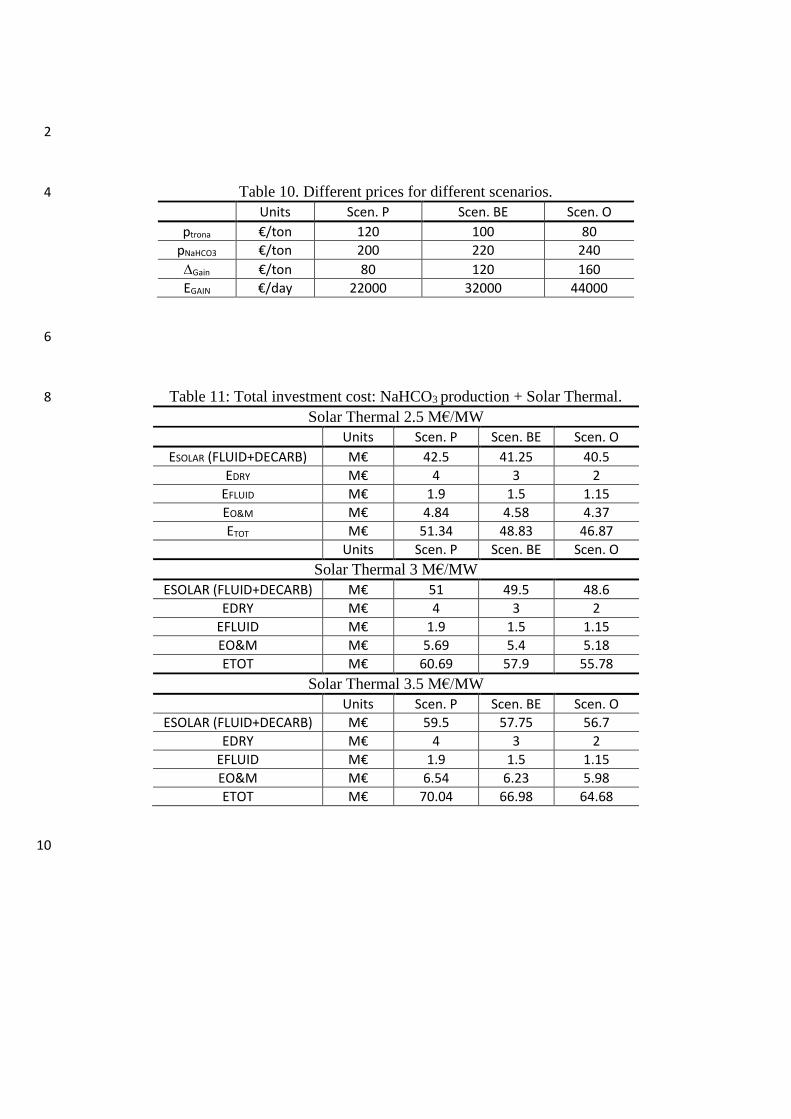
2
Table 10. Different prices for different scenarios. 4
Units Scen. P Scen. BE Scen. O
ptrona €/ton 120 100 80
pNaHCO3 €/ton 200 220 240
Gain €/ton 80 120 160
EGAIN €/day 22000 32000 44000
6
Table 11: Total investment cost: NaHCO3 production + Solar Thermal. 8
Solar Thermal 2.5 M€/MW
Units Scen. P Scen. BE Scen. O
ESOLAR (FLUID+DECARB) M€ 42.5 41.25 40.5
EDRY M€ 4 3 2
EFLUID M€ 1.9 1.5 1.15
EO&M M€ 4.84 4.58 4.37
ETOT M€ 51.34 48.83 46.87
Units Scen. P Scen. BE Scen. O
Solar Thermal 3 M€/MW
ESOLAR (FLUID+DECARB) M€ 51 49.5 48.6
EDRY M€ 4 3 2
EFLUID M€ 1.9 1.5 1.15
EO&M M€ 5.69 5.4 5.18
ETOT M€ 60.69 57.9 55.78
Solar Thermal 3.5 M€/MW
Units Scen. P Scen. BE Scen. O
ESOLAR (FLUID+DECARB) M€ 59.5 57.75 56.7
EDRY M€ 4 3 2
EFLUID M€ 1.9 1.5 1.15
EO&M M€ 6.54 6.23 5.98
ETOT M€ 70.04 66.98 64.68
10

Table 12: Total Investment costs and yearly revenue for scenarios of analysis. 2
TOTAL INVESTMENT SCENARIO P SCENARIO BE SCENARIO O
SOLAR THERMAL COST 2.5 M€/MW 51.34 M€ 48.83 M€ 46.87 M€
SOLAR THERMAL COST 3 M€/MW 60.69 M€ 57.90 M€ 55.78 M€
SOLAR THERMAL COST 3.5 M€/MW 70.04 M€ 66.98 M€ 64.69 M€
ANNUAL ECONOMIC PROFIT 8.08 M€ 11.58 M€ 15.08 M€
4
Table 13: CO2 emission data for different scenarios.
REFERENCE
PLANT
DRY CARBONATE
(P)
DRY CARBONATE
(BE)
DRY CARBONATE
(O)
Power (MWel) 15 15 15 15
CCS Power consumption (MWel) 2.5 1.6 1.5
Regenerator Heat requirement (MWth) 11.9 11.4 11.1
Net power (MWel) 15 12.5 13.35 13.5
CO2 Emissions (tons/hr) 13.5 1.07 1.07 1.07
CO2 Emissions (kmol/hr) 308 24.32 24.32 24.32
CO2 Avoided Emissions (kton/year) 108.9 108.9 108.9
CO2 Emissions (tons/ MWhel) 0.9 0.085 0.08 0.079
6
Table 14: Revenues due to CO2 emission reduction for different scenarios (20 years). 8
SCENARIO P SCENARIO BE SCENARIO O
Carbon Tax 10 €/tonCO2 18 €/tonCO2 25 €/tonCO2
Yearly Economic Gain 1.09 M€/year 1.96 M€/year 2.72 M€/year
IR =0.08 10.89 M€ 19.60 M€ 29.00 M€
IR =0.1 8.72 M€ 15.70 M€ 23.18 M€
IR =0.12 7.71 M€ 13.88 M€ 20.33 M€
10
12 Table 15:NPV(20 years) values including savings from CO2 emission reduction.
IR SOLAR COST(M€/MW) SCENARIO P SCENARIO BE SCENARIO O
0,08
2.5 38.93 84.51 130.24
3 29.58 75.44 121.33
3.5 19.87 66.34 112.41
0,1
2.5 26.22 65.50 104.73
3 16.87 56.43 95.82
3.5 7.6 47.33 86.90
0,12
2.5 16.77 51.58 86.14
3 7.42 42.51 77.23
3.5 -2.29 33.41 68.31
14