carbon and hydrogen isotopic ratios of atmospheric methane
TRANSCRIPT

Atmos. Chem. Phys., 12, 8095–8113, 2012www.atmos-chem-phys.net/12/8095/2012/doi:10.5194/acp-12-8095-2012© Author(s) 2012. CC Attribution 3.0 License.
AtmosphericChemistry
and Physics
Carbon and hydrogen isotopic ratios of atmospheric methane in theupper troposphere over the Western Pacific
T. Umezawa1,*, T. Machida2, K. Ishijima 3, H. Matsueda4, Y. Sawa4, P. K. Patra3, S. Aoki1, and T. Nakazawa1
1Center for Atmospheric and Oceanic Studies, Graduate School of Science, Tohoku University, Sendai, Japan2National Institute for Environmental Studies, Tsukuba, Japan3Research Institute for Global Change, JAMSTEC, Yokohama, Japan4Meteorological Research Institute, Tsukuba, Japan* now at: Max Planck Institute for Chemistry, Mainz, Germany
Correspondence to:T. Umezawa ([email protected])
Received: 8 March 2012 – Published in Atmos. Chem. Phys. Discuss.: 10 April 2012Revised: 23 August 2012 – Accepted: 25 August 2012 – Published: 10 September 2012
Abstract. We present the mixing ratio,δ13C andδD of at-mospheric CH4 using commercial aircraft in the upper tro-posphere (UT) over the Western Pacific for the period De-cember 2005–September 2010. The observed results werecompared with those obtained using commercial containerships in the lower troposphere (LT) over the same region.In the Northern Hemisphere (NH), the UT CH4 mixing ra-tio shows high values in the boreal summer–autumn, whenthe LT CH4 mixing ratio reaches a seasonal minimum. Fromtagged tracer experiments made using an atmospheric chem-istry transport model, we found that such high CH4 valuesare due to rapid transport of air masses influenced by CH4sources in South Asia and East Asia. The observed isotopicratio data imply that these areas have CH4 sources with rela-tively low δ13C andδD signatures such as biogenic sources.Latitudinal distributions of the annual average UT and LTCH4 mixing ratio intersect each other in the tropics; the mix-ing ratio value is lower in the UT than in the LT in the NH andthe situation is reversed in the Southern Hemisphere (SH),due mainly to the NH air intrusion into the SH through theUT. Such intersection of the latitudinal distributions is ob-servable inδD but not inδ13C, implying an additional con-tribution from reaction of CH4 with active chlorine in themarine boundary layer.δ13C andδD show low values in theNH and high values in the SH both in the UT and in the LT.We also observed an increase in the CH4 mixing ratio and
decreases inδ13C andδD during 2007–2008 in the UT andLT over the Western Pacific, possibly due to enhanced bio-genic emissions in the tropics and NH.
1 Introduction
Methane (CH4) is an important trace gas in atmosphericchemistry and climate. CH4 is emitted into the atmospherefrom natural and anthropogenic sources, and it is destroyedmainly by reaction with hydroxyl radical (OH) in the tropo-sphere. The global average CH4 budget is relatively well con-strained, for example, to be (514± 14) Tg a−1 (in CH4) ofnet emissions from the surface during the 2000s (Patra et al.,2011), but there are still large uncertainties in quantitative es-timation of individual strengths and distributions (e.g. Forsteret al., 2007). Ice core analyses revealed low CH4 levels ofapproximately 700 parts per billion (ppb = nmol mol−1) inthe pre-industrial/agricultural era, followed by rapid increasedue to anthropogenic CH4 emissions (e.g. Nakazawa et al.,1993a; Etheridge et al., 1998). Systematic measurements ofthe atmospheric CH4 mixing ratio were initiated in the late1970s (Blake and Rowland, 1986), and they found that atmo-spheric CH4 increased at rates of 10–20 ppb a−1 in the 1980s.This increase slowed greatly in the early 1990s until becom-ing nearly zero in 1999, and then the CH4 mixing ratio began
Published by Copernicus Publications on behalf of the European Geosciences Union.
8096 T. Umezawa et al.: Methane isotopes in the troposphere over the Western Pacific
to increase again after 2007 (Dlugokencky et al., 2003, 2009;Rigby et al., 2008; Terao et al., 2011). The globally averagedCH4 mixing ratio is reported to have been 1794 ppb in 2009(Dlugokencky et al., 2011).
The atmospheric CH4 mixing ratio has been observedmostly at surface baseline stations (e.g. Steele et al., 1987;Cunnold et al., 2002), and the data obtained were used toprovide a global picture of atmospheric CH4 variations, aswell as to constrain atmospheric chemistry transport mod-els for estimation of the global CH4 budget (e.g. Fung et al.,1991; Bousquet et al., 2006; Patra et al., 2009). However, ithas been pointed out that the present observation network ofatmospheric CH4 is not sufficient for describing atmosphericCH4 variations caused by regional sources (Fung et al., 1991;Chen and Prinn, 2006; Houweling et al., 2006; Bousquet etal., 2011). On the other hand, satellite observations can covera spatially wide area at the cost of less precise individualmeasurements relative to the high precision of laboratory-based observations. In fact, the data from the Scanning Imag-ing Absorption Spectrometer for Atmospheric Chartogra-phy (SCIAMACHY) aboard the ENVISAT satellite revealedthe atmospheric CH4 variations over such regions as Asia,Africa and South America where important CH4 sources ex-ist but direct atmospheric CH4 observations are very sparse(Frankenberg et al., 2011). Data from SCIAMACHY werealso used for inverse modeling to improve our knowledge ofthe distributions of CH4 sources (Bergamaschi et al., 2007,2009). CH4 data by the Greenhouse gases Observing SATel-lite (GOSAT) are also becoming available, which are likelyto constrain surface emissions at weekly to monthly time in-tervals (Yoshida et al., 2011). Aircraft observations using agrab sampling technique with subsequent laboratory analy-sis are also helpful for high-precision measurements of CH4mixing ratio in the upper troposphere (UT). However, regularmeasurements using dedicated research aircraft are expen-sive, and the number of aircraft observations for trace gases islimited (Nakazawa et al., 1993b; Francey et al., 1999; Milleret al., 2007).
Commercial airliners have also been used for measure-ments of trace gases over a long distances, particularly in theUT. The Tohoku University group conducted trace gas ob-servations on domestic and international flights by Toa Do-mestic Airlines (renamed Japan Air System later) and JapanAirlines (JAL) (Tanaka et al., 1983, 1987a; Nakazawa et al.,1991, 1993b; Ishijima et al., 2001, 2010). Observations ofCO2, CH4 and CO in the UT over the Western Pacific werealso conducted using JAL aircraft by the MeteorologicalResearch Institute, Japan (Matsueda and Inoue 1996; Mat-sueda et al., 1998, 2002). This observation program has beenmerged into a new project named CONTRAIL (Compre-hensive Observation Network for TRace gases by AILiner)(Machida et al., 2008).
Regular measurements of trace gases using commercialaircraft are also made through the CARIBIC project (CivilAircraft for the Regular Investigation of the atmosphere
Based on an Instrument Container) (Brenninkmeijer et al.,2007). This program reported an interesting phenomenonthat the mixing ratios of greenhouse gases and nonmethanehydrocarbons are high in the UT (approximately 10–12 km)over South Asia during the Asian summer monsoon sea-son of June–September (Schuck et al., 2010; Baker et al.,2011). Such high CH4 mixing ratios were also found bysatellite measurements (Park et al., 2004; Xiong et al., 2009).It is known that the Asian region (South Asia, East Asiaand Southeast Asia) has important natural and anthropogenicCH4 sources including rice paddies with annual emissionsof ∼20–50 Tg a−1, livestock with∼26–36 Tg a−1, fossilfuel consumption of∼10–20 Tg a−1 and natural wetlands of∼40 Tg a−1 (Fung et al., 1991; Olivier and Berdowski, 2001;Yan et al., 2003; Yamaji et al., 2003; Streets et al., 2003; Xiaoet al., 2004). However, since systematic observations of theCH4 mixing ratio in rapidly developing Asian countries, suchas China and India, remain sparse (Lal et al., 2004; Zhou etal., 2004; Bhattacharya et al., 2009), quantitative understand-ing of CH4 sources in this region is insufficient.
Carbon and hydrogen isotopic ratios of CH4 (δ13C andδD)are useful for distinguishing contributions of individual CH4sources to atmospheric CH4 variations, since each source hasits own isotopic signature, the average values ofδ13C andδD being about−60 and−300 ‰ for biogenic sources,−40and−180‰ for fossil fuel sources, and−25 and−200 ‰for biomass burning sources (Quay et al., 1999). The liter-atures give a range of values for the source type. Namely,for biogenic sources, previous studies giveδ13C andδD val-ues ranging from−80 to−40 ‰ and−400 to−300 ‰, re-spectively (e.g. Whiticar and Schaefer, 2007). For fossil fuelsources, Schoell (1980) gives values from−90 to −30 ‰for δ13C and−280 to−130 ‰ for δD. For biomass burn-ing sources,δ13C andδD range from−30 to −16 ‰ and−330 to −190 ‰, respectively (e.g. Yamada et al., 2006;Umezawa et al., 2011). The number of isotopic observa-tions of atmospheric CH4 has increased since a continuous-flow measurement technique with a gas-chromatograph iso-tope ratio mass spectrometry (GC-IRMS) became available(Rice et al., 2001; Miller et al., 2002; Umezawa et al., 2009).Measurements ofδ13C are made at selected sites of theNational Oceanic and Atmospheric Administration/GlobalMonitoring Division (NOAA/GMD) (Miller et al., 2002;Dlugokencky et al., 2009), NyAlesund, Svalbard (Morimotoet al., 2006), and two sites in the western part of the UnitedStates (Tyler et al., 2007). Tyler et al. (2007) also reportedthe measurement results ofδD. However, their systematicobservations are still limited, and only campaign-based ob-servations were made forδ13C andδD variations in the freetroposphere (Sugawara et al., 1996; Tyler et al., 1999; Maket al., 2000; Umezawa et al., 2011).
In order to understand spatial and temporal variations ofδ13C andδD in the UT over the Western Pacific, we ana-lyzed the CONTRAIL air samples for these variables, in ad-dition to the CH4 mixing ratio. These data are available in
Atmos. Chem. Phys., 12, 8095–8113, 2012 www.atmos-chem-phys.net/12/8095/2012/

T. Umezawa et al.: Methane isotopes in the troposphere over the Western Pacific 8097
45
975
Figure 1. A map showing locations where air samples were collected in this study. NRT: 976
Narita, GUM: Guam, HNL: Honolulu, SYD: Sydney, BNE: Brisbane. The air sampling was 977
made between NRT and SYD or BNE for December 2005–March 2009 (open circles), 978
between NRT and GUM for April 2009–March 2010 (open squares) and between NRT and 979
HNL for April–September 2010 (open triangles). Also shown are air sampling locations by 980
container ships (closed circles). Dashed lines on the ship track represent the division of 981
latitude bands for the data analysis (see text). Boxes denote the two regions (Region 5 and 982
Region 6) assigned for the tagged experiments. 983
984
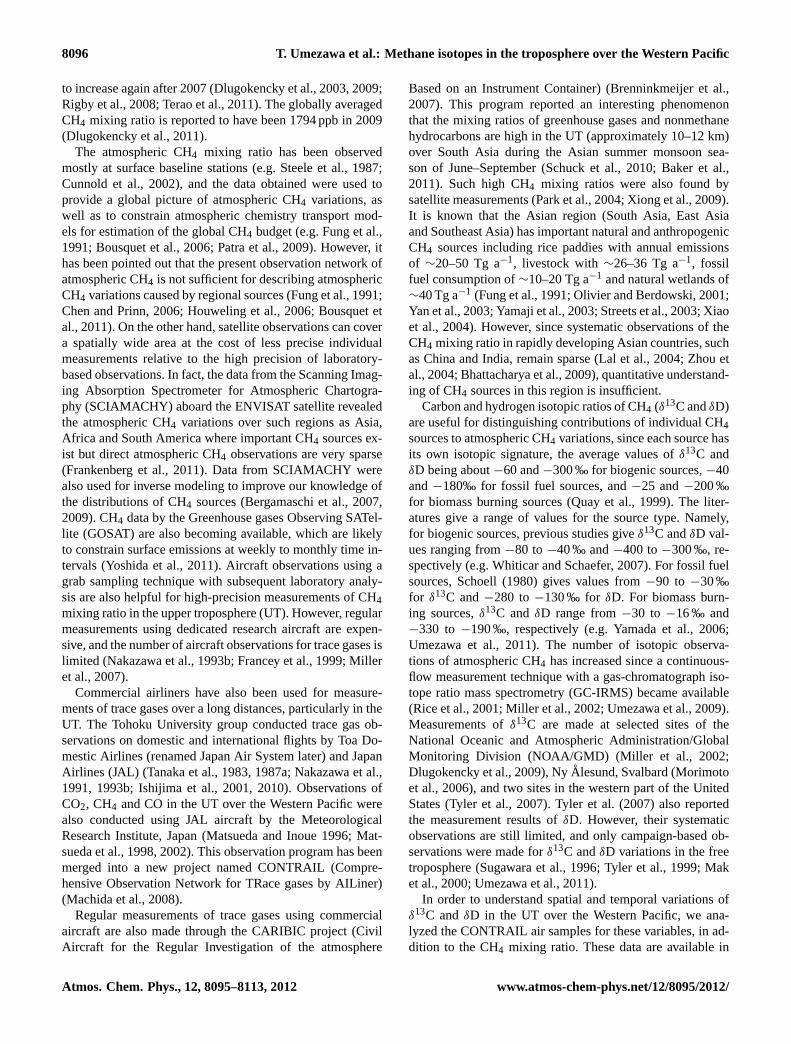
Fig. 1. A map showing locations where air samples were collected in this study. NRT: Narita, GUM: Guam, HNL: Honolulu, SYD: Sydney,BNE: Brisbane. The air sampling was made between NRT and SYD or BNE for December 2005–March 2009 (open circles), between NRTand GUM for April 2009–March 2010 (open squares) and between NRT and HNL for April–September 2010 (open triangles). Also shownare air sampling locations by container ships (closed circles). Dashed lines on the ship track represent the division of latitude bands for thedata analysis (see text). Boxes denote the two regions (Region 5 and Region 6) assigned for the tagged experiments.
the Supplement and from the World Data Center for Green-house Gases (http://ds.data.jma.go.jp/gmd/wdcgg/). The re-sults were compared with those observed in the lower tropo-sphere (LT) using container ships that sailed between Japanand New Zealand in the Western Pacific, of which routes areless than 20◦ in longitude distant from the CONTRAIL flighttracks (Fig. 1). We also made tagged tracer experiments usingan atmospheric chemistry transport model to examine causesof the CH4 variations observed in the UT. In this paper, wepresent the results obtained from our observation and modelstudies, and discuss them in terms of CH4 sources and atmo-spheric transport.
2 Methods
2.1 Air sample collection
As part of the CONTRAIL project, Automatic air SamplingEquipment (ASE) was installed onboard a Boeing 747-400.Since details of air sampling using ASE have been describedelsewhere (Machida et al., 2008; Matsueda et al., 2008), onlya brief description is presented here. ASE consists of twopackages and each package has six titanium sample flasks, sothat 12 air samples can be collected during one flight. Each
flask is cylindrical in shape with solenoid valves at both endsand an inner volume of∼1.7 l. The sample air was collectedusing the air-conditioning system of the aircraft. The air sam-pling procedures at each location, assigned before each flight,were automatically performed by controlling a metal bellowspump and the solenoid valves using a specially designed con-trol unit which receives flight information from the naviga-tion system of the aircraft. The flasks were pressurised, typ-ically to 0.15 MPa above the surface atmospheric pressure.Particles in the sample air were removed by using a sinteredinline filter.
Figure 1 shows typical sampling locations for this study.The collection of air samples were made almost twice amonth between Narita (NRT), Japan and Sydney (SYD)or Brisbane (BNE), Australia from December 2005–March2009 and between NRT and Guam (GUM) from April 2009–March 2010, and once a month between NRT and Honolulu(HNL) from April–September 2010. The departure airport inAustralia was frequently changed to BNE instead of SYDafter October 2007, and the sample collection at 30◦ S wastemporarily terminated after September 2008. Air samplingsbetween NRT and SYD started again in April 2011 and areongoing.
www.atmos-chem-phys.net/12/8095/2012/ Atmos. Chem. Phys., 12, 8095–8113, 2012

8098 T. Umezawa et al.: Methane isotopes in the troposphere over the Western Pacific
We also analyzed the air samples collected from onboardcommercial container ships sailing between Tokyo, Japanand Sydney, or Auckland, New Zealand over periods of about40 days. Each air sample was collected into a 550 ml Pyrexglass flask every 5◦ latitude, as shown in Fig. 1. Details of thisobservation program have been described elsewhere (Tanakaet al., 1987b; Nakazawa et al., 1992, 1997a; Morimoto et al.,2000; Ishijima et al., 2009; Yashiro et al., 2009).
2.2 Measurement of CH4 mixing ratios
The ASE was returned to the National Institute for Environ-mental Studies (NIES), Tsukuba, Japan within a day of sam-pling, and the mixing ratios of various trace gases, includ-ing CH4, were analyzed. The CH4 mixing ratio of each airsample was determined against the NIES-94 CH4 scale us-ing a gas chromatograph (Agilent 5890, Agilent Technolo-gies Inc.) equipped with a flame ionization detector (GC-FID) (Tohjima et al.,2002; Machida et al.,2008). Air sam-ples collected onboard the container ships were analyzed forthe CH4 mixing ratio relative to the Tohoku University (TU)1988 scale (Aoki et al., 1992) using a GC-FID (Agilent 6890)installed at TU (Umezawa, 2009). The analytical precisionof the GC-FID for the CH4 mixing ratio was estimated tobe less than 2.0 ppb for both institutes. Comparisons of theNIES and TU scales have been made several times, and theresults show that the two scales agree with each other, thedifferences at baseline atmospheric mixing ratio levels beingless than 1 ppb. We therefore applied no corrections to themixing ratio data reported by the two institutes.
2.3 Measurements ofδ13C and δD
For analysis, an aliquot of each ASE air sample was trans-ferred into two evacuated 100 ml sample flasks at NIES, andthe flasks were sent to TU forδ13C andδD measurements. AtTU, the air sample in each flask was further divided in twofor duplicate analyses ofδ13C or δD. The air samples fromthe container ships were also divided by the same procedureas above to allow duplicate analyses ofδ13C andδD.
Since details of ourδ13C and δD analyses, using agas chromatograph combustion/pyrolysis isotope ratio massspectrometer (GC-C/P-IRMS) have been reported (Umezawaet al., 2009), only a brief description is presented here. Theair sample in the 100 ml flask was flushed by pure helium intoa CH4 preconcentration trap containing HayeSep D main-tained at−130◦C and then warmed to−83◦C to release si-multaneously trapped gases such as N2. The trapped CH4was transferred into a cryofocusing trap (CP-PoraBOND Q)kept at−196◦C. The concentrated CH4 was released intoa PoraPLOT Q column for separation from the residual gascomponents. Then CH4 was combusted into CO2 at 940◦Cor pyrolyzed into H2 at 1450◦C for the subsequent continu-ous flow mass spectrometer measurements ofδ13C andδD,respectively, using ThermoQuest/Finnigan Delta Plus XP.
The analytical precision was estimated to be 0.08 ‰ forδ13Cand 2.2 ‰ forδD. δ13C andδD values in this study are re-ported relative to the international standards of the ViennaPeedee Belemnite (V-PDB) and the Vienna Standard MeanOcean Water (V-SMOW), respectively.
To verify the long-term stability of ourδ13C andδD mea-surements, we analyzed an aliquot of “test gas” at least twiceon every measurement day. The test gas is dry natural air ina 47 l aluminum cylinder. The CH4 mixing ratio, δ13C andδD of the test gas were determined to be (1876± 1.1) ppb,(−47.07± 0.06) ‰ and (−98.8± 2.1) ‰, respectively; themixing ratio was determined using the GC-FID at TU rel-ative to the TU scale, and theδ13C andδD values were deter-mined from replicate measurements using the GC-C/P-IRMSagainst our laboratory standards of pure CO2 and H2 storedin high-pressure cylinders when the system was quite stable.The CO2 and H2 standards were calibrated using dual-inletmass spectrometers against the V-PDB and V-SMOW, re-spectively (Umezawa et al., 2009). It should be noted that ourδ13C andδD scales do not follow the “identical treatment”principle (Werner and Brand, 2001), since its experimentalset up is not available yet in our laboratory. Intercompar-isons ofδ13C andδD scales with other laboratories are alsoneeded. The measuredδ13C value of the test gas was stableto be (−47.12± 0.10) ‰ from the start date of our measure-ment until April 2008. Afterward, the measured value sud-denly shifted to (−46.85± 0.09) ‰, keeping the same pre-cision as before. The cause is still unclear, since we had notchanged any measurement settings. To keep data consistency,we added−0.27 ‰ to the measured values after the gap.With regard to the stability of ourδD measurements, mea-sured values determined by our GC-C/P-IRMS system aredependent on the pyrolysis condition (Umezawa et al., 2009).As described by Bock et al. (2010) and Brass and Rockmann(2010), the pyrolysis reactor is well conditioned when carbonlayer is deposited on the inner wall of the ceramic tube bypassing a sufficient amount of CH4 through the reactor, andsuch a good condition continues until micro-fractures occuron the tube. Using the average measured value of the test gason each measurement day, the assigned value of standard H2was corrected so that theδD value of the test gas was con-stant.
Our system shows a linear response to bothδ13C andδDas long as an air sample with a sufficient amount of CH4is analyzed (Umezawa et al., 2009), which was confirmedby changing the volume of sample air with a constant CH4mixing ratio. Additional tests revealed that measured valuesare invariable if the peak heights of the IRMS chromatogramare higher than 3.0 and 2.5 V forδ13C andδD, respectively.The respective threshold peak heights forδ13C andδD corre-spond to about 800 and 1100 ppb in sample air of 100 ml, al-though we have not made any tests in which the CH4 mixingratio is changed for a constant volume sample. At this mo-ment, it is difficult for us to assess the mixing ratio effect onthe measured isotopic ratios, since standard air with different
Atmos. Chem. Phys., 12, 8095–8113, 2012 www.atmos-chem-phys.net/12/8095/2012/

T. Umezawa et al.: Methane isotopes in the troposphere over the Western Pacific 8099
CH4 mixing ratios but the same isotopic value are needed.However, all measurements reported in this study were ob-tained under higher CH4 mixing ratios (or peak heights) thanthe above-mentioned thresholds, we made no corrections ofthe mixing ratio effect on the measured isotopic ratios.
Analyses of the CH4 mixing ratio were made for all airsamples collected from the aircraft and container ships, whileδ13C andδD were analyzed for selected samples, since theiranalyses are time consuming. Although the air sampling withASE was made twice a month between NRT and SYD orBNE and between NRT and GUM, one of the two sets ofsamples was analyzed for each month. The air samples werecollected onboard the container ships every 5◦ latitude, butthe isotope analysis was made on the samples at∼10◦ lati-tude interval.
2.4 Data analysis
To extract a long-term trend and a seasonal cycle from tem-porally discrete CH4 mixing ratio data,δ13C andδD, a digitalfiltering technique (Nakazawa et al., 1997b) was applied. Thetechnique consists of stepwise calculation process involvinglinear interpolation, Reinsch-type cubic splines, Fourier har-monics and a Butterworth filter. In this study, the Butterworthfilter with a cutoff period of 24 months was used to derivethe long-term trend, and the average seasonal cycle was ex-pressed by fundamental and its first harmonics. Signals withperiods of 4–24 months, obtained by further applying theButterworth filter with a cutoff period of 4 months, were de-fined as short-term variations. The best-fit curve to the ob-served data was obtained by summing the long-term trend,the average seasonal cycle and the short-term variations.
Since the numbers ofδ13C andδD data taken in the LTare limited, we classified them into five latitudinal bandsof 35◦–25◦ N, 20◦–10◦ N, 5◦ N–10◦ S, 15◦–25◦ S and 30◦–40◦ S (Fig. 1) and then applied the curve fitting to the datasets of the respective bands. Since the original air samplingswere made at intervals of 5◦ latitude and every sample wasanalyzed for the CH4 mixing ratio, we inspected the CH4mixing ratio data taken at individual sampling latitudes from35◦ N to 40◦ S. After that, these latitude bands were deter-mined by carefully inspecting the average seasonal cycles ofthe CH4 mixing ratio at the respective latitudes, so that theseasonal CH4 features are similar within each band. On theother hand, the curve fitting method was simply applied toindividual UT data sets at the assigned sampling latitudes.
2.5 Tagged tracer simulations
To examine where the CH4 sources contributing to CH4variations in the UT are located, we made tagged tracerexperiments using the CCSR (Center for Climate Sys-tem Research)/NIES/FRCGC (Frontier Research Center forGlobal Change) Atmospheric General Circulation Model-based Chemistry Transport Model (ACTM) for CH4 mix-
Table 1.Regions assigned for tagged tracer experiments.
No. Region
1 Europe2 Western Siberia3 Eastern Siberia4 Middle East5 South Asia6 East Asia7 Japan and Korea8 Southeast Asia9 Maritime Continent10 Africa11 Australia and New Zealand12 Boreal North America13 Temperate North America14 South America15 Others
ing ratios (Patra et al., 2009). In order to discriminate CH4emitted from different source regions, the original surfaceflux field was divided into 15 regions on the globe (Ta-ble 1), and each CH4 tracer was simulated separately witheach flux field. We confirmed that the sum of the 15 tracersand the simulated mixing ratio with original global flux fieldagreed with each other within 0.1 %. The original surfaceCH4 fluxes were prepared by multiplying optimal scalingfactors to natural/biogenic emissions from the Goddard Insti-tute for Space Studies (GISS) (Fung et al., 1991; Matthewsand Fung,1987), as well as to anthropogenic/industrial emis-sions from the Emission Database for Global AtmosphericResearch (EDGAR, version 3.2) inventory (Olivier andBerdowski, 2001). It was assumed that atmospheric CH4 isdestroyed by reacting with OH, Cl and O(1D) during trans-port, and the mixing ratios of the reactants were prescribedby independent modeling results (Sudo et al., 2002; Taki-gawa et al., 1999). The natural emissions and chemical lossesof CH4 varied seasonally but their seasonality was repeatedannually. The anthropogenic CH4 emissions were providedby extrapolating the EDGAR inventories. Consequently, theglobal CH4 emission for the observation period (2007–2010)was given to be constant ((543± 0.6) Tg a−1). The modelmeteorological field was nudged to Japanese 25-year Re-Analysis (JRA25) (Onogi et al., 2007) and thus interannu-ally variable. Patra et al. (2009) showed that the CH4 mixingratio variations observed at surface baseline sites around theworld are reproduced relatively well by using this model. Thehourly model outputs were sampled for the times and loca-tions specified by our observations, to compare directly withthe observational results.
www.atmos-chem-phys.net/12/8095/2012/ Atmos. Chem. Phys., 12, 8095–8113, 2012

8100 T. Umezawa et al.: Methane isotopes in the troposphere over the Western Pacific
46
985
Figure 2. Temporal variations of the CH4 mixing ratio (closed circles), δ13C (open circles) and 986
δD (open squares) in the UT at (a) 32° N, (b) 26° N, (c) 21° N and (d) 15° N in the UT 987
between Australia and Japan and between Japan and Guam. Also shown are the best-fit 988
curves to the observed data (solid lines). 989
990
Fig. 2. Temporal variations of the CH4 mixing ratio (closed circles),δ13C (open circles) andδD (open squares) in the UT at(a) 32◦ N, (b)26◦ N, (c) 21◦ N and(d) 15◦ N in the UT between Australia and Japan and between Japan and Guam. Also shown are the best-fit curves tothe observed data (solid lines).
3 Results and discussions
3.1 Variations of atmospheric CH4 and its isotopesin the UT
Figure 2 shows time series of the CH4 mixing ratio, δ13Cand δD obtained in the UT between NRT and Australia(SYD or BNE) and between NRT and GUM. For time se-ries obtained between 32◦ and 15◦ N, high CH4 mixing ra-tios often appear in boreal summer–autumn, and relativelylow CH4 mixing ratios are found in winter–spring (Fig. 3a).Such summer–autumn CH4 mixing ratios are higher by asmuch as 30–80 ppb than the winter–spring mixing ratios. Thelow CH4 mixing ratios observed in winter–spring may bepartly attributable to an intrusion of stratospheric air with lowCH4 mixing ratios into the troposphere (e.g. Sugawara et al.,1997). A similar phenomenon was also found for the N2Omixing ratio at 32◦ N from the same ASE samples (Ishijima
et al., 2010). In general,δ13C andδD at latitudes between32◦ N and 15◦ N show a negative correlation with the CH4mixing ratio; high and low values ofδ13C andδD are ob-servable in winter–spring and autumn, respectively (Fig. 3band c). The most compact relationships between the isotopicratios and the CH4 mixing ratio were found at 32◦ N withcorrelation coefficientsR of −0.75 forδ13C and−0.77 forδD, and the corresponding coefficients are−0.61 and−0.60at 26◦ N, −0.44 and−0.51 at 21◦ N, and−0.63 and−0.61at 15◦ N.
There are some studies that observed high summer–autumn CH4 mixing ratios in the UT in the NH mid-latitudes.Matsueda and Inoue (1996) reported, from their CH4 mea-surements in the UT between Cairns, Australia and NRTduring 1993–1994, that in boreal autumn, high CH4 mix-ing ratios appear in the NH, but the feature disappears mov-ing southward. Schuck et al. (2010) also found high CH4mixing ratios in the UT around 20◦–40◦ N in eastern South
Atmos. Chem. Phys., 12, 8095–8113, 2012 www.atmos-chem-phys.net/12/8095/2012/

T. Umezawa et al.: Methane isotopes in the troposphere over the Western Pacific 8101
47
991
Figure 2. (Continued). Same as Fig. 2a–d, but for (e) 10° N, (f) 5 °N, (g) the equator and (h) 992
6° S between Australia and Japan. 993
994
Fig. 2.Same as Fig. 2a–d, but for(e)10◦ N, (f) 5 ◦N, (g) the equator and(h) 6◦ S between Australia and Japan.
Asia during June–September 2008. Furthermore, the Atmo-spheric Infrared Sounder (AIRS) instrument onboard theEOS/Aqua satellite observed high CH4 mixing ratios at 150–300 hPa levels over northern South Asia for July–Septemberwith maximum in an early September (Xiong et al., 2009).Measurements over geographically wide area were made bythe Halogen Occultation Experiment (HALOE) instrumentonboard the Upper Atmosphere Research Satellite (UARS)spacecraft (Park et al., 2004), and their results revealed thathigh CH4 mixing ratios appear at 136 hPa level at 10◦–40◦ Nduring June–September, especially in South Asia. These pre-vious studies suggest that boundary layer air affected by var-ious CH4 sources in the Asian region is transported into theUT and responsible for the high CH4 mixing ratios in sum-mer.
The high CH4 mixing ratio values observed in the NHin boreal summer–autumn become unclear going south-ward, and in the tropics the CH4 mixing ratios showsslightly higher and lower values in boreal winter–springand summer–autumn, respectively (Figs. 2e–h and Fig. 3a).
The peak-to-peak amplitude of the seasonal CH4 cycle isabout 30 ppb at 10◦ N and 5◦ N and 15 ppb at the equa-tor and 6◦ S, indicating a southward reduction of the sea-sonal cycle of CH4 fluxes. In the SH, the seasonal CH4 cy-cles are much reduced, and its seasonal minimum and maxi-mum appear in the austral summer (December–January) andspring (September–October), respectively (Fig. 3a). The CH4seasonality observed in the SH UT is generally consistentwith that observed using aircraft over Cape Grim, Australia(Francey et al., 1999), as well as with zonal-mean seasonalcycle reported from satellite observations (Park et al., 2004).It should be noted that Ishijima et al. (2010) found low N2Omixing ratios at 30◦ S in the austral spring, due to an intrusionof the stratospheric air into the UT, but the limited number ofsuch stratospheric samples has an insignificant effect on theseasonal CH4 cycle at this latitude.
While δ13C and δD vary seasonally in opposite phasewith the CH4 mixing ratio in the NH (32◦–10◦ N), their sea-sonal cycles are rather irregular in the tropics (5◦ N and theequator), resulting in even poorer negative correlations with
www.atmos-chem-phys.net/12/8095/2012/ Atmos. Chem. Phys., 12, 8095–8113, 2012

8102 T. Umezawa et al.: Methane isotopes in the troposphere over the Western Pacific
48
995
Figure 2. (Continued). Same as Fig. 2a–d, but for (i) 13° S, (j) 18° S, (k) 24° S and (l) 30° S 996
beween Australia and Japan. Note that the axis ranges of the CH4 mixing ratio are different 997
from Fig. 2a–h. 998
999
Fig. 2. Same as Fig. 2a–d, but for(i) 13◦ S, (j) 18◦ S, (k) 24◦ S and(l) 30◦ S beween Australia and Japan. Note that the axis ranges of theCH4 mixing ratio are different from Fig. 2a–h.
the CH4 mixing ratio for bothδ13C (R = −0.45) andδD(R = −0.13) in the southern low latitude (6◦ S). It is seenin the SH (13◦–30◦ S) thatδ13C andδD show negative cor-relations with the CH4 mixing ratio in some places, but bothvariables are independent of the CH4 mixing ratio as a whole.The respective correlation coefficients forδ13C andδD are−0.38 and−0.72 at 13◦ S,−0.14 and−0.48 at 18◦ S,−0.48and−0.77 at 24◦ S, and−0.13 and−0.46 at 30◦ S.
3.2 Comparisons of the CH4 variations in the UT withthose in the LT
To interpret variations of the CH4 mixing ratio,δ13C andδDin the UT, we compare them with those observed in the LT.The CH4 mixing ratio, δ13C andδD observed in the UT at21◦ N are compared in Fig. 4a with those observed in the LTat 20◦–10◦ N. As seen in this figure, the UT CH4 mixing ra-tio shows high values in boreal summer when the LT CH4shows the seasonal minimum. It is also seen in summer that
the CH4 mixing ratio is often higher in the UT than in the LT.The summertime minimum CH4 mixing ratio is commonlyfound at surface baseline sites in northern mid-latitudes, dueto a CH4 + OH reaction enhanced in summer (e.g. Dlugo-kencky et al., 1994; Patra et al., 2009). The OH density ishigher in the LT than in the UT as a whole, but its seasonalchange should occur in almost the same phase throughoutthe troposphere (e.g. Spivakovsky et al., 2000). Therefore,the summertime high CH4 mixing ratios observed in the UTsuggest an overwhelming role of transport of air masses thatare strongly influenced by some CH4 sources.
The CH4 + OH reaction leads to an enrichment in13Cand D of atmospheric CH4 through the kinetic isotope effect(KIE) (e.g. Saueressig et al., 2001). As seen in Fig. 4a,δ13Cand δD show high values in boreal summer in the NH LT,corresponding to the seasonal minimum of the CH4 mixingratio, due to an enhanced destruction of CH4 by OH. Simi-lar seasonal cycles ofδ13C andδD were observed at other
Atmos. Chem. Phys., 12, 8095–8113, 2012 www.atmos-chem-phys.net/12/8095/2012/

T. Umezawa et al.: Methane isotopes in the troposphere over the Western Pacific 8103
49
1000
Figure 3. Seasonal variations of (a) the CH4 mixing ratio, (b) δ13C and (c) δD in the NH-UT 1001
over the western Pacific. Each line represents the average seasonal cycle added by the annual 1002
average in 2007. Clear seasonal cycles of δ13C and δD are not observable in the SH and are 1003
not shown. 1004
1005
Fig. 3. Seasonal variations of(a) the CH4 mixing ratio, (b) δ13Cand(c) δD in the NH UT over the Western Pacific. Each line rep-resents the average seasonal cycle added by the annual average in2007. Clear seasonal cycles ofδ13C andδD are not observable inthe SH and are not shown.
NH mid-latitude sites (Quay et al., 1991, 1999; Miller etal., 2002; Tyler et al., 2007).δ13C andδD also vary season-ally in the UT, but their phases are not always the same asthose observed in the LT; in summer 2007 and 2008,δ13CandδD show seasonal minima in the UT, but high values inthe LT. Considering that the summertimeδ13C andδD valuesare often lower in the UT than in the LT, CH4 sources withlow δ13C andδD would influence the seasonal CH4 cycle inthe UT.
Figure 4b shows temporal variations of the CH4 mixingratio, δ13C andδD in the tropical UT (the equator) and LT(5◦ N–10◦ S). The UT and LT CH4 mixing ratios vary almostin phase (R=0.59), showing the seasonal maximum and min-imum in boreal winter and summer, respectively. This wouldbe caused by the fact that the tropical tropospheric air is ver-tically well mixed due to strong convection. For the seasonalCH4 cycle observed in the tropical LT, seasonally depen-dent air transport would be particularly important, as pointedout by Nakazawa et al. (1997a) and Yashiro et al. (2009).The intertropical convergence zone (ITCZ) in the WesternPacific migrates seasonally in association with Asian mon-soon (Waliser and Gautier, 1993). Since the ITCZ is locatedaround 10◦ N on our tracks during boreal summer, the lat-
50
1006
Figure 4. Variations of the CH4 mixing ratio, δ13C and δD in the UT (closed circles) and LT 1007
(crosses) over the western Pacific. Also shown are the best-fit curves to the UT (solid line) 1008
and LT (dotted line) data. 1009
1010
Fig. 4. Variations of the CH4 mixing ratio, δ13C andδD in theUT (closed circles) and LT (crosses) over the Western Pacific. Alsoshown are the best-fit curves to the UT (solid line) and LT (dottedline) data.
itude band 5◦ N–10◦ S is composed of the SH air with lowCH4 mixing ratios. On the other hand, the ITCZ moves southof the equator in boreal winter, so that NH air with high CH4mixing ratios, brought from the central Pacific by the north-east trade wind, prevails in this area.
Variations ofδ13C andδD should also be affected by theseasonally different air transport mentioned above. In gen-eral, δ13C and δD are low in the NH LT, increase goingsouthward, and are almost constant in the SH LT (Quay etal., 1999; Miller et al., 2002). Our latitudinal distributions ofδ13C andδD in the LT, which will be presented later (Fig. 5),also show similar features. Therefore, it is expected that thetransport of the NH (SH) air through the LT deplete (enrich)13C and D of atmospheric CH4 in the tropics. In fact, the sea-sonal cycles ofδ13C andδD observed in the LT of the tropicsare generally interpretable in this context (Fig. 4b).
The results observed at 24◦ S in the UT and 15◦–25◦ Sin the LT are shown in Fig. 4c. As seen in this figure, theSH CH4 mixing ratio is higher in the UT than in the LTthroughout the year. Nakazawa et al. (1991) and Matsueda etal. (2002) found in the SH that annual-average CO2 mixingratios are higher in the UT than in the LT, which is also shown
www.atmos-chem-phys.net/12/8095/2012/ Atmos. Chem. Phys., 12, 8095–8113, 2012

8104 T. Umezawa et al.: Methane isotopes in the troposphere over the Western Pacific
51
1011
Figure 5. Latitudinal distributions of annual averages of (a) the CH4 mixing ratio, (b) δ13C and 1012
(c) δD in the UT (open symbols with solid lines) and LT (closed symbols with dotted lines). 1013
Each error bar represents one standard error of the data deviations from the best-fit curves. 1014
1015
Fig. 5. Latitudinal distributions of annual averages of(a) the CH4mixing ratio, (b) δ13C and(c) δD in the UT (open symbols withsolid lines) and LT (closed symbols with dotted lines). Each errorbar represents one standard error of the data deviations from thebest-fit curves.
by a large number of in-situ CO2 data taken by CONTRAILflights (Sawa et al., 2012). Such a CO2 increase with alti-tude in the SH is ascribed to the interhemispheric transportthrough the tropical UT (Miyazaki et al., 2008; Sawa et al.,2012). Similar vertical distributions of the CH4 mixing ratiowere reported from aircraft measurements over Cape Grim(Francey et al., 1999). The CH4 mixing ratios obtained in thisstudy show similar seasonal cycles in the LT and UT. In thisconnection, Francey et al. (1999) reported that the seasonalCH4 cycles obtained at three levels between 0–8 km proceedin similar phase with that at the surface. Since no strong CH4sources exist around the Western Pacific region of the SH,the seasonal CH4 cycle could be predominantly produced bythe seasonality of the CH4+OH reaction (Dlugokencky et al.,1994) as well as seasonal change of atmospheric transport ofthe NH air through the UT, as observed in the CO2 mixingratio (Sawa et al., 2012).
Theδ13C andδD values are relatively lower in the UT thanin the LT in the SH. As described earlier, air mass transportfrom the NH into the SH through the UT is responsible forthis vertical difference. In this connection, the NH air haslower δ13C andδD values than the SH air (see Fig. 5). In or-der to assess the influence of CH4 sources and sinks on theobserved seasonal CH4 cycle, the deviations of the isotopic
ratio values from its yearly mean value are plotted againstthe corresponding deviations of the CH4 mixing ratio. Dueto seasonal phase difference between the isotopic ratios andthe CH4 mixing ratio, it is known that the plot results in anellipse-like diagram which is called “phase ellipse” (Allan etal., 2001, 2005; Tyler et al., 2007). Allan et al. (2001, 2005)applied this analysis to theδ13C data obtained at BaringHead, New Zealand (41◦ S, 175◦ E) and Scott Base, Antarc-tica (78◦ S, 167◦ E) to estimate the KIE of the CH4 sink inthe SH extratropics. They found the apparent carbon KIE ofabout−13 ‰, estimated from a slope of the observed phaseellipse, being much larger than−3.9 ‰ derived from labo-ratory experiments for the CH4 + OH reaction (Saueressig etal., 2001). Allan et al. (2001, 2005) ascribed the cause to thecontribution from the CH4 + Cl reaction, with a large KIE ofabout−60 ‰ (Saueressig et al., 1995; Tyler et al., 2000), inthe marine boundary layer. We also found a large apparentKIE of about−11 ‰ for the latitude band of 15◦–25◦ S inthe LT. However, a longer data record is required to bettercharacterize the phase ellipse, as well as to more quantita-tively evaluate the contribution of the CH4 + Cl reaction onthe KIE. On the other hand, the impact of the CH4 + Cl re-action onδD would be small, since the hydrogen KIE of thisreaction is only 1.5 times larger than that of the major re-action with OH (Saueressig et al., 1996, 2001; Tyler et al.,2000).
3.3 Latitudinal and annual changes
3.3.1 Latitudinal distribution in the UT and LT
Figure 5 shows the latitudinal distributions of annual aver-ages of the CH4 mixing ratio,δ13C andδD in the UT and LTfor the period 2007–2009. The UT distributions for 2007–2008 and 2009 were derived from the data taken betweenNRT and SYD or BNE and between NRT and GUM, respec-tively. In the LT, the CH4 mixing ratio is high in the NH anddecreases going southward until the value is almost constantin the extratropical SH. The CH4 mixing ratio in the north-ernmost latitude band is about 100 ppb higher than the valuein the extratropical SH. Such a latitudinal distribution of theCH4 mixing ratio has been reported from the global baselinenetwork (Dlugokencky et al., 1994), attributing the cause tothe fact that a large portion of CH4 source is located in theNH (e.g. Fung et al., 1991). The UT CH4 mixing ratio ishigher in the NH than in the SH, but the north-south gradi-ent in the UT (about 45 ppb) is smaller than that in the LT.It is also seen from Fig. 5 that the latitudinal distributions ofthe CH4 mixing ratio in the UT and LT cross each other inthe tropics; the CH4 mixing ratio is lower in the UT than inthe LT in the NH, and vice versa in the SH. Such latitudinaldistributions are due to CH4 emissions from the NH surfaceas well as to the intrusion of NH air into the SH throughthe UT. A similar distribution feature has been reported forthe CO2 mixing ratio from measurements on the same flight
Atmos. Chem. Phys., 12, 8095–8113, 2012 www.atmos-chem-phys.net/12/8095/2012/

T. Umezawa et al.: Methane isotopes in the troposphere over the Western Pacific 8105
route as this study (Nakazawa et al., 1991; Matsueda et al.,2002), more frequent and wider coverage measurements ofthe CONTRAIL project (Sawa et al., 2012) and global-scalesimulations (Miyazaki et al., 2008).
In the LT, δ13C increases with decreasing latitude fromthe NH to the tropics and the values are almost constant inthe extratropical SH. A similar distribution has been reportedfrom surface and shipboard measurements (Quay et al., 1991,1999; Miller et al., 2002). The observed north-south gradientof δ13C arises from the process that a large amount of CH4 isemitted in the NH from biogenic sources with lowδ13C suchas wetlands, rice paddies and ruminant animals and13C of at-mospheric CH4 is enriched by the OH reaction during south-ward transport (Miller et al., 2002). The north-south gradientof δ13C is also found in the UT, but it is less pronounced thanthat in the LT. Compared withδ13C in the LT, the UT value isalmost equal in the NH and the tropics and lower in the SH.As a result,δ13C does not show any clear intersection of thelatitudinal distributions in the LT and UT.
In the LT, δD shows almost the same latitudinal distribu-tions asδ13C. The latitudinal distribution ofδD was alsomeasured by Quay et al. (1999) and Rice et al. (2001) us-ing ships in the Eastern Pacific, but their measurements arenot systematic. The north-south gradient ofδD in the LT canbe interpreted in terms of unevenly distributed CH4 sourcesin the NH and the SH, as well as the KIE by the OH reaction.The north-south gradient ofδD is also apparent in the UT,although it is less pronounced than in the LT. Compared withδD in the LT, the UT value is lower and higher in the NH andthe SH, respectively, yielding a intersection of the UT and LTlatitudinalδD distributions, as was found in the CH4 mixingratio. A possible cause of the intersection is ascribed to theintrusion of NH air into the SH through the UT.
As described above, the CH4 mixing ratio andδD showthe LT and UT latitudinal profiles crossing each other in thetropics, while such a crossing is not seen forδ13C. To inter-pret the observedδ13C latitudinal profiles, some mechanismshould be considered, in addition to the NH air intrusion, bywhich δ13C is increased in the LT or decreased in the UTwith no significant impact on the CH4 mixing ratio andδD.A possible explanation is ascribed to the CH4+Cl reaction,which enriches13C significantly by its large KIE of about−60 ‰ (Saueressig et al., 1995; Tyler et al., 2000) in the ma-rine boundary layer (e.g. Allan et al., 2007). Since the presentobservations in the LT were made just above the open sea inthe Western Pacific, ourδ13C values in the LT could havebeen enriched significantly by the Cl reaction over all obser-vation latitudes. If theδ13C values in the LT were loweredby about 0.05 ‰, the resultant latitudinal profile would haveintersected the UT profile in the tropics. Given that our LTδ13C values are increased by this amount due to the Cl reac-tion with a large KIE, the contribution of the reaction to theCH4 mixing ratio is estimated to be only 2 ppb (see also for-mulae by Allan et al., 2001). Such a small contribution couldmerge into data variability of the CH4 mixing ratio. As men-
tioned earlier, impact of the CH4+Cl reaction onδD is alsoexpected to be small due to a relatively small difference ofthe hydrogen KIE between the Cl and OH reactions.
3.3.2 Recent increase of atmospheric CH4
As seen in Fig. 5, the average CH4 mixing ratio is increasedby about 10 ppb at 30◦–40◦ S, 15◦–25◦ S, 5◦ N–10◦ S and20◦–10◦ N and by 17 ppb at 35◦–25◦ N in the LT from 2007to 2008. The mixing ratio increase between 2008 and 2009is about 5 ppb for all latitude bands. Such a mixing ratio in-crease is consistent with the results from baseline measure-ments (Dlugokencky et al., 2009; Terao et al., 2011). On theother hand, the respective decreases inδ13C andδD between2007 and 2008 are about 0.05 ‰ and 0.6 ‰ in the SH andthe tropics (30◦–40◦ S to 5◦ N–10◦ S) and by about 0.10 ‰and 1.2 ‰ at NH mid-latitudes (20◦–10◦ N and 35◦–25◦ N),showing slightly more prominent decreases in the NH thanin the tropics and SH. Such temporal decreases inδ13C andδD suggest that the CH4 mixing ratio increase was causedby enhanced emissions of isotopically light CH4 from bio-genic sources such as wetlands and rice paddies. For theperiod 2008–2009, no significant temporal change inδ13C(<0.04 ‰) andδD (<1 ‰) were observed at all latitudes inthe LT covered by this study. The CH4 mixing ratio in the UTincreased by about 7 ppb in the tropics (13◦ S–10◦ N) and byabout 15 ppb in the extratropics of both hemispheres between2007 and 2008. On the other hand,δ13C andδD showed sim-ilar values in the two years at all latitudes, the differences forthe respective variables being−0.03 and−1.2 ‰.
Rigby et al. (2008) and Sasakawa et al. (2010) found hightemperature anomalies in Siberia in 2007, suggesting thatCH4 emissions from boreal wetlands were enhanced. By us-ing a two-dimensional box model with possible changes inOH, Rigby et al. (2008) indicated that the CH4 increase in2007 is attributable to CH4 emissions enhanced in the NH.Dlugokencky et al. (2009) also suggested an enhancement ofCH4 emissions from boreal wetlands, resulting in the largestCH4 increase in the Arctic and lowδ13C values at northernhigh-latitude site Alert, Canada, in late summer of 2007. Onthe other hand, Bousquet et al. (2011) indicated from theiratmospheric inversion modeling that tropical wetlands area dominant contributor to the CH4 increase in 2007, alsowith a significant but smaller contribution from boreal wet-lands. These earlier studies support our observational resultsthat δ13C andδD decreased in the LT of the NH in 2007–2008. In addition, the CH4 increase in the whole troposphereobserved in this study might be explained by tropical CH4emissions combined with rapid vertical transport (Houwel-ing et al., 2006; Bousquet et al., 2011), although insignificantchanges inδ13C andδD do not allow us to identify the sourcetype.
www.atmos-chem-phys.net/12/8095/2012/ Atmos. Chem. Phys., 12, 8095–8113, 2012

8106 T. Umezawa et al.: Methane isotopes in the troposphere over the Western Pacific
3.4 Summertime elevated CH4 in the UT of the NH
3.4.1 Tagged tracer results
To examine causes of the high CH4 mixing ratios observedin the NH UT in summer, we made tagged tracer experi-ments using the ACTM. Figure 6 shows the comparison ofthe observed and model-simulated CH4 mixing ratios forthe UT at 32◦–15◦ N. As seen in this figure, the model re-produces the observed variations relatively well, especiallyfor the timing of high CH4 mixing ratios. The tagged trac-ers for the respective regions are also shown in Fig. 6. Asclearly seen in this figure, Region 5 (South Asia) and Region6 (East Asia) play an important role in the CH4 variationsin the NH UT (see Table 1 and Fig. 1). The contribution ofSouth Asia is larger than that of East Asia as a whole, andboth regions are closely related to the high CH4 mixing ra-tios in boreal summer–autumn, CH4 from South Asia andEast Asia being important for September–October and May–September, respectively. Such high CH4 mixing ratios wouldbe due to rapid upward transport of the boundary layer airby Asian summer monsoon (Jiang et al., 2007; Park et al.,2009; Xiong et al., 2009; Schuck et al., 2010). A sensitivitytest, in which the model was run with and without seasonallyvarying sources, also indicates that enhanced vertical trans-port over these two regions predominantly drives the sum-mertime high CH4 mixing ratio peaks in the UT. It should bealso noted that the CH4 emission from rice paddies used inthe model reaches a maximum around August–September inSouth Asia and June in East Asia.
It is also found from Fig. 6 that the differences betweenthe observed and simulated CH4 mixing ratios become largerafter 2008. Since our model reproduces the timing of the ob-served CH4 peaks relatively well, the meteorological fieldand CH4 source distributions can be plausibly incorporatedinto the model. Therefore, the large differences between thesimulated and observed CH4 mixing ratios after 2008 couldbe caused by underestimated CH4 emissions in the model.
3.4.2 Isotopic signatures of CH4 sources in South Asiaand East Asia
Figure 7 shows plots ofδ13C andδD against the recipro-cal of the CH4 mixing ratio for the UT at 15◦–32◦ N. Thiskind of plot is called as Keeling plot and often used to es-timate the isotopic ratio of a source that exchanges a tracegas with the atmosphere (e.g. Pataki et al., 2003). In the lightof the results of the tagged tracer experiments, we catego-rized the observed data into three regions of South Asia, EastAsia and the rest of the world (hereafter referred to as base-line). The air samples categorized into the two regions haveextremely high values of the corresponding tagged tracersfor the respective regions, which exceed the average plusone standard deviation calculated for the observation pe-riod. The South Asian and East Asian samples were found
in May–October with only one exception (December). It isobvious from Fig. 7 that air originating in South Asia andEast Asia has higher CH4 mixing ratios and lowerδ13C andδD than those of the baseline air. The average CH4 mixingratios are (1819± 28) and (1827± 26) ppb for the South-Asian and East-Asian air, respectively, while the mixing ratiovalue of the baseline air is (1796± 22) ppb, and the respec-tive average values ofδ13C andδD are (−47.08± 0.11) and(−90.3± 4.1) ‰ for South Asia and (−47.01± 0.11) and(−90.5± 3.9) ‰ for East Asia, while the corresponding val-ues are (−46.96± 0.11) and (−87.3± 3.6) ‰ for the base-line air. Although the differences of the CH4 mixing ratioand isotopic ratios between the South Asian or East Asianair and the baseline air are small, we attempt the followinganalysis with these values.
If it is assumed that CH4 is emitted into the atmospherefrom a single CH4 source, the isotopic ratio of that sourcecan be inferred as an end-member for the baseline on a Keel-ing plot (e.g. Bergamaschi et al., 1998). Using our data, wefound the respective end-member signatures ofδ13C andδDrelative to the baseline to be−56.5 ‰ and−329 ‰ for SouthAsia, and−49.6 ‰ and−277 ‰ for East Asia. Although theobtained isotopic ratios include very large uncertainties, dueto small differences of the CH4 mixing ratio and isotopic ra-tios between South Asian and East Asian air and the base-line air, these values suggest a mix of source with substantialcontributions from13C and D depleted sources such as bio-genic emissions from rice paddies and livestock. The modelCH4 flux indicates that CH4 emissions from rice paddies areenhanced in summer in both regions, which is generally con-sistent with the isotopic signatures estimated in this study.The above assumption is usually valid for the atmosphereclose to the source, such as in the forest canopy (e.g. Patakiet al., 2003) and the boundary layer (e.g. Llyod et al., 2001;Umezawa et al., 2011), but our measurements were made inthe UT. Therefore, it should be noted that the sampled airwould be influenced not only by CH4 sources but also bychemical destruction and mixing during transport.
3.5 Longitudinal variations in the UT of the NH
Figure 8 shows longitudinal distributions of the CH4 mixingratio, δ13C andδD in the UT between NRT and HNL. Asseen in this figure, the CH4 mixing ratios observed in May2010 are extremely low between 160◦–180◦ E, with the min-imum value of 1655 ppb around 170◦ E. Such low CH4 mix-ing ratios were not observed in the UT between NRT andSYD or BNE or between NRT and GUM (Fig. 2). The airsamples with low CH4 mixing ratios show high values ofδ13C andδD. To examine the cause, we analyzed the JapanMeteorological Agency Climate Data Assimilation System(JCDAS) reanalysis data (Onogi et al., 2007), following thesame method as used in Sawa et al. (2008), in which potentialvorticity (PV) in PV-units (PVU = 10−6 Km2 kg−1 s−1) wasadopted as a measure of stratospheric air. By inspecting the
Atmos. Chem. Phys., 12, 8095–8113, 2012 www.atmos-chem-phys.net/12/8095/2012/

T. Umezawa et al.: Methane isotopes in the troposphere over the Western Pacific 8107
52
1016
Figure 6. Comparison of the observed (closed circles) and model-simulated (open circles) 1017
CH4 mixing ratios for the UT at (a) 32° N. (b) 26° N, (c) 21° N and (d) 15° N. In each lower 1018
panel the tagged tracers for the respective regions 1–15 (from top to bottom) are shown. Blue 1019
and green lines represent Region 5 (South Asia) and Region 6 (East Asia), respectively, and 1020
each line is offset for easy view. 1021
1022
Fig. 6. Comparison of the observed (closed circles) and model-simulated (open circles) CH4 mixing ratios for the UT at(a) 32◦ N. (b)26◦ N, (c) 21◦ N and(d) 15◦ N. In each lower panel the tagged tracers for the respective regions 1–15 (from top to bottom) are shown. Blueand green lines represent Region 5 (South Asia) and Region 6 (East Asia), respectively, and each line is offset for easy view.
PV distribution along the flight route, we found that strato-spheric air (>3 PVU) intruded into the UT around 160◦–180◦ E. It is known that the CH4 mixing ratio decreasesrapidly with increasing altitude in the stratosphere (e.g. Sug-awara et al., 1997). In the stratosphere, no CH4 sources ex-ist and CH4 is destroyed by chemical reactions with OH, Cland O(1D). Therefore, CH4 is enriched in13C and D by theKIEs due to these reactions during its long residence timein the stratosphere (Sugawara et al., 1997; Rice et al., 2003;Rockmann et al., 2011). Regarding the air samples collectedaround 160◦–180◦ E, the N2O mixing ratios in the corre-sponding air samples were also lower than those of the othersamples, due to the influence of stratospheric air.
Another interesting feature is that relatively high CH4 mix-ing ratios, accompanied by lowδ13C andδD values, wereobserved in September 2010. As mentioned above, the ob-
servations in the NH UT between NRT and SYD or BNE andbetween NRT and GUM indicate that the CH4 mixing ratio ishigh in this season (Fig. 2a–d), due to CH4 from South Asiaand East Asia. Observed longitudinal distributions showedthe eastward decrease of the CH4 mixing ratio and increaseof δ13C andδD in the east of the CH4 maximum at 170◦ E,probably due to CH4 outflow from South Asia and East Asia.
4 Conclusions
To elucidate temporal and spatial variations of the CH4 mix-ing ratio,δ13C andδD in the UT over the Western Pacific, airsamples collected using the CONTAIL were analyzed. In theNH, the CH4 mixing ratio showed high values in boreal sum-mer, accompanied by relatively lowδ13C andδD values. Bycomparing with the LT data obtained using container ships
www.atmos-chem-phys.net/12/8095/2012/ Atmos. Chem. Phys., 12, 8095–8113, 2012

8108 T. Umezawa et al.: Methane isotopes in the troposphere over the Western Pacific
53
1023
Figure 7. Plots for (a) δ13C and (b) δD relative to the reciprocal of the CH4 mixing ratio for 1024
the UT at 15°–32° N. All data plotted were categorized as “Baseline” (black crosses), “South 1025
Asia” (blue closed circles) or “East Asia” (green closed circles) based on the tagged tracer 1026
experiments. Also shown are the average values of the data for the respective categories (open 1027
circles). 1028
1029
Fig. 7. Plots for(a) δ13C and(b) δD relative to the reciprocal ofthe CH4 mixing ratio for the UT at 15◦–32◦ N. All data plottedwere categorized as “Baseline” (black crosses), “South Asia” (blueclosed circles) or “East Asia” (green closed circles) based on thetagged tracer experiments. Also shown are the average values of thedata for the respective categories (open circles).
in the same region, it was found in the NH that CH4 mixingratios were higher in the UT than in the LT in summer. Fromthe tagged tracer experiments, we found that CH4 sources inSouth Asia and East Asia play an important role in the sum-mertime high CH4 mixing ratio values in the NH UT. Theobserved data ofδ13C andδD also indicated potential contri-butions of isotopically depleted biogenic CH4 sources suchas rice paddies and livestock to the high CH4 mixing ratiosobserved in the NH UT.
The latitudinal distributions of the CH4 mixing ratio andδD in the LT and UT were found to intersect at low latitudes;the CH4 mixing ratio andδD were higher and lower, respec-tively, in the LT than in the UT in the NH, and the situation isreversed in the SH. On the other hand,δ13C showed similarvalues in the LT and UT of the NH, but the value is higherin the LT than in the UT in the SH. These latitudinal distri-butions can be interpreted mainly in terms of the NH air in-trusion into the SH through the UT, but the CH4+Cl reactionin the marine boundary layer may also affect theδ13C distri-butions to some extent. Our data also indicate that the CH4mixing ratio has increased again since 2007, due to emissionsof isotopically light biogenic CH4 in the tropics and northernlatitudes.
54
1030
Figure 8. Longitudinal distributions of (a) the CH4 mixing ratio, (b) δ13C and (c) δD observed 1031
in four flights between Honolulu, Hawaii and Narita, Japan. 1032
1033
Fig. 8. Longitudinal distributions of(a) the CH4 mixing ratio,(b)δ13C and(c) δD observed in four flights between Honolulu, Hawaiiand Narita, Japan.
The analyses ofδ13C andδD in combination with the CH4mixing ratio are very useful for a better understanding of theglobal CH4 cycle. However, systematic measurements arestill quite sparse. To examine their spatiotemporal variationsin more detail, long-term measurements of these variablesover a geographically wide area are required. In additionto conventional analyses on IRMS, it is also expected thathigh-frequency isotopic data will be obtained using quantumlaser spectroscopy in the near future (e.g. Rigby et al., 2012).Modeling studies based onδ13C andδD as well as the CH4mixing ratio are also necessary for quantitatively elucidatingthe CH4 cycle, as well as for estimating the CH4 budget.
Supplementary material related to this article isavailable online at:http://www.atmos-chem-phys.net/12/8095/2012/acp-12-8095-2012-supplement.zip.
Acknowledgements.We are grateful to Japan Airlines (JAL), JALfoundation and JAMCO for supporting the CONTRAIL project.We also appreciate Hachiuma Steamship CO. Ltd., NYK Line,NYK shipmanagement Pte. Ltd., and staffs of container shipsfor their cooperation in collecting air samples. Our thanks aredue to K. Katsumata and H. Sandanbata, NIES and F. Arai and
Atmos. Chem. Phys., 12, 8095–8113, 2012 www.atmos-chem-phys.net/12/8095/2012/

T. Umezawa et al.: Methane isotopes in the troposphere over the Western Pacific 8109
J. Miyakozawa, Tohoku University for their CH4 mixing ratioanalyses. We also thank two anonymous referees and A. Baker fortheir comments to improve this paper.
Edited by: J. Kaiser
References
Allan, W., Manning, M. R., Lassey, K. R., Lowe, D. C., and Gomez,A. J.: Modeling the variation ofδ13C in atmospheric methane:Phase ellipses and the kinetic isotope effect, Global Biogeochem.Cy., 15, 467–481, 2001.
Allan, W., Lowe, D. C., Gomez, A. J., Struthers, H., and Brails-ford, G. W.: Interannual variation of13C in troposphericmethane: Implications for a possible atomic chlorine sink inthe marine boundary layer, J. Geophys. Res., 110, D11306,doi:10.1029/2004JD005650, 2005.
Allan, W., Struthers, H., and Lowe, D. C.: Methane carbon iso-tope effects caused by atomic chlorine in the marine bound-ary layer: Global model results compared with SouthernHemisphere measurements, J. Geophys. Res., 112, D04306,doi:10.1029/2006JD007369, 2007.
Aoki, S., Nakazawa, T., Murayama, S. and Kawaguchi, S.: Mea-surements of atmospheric methane at the Japanese Antarctic Sta-tion. Syowa, Tellus, 44B, 273–281, 1992.
Baker, A. K., Schuck, T. J., Slemr, F., van Velthoven, P., Zahn,A., and Brenninkmeijer, C. A. M.: Characterization of non-methane hydrocarbons in Asian summer monsoon outflow ob-served by the CARIBIC aircraft, Atmos. Chem. Phys., 11, 503–518,doi:10.5194/acp-11-503-2011, 2011.
Bergamaschi, P., Brenninkmeijer, C. A. M., Hahn, M., Rockmann,T., Scharffe, D. H., Crutzen, P. J., Elansky, N. F., Belikov, I.B., Trivett, N. B. A. and Worthy, D. E. J.: Isotope analysisbased source identification for atmospheric CH4 and CO sam-pled across Russia using the Trans-Siberian railroad, J. Geophys.Res., 103, 8227–8235, 1998.
Bergamaschi, P., Frankenberg, C., Meirink, J. F., Krol, M., Den-tener, F., Wagner, T., Platt, U., Kaplan, J. O., Korner, S.,Heimann, M., Dlugokencky, E. J., and Goede, A.: Satellite char-tography of atmospheric methane from SCIAMACHY on boardENVISAT: 2. Evaluation based on inverse model simulations, J.Geophys. Res., 112, D2304,doi:10.1029/2006JD007268, 2007.
Bergamaschi, P., Frankenberg, C., Meirink, J. F., Krol, M., Vil-lani, M. G., Houweling, S., Dentener, F., Dlugokencky, E. J.,Miller, J. B., Gatti, L. V., Engel, A. and Levin, I.: Inversemodeling of global and regional CH4 emissions using SCIA-MACHY satellite retrievals, J. Geophys. Res., 114, D22301,doi:10.1029/2009JD012287, 2009.
Bhattacharya, S. K., Borole, D. V., Francey, R. J., Allison, C. E.,Steele, L. P., Krummel, P., Langenfelds, R., Masarie, K. A., Ti-wari, Y. K., and Patra, P. K.: Trace gases and CO2 isotope recordsfrom Cabo de Rama, India, Curr. Sci., 97, 1336–1344, 2009.
Blake, D. R. and Rowland, F. S.: World-wide increase in tropo-spheric methane, 1978–1983, J. Atmos. Chem., 4, 43–62, 1986.
Bock, M., Schmitt, J., Behrens, M., Moller, L., Schnei-der, R., Sapart, C., and Fischer, H.: A gas chromatogra-phy/pyrolysis/isotope ratio mass spectrometry system for high-precisionδD measurements of atmospheric methane extracted
from ice cores, Rapid Commun. Mass Spectrom., 24, 621–633,2010.
Bousquet, P., Ciais, P., Miller, J. B., Dlugokencky, E. J., Hauglus-taine, D. A., Prigent, C., Van der Werf, G. R., Peylin, P.,Brunke, E.-G., Carouge, C., Langenfelds, R. L., Lathiere, J.,Papa, F., Ramonet, M., Schimidt, M., Steele, L. P., Tyler, S.C., and White, J.: Contribution of anthropogenic and naturalsources to atmospheric methane variability, Nature, 443, 439–443,doi:10.1038/nature05132, 2006.
Bousquet, P., Ringeval, B., Pison, I., Dlugokencky, E. J., Brunke, E.-G., Carouge, C., Chevallier, F., Fortems-Cheiney, A., Franken-berg, C., Hauglustaine, D. A., Krummel, P. B., Langenfelds, R.L., Ramonet, M., Schmidt, M., Steele, L. P., Szopa, S., Yver,C., Viovy, N., and Ciais, P.: Source attribution of the changes inatmospheric methane for 2006–2008, Atmos. Chem. Phys., 11,3689–3700,doi:10.5194/acp-11-3689-2011, 2011.
Brass, M. and Rockmann, T.: Continuous-flow isotope ratio massspectrometry method for carbon and hydrogen isotope measure-ments on atmospheric methane, Atmos. Meas. Tech., 3, 1707–1721,doi:10.5194/amt-3-1707-2010, 2010.
Brenninkmeijer, C. A. M., Crutzen, P., Boumard, F., Dauer, T., Dix,B., Ebinghaus, R., Filippi, D., Fischer, H., Franke, H., Frieß, U.,Heintzenberg, J., Helleis, F., Hermann, M., Kock, H. H., Koep-pel, C., Lelieveld, J., Leuenberger, M., Martinsson, B. G., Miem-czyk, S., Moret, H. P., Nguyen, H. N., Nyfeler, P., Oram, D.,O’Sullivan, D., Penkett, S., Platt, U., Pupek, M., Ramonet, M.,Randa, B., Reichelt, M., Rhee, T. S., Rohwer, J., Rosenfeld, K.,Scharffe, D., Schlager, H., Schumann, U., Slemr, F., Sprung, D.,Stock, P., Thaler, R., Valentino, F., van Velthoven, P., Waibel, A.,Wandel, A., Waschitschek, K., Wiedensohler, A., Xueref-Remy,I., Zahn, A., Zech, U., and Ziereis, H.: Civil Aircraft for the reg-ular investigation of the atmosphere based on an instrumentedcontainer: The new CARIBIC system, Atmos. Chem. Phys., 7,4953–4976,doi:10.5194/acp-7-4953-2007, 2007.
Chen, Y.-H. and Prinn, R. G.: Estimation of atmospheric methaneemissions between 1996 and 2001 using a three-dimensionalglobal chemical transport model, J. Geophys. Res., 111, D10307,doi:10.1029/2005JD006058, 2006.
Cunnold, D. M., Steele, L. P., Fraser, P. J., Simmonds, P. G.,Prinn, R. G., Weiss, R. F., Porter, L. W., O’Doherty, S., Lan-genfelds, R. L., Krummel, P. B., Wang, H. J., Emmons, L.,Tie, X. X., and Dlugokencky, E. J.: In situ measurements of at-mospheric methane at GAGE/AGAGE sites during 1985–2000and resulting source inferences, J. Geophys. Res., 107, 4225,doi:10.1029/2001JD001226, 2002.
Dlugokencky, E. J., Steele, L. P., Lang, P. M., and Masarie, K. A.:The growth rate and distribution of atmospheric methane, J. Geo-phys. Res., 99, 17021–17043, 1994.
Dlugokencky, E. J., Houweling, S., Bruhwiler, L., Masarie, K. A.,Lang, P. M., Miller, J. B., and Tans, P. P.: Atmospheric methanelevels off: Temporary pause or a new steady-state?, Geophys.Res. Lett., 30, 1992,doi:10.1029/2003GL018126, 2003.
Dlugokencky, E. J., Bruhwiler, L., White, J. W. C., Emmons, L.K., Novelli, P. C., Montzka, S. A., Masarie, K. A., Lang, P. M.,Crotwell, A. M., Miller, J. B., and Gatti, L. V.: Observationalconstraints on recent increases in the atmospheric CH4 burden,Geophys. Res. Lett., 36, L18803,doi:10.1029/2009GL039780,2009.
www.atmos-chem-phys.net/12/8095/2012/ Atmos. Chem. Phys., 12, 8095–8113, 2012

8110 T. Umezawa et al.: Methane isotopes in the troposphere over the Western Pacific
Dlugokencky, E. J., Nisbet, E. G., Fisher, R. and Lowry, D.: Globalatmospheric methane: budget, changes and dangers, Phil. Trans.R. Soc. A, 369, 2058–2072, 2011.
Etheridge, D. M., Steel, L. O., Francey, R. J., and Langenfelds, R.L.: Atmospheric methane between 1000 A.D. and present: Ev-idence of anthropogenic emissions and climatic variability, J.Geophys. Res., 103, 15979–15993, 1998.
Forster, P., Ramaswamy, V., Artaxo, P., Berntsen, T., Betts, R., Fa-hey, D. W., Haywood, J., Lean, J., Lowe, D. C., Myhre, G.,Nganga, J., Prinn, R., Raga, G., Schulz, M., and Dorland, R. V.:Changes in Atmospheric Constituents and in Radiative Forcing,Climate Change 2007: The Physical Science Basis. Contributionof Working Group I to the Fourth Assessment Report of the In-tergovernmental Panel on Climate Change. S. Solomon, D. Qin,M. Manninget al, Cambridge, United Kingdom and New York,NY, USA, Cambridge University Press, 2007.
Francey, R. J., Steele, L. P., Langenfelds, R. L., and Pak, B. C.:High Precision Long-Term Monitoring of Radiatively Active andRelated Trace Gases at Surface Sites and from Aircraft in theSouthern Hemisphere Atmosphere, J. Atmos. Sci., 56, 279–85,1999.
Frankenberg, C., Aben, I., Bergamaschi, P., Dlugokencky, E. J., vanHees, R., Houweling, S., van der Meer, P., Snel, R., and Tol,P.: Global column-averaged methane mixing ratios from 2003to 2009 as derived from SCIAMACHY: Trends and variability, J.Geophys. Res., 116, D04302,doi:10.1029/2010JD014849, 2011.
Fung, I., John, J., Lerner, J., Mattews, E., Prather, M., Steele, L.P., and Fraser, P. J.: Three-dimensional model synthesis of theglobal methane cycle, J. Geophys. Res., 96, 13033–13065, 1991.
Houweling, S., Rockmann, T., Aben, I., Keppler, F., Krol, M.,Meirink, J. F., Dlugokencky, E. J., and Frankenberg, C.: Atmo-spheric constraints on global emissions of methane from plants,Geophys. Res. Lett., 33, L15821,doi:10.1029/2006GL026162,022006, 2006.
Ishijima, K., Nakazawa, T., Sugawara, S., Aoki, S., and Saeki,T.: Concentration variations of tropospheric nitrous oxide overJapan, Geophys. Res. Lett., 28, 171–174, 2001.
Ishijima, K., Nakazawa, T., and Aoki, S.: Variations of atmosphericnitrous oxide concentration in the northern and Western Pacific,Tellus, 61B, 408–415, 2009.
Ishijima, K., Patra, P. K., Takigawa, M., Machida, T., Matsueda,H., Sawa, Y., Steele, L. P., Krummel, P. B., Langenfelds, R. L.,Aoki, S., and Nakazawa, T.: Stratospheric influence on the sea-sonal cycle of nitrous oxide in the troposphere as deduced fromaircraft observations and model simulations, J. Geophys. Res.,115, D20308,doi:10.1029/2009JD013322, 2010.
Jiang, J. H., Livesey, N. J., Su, H., Neary, L., McConnell, J. C.,and Richards, N. A. D.: Connecting surface emissions, con-vective uplifting, and long-range transport of carbon monox-ide in the upper troposphere: New observations from the AuraMicrowave Limb Sounder, Geophys. Res. Lett., 34, L18812,doi:10.1029/2007GL030638, 2007.
Lal, S., Chand, D., Venkataramani, S., Appu, K. S., Naja, M., andPatra, P. K.: Trends in methane and sulfur hexafluoride at a trop-ical coastal site, Thumba (8.6◦ N, 77◦ E), in India, Atmos. Envi-ron., 38, 1145–1151, 2004.
Lloyd, J., Francey, R. J., Mollicone, D., Raupach, M. R., Sogachev,A., Arneth, A., Byers, J. N., Kelliher, F. M., Rebmann, C., Valen-tini, R., Wong, S.-C., Bauer, G., and Schulze, E.-D.: Vertical pro-files, boundary layer budgets, and regional flux estimates for CO2and its13C/12C ratio and for water vapor above a forest/bog mo-saic in central Siberia, Global Biogeochem. Cy., 15, 267–284,2001.
Machida, T., Matsueda, H., Sawa, Y., Nakagawa, Y., Hirotani, K.,Kondo, N., Goto, K., Nakazawa, T., Ishikawa, K., and Ogawa, T.:Worldwide measurements of atmospheric CO2 and other tracegas species using commercial airlines, J. Atmos. Ocean. Tech.,25 1744–1754, 2008.
Mak, J. E., Manning, M. R., and Lowe, D. C.: Aircraft observationsof δ13C of atmospheric methane over the Pacific in August 1991and 1993: Evidence of an enrichment in13CH4 in the SouthernHemisphere, J. Geophys. Res., 105, 1329–1335, 2000.
Matsueda, H. and Inoue, H. Y.: Measurements of atmospheric CO2and CH4 using a commercial airliner from 1993 to 1994, Atmos.Environ., 30, 1647–1655, 1996.
Matsueda, H., Inoue, H. Y., Sawa, Y., Tsutsumi, Y., and Ishii, M.:Carbon monoxide in the upper troposphere over the Western Pa-cific between 1993 and 1996, J. Geophys. Res., 103, 19093–19110, 1998.
Matsueda, H., Inoue, H. Y., and Ishii, M.: Aircraft observations ofcarbon dioxide at 8–13 km altitude over the Western Pacific from1993 to 1999, Tellus, 54B, 1–21, 2002.
Matsueda, H., Machida, T., Sawa, Y., Nakagawa, Y., Hirotani, K.,Ikeda, H., Kondo, N., and Goto, K.: Evaluation of atmosphericCO2 measurements from new flask air sampling of JAL airlinerobservations, Pap. Meteorol. Geophys., 59, 1–17, 2008.
Matthews, E. and Fung, I.: Methane emission from natural wet-lands: Global distirbution, area, and environmental characteris-tics of sources, Global Biogeochem. Cy., 1, 61–86, 1987.
Miller, J. B., Mack, K. A., Dissly, R., White, J. W. C., Dlu-gokencky, E. J., and Tans, P. P.:, Development of analyticalmethods and measurements of13C/12C in atmospheric CH4from the NOAA Climate Monitoring and Diagnostics Labo-ratory Global Air Sampling Network, J. Geophys. Res., 107,doi:10.1029/2001JD000630, 2002.
Miller, J. B., Gatti, L. V., d’Amelio, M. T. S., Crotwell, A. M.,Dlugokencky, E. J., Bakwin, P., Artaxo, P., and Tans, P. P.:Airborne measurements indicate large methane emissions fromthe eastern Amazon basin, Geophys. Res. Lett., 34, L10809,doi:10.1029/2006GL029213, 2007.
Miyazaki, K., Patra, P. K., Takigawa, M., Iwasaki, T., andNakazawa. T.: Global-scale transport of carbon diox-ide in the troposphere, J. Geophys. Res., 113, D15301,doi:10.1029/2007JD009557, 2008.
Morimoto, S., Nakazawa, T., Higuchi, K., and Aoki, S.: Latitudinaldistribution of atmospheric CO2 sources and sinks inferred byδ13C measurements from 1985 to 1991, J. Geophys. Res., 105,24315–24326, 2000.
Morimoto, S., Aoki, S., Nakazawa, T., and Yamanouchi, T.: Tempo-ral variations of the carbon isotopic ratio of atmospheric methaneobserved at NyAlesund, Svalbard from 1996 to 2004, Geophys.Res. Lett., 33, L01807,doi:10.1029/2005GL024648, 2006.
Atmos. Chem. Phys., 12, 8095–8113, 2012 www.atmos-chem-phys.net/12/8095/2012/

T. Umezawa et al.: Methane isotopes in the troposphere over the Western Pacific 8111
Nakazawa, T., Miyashita, K., Aoki, S., and Tanaka, M.: Tempo-ral and spatial variations of upper tropospheric and lower strato-spheric carbon dioxide, Tellus, 43B, 106–117, 1991.
Nakazawa, T., Murayama, S., Miyashita, K., Aoki, S., and Tanaka,M.: Longitudinally different variations of lower tropospheric car-bon dioxide concentrations over the North Pacific Ocean, Tellus,44B, 161–172, 1992.
Nakazawa, T., Machida, T., Tanaka, M., Fujii, Y., Aoki, S., andWatanabe, O.: Differences of the atmospheric CH4 concentrationbetween the Arctic and Antarctic regions in pre-industrial/pre-agricultural era, Geophys. Res. Lett., 20, 943–946, 1993a.
Nakazawa, T., Morimoto, S., Aoki, S., and Tanaka, M.: Time andspace variations of the carbon isotopic ratio of tropospheric car-bon dioxide over Japan, Tellus, 45B, 258–274, 1993b.
Nakazawa, T., Morimoto, S., Aoki, S., and Tanaka, M.: Temporaland spatial variaitions of the carbon isotopic ratio of atmosphericcarbon dioxide in the Western Pacific region, J. Geophys. Res.,102, 1271–1285, 1997a.
Nakazawa, T., Ishizawa, M., Higuchi, K., and Trivett, N. B. A.: Twocurve fitting methods applied to CO2 flask data, Environmetrics,8, 197–218, 1997b.
Olivier, J. G. J. and Berdowski, J. J. M.: Global emissions sourcesand sinks, The Climate System. J. Berdowski, R. Guicheritand B. J. Heij, Lisse, The Netherlands, A.A. Balkema Publish-ers/Swets & Zeitlinger Publishers, 33–78, 2001.
Onogi, K., Tsutsui, J., Koide, H., Sakamoto, M., Kobayashi, S., Hat-sushika, H., Matsumoto, T., Yamazaki, N., Kamahori, H., Taka-hashi, K., Kadokura, S., Wada, K., Kato, K., Oyama, R., Ose, T.,Mannoji, N., and Taira, R.: The JRA-25 Reanalysis, J. Meteorol.Soc. Jpn., 85, 369–432, 2007.
Park, M., Randel, W. J., Kinnison, D. E., Garcia, R. R.,and Choi, W.: Seasonal variation of methane, water vapor,and nitrogen oxides near the tropopause: Sattelite observa-tions and model simulations, J. Geophys. Res., 108, D03302,doi:10.1029/2003JD003706, 2004.
Park, M., Randel, W. J., Emmons, L. K., and Liversey, N. J.: Trans-port pathways of carbon monoxide in the Asian summer mon-soon diagnosed from MOZART, J. Geophys. Res., 114, D08303,doi:10.1029/2008JD010621, 2009.
Pataki, D. E., Ehleringer, J. R., Flanagan, L. B., Yakir, D., Bowl-ing, D. R., Still, C. J., Buchmann, N., Kaplan, J. O., and Berry, J.A.: The application and interpretation of Keeling plots in terres-trial carbon cycle research, Global Biogeochem. Cy., 17, 1022,doi:10.1029/2001GB001850, 2003.
Patra, P. K., Takigawa, M., Ishijima, K., Choi, B.-C., Cunnold,D., Dlugokencky, E. J., Fraser, P., Gomez-Pelaez, A. J., Goo,T.-Y., Kim, J.-S., Krummel, P., Langenfelds, R., Meinhardt, F.,Mukai, H., O’Doherty, S., Prinn, R. G., Simmonds, P., Steele, P.,Tohjima, Y., Tsuboi, K., Uhse, K., Weiss, R., Worthy, D., andNakazawa, T.: Growth rate, seasonal, synoptic and diurnal varia-tions in lower atmospheric methane and its budget, J. Meteorol.Soc. Jpn., 87, 635–663,doi:10.2151/jmsj.87.635, 2009.
Patra, P. K., Houweling, S., Krol, M., Bousquet, P., Belikov, D.,Bergmann, D., Bian, H., Cameron-Smith, P., Chipperfield, M. P.,Corbin, K., Fortems-Cheiney, A., Fraser, A., Gloor, E., Hess, P.,Ito, A., Kawa, S. R., Law, R. M., Loh, Z., Maksyutov, S., Meng,L., Palmer, P. I., Prinn, R. G., Rigby, M., Saito, R., and Wilson,C.: TransCom model simulations of CH4 and related species:linking transport, surface flux and chemical loss with CH4 vari-
ability in the troposphere and lower stratosphere, Atmos. Chem.Phys., 11, 12813–12837,doi:10.5194/acp-11-12813-2011, 2011.
Quay, P. D., King, S. L., Stutsman, J., Wilbur, D. O., Steele, L. P.,Fung, I., Gammon, R. H., Brown, T. A., Farwell, G. W., Grootes,P. M., and Schmidt, F. H.: Carbon isotopic composition of at-mospheric CH4: Fossil and biomass burning strengths, GlobalBiogeochem. Cy., 5, 25–47, 1991.
Quay, P., Stutsman, J., Wilbur, D., Snover, A., Dlugokencky, E., andBrown, T.: The isotopic composition of atmospheric methane,Global Biogeochem. Cy., 13, 445–461, 1999.
Rice, A. L., Gotoh, A. A., Ajie, H. O., and Tyler, S. C.: High-precision continuous-flow measurement ofδ13C andδD of at-mospheric CH4, Anal. Chem., 73, 4104–4110, 2001.
Rice, A. L., Tyler, S. C., McCarthy, M. C., Boering, K.A., and Atlas, E.: Carbon and hydrogen isotopic composi-tions of stratospheric methane: 1. High-precision observationsfrom the NASA ER-2 aircraft, J. Geophys. Res., 108, 4460,doi:10.1029/2002JD003042, 2003.
Rigby, M., Prinn, R. G., Fraser, P. J., Simmonds, P. G., Lan-genfelds, R. L., Huang, J., Cunnold, D. M., Steele, L. P.,Krummel, P. B., Weiss, R. F., O’Doherty, S., Salameh, P. K.,Wang, H. J., Harth, C. M., Muhle, J., and Porter, L. W.: Re-newed growth of atmospheric methane, Geophys. Res. Lett., 35,L22805,doi:10.1029/2008GL036037, 2008.
Rigby, M., Manning, A. J., and Prinn, R. G.: The value of high-frequency, high-precision methane isotopologue measurementsfor source and sink estimation, J. Geophys. Res., 117, D12312,doi:10.1029/2011JD017384, 2012.
Rockmann, T., Brass, M., Borchers, R., and Engel, A.: The isotopiccomposition of methane in the stratosphere: high-altitude balloonsample measurements, Atmos. Chem. Phys., 11, 13287–13304,doi:10.5194/acp-11-13287-2011, 2011.
Sasakawa, M., Shimoyama, K., Machida, T., Tsuda, N., Suto, H.,Arshinov, M., Davydov, D., Fofonov, A., Krasnov, O., Saeki, T.,Koyama, Y., and Maksyutov, S.: Continuous measurements ofmethane from a tower network over Siberia, Tellus, 62, 403–416,2010.
Saueressig, G., Bergamaschi, P., Crowley, J. N., Fischer, H., andHarris, G. W.: Carbon kinetic isotope effect in the reaction ofCH4 with Cl atoms, Geophys. Res. Lett., 22, 1225–1228, 1995.
Saueressig, G., Bergamaschi, P., Crowley, J. N., Fischer, H.,and Harris, G. W.: D/H kinetic isotope effect in the reactionCH4 + Cl, Geophys. Res. Lett., 23, 3619–3622, 1996.
Saueressig, G., Crowley, J. N., Bergamaschi, P., Bruhl, C., Bren-ninkmeijer, C. A. M., and Fischer, H.: Carbon 13 and D kineticisotope effects in the reactions of CH4 with O(1D) and OH: Newlaboratory measurements and their implications for the isotopiccomposition of stratospheric methane, J. Geophys. Res., 106,23127–23138, 2001.
Sawa, Y., Machida, T., and Matsueda, H.: Seasonal variations ofCO2 near the tropopause observed by commercial aircraft, J.Geophys. Res., 113, D23301,doi:10.1029/2008JD010568, 2008.
Sawa, Y., Machida, T., and Matsueda. H.: Aircraft obser-vation of the seasonal variation in the transport of CO2in the upper atmosphere, J. Geophys. Res., 117, D05305,doi:10.1029/2011JD016933, 2012.
Schoell, M.: The hydrogen and carbon isotopic composition ofmethane from natural gases of various origin, Geochim. Cos-mochim. Acta, 44, 649–661, 1980.
www.atmos-chem-phys.net/12/8095/2012/ Atmos. Chem. Phys., 12, 8095–8113, 2012
8112 T. Umezawa et al.: Methane isotopes in the troposphere over the Western Pacific
Schuck, T. J., Brenninkmeijer, C. A. M., Baker, A. K., Slemr, F.,von Velthoven, P. F. J., and Zahn, A.: Greenhouse gas relation-ships in the Indian summer monsoon plume measured by theCARIBIC passenger aircraft, Atmos. Chem. Phys., 10, 3965–3984,doi:10.5194/acp-10-3965-2010, 2010.
Spivakovsky, C. M., Logan, J. A., Montzka, S. A., Balkanski, Y. J.,Foreman-Fowler, M., Jones, D. B. A., Horowitz, L. W., Fusco, A.C., Brenninkmeijer, C. A. M., Prather, M. J., Wofsy, S. C., andMcElroy, M. B.: Three-dimensional climatological distributionof tropospheric OH: Update and evaluation, J. Geophys. Res.,105, 8931–8980, 2000.
Steele, L. P., Fraser, P. J., Rasmussen, R. A., Khalil, M. A. K., Con-way, T. J., Crawford, A. J., Gammon, R. H., Masarie, K. A., andThoning, K. W.: The global distribution of methane in the tropo-sphere, J. Atmos. Chem., 5, 125–171, 1987.
Streets, D. G., Bond, T. C., Carmichael, G. R., Fernandes, S. D., Fu,Q., He, D., Klimont, Z., Nelson, S. M., Tsai, N. Y., Wang, M.Q., Woo, J.-H. and Yarber, K. F.: An inventory of gaseous andprimary aerosol emissions in Asia in the year 2000, J. Geophys.Res., 108, 8809,doi:10.1029/2002JD003093, 2003.
Sudo, K., Takahashi, M., Kurokawa, J., and Akimoto, H.:CHASER: A global chemical model of the troposphere 1. Modeldescription, J. Geophys. Res., 107,doi:10.1029/2001JD001113,2002.
Sugawara, S., Nakazawa, T., Inoue, G., Machida, T., Mukai, H.,Vinnichenko, N. K., and Khattatov, V. U.: Aircraft measurementsof the stable carbon isotopic ratio of atmospheric methane overSiberia, Global Biogeochem. Cy., 10, 223–231, 1996.
Sugawara, S., Nakazawa, T., Shirakawa, Y., Kawamura, K., Aoki,S., Machida, T., and Honda, H.: Vertical profile of the carbonisotopic ratio of stratospheric methane over Japan, Geophys. Res.Lett., 24, 2989–2992, 1997.
Takigawa, M., Takahashi, M., and Akiyoshi, H.: Simulation ofozone and other chemical species using a Center for Climate Sys-tem Research/National Institute for Environmental Studies atmo-spheric GCM with coupled stratospheric chemistry, J. Geophys.Res., 104, 14003–14018, 1999.
Tanaka, M., Nakazawa, T., and Aoki, S.: Concentrationof Atmo-spheric Carbon Dioxide over Japan, J. Geophys. Res., 88, 1339–1344, 1983.
Tanaka, M., Nakazawa, T., and Aoki, S.: Time and space variationsof tropospheric carbon dioxide over Japan, Tellus, 39B, 3–12,1987a.
Tanaka, M., Nakazawa, T., and Aoki, S.: Seasonal and meridionalvariations of atmospheric carbon dioxide in the lower tropo-sphere of the northern and southern hemispheres, Tellus, 39B,29–41, 1987b.
Terao, Y., Mukai, H., Nojiri, Y., Machida, T., Tohjima, Y., Saeki, T.,and Maksyutov, S.: Interannual variability and trends in atmo-spheric methane over the Western Pacific from 1994 to 2010, J.Geophys. Res., 116, D14303,doi:10.1029/2010JD015467, 2011.
Tohjima, Y., Machida, T., Utiyama, M., Katsumoto, M., Fu-jinuma, Y., and Maksyutov , S.: Analysis and presentationof in situ atmospheric methane measurements from CapeOchi-ishi and Hateruma Island, J. Geophys. Res., 107, 4148,doi:10.1029/2001JD001003, 2002.
Tyler, S. C., Ajie, H. O., Gupta, M. L., Cicerone, R. J., Blake, D.R., and Dlugolencky, E. J.: Stable carbon isotopic compositionof atmospheric methane: A comparison of surface level and freetropospheric air, J. Geophys. Res., 104, 13895–13910, 1999.
Tyler, S. C., Ajie, H. O., Rice, A. L., Cicerone, R. J., and Tuazon, E.C.: Experimentally determined kinetic isotope effects in the re-action of CH4 with Cl: Implications for atmospheric CH4, Geo-phys. Res. Lett., 27, 1715–1718, 2000.
Tyler, S. C., Rice, A. L., and Ajie, H. O.: Stable isotope ratios inatmospheric CH4: Implications for seasonal sources and sinks, J.Geophys. Res., 112, D03303,doi:10.1029/2006JD007231, 2007.
Umezawa, T.: A study of global methane cycle based on measure-ments of its carbon and hydrogen isotopes in the atmosphere,Ph.D. thesis, Graduate school of science, Tohoku University,Sendai, Japan, 2009.
Umezawa, T., Aoki, S., Morimoto, S., and Nakazawa, T.: A high-precision measurement system for carbon and hydrogen isotopicratios of atmospheric methane and its application to air samplescollected in the Western Pacific region, J. Meteorol. Soc. Jpn.,87, 365–379, 2009.
Umezawa, T., Aoki, S., Kim, Y., Morimoto, S., and Nakazawa, T.:Carbon and hydrogen stable isotopic ratios of methane emit-ted from wetlands and wildfires in Alaska: Aircraft observa-tions and bonfire experiments, J. Geophys. Res., 116, D15305,doi:10.1029/2010JD015545, 2011.
Waliser, D. E. and Gautier, C.: A satellite-derived climatology ofthe ITCZ, J. Clim., 6, 2162–2174, 1993.
Werner, R. A. and Brand, W. A.: Referencing strategies and tech-niques in stable isotope ratio analysis, Rapid Comm. Mass Spec-trom., 15, 501–519, 2001.
Whiticar, M. and Schaefer, H.: Constraining past global tro-pospheric methane budgets with carbon and hydrogen iso-tope ratios in ice, Phil. Trans. R. Soc. A, 365, 1793–1828,doi:1710.1098/rsta.2007.2048, 2007.
Xiao, Y., Jacob, D. J., Wang, J. S., Logan, J. A., Palmer, P. I., Sun-tharalingam, P., Yantosca, R. M., Sachse, G. W., Blake, D. R.,and Streets, D. G.: Constraints on Asian and European sourcesof methane from CH4-C2H6-CO correlations in Asian outflow, J.Geophys. Res., 109, D15S16,doi:10.1029/2003JD004475, 2004.
Xiong, X., Houweling, S., Wei, J., Maddy, E., Sun, F., and Barnet,C.: Methane plume over south Asia during the monsoon season:satellite observation and model simulation, Atmos. Chem. Phys.,9, 783–794,doi:10.5194/acp-9-783-2009, 2009.
Yamada, K., Ozaki, Y., Nakagawa, F., Sudo, S., Tsuruta, H., andYoshida, N.: Hydrogen and carbon isotopic measurements ofmethane from agricultural combustion: Implications for isotopicsignatures of global biomass burning sources, J. Geophys. Res.,111, D16306,doi:10.1029/2005JD006750, 2006.
Yamaji, K., Ohara, T., and Akimoto, H.: A country-specific, high-resolution emission inventory for methane from livestock in Asiain 2000, Atmos. Environ., 37, 4393–4406, 2003.
Yan, X., Ohara, T., and Akimoto, H.: Development of region-specific emission factors and estimation of methane emissionfrom rice fields in the East, Southeast and South Asian countries,Global Change Biol., 9, 237–254, 2003.
Atmos. Chem. Phys., 12, 8095–8113, 2012 www.atmos-chem-phys.net/12/8095/2012/

T. Umezawa et al.: Methane isotopes in the troposphere over the Western Pacific 8113
Yashiro, H., Sugawara, S., Sudo, K., Aoki, S., and Nakazawa,T.: Temporal and spatial variations of carbon monoxide overthe western part of the Pacific Ocean, J. Geophys. Res., 114,D08305,doi:10.1029/2008JD010876, 2009.
Yoshida, Y., Ota, Y., Eguchi, N., Kikuchi, N., Nobuta, K., Tran,H., Morino, I., and Yokota, T., Retrieval algorithm for CO2 andCH4 column abundances from short-wavelength infrared spec-tral observations by the Greenhouse gases observing satellite,Atmos. Meas. Tech., 4, 717–734, doi:710.5194/amt-5194-5717-2011, 2011.
Zhou, L. X., Worthy, D. E. J., Lang, P. M., Ernst, M. K., Zhange, X.C., Wen, Y. P., and Li, J. L.: Ten years of atmospheric methaneobservations at a high elevation site in Western China, Atmos.Environ., 38, 7041–7054, 2004.
www.atmos-chem-phys.net/12/8095/2012/ Atmos. Chem. Phys., 12, 8095–8113, 2012