capitation payment model - amga · pdf fileintegrated emr + all payer claims data 6 . ... plan...
TRANSCRIPT
Capitation Payment Model: Understanding Payment Models in a World of
Value-Based Care
March 10, 2016
Beth Honan, Chief Contracting Officer
Atrius Health
Atrius Health
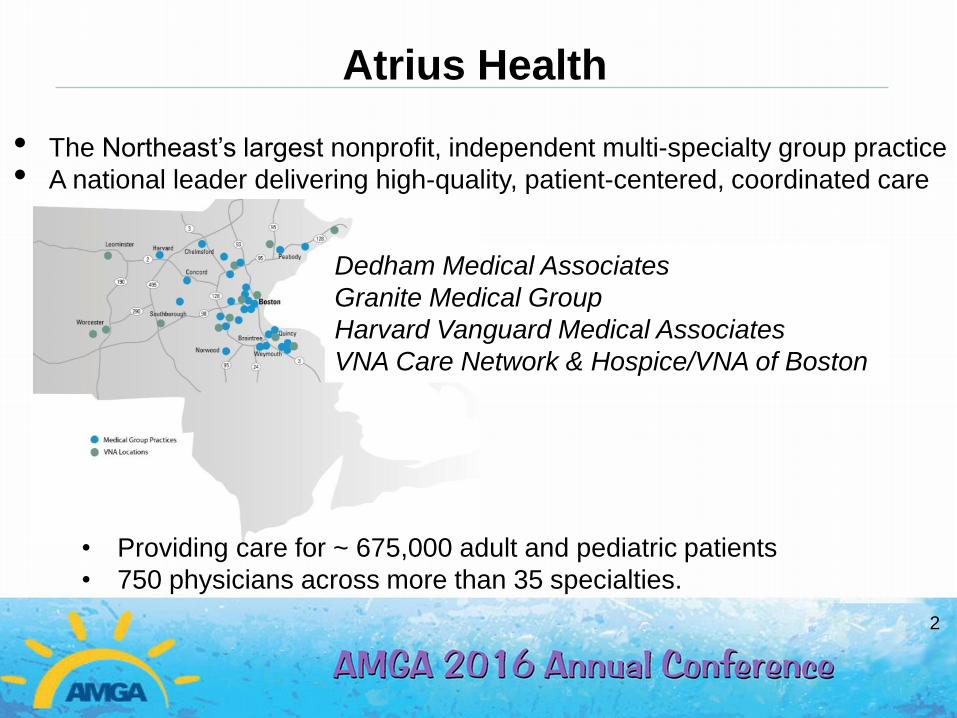
• The Northeast’s largest nonprofit, independent multi-specialty group practice
• A national leader delivering high-quality, patient-centered, coordinated care
Dedham Medical Associates
Granite Medical Group
Harvard Vanguard Medical Associates
VNA Care Network & Hospice/VNA of Boston
• Providing care for ~ 675,000 adult and pediatric patients
• 750 physicians across more than 35 specialties.
2

Key Statistics
• Employees: 6,800
• Physicians: 750
• Patients Served: 675,000
• Annual Patient Visits: 2.3 million
• Clinical Locations: 32, (3 hospices)
• Revenue: $1.9B (2015)
– 75% through a capitation payment model
3

Atrius Health Payment Model Mix: - 75% of revenue aligned with reducing total cost of care
Fee-for-Service
(includes Pioneer)
Medicaid
Medicare
Advantage
Commercial
75% Capitation
25%
Fee for Service
~ $500 K
4
~ $1.4b
Atrius Health’s Services
• Primary care: ~340 physicians.
– Internal Medicine, Pediatrics, Family Medicine
• Behavioral Health: ~160 providers
• Specialties: ~250 physicians
– 35+ medical and surgical specialties
• Urgent Care:
– Evenings/weekends/holidays 365 days/year. 24/7 phone advice
• VNA Care Network/Hospice:
– Home health, palliative care and hospice, private duty nursing,
assisted living nursing management
5
Why Choose Capitation Payment Model?
• Long history of managing capitation
– Practice originated from HMO staff model
– 75% of revenue under capitation today
• Population Health management is in our DNA
– Proactive and preventive care, chronic disease management, hi-risk
patient management for all patients
• Mature Informatics and Analytics Infrastructure
– Same EMR since 1998, 100% organizational adoption
– Enterprise Data Warehouse. Integrated EMR + All Payer Claims Data
6
The Concept of Value-Based Care is Not New
“The existing deficiencies in health care cannot
be corrected simply by supplying more
personnel, more facilities and more money.
These problems can only be solved by
organizing the personnel, facilities and financing
into a conceptual framework and operating
system that will provide optimally for the health
needs of the population.”
Dr. Robert Ebert, Founder,
Harvard Community Health Plan,1969
7
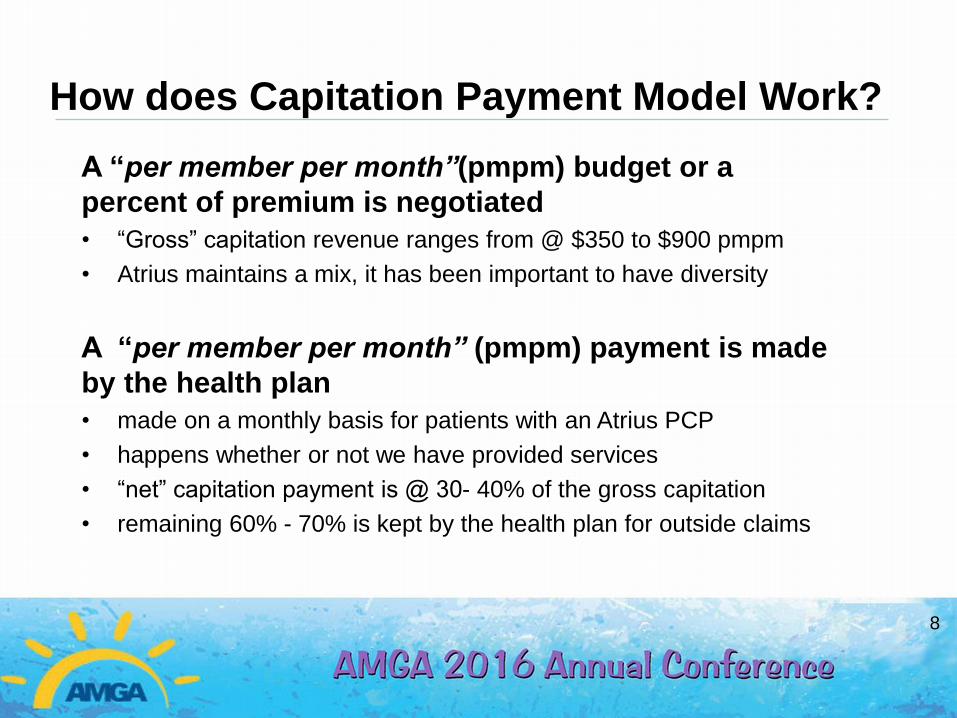
A “per member per month”(pmpm) budget or a
percent of premium is negotiated
• “Gross” capitation revenue ranges from @ $350 to $900 pmpm
• Atrius maintains a mix, it has been important to have diversity
A “per member per month” (pmpm) payment is made
by the health plan
• made on a monthly basis for patients with an Atrius PCP
• happens whether or not we have provided services
• “net” capitation payment is @ 30- 40% of the gross capitation
• remaining 60% - 70% is kept by the health plan for outside claims
How does Capitation Payment Model Work?
8
$54
$105
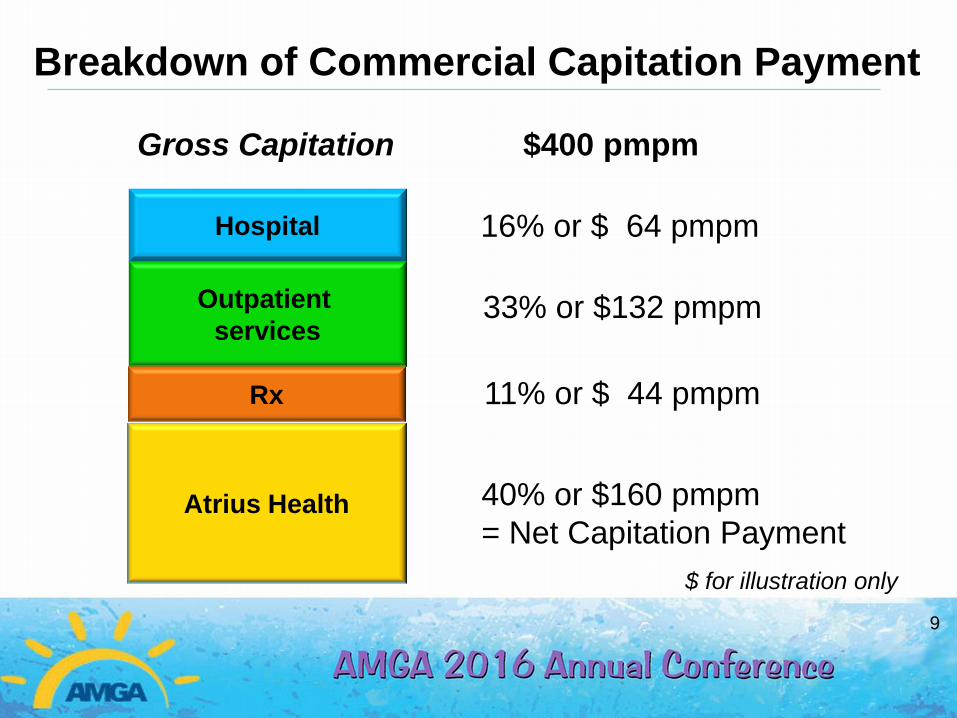
Gross Capitation
Hospital
Outpatient
services
Rx
Atrius Health
Breakdown of Commercial Capitation Payment
16% or $ 64 pmpm
11% or $ 44 pmpm
33% or $132 pmpm
40% or $160 pmpm
= Net Capitation Payment
$400 pmpm
9
$ for illustration only
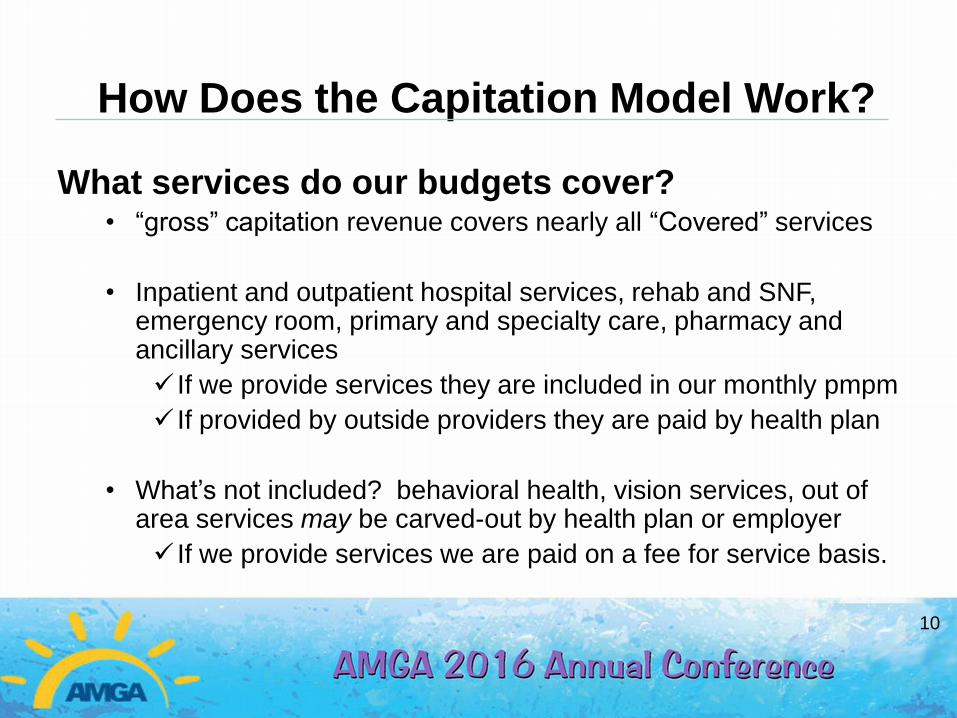
What services do our budgets cover? • “gross” capitation revenue covers nearly all “Covered” services
• Inpatient and outpatient hospital services, rehab and SNF, emergency room, primary and specialty care, pharmacy and ancillary services
If we provide services they are included in our monthly pmpm
If provided by outside providers they are paid by health plan
• What’s not included? behavioral health, vision services, out of area services may be carved-out by health plan or employer
If we provide services we are paid on a fee for service basis.
How Does the Capitation Model Work?
10
How are our pmpm budgets adjusted? • adjustments happen concurrently and at settlement
• adjustments reflect changes in the population
patients’ age, gender, “health status”, i.e. DxCG, plan
design and benefits
• significant variation exists at site level, as much as 50%
• budgets trended annually, based on medical expense
11
How Does the Capitation Model Work?
How Does the Capitation Model Work?
How much risk do we accept?
• generally accept 100% of the risk
• exception is either small populations or new risk
arrangements
• If exception, we may share risk and/or have a cap
on gains/losses
• we purchase outside reinsurance to protect
ourselves against individual catastrophic or high
cost cases.
12
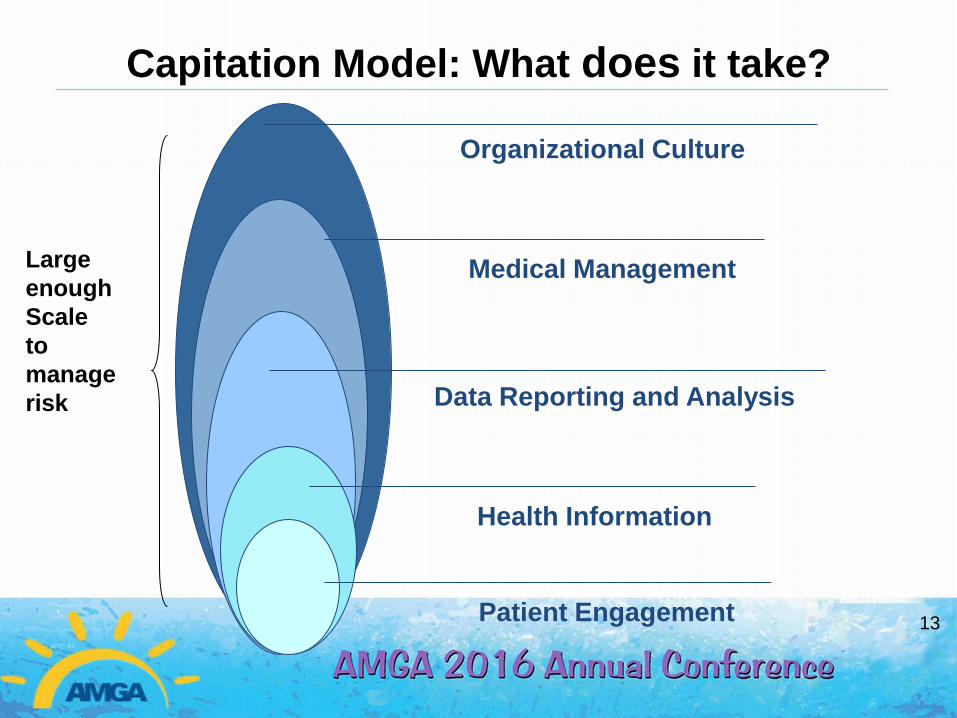
Capitation Model: What does it take?
Organizational Culture
Data Reporting and Analysis
Medical Management
Health Information
Patient Engagement
Large
enough
Scale
to
manage
risk
13
Capitation Model: What are the incentives?
Provide high quality, cost effective, coordinated patient-centered care
• Payment comes up front, focus on patient needs, not what is billed
• Improve patient experience, improve population heath and reduce TME
• Right care, right time, right place
What does this look like in the medical practices? • Same day access, urgent care, 24/7 telemed
• Integrated Behavioral Health services and BH facilitators
• Case Managers embedded in primary care practices
• Clinical Pharmacists, Pediatric Care Facilitators
• E-consults and telehealth visits
• Coding and EMR supports
14
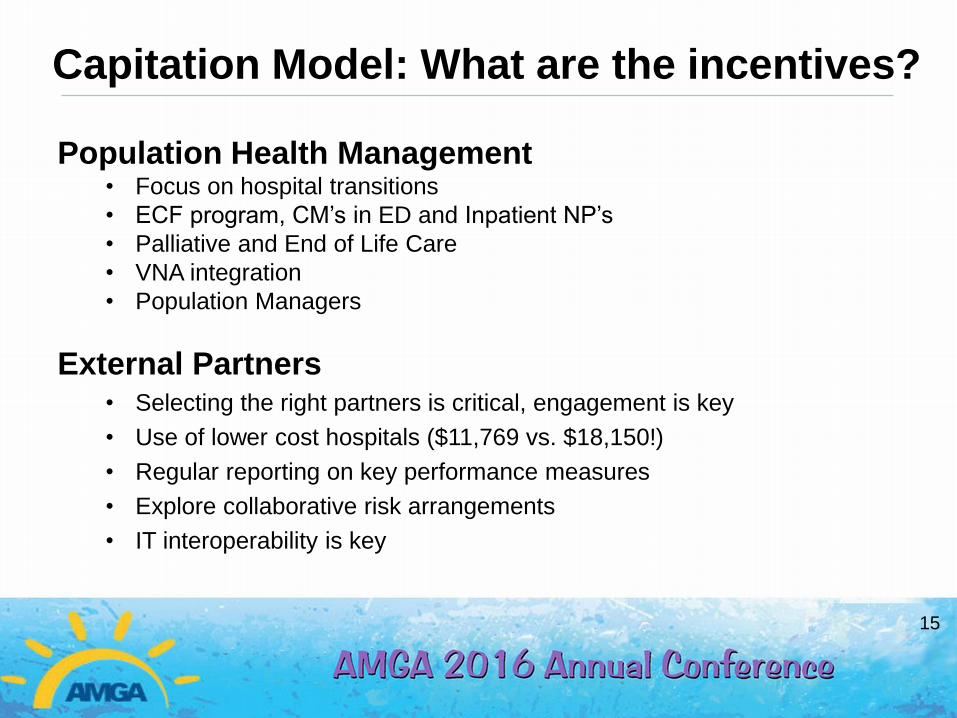
Capitation Model: What are the incentives?
Population Health Management
• Focus on hospital transitions
• ECF program, CM’s in ED and Inpatient NP’s
• Palliative and End of Life Care
• VNA integration
• Population Managers
External Partners • Selecting the right partners is critical, engagement is key
• Use of lower cost hospitals ($11,769 vs. $18,150!)
• Regular reporting on key performance measures
• Explore collaborative risk arrangements
• IT interoperability is key
15
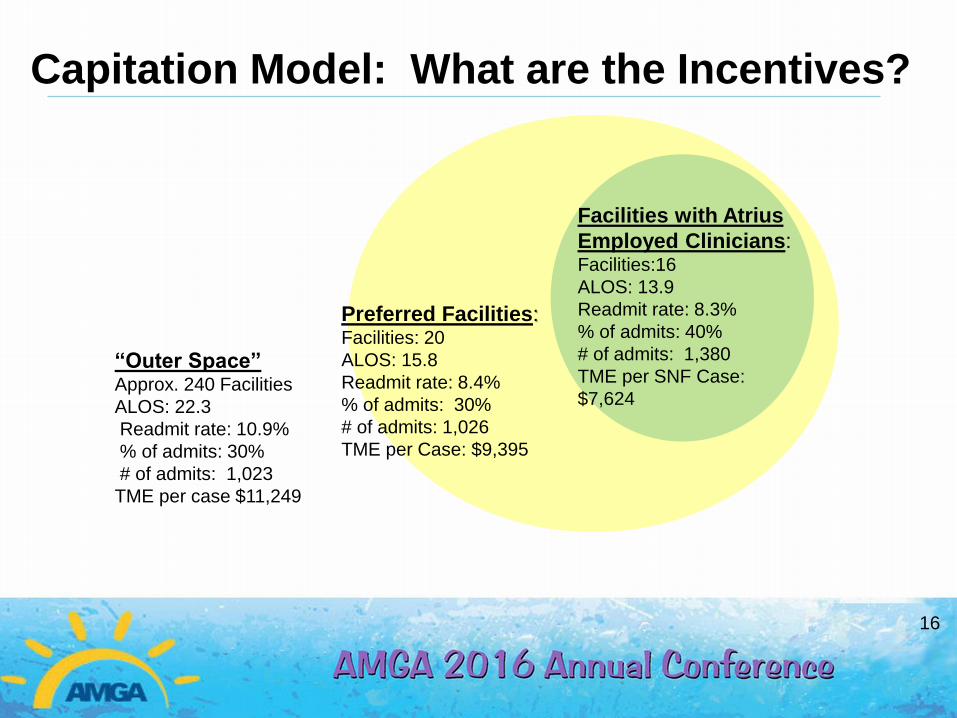
Capitation Model: What are the Incentives?
Facilities with Atrius
Employed Clinicians: Facilities:16
ALOS: 13.9
Readmit rate: 8.3%
% of admits: 40%
# of admits: 1,380
TME per SNF Case:
$7,624
Preferred Facilities: Facilities: 20
ALOS: 15.8
Readmit rate: 8.4%
% of admits: 30%
# of admits: 1,026
TME per Case: $9,395
“Outer Space” Approx. 240 Facilities
ALOS: 22.3
Readmit rate: 10.9%
% of admits: 30%
# of admits: 1,023
TME per case $11,249
16
0%
10%
20%
30%
40%
50%
60%
70%
80%
90%
100%
Em
ers
on(n
=3
10)
BW
H-F
H(n
=28
4)
SS
H(n
=57
4)
BID
H M
ilton
(n=
147)
Quin
cy(n
=19
1)
Beverly(n
=412
)
NE
BH
(n=
579)
No
rwo
od(n
=1
52)
BW
H(n
=3
15)
Win
ch
este
r(n=
144
)
La
hey(n
=224
)
BID
MC
(n=
659)
No
rth
Shore
(n=
16
8)
Lo
well(
n=
38
5)
Tuft
s(n
=34
)
MG
H(n
=1
90)
BID
H N
eedh
am
(n=
80)
MA
H(n
=35
6)
Ste
wa
rd C
arn
ey(n
=2
2)
BM
C(n
=20
)
Ne
wto
n-W
elle
sle
y(n
=156
)
Ste
wa
rd S
t E
lizab
eth
(n=
38)
Ste
wa
rd G
ood
Sa
m(n
=25
)
Ca
mbri
dge
(n=
31)
La
wre
nce/H
allm
ark
(n=
98
)
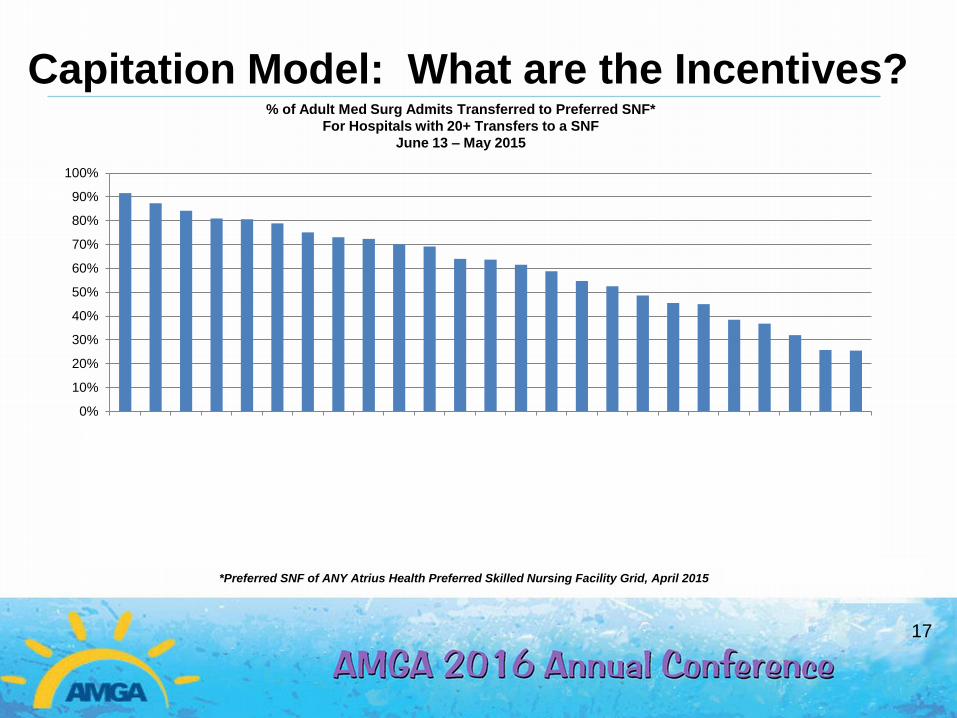
*Preferred SNF of ANY Atrius Health Preferred Skilled Nursing Facility Grid, April 2015
Capitation Model: What are the Incentives? % of Adult Med Surg Admits Transferred to Preferred SNF*
For Hospitals with 20+ Transfers to a SNF
June 13 – May 2015
17
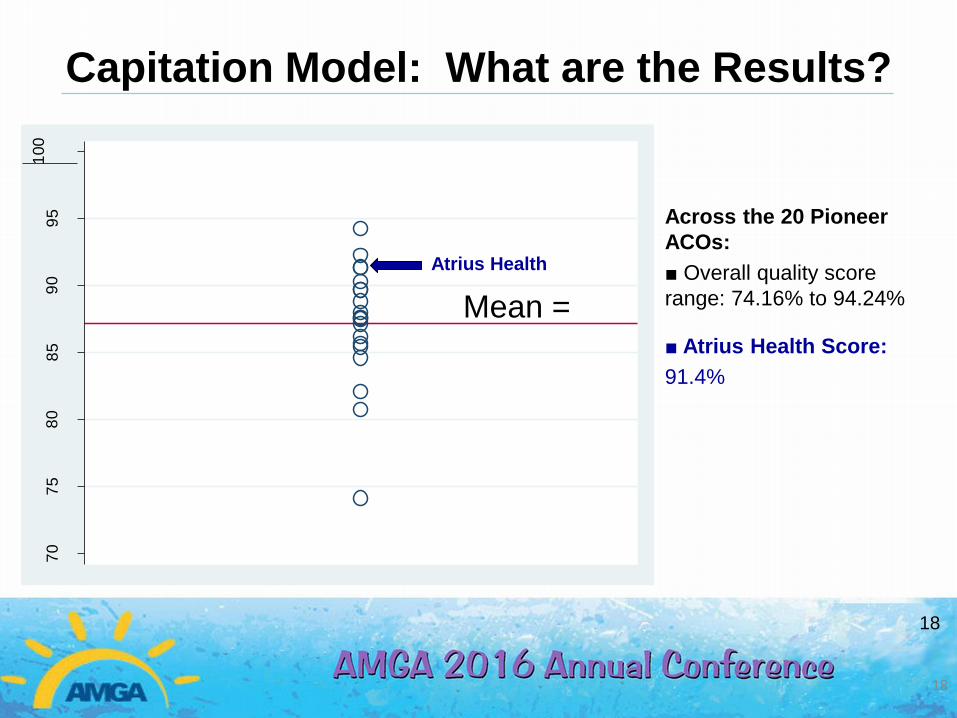
Capitation Model: What are the Results?
18
18
Across the 20 Pioneer
ACOs:
■ Overall quality score
range: 74.16% to 94.24%
■ Atrius Health Score:
91.4%
70
75
80
85
90
95
100
Overa
ll Q
ua
lity S
core
(%
)
Mean =
Atrius Health
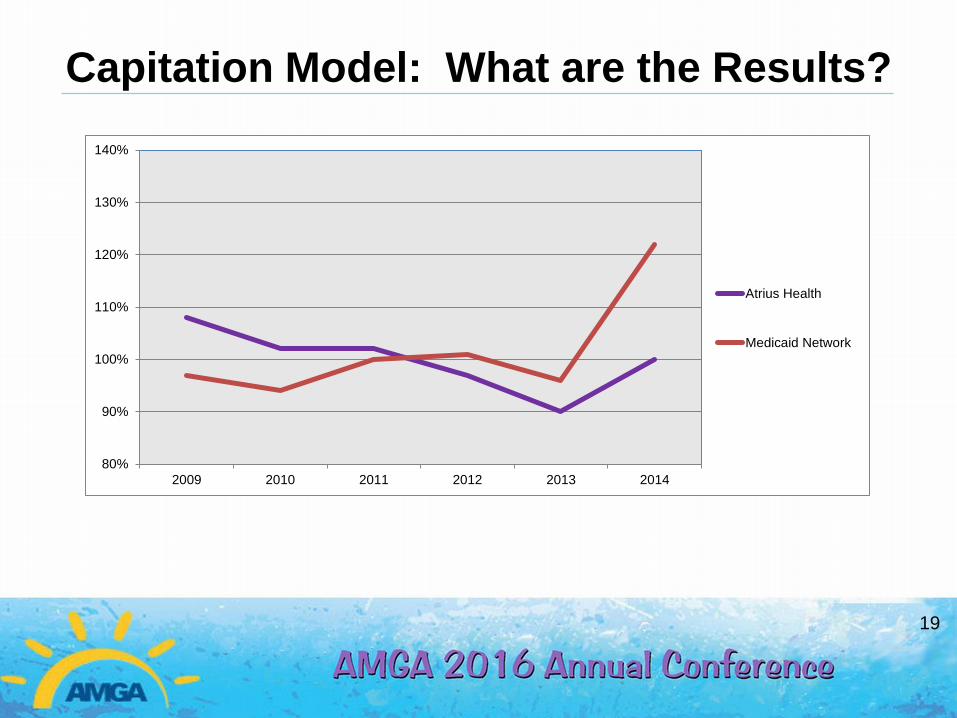
Capitation Model: What are the Results?
19
80%
90%
100%
110%
120%
130%
140%
2009 2010 2011 2012 2013 2014
Atrius Health
Medicaid Network

Our Challenge is to Move
Volume-based
reimbursement
Value-based
reimbursement
From To
Total
Medical
Expense
Price
focus
20
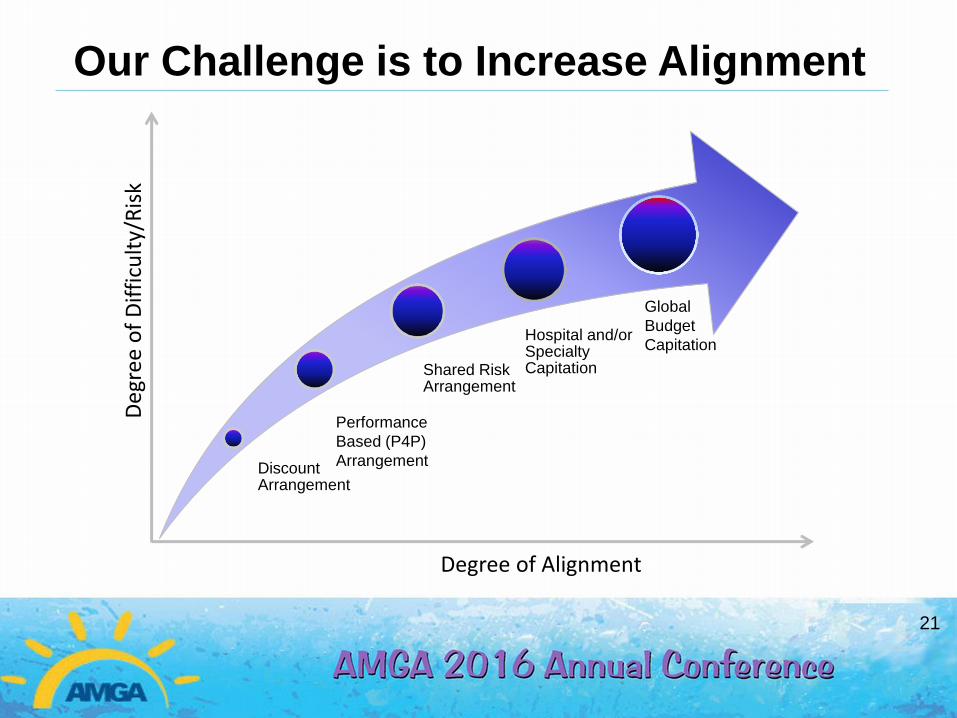
Our Challenge is to Increase Alignment
Degree of Alignment
Discount Arrangement
Shared Risk Arrangement
Hospital and/or Specialty Capitation
Deg
ree
of
Dif
ficu
lty/
Ris
k
Global
Budget
Capitation
Performance
Based (P4P)
Arrangement
21
Our Challenge is to increase alignment
“Physician compensation is expected to increasingly incorporate factors such as quality, outcomes & patient satisfaction. Incentive pay makes up 3% to 5% of the total compensation of employed physicians
But is expected to be between 7% and 10% in the next few years, according to a survey of 424 health care executives”
Jan. 10, 2012, by Sullivan, Cotter and Associates.
22

MDs have been shielded from direct financial
exposure from Alternative Payment Models
23
Bring back the Joy to the Practice of Medicine!
“American doctors are suffering from a
collective malaise.
We strove, made sacrifices—and for
what?
For many of us, the job has become only
that—a job.”
Sandeep Jauhar WSJ.com, Aug. 29, 2014
24
25