capitals · 2015 medium term note (mtn) programme annual update by around one month to early april...
TRANSCRIPT

What are the “Capitals” that sustain our business?
CAPITALS

e have selected some resources and relationships - collectively known as capitals
- that are critical to CLP, and explain how careful management of these capitals
contribute to the sustainability of our business

Financial Market UpdateOn 19 December 2015, the US Federal Reserve (Fed)
announced the increase of Fed Funds rate from close to
zero to a range of 0.25%-0.5%. This first credit tightening
since 2006 officially ended the debate about prolongation
of its accommodative monetary policy and signified a vote of
confidence by the Fed to the strength of the US economy.
In contrast, the European Central Bank and the Bank of Japan
further supplemented their quantitative easing programmes
in December 2015 with new flurries of measures to arrest the
lingering weak economies and combat deflationary pressures.
This has highlighted the divergence of central bank monetary
policies that, if not managed properly, can lead to significantly
higher market volatility and uncertainty when confidence is
already fragile.
Looking back in 2015, global financial markets have been
jolted by several major shocks. Firstly, in the first quarter of the
year, anxiety regarding the Fed tightening too early saw the
US 10-year treasury yield fluctuate. Secondly, the default of
Greece on a US$1.7 billion International Monetary Fund loan
repayment in June unsettled the Eurozone and caused grave
apprehension of another financial crisis. Thirdly, the massive
sell-off of China’s A-share index from June to August, triggered
by weaker-than-expected economic data and government
policy to dampen excessive speculative positions, sent shock
waves through global equity markets. Fourthly, the move by
China to adopt a new foreign exchange regime and devaluate
the Renminbi (RMB) in August took the markets by surprise.
The above market challenges, combined with a steady
decline of liquidity in the financial markets and re-emerging
geopolitical concerns, have reminded CLP to stay vigilant.
CLP’s Proven, Meticulous Financing and Investment DisciplinesOver the years, this “Financial Capital” section has highlighted
the importance of acquiring sustainable, diversified, cost-
effective, long-tenured debt and equity funding on a timely
basis to support business growth as our investments are capital
intensive and involve long payback periods. It is also critical
to identify the financial market challenges to CLP so that we
can manage the composite risk elements (including funding,
foreign currency, interest rate, credit rating, counterparty) and
meet corporate and compliance objectives. In addition, our
prudent financial planning and innovative approach enables
us to mitigate adversities, protect customers’ interest, enhance
shareholder value and avoid potential impediments to business
sustainability.
In November 2013, credit rating agencies put CLP Holdings and
CLP Power Hong Kong under negative credit watch following
the announcement of the CAPCO and PSDC acquisitions.
Some of the Group’s financial ratios remained tight, amidst
EnergyAustralia’s operational challenges in a depressed
electricity market. In order to resolve the negative rating watch
for CLP Holdings and its subsidiaries and deliver a more robust
financial profile, we undertook proactive and multi-levered
initiatives to reduce our gearing and lower our finance costs.
Some of the measures are listed below and more details can be
found on pages 79 and 83:
• CLP’s major entities prepaid about HK$13 billion of debt to
save financing costs and lower the debt leverage ratio of
the Group.
• CLP Power Hong Kong advanced the completion of its
2015 Medium Term Note (MTN) programme annual update
by around one month to early April for issuing a US$300
million bond in order to forerun potential interest rate
hikes, and capture a better market window to arrange
cost-effective debt. Soon after the bond placement, both
the US 10-year treasury yield and credit margin of public
bonds climbed considerably with renewed concerns over
the future interest rate path.
• CLP Power Hong Kong continued to diversify its funding
sources and tapped into the Japanese onshore market in
September 2015 for a US$125 million (HK$969 million)
cross-border bank loan.
• CLP India kicked off its fund-raising in the domestic bond
market with two inaugural issuances. We issued a series
of green bonds totalling Rs.6 billion (HK$706 million) in
September 2015 to fund our renewable projects, making CLP
the first company in the power sector of South and Southeast
Asia to issue green bonds. Earlier in April 2015, Jhajjar Power
Limited also issued asset-specific corporate bonds of Rs.4.76
billion (HK$591 million) to replace higher cost bank loans and
extend duration.
76 CLP Holdings 2015 Annual Report

Major funding sources and usages of the Group are summarised below:
• In July 2015, EnergyAustralia refinanced A$1.8 billion
(HK$10.7 billion) of syndicated bank facilities.
• EnergyAustralia also completed the divestment of Iona Gas
Plant. This enabled EnergyAustralia to take major steps of
reducing debt gearing. In addition to the early repayment of
external debt, EnergyAustralia repaid part of the shareholder’s
loan extended by CLP Holdings in February 2016.
• CLP China arranged RMB3.56 billion (HK$4.45 billion)
project loans for the development of Fangchenggang II
in March 2015 with favourable lending rate amidst tighter
liquidity in the first half of 2015. We reported last year
that CLP would diversify into the more liquid, cost-effective
offshore RMB bank loan market in Hong Kong (CNH) to
fund construction and early operation of our renewable
energy projects. We would also seek onshore RMB project
level refinancing after the start of commercial operation to
better match the asset and liability profile. In September
2015, we successfully refinanced the operating Xicun I
Solar project with a non-recourse, long-term project loan
of RMB302 million (HK$360 million) by a domestic bank.
This strategy enables CLP to develop and construct wholly-
owned renewable projects in Mainland China with shorter
timeline and better financing terms.
As a result of these actions, CLP Holdings saw meaningful
improvements in the debt gearing and interest coverage ratios
in 2015 (Net Debt to Total Capital as at 31 December 2015:
32.4% versus 31 December 2014: 38.0%, EBIT (Earnings
Before Interest and Taxes) interest cover (2015: 10 times
versus 2014: 6 times) and FFO (Fund From Operations) interest
cover (2015: 9 times versus 2014: 9 times)). In addition, credit
ratings outlooks for CLP Holdings, CLP Power Hong Kong
and EnergyAustralia returned to their full strength (See Credit
Ratings section on page 83 for more information).
In November 2015, the Vinh Tan III power project in Vietnam
that CLP co-owns and takes a leading role in developing and
financing achieved an important milestone when the project
company, Vinh Tan 3 Energy Joint Stock Company (VTEC),
signed a Financing Memorandum of Understanding (MoU)
with China Development Bank Corporation, Beijing (CDB) in
Hanoi, Vietnam. In the MoU, VTEC and CDB agreed to carry
out investment and financing endeavours in cooperation with
each other for Vinh Tan III. VTEC aims to finalise contractual
arrangements with the Vietnamese Government and structure
project financing in the next stage.
Funding Sources and Usages
Shareholder Value Creation
On-going capital investments will lead to higher returns
in subsequent years
• Scheme of Control: HK$7,328 million
• Growth: HK$2,795 million
• Maintenance: HK$748 million
• Joint ventures and intangible assets: HK$1,096 million
Dividends
Continual growth in dividends in past years
2015: HK$6,822 million
2014: HK$6,619 million
Healthy Capital Structure
Good operational performance will generate strong
cash flows, dividends and retained earnings ensuring a
sustainable capital structure
• Reduction of net debt balance by HK$11,358 million
• Net debt to total capital ratio decreased by 5.6%
• Shareholders’ funds (including retained earnings)
increased by HK$5,105 million
Operational Performance
Quality operations deliver good revenues to pay
for expenditures, debt services and dividends
Free cash flow: HK$17,290 million
Capital Recycling to Realise Economic Benefit and Support Future Growth
Divestment of non-core, limited growth assets
will generate profit and cash flows for new
investments
Iona Gas Plant sale proceeds: HK$9,991 million
Debt and Equity
Provide new funding for natural growth, merger
and acquisitions, and operations
77CLP Holdings 2015 Annual Report

Financial Capital
A Vigilant, Evolving and Pragmatic Financing ApproachOur financial management is dedicated to maintaining good
investment grade credit ratings that help preserve a healthy
capital structure to meet CLP’s business objectives and employ
sound risk management policies to weather through cycles in
the financial markets. Such approach provides CLP the ability to
access global financial markets in a cost-effective and timely way,
even in highly volatile periods during financial crises. As at 31
December 2015, the Group maintained business relationships
with 74 financial institutions. This number had significantly
increased over the last decade from about 40 financial
institutions in 2005, demonstrating our continued efforts in
developing and broadening our business relationship base. Apart
from conventional bank loans, CLP Power Hong Kong has the
ability to tap into the global debt capital markets denominated in
multi-currencies under their MTN programmes of up to US$4.5
billion. This enables us to diversify funding sources and achieve
long-tenured asset and liability matching. As at 31 December
2015, CLP Power Hong Kong has outstanding 41 tranches
of bonds (denominated in US dollars, HK dollars, Japanese
yen and Australian dollars) issued under its MTN Programme
comprising a notional value of approximately HK$27 billion
whilst EnergyAustralia has one tranche of US dollar bond (US$30
million) issued in the US private placement market.
The Essence of CLP’s Financial Framework
VALUE CREATION
STRATEGIC OBJECTIVES
DESIRABLE OUTCOMES
Optimised Debt Profile Creates Value for Stakeholders
(Shareholders, Customers, Business Counterparties)
Well-diversified, Cost-efficient, Sustainable Debt Funding with Strong Financial Structure
Good Relationship and
Strong Access to Markets
Effective and Proven
Risk Mitigations
Strong Business and
Financial Profile
CONCRETE ACTIONS
Longstanding, Mutually Beneficial Relationships
• Respectful business practices
• Open and transparent communications with stakeholders
• Long-term, sustainable relationship with lenders and investors
• Development of new business relationship with potential parties
Market Knowledge and Professionalism
• Stay abreast of global financial markets and developments
• Useful insights from financial and business counterparties
• High level of integrity and commitment
Prudent, Well-proven Risk Management Principles
• Timely identification of risk elements
• Cost-effective hedging instruments
• Ongoing policy review and market monitoring to protect against compounding risk exposures
Funding Diversity
• Avoid concentration risk by spreading out sources, tenor, markets, currencies and instruments
• Well-diversified debt profile minimises (re)financing risk
High Quality Grade Credit Ratings
• Healthy capital structure
• Robust financial metrics and flexibility
Strong Foundation
• Disciplined investment and financial strategies
• 115 years of experience
• Good corporate governance
• Ample liquidity and solid operating cash flow to cover business requirement and guard against adversities
78 CLP Holdings 2015 Annual Report
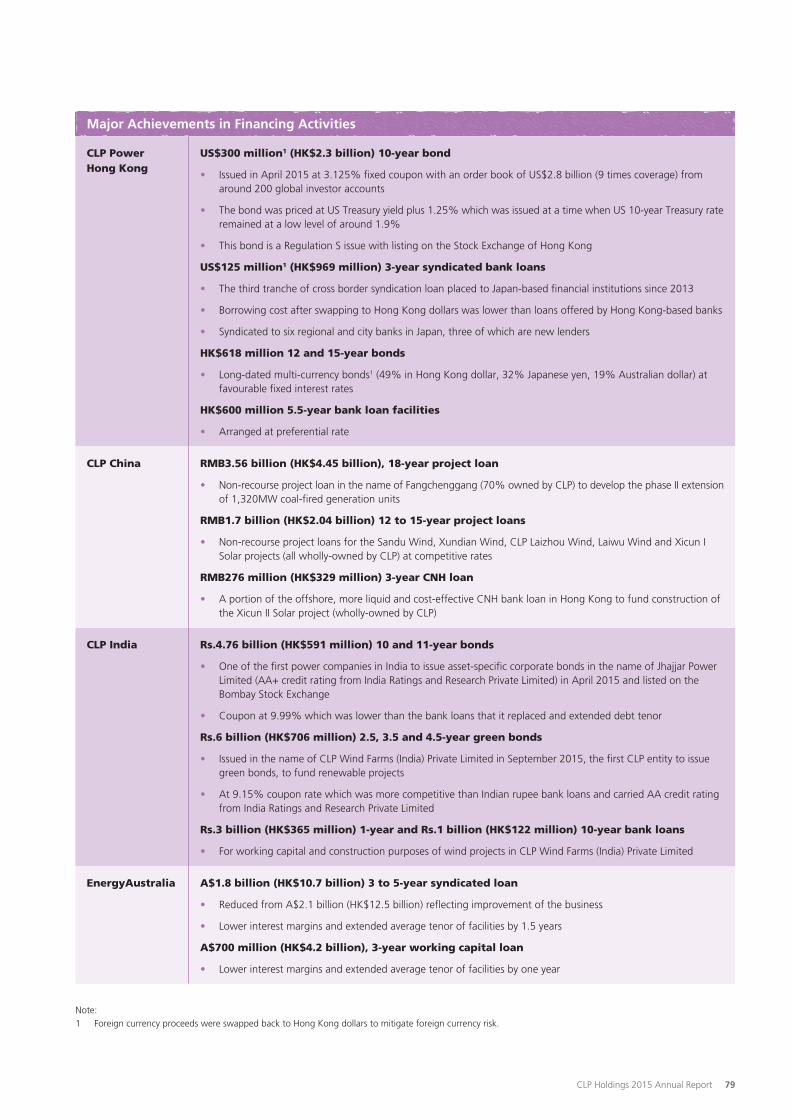
Major Achievements in Financing Activities
CLP PowerHong Kong
US$300 million1 (HK$2.3 billion) 10-year bond
• Issued in April 2015 at 3.125% fixed coupon with an order book of US$2.8 billion (9 times coverage) from around 200 global investor accounts
• The bond was priced at US Treasury yield plus 1.25% which was issued at a time when US 10-year Treasury rate remained at a low level of around 1.9%
• This bond is a Regulation S issue with listing on the Stock Exchange of Hong Kong
US$125 million1 (HK$969 million) 3-year syndicated bank loans
• The third tranche of cross border syndication loan placed to Japan-based financial institutions since 2013
• Borrowing cost after swapping to Hong Kong dollars was lower than loans offered by Hong Kong-based banks
• Syndicated to six regional and city banks in Japan, three of which are new lenders
HK$618 million 12 and 15-year bonds
• Long-dated multi-currency bonds1 (49% in Hong Kong dollar, 32% Japanese yen, 19% Australian dollar) at favourable fixed interest rates
HK$600 million 5.5-year bank loan facilities
• Arranged at preferential rate
CLP China RMB3.56 billion (HK$4.45 billion), 18-year project loan
• Non-recourse project loan in the name of Fangchenggang (70% owned by CLP) to develop the phase II extension of 1,320MW coal-fired generation units
RMB1.7 billion (HK$2.04 billion) 12 to 15-year project loans
• Non-recourse project loans for the Sandu Wind, Xundian Wind, CLP Laizhou Wind, Laiwu Wind and Xicun I Solar projects (all wholly-owned by CLP) at competitive rates
RMB276 million (HK$329 million) 3-year CNH loan
• A portion of the offshore, more liquid and cost-effective CNH bank loan in Hong Kong to fund construction of the Xicun II Solar project (wholly-owned by CLP)
CLP India Rs.4.76 billion (HK$591 million) 10 and 11-year bonds
• One of the first power companies in India to issue asset-specific corporate bonds in the name of Jhajjar Power Limited (AA+ credit rating from India Ratings and Research Private Limited) in April 2015 and listed on the Bombay Stock Exchange
• Coupon at 9.99% which was lower than the bank loans that it replaced and extended debt tenor
Rs.6 billion (HK$706 million) 2.5, 3.5 and 4.5-year green bonds
• Issued in the name of CLP Wind Farms (India) Private Limited in September 2015, the first CLP entity to issue green bonds, to fund renewable projects
• At 9.15% coupon rate which was more competitive than Indian rupee bank loans and carried AA credit rating from India Ratings and Research Private Limited
Rs.3 billion (HK$365 million) 1-year and Rs.1 billion (HK$122 million) 10-year bank loans
• For working capital and construction purposes of wind projects in CLP Wind Farms (India) Private Limited
EnergyAustralia A$1.8 billion (HK$10.7 billion) 3 to 5-year syndicated loan
• Reduced from A$2.1 billion (HK$12.5 billion) reflecting improvement of the business
• Lower interest margins and extended average tenor of facilities by 1.5 years
A$700 million (HK$4.2 billion), 3-year working capital loan
• Lower interest margins and extended average tenor of facilities by one year
Note:1 Foreign currency proceeds were swapped back to Hong Kong dollars to mitigate foreign currency risk.
79CLP Holdings 2015 Annual Report

Financial Capital
A Disciplined Follower of Effective Risk ManagementThe power industry is characterised by high investment costs,
capital intensity and long payback periods with compounding
risk factors. The ability to arrange timely, cost-effective,
diversified, multiple-tenured and sustainable funding in equity
and debt markets is crucial in managing and growing our
business. Our shareholders and business partners value our
commitment to prudent and vigilant financial management.
We are dedicated to preserve a healthy capital structure, retain
good investment grade credit ratings, maintain sound business
relationships with lenders and investors whilst developing new
ones, and reserve financial strength and flexibility to withstand
unforeseen contingencies driven by financial market volatilities.
Our substantial and expanding businesses portfolio exposes
CLP to multiple risks of liquidity, (re)financing, foreign
exchange, interest rate, counterparty and compliance. CLP
Group requires all business units to clearly identify, diligently
monitor and effectively manage their financial related
exposures, both in policy formulation and implementation.
Our financial risk mitigation approaches and results are
highlighted below:
Liquidity The risk of not being able to fulfil payment obligation
Mitigation Result
CLP is risk adverse. We believe it is imperative to maintain sufficient liquidity by:
• keeping adequate committed credit facilities / cash balances at cost effective terms
• preserving strong financial flexibility to support potential strategic moves and meet contingencies
As at end 2015, CLP Group is highly liquid with HK$33.5 billion of undrawn bank facilities and internal resources.
Note: Liquidity equals to the undrawn bank facilities plus bank balances, cash and other liquid funds.
Dec 15Dec 14Dec 13Dec 12Dec 1120,000
30,000
40,000
50,000
HK$M
Liquidity
Debt profile as at 31 December 2015
CLP Holdings HK$M
CLP PowerHong Kong
HK$MCAPCOHK$M
Other Subsidiaries
HK$MCLP Group
HK$M
Available Facility1 9,400 39,202 7,165 29,401 85,168
Loan Balance 306 35,002 5,974 14,201 55,483
Undrawn Facility 9,094 4,200 1,191 15,200 29,685
Note:1 For the MTN Programmes, only the amounts of the bonds issued as at 31 December 2015 were included in the total
amount of Available Facility. The Available Facility in EnergyAustralia excludes a facility set aside for guarantees.
80 CLP Holdings 2015 Annual Report

Refinancing The risk that refinancing may become difficult or costly thus impairing the ability to fulfil payment obligations
Mitigation Result
CLP seeks longlasting, trustworthy relationships with bond investors, lending banks and financial derivative counterparties. We act promptly to secure diversity (tenor, currency, instrument, market, geographical region) and cost-effectiveness.
As at end 2015, CLP achieved a very well-balanced debt portfolio with well spread-out key attributes:
• long-term business partnership with 74 financial institutions (2014: 77) minimising concentration risk
• evenly distributed loan maturities in multiple tenors (beyond 5 years: 43%, 2-5 years: 22%, 1-2 years: 11%, within 1 year: 24%)
• type of debt (medium term notes / private placement / bonds: 48%, term loans: 42%, money market line: 10%)
• bond denominations in USD (49%), HKD (35%), JPY (8%), INR (5%), AUD (3%)
0
10,000
20,000
30,000
40,000
50,000
60,000
70,000
80,000
0
10,000
20,000
30,000
40,000
50,000
60,000
70,000
80,000
HK$M
Export Credit
Money Market Line
HK$M
Notes: 1 The 2014 and 2015 figures include CAPCO and PSDC as subsidiaries of the Group after the acquisitions. For comparative purpose, we have included CLP Group, CAPCO and PSDC in the 2011, 2012 and 2013 figures.2 Loan balance between two and five years as at 31 December 2015 included loan drawdown with current tenor less than one year under revolving facility with maturity falling beyond one year.
Medium Term Notes / Private Placement / Bonds Within 1 year 1 – 2 years 2 – 5 years 2 Beyond 5 years
Term Loans
15141312111514131211
Loan Balance – Type1 Loan Balance – Maturity1
3%
4%
96%
8%
45%
44%
3%
100%100%
9%
51%
37%
EnergyAustraliaCLP PowerHong Kong
EnergyAustraliaCLP PowerHong Kong
CLP India 10
10,000
5,000
15,000
20,000
25,000
30,000
Dec 2014 Dec 2015
USDAUD HKD INRJPY
HK$M
Note: 1 Jhajjar Power Limited arranged its inaugural issuance of Rs.4.76 billion
(HK$591 million), 10 and 11-year asset-specific corporate bonds in April 2015. CLP Wind Farms (India) Private Limited also arranged its inaugural issuance of Rs.6 billion (HK$706 million), 2.5, 3.5 and 4.5 years green bonds in September 2015.
Currency of Bond Funding
0
10
20
30
40
50
60
70
80
18%
12%
5%
13%
36%
12%4%
14%
12%5%
12%
42%
11%4%
Dec 2014 Dec 2015
Number of Banks
Australian based
Mainland China based
UK and European based
Indian based
Japanese based
US based
Others
Note: Geographical bases of the financial institutions are determined according to the places of incorporation of their respective holding entities.
CLP Banking Relationship – Balanced Mix of Lending Financial Institutions
Interest RateThe risk of adverse impact on profit or loss or cash flow as a result of interest rate fluctuation
Mitigation Result
CLP proactively manages interest rate risk through a carefully calibrated use of fixed rate debt and interest rate swaps.
CLP Power Hong Kong arranged an aggregate HK$24.7 billion long-tenured fixed rate bond since the global financial crisis in 2007 to lock in favourable interest rates in low interest rate environment. As at 31 December 2015, the Group has borrowings in fixed rate of 57% (without perpetual capital securities) or 61% (with perpetual capital securities).
81CLP Holdings 2015 Annual Report

Financial Capital
Foreign ExchangeThe risk of adverse impact on profit or loss, cash flow or balance sheet as a result of foreign exchange volatility
Mitigation Result
TranslationalThis relates to the foreign currency element of our equity investment for the business outside Hong Kong but carries no profit or loss nor cash flow effect. CLP does not hedge such risk as per its policy (unrealised in nature, long-term investment, geographically diversified).
TransactionalThis arises from mismatch of revenues generated in host country currencies of the respective business units whilst debt or invoice payments are paid in other currencies. CLP hedges a high portion of committed and highly probable transactional foreign currency risk to deliver a more certain economic outcome.
Our initiative to hedge a high level of foreign exchange exposure on behalf of customers is but one example of this, allowing all parties to avoid undue tariff volatility. CLP’s tariffs in Hong Kong and overseas remain fairly stable despite much increased foreign currency volatility during regional and global financial crisis.
CounterpartiesThe risk of adverse impact on profit or loss or cash flow due to default of business parties
Mitigation Result
CLP transacts only with trustworthy, capable parties. Our business units have a list of authorised financial institutions that are financially sound and competent in executing financing and risk management transactions and will persistently perform their obligations over a long period of time.
CLP has not faced any loss from default or potential default by its financial counterparties over the past decade.
ComplianceThe risk of adverse impact as a result of failure to meet regulatory requirements
Mitigation Result
CLP has a high level of corporate governance and always strives to maintain full compliance of all rules and regulations for financial and risk management. This requires a high level of professional integrity and strong commitment. CLP is implementing a new Group Treasury Management System to further enhance the efficiency and effectiveness of treasury management, compliance and report.
CLP achieves satisfactory audit outcomes by internal and external auditors, and meets all regulatory and internal compliance requirements with high standard of corporate control and governance procedures.
We take pride in the track record of our team for diversified and innovative financing. Last year, we set a milestone by issuing our first green bond in Indian rupees through our wholly-owned subsidiary CLP Wind Farms (India) Private Limited to fund the development of renewable projects in India. In China, we make use of a mix of short-term funds from the offshore Renminbi market to fund construction, supplemented by long-term project financing from Chinese financial institutions once the project operates. Looking forward, we plan to issue Renminbi-denominated green bonds in China, or known as “green panda bonds”, as a means to fund our renewable projects in the country like what we did in India.
CLP has an ambitious growth plan in the field of non-carbon emitting generation. How does CLP plan to finance its new investments?
Mr Lodewijk MeensManaging Director, International Corporates, Corporate and Institutional Banking Standard Chartered Bank (Hong Kong) Limited
Geert PeetersExecutive Director & Chief Financial Officer
More Q&As
82 CLP Holdings 2015 Annual Report

Credit RatingsCLP is committed to maintaining high quality grade credit ratings.
Our effort to further enhance the capital structure of the Group
by issuing US$750 million (HK$5.8 billion) perpetual capital
securities in 2014 and deliver a more robust financial profile by
further reducing debt gearing and lowering debt funding costs
in 2015 paid off. The credit rating agencies revised the outlooks
of CLP Holdings (by S&P and Moody’s) and CLP Power Hong
Kong (by S&P) from negative to stable after the annual credit
rating review in May 2015. In parallel, both S&P and Moody’s
affirmed the credit ratings of CLP Holdings and CLP Power Hong
Kong at A- / A2 and A / A1 respectively. In May 2015, S&P revised
EnergyAustralia’s rating outlook to stable from negative and
affirmed its BBB- credit rating. These rating actions demonstrated
that the two credit rating agencies recognised CLP exercised a
high level of discipline in managing its investments and financials.
CLP Holdings CLP Power Hong Kong EnergyAustralia
S&P Moody’s S&P Moody’s S&P
Long-term Rating
Foreign currency A- A2 A A1 BBB-
Outlook Stable Stable Stable Stable Stable
Local currency A- A2 A A1 BBB-
Outlook Stable Stable Stable Stable Stable
Short-term Rating
Foreign currency A-2 P-1 A-1 P-1 –
Local currency A-2 P-1 A-1 P-1 –
More information about the credit ratings of our major companies is shown on our website.
S&P
Positives Negatives
• The Group has good financial flexibility and strong access to
banking facilities
• CLP Holdings’ focus on organic growth should lead to the steady
improvement of credit metrics
• CLP Power Hong Kong has excellent business risk profile and
provides sound and stable cash flows
• EnergyAustralia’s new retail billing system and expected lower
operating cost should bring stable earnings
• CLP India’s Jhajjar power plant has improving coal supply and
higher utilisation
• Strengths of Hong Kong’s favourable regulatory conditions are
tampered by the future regulation-reset risk and clean energy
policy
• EnergyAustralia is facing moderately high industry risk
Moody’s
Positives Negatives
• CLP Holdings’ credit profile, though constrained in 2015, will
strengthen in the next two to three years
• Gradual decline in financial leverage of the Group
• Predictable cash flows from Hong Kong operations
• EnergyAustralia’s operations have higher visibility and more
steady performance
• Increasing earnings from operations in Mainland China and
India
• Expansion into riskier, non-regulated electricity and retail
businesses has raised CLP Holdings’ overall business risk
• EnergyAustralia’s performance has remained weak since 2012
due to challenging operating environment but modest growth
in revenue is expected
83CLP Holdings 2015 Annual Report
Care for the environment is one of the four “key values” of our
Value Framework that guides us in fulfilling our mission and
turning our vision into reality. The Framework mandates us
to responsibly manage the short-term and long-term impacts
of our business on the environment. Since our business
covers the entire energy supply chain, the suite of potential
environmental issues that we need to manage depends on the
type of generation, site specific conditions and the nature of
the business.
Environmental Management ApproachOur Group Environmental Policy Statement, which is
included in the CLP Value Framework and available on our
website, sets out the principles that our business units must
follow. The topics covered by the combination of our Group
Environmental Policy Statement, standards and guidelines
include: compliance; use of resources such as materials, energy
and water; impacts such as emissions, effluents and waste; and
biodiversity. Through this Policy Statement, we commit to:
• Comply fully with all applicable environmental laws and
regulations;
• Ensure that all key environmental impacts are identified and
managed in a responsible manner;
• Use all resources, including fuel, water and other natural
resources efficiently and conservatively, and increase the
use of renewable resources;
• Continuously improve our environmental performance;
• Monitor and report the environmental performance of our
business;
• Provide the training and resources necessary to meet our
environmental responsibilities;
• Share our knowledge of environmental issues and
management practices with others in our industry and our
communities; and
• Support the development of effective government policy to
address environmental issues.
To support the delivery of the principles laid out in the
Group Environmental Policy Statement, our operationally
controlled assets are required to develop their own site
specific Environmental Policy Statement, using the Group
Environmental Policy Statement as a framework. Furthermore,
we have developed and implemented internal environmental
standards and guidelines to cover a range of material
environmental issues.
In respect to regulations and compliance, CLP has two primary
components to its management of environmental impacts and
resource use. The first is to ensure full regulatory compliance
in the diverse set of regulatory jurisdictions in which we
operate. The second is to both monitor evolving environmental
regulations which apply to our operations and respond to
anticipated regulatory developments as necessary – whether by
making specific investments at an asset level or adjusting our
core business strategy.
Internal Environmental StandardsCLP’s commitment to environmental protection goes beyond
basic regulatory compliance. CLP takes the view that, as a
leader, we should require our operations, in particular those in
locations where environmental regulatory controls are weaker,
to perform beyond compliance and our internal environmental
standards reflect that. For example, all power generation
facilities in which we have operational control must establish
effective environmental management systems which conform
to the globally recognised ISO14001 Standard and achieve
third-party certification within 2 years from commencement
of operation or acquisition. All our assets in this category
obtained the required certification on time in 2015. More
details are available in our 2015 Sustainability Report. Another
example is that for air emissions, fossil-fuel based power
stations developed after the effective date of our Power Plant
Air Emissions Standard are required to operate within CLP
prescribed limits on SO2, NOx and particulates emissions, or to
comply with local regulations, whichever is more stringent.
On the business development side, we also assess our potential
environmental liability carefully before we commit to projects.
CLP’s Pre-Investment Environmental Risk Assessment process
ensures that sufficient environmental considerations are
given to every project as part of the approval process by the
Investment Committee.
84 CLP Holdings 2015 Annual Report

85CLP Holdings 2015 Annual Report
Performance on Group Environmental GoalsThis year, we continue to report on our performance on the three aspirational environmental goals under CLP Group’s
Sustainability Framework to move towards:
• zero emissions; • a more sustainable rate of resource use, and • no net loss of biodiversity.
Our performance in these areas is summarised below:
Group Goal Aspect Group Highlights 2015 2014
Move towards zero
emissions
Greenhouse gases • Total CO2 emissions (from power
generation)
• Carbon intensity (on equity basis)
46,553kT
0.81kg
CO2 / kWh
53,044kT
0.84kg
CO2 / kWh
Air pollutants • Total SO2 emissions
• Total NOx emissions
• Total particulate matter emissions
63.4kT
56.3kT
9.8kT
93.0kT
74.6kT
11.5kT
Water discharged • Total water discharged 4,463.0 Mm3 4,792.2 Mm3
Waste • Total solid waste produced
• Total liquid waste produced
12,096T
3,031kl
21,626T
2,861kl
Move towards a more
sustainable rate of
resource use
Fuel • Total coal consumed
• Total gas consumed
• Total oil consumed
• Non-carbon % (on equity basis)
• Renewable energy % (on equity
basis)
450,937TJ
95,591TJ
2,892TJ
19.5%
16.8%
541,865TJ
63,268TJ
2,345TJ
16.7%
14.1%
Water • Total water withdrawal 4,503.0 Mm3 4,834.0 Mm3
Move towards no net
loss of biodiversity
Air / Terrestrial • Group guidelines Implemented Endorsed by
Group HSSE
Committee
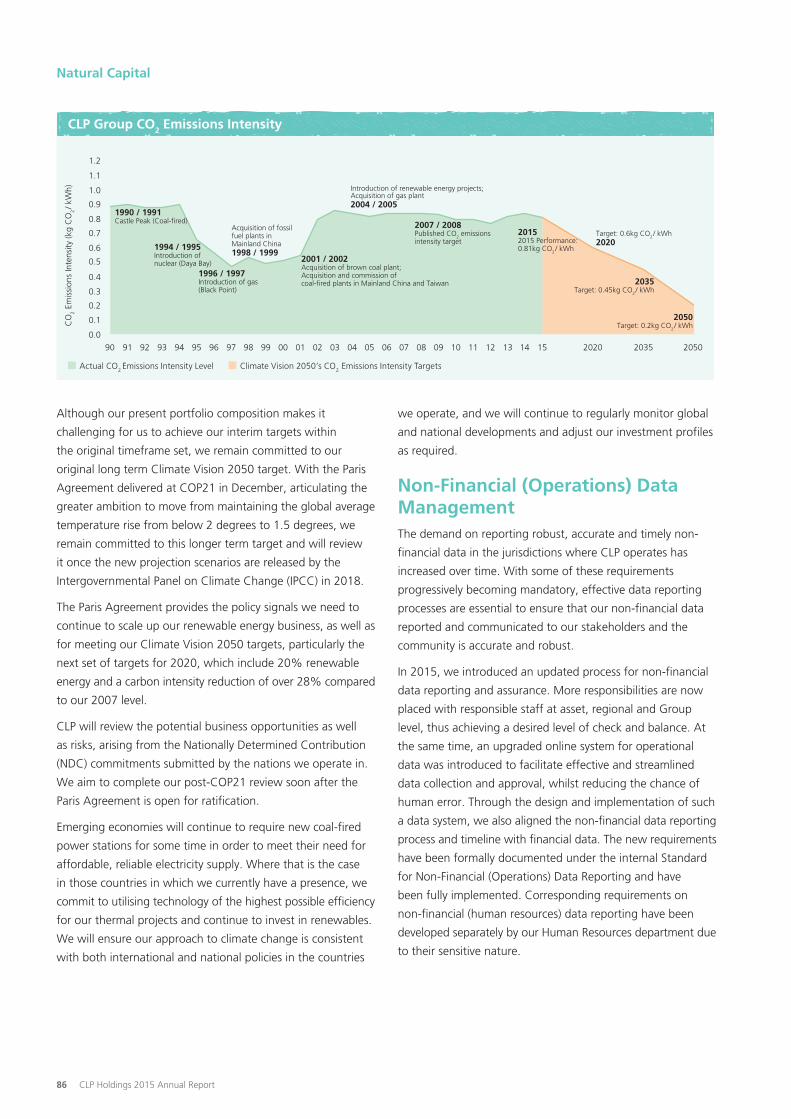
Climate Vision 2050In 2007, we developed our Climate Vision 2050, which
was centred around an ambitious science-based target of
reducing the carbon intensity of our generating portfolio by
approximately 75% by 2050, compared to our 2007 level. We
also developed milestone reduction targets in between, taking
into account assumptions on technological advancements and
regulatory change.
Our performance up to 2012 was quite encouraging, however
local priorities in Asia on energy security and access, favoured
the continued development of fossil-fuelled assets. In 2014,
the Group’s carbon intensity increased back up to 0.84 kg
CO2 / kWh. However, in 2015, the Group’s carbon intensity has
fallen back down to 0.81kg CO2 / kWh, mainly due to:
• less generation from our coal-fired Castle Peak Power
Station in Hong Kong, and more gas-fired generation at
Black Point Power Station to further reduce emissions from
power generation;
• less generation from our coal-fired Fangchenggang
Power Station in Mainland China, as demand has become
suppressed, and
• less generation from our coal-fired Mount Piper Power
Station in Australia, due to maintenance and uncertainty
over coal supply.
86 CLP Holdings 2015 Annual Report
Natural Capital
205020352020
0.0
0.1
0.2
0.3
0.4
0.5
0.6
0.7
0.8
0.9
1.0
1.1
1.2
1514131211100908070605040302010099989796959493929190
CO
2 Em
issi
ons
Inte
nsity
(kg
CO
2 / k
Wh)
1994 / 1995Introduction ofnuclear (Daya Bay)
1996 / 1997Introduction of gas(Black Point)
Acquisition of fossilfuel plants inMainland China1998 / 1999
2001 / 2002Acquisition of brown coal plant; Acquisition and commission ofcoal-fired plants in Mainland China and Taiwan
Introduction of renewable energy projects; Acquisition of gas plant2004 / 2005
2007 / 2008Published CO2 emissionsintensity target
20152015 Performance:0.81kg CO2 / kWh
Target: 0.6kg CO2 / kWh2020
2050Target: 0.2kg CO2 / kWh
Actual CO2 Emissions Intensity Level Climate Vision 2050’s CO2 Emissions Intensity Targets
1990 / 1991Castle Peak (Coal-fired)
2035Target: 0.45kg CO2 / kWh
CLP Group CO2 Emissions Intensity
Although our present portfolio composition makes it
challenging for us to achieve our interim targets within
the original timeframe set, we remain committed to our
original long term Climate Vision 2050 target. With the Paris
Agreement delivered at COP21 in December, articulating the
greater ambition to move from maintaining the global average
temperature rise from below 2 degrees to 1.5 degrees, we
remain committed to this longer term target and will review
it once the new projection scenarios are released by the
Intergovernmental Panel on Climate Change (IPCC) in 2018.
The Paris Agreement provides the policy signals we need to
continue to scale up our renewable energy business, as well as
for meeting our Climate Vision 2050 targets, particularly the
next set of targets for 2020, which include 20% renewable
energy and a carbon intensity reduction of over 28% compared
to our 2007 level.
CLP will review the potential business opportunities as well
as risks, arising from the Nationally Determined Contribution
(NDC) commitments submitted by the nations we operate in.
We aim to complete our post-COP21 review soon after the
Paris Agreement is open for ratification.
Emerging economies will continue to require new coal-fired
power stations for some time in order to meet their need for
affordable, reliable electricity supply. Where that is the case
in those countries in which we currently have a presence, we
commit to utilising technology of the highest possible efficiency
for our thermal projects and continue to invest in renewables.
We will ensure our approach to climate change is consistent
with both international and national policies in the countries
we operate, and we will continue to regularly monitor global
and national developments and adjust our investment profiles
as required.
Non-Financial (Operations) Data ManagementThe demand on reporting robust, accurate and timely non-
financial data in the jurisdictions where CLP operates has
increased over time. With some of these requirements
progressively becoming mandatory, effective data reporting
processes are essential to ensure that our non-financial data
reported and communicated to our stakeholders and the
community is accurate and robust.
In 2015, we introduced an updated process for non-financial
data reporting and assurance. More responsibilities are now
placed with responsible staff at asset, regional and Group
level, thus achieving a desired level of check and balance. At
the same time, an upgraded online system for operational
data was introduced to facilitate effective and streamlined
data collection and approval, whilst reducing the chance of
human error. Through the design and implementation of such
a data system, we also aligned the non-financial data reporting
process and timeline with financial data. The new requirements
have been formally documented under the internal Standard
for Non-Financial (Operations) Data Reporting and have
been fully implemented. Corresponding requirements on
non-financial (human resources) data reporting have been
developed separately by our Human Resources department due
to their sensitive nature.

87CLP Holdings 2015 Annual Report
Environmental Regulatory ComplianceAs at 31 December 2015, we had 14 environmental incidents
that resulted in license breaches. One of them resulted in
a penalty infringement notice. Details can be found in the
Performance and Business Outlook section of Australia, the
Environmental section of the Five-year Summary and the 2015
Sustainability Report.
Air QualityOur Group’s total air emissions have decreased compared to
2014. This was due mainly to lower utilisation at some of our
coal-fired power stations, use of more gas in Hong Kong and
some improvement in air emissions mitigation measures at our
Jhajjar Power Station in 2015. The 2015 Sustainability Report
has more details.
Emerging Environmental RegulationsWe continue to be alert on the development of environmental
policies and regulations, both in the countries we operate and
other advanced economies such as the US and the European
Union. We carefully keep ourselves abreast of these emerging
issues in order to be prepared to meet similar requirements
when they become applicable in our operational locations. For
example, we have carried out extensive research in the past
two years on issues related to mercury emissions from coal-
fired power stations. We face increasing regulatory control
on mercury emissions in the locations where we operate, and
we have just completed a research on the suite of control
technologies available.
CLP’s Chui Ling Road Substation in Tseung Kwan O is Hong Kong’s largest Sky Woodland hosting 80 trees made up of 32 native species
HSSE IntegrationWe reported last year that we have spent a substantial amount
of effort in integrating our management approach on Health,
Safety, Security, and Environment (HSSE) issues. We were
able to demonstrate the success of this integration in 2015.
Firstly, the overall HSSE management structure is clear and our
approaches are now unified. This includes clear definition of
roles at asset and regional level, as well as a consolidation and
streamlining of how internal requirements are implemented.
Secondly, the Group level HSSE Committee, chaired by our
CEO, established a clear link between our assets, regions,
and other related corporate committees in particular the
Sustainability Committee. Thirdly, as the integration became
more mature, we were able to share knowledge, expertise
and lessons learnt much more effectively throughout the CLP
Group. Going forward in 2016, we have plans to instigate an
even closer working relationship under the HSSE functions,
with the objective to achieve excellence in HSSE performance.

Safety Comes FirstSafety has always been a central pillar of how we conduct
our business. For decades, a “Safety Comes First” culture has
guided CLP well. Today, we employ 7,360 people across the
Asia-Pacific region and we apply the same principles and
values in all our businesses. Our goal is zero injuries in all our
operations and safety is always our top priority wherever we do
business.
We benchmark our safety performance by measuring our Lost
Time Injury Rate (LTIR) and Total Recordable Injury Rate (TRIR).
They refer to the number of lost time injuries or recordable
injuries measured over 200,000 working hours of exposure,
which is equivalent to around 100 persons working for one
year.
In 2015, we recorded 16 cases of LTI in our majority-owned
assets or assets under our operational control. The combined
TRIR of CLP employees and contractors fell from 0.41 in
2014 to 0.25 last year. However, one fatality happened in
2015 when a worker was electrocuted whilst carrying out
maintenance work on site at a minority-owned asset in
Dagangzi of Jilin Province in Mainland China.
The table below summarises the overall safety performance of
our majority controlled assets and assets under our operational
control in 2015 for both employees and contractors:
Safety Performance
Location
Employees Combined Employees and Contractors
2015 2014 2015 2014
LTI LTIR TRIR LTI LTIR TRIR LTI LTIR TRIR LTI LTIR TRIR
CLP Holdings 0 0.00 0.53 0 0.00 0.00 0 0.00 0.49 1 0.32 0.32
Hong Kong 0 0.00 0.07 1 0.02 0.11 4 0.04 0.13 6 0.06 0.17
Australia 6 0.28 0.42 3 0.14 0.42 8 0.28 0.84 8 0.27 0.83
Mainland China 0 0.00 0.00 0 0.00 0.44 1 0.02 0.13 1 0.03 0.31
India 2 0.54 0.54 0 0.00 0.71 3 0.08 0.28 7 0.19 0.86
Total: 8 0.10 0.18 4 0.05 0.26 16 0.07 0.25 23 0.11 0.41
In 2015, we issued a number of supporting guidelines and
developed an e-learning package to assist our regional
business units to implement the Health, Safety, Security and
Environment (HSSE) Management System Standard that we
rolled out in the previous year. The Standard enables our
regional organisations to incorporate the HSSE requirements
into their business programmes. This allows us to continue
to maintain high standards in health, safety, security and
environmental areas of our operations as we expand.
Our Organisation and ResourcesTo successfully implement our investment strategy, we
must ensure that we are effectively organised, adequately
resourced, and equipped with the necessary capabilities. We
continuously review our organisation to ensure that it supports
our investment strategy and the continued efficient and safe
operations of our businesses. In addition, we need to have
the organisational agility to adapt to an increasingly complex
and volatile business environment and meet the challenges
presented by the accelerating pace of technological innovation
and digital disruption. The tables below and on page 89 show
more details of our employee distribution at the end of 2015.
Age Distribution by Region (% of Employees)
Below 18
18 to 29
30 to 39
40 to 49
50 & Above
Hong Kong 0.1 12.3 20.7 27.4 39.5
Mainland China 0.0 18.8 27.9 38.3 15.0
India 0.0 32.0 42.1 19.4 6.5
Australia 0.0 25.0 34.5 20.0 20.5
88 CLP Holdings 2015 Annual Report

89CLP Holdings 2015 Annual Report
Gender Distribution by Region (% of Employees)
Male Female
Hong Kong 82.2 17.8
Mainland China 79.3 20.7
India 90.2 9.8
Australia 57.4 42.6
Employment Type by Region (% of Employees)
PermanentShort-term
Contract
Hong Kong 80.8 19.2
Mainland China 70.0 30.0
India 99.7 0.3
Australia 98.3 1.7
Last year, we reviewed the use of short term contracts in Hong
Kong, and set a limit on the use of these in order to ensure
that short term contracts were not used where permanent
employment would be more appropriate.
In addition to our employees, all our businesses make use of
external contractors, that is staff who are employed by third
party contractors to CLP rather than directly by CLP.
Enhancing our information on the use of contractors is
important for three reasons:
• So that we have a full and accurate picture of the total
human resources needed to meet our business needs;
• To ensure that the employment and other rights of staff
employed by contractors are respected, and
• To support our strategic workforce planning and ensure
that we are not outsourcing core capabilities.
In 2015, we have taken steps to strengthen our data collection
and in future years we plan to report more fully on our use
of contractors, taking into account the definitional, data
collection and procurement policy issues associated with this.
In all of our operations the majority of employees are local.
As an international business, however, we also need to move
selected staff between operations for reasons including
individual development, transfer of know-how, and project
resourcing. We plan and manage these movements through
our Management Development and Succession Planning
process.
In 2015, a total of 510 headcounts were employed in wind,
solar and hydro projects, reflecting the progressive shift in our
generation portfolio to renewable energy.
Ensuring Our Capabilities to Implement Our StrategyOur core requirement is to ensure that we attract, retain and
deploy employees with the capabilities needed to construct,
operate and maintain power facilities across the full range of
fuel types. In particular, we need to retain and maintain our
excellence in engineering.
The recent Group Investment Strategy Review highlighted the
importance of greenfield projects to our future, particularly
in our primary growth markets of Mainland China and
India. Given this strategy, in 2015 we strengthened Group
Operations resources and capabilities significantly, through
a combination of external recruitment and internal transfers
of staff, in order to allow us to unlock value and enhance
performance through common standards and processes in
project management, asset management, procurement and
safety.
In EnergyAustralia, a major reorganisation was undertaken
through the third quarter of 2015 to provide a clear, fit-for-
purpose and accountable operating model that would ensure
we meet the business challenges in the Australian operating
environment.
In India, the focus has been on developing our talent
through initiatives like cross-functional transfers, short-term
assignments and mentoring by seniors from other functions.
Our career development opportunities reflect our high rate
of internal promotion compared to external recruitment, and
this is based on our strong management development and
succession planning process. For example, of our current
11 members of Senior Management, four were external
appointments and seven internal promotions. Two members of
our Senior Management team joined CLP as graduate trainees.
In addition to the on-the-job experience, we are also
committed to formal training and development programmes
covering job specific skills, generic management or supervisory
skills, and language training. The tables below and on page
90 show the percentage of employees trained by gender,
employee category, and the average training hours completed
per employee.
% of Employee Trainedby Region and Gender
AverageTraining HoursPer EmployeeMale Female
Hong Kong 96.9 98.9 55.1
Mainland China 100.0 99.1 66.8
India 86.3 87.2 34.3
Australia 100.0 100.0 63.5

90 CLP Holdings 2015 Annual Report
Human Capital
% of Employee Trained by Region and Professional Category
Managerial Professional
General &Technical
Staff Total
Hong Kong 98.7 99.3 95.4 97.2Mainland China 100.0 99.4 100.0 99.8India 90.7 86.1 85.5 86.4Australia 100.0 100.0 100.0 100.0
To support our succession planning process, we run a number
of regular management development programmes at the
Group level for high potential staff. In 2015, a number of our
employees took part in the following programmes:
• Personal leadership programme for executive development
at the Institute for Management Development, a leading
European Business School;
• Accelerating Management Talent Consortium Programmes
at the Ivey Business School;
• Tsinghua Executive Consortium Programme;
• Hong Kong Young Leaders Programme organized by the
Global Institute for Tomorrow supported by the Hong Kong
Government’s Efficiency Unit and the Hong Kong Jockey
Club;
• World Business Council for Sustainable Development
Future Leaders Programme, and
• Emerging Leaders Programme at the Indian Institute of
Management, Ahmedabad.
Our industry is changing rapidly and we have expanded
our range of strategic partnerships related to learning and
development to help us navigate the future successfully.
Our senior management team has access to the strategic
thinking and research capability of the globally respected
Chatham House, and we are working closely with them on an
industry specific research project.
During the year we also began a pilot programme with École
Polytechnique Fédérale de Lausanne, a leading technology
research institute. Twenty-three of our high potential staff from
across the Group attended the programme to strengthen their
understanding of the disruptive changes driven by technological
innovation and digitisation that are happening to the electricity
industry. Through the programme, participants learned about
the impact of such changes on European utilities, how that may
affect our business model, and the need to prepare CLP for the
transformational changes facing the industry.
We also held regular expert briefings for senior staff on key
emerging topics. In 2015, these briefings included digital
disruption, electromobility and the future of coal.
Our ability to retain staff is reflected in our voluntary turnover
(VTO) rates, which are typically below the local market average
in most of our operations. The VTO for Australia of 13.7% is
above the local market average of 10%, predominantly because
a large percentage of EnergyAustralia’s staff work in call centers,
which typically have a VTO rate significantly higher than for other
staff groups. In the tables below, we show our voluntary staff
turnover rate by age group, gender, and geographical location.
Voluntary Turnover Rate by Region and Age Group (%)
Below18
18to 29
30to 39
40to 49
50 &Above Total
Hong Kong – 5.3 6.1 2.0 1.7 2.8
Mainland China – 5.9 4.1 0.5 1.3 2.6
India – 9.9 11.6 6.5 8.3 9.8Australia – 15.6 18.9 11.2 5.5 13.7
Voluntary Turnover Rate by Region and Gender (%)
Male Female Overall
Hong Kong 2.5 4.7 2.8
Mainland China 2.7 1.9 2.6
India 9.6 11.5 9.8Australia 12.6 15.2 13.7
Leveraging Our Capabilities to Implement Our StrategyLeveraging our capabilities means both being able to deploy
key skills to where they are needed across the Group, and
capturing and retaining critical experience in order to ensure
we are not losing it through retirement or sub-contracting our
core capabilities.
An important example of leveraging our capabilities was our
resourcing plan for the Fangchenggang II construction project
in 2015. We posted seven employees to the project last year, in
order to expose them to project management and construction
experience, and capture that learning to support our future
project resourcing requirements around the region.
Addressing Long-term Human Capital ChallengesTo be a sustainable business, we also have to anticipate and
plan for the longer term internal and external Human Capital
challenges that we face. The most significant of these are:
• We have an ageing workforce in our core Hong Kong business,
as a result of low turnover and a high average length of service.
However, it is also important to recognise that retirement
creates opportunities. The percentage of staff eligible to retire
in the next five years is shown in the table on page 91. In 2015,
we recruited 315 new staff in Hong Kong. The average age
of these new recruits is 23.3, which is significantly below the
average age of our Hong Kong workforce.

91CLP Holdings 2015 Annual Report
% of Employees due to retire in the next 5 years
Hong Kong 16.2
Mainland China 11.9
India 0.8
Australia 10.9
• We face demographic pressures in some markets due to
ageing populations and the high demand for engineers.
Consequently, we will continue to diversify our sources of
recruitment for engineers, both geographically and in terms
of gender diversity.
• Historically we have had limited geographical mobility of
our Hong Kong-based staff due to cultural and personal
reasons. This has inhibited our ability to deploy our core
capabilities effectively outside of Hong Kong, and we are
now taking active steps to increase mobility.
• Young engineers in some parts of the world have an
increasing preference to work in renewable energy. Given
that our renewable energy business is concentrated in
India and Mainland China, we have created opportunities
for Hong Kong-based engineers to be seconded to these
projects, and six assignments were confirmed last year.
To address our long-term challenges we have implemented a
number of initiatives.
Firstly, we have had established a senior management forum,
which meets regularly, to review and optimise the use of our
engineering resources. A key task being addressed by this
forum is increasing the mobility of engineering staff across the
Group. For example, we seconded three young engineers from
India to Hong Kong last year. These cross-business assignments
contribute to the transfer of know-how, sharing of best
practices and individual development.
Secondly, we are progressively increasing the number of
graduate engineering trainees, and diversifying the sources of
recruitment. In addition to Hong Kong, last year we hired more
extensively throughout China and India, and we will seek to
increase our number of female engineers. We recruited nine
graduate trainees locally in China and India last year including
four female engineering graduates. Our apprentice and
technician intakes have also been progressively expanded.
Increasing Diversity and InclusivenessGiven that we employ predominantly local staff in each of
the markets that we operate in, CLP is already a very diverse
organisation from an ethnic perspective.
Historically, utilities have had a significantly higher percentage
of male than female employees. In our case this is compounded
by our operating in countries across Asia-Pacific and, for
cultural reasons, there have been relatively low levels of female
participation in the workforces of these countries.
The tables below show the breakdown of male and female
staff by level and geographical location, and also the ethnic and
gender diversity of our current senior executives.
% of Employees by Region, Professional Category and Gender
Managerial ProfessionalGeneral &
Technical StaffMale Female Male Female Male Female
Hong Kong 76.6 23.4 79.3 20.7 85.0 15.0
Mainland China 90.0 10.0 83.1 16.9 77.1 22.9
India 93.0 7.0 92.8 7.2 83.8 16.2
Australia 71.0 29.0 58.4 41.6 55.0 45.0
% of Senior Executives by Nationality
Chinese 32
European 14
American / Canadian 14
Australian / New Zealander 23
Indian 14
Latin American 3
% of Senior Executives by Gender
Male 86
Female 14
We are taking a number of initiatives to increase gender
diversity:
• We measure and report gender diversity across the Group
to increase the visibility of the issue to the Group Executive
Committee and the Human Resources & Remuneration
Committee.
• In Hong Kong, we have sought the views of female
employees, via focus groups, on how to ensure that we
remain a female-friendly employer. In 2015, we have
enhanced our facilities for female employees, including
breastfeeding facilities and guidelines on lactation breaks.
• We successfully completed the female engineer mentoring
programme with the Hong Kong Institute of Engineers last
year, with the support of a number of our female engineers
from across the Group.
• In India, there was a greater focus on gender sensitisation
with sessions organised for the Internal Complaints
Committee (which investigates and deals with complaints
relating to sexual harassment) as well as the senior leadership
team and staff in Human Resources on aspects including
relevant law, gender sensitivity, and best practices.
We operate across a number of culturally diverse countries
and respect the local differences that result from this.

92 CLP Holdings 2015 Annual Report
Human Capital
Consequently some diversity related initiatives reflect locally
specific considerations. An example is the evolving role of
EnergyAustralia’s Diversity and Inclusion Council which aims to
build an inclusive culture within the company.
Dealing Effectively with Grievances and ComplaintsEach of our businesses has an employee grievance procedure
in place that reflects our Value Framework and any applicable
local legal requirements. The numbers of complaints related to
harassment, discrimination, human rights and labour disputes
that were found to be substantiated following investigation
during 2015 are set out in the table below.
Substantiated Complaints in 2015
Harassment 1
Discrimination 0
Human Rights grievances 0
Labour practices grievances 0
With respect to complaints of discrimination and harassment,
we have clear policies in place, supported by employee training.
Our Group-wide harassment policy sets a common framework
of principles and our detailed policies in each country are fully
compliant with local legislation. Following the introduction of
a Hong Kong specific policy to ensure compliance with Hong
Kong legislation and codes of practice, a series of refresher
training sessions were held last year for Hong Kong staff.
In the case of any employee having concerns, we follow
established procedures to address grievances. We investigate
all complaints of discrimination and harassment. These
procedures ensure fairness and independence in the
investigation process, and respect for the confidentiality of the
parties involved. In Hong Kong and Australia, complaints may
also be made to relevant external bodies such as the Equal
Opportunities Commission in Hong Kong and the Human
Rights and Equal Opportunity Commission in Australia.
Employee Engagement and CommunicationWe conduct regular Employee Opinion Surveys to understand
our employees’ views. These surveys are carried out by
independent external consultants to ensure objectivity and to
maintain confidentiality of the responses.
The most important outcome of the survey is the measurement
of an overall Employee Engagement Index in relation to the
local market norm. The most recent Employee Opinion Survey
result for Hong Kong payroll staff was completed in early 2015.
Our Employee Engagement Index was significantly above the
Hong Kong norm.
For more details on CLP’s human capital, please refer to our
Sustainability Report online.
Given demographic trends and our dedication to promote gender diversity, we are keen to increase the number of female engineers we employ and have teamed up with industry partners to attract females to the profession. To help engage female engineering students, we partnered with the Hong Kong Institution of Engineers (HKIE) to run a mentoring programme for female engineering students in 2015, in which 20 of our female engineers volunteered to provide one-on-one mentoring for female HKIE student members, the first of its kind by our staff. Through a series of site visits and sharing sessions, the mentees learned more about the engineering profession and the power industry.
In addition, we have also reviewed and enhanced the facilities for female staff and introduced lactation breaks for our nursing colleagues and an enhanced maternity leave policy that allows female employees to take four more weeks of unpaid leave in addition to 10 weeks of full-paid leave.
The power industry requires a workforce with specialised skills and is generally considered as male-dominated. How does CLP nurture female engineers?
Venus TamActing Senior Engineer – Smart Grid CLP Power Hong Kong
Roy MasseyChief Human Resources Officer
More Q&As

People are at the heart of CLP’s corporate values, as enshrined
in our Value Framework first published in 2003. In our pursuit
of sustainable development for the future, we put special
emphasis on our relationship with people across a wide
spectrum of internal and external stakeholders. They include
our customers, shareholders, business partners, suppliers,
employees, policy makers and the wider community.
The recent adoption of 17 Sustainable Development
Goals (SDGs) aimed at tackling poverty, hunger, climate
change and other global problems by 2030 at the United
Nations Sustainable Development Summit has provided
the international community with a clear direction on the
transformative steps that are urgently needed for sustainable
development.
As a responsible energy provider, we participated in the United
Nations Private Sector Forum in New York in September
2015 to understand more about the roles of businesses in
contributing to the SDGs. Based on the adopted goals, we have
developed our new Sustainability Principles, which will succeed
our Sustainability Framework (for more details, please refer
to our Sustainability Report). In line with the SDGs, CLP will
continue to develop community initiatives, business solutions
and stakeholder engagement strategy to make people’s lives –
and the world – better.
Climate Action and International EngagementCLP recognises our role to play in helping the world achieve
the SDGs, especially those on combating climate change, and
ensuring access to sustainable and affordable electricity. In just
over a decade, CLP has developed over 3,000MW of renewable
energy in our generation portfolio. At the same time, we invest
in the cleanest coal-fired technology to generate electricity in
markets such as India and China, where affordable electricity
remains a concern.
CLP has been proactively engaging different sectors in the area
of climate action and promoting the use of renewables and
energy efficiency, both internationally and in the communities
where we operate. The highlight last year was the attendance
by CEO Richard Lancaster at some of the side events at COP21
in Paris during which he shared our views of a low carbon
future and reform of the electricity market in China. He also
reiterated the importance of clarity and predictability in the
area of energy policy across nations at the World Business
Council for Sustainable Development (WBCSD) Paris Council
Meeting.
Our other engagement efforts included participating in the
Low Carbon Technology Partnership initiative (LCTPi), which
is led by WBCSD, the International Energy Agency and the
Reprinted with permission of the United Nations
93CLP Holdings 2015 Annual Report
94 CLP Holdings 2015 Annual Report
Social and Relationship Capital
Sustainable Development Solutions Network. CLP is one of
the 82 global companies that have endorsed the LCTPi, which
aims to develop action to accelerate low carbon technology
development and scale up deployment with the aim of limiting
global warming to below 2°C.
Dialogues with Policy MakersStrengthening dialogues with policy makers is also important
to CLP in achieving the SDGs of ensuring the public’s access
to affordable, reliable, sustainable and modern energy. In
our home market in Hong Kong, we actively participated in
the consultation on the future development of the electricity
market in 2015 and shared our knowledge and expertise with
different stakeholders in the discussions.
Since our business spans five different markets, we also make
special efforts to engage and communicate with policy makers
in all of the markets where we operate. For example, we joined
the business roundtable chaired by Indian Prime Minister
Narendra Modi in Shanghai during his visit to China in May.
Most recently, Mr Lancaster participated in a delegation to
India led by Hong Kong Special Administrative Region Chief
Executive Leung Chun-ying to promote trade and business.
To enhance the Chinese Government’s understanding of our
efforts in promoting sustainable energy, we invited central
and provincial officials to visit our power stations and engaged
them in discussions over the prospects of clean energy. In
Australia, our government and regulatory advocacy in 2015
concentrated on key focus areas of market sustainability,
environmental performance, climate change, consumer
affordability and customer experience.
Relationship with Suppliers and ContractorsIn our relationship with our suppliers and contractors, we
put special emphasis on compliance and adherence to the
principles set out in our Responsible Procurement Policy
Statement (RePPS), which is included in our Value Framework.
We are committed to supply chain sustainability and will
progressively consider RePPS in supplier selection and contract
monitoring at a pace and depth that suits local business
conditions. When designing project specifications and
engaging suppliers, we always take environmental impact and
resource usage into consideration.
Furthermore, safety of our contractors is a top priority. Across
the Group, we organised safety workshops to raise awareness
of our contractors. In 2015, CLP Power Hong Kong conducted
site visits to seven key suppliers to understand their sustainability
practices. Currently, Fangchenggang II in China is the largest
and most complex construction project ongoing in CLP. Several
behaviour safety workshops were held on site to enhance
the safety awareness of both employees and contractors. In
Australia, all operational sites were required to conduct back to
work safety workshops when employees returned from their
break as part of the “Summer of Safety” campaign, launched at
the end of 2014.
FeedbackFeedback
Our Core Values
Creating Value for Our Stakeholders
Bu
sin
ess
Ou
tlo
ok O
ur Strateg
y
Business Objectives
Actively Involving our Stakeholders
Learning fromtheir Feedback & Responding
Process of Engagement
ObjectivesAssessment
Issues &ConcernsMapping
StakeholdersIdentification
Communications& Engagement
Plan Development
EngagementActivities
Feedback &Reporting
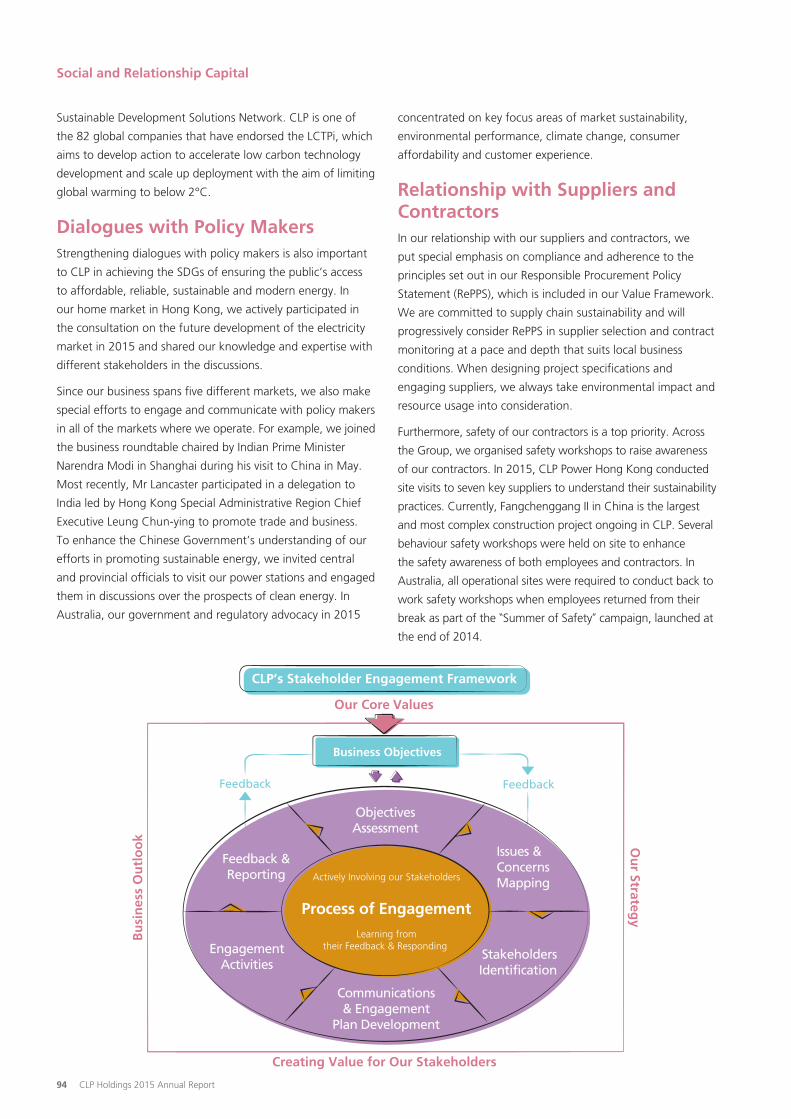
CLP’s Stakeholder Engagement Framework

95CLP Holdings 2015 Annual Report
Relationship with CustomersEngagement with customers and raising their awareness in
energy conservation are equally important to responsible
energy providers like CLP. In fact, we believe our customers are
our biggest asset as we strive to achieve some of the SDGs.
The innovative “Power Your Love” programme launched in
2015 in Hong Kong was an exemplar of how we partner with
our customers to support the underprivileged whilst achieving
energy conservation (for more details, see page 47). We are
also engaging with our commercial and industrial customers
by providing them with free energy audit services under the
GREENPLUS programme in Hong Kong.
In our Customer Service Quality Statement, which is included
in our Value Framework, we state our commitment to service
excellence. We have made great strides in this area during the
past year. In Hong Kong, our simplified application procedures
for customers to connect their distributed renewable energy
facilities to our power grid was one of the many examples
of how we supported our customers on the one hand whilst
protecting the environment on the other.
In Australia, our new business strategy is to grow the business
by focusing on our customers. EnergyAustralia is currently
evaluating alternative energy management systems that will
enable customers to identify opportunities for improvements in
how they manage their energy requirements, particularly to do
with energy efficiency and usage.
In addition, EnergyAustralia is pursuing a number of
opportunities to offer customers greater choice. These include
working with potential partners on energy-efficient lighting
retrofits to improve energy efficiency and evaluating a range
of potential battery systems to increase customer energy
independence.
Community EngagementTo collect feedback from different sectors, we have set up
or joined committees at various levels for continuous service
enhancement. In Hong Kong, apart from establishing the
Customer Consultative Group, Local Customer Advisory
Committee, Green Elites Campus Accreditation Programme
Steering Committee and Eco Building Fund Vetting Committee
over the past years, we were actively involved in the extensive
stakeholder engagement exercise on our plan to add a
gas-fired generation unit at the Black Point Power Station.
Through their feedback, we can constantly assess our business
objectives for creating the greatest possible value for our
stakeholders. This approach is summarised in our Stakeholder
Engagement Framework, which reflects our stress on the
integration of stakeholder engagement into all aspects of our
business, from project development to operation, management
and decommissioning, and on the transparency in our
environmental, social and governance reporting.
Community InitiativesWe consider our interaction with the community we serve a
long-term investment. Over the years, CLP has developed and
invested in a range of initiatives to serve our communities.
One of the keys to the overall success of our business is the
public acceptance of CLP as a provider of essential services.
We believe we can strengthen our social licence to do business
if we engage and empower the communities in which we
operate. In 2015, our cash donations alone amounted to
HK$14.5 million.
Our approach is to apply our skills and resources strategically
to projects, programmes and initiatives that have a positive
impact on community development for the short- and long-
term, as we have committed under our Value Framework. We
strive to create impact through collaboration, capacity-building
initiatives, employee volunteerism and strategic giving. Our
community initiatives focus on four pillars: (1) Climate Change
and the Environment, (2) Youth Education and Development,
(3) Community Wellness, and (4) Arts and Culture. This
is in tandem with the SDG integrated approach which
emphasises the universal need of development and progressive
improvement.
CLP India staff and family members deliver nutritional kits to HIV-infected children

96 CLP Holdings 2015 Annual Report
Social and Relationship Capital
Specifics of our 2015 community initiatives, including CLP-initiated programmes, sponsorship and donations to third parties, are
illustrated below:
Community Spending by Region1
India
Mainland China
Australia
Hong Kong
Southeast Asia & Taiwan
12%
18%
4%
46%
20%
Community Spending by Theme1
Youth Education & Development
Climate Change & Environment
Community Engagement
Community Health & Wellness
Arts & Culture
1% 76%
3%
18%
2%
Our Community Spending
Notes:1 Figures include rounding adjustments.2 The number of people directly reached by or engaged in a community initiative, such as those who have participated directly in the programme, or benefited from
the improvements made to relevant facilities or environment.3 In some cases, the impact of the initiatives is better reflected by the benefiting organisation as a whole instead of the countable number of people.4 Volunteering work that requires electrical engineering skills.
Direct Beneficiaries by Theme1
1%
36%
54%
9%
Youth Education & Development
Climate Change & Environment
Community Health & Wellness
Arts & CultureOver 178,000 direct beneficiaries2
Our Beneficiaries
620 activities implemented
418 organisations benefited3 including professional bodies, academic institutes, NGOs and community groups
200,000 customerstook part in Power Your Love Programme in Hong Kong
10,000 meals per monthdistributed through 3 Hotmeal Canteens in Hong Kong
Over 400 swimming schools benefited from the SwimSAFER Week in Australia
58,950 meals were provided in Goals to End Hunger Campaign in Australia
2 tonnes of foodpackaged by EnergyAustralia’s volunteers in Foodbank Victoria
87%
13%
Skill-based4
Non Skill-based
11,675 volunteer hours from CLP Staff
Contributing Our Time and Expertise Highlights on Our Contribution

97CLP Holdings 2015 Annual Report
Details of our community initiatives and stakeholder
engagement efforts in the different countries in which we
operate can be found in the Performance and Business Outlook
section and our Sustainability Report online.
Measuring Our ImpactTo understand the impacts of our community initiatives, we
adopt global standards that measure a company’s contribution
to the community. These standards also support companies
in evaluating the outputs and long-term benefits of the
community investments.
Since 2009 we have been periodically using the London
Benchmarking Group methodology to measure and evaluate
the social-economic impact of our community investment
initiatives. We are now exploring new impact measurement
tools to more comprehensively reflect the value of our wide
range of contributions.
Furthermore, as part of our efforts to improve the integrity
of our community investment data across the Group, a
standardised online reporting system will be launched in the
coming months.
Sustainable development is one of CLP’s core values. We have made enormous efforts to raise students’ awareness of the importance of energy conservation and greener lifestyles through the GREENPLUS School Programme and Green Elites Campus Accreditation Programme. Through various education initiatives including an online learning portal, seminars, visits to CLP facilities and energy audits for schools, CLP works closely with participating schools to put energy conservation into practice and help strengthen students’ understanding of energy saving and carbon footprint reduction in an interesting manner. We organised the GREENPLUS Award for four consecutive years to recognise organisations which excel in energy saving and encourage more companies to practise sustainable development and conservation. The Award also provides a platform for winners to share their best practices. Going forward, we will join hands with partners such as S.K.H. Mung Yan Primary School to promote a low carbon future to the younger generation.
Our school strives to instil lifelong energy conservation habits in the younger generation. How can CLP help us in this respect?
Mr Sam Lok Kwok Sum and Law Lok HinPrincipal of S.K.H. Mung Yan Primary School and Primary Six student
Quince ChongChief Corporate Development Officer
More Q&As
CLP’s Value Framework

Smart CitiesDuring the period of 1990 and 2014, urban population in the
Asia-Pacific region has increased by nearly 1 billion people, with
almost half of that growth in China. According to a report by
the International Migration Organisation, an estimated 120,000
people are expected to flock into cities daily by 2050. Rapid
urbanisation is now being considered one of the megatrends
that will shape our future. It demands attention from
governments, businesses and the public as it requires significant
resources to support the new infrastructure that we need.
Along with improved living standards, citizens around the
world, in particular those living in urban areas, are demanding
sustainable energy, cleaner air and more efficient transport
systems. There is a trend towards more customer control,
deciding when and how they use energy. They also desire
a higher quality living and working environment. The
phenomenal growth of Information and Communication
Technologies (ICT) being deployed in recent decades has
provided ubiquitous connectivity and intelligent automation.
Ultimately, the notion of smart cities has emerged and global
cities like Barcelona, Stockholm, Seattle, Seoul, Singapore,
New Delhi and Hong Kong are embarking on building their
own version of a smart city.
Smart WasteManagement
Smart Charging
Roof-topSolar
Smart Building
Smart Substation
Smart Grid
EnergyStorage
Smart Meter
ElectricVehicle
Information and Communication Technologies providing connectivity essentials for smart cities
Energy powering infrastructure of smart cities
98 CLP Holdings 2015 Annual Report

99CLP Holdings 2015 Annual Report
Whilst there is no “one-size-fits-all” model for smart cities, they
share some common attributes. ICT acts as the neuro system
of a smart city connecting its citizens to enable them to work,
live and travel more efficiently and comfortably. Smart cities are
“smart” only if their governments are committed to supporting
them through policies, incentives and investment. Energy
represents the most fundamental and critical element as it is
required to power every aspect of a smart city.
CLP has been providing safe and reliable energy for over a
century. Over the years, we have acquired and applied our
expertise to develop and operate a high quality power system
to serve our customers. We have been continuously evaluating
and exploring different new technologies and related economic
benefits through CLP Power Hong Kong, CLP Research
Institute, CLP Engineering and EnergyAustralia. One of our
strengths is to embrace new technologies and tailor them
to meet local needs. Some examples are highlighted in the
following sections.
From Reliable Power System to Smart GridA city requires a reliable, safe and cost-effective power system
that can support the activities of its citizens. Advancement of
ICT has led to the popularisation of smart grids around the
world. With the application of smart grid technology, operators
can now monitor and control their power facilities remotely,
intelligently and accurately. These ICT-based systems are
backed by thousands of sensors and controllers deployed in
our facilities, feeding their real-time data to the control centre.
The control engineers can then monitor and control the power
system with a high degree of accuracy and efficiency, which
in turn, delivers excellent service. The use of these ICT-based
systems has greatly improved system reliability and resilience.
CLP Power Hong Kong has achieved world-class performance
in areas such as safety, supply reliability and operational
efficiency. In order to deliver new and improved services to our
customers, we continue to explore new technologies that make
the grid ‘smarter’ to meet energy challenges in an economic,
sustainable and socially responsible manner. For instance,
we have introduced intelligent substations which use digital
technologies to improve the equipment connectivity, making
them more reliable and flexible.
Our Smart Grid Experience Centre in Hong Kong, which
showcases the many features and benefits of different smart grid
technologies, has attracted over 12,700 visitors, including some
5,400 shareholders, since 2011.
From Internet-of-things to Smart XInternet-of-things (IoT) refers to different sensors, controllers or
ICT systems that are linked together via the internet. They offer
different products and / or services to individual customers,
businesses and governments. They range from a simple switch
that is controlled remotely via a smart phone to a complex
traffic monitoring system. Through the IoT, citizens can get
the latest information they require at or near real time. With
the ease and rapid development of IoT, many functions within
a smart city can be optimised and enhanced, for instance,
controlling traffic dynamically, home security, energy efficiency
in buildings and waste management. It enables a level of
visibility and control that was not previously possible.
Smart X represents a variety of applications utilising the IoT.
With connectivity and intelligent learning algorithms, these
devices and systems make our living and work space more
comfortable (smart thermostat), efficient (smart lighting),
secure (smart home), flexible (smart meter), reliable (smart grid)
and adaptable (smart building).
CLP has gained extensive experience and knowledge on the
development of smart meters in both Australia and Hong
Kong. Smart meters are electronic meters that can provide
additional information on energy consumption and enable
two-way communication between customers and utilities. By
integrating smart meters, CLP is able to provide more energy
options and choices for our customers and to help them save
energy.
In Australia, our subsidiary EnergyAustralia participated in the
Smart Grid, Smart City project in New South Wales, which
generated significant smart meter knowledge and experience
that will help us better meet our customers’ needs in the
future. In Hong Kong, we have successfully completed a smart
meter pilot programme, “myEnergy”, in 2014 for residential
and small-to-medium commercial customers. Through the
pilot programme, we helped our customers identify energy
saving opportunities and better manage their electricity usage.
CLP submitted the encouraging findings of myEnergy to the
Government and is working with the Government to explore
greater use of smart meters in the future.

100 CLP Holdings 2015 Annual Report
Intellectual Capital
From Integrated Renewables to Energy StorageRenewable energy generation will be an integral part of future energy systems. Harnessing unlimited renewable energy, particularly
solar energy, is becoming more affordable. It also offers a low carbon solution to our constant need for cleaner and more economic
energy in city buildings. However, due to the high cost of land, renewable energy will more likely be developed at a small scale and
distributed locally within a city.
Smart Grid
Generation
NuclearPower Import
Cross-BorderInterconnection
Local Generation
RenewableGeneration
Power Network
Telecommunication
Commercial &Industrial
Car Park with Electric Vehicle Charging
Energy Storage
Distributed EnergyManagement System Smart Building
DistributedGeneration
Residential
Home Display Unit
Electric Vehicle
Smart Control/Smart Appliances
Transmission &Distribution
Remote Control / Condition Monitoring /Wide-Area Monitoring
Grid Automation Intelligent Substation Smart Switch &DistributionAutomation
Smart Meter/Advanced Metering
Infrastructure
Highlights of a smart grid:
• A power system must be designed and operated in a safe, reliable, efficient and environmentally responsible manner;
• A smart grid enables the integration of renewable energy at all levels;
• The smart meters, a key component of smart grids, are electronic meters that can provide granular usage data, two-way
communications, remote meter reading and equipment control capabilities;
• A smart grid allows utilities and customers to interact such that certain load consumptions can be controlled to meet
system needs;
• A smart grid enables the integration of different distributed energy resources, including local generation and storage
devices, and
• A smart grid leverages telecommunications and advanced technologies to provide better monitoring capabilities such as
intelligent substations, outage management systems, equipment health monitoring and distribution automation.
101CLP Holdings 2015 Annual Report
Energy storage, particularly battery technology, has seen rapid
growth and cost reduction within the last decade. With energy
storage devices, we can overcome the intermittent generation
profile of wind and solar resources and accelerate more uptake
of renewable energy. In addition, energy storage can also
provide emergency backup power and spinning reserve for the
grid.
Today, CLP has over 3,000MW of renewable energy projects
in our generation portfolio spreading across the Asia-Pacific
region. These facilities include utility-scale wind and solar
farms, roof-top solar panels and building integrated
photovoltaic (BIPV).CLP has worked with different battery
systems for various applications for years. The success of the
integration and utilisation of storage devices will depend
heavily on their overall economic benefits, technology maturity,
performance reliability and safety considerations.
From Mass Transit Systems to Electric Vehicles (EVs)Electrification of mass transit systems is already very common in
major cities around the world. Both public and private EVs are
increasingly popular and it is largely driven by rapid technology
advancement and emission control incentives. The need to
equip smart cities with the necessary charging infrastructure,
convenient payment model, and parking space information will
eventually surface in most smart cities.
CLP has long been a supporter of EVs and public charging
station deployment. In 2015, we owned and operated 77
electric vehicles including two electric buses with 142 public
charging points in our service areas within Hong Kong. We
have extended our free charging service until the end of
2016 and introduced a new service in 2015 to facilitate the
installation of private chargers by our customers in residential
or commercial buildings.
From Data Management to Data AnalyticsData is an integral part of all smart cities. With IoT and Smart
X being increasingly deployed, a large volume of real time
data is generated. This voluminous and complex data, also
known as Big Data, will require extensive data management,
sophisticated analytics and visualisation capabilities to provide
insight and enable faster decision making. In Hong Kong, we
recently published the location data of our EV charging stations
on the Government’s open data portal, which could help
facilitate the development of mobile apps.
CLP has been managing bulk metering data since the 1980s,
when we first implemented interval meters in Hong Kong. The
smart meter deployment in Victoria, Australia and the recent
pilot programmes in Hong Kong have also enabled us to build
extensive capabilities on Big Data management and analytics.
As the importance of ensuring personal privacy and public
security increases, cyber-security has also become our top
priority and newly acquired expertise.
Towards a Low Carbon and Sustainable FutureThe definition of a smart city is constantly evolving. Each city
has its own technological, economical and aspirational drivers
that will define its own vision of a smart city. Ultimately,
historical, cultural, political and social factors will play a role in
the final implementation. However, the role of electricity supply
within all smart cities will be common and the trend is towards
a low carbon, economical, efficient and intelligent power
system.
CLP has been actively working on the development and
deployment of smart meters, demand side management,
distribution automation, renewable energy, building energy
management systems, micro-grid, EV charging network,
intelligent substations, condition monitoring, open data and
big data management. Such knowledge and experience will
enable us to shape and participate in the development of smart
cities in Asia Pacific.