capitalizing on the global smartphone sales recovery
TRANSCRIPT

Capitalizing on the global smartphone sales recovery
Consumer Tech Whitepaper 2020
October 2020

CONSUMER TECH WHITEPAPER, OCT 2020 2
2020 witnessed a massive change in people’s life and
behavior and business owners urgently need to explore
more agile, user friendly and data/value-driven
solutions to address increasingly changing and
complex business challenges.
Facebook’s mission is to give people the power to build
community and bring the world closer together. Our
products empower more than 3 billion people around
the world to share ideas, offer support and make a
difference. Through leveraging the insights from this
report, business owners can conduct scientific
marketing strategies to help propel business growth in
the coming new era of emerging technology.
Micson KwongIndustry Director, Greater China RegionFacebook

3
INTRODUCTION
COVID has sent the world into a tailspin.
However, latest insights from GfK suggests that
the worst in terms of technical consumer goods’
sales has passed. More specifically, there is a
smartphone sales recovery as the world starts to
learn to deal with the fall-out from COVID.
This paper combines insights from three
different data sources: GfK Point of Sales Retail
Tracking Data, GfK Marketing Mix Modelling
(MMM) norms and an extensive multi country
consumer insights study. By doing so, we seek
to highlight the opportunity presented by the
return of demand and how to maximize your
marketing to take advantage of this demand.
Apart from looking at insights at a global level,
we will also focus on 7 key markets in this paper,
India, Indonesia, Brazil, Spain, Russia, UK and
UAE. Markets that represent significant
opportunity for smartphone manufacturers.
Using the insights available from this paper, you
can plot the trajectory of recovery. And prepare
yourself to reach and engage your target
consumers with insights around what drives
purchase intent. GfK Marketing Mix Modelling
norms are also available to provide guidance on
how to maximize sales and utilize your
marketing mix to help effectively drive brand
impact.
CONSUMER TECH WHITEPAPER, OCT 2020

4
OVERVIEW OF DATA SOURCES FOR THIS PAPER:BLEND OF METHODOLOGIES AND GfK DATA ASSETS
Marketing Effectiveness
Consumer Intelligence
Retail and Market Intelligence
The world’s largest and most comprehensive one of its kind point of sales (POS) tracking retail panel for the global tech and durable industry.
Rely on actual sales data from retailers and resellers through our POS tracking to help you measure your market share and brand performance, and benchmark it against your competition.
60+countries
180 million+products tracked
100,000+retailer partnerships
2 million+SKUs
Consumer Survey (Multi-Country Study) conducted by GfK and commissioned by Facebook
Sample methodology:
Online panelists
LOI: 25 Questions
Survey Type: One-shot
Sample Size: 10,738 from 7 countriesIndia (1548), Indonesia (1549), Brazil (1542),Spain (1509), Russia (1524), UK (1546), UAE (1520)
Criteria of Respondents
• Smartphone past 3 months purchasers OR intenders over next 3 months. Both will have recent media interactions in decision making
• Living in surveyed countries • Wide range of price bands covered
Survey Period: October 14 to November 4 2019
GfK offers Marketing Mix Modeling solution designed as the single source to help brands perfect their marketing activities and media mix –rooted in a powerful combination of advertisers’ marketing mix data with our robust GfK Point of Sales (POS) data, advanced analytics, accurate econometric modeling, and local marketing and category insight from our experts.
CONSUMER TECH WHITEPAPER, OCT 2020
5
TABLE OF CONTENTS
01 COVID and the new world 6
02 The recovery of retail and smartphone sales 8
03 Chinese smartphone brand preference 12
04 Role of advertising in driving purchase intent 16
05 Role of the marketing mix in driving sales 22
06 Role of branding in driving sales 26
07 Concluding remarks 30
CONSUMER TECH WHITEPAPER, OCT 2020

6
COVID AND THE NEW WORLD
01
CONSUMER TECH WHITEPAPER, OCT 2020

7
COVID AND THE NEW WORLD
COVID has been the black swan event of 2020 –impacting every part of the globe. While in some countries, the curve has been flattened, in others, COVID infections continue to be on the rise.
Furthermore, even countries that have successfully rolled back the pandemic and achieved zero infections for a period of time, have experienced a resurgence in COVID infections1.
The economic repercussions have also come swiftly as consumer demand is impacted. This problem has been compounded by government regulations enforcing lockdowns.
The consequence is several economies wading into a technical recession2. Certainly, the outlook is gloomy.
▪China▪89,814
▪USA▪5,866,053
▪Brazil▪3,761,391
▪India▪3,310,234
Data as of Aug. 28, 12 p.m. CST.Source: NBC News, Johns Hopkins University Coronavirus Resource Center1. Straits Times: New Zealand reports 13 new confirmed coronavirus cases. After going 102 days without any new reported infections (16 Aug 2020)2. CNN Business: COVID 19 dealt a shock to the world’s top economies. Here’s who has fared the worst (28 Aug 2020)
Confirmed Covid-19 cases by country
01
CONSUMER TECH WHITEPAPER, OCT 2020

8
THE RECOVERY OF RETAIL AND SMARTPHONE SALES
02
CONSUMER TECH WHITEPAPER, OCT 2020

9
THE RECOVERY OF RETAIL
While the world is coming to grips with the economic repercussions of COVID and the ensuing lockdowns. Consumer demand is returning as economic imperatives and calls for a return to normalcy prompt countries out of lockdown3.
While It might be premature to predict an end to this pandemic. On the bright side, the return of offline retail sales is the clearest indicator that consumer demand is recovering.
GfK data shows that global retail sales value for technical consumer goods (TCG) is on the ascendancy. Consumers have been taking out their wallets to spend again.
THE RECOVERY OF RETAIL AND SMARTPHONE SALES
02
Global TCG Market: Consumer Electronics incl. Photo, Small/Major Domestic Appliances, Telecom, IT incl. Office Source: GfK POS Market Intelligence, Panelmarket, International coverage excl. North America & South Africa, based on non-subsidized prices USD fixPRJ 101566/206542 - RG 5481054 - RP 37591452 - ID 5692078103. The Conversation: Exit from coronavirus lockdowns – lessons from 6 countries (6 May 2020)
For some markets, there is positive YOY growth in TCG (Technical Consumer Goods)
CONSUMER TECH WHITEPAPER, OCT 2020

-5%
-22% -23%
-37%
-19%
-11% -6%
Jan 20 Feb 20 Mar 20 Apr 20 May 20 Jun 20 Jul 20
Global Smartphone Volume Growth 2020 (YOY%)
10
SMARTPHONE SALES ON THE ROAD TO RECOVERY GLOBALLY
Apart from the positive signals from GfK retail data (which covers all technical consumer goods). We also see uplifting data from the smartphone market. Once again, GfK POS data shows that global smartphone sales have bottomed out and is steadily recovering.
We should certainly not throw caution to the wind as the erratic nature of the pandemic may trigger more waves and subsequent lockdowns. But countries are a lot better prepared with better infrastructure and capabilities now to deal with the pandemic4.
Therefore, smartphone manufacturers should take advantage of the recovering smartphone market and address this rising demand.
Source: GfK POS Market Intelligence, Panelmarket
CONSUMER TECH WHITEPAPER, OCT 2020
4. The Guardian: Coronavirus testing; how some countries got ahead of the rest (2 Apr 2020)

11
Specifically, looking across seven markets we see varying degrees of recovery. Russia and Brazil smartphone sales are recovering the fastest while UAE is slower.
There are two key takeaways we can derive from the above chart:
• All countries’ smartphone sales are clearly on the road to recovery.
• There is no protracted bottoming out effect. All countries reach the bottom and bounce back up within a month. This is an encouraging trajectory to have even though some markets may not have recovered to pre-COVID levels yet.
Smartphone sales have bottomed out in key markets
Global TCG Market: Consumer Electronics incl. Photo, Small/Major Domestic Appliances, Telecom, IT incl. Office Source: GfK POS Market Intelligence, Panelmarket, International coverage excl. North America & South Africa, based on non-subsidized prices USD fix
CONSUMER TECH WHITEPAPER, OCT 2020

12
CHINESE SMARTPHONE BRAND PREFERENCE
03
CONSUMER TECH WHITEPAPER, OCT 2020

Brand preference of Chinese brands is 36% on average across all countries. In India, Indonesia, Spain and Russia it’s even higher, surpassing brands from other countries of origin. This represents a significant opportunity for Chinese smartphones to retain and win market share across these markets.
Furthermore, the strong brand preference suggest that the brands of Chinese smartphones may actually be an asset for the marketing mix to amplify in order to drive demand.
13
Based on the consumer survey that GfK deployed across these seven markets, we can peer deeper into the minds of the smartphone consumer. We can clearly see that brand preference for Chinese brands isthe highest on average across all seven markets.
STRONG CHINESE BRAND PREFERENCE
03
36.4%32.8%
30.4%
Chinese brands Other Asianbrands
Western brands
7 Countries (N=10738)
Source: GfK and Facebook Consumer Survey, 2019
Chinese brand preference higher than other Asian and Western brand at total level
53.4%
23.5% 22.7%
India (N=1548)
42.7% 38.8%
17.8%
Indonesia (N=1549)
29.6%36.6% 33.7%
Brazil (N=1542)
39.0% 34.7%25.8%
Spain (N=1509)
49.2%
28.8%21.7%
Russia (N=1524)
12.8%
37.6%
49.2%
UK (N=1546)
28.5% 29.5%
42.0%
UAE (N=1520)
Chinese Brands Other Asian Brands Western Brands
CONSUMER TECH WHITEPAPER, OCT 2020
Note that the survey was conducted in October 2019. While this survey is pre-COVID, the results of the survey also correspond with GfK POS data where Chinese brands’ shares are maintained at the same levels when comparing between 1H2019 with 1H2020.

OPPORTUNITY TO DRIVE DEMAND AMONGST PREMIUM SEGMENT
However, in markets like India and Indonesia, Chinese brand preference is noticeably higher than the average. More work can be done to elevate brand preference amongst consumers here. A segment specific strategy is required to drive demand here.
14
22.9%33.0%
44.1%
Chinese brands Other Asianbrands
Western brands
7 Countries (N=4163)
Amongst consumers who have purchased more premium smartphones, average brand preference for Chinese smartphones is lower at 23%.
Western and other Asian brands attract higher brand preference at total level
(price band > USD400*)
42.1%
26.2%31.7%
India (N=477)
27.3%
42.8%29.7%
Indonesia (N=414)
23.4%38.2% 38.4%
Brazil (N=589)
20.4%
37.4%42.2%
Spain (N=602)
24.2%30.4%
45.4%
Russia (N=425)
10.6%
32.2%
57.3%
UK (N=793)
22.4%27.3%
50.3%
UAE (N=863)
Source: GfK and Facebook Consumer Survey, 2019 Chinese Brands Other Asian Brands Western Brands
CONSUMER TECH WHITEPAPER, OCT 2020
*Amongst respondents whose current phone purchased costs > USD400Q10a: Which smart phone brand are you most likely to buy for your next smart phone replacement?

STRONGER CHINESE BRAND PREFERENCE AMONGST NON-PREMIUM SEGMENT
15CONSUMER TECH WHITEPAPER, OCT 2020
58.4%
22.3% 18.8%
India (N=1071)
48.3%37.4%
13.5%
Indonesia (N=1135)
33.4%35.6%
30.8%
Brazil (N=953)
51.3%
33.0%
15.0%
Spain (N=907)
58.9%
28.2%12.5%
Russia (N=1099)
15.1%
43.4% 40.8%
UK (N=753)
36.5%
32.3% 31.2%
UAE (N=657)
Source: GfK and Facebook Consumer Survey, 2019 Chinese Brands Other Asian Brands Western Brands
*Amongst respondents whose current phone purchased costs < USD400Q10a: Which smart phone brand are you most likely to buy for your next smart phone replacement?
Amongst consumers who have purchased less premium smartphones, total brand preference for Chinese smartphones is even higher at 45%.
This is driven by markets like India, Indonesia, Spain and Russia, Chinese brand preference is either on par or surpasses the brand preference for smartphones with other countries of origins.
This is the bigger opportunity for Chinese brands to drive brand share. Furthermore, with the looming possibility of a protracted economic downturn, we need to be prepared for the possibility that consumers may down-trade into this segment.
45.0%32.7%
21.8%
Chinese brands Other Asianbrands
Western brands
7 Countries (N=6575)
Stronger brand preference for Chinese brands across all markets at total level
(price band < USD400*)

16
ROLE OF ADVERTISING IN DRIVING PURCHASE INTENT
04
CONSUMER TECH WHITEPAPER, OCT 2020

17
Based on the same consumer survey that GfK deployed, it is clear that after usage occasions5, advertising plays the most important role in triggering the purchase of smartphones across all seven markets.
Note that this advertising in the broad sense of the word and contains anything from digital ads to traditional media.
The effects of advertising in driving purchase intent is highest in markets like India and Indonesia where over 60% of consumers cite it as a trigger of purchase.
Even in Europe and Russia, over 40% claim that it is a trigger of purchase.
ROLE OF ADVERTISING IN DRIVING PURCHASE INTENT
04
Q18- What triggered the purchase of your mobile phone? [Top 3 choices]The different choices are subsequently grouped under 5 broad classifications of triggers: Usage Needs, Social, Upgrade/Replacement, In-store events/promotions, and advertising
CONSUMER TECH WHITEPAPER, OCT 2020
5. Purchase triggers have been clustered into several buckets. The advertising bucket would consist of a mix of both traditional and digital ads. Usage occasions bucket is an aggregation of several activities such as taking photos, social media, gaming, etc.
DIGITAL MEDIA PLAYS A BIGGER ROLE THAN TRADITIONAL MEDIA IN TRIGGERING PURCHASE INTENT
18
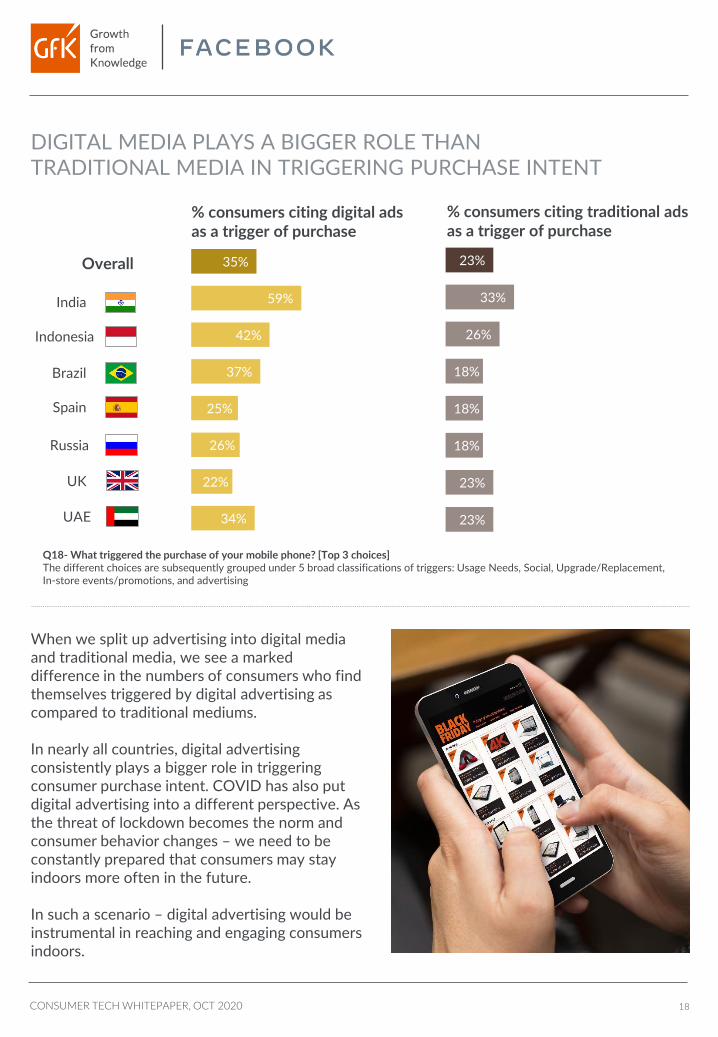
When we split up advertising into digital media and traditional media, we see a marked difference in the numbers of consumers who find themselves triggered by digital advertising as compared to traditional mediums.
In nearly all countries, digital advertising consistently plays a bigger role in triggering consumer purchase intent. COVID has also put digital advertising into a different perspective. As the threat of lockdown becomes the norm and consumer behavior changes – we need to be constantly prepared that consumers may stay indoors more often in the future.
In such a scenario – digital advertising would be instrumental in reaching and engaging consumers indoors.
India
Indonesia
Brazil
Spain
Russia
UK
Overall 23%
33%
26%
18%
18%
18%
23%
23%
% consumers citing traditional ads as a trigger of purchase
35%
59%
42%
37%
25%
26%
22%
34%
% consumers citing digital ads as a trigger of purchase
UAE
Q18- What triggered the purchase of your mobile phone? [Top 3 choices]The different choices are subsequently grouped under 5 broad classifications of triggers: Usage Needs, Social, Upgrade/Replacement, In-store events/promotions, and advertising
CONSUMER TECH WHITEPAPER, OCT 2020
UNDERSTANDING USAGE OCCASIONS CAN HELP US TAP INTO CONSUMER DEMAND BETTER
19
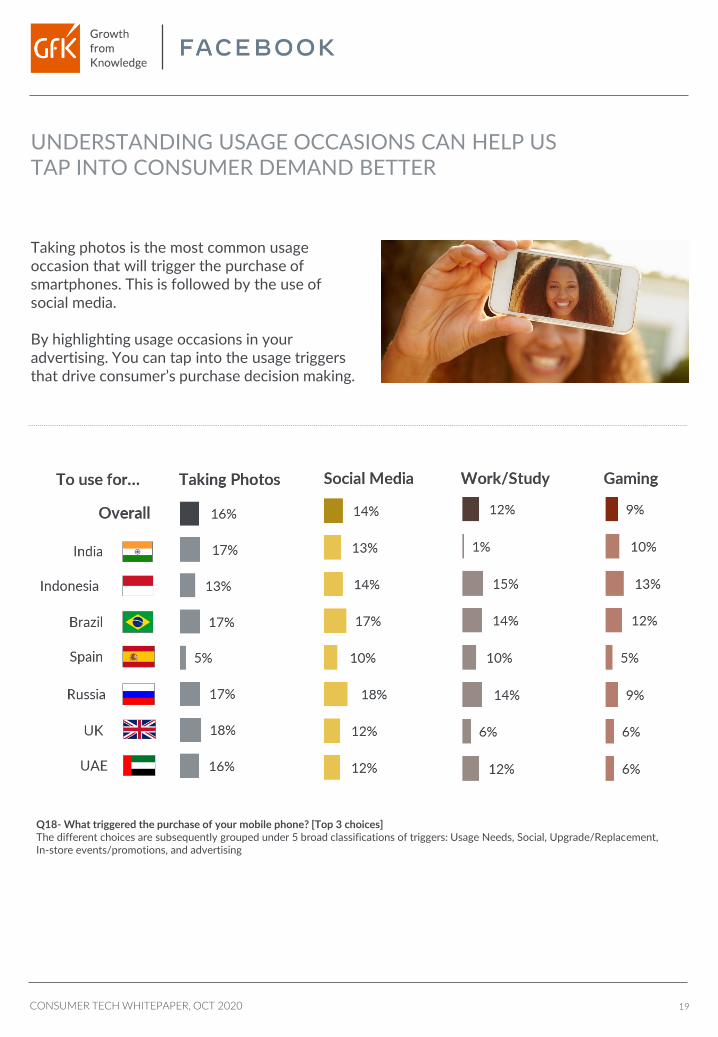
Taking photos is the most common usage occasion that will trigger the purchase of smartphones. This is followed by the use of social media.
By highlighting usage occasions in your advertising. You can tap into the usage triggers that drive consumer’s purchase decision making.
Q18- What triggered the purchase of your mobile phone? [Top 3 choices]The different choices are subsequently grouped under 5 broad classifications of triggers: Usage Needs, Social, Upgrade/Replacement, In-store events/promotions, and advertising
CONSUMER TECH WHITEPAPER, OCT 2020

FACEBOOK:MOST FREQUENTLY CITED AS THE MOST INFLUENTIAL MEDIUM IN DRIVING SMARTPHONE BUYING DECISIONS
20
Facebook was most frequently cited as the number 1 source in making or changing decisions around smartphone purchases in four key markets.
These four markets are India, Indonesia, UK and UAE where Facebook is most frequently cited as the most influential source. This is perhaps unsurprising given that Facebook is a storytelling medium and stories have the power to influence.
It is no longer enough to simply have an online presence or to help consumers make their decisions. Given the competitive pressures and advertising clutter, it is imperative for brands to sway decision making through advertising in order to drive conversion
Q14ar1 - Which of these sources do you find particularly helpful or will change your decision, when you were still just thinkingabout buying or casually looking for smartphone? (ranking question)
India
Indonesia
Brazil
Spain
Russia
UK
UAE
28.1%
23.3%
12.8%
11.8%
5.7%
16.3%
19.7%
4.4%
5.0%
4.2%
2.7%
1.8%
3.3%
5.2%
2.6%
3.7%
3.4%
2.8%
1.0%
2.7%
4.3%
FBTotal
Source most frequently cited
as rank 1
35.1% Facebook
32.0% Facebook
20.5%Online video
(non Facebook)
17.2% Physical stores
8.5%Online video
(non Facebook)
22.3% Facebook
29.3% Facebook
% consumers ranking Facebook’s influence over their smartphone purchase decision making
Rank 1 Rank 2 Rank 3
CONSUMER TECH WHITEPAPER, OCT 2020

21
SMARTPHONE PURCHASE JOURNEYS TAKE UP TO A MONTH AND MAJORITY FINISH THE JOURNEY WITHIN 2 WEEKS
46%
49%
42%
42%
52%
50%
50%
26%
24%
22%
29%
20%
25%
22%
18%
15%
20%
17%
15%
15%
16%
Around 1 week Around 2 weeks Around 1 month
Length of smartphones purchasing journey
India
Indonesia
Brazil
Spain
Russia
UK
UAE
Generally, consumers would make the decision to buy smartphone in one month and majority of consumers (60%+) just spend two weeks to complete the purchase.
From GfK POS, we also note that on average, 55% of smartphone sales occur within the first 6 months post launch6, followed by a period of extended long tail sales.
Product led advertising thus needs to address the pre-launch, launch and post launch phase bearing in mind the timeframes each period encompasses.
CONSUMER TECH WHITEPAPER, OCT 2020
6. Based on flagship smartphones with Android OS in the 7 countries studied in this report. Note that smartphone sales can carryon for a period of around 20 months so there is an extensive long tail after the initial burst of sales.
22
ROLE OF MARKETING MIX IN DRIVING SALES
05
CONSUMER TECH WHITEPAPER, OCT 2020

23
GfK MARKETING MIX MODELING NORMS SHOW SUBSTANTIAL SALES IS PUSHED BY THE MARKETING MIX
GfK Marketing Mix Modelling norms show that media and promotional activities are vital to drive sales. 14% of sales is directly driven by the marketing mix.
About half of these sales are driven by promotional activities in store. Traditional media also plays a strong role in pushing sales with TV advertising driving the strongest sales effect amongst all media.
On the other hand, the effects of digital media are more fragmented. There is a wide array of digital advertising that contributes to sales. When aggregated, this effect is equivalent to the amount of sales driven by traditional media.
86%
7%
4%
4%
14%
Base Promotions
Traditional Media Digital Media
14% of device brand sales are driven by media and promotion support
2.1%
1.2%
1.2%
1.1%
0.9%
0.6%
0.5%
0.6%
1.4%
3.0%
1.3%
2.8%
3.1%
3.8%
4.7%
ecommerce ads
Display
Search
Social
Display (Programmatic)
Video
Radio
OOH
TV
in-store
Promoters
Flyer
Cashback
Price Promotion
Driving sales is heavily dependent on price promotions with strong support from ATL
Source: GfK MMM global norms. Consumer technology
ROLE OF MARKETING MIX IN DRIVING SALES
05
CONSUMER TECH WHITEPAPER, OCT 2020

24
DIGITAL MEDIA ROI SURPASSES TRADITIONAL MEDIA(LED BY SOCIAL MEDIA)
The story becomes very different once we put all media on a level playing field through the lens of ROI. GfK Marketing Mix Modelling norms demonstrate that digital advertising ROI surpasses traditional media ROI.
Social media delivers the strongest ROIs based on our norms. Social media is nearly 4 times more cost efficient at driving sales as compared to the average media’s ROI.
Social media’s sales effectiveness may be due to its efficacy as a medium of influence. This is corroborated by the results of GfK’s consumer survey since Facebook is deemed as the most influential medium.
Source: GfK MMM global norms. Consumer technology
Digital media is 4.3 times more efficient than non digital advertising
Social media* delivers the strongest ROIs. Followed by display
100
36
155
Average Traditional Digital
Indexed ROI (Indexed against average ROI) 117
86
33
17
19
57
107
181
195
362
Radio
OOH
Cinema
TV
ecommerce ads
Video
Search
Display
Social media
CONSUMER TECH WHITEPAPER, OCT 2020
25
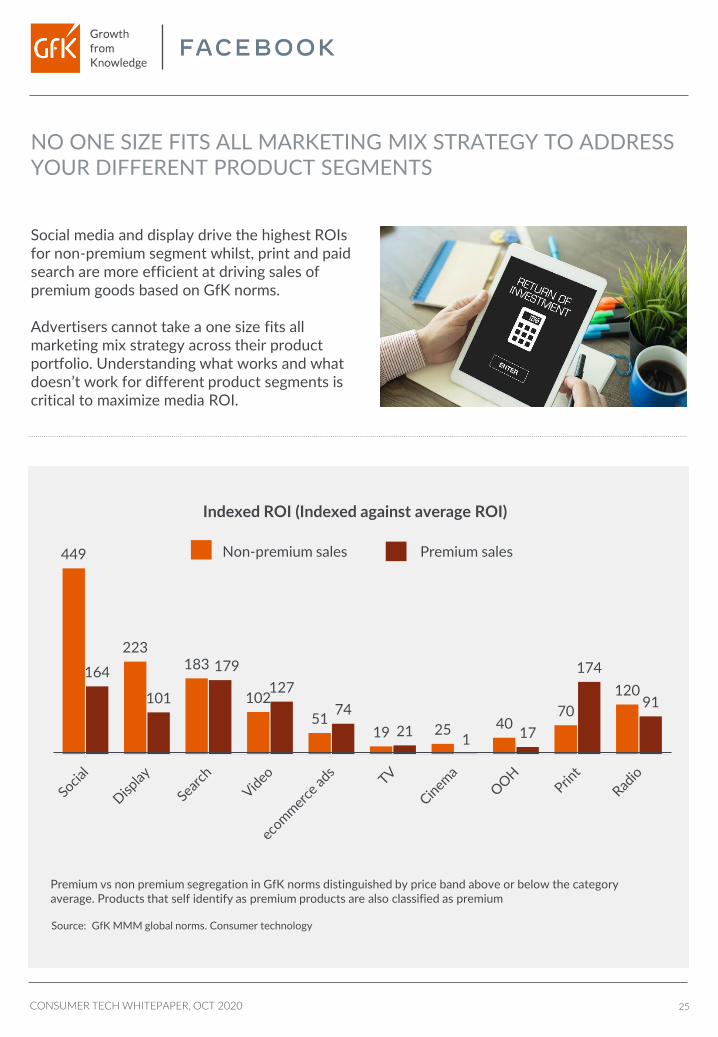
NO ONE SIZE FITS ALL MARKETING MIX STRATEGY TO ADDRESS YOUR DIFFERENT PRODUCT SEGMENTS
Social media and display drive the highest ROIs for non-premium segment whilst, print and paid search are more efficient at driving sales of premium goods based on GfK norms.
Advertisers cannot take a one size fits all marketing mix strategy across their product portfolio. Understanding what works and what doesn’t work for different product segments is critical to maximize media ROI.
Source: GfK MMM global norms. Consumer technology
Premium vs non premium segregation in GfK norms distinguished by price band above or below the category average. Products that self identify as premium products are also classified as premium
Non-premium sales Premium sales
Indexed ROI (Indexed against average ROI)
91
174
17121
74
127
179
101
164120
70402519
51
102
183223
449
CONSUMER TECH WHITEPAPER, OCT 2020

26
ROLE OF BRANDING IN DRIVING SALES
06
CONSUMER TECH WHITEPAPER, OCT 2020

27
DRIVING YOUR BRAND EQUITY WILL TRANSLATE INTO BUSINESS PERFORMANCE
It is easy to understate the power of branding given how it is often framed in intangible terms. However, based on the MMMs that GfK has run, we have been able to quantify the effect of branding on sales.
On average, brand equity drives 16% of sales based on GfK MMM norms. It is important to recognize and appreciate this indirect effect of brand on sales because it is comparable to the direct effects of your marketing mix on sales.
This is measurable evidence that branding plays a substantial role in business performance. Your brand equity is an asset that you can leverage on as a sales driver through brand led advertising.
Furthermore, during the time of COVID, advertisers who encourage a respectable brand perception of themselves may stand to gain in the long run7.
ROLE OF BRANDING IN DRIVING SALES
06
Sales decomposition from MMM norms
BTL Traditional
Digital media Base
Direct effects of marketing mix drives
14% of sales
Promotion Traditional
Digital media Brand Impact
Base
Indirect effects
16% of sales linked to
brand effect*
*brand effect on sales derived by integrating specific metrics from brand health trackers
into the MMM timeseries
CONSUMER TECH WHITEPAPER, OCT 2020
7. Mediavisioninteractive.com: The importance of brand building and equity during COVID – 19 (27 Mar 2020)
28
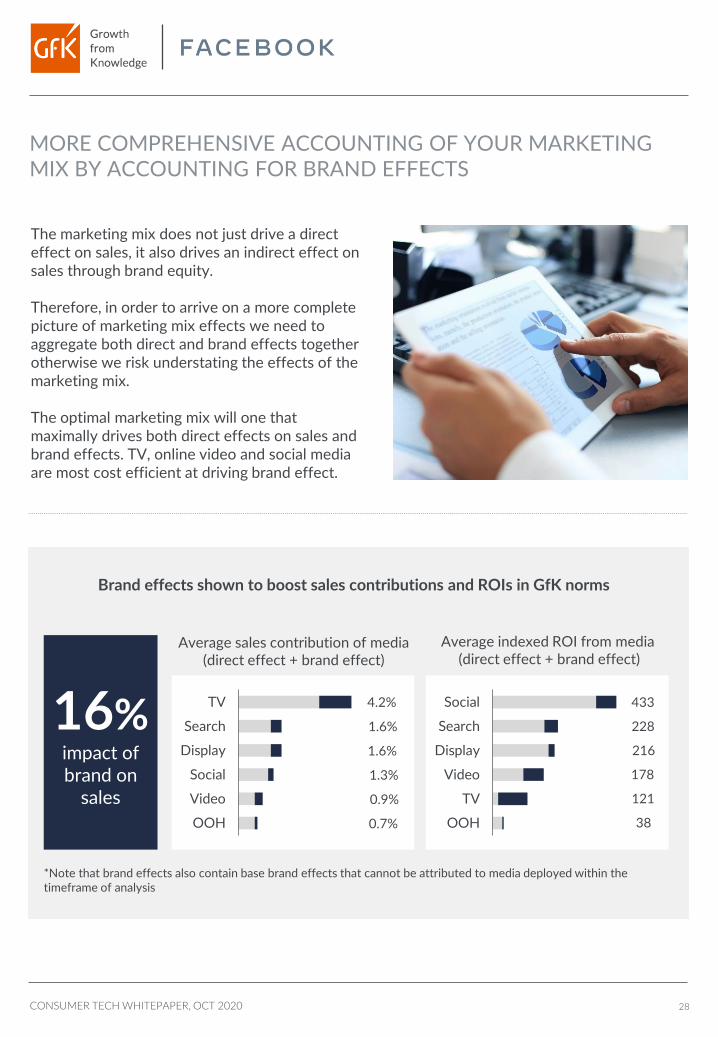
MORE COMPREHENSIVE ACCOUNTING OF YOUR MARKETING MIX BY ACCOUNTING FOR BRAND EFFECTS
The marketing mix does not just drive a direct effect on sales, it also drives an indirect effect on sales through brand equity.
Therefore, in order to arrive on a more complete picture of marketing mix effects we need to aggregate both direct and brand effects together otherwise we risk understating the effects of the marketing mix.
The optimal marketing mix will one that maximally drives both direct effects on sales and brand effects. TV, online video and social media are most cost efficient at driving brand effect.
Brand effects shown to boost sales contributions and ROIs in GfK norms
*Note that brand effects also contain base brand effects that cannot be attributed to media deployed within the timeframe of analysis
16%impact of brand on
sales
Social
Search
Display
Video
TV
OOH
Average indexed ROI from media (direct effect + brand effect)
OOH
Video
Social
Display
Search
TV
Average sales contribution of media (direct effect + brand effect)
CONSUMER TECH WHITEPAPER, OCT 2020
4.2%
1.6%
1.6%
1.3%
0.9%
0.7%
433
228
216
178
121
38

29
EXPECT THE IMPORTANCE OF ONLINE MEDIA TO GROW ALONGSIDE THE LEVEL SHIFT IN ONLINE SHOPPING
Further, we expect the importance of digital / social media advertising to become even more entrenched as online shopping grows.
Online retail may be experiencing a level shift as COVID has given new impetus to consumers to get into online shopping. Online shopping has not gone back to pre-COVID period and has continued to remain high across all markets.
This is also good news for digital media. Based on GfK MMM norms – for every $10 that shoppers spend online, $0.808 is driven by online advertising. As consumers open their wallets to spend more online, we can expect the sales contributions from digital marketing to grow in tandem.
Online sales of smartphones(value share %)
Source: GfK POS Market Intelligence, Panelmarket, International coverage (excl. North America & South Africa), Sales Value USD with a fixed exchange rate, Value Growth % Year-on-YearTechnical Consumer Goods (TCG): Consumer Electronics, IT, Office Equipment, Multifunctional Technical Goods, Photo, Telecom, Small & Major Domestic Appliances, Personal Diagnosis Devices
1% 3%
United Arab Emirates
18%25%
Russia
14%18%
Spain
19% 22%
Indonesia
28%42%
Great Britain
19%34%
Brazil
Jul2020 Jun May Apr Mar Feb Jan
CONSUMER TECH WHITEPAPER, OCT 2020
8. GfK MMM norms based on technical consumer goods. Note that any promotional effect is accounted for separately even if they are communicated via digital media, e.g. price promotions, cashbacks
30
CONCLUDING REMARKS
07
CONSUMER TECH WHITEPAPER, OCT 2020
CONSUMER TECH PLAYBOOK, OCT 2020 31
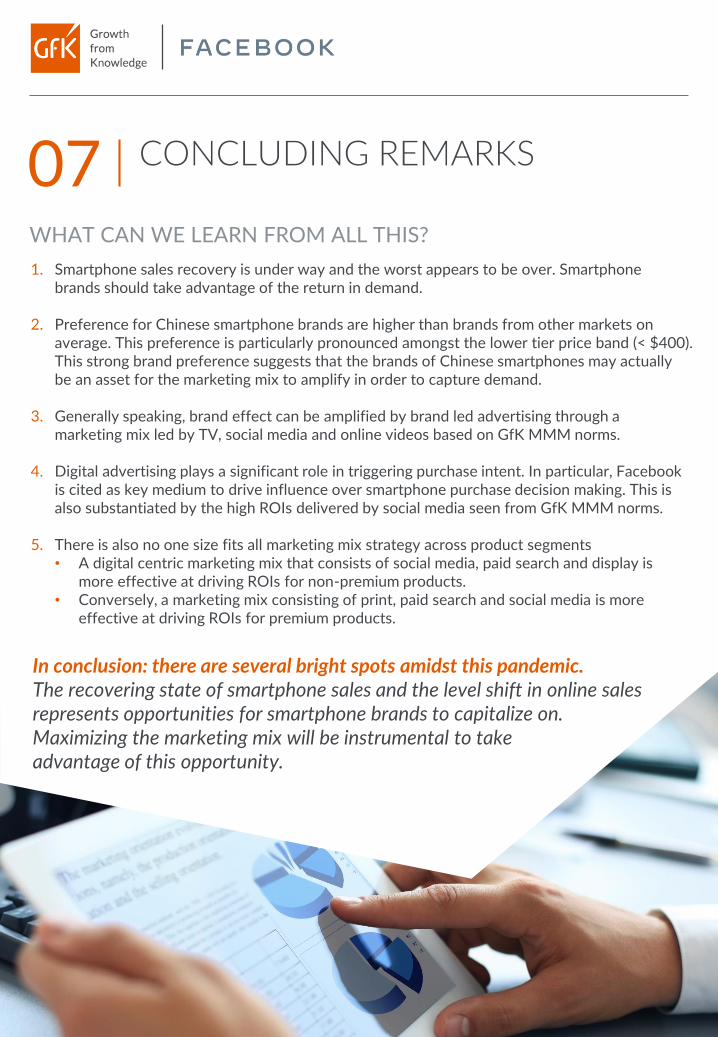
WHAT CAN WE LEARN FROM ALL THIS?
1. Smartphone sales recovery is under way and the worst appears to be over. Smartphone brands should take advantage of the return in demand.
2. Preference for Chinese smartphone brands are higher than brands from other markets on average. This preference is particularly pronounced amongst the lower tier price band (< $400). This strong brand preference suggests that the brands of Chinese smartphones may actually be an asset for the marketing mix to amplify in order to capture demand.
3. Generally speaking, brand effect can be amplified by brand led advertising through a marketing mix led by TV, social media and online videos based on GfK MMM norms.
4. Digital advertising plays a significant role in triggering purchase intent. In particular, Facebook is cited as key medium to drive influence over smartphone purchase decision making. This is also substantiated by the high ROIs delivered by social media seen from GfK MMM norms.
5. There is also no one size fits all marketing mix strategy across product segments• A digital centric marketing mix that consists of social media, paid search and display is
more effective at driving ROIs for non-premium products.• Conversely, a marketing mix consisting of print, paid search and social media is more
effective at driving ROIs for premium products.
CONCLUDING REMARKS07
In conclusion: there are several bright spots amidst this pandemic. The recovering state of smartphone sales and the level shift in online sales represents opportunities for smartphone brands to capitalize on. Maximizing the marketing mix will be instrumental to take advantage of this opportunity.

32
Bryan WangDirector, Marketing Science, Greater China & APAC, GamingFacebook
As we are stepping into a very different world, all marketers
need to rethink about their marketing strategy to reach
consumers more effectively, be where consumers are, and
meet what consumers need. We hope the insights from this
white paper can help marketers to better embrace the new
consumer behavior and media era - especially how to utilize
marketing mix modeling to better understand their cross-
channel marketing effectiveness, which is now more
important than ever given the more challenging
circumstances and greater uncertainties.
Facebook is also committed to work with advertisers to
release the power of data and science in marketing along
with our partners such as GfK.
CONSUMER TECH WHITEPAPER, OCT 2020

33
Authors
Winnie KungCommercial Director, GfK [email protected] 15 years of experience in the market research industry, Winnie has a wealth of knowledge and expertise in research planning and quantitative analytics. Her specialization sectors includes Communications, Home Appliances, Consumer Electronics and Fashion & Lifestyle.
Spencer NgMarketing Analytics lead, GfK [email protected] has been working in marketing analytics and consumer insights for nearly 15 years, covering markets across Asia Pacific, Europe and Middle East region. He leads the marketing analytics practice in APAC and has worked a broad range of brands to help them optimize their marketing mix investments and channels.
About GfKIn a world of data overflow, disruption and misuse, picking up the right “signal from noise” is keyto win. We at GfK are the trusted partner with more than 85 years of experience in combining data and science to help you make the right business decisions. Together with our attention to detail and advanced Augmented Intelligence, we provide you with world-class analytics that delivers not just descriptive data but actionable recommendations always-on at your fingertips. As a result, you can make key business decisions with confidence which help you drive sales, organizational and marketing effectiveness. That’s why we promise to you “Growth from Knowledge”.
About FacebookFounded in 2004, Facebook's mission is to give people the power to build community and bring the world closer together. People use Facebook's apps and technologies to connect with friends and family, find communities and grow businesses.
CONSUMER TECH WHITEPAPER, OCT 2020

22-Oct-20 ▪ Title of presentation (Insert / Header & Footer / Apply to All) 34www.gfk.com ©GfK2020