capital structure, business strategy and firm’s
TRANSCRIPT

European Online Journal of Natural and Social Sciences 2017; www.european-science.com Vol.6, No.2 pp. 302-328 ISSN 1805-3602
Openly accessible at http://www.european-science.com 302
Capital Structure, Business Strategy and firm’s performance: Evidence from Pakistan
Talat Afza1, Naveed Ahmed2*
1The Government Sadiq College Women University, Bahawalpur, Pakistan; 2COMSATS Institute of Information Technology, Lahore, Pakistan *Email: [email protected]
Received for publication: 21 February 2017. Accepted for publication: 25 May 2017.
Abstract The core objective of the current study is to explore the moderating role of business strategy
on the established relationship between capital structure and firm performance by selecting the data of 333 non-financial firms of Pakistan over the period of 2006 to 2013. The empirical results indicate that debt financing is imperative both for the accounting and market performance of the selected firms while attempting to pursue the cost leadership strategy. Moreover, as the firms follow the hybrid strategy, product differentiation strategy and firms with unclear strategic situation, the benefits of debt decreases and incurs a significant performance penalty.
Keywords: Capital Structure, Business Strategy, Firm Performance, Pakistan Introduction: All the financial decisions are made by the firm in pursuit of maximizing its value and
shareholders wealth. Among the financial decisions, capital structure decision is not only concerned with finding right kind of asset financing but is also entailed with choosing the appropriate blend of the financing options for successfully running the firms operations. This optimal or appropriate combination of equity and debt is also depends upon the choice of the firm’s business strategy (Jermias, 2008). Business strategy is an effective mechanism of each business and it is combination of diverse set of activities for the creation of valuable and unique position in the marketplace. It addresses the competitive aspect who the business should serve, what needs should be satisfied, how core competencies can be developed and the business can be positioned.
Porter (1980) made a valuable addition in the literature by establishing a generic strategy framework that specify how firms choose a business strategy for outperforming and effectively competing other ventures or business units in a specific industry. According to the Porter’s topology, strategic managers must decide whether a firm or business unit will compete in the product market through minimizing its costs relative to its competitors (i.e. cost leadership strategy) or will compete by providing the unique, high quality features products (product differentiation strategy). Although several types of organizational strategies have been developed over the years (i.e. Miles and Snow, 1978; Chrisman et al., 1988), however, porter’s competitive strategies remain the most generally accepted and supported in the strategic management literature (Miller, 1998; Kim and Lim, 1988; Miller and Dess, 1993; Thompson and Stickland, 1998; David, 2000; Jermias, 2008).
Consequently, Porter proposed two broad categories of “generic” competitive business strategy i.e. Cost Leadership Strategy and Product Differentiation strategy and argued that the firm must achieve one strategy for accomplishment of its goals, otherwise, business unit or a firm will “stuck in the middle” of the competitive marketplace without any competitive advantage and will

Social science section
Openly accessible at http://www.european-science.com 303
also face poor financial performance. However, numerous researchers (Hill, 1988; Kim and Lim, 1988; Chakraborty & Philip, 1996; Parnell, 1997; Barney, 2002; Barney & Hesterley, 2006) latterly argued that hybrid strategy is also quite effective in terms of generate high margins or profits due to premium prices and low product costs. Consequently, the current study classifies the firms under “hybrid strategy” group which are giving emphasis on cost Leadership strategy and product differentiation strategy simultaneously whereas firms with the poor strategic condition or “Stuck in the Middle” firms are describes as those firms which are failed to pursue any single strategy.
Cost leadership strategy and product differentiation strategy can be combined to acquire more financial benefits as mixed strategies enhances flexibility and make it easier for the organizations to adapt the modifications e.g. industry changes and advancement in technology (Parker & Helms, 1992). Furthermore, any inaptness between product differentiation strategy and cost leadership strategy may have apprehended true in 1980s when business environment was relatively stable; however, mass customization, development of network organizations and rapidly transformation in the business competitive environment demands more flexibility for the selection of more than one strategies or to pursue both strategies simultaneously to meet the innovative requirements of the customers (Goldman et al, 1995; Anderson, 1997; Kim et al., 2004).
In addition, many firms working in the competitive environment are unable to make necessary plan to choose their strategy due to the faults i.e. poor resource allocation decisions or ignorance and such firms are considered “Stuck in the Middle” (Cronshaw et al., 1994). These firms are laid down under the poor strategic conditions and fail to implement either cost Leadership strategy or product differentiation strategy and as a result face poor financial performance and suffer when competition intensifies. In addition, these firms normally do not offer unique featured products as per the demand but charge high prices from their customers and as a result, duck out from the product market competition. Several studies also illustrated that “Stuck in the Middle” firms negatively influence the financial performance (Dess and Davis, 1984; Miller, 1986; Farrell et al., 1992; Powers and Hahn, 2004; Kim et al., 2004; Torgovicky et al., 2005; Parnell, 2010; Nandakumar et al., 2011). Consequently, the study anticipates that the firms which follow the cost leadership strategy can enhance their both accounting and market performance through debt financing while the firms which pursue the product differentiation strategy and hybrid strategy may not attain suitable monetary benefits of debt financing. In addition, asset financing through debt is also not suitable for the firms with unclear strategy.
Literature Review Capital Structure and Firm Performance The real debate on the capital structure started after the pioneer work of Modigliani and
Miller (MM) in 1958. They argued that firm’s value is not dependent on capital structure under the perfect capital market. However, they inverted their claim and explored that the firm’s value is maximized when its assets are financed by large amount of debt (Modigliani and Miller, 1963). Jensen and Meckling (1976) also proposed that agency cost exits between the managers and the shareholders due to moral hazard problems and as a result shareholders face high monitoring and incentive costs for the reduction of moral hazard problems. They further stated that high debt financing reduces these costs and enhances the performance because debt acts as a disciplinary device to reduce the manager’s cash flow wastage. Ross (1977) also argued that high debt ratio of the firm through a positive signal to the market that the firm has positive cash flows for meeting the future operational and financing requirements of the firm. In another development, Lubatkin and Chatterjee (1994) argued that debt can enhance the firm performance as a portion of cost of debt (interest) is tax deductible Harris and Raviv (1991) explored that leverage align the interest of

Talat Afza, Naveed Ahmed
Openly accessible at http://www.european-science.com 304
shareholders and managers for maximizing the shareholders wealth. Several studies also reported positive relationship between capital structure and firms performance (e.g. Ghosh et al., 2000; Berger & Bonaccorsi di Patti, 2006; Margaritis and Psillaki, 2010; Fosu, 2013).
On the other hand, several academicians also explored the negative relationship between capital structure and firms performance. Jensen and Meckling (1976) indicated another kind of agency costs arises from the conflicts between the debt holders and shareholders due to default risk. This risk may create due to “debtoverhang” or “overinvestment”. In this scenario, firm’s performance will be negatively affected by debt financing. Myers (1977) extended this analysis and explore that high debt ratio leads to suboptimal investment. As part of the investment’s benefits transfer to the debt holders, valuable investment opportunities may be rejected by the high levered firms, leading to reduction in the market value of the firm. Stulz (1990) extended the work of Myers (1977) and suggested that debt financing deteriorate the underinvestment problem due to regular outflow of cash to the creditors. It limits the resource constraints to the mangers and ultimately declining the firm’s performance.
Maksimovic and Titman (1991) argued that the product quality can be compromised when the firms finance their assets through debt, which is harmful for the firm’s performance. Balakrishnan and Fox (1993) identified that high debt enhances the risk aversion of the managers and lessen their inclination to invest in risky but more lucrative businesses. Therefore, debt financing is negatively affected to firm’s performance. Many empirical studies also described inverse relationship between leverage and firms performance. (e.g., Kester, 1986; Titman and Wessels, 1988; Balakrishnan and Fox, 1993; Rajan and Zingales, 1995; Gleason et al., 2000; King and Santor, 2008). Consequently, the current study also anticipates the negative impact of leverage on the firm performance due to the various drawbacks of debt financing.
Capital Structure, Business Strategy and Firm Performance Business strategy is considered one of the imperative and essential elements of every
effective business and the firm can enhance its value and fruitfully compete in the marketplace by choosing the suitable competitive business strategy. For instance, Hambrick (1983) selected the data of industrial product manufacturers and the producers of capital goods to investigate the strategy-performance relationship and the outcomes supported the porter’s topology and found that struck in the middle firms poorly performed than the cost leadership firms or product differentiators. Kim et al., (2004) selected the sample of 75 listed firms to explore the applicability of the Porter’s business strategy and the outcomes of the research illustrated that Porter’s generic strategies are also applicable to the e-business firms. Moreover, business units pursuing the integrated strategy exhibited the highest performance than the firms which adopted single strategy. Allen et al. (2006) examined the validity of widely accepted porter’s topology by using the data of 226 adult employees of different organizations. The results of regression analysis indicated that both cost leadership and product differentiation strategy significantly and positively influence the firm’s performance.
Parnell (2010) also explored the link between Porter’s generic business strategy and firm’s performance by selecting 277 retail business firms of USA and the results revealed that the firms pursuing single strategy and hybrid strategy performance better than the firms without strategic clarity (struck in the middle). Nandakumar et al., (2011) explored the impact of business strategy on the organizational performance to assess the applicability of porter’s generic strategies. The outcomes of the study revealed that the firms pursuing either product differentiation strategy or cost leadership strategy performs better than struck in the middle firms. In addition, positive relationship has also been found between hybrid strategy and firms performance. Pulaj et al., (2015) also explored the relationship between Porter’s generic business strategies and the organizational

Social science section
Openly accessible at http://www.european-science.com 305
performance and the outcomes depicted that both cost leadership strategy and product differentiation strategy positively and significantly contribute in the firm’s performance.
As stated, most of the prior studies have only examined the direct relationship between leverage-performance and business strategy-performance relationship; however, Jermias (2008) argued that the impact of capital structure on the firm’s performance may be contingent upon the business strategy followed by the firms. For Instance, O’Brien (2003) explored the moderating role of product differentiation strategy on the leverage-performance relationship. The results illustrated that the capital structure of the firms has a negative relationship with firm’s performance. In addition, the results also designated that the coefficient of interaction term between product differentiation and leverage is negative and significant. It indicates that the firms which maintain high debt levels in their capital structure and are interested to adopt the business strategy based on production differentiation, incur a poor financial performance.
By using the sample of 176 U.S manufacturing listed firms, Jermias (2008) empirically examined the moderating role of business strategy on the relationship between capital structure and firm performance. The outcomes of the study indicated that leverage negatively affects the firm’s performance. In addition, the results also confirmed the moderating role of business strategy on the leverage-performance relationship as the relationship between capital structure and the firm’s performance is more negative for the firms which are pursuing product differentiation strategy than cost leaders.
For the best of author’s knowledge, existing literature exhibited only the mentioned studies which choose the business strategy as a moderating variable between the relationship of capital structure and firm performance. Out of these two studies, O’Brien (2003) considered only one type of Porter’s business strategy while Jermias (2008) opted two categories of business strategy as a moderating variable and conducted the research in the domain of USA. In addition no single study has also been found in the literature relevant to Pakistan which selected the business strategy as a moderating variable. Therefore, the present study contributes in the existing literature by choosing all the categories of business strategy i.e. cost leadership strategy, product differentiation strategy, hybrid strategy and unclear strategy (stuck in the middle) of the firms as a moderating variable between the leverage-performance relationship.
Research Methodology Sample Size In order to accomplish the objectives of the study, the current study initially selected all 396
non-financial firms listed at Pakistan Stock Exchange (Formerly Karachi Stock Exchange) over the period of eight years from 2006 to 2013. Out of 396 listed firms at Pakistan Stock Exchange, 63 firms have been defaulted during the entire sample period and the current study excludes all these defaulted firms from the final sample due to unavailability of annual reports or financial data of these firms. Consequently, final sample of the study consist of 2317 firm year observations of 333 listed non-financial firms of Pakistan over the period of eight years from 2006 to 2013 have been used to accomplish the objectives of the study.
Sources of Data Various sources have been used for the purpose of collection of data. Book value based
yearly financial data is collected from the annual reports of the firms and from the financial reports named “ Financial Statement Analysis of Non-financial Companies” published by the State Bank of Pakistan. Moreover, market prices of the selected sample firms have been collected from the website of Karachi Stock Exchange as it provides the reliable and authentic information regarding the firm’s market activities.

Talat Afza, Naveed Ahmed
Openly accessible at http://www.european-science.com 306
Variables of the Study Firm Performance To measure the performance of listed non-financial firms of Pakistan, the present study
divides the firm’s performance into two general groups i.e. accounting based performance measures and market based performance measure. This study splits the accounting based measures into return on assets (ROA) and return on equity (ROE). Many authors are also utilized the given accounting based measures to measure the firms performance (Arcas & Bachiller, 2008; Chen et.al.,2009; Sheikh & Wang, 2012; Yang et. al., 2014). Firm performance is measured through the following proxies:
Return on Total Assets (ROA) = Net Profit after Tax Total Assets Return on Total Equity (ROE) = Net Profit after Tax Total Equity In addition, market performance of the firms is measured through Tobin’s Q (Q ratio). Many
studies (Aggarwal, Kyaw and Zhao, 2011; King & Santor, 2008; Salim & Yadav, 2012; Park & Jang, 2013) have also utilized Q ratio to measure the market performance of the firms. Q ratio is computed through:
Tobin’s Q (Q Ratio) = Market value of the firm Book value of asset Where, Market value of the firm = Book value of debt + market value of equity. Capital Structure: The current study measures the capital structure of the selected firms by using the following
proxies: Total Debt Ratio (TDR) = Total Debt Total Assets Long Term Debt Ratio (LDR) = Long Term Debt Total Assets Short Term Debt Ratio (SDR) = Short Term Debt Total Assets Control Variables To accomplish the factual objectives of the current study, five control variables are also
utilized as standard determinants of performance. These variables comprise of firms size, liquidity, growth, risk and age of the firms and have been extensively employed by various researchers. The relationship justification along with the measurements of these control variables are as follows:
Business Strategy (Moderating Variable) The current study splits the business strategy into Cost Leadership Strategy and Product
Differentiation strategy. Consistent with the Singh and Agarwal (2002) and Jermias (2008), Cost leadership strategy is measured through:
Asset Utilization Efficiency (AUE) = Total Sales Total Assets While product differentiation strategy is measured through: Premium Price Capability (PPC) = Selling and Administrative Expenses

Social science section
Openly accessible at http://www.european-science.com 307
Total sales After applying the above measurements, the following methodology is adopted to evaluate
that (1) which type of firms are focusing on cost leadership strategy, (2) how many firms are following product differentiation strategy, (3) how many firms are pursuing both strategies simultaneously (hybrid strategy) and (4) the number of firms are lay down in the domain under the poor strategic situation or stuck in the middle.
Cost Leadership Strategy: The firm is considered to follow cost leadership strategy if it fulfills the following two
conditions: a) If the firms value of Asset Utilization Efficiency is greater than its median value and b) If the firms value of Premium Price Capability is lesser than its median value Product Differentiation strategy: The firm is considered to choose product differentiation strategy if it fulfills the following
two conditions: a) If the firms value of Asset Utilization Efficiency is lesser than its median value and b) If the firms value of Premium Price Capability is greater than its median value Hybrid Strategy: The firm is considered to follow hybrid strategy if it fulfills the following two conditions: a) If the firms value of Asset Utilization Efficiency is greater than its median value And suppose b) If the firms value of Premium Price Capability is greater than its median value Struck in the Middle: The firm is deemed to implement any single strategy if it fulfills the following two
conditions: a) If the firms value of Asset Utilization Efficiency is lesser than its median value and b) If the firms value of Premium Price Capability is lesser than its median value Regression Model to Determine the Moderating Role of Business Strategy on the
Relationship between Capital Structure and firm Performance: Perf = Ɣ0 + Ɣ1 (CS) + Ɣ2 (STRA) + Ɣ3 (CS)*(STRA) + Ɣ4 (SZ) + Ɣ5 (GT) + Ɣ6 (LQ) +
Ɣ7 (AG) + Ɣ8 (RK) + ε Where, Perf = Firm Performance, CS = Capital Structure, SZ = Size, GR = Growth, LQ =
Liquidity, AG = Age, RK = Risk, STRA = Business Strategy and STRA = 1 (If the firm is pursuing Strategy), otherwise= 0. The above model is separately regressed by adopting all categories of business strategy along with all performance measures.
Results and Discussion Descriptive Statistics Overall descriptive statistics of the firm specific dependent, independent, control and
moderating variables of the study illustrate in the table 1. The selected sample of non-financial firms of Pakistan are reasonably profitable in terms of accounting measures of performance as the mean value of ROA and ROE are 3.50% and 7.83% respectively. The outcomes of table 4.1 indicates that

Talat Afza, Naveed Ahmed
Openly accessible at http://www.european-science.com 308
the average value of Tobin’s Q is greater than 1, designated that investors place the higher market value of assets than the recorded value in terms of Tobin’s Q. This higher value is also suggested that sample firms should avail more investment opportunities as they worth more than the price they paid for them.
Table 1 also indicated that total debt ratio of the selected sample firms are relatively highly leveraged as the mean value of the TDR is around 60%. On average, 18% of the Pakistani non-financial firm’s assets are financed through long term debts whereas short term debt ratio (SDR) varies from 0% to 97%. The current study measures the business strategy through dummy variable; code 1 is assigned to the firms if they follow the cost leadership strategy otherwise 0. Similarly, the firms which follow the product differentiation strategy, the study allocates code 1 otherwise 0. The same coding is followed for the rest of two strategic choices of the firms i.e. hybrid strategy and unclear strategy. The descriptive statistics show that the non-financial firms of Pakistan mostly follow the cost leadership strategy for the accomplishment of their business goals as the mean value of the cost leadership strategy is 0.31. In addition, mean values also depicts that 19% (least preference) Pakistani firms adopt both strategies simultaneously (cost leadership strategy and product differentiation strategy) during the whole selected sample period.
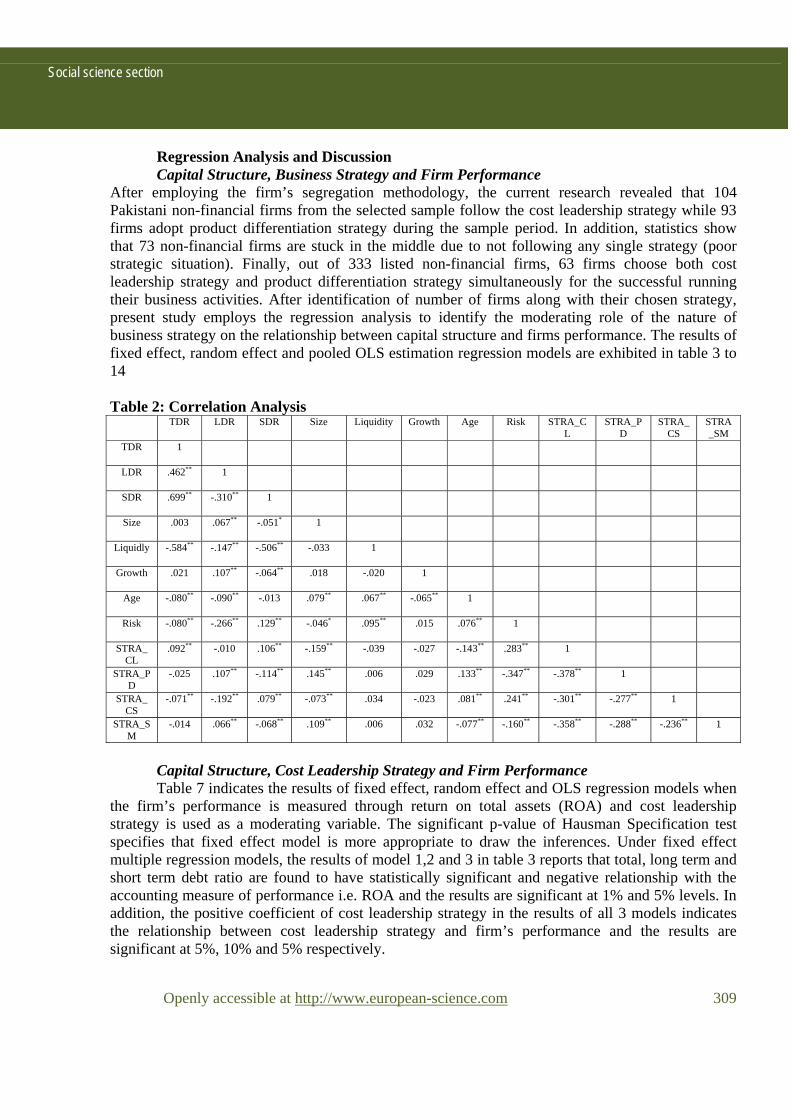
Correlation Analysis In order to exhibit the stability of the regression models, the present study applies the
standard technique of collinearity diagnostics. Table 2 portrays the outcomes of the person correlation analysis of the selected independent and control variables of the study and it is signified the non-existence of the multicolinearity issue between the variables as the reported correlation coefficients subsist under the threshold level i.e. 0.60 except the correlation between the total debt ratio (TDR) and short term debt ratio (SDR) which is around 0.69. However, it does not create multicolinearity as both independent variables TDR and SDR will regress separately in different regression models or will not consider in the same one single regression model.
Table 1: Descriptive Statistics
Variable Minimum Maximum Mean Std. Deviation ROA (%) -.23 .29 .0350 .08591 ROE (%) -.45 .61 .0783 .18002 Tobin’s Q (%) .21 1.63 1.08 .24144 TDR (%) .01 1.41 .5940 .19990 LDR (%) .00 .79 .1800 .15028 SDR (%) .00 .97 .4140 .18646 Size (Billions-PAK) 0.01 414.02 10.76 29.9865 Liquidity (%) .08 15.36 1.3898 1.36306 Growth (%) -1.46 9.55 .2268 .57344 Age (Years) 2 153 33.01 16.901 Risk (Z-Scores) .00 9.58 1.9328 .76660 SRTA_CL (Dummy) 0 1 .31 .465 STRA_PD (Dummy) 0 1 .28 .443 STRA_CS (Dummy) 0 1 .19 .385 STRA_SM (Dummy) 0 1 .22 .428 Firm-Year Observations = 2317
Social science section
Openly accessible at http://www.european-science.com 309
Regression Analysis and Discussion Capital Structure, Business Strategy and Firm Performance
After employing the firm’s segregation methodology, the current research revealed that 104 Pakistani non-financial firms from the selected sample follow the cost leadership strategy while 93 firms adopt product differentiation strategy during the sample period. In addition, statistics show that 73 non-financial firms are stuck in the middle due to not following any single strategy (poor strategic situation). Finally, out of 333 listed non-financial firms, 63 firms choose both cost leadership strategy and product differentiation strategy simultaneously for the successful running their business activities. After identification of number of firms along with their chosen strategy, present study employs the regression analysis to identify the moderating role of the nature of business strategy on the relationship between capital structure and firms performance. The results of fixed effect, random effect and pooled OLS estimation regression models are exhibited in table 3 to 14 Table 2: Correlation Analysis
TDR LDR SDR Size Liquidity Growth Age Risk STRA_CL
STRA_PD
STRA_CS
STRA_SM
TDR 1
LDR .462** 1
SDR .699** -.310** 1
Size .003 .067** -.051* 1
Liquidly -.584** -.147** -.506** -.033 1
Growth .021 .107** -.064** .018 -.020 1
Age -.080** -.090** -.013 .079** .067** -.065** 1
Risk -.080** -.266** .129** -.046* .095** .015 .076** 1
STRA_CL
.092** -.010 .106** -.159** -.039 -.027 -.143** .283** 1
STRA_PD
-.025 .107** -.114** .145** .006 .029 .133** -.347** -.378** 1
STRA_CS
-.071** -.192** .079** -.073** .034 -.023 .081** .241** -.301** -.277** 1
STRA_SM
-.014 .066** -.068** .109** .006 .032 -.077** -.160** -.358** -.288** -.236** 1
Capital Structure, Cost Leadership Strategy and Firm Performance Table 7 indicates the results of fixed effect, random effect and OLS regression models when
the firm’s performance is measured through return on total assets (ROA) and cost leadership strategy is used as a moderating variable. The significant p-value of Hausman Specification test specifies that fixed effect model is more appropriate to draw the inferences. Under fixed effect multiple regression models, the results of model 1,2 and 3 in table 3 reports that total, long term and short term debt ratio are found to have statistically significant and negative relationship with the accounting measure of performance i.e. ROA and the results are significant at 1% and 5% levels. In addition, the positive coefficient of cost leadership strategy in the results of all 3 models indicates the relationship between cost leadership strategy and firm’s performance and the results are significant at 5%, 10% and 5% respectively.

Talat Afza, Naveed Ahmed
Openly accessible at http://www.european-science.com 310
Cost leadership strategy is a lower cost competitive strategy entails the aggressive establishment of efficient scale amenities, tight control of overhead expenditures and the cost. As a result, lower costs not only permit to continue to earn profits but also attain market share of the business (Campbell et al., 2000; Balsam et al., 2011). In addition, table 3 shows that positive coefficients of the interaction terms between cost leadership strategy and all the measures of capital structure are positive with the performance measure i.e. ROA and all these relationships are statistically significant at 1% and 5% levels. It indicates that the relationship between capital structure and the firm’s performance is positively and significantly moderated by the cost leadership strategy. In other words, firms maintain high leverage while attempting to pursue a cost leadership strategy incurs a significant performance reward.
Table 3: Capital Structure, Cost Leadership Strategy and Firm Performance Fixed effect models, Random Effect Models and Ordinary Least Square Models of the Predictors of Return on Assets (ROA)
Variables Fixed Random OLS Model 1 Model 2 Model 3 Model 1 Model 2 Model 3 Model 1 Model 2 Model 3
Constant (3.04)*** 0.21
(0.89)* 0.06
(1.89)** 0.13
(-2.10)** -0.05
(-6.60)*** -0.17
(-4.07)*** -0.11
(-4.79)*** -0.08
(11.90)*** -0.19
(-8.16)*** -0.14
TRD (-9.38)*** -0.15
(-13.05)*** -0.16
(17.38)*** -0.17
STRA_CL
(0.39)** 0.02
(0.43)* 0.01
(0.56)** 0.02
TDR*STRA_CL
(1.55)*** 0.04
(0.54)* 0.01
(0.70)*** 0.03
LRD (-2.46)** -0.04
(-3.60)*** -0.05
(-5.95)*** -0.07
STRA_CL
(1.34)* 0.06
(0.39)* 0.02
(0.51)* 0.03
LDR*STRA_CL
(0.93)** 0.02
(0.77)* 0.02
(0.01)** 0.05
SRD (-6.12)*** -0.09
(-8.43)*** -0.11
(11.27)*** -0.12
STRA_CL
(0.85)* 0.04
(0.40)** 0.03
(0.88)* 0.04
SDR*STRA_CL
(0.58)** 0.05
(0.34)** 0.02
(0.59)*** 0.05
Size (2.04)** 0.03
(1.86)** 0.02
(1.81)** 0.01
(5.77)*** 0.01
(5.65)*** 0.01
(4.91)*** 0.01
(11.58)*** 0.01
(11.34)*** 0.01
(10.38)*** 0.01
Liquidity (3.56)*** 0.02
(8.04)*** 0.01
(3.74)*** 0.03
(3.19)*** 0.01
(11.02)*** 0.02
(5.21)*** 0.01
(2.97)*** 0.02
(14.98)*** 0.02
(7.38)*** 0.01
Growth (6.50)*** 0.03
(6.24)*** 0.02
(5.80)*** 0.02
(6.24)*** 0.01
(6.32)*** 0.01
(5.35)*** 0.01
(5.02)*** 0.01
(5.34)*** 0.01
(3.53)*** 0.01
Age (1.48)* 0.03
(2.76) 0.01
(1.37) 0.02
(1.38) 0.02
(0.76) 0.01
(0.81) 0.01
(2.43)** 0.02
(2.09)** 0.01
(1.56) 0.03
Risk (9.77)*** 0.04
(11.62)*** 0.04
(12.09)** 0.04
(14.74)*** 0.04
(15.08)*** 0.04
(16.98)*** 0.05
(19.05)*** 0.04
(16.51)*** 0.04
(21.21)*** 0.04
F value 64.67 44.80 51.28 819.11 543.59 637.24 160.89 108.93 125.98 Adjusted R2
0.17 0.07 0.13 0.36 0.27 0.30 0.36 0.27 0.30
Hausman test
0.0017 0.0021 0.0024 0.0017 0.0021 0.0024 - - -
Note: t-values are in parentheses (t-statistics) while ***, **, and * designate the level of significance at 1%, 5% and 10% respectively. STRA_CL is a cost leadership strategy of the firms and is measured through dummy variable i.e. code 1 is assigned if the firms are pursuing cost leadership strategy otherwise 0. The moderating variable TDR*STRA_CL is the interaction term between total debt ratio and cost leadership strategy while LDR*STRA_CL is the interaction term between long term debt ratio and cost leadership strategy. The moderating variable SDR*STRA_CL is also the interaction term between short term debt ratio and cost leadership strategy of the firms.

Social science section
Openly accessible at http://www.european-science.com 311
Model 1 includes total debt ratio (TDR) and cost leadership strategy of the firms (STRA_CL) as an explanatory variables and TDR*STRA_CL is a moderating variable whereas long term debt ratio (LDR), cost leadership strategy (STRA_CL) and the moderating variable LDR* STRA_CL are included in the model 2. Model 3 contains the SDR*STRA_CL as a moderating variable along with the short term debt ratio (SDR) and Cost leadership strategy (STRA_CL). The values of VIF of each variable are less than 4; ensure the absence of Multicolinearity in the regression models.
The firm which adopts cost leadership strategy needs to be more cost efficient than its counterparts, require tight control of overhead expenditures, avoidance of marginal customer accounts and minimization of cost in other different areas like sales force, services, R&D, advertisement etc. In this scenario, debt financing is considered a useful tool to accomplish these objectives of the firm as the firms managers become more efficient due to the monitoring role of debt providers (Jensen and Meckling 1976; Jordan et al.,1998; Jermias, 2008) which put pressure on them to avoid unnecessary overhead expenditures and produce cost effective products. In addition, restrictive covenants attached with the debt also reduce the free cash flow available for investments due to the periodic principal and interet payments; hence, debt financing limits the opportunistic behaviors of managers (Jensen, 1986) and refrains them from the investments in the risky projects.
In addition, almost consistent results have shown by the outcomes of all OLS which validate the outcome of fixed effect model. Consistent with the results of Table 3, positive and statistically significant coefficients of the interaction terms between capital structure and cost leadership strategy in all 3 models of table 4, describe that cost leadership strategy also positively influences the established relationship between capital structure and ROE of the selected non-financial firms of Pakistan. In addition to the accounting measures of performance, the present study is also employed the Q ratio to measure the firms market performance and the results of all regression models are displayed on Table 5. The interaction terms between cost leadership strategy and all measures of capital structure in all three models are also positive but statistically insignificant with the Q ratio. It indicates that when the firms try to maintain high debt ratio (either short, long term debt or combination of both) while attempting to pursue a strategy based of cost leadership sustain a positive but an insignificant market performance.
Capital Structure, Product Differentiation Strategy and Firms Performance The second category which the firms adopt to enhance their firms performance is a product
differentiation strategy. This strategy normally attempts to establish new products with distinguished physical characteristics and market opportunities through employing the latest scientific technology and as an outcome; the customers usually are willing to pay above than average prices due to the perceived significant differences in the features of the products. Tables 6 to 8 illustrate the outcomes of leverage-performance relationship and the moderating role of firm’s product differentiation strategy between the relationship of capital structure and firms performance. The results of table 6 specify that all measurement of capital structure i.e. TDR, LDR and SDR are significantly and negatively affects the firm’s performance. In addition, the results of all three fixed effect models indicate that if the firms adopt product differentiation strategy then it enhances their performance and the relationships are significant at 5%, 10% and 5% respectively.

Talat Afza, Naveed Ahmed
Openly accessible at http://www.european-science.com 312
Table 4: Capital Structure, Cost Leadership Strategy and Firm Performance Fixed effect models, Random Effect Models and Ordinary Least Square Models of the Predictors of Return on Equity (ROE)
Variables Fixed Random OLS Model 1 Model 2 Model 3 Model 1 Model 2 Model 3 Model 1 Model 2 Model 3 Constant (1.79)***
0.30 (0.94)**
0.16 (1.78)**
0.30 (-4.60)***
-0.28 (-7.28)***
-0.42 (-5.23)***
-0.32 (-8.72)***
-0.34 (12.55)***
-0.46 (-10.07)***
-0.39
TRD (-5.01)***
-0.21
(-6.44)*** -0.20
(-7.80)*** -0.19
STRA_CL (0.45)* 0.05
(0.32) 0.05
(1.10)* 0.03
TDR*STRA_CL (1.61)** 0.11
(0.23)* 0.07
(1.57)*** 0.06
LRD (-0.06)*** -0.04
(-1.39)** -0.05
(-3.38)*** -0.10
STRA_CL (1.46) 0.15
(0.70)* 0.03
(0.78)* 0.03
LDR*STRA_CL (0.02)* 0.06
(0.73)* 0.05
(1.58)* 0.09
SRD (-4.82)*** -0.19
(-4.98)*** -0.16
(-4.98)*** -0.13
STRA_CL (0.74)** 0.08
(0.69)* 0.02
(0.09)** 0.03
SDR*STRA_CL (1.20)** 0.07
(0.83)** 0.04
(0.38)*** 0.02
Size (0.95) 0.01
(1.34) 0.02
(1.24) 0.02
(6.31)*** 0.02
(6.34)*** 0.03
(5.71)*** 0.02
(11.97)*** 0.03
(12.01)*** 0.03
(11.22)*** 0.03
Liquidity (2.77)*** 0.02
(5.09)*** 0.02
(2.12)** 0.01
(2.35)** 0.01
(6.62)*** 0.02
(2.92)*** 0.01
(2.50)** 0.01
(8.17)*** 0.02
(4.41)*** 0.01
Growth (6.05)*** 0.03
(5.70)*** 0.03
(5.52)*** 0.03
(5.82)*** 0.03
(5.56)*** 0.03
(5.20)*** 0.03
(4.25)*** 0.03
(4.30)*** 0.03
(3.55)*** 0.02
Age (0.06) 0.03
(1.24) 0.01
(0.15) 0.02
(0.87) 0.01
(0.61) 0.01
(0.63) 0.01
(1.17) 0.02
(1.14) 0.01
(0.85) 0.03
Risk (8.81)*** 0.08
(10.62)*** 0.10
(10.31)*** 0.09
(13.62)*** 0.09
(14.27)*** 0.09
(15.00)*** 0.09
(17.51)*** 0.08
(16.29)*** 0.08
(18.34)*** 0.09
F value 36.69 29.47 35.87 445.14 379.22 422.02 81.64 73.19 75.93
Adjusted R2 0.09 0.05 0.08 0.23 0.21 0.22 0.23 0.21 0.22
Hausman test 0.0002 0.0039 0.0002 0.0002 0.0039 0.0002 - - -
Note: t-values are in parentheses (t-statistics) while ***, **, and * designate the level of significance at 1%, 5% and 10% respectively. STRA_CL is a cost leadership strategy of the firms and is measured through dummy variable i.e. code 1 is assigned if the firms are pursuing cost leadership strategy otherwise 0. The moderating variable TDR*STRA_CL is the interaction term between total debt ratio and cost leadership strategy while LDR*STRA_CL is the interaction term between long term debt ratio and cost leadership strategy. The moderating variable SDR*STRA_CL is also the interaction term between short term debt ratio and cost leadership strategy of the firms. Model 1 includes total debt ratio (TDR) and cost leadership strategy of the firms (STRA_CL) as an explanatory variables and TDR*STRA_CL is a moderating variable whereas long term debt ratio (LDR), cost leadership strategy (STRA_CL) and the moderating variable LDR* STRA_CL are included in the model 2. Model 3 contains the SDR*STRA_CL as a moderating variable along with the short term debt ratio (SDR) and Cost leadership strategy (STRA_CL). The values of VIF of each variable are less than 4; ensure the absence of Multicolinearity in the regression models.

Social science section
Openly accessible at http://www.european-science.com 313
Table 5: Capital Structure, Cost Leadership Strategy and Firm Performance Fixed effect models, Random Effect Models and Ordinary Least Square Models of the Predictors of Tobin’s Q
Variables
Fixed Random OLS
Model 1 Model 2 Model 3 Model 1 Model 2 Model 3 Model 1 Model 2 Model 3 Constant (11.35)***
1.97 (14.08)***
2.59 (13.16)***
0.40 (10.72)***
1.02 (15.30)***
1.44 (12.40)***
1.19 (6.47)***
0.35 (12.57)***
0.67 (10.43)***
0.57
TRD (15.44)*** 0.61
(15.68)*** 0.58
(13.11)*** 0.43
STRA_CL (0.06) 0.04
(3.85)*** 0.17
(6.16) 0.21
TDR*STRA_CL
(0.30) 0.06
(1.32) 0.08
(3.44) 0.18
LRD (3.13)*** 0.14
(3.34)*** 0.14
(7.13)*** 0.29
STRA_CL (0.10) 0.05
(3.72) 0.10
(3.82) 0.07
LDR*STRA_CL
(0.87) 0.06
(0.19) 0.07
(2.17) 0.16
SRD (10.44)*** 0.40
(10.80)*** 0.39
(6.13)*** 0.21
STRA_CL (0.34) 0.05
(3.98) 0.14
(8.41)*** 0.25
SDR*STRA_CL
(0.92) 0.06
(1.23) 0.07
(5.82) 0.36
Size (4.72)*** 0.06
(4.81)*** 0.07
(5.27)*** 0.07
(4.28)*** 0.03
(4.40)*** 0.03
(3.61)*** 0.02
(4.83)*** 0.02
(3.16)*** 0.01
(4.49) 0.01
Liquidity (3.91)*** 0.02
(-2.45)*** -0.01
(3.39)*** 0.02
(4.18)*** 0.02
(3.77)*** 0.02
(2.87)*** 0.01
(4.55)*** 0.02
(4.99)*** 0.02
(0.27) 0.03
Growth (0.98) 0.01
(-1.22) -0.01
(0.16) 0.01
(0.53) 0.02
(0.74) 0.03
(0.33) 0.02
(0.98) 0.01
(1.61) 0.01
(0.02) 0.02
Age (8.78)*** 0.02
(9.80)*** 0.02
(7.88)*** 0.02
(5.86)*** 0.01
(6.17)*** 0.01
(5.96)*** 0.02
(4.20)*** 0.03
(4.22)*** 0.02
(4.57)*** 0.03
Risk (6.66)*** 0.06
(3.60)*** 0.04
(3.24)*** 0.03
(7.75)*** 0.07
(4.95)*** 0.04
(4.43)*** 0.04
(13.30)*** 0.09
(13.58)*** 0.11
(10.60)*** 0.08
F value 92.61 46.01 63.77 498.46 113.05 290.57 63.43 32.81 42.81
Adjusted R2 0.05 0.03 0.02 0.12 0.02 0.06 0.19 0.11 0.13
Hausman Test 0.0000 0.0000 0.0000 0.0000 0.0000 0.0000 - - -
Note: t-values are in parentheses (t-statistics) while ***, **, and * designate the level of significance at 1%, 5% and 10% respectively. STRA_CL is a cost leadership strategy of the firms and is measured through dummy variable i.e. code 1 is assigned if the firms are pursuing cost leadership strategy otherwise 0. The moderating variable TDR*STRA_CL is the interaction term between total debt ratio and cost leadership strategy while LDR*STRA_CL is the interaction term between long term debt ratio and cost leadership strategy. The moderating variable SDR*STRA_CL is also the interaction term between short term debt ratio and cost leadership strategy of the firms. Model 1 includes total debt ratio (TDR) and cost leadership strategy of the firms (STRA_CL) as an explanatory variables and TDR*STRA_CL is a moderating variable whereas long term debt ratio (LDR), cost leadership strategy (STRA_CL) and the moderating variable LDR* STRA_CL are included in the model 2. Model 3 contains the SDR*STRA_CL as a moderating variable along with the short term debt ratio (SDR) and Cost leadership strategy (STRA_CL). The values of VIF of each variable are less than 4; ensure the absence of Multicolinearity in the regression models.

Talat Afza, Naveed Ahmed
Openly accessible at http://www.european-science.com 314
Table 6: Capital Structure, Product Differentiation Strategy and Firm Performance Fixed effect models, Random Effect Models and Ordinary Least Square Models of the Predictors of Return on Assets (ROA)
Variables
Fixed Random OLS
Model 1 Model 2 Model 3 Model 1 Model 2 Model 3 Model 1 Model 2 Model 3 Constant (2.97)***
0.20 (0.60)**
0.04 (1.72)**
0.11 (-2.10)**
-0.05 (-6.97)***
-0.18 (-4.26) -0.11
(-4.87)*** -0.08
(12.32)*** -0.20
(-8.58)*** -0.14
TRD (-10.84)** -0.17
(-13.44)***
-0.17
(-16.41)** -0.16
STRA_PD (0.26)** 0.05
(0.09)* 0.08
(0.38)** 0.12
TDR*STRA_PD (-0.44)*** -0.03
(-0.00)** -0.05
(-0.62)*** -0.06
LRD (-2.61)*** 0.04
(-3.63)*** -0.05
(-5.39)*** -0.07
STRA_PD (0.54)* 0.05
(0.82) 0.07
(0.75)* 0.09
LDR*STRA_ PD
(-0.77)** -0.02
(-0.08) -0.11
(-0.87)* -0.07
SRD (-7.16)*** -0.10
(-8.85)*** -0.10
(-10.85)** -0.12
STRA_PD (0.65)** 0.02
(0.22)** 0.04
(0.41)** 0.09
SDR*STRA_ PD
(-0.44)** -0.17
(-0.14)** -0.08
(-0.14)*** -0.12
Size (1.98)** 0.02
(1.82)*** 0.01
(1.76)*** 0.01
(5.85)*** 0.01
(5.87)*** 0.01
(5.00)*** 0.01
(11.59)*** 0.03
(11.69)*** 0.01
(10.63)*** 0.01
Liquidity (3.51)*** 0.01
(8.10)*** 0.02
(3.72)*** 0.01
(3.18)*** 0.02
(11.11)*** 0.02
(5.22)*** 0.01
(2.96)*** 0.01
(15.08)*** 0.02
(7.41)*** 0.01
Growth (6.44)*** 0.01
(6.41)*** 0.01
(5.78)*** 0.01
(6.24)*** 0.01
(6.35)*** 0.01
(5.39)*** 0.01
(5.04)*** 0.01
(5.37)*** 0.01
(3.61)*** 0.01
Age (1.50) 0.02
(2.73)* 0.01
(1.31) 0.01
(1.33) 0.01
(0.71) 0.01
(0.69) 0.01
(2.40)* 0.03
(2.02)** 0.01
(1.34) 0.02
Risk (10.07)*** 0.04
(11.64)*** 0.04
(12.22)*** 0.04
(14.70)*** 0.04
(14.86)*** 0.04
(16.75)*** 0.04
(18.58)*** 0.04
(16.12)*** 0.04
(20.42)*** 0.04
F value 73.36 50.81 58.43 818.56 542.67 636.39 160.91 108.96 125.85
Adjusted R2 0.20 0.09 0.16 0.36 0.27 0.30 0.36 0.27 0.30
Hausman test 0.0037 0.0020 0.0027 0.0033 0.0020 0.0008 - - -
Note: t-values are in parentheses (t-statistics) while ***, **, and * designate the level of significance at 1%, 5% and 10% respectively. STRA_PD is a product differentiation strategy of the firms and is measured through dummy variable i.e. code 1 is assigned if the firms are pursuing product differentiation strategy otherwise 0. The moderating variable TDR*STRA_PD is the interaction term between total debt ratio and product differentiation strategy while LDR*STRA_PD is the interaction term between long term debt ratio and product differentiation strategy. The moderating variable SDR*STRA_PD is also the interaction term between short term debt ratio and product differentiation strategy of the firms. Model 1 includes total debt ratio (TDR) and product differentiation strategy of the firms (STRA_PD) as an explanatory variables and TDR*STRA_PD is a moderating variable whereas long term debt ratio (LDR), product differentiation strategy (STRA_PD) and the moderating variable LDR* STRA_PD are included in the model 2. Model 3 contains the SDR*STRA_PD as a moderating variable along with the short term debt ratio (SDR) and Product differentiation strategy (STRA_PD). The values of VIF of each variable are less than 4; ensure the absence of Multicolinearity in the regression models.

Social science section
Openly accessible at http://www.european-science.com 315
Table 7: Capital Structure, Product Differentiation Strategy and Firm Performance Fixed effect models, Random Effect Models and Ordinary Least Square Models of the Predictors of Return on Equity (ROE) Variables
Fixed Random OLS
Model 1 Model 2 Model 3 Model 1 Model 2 Model 3 Model 1 Model 2 Model 3 Constant (1.69)**
0.27 (0.61)**
0.09 (1.71)***
0.28 (-4.69)***
-0.28 (-7.35)**
-0.42 (-5.34)***
-0.32 (-8.84)***
-0.35 (12.34)***
-0.45 (10.39)***
-0.40
TRD (6.12)*** -0.24
(-6.40)*** -0.19
(-6.45)*** -0.16
STRA_PD (0.52)** 0.04
(0.37)* 0.07
(0.77)** 0.06
TDR*STRA_PD (-0.32)** -0.02
(-0.83)* -0.08
(-1.36)** -0.05
LRD (-0.05)** -0.08
(-1.29)* -0.09
(-2.88)*** -0.09
STRA_PD (0.23)* 0.05
(0.64)* 0.07
(-1.05)** -0.07
LDR*STRA_ PD
(-0.33)** -0.03
(-0.51)* -0.03
(0.68)* 0.04
SRD (-5.04)*** -0.15
(-5.04)*** -0.15
(-3.93)*** -0.10
STRA_PD (1.56)** 0.06
(0.93)** 0.06
(1.15)** 0.05
SDR*STRA_ PD
(-1.35)** -0.09
(-1.69)** -0.09
(-1.99)*** -0.09
Size (0.92) 0.01
(1.27) 0.02
(1.26) 0.02
(6.39)*** 0.02
(6.35) 0.02
(5.68)*** 0.02
(11.88)*** 0.03
(11.88)*** 0.03
(11.19)*** 0.03
Liquidity (2.67)*** 0.01
(5.09)*** 0.03
(1.84)*** 0.01
(2.32)*** 0.01
(6.62)*** 0.02
(2.75)*** 0.01
(2.44)*** 0.03
(8.06)*** 0.02
(4.31)*** 0.01
Growth (6.02)*** 0.03
(5.69)*** 0.03
(5.53)*** 0.03
(5.87)*** 0.03
(5.59)*** 0.03
(5.25)*** 0.03
(4.30)*** 0.03
(4.28)*** 0.03
(3.61)*** 0.02
Age (0.09) 0.01
(1.17) 0.01
(0.16) 0.01
(0.78) 0.02
(0.47) 0.01
(0.44) 0.01
(1.13) 0.03
(1.01) 0.02
(0.69) 0.02
Risk (9.12)*** 0.08
(10.61)*** 0.09
(10.58)*** 0.09
(13.50)*** 0.09
(13.89)*** 0.09
(14.94)*** 0.09
(16.94)*** 0.08
(15.83)*** 0.08
(17.82)*** 0.09
F value 41.30 33.37 40.88 446.70 378.96 426.05 81.60 72.91 76.72
Adjusted R2 0.14 0.09 0.12 0.32 0.21 0.22 0.23 0.21 0.22
Hausman test 0.0003 0.0047 0.0002 0.0035 0.0047 0.0002 - - -
Note: t-values are in parentheses (t-statistics) while ***, **, and * designate the level of significance at 1%, 5% and 10% respectively. STRA_PD is a product differentiation strategy of the firms and is measured through dummy variable i.e. code 1 is assigned if the firms are pursuing product differentiation strategy otherwise 0. The moderating variable TDR*STRA_PD is the interaction term between total debt ratio and product differentiation strategy while LDR*STRA_PD is the interaction term between long term debt ratio and product differentiation strategy. The moderating variable SDR*STRA_PD is also the interaction term between short term debt ratio and product differentiation strategy of the firms. Model 1 includes total debt ratio (TDR) and product differentiation strategy of the firms (STRA_PD) as an explanatory variables and TDR*STRA_PD is a moderating variable whereas long term debt ratio (LDR), product differentiation strategy (STRA_PD) and the moderating variable LDR* STRA_PD are included in the model 2. Model 3 contains the SDR*STRA_PD as a moderating variable along with the short term debt ratio (SDR) and Product differentiation strategy (STRA_PD). The values of VIF of each variable are less than 4; ensure the absence of Multicolinearity in the regression models.

Talat Afza, Naveed Ahmed
Openly accessible at http://www.european-science.com 316
As the firms differentiation strategy focus on R&D activities, distinguished physical characteristics of the products, brand image and advertising intensity, so they charge premium prices and earns higher profit margins (Chaganti et al.,1989). Porter (1980) also claimed that the product differentiation strategy of the firms is more likely to produce higher return on investments or profits than the cost leader firms as a product differentiation creates the better entry barrier. Consistent with the expectations, the outcomes of table 6 also illustrates that all the coefficients moderating variables (interaction term between product differentiation and all measures of leverage) are negative and statistically significant at 1% and 5% levels respectively, designate that product differentiation strategy negatively and significantly moderated the relationship between all proxies of capital structure and firms value. It indicates that firms maintain either high total, long or short term debt ratio while attempting to peruse a strategy based on product differentiation incur a significant performance penalty. These outcomes also specify that as firms pursue a product differentiation strategy, the benefit of debt financing becomes decreases. Table 8: Capital Structure, Product Differentiation Strategy and Firm Performance Fixed effect models, Random Effect Models and Ordinary Least Square Models of the Predictors of Tobin’s Q
Variables Fixed Random OLS
Model 1 Model 2 Model 3 Model 1 Model 2 Model 3 Model 1 Model 2 Model 3 Constant (11.58)***
1.98 (14.60)***
2.57 (13.63)***
2.35 (10.12)***
0.97 (15.18)***
1.43 (11.97)***
1.16 (5.43)***
0.30 (11.79)***
0.63 (8.40)***
0.46
TRD (16.58)*** 0.62
(17.16)*** 0.62
(12.68)*** 0.42
STRA_PD (0.78)** 0.03
(2.03)* 0.09
(0.50)** 0.07
TDR*STRA_PD (-1.04)* -0.07
(-0.65) -0.04
(-2.17)** -0.11
LRD (2.68)*** 0.11
(1.60)*** 0.07
(2.77)** 0.11
STRA_PD (1.34)* 0.07
(0.02)** 0.08
(1.00)** 0.02
LDR*STRA_ PD
(-2.06)* -0.16
(3.43)* 0.26
(-4.67)*** -0.33
SRD (11.61)*** 0.41
(13.39)*** 0.46
(9.22)*** 0.33
STRA_PD (1.43)* 0.08
(3.86)** 0.14
(3.43)* 0.09
SDR*STRA_ PD
(-2.12)** -0.14
(-2.82)* -0.18
(-1.62)** -0.09
Size (-4.79)** -0.06
(-4.70)*** -0.07
(-5.31)*** -0.07
(-4.45)* -0.03
(-4.55) -0.03
(-3.97) -0.03
(-5.03)** -0.02
(-3.87)** -0.01
(-4.98)***
-0.02
Liquidity (3.87)*** 0.02
(2.57)*** 0.01
(3.10)*** 0.03
(4.18)*** 0.02
(3.79)** 0.02
(2.75) 0.01
(4.37) 0.02
(4.70)*** 0.02
(0.47)* 0.00
Growth (0.97)*** 0.01
(1.23)*** 0.01
(0.17)** 0.02
(0.38)*** 0.01
(0.62)*** 0.02
(0.46) 0.01
(-0.68) -0.01
(1.24)*** 0.01
(0.33)* 0.02
Age (8.70)* 0.02
(9.88) 0.02
(7.83)* 0.02
(5.65) 0.01
(5.89) 0.02
(3.98) 0.03
(3.25)** 0.02
(3.35)* 0.01
(4.03)** 0.01
Risk (6.85)*** 0.06
(3.58)*** 0.04
(3.45)*** 0.03
(7.17)** 0.06
(4.33)*** 0.04
(3.98)*** 0.03
(11.15)*** 0.08
(11.54)** 0.09
(8.64)*** 0.07
F value 106.09 53.20 73.54 480.01 114.84 289.76 52.42 27.85 32.17
Adjusted R2 0.08 0.03 0.05 0.09 0.02 0.04 0.16 0.09 0.10
Hausman test 0.0000 0.0000 0.0306 0.0000 0.0000 0.0306 - - -

Social science section
Openly accessible at http://www.european-science.com 317
Note: t-values are in parentheses (t-statistics) while ***, **, and * designate the level of significance at 1%, 5% and 10% respectively. STRA_PD is a product differentiation strategy of the firms and is measured through dummy variable i.e. code 1 is assigned if the firms are pursuing product differentiation strategy otherwise 0. The moderating variable TDR*STRA_PD is the interaction term between total debt ratio and product differentiation strategy while LDR*STRA_PD is the interaction term between long term debt ratio and product differentiation strategy. The moderating variable SDR*STRA_PD is also the interaction term between short term debt ratio and product differentiation strategy of the firms. Model 1 includes total debt ratio (TDR) and product differentiation strategy of the firms (STRA_PD) as an explanatory variables and TDR*STRA_PD is a moderating variable whereas long term debt ratio (LDR), product differentiation strategy (STRA_PD) and the moderating variable LDR* STRA_PD are included in the model 2. Model 3 contains the SDR*STRA_PD as a moderating variable along with the short term debt ratio (SDR) and Product differentiation strategy (STRA_PD). The values of VIF of each variable are less than 4; ensure the absence of Multicolinearity in the regression models
As product Differentiation Strategy of the firm comprises the creation of the products and
services with the unique characteristics i.e. technology, quality, design, features and brand image etc., spend heavily in R&D activities and charge premium prices than its counterparts (Cross, 1999; Hyatt, 2001). Therefore, more debt financing along with its covenants is probable to impede innovation, qualities and creativity of the firm’s managers which is required for the achieving the competitive advantage as a product differentiators (Simerly and Li, 2000). Furthermore, asset financing through debt is also considered as an obstruction for the product differentiators because it also create the conflict of interests between the creditors and firms managers. These results are consistent with the seminal research work of O’Brien (2003) and Jermias (2008).
In addition, the results of OLS regression models also show that the coefficients of TDR*STRA_PD, LDR*STRA_PD, SDR*STRA_PD are negative and statistically significant at 1%, 10% and 1% levels, confirms the results of fixed effect models. The results of table 7 indicate that the relationship directions and significance level of the selected independent, moderating and control variables are almost similar, indicates the consistency of the leverage-performance and moderating relationship among all accounting measures of the performance. In addition, debt financing is also harmful for the market value of the firms while pursuing the product differentiation strategy as depicted in table 8.
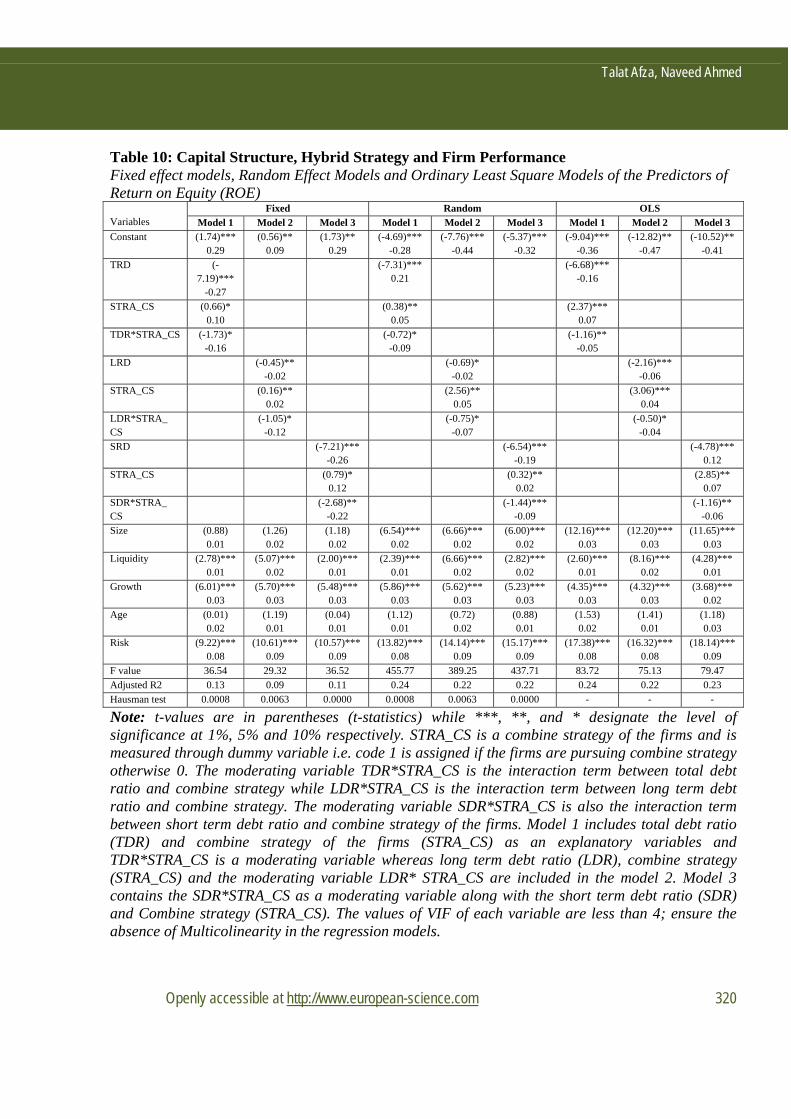
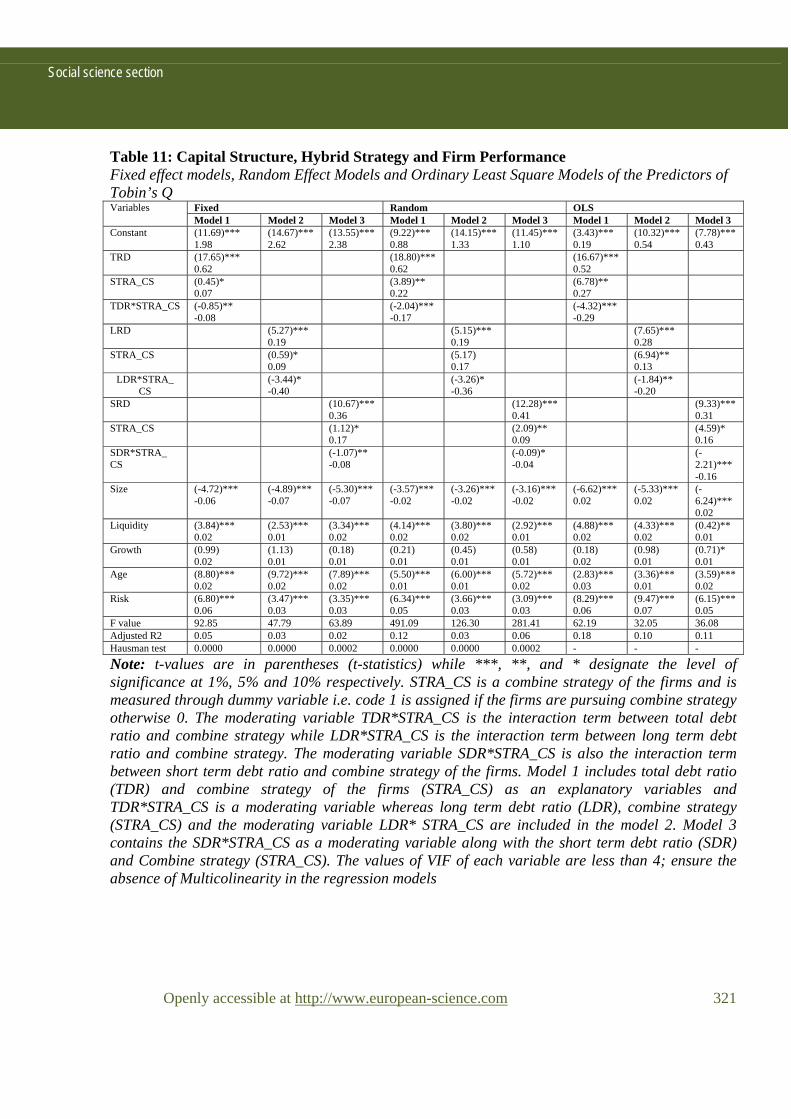
Capital Structure, Hybrid Strategy and Firms Performance Another contribution of the current study is to examine that whether the selected hybrid
strategy of the firms moderate the relationship between capital structure and firm’s performance and the outcomes are depicted from table 9 to 11. Table 9 shows that TDR, LDR and SDR are significantly and negative related with the firms performance. In addition, positive coefficient of variable combine strategy shows that the firm’s performance significantly and positively affected when the firms tries to adopt both business strategies (Differentiation Strategy and Cost Leadership Strategy) simultaneously.
Hill (1988) and Parnell (2000) stated that these two approaches are not necessarily mutually exclusive and many business ventures start with the differentiation strategy and integrate low costs as they grow and develop economies of scale with the passage of time. Certainly, hybrid strategy is feasible to attain and can be quite effective in terms of generate high margins or profits due to premium prices and low product costs. In addition, hybrid strategy is less vulnerable to the risks attached with the adaptation of pure “Single” strategy (Miller, 1988; Wright et al, 1991).

Talat Afza, Naveed Ahmed
Openly accessible at http://www.european-science.com 318
Barney (2002) and Barney & Hesterley (2006) also illustrated that the firms which successful implementing both strategies simultaneously gained continual competitive advantage in the market place. Our results are consistent with many studies who also have illustrated the positive relationship between hybrid business strategy and firms performance (Wright et al. 1991; Hlavacka et al., 2001; Koo et al., 2004; Kim et al. 2004). Moreover, the results of table 9 indicates that the interaction term between all measures of capital structure and combine strategy is significant and negative, indicates that combine business strategy negatively moderated the relationship between capital structure and firms performance. It shows that when firms try to adopt both strategies simultaneously while maintaining the high debt ratio incur the performance penalty.
As the firms try to pursue mixed strategies in chorus, so at the one end, debt financing make firms manager more efficient and reduces their opportunistic behavior due to restrictive covenants imposed by lenders and this situation may creates tight control of overhead expenditures and the cost and produce efficiency but on the other hand, firms try to become product differentiators also, so the benefits of debt financing becomes lessen because more leverage impede managers from R&D activities, intensive advertisement expenditures and from high riskier business investments etc. for getting the premium prices. Therefore, high debt financing negatively impact the firm’s performance while pursuing both the strategies simultaneously. Table 10 and table 11 also illustrate almost consistent results related to the moderating effects.
Capital Structure, Unclear Strategy and Firms Performance Another strategic structure is “unclear strategy” or “stuck in the middle” which occurs when
the firms fail to implement or adopt any single strategy between cost leadership strategy and product differentiation strategy i.e. unclear strategy or poor strategic situation. In other words, a firm that tries to employ one of the generic business strategies but fails to achieve any of them is considered as “Stuck in the Middle”. The current study is also investigated the impact of stuck in middle firms on their firms performance along with moderating role of these firms on the relationship between capital structure and firms performance
Table 12 shows that all measures of capital structure are negatively and significantly related with the firm’s performance except the outcomes when dependent variable is measured through Q ratio. The results also indicate that unclear strategic situation of the firms inversely and significantly affected the performance in all three models. The firms with unclear strategy or “Stuck in the Middle” firms are basically failed to emphasis on either on cost leadership strategy or product differentiation strategy and this poor strategic situation is harmful for the health of the firms (Porter 1980; Kim et al., 2004; Nandakumar et al., 2011; Ghobadian; Huang, 2001; Powers and Hahn, 2004; Torgovicky et al., 2005). In addition, the interaction term of SM and all measures of leverage is negative, show that unclear strategic situation of the firms is negatively moderated the relationship between capital structure and firms performance, however the results of this moderated relationship are statistically insignificant in all three models. In other words, when firms try to maintain high leverage while having unclear strategic situation, incur the significant performance penalty. The results of OLS regression models are also consistent with the results of fixed effect model in terms of significance level and relationship directions. The outcomes of tables 13 to 14 illustrates the almost consistent findings with the table 12 and validate that unclear strategic situation are not beneficial for the financial health of the firms and all kinds of debt financing also insignificantly declines the performance in the presence of unclear strategic situation of the firms.

Social science section
Openly accessible at http://www.european-science.com 319
Table 9: Capital Structure, Hybrid Strategy and Firm Performance Fixed effect models, Random Effect Models and Ordinary Least Square Models of the Predictors of Return on Assets (ROA) Variables Fixed Random OLS
Model 1 Model 2 Model 3 Model 1 Model 2 Model 3 Model 1 Model 2 Model 3 Constant (2.87)***
0.19 (0.53)*** 0.11
(1.71)** 0.12
(-2.81)*** -0.07
(-7.29)*** -0.19
(-4.73)*** -0.12
(-6.22)*** -0.10
(-12.84)** -0.20
(-9.52)*** -0.16
TRD (-11.27)** -0.16
(-13.57)** -0.15
(-15.72)** -0.15
STRA_CS (0.40)** 0.03
(3.48)*** 0.06
(6.20)*** 0.07
TDR*STRA_CS (-0.87)** -0.05
(-2.73)*** -0.07
( -5.19)** -0.10
LRD (-3.12)*** -0.05
(-3.97)*** -0.05
(-5.42)*** -0.06
STRA_CS (0.18)* 0.06
(2.48)*** 0.05
(4.33)*** 0.04
LDR*STRA_CS (-0.76)* -0.08
(-1.28) -0.09
(-2.24)*** -0.07
SDR (-7.33)*** -0.10
(-8.87)*** -0.10
(-10.12)** -0.10
STRA_CS (0.08)* 0.06
(2.68)*** 0.04
(6.31)*** 0.06
SDR*STRA_ CS
(-0.55)** -0.09
(-1.19) -0.03
(-4.50)*** -0.10
Size (2.02)*** 0.01
(1.81)** 0.02
(1.77)** 0.01
(6.35)*** 0.01
(6.21)*** 0.01
(5.43)*** 0.01
(12.47)*** 0.01
(12.19)*** 0.01
(11.36)*** 0.01
Liquidity (3.43)*** 0.01
(8.07)*** 0.01
(3.70)*** 0.01
(3.17)*** 0.01
(11.15)*** 0.02
(5.24)*** 0.01
(3.21)*** 0.02
(15.13)*** 0.02
(7.41)*** 0.01
Growth (6.46)*** 0.02
(6.42)*** 0.02
(5.78)*** 0.01
(6.32)*** 0.01
(6.43)*** 0.01
(5.42)*** 0.01
(5.24)*** 0.01
(5.47)*** 0.01
(3.82)*** 0.01
Age (1.54) 0.02
(2.76)* 0.01
(1.33) 0.01
(1.43) 0.01
(0.82) 0.01
(0.89) 0.03
(2.40)*** 0.04
(-2.24)*** -0.01
(-1.51) -0.02
Risk (10.09)*** 0.04
(11.62)*** 0.04
(12.24)*** 0.04
(14.93)*** 0.04
(14.84)*** 0.04
(16.88)*** 0.04
(18.77)*** 0.04
(16.01)*** 0.03
(20.36)*** 0.04
F value 64.24 44.43 51.12 846.19 552.54 659.92 169.10 112.30 135.05 Adjusted R2 0.20 0.09 0.16 0.37 0.23 0.31 0.37 0.28 0.31 Hausman test 0.0024 0.0011 0.0001 0.0024 0.0011 0.0001 - -
Note: t-values are in parentheses (t-statistics) while ***, **, and * designate the level of significance at 1%, 5% and 10% respectively. STRA_CS is a combine strategy of the firms and is measured through dummy variable i.e. code 1 is assigned if the firms are pursuing combine strategy otherwise 0. The moderating variable TDR*STRA_CS is the interaction term between total debt ratio and combine strategy while LDR*STRA_CS is the interaction term between long term debt ratio and combine strategy. The moderating variable SDR*STRA_CS is also the interaction term between short term debt ratio and combine strategy of the firms. Model 1 includes total debt ratio (TDR) and combine strategy of the firms (STRA_CS) as an explanatory variables and TDR*STRA_CS is a moderating variable whereas long term debt ratio (LDR), combine strategy (STRA_CS) and the moderating variable LDR* STRA_CS are included in the model 2. Model 3 contains the SDR*STRA_CS as a moderating variable along with the short term debt ratio (SDR) and Combine strategy (STRA_CS). The values of VIF of each variable are less than 4; ensure the absence of Multicolinearity in the regression models.
Talat Afza, Naveed Ahmed
Openly accessible at http://www.european-science.com 320
Table 10: Capital Structure, Hybrid Strategy and Firm Performance Fixed effect models, Random Effect Models and Ordinary Least Square Models of the Predictors of Return on Equity (ROE) Variables
Fixed Random OLS
Model 1 Model 2 Model 3 Model 1 Model 2 Model 3 Model 1 Model 2 Model 3 Constant (1.74)***
0.29 (0.56)**
0.09 (1.73)**
0.29 (-4.69)***
-0.28 (-7.76)***
-0.44 (-5.37)***
-0.32 (-9.04)***
-0.36 (-12.82)**
-0.47 (-10.52)**
-0.41
TRD (-7.19)***
-0.27
(-7.31)*** 0.21
(-6.68)*** -0.16
STRA_CS (0.66)* 0.10
(0.38)** 0.05
(2.37)*** 0.07
TDR*STRA_CS (-1.73)* -0.16
(-0.72)* -0.09
(-1.16)** -0.05
LRD (-0.45)** -0.02
(-0.69)* -0.02
(-2.16)*** -0.06
STRA_CS (0.16)** 0.02
(2.56)** 0.05
(3.06)*** 0.04
LDR*STRA_ CS
(-1.05)* -0.12
(-0.75)* -0.07
(-0.50)* -0.04
SRD (-7.21)*** -0.26
(-6.54)*** -0.19
(-4.78)*** 0.12
STRA_CS (0.79)* 0.12
(0.32)** 0.02
(2.85)** 0.07
SDR*STRA_ CS
(-2.68)** -0.22
(-1.44)*** -0.09
(-1.16)** -0.06
Size (0.88) 0.01
(1.26) 0.02
(1.18) 0.02
(6.54)*** 0.02
(6.66)*** 0.02
(6.00)*** 0.02
(12.16)*** 0.03
(12.20)*** 0.03
(11.65)*** 0.03
Liquidity (2.78)*** 0.01
(5.07)*** 0.02
(2.00)*** 0.01
(2.39)*** 0.01
(6.66)*** 0.02
(2.82)*** 0.02
(2.60)*** 0.01
(8.16)*** 0.02
(4.28)*** 0.01
Growth (6.01)*** 0.03
(5.70)*** 0.03
(5.48)*** 0.03
(5.86)*** 0.03
(5.62)*** 0.03
(5.23)*** 0.03
(4.35)*** 0.03
(4.32)*** 0.03
(3.68)*** 0.02
Age (0.01) 0.02
(1.19) 0.01
(0.04) 0.01
(1.12) 0.01
(0.72) 0.02
(0.88) 0.01
(1.53) 0.02
(1.41) 0.01
(1.18) 0.03
Risk (9.22)*** 0.08
(10.61)*** 0.09
(10.57)*** 0.09
(13.82)*** 0.08
(14.14)*** 0.09
(15.17)*** 0.09
(17.38)*** 0.08
(16.32)*** 0.08
(18.14)*** 0.09
F value 36.54 29.32 36.52 455.77 389.25 437.71 83.72 75.13 79.47
Adjusted R2 0.13 0.09 0.11 0.24 0.22 0.22 0.24 0.22 0.23
Hausman test 0.0008 0.0063 0.0000 0.0008 0.0063 0.0000 - - -
Note: t-values are in parentheses (t-statistics) while ***, **, and * designate the level of significance at 1%, 5% and 10% respectively. STRA_CS is a combine strategy of the firms and is measured through dummy variable i.e. code 1 is assigned if the firms are pursuing combine strategy otherwise 0. The moderating variable TDR*STRA_CS is the interaction term between total debt ratio and combine strategy while LDR*STRA_CS is the interaction term between long term debt ratio and combine strategy. The moderating variable SDR*STRA_CS is also the interaction term between short term debt ratio and combine strategy of the firms. Model 1 includes total debt ratio (TDR) and combine strategy of the firms (STRA_CS) as an explanatory variables and TDR*STRA_CS is a moderating variable whereas long term debt ratio (LDR), combine strategy (STRA_CS) and the moderating variable LDR* STRA_CS are included in the model 2. Model 3 contains the SDR*STRA_CS as a moderating variable along with the short term debt ratio (SDR) and Combine strategy (STRA_CS). The values of VIF of each variable are less than 4; ensure the absence of Multicolinearity in the regression models.
Social science section
Openly accessible at http://www.european-science.com 321
Table 11: Capital Structure, Hybrid Strategy and Firm Performance Fixed effect models, Random Effect Models and Ordinary Least Square Models of the Predictors of Tobin’s Q Variables Fixed Random OLS
Model 1 Model 2 Model 3 Model 1 Model 2 Model 3 Model 1 Model 2 Model 3 Constant (11.69)***
1.98 (14.67)*** 2.62
(13.55)*** 2.38
(9.22)*** 0.88
(14.15)*** 1.33
(11.45)*** 1.10
(3.43)*** 0.19
(10.32)*** 0.54
(7.78)*** 0.43
TRD (17.65)*** 0.62
(18.80)*** 0.62
(16.67)*** 0.52
STRA_CS (0.45)* 0.07
(3.89)** 0.22
(6.78)** 0.27
TDR*STRA_CS (-0.85)** -0.08
(-2.04)*** -0.17
(-4.32)*** -0.29
LRD (5.27)*** 0.19
(5.15)*** 0.19
(7.65)*** 0.28
STRA_CS (0.59)* 0.09
(5.17) 0.17
(6.94)** 0.13
LDR*STRA_ CS
(-3.44)* -0.40
(-3.26)* -0.36
(-1.84)** -0.20
SRD (10.67)*** 0.36
(12.28)*** 0.41
(9.33)*** 0.31
STRA_CS (1.12)* 0.17
(2.09)** 0.09
(4.59)* 0.16
SDR*STRA_ CS
(-1.07)** -0.08
(-0.09)* -0.04
(-2.21)*** -0.16
Size (-4.72)*** -0.06
(-4.89)*** -0.07
(-5.30)*** -0.07
(-3.57)*** -0.02
(-3.26)*** -0.02
(-3.16)*** -0.02
(-6.62)*** 0.02
(-5.33)*** 0.02
(-6.24)*** 0.02
Liquidity (3.84)*** 0.02
(2.53)*** 0.01
(3.34)*** 0.02
(4.14)*** 0.02
(3.80)*** 0.02
(2.92)*** 0.01
(4.88)*** 0.02
(4.33)*** 0.02
(0.42)** 0.01
Growth (0.99) 0.02
(1.13) 0.01
(0.18) 0.01
(0.21) 0.01
(0.45) 0.01
(0.58) 0.01
(0.18) 0.02
(0.98) 0.01
(0.71)* 0.01
Age (8.80)*** 0.02
(9.72)*** 0.02
(7.89)*** 0.02
(5.50)*** 0.01
(6.00)*** 0.01
(5.72)*** 0.02
(2.83)*** 0.03
(3.36)*** 0.01
(3.59)*** 0.02
Risk (6.80)*** 0.06
(3.47)*** 0.03
(3.35)*** 0.03
(6.34)*** 0.05
(3.66)*** 0.03
(3.09)*** 0.03
(8.29)*** 0.06
(9.47)*** 0.07
(6.15)*** 0.05
F value 92.85 47.79 63.89 491.09 126.30 281.41 62.19 32.05 36.08 Adjusted R2 0.05 0.03 0.02 0.12 0.03 0.06 0.18 0.10 0.11 Hausman test 0.0000 0.0000 0.0002 0.0000 0.0000 0.0002 - - -
Note: t-values are in parentheses (t-statistics) while ***, **, and * designate the level of significance at 1%, 5% and 10% respectively. STRA_CS is a combine strategy of the firms and is measured through dummy variable i.e. code 1 is assigned if the firms are pursuing combine strategy otherwise 0. The moderating variable TDR*STRA_CS is the interaction term between total debt ratio and combine strategy while LDR*STRA_CS is the interaction term between long term debt ratio and combine strategy. The moderating variable SDR*STRA_CS is also the interaction term between short term debt ratio and combine strategy of the firms. Model 1 includes total debt ratio (TDR) and combine strategy of the firms (STRA_CS) as an explanatory variables and TDR*STRA_CS is a moderating variable whereas long term debt ratio (LDR), combine strategy (STRA_CS) and the moderating variable LDR* STRA_CS are included in the model 2. Model 3 contains the SDR*STRA_CS as a moderating variable along with the short term debt ratio (SDR) and Combine strategy (STRA_CS). The values of VIF of each variable are less than 4; ensure the absence of Multicolinearity in the regression models

Talat Afza, Naveed Ahmed
Openly accessible at http://www.european-science.com 322
Table 12: Capital Structure, Unclear Strategy and Firm Performance Fixed effect models, Random Effect Models and Ordinary Least Square Models of the Predictors of Return on Assets (ROA) Variables Fixed Random OLS
Model 1 Model 2 Model 3 Model 1 Model 2 Model 3 Model 1 Model 2 Model 3 Constant (3.34)***
0.22 (0.62)**
0.04 (2.02)***
0.14 (-1.64) -0.04
(-7.01) -0.18
(-4.08)*** -0.11
(-4.09)*** -0.07
(-12.08)*** -0.19
(-8.51)*** -0.14
TRD (-11.41)** -0.18
(-14.70)*** -0.18
(-18.47)** -0.18
STRA_SM
(-1.73)*** -0.08
(-3.57)*** -0.05
(-5.10)*** -0.05
TDR*STRA_SM
(1.75) 0.05
(2.27) 0.05
(-3.08)* -0.05
LRD (-2.83)*** -0.05
(-4.93)*** -0.07
(-8.26)*** -0.10
STRA_SM
(-0.51)* -0.02
(-3.26)* -0.03
(-7.12)** -0.04
LDR*STRA_ SM
(-0.32) -0.01
(-1.61) -0.04
(-4.39) -0.10
SRD (-7.73)*** -0.12
(-9.30)*** -0.12
(-10.96)** -0.12
STRA_SM
(-1.30)* -0.06
(-3.15)** -0.03
(-3.06)*** -0.02
SDR*STRA_ SM
(2.15) 0.05
(-1.38) -0.03
(0.21) 0.02
Size (2.06)*** 0.01
(1.77)** 0.01
(1.83)** 0.01
(6.19)*** 0.01
(6.34)*** 0.01
(5.38)*** 0.01
(12.23)** 0.01
(12.32)*** 0.01
(11.36)** 0.01
Liquidity (3.41)*** 0.01
(8.09)*** 0.01
(3.64)*** 0.01
(3.13)*** 0.02
(11.24)** 0.02
(5.24)*** 0.01
(2.95)*** 0.01
(15.22)*** 0.02
(7.52)*** 0.01
Growth (6.49)*** 0.01
(6.40)*** 0.02
(5.81)*** 0.01
(6.37)*** 0.01
(6.44)*** 0.01
(5.48)*** 0.01
(5.32)*** 0.01
(5.56)*** 0.01
(3.81)*** 0.01
Age (1.47) 0.02
(2.71)* 0.01
(1.37) 0.01
(1.68)* 0.01
(0.94) 0.01
(0.99) 0.01
(3.01)* 0.03
(2.41) 0.01
(1.94)* 0.02
Risk (9.86)*** 0.06
(11.64)** 0.04
(12.02)*** 0.04
(14.71)*** 0.04
(14.95)** 0.04
(16.86)*** 0.04
(18.72)** 0.04
(16.38)*** 0.03
(20.89)** 0.04
F value 64.81 44.41 51.86 852.10 563.10 659.24 171.13 118.00 133.17
Adjusted R2
0.20 0.10 0.16 0.37 0.28 0.31 0.37 0.29 0.31
Hausman test
0.0045 0.0000 0.0006 0.0045 0.0000 0.0006 - - -
Note: t-values are in parentheses (t-statistics) while ***, **, and * designate the level of significance at 1%, 5% and 10% respectively. STRA_SM is an unclear strategy of the firms (stuck in the middle or failed to choose any single strategy) and is measured through dummy variable i.e. code 1 is assigned if the firms are failed to pursue any single strategy or stuck in the middle otherwise 0. The moderating variable TDR*STRA_SM is the interaction term between total debt ratio and unclear strategy (STRA_SM) while LDR*STRA_SM is the interaction term between long term debt ratio unclear strategy. The moderating variable SDR*STRA_SM is also the interaction term between short term debt ratio and unclear strategy. Model 1 includes total debt ratio (TDR) and unclear strategy of the firms (STRA_SM) as an explanatory variables and TDR*STRA_SM is a moderating variable whereas long term debt ratio (LDR), unclear strategy (STRA_SM) and the moderating variable LDR* STRA_SM are included in the model 2. Model 3 contains the SDR*STRA_SM as a moderating variable along with the short term debt ratio (SDR) and unclear strategy (STRA_SM). The values of VIF of each variable are less than 4; ensure the absence of Multicolinearity in the regression models.

Social science section
Openly accessible at http://www.european-science.com 323
Table 13: Capital Structure, Unclear Strategy and Firm Performance Fixed effect models, Random Effect Models and Ordinary Least Square Models of the Predictors of Return on Equity (ROE)
Variables
Fixed Random OLS
Model 1 Model 2 Model 3 Model 1 Model 2 Model 3 Model 1 Model 2 Model 3 Constant (1.71)***
0.28 (0.54)***
0.09 (1.69)***
0.28 (-4.49)***
-0.27 (-7.48)***
-0.42 (-5.20)***
-0.31 (-8.51)***
-0.34 (-12.51)***
-0.45 (-10.17)***
-0.39
TRD (-6.25)*** -0.26
(-6.76)*** -0.21
(-7.15)*** -0.18
STRA_SM (-0.15)* -0.02
(-1.44) -0.05
(-1.95)** -0.05
TDR*STRA_SM
(-0.47) -0.03
(-0.20) -0.01
(-0.18) -0.01
LRD (0.22)** 0.01
(-1.11) -0.04
(-3.01)*** -0.09
STRA_SM (-0.40) -0.04
(-2.34)*** -0.04
(-4.08)*** -0.05
LDR*STRA_ SM
(-0.21) -0.02
(-0.24) -0.02
(-1.10) -0.06
SRD (-6.11)*** -0.24
(-5.67)*** -0.18
(-4.66)*** -0.12
STRA_SM (-0.13) -0.01
(-2.02)*** -0.05
(-2.05)*** -0.04
SDR*STRA_ SM
(-0.72) -0.05
(-0.28) -0.01
(-0.40) -0.02
Size (0.92)*** 0.01
(1.28) 0.02
(1.24) 0.02
(6.67)*** 0.02
(6.70)*** 0.02
(6.08)*** 0.02
(12.35)*** 0.03
(12.43)*** 0.03
(11.83)*** 0.03
Liquidity (2.67)*** 0.01
(5.10)*** 0.02
(2.00)*** 0.01
(2.36)*** 0.01
(6.71)*** 0.02
(2.90)*** 0.01
(2.48)*** 0.01
(8.21)*** 0.02
(4.40)*** 0.01
Growth (6.03)*** 0.34
(5.69)*** 0.03
(5.51)*** 0.03
(5.87)*** 0.03
(5.63)*** 0.03
(5.24)*** 0.03
(4.40)*** 0.03
(4.39)*** 0.03
(3.68)*** 0.02
Age (0.08) 0.02
(1.18) 0.01
(0.14) 0.01
(1.17) 0.01
(0.79) 0.01
(0.87) 0.02
(1.86)** 0.03
(1.60) 0.01
(1.47) 0.01
Risk (9.08)*** 0.08
(10.60)*** 0.10
(10.42)*** 0.09
(13.90)*** 0.08
(14.33)*** 0.09
(15.30)*** 0.09
(17.73)*** 0.08
(16.61)*** 0.08
(18.62)*** 0.09
F value 36.14 29.19 35.56 458.66 390.67 435.82 85.68 77.02 80.56
Adjusted R2 0.14 0.08 0.06 0.24 0.22 0.05 0.24 0.23 0.23
Hausman test 0.0032 0.0051 0.0005 0.0032 0.0051 0.0005 - - -
Note: t-values are in parentheses (t-statistics) while ***, **, and * designate the level of significance at 1%, 5% and 10% respectively. STRA_SM is an unclear strategy of the firms (stuck in the middle or failed to choose any single strategy) and is measured through dummy variable i.e. code 1 is assigned if the firms are failed to pursue any single strategy or stuck in the middle otherwise 0. The moderating variable TDR*STRA_SM is the interaction term between total debt ratio and unclear strategy (STRA_SM) while LDR*STRA_SM is the interaction term between long term debt ratio unclear strategy. The moderating variable SDR*STRA_SM is also the interaction term between short term debt ratio and unclear strategy. Model 1 includes total debt ratio (TDR) and unclear strategy of the firms (STRA_SM) as an explanatory variables and TDR*STRA_SM is a moderating variable whereas long term debt ratio (LDR), unclear strategy (STRA_SM) and the moderating variable LDR* STRA_SM are included in the model 2. Model 3 contains the SDR*STRA_SM as a moderating variable along with the short term debt ratio (SDR) and unclear strategy (STRA_SM). The values of VIF of each variable are less than 4; ensure the absence of Multicolinearity in the regression models.
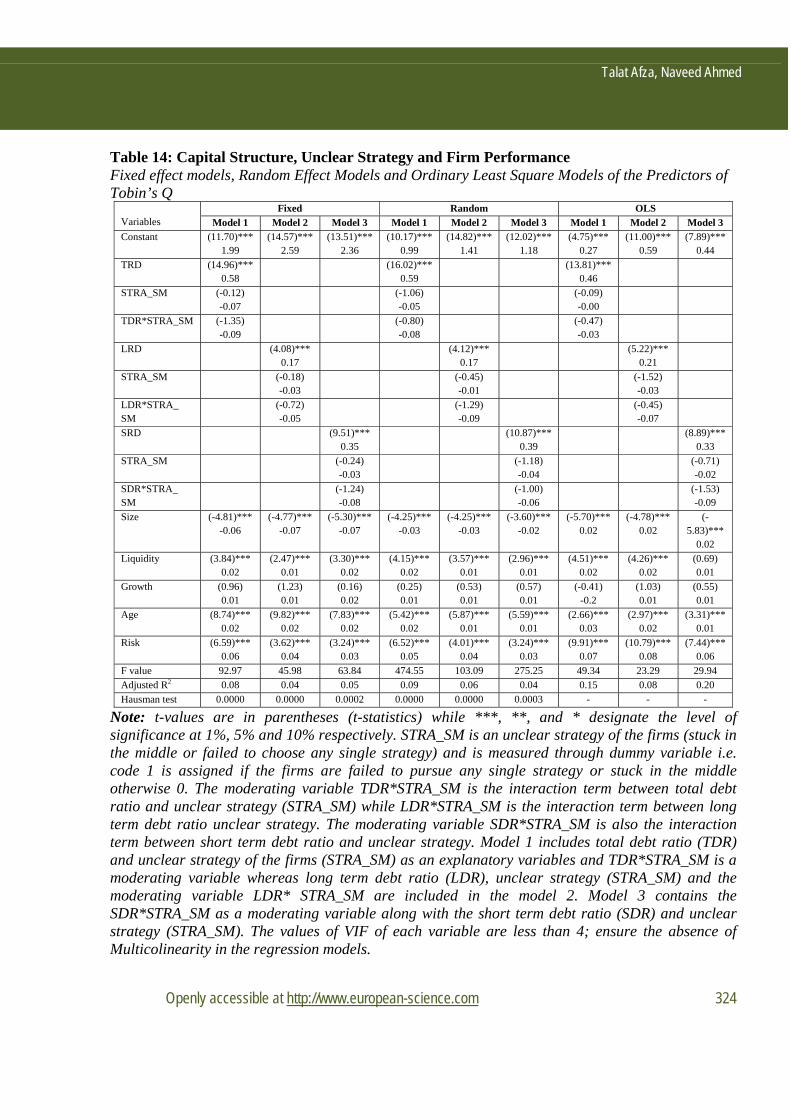
Talat Afza, Naveed Ahmed
Openly accessible at http://www.european-science.com 324
Table 14: Capital Structure, Unclear Strategy and Firm Performance Fixed effect models, Random Effect Models and Ordinary Least Square Models of the Predictors of Tobin’s Q
Variables
Fixed Random OLS
Model 1 Model 2 Model 3 Model 1 Model 2 Model 3 Model 1 Model 2 Model 3 Constant (11.70)***
1.99 (14.57)***
2.59 (13.51)***
2.36 (10.17)***
0.99 (14.82)***
1.41 (12.02)***
1.18 (4.75)***
0.27 (11.00)***
0.59 (7.89)***
0.44
TRD (14.96)*** 0.58
(16.02)*** 0.59
(13.81)*** 0.46
STRA_SM (-0.12) -0.07
(-1.06) -0.05
(-0.09) -0.00
TDR*STRA_SM (-1.35) -0.09
(-0.80) -0.08
(-0.47) -0.03
LRD (4.08)*** 0.17
(4.12)*** 0.17
(5.22)*** 0.21
STRA_SM (-0.18) -0.03
(-0.45) -0.01
(-1.52) -0.03
LDR*STRA_ SM
(-0.72) -0.05
(-1.29) -0.09
(-0.45) -0.07
SRD (9.51)*** 0.35
(10.87)*** 0.39
(8.89)*** 0.33
STRA_SM (-0.24) -0.03
(-1.18) -0.04
(-0.71) -0.02
SDR*STRA_ SM
(-1.24) -0.08
(-1.00) -0.06
(-1.53) -0.09
Size (-4.81)*** -0.06
(-4.77)*** -0.07
(-5.30)*** -0.07
(-4.25)*** -0.03
(-4.25)*** -0.03
(-3.60)*** -0.02
(-5.70)*** 0.02
(-4.78)*** 0.02
(-5.83)***
0.02
Liquidity (3.84)*** 0.02
(2.47)*** 0.01
(3.30)*** 0.02
(4.15)*** 0.02
(3.57)*** 0.01
(2.96)*** 0.01
(4.51)*** 0.02
(4.26)*** 0.02
(0.69) 0.01
Growth (0.96) 0.01
(1.23) 0.01
(0.16) 0.02
(0.25) 0.01
(0.53) 0.01
(0.57) 0.01
(-0.41) -0.2
(1.03) 0.01
(0.55) 0.01
Age (8.74)*** 0.02
(9.82)*** 0.02
(7.83)*** 0.02
(5.42)*** 0.02
(5.87)*** 0.01
(5.59)*** 0.01
(2.66)*** 0.03
(2.97)*** 0.02
(3.31)*** 0.01
Risk (6.59)*** 0.06
(3.62)*** 0.04
(3.24)*** 0.03
(6.52)*** 0.05
(4.01)*** 0.04
(3.24)*** 0.03
(9.91)*** 0.07
(10.79)*** 0.08
(7.44)*** 0.06
F value 92.97 45.98 63.84 474.55 103.09 275.25 49.34 23.29 29.94
Adjusted R2 0.08 0.04 0.05 0.09 0.06 0.04 0.15 0.08 0.20
Hausman test 0.0000 0.0000 0.0002 0.0000 0.0000 0.0003 - - -
Note: t-values are in parentheses (t-statistics) while ***, **, and * designate the level of significance at 1%, 5% and 10% respectively. STRA_SM is an unclear strategy of the firms (stuck in the middle or failed to choose any single strategy) and is measured through dummy variable i.e. code 1 is assigned if the firms are failed to pursue any single strategy or stuck in the middle otherwise 0. The moderating variable TDR*STRA_SM is the interaction term between total debt ratio and unclear strategy (STRA_SM) while LDR*STRA_SM is the interaction term between long term debt ratio unclear strategy. The moderating variable SDR*STRA_SM is also the interaction term between short term debt ratio and unclear strategy. Model 1 includes total debt ratio (TDR) and unclear strategy of the firms (STRA_SM) as an explanatory variables and TDR*STRA_SM is a moderating variable whereas long term debt ratio (LDR), unclear strategy (STRA_SM) and the moderating variable LDR* STRA_SM are included in the model 2. Model 3 contains the SDR*STRA_SM as a moderating variable along with the short term debt ratio (SDR) and unclear strategy (STRA_SM). The values of VIF of each variable are less than 4; ensure the absence of Multicolinearity in the regression models.

Social science section
Openly accessible at http://www.european-science.com 325
Conclusion The purpose of the current study is to examine the moderating role of business strategy on
the relationship between capital structure and firm performance. Overall, the results of regression analysis conducted to accomplish the objectives of the research reveal that all the measures of capital structure negatively and significantly affected to the accounting measures of performance i.e. ROA and ROE whereas TDR, LDR and SDR positively influence the market performance of the selected Pakistani firms. In addition, cost leadership strategy, product differentiation strategy and hybrid strategy also enhances both the accounting and market performance of the selected firms; however, Pakistani firms with unclear strategy inversely affect their financial health. Furthermore, the outcomes also stated that debt financing is imperative both for the accounting and market performance of the firms while attempting to pursue the cost leadership strategy. Moreover, as the firms follow the hybrid strategy, product differentiation strategy and firms with unclear strategic situation, the benefits of debt decreases and incurs a significant performance penalty.
References
Abor, J., 2005. The effect of capital structure on profitability: an empirical analysis of listed firms in Ghana, Journal of Risk Finance 6, 438-47.
Abor, J., 2007. Debt policy and performance of SMEs: evidence from Ghanaian and South African firms, Journal of Risk Finance, 8(4), 364-379.
Aggarwal, R., Kyaw, N.A., Zhao, X., 2011. Financial environment and the valueleverage relation, Journal of International Business and Economy 12(2), 1-26.
Allen, A.O., Helms, R.S., Spralls, S.A., 2006. Critical tactics for implementing Porter’s generic strategies. Journal of Business Strategy, 27(1), 43-53.
Anderson, D. M., 1997. Agile product development for mass customization. Chicago, IL: Irwin Arcas, M.J., Bachiller, P., 2008. Performance and Capital Structure of Privatized Firms in Europe,
Global Economic Review: Perspectives on East Asian Economies and Industries, 37(1), 107-123,
Balakrishnan, S., Fox, I., 1993. Asset specificity, firm heterogeneity and financial leverage. Strategic Management Journal 14 (1), 3–16.
Balsam, S., Fernando, G. and Tripathy, A., 2011. The impact of firm strategy on performance measures used in executive compensation, Journal of Business Research, 64(2), 187-193.
Barney, J.B., 2002. Gaining and sustaining competitive advantage. Prentice Hall: New Jersey, Second edition.
Barney, J.B. & Hesterley, W.S., 2006. Strategic management and competitive advantage- Concepts. Pearson Prentice Hall: New Jersey.
Baysinger, B., Hoskisson, R.E., 1989. Diversification Strategy and R&D Intensity in Multiproduct Firms, The Academy of Management Journal 32(2), 310-332.
Berger, A.N., Bonaccorsi di Patti, E., 2006. Capital structure and firm performance: a new approach to testing agency theory and an application to the banking industry. Journal of Banking and Finance 30, 1065–1102.
Campbell-Hunt, C., 2000. What have we learned about generic competitive strategy? A meta-analysis, Strategic Management Journal 21(2), 127-54.
Cassar, G., Holmes, S. 2003. Capital structure and financing of SME’s: Australian evidence. Accounting and Finance, 43, 123–147.
Chaganti, R.S., R. Chaganti, V. Mahajan, 1989. Profitable strategies under different types of competition, Entrepreneurship Theory and Practice 13(3), 21-35.

Talat Afza, Naveed Ahmed
Openly accessible at http://www.european-science.com 326
Chen, J., Chen, M., Liao, W., Chen, T., 2009. Influence of capital structure and operational risk on profitability of life insurance industry in Taiwan, Journal of Modeling in Management 4(1), 7-18.
Chiang, Y., Chang, P., Hui, C. 2002. Capital structure and profitability of the property and construction sectors in Hong Kong, Journal of Property Investment and Finance, 20, 434-53.
Chibber, P.K., Majumdar, S.K., 1999. Foreign ownership and profitability: Property rights, control, and the performance of firms in Indian industry. Journal of Law and Economics 42, 209–238.
Chrisman, J., Hofer, C. and Bolton, W., 1988. Toward a system for classifying business strategies, Academy of Management Review, 13, 413-28.
Chakraborty, S. & Philip, T., 1996. Vendor development strategies, International Journal of Operations & Production Management, 16(10), 54-66.
Cronshaw, M., Davis, E. and Kay, J., 1994. On being stuck in the middle or good food costs less at Sainsburys, British Journal of Management, 5(1), 19-32.
Cross, L., 1999. Strategy drives marketing success, Graphic Arts Monthly 71(2), 96-106. David, F., 2000. Strategic Management Concepts and Cases, Prentice-Hall, Englewood Cliffs, NJ. Dess, G.G. and Davis, P.S., 1984. Porters (1980) generic strategies as determinants of strategic
group membership and organizational performance, Academy of Management Journal, 27(3), 467-88.
Farrell, P., Hitchens, D. and Moffat, L., 1992. Does strategy matter? An analysis of generic strategies and performance in business service firms, Business Strategy Review, 3(1), 71-87.
Fosu, S., 2013. Capital structure, product market competition and firm performance: Evidence from South Africa, The Quarterly Review of Economics and Finance 53, 140– 151.
Ghosh, C., Nag, R., Sirmans, C.F., 2000. The pricing of seasoned equity offerings: evidence from REITs. Real Estate Economics 28, 363–384.
Gleason, K.C., Mathur, L.K., Mathur, I., 2000. The interrelationship between culture, capital structure, and performance: evidence from European retailers. Journal of Business Research 50, 185–191.
Goldman, S. L., Nagel, R. N., & Preiss, K., 1995. Agile competitors and virtual organizations: Strategies for enriching the customer. New York: VNR.
Hlavacka, S., Ljuba, B., Viera, R., & Robert, W. 2001. “Performance Implications of Porter's Generic Strategies in Slovak Hospitals”, Journal of Management in Medicine (15)1, 44-66.
Harris, M., Raviv, A., 1991. The theory of financial leverage. Journal of Finance 46, 297–355. Hambrick D.C. 1983. Some tests of the effectiveness and functional attributes of Miles and Snow's
strategic types. Academy of Management Journal. 26(1), 5-26. Hill, C.W.L., 1988. Differentiation versus low cost or differentiation and low cost: a contingency
framework, Academy of Management Review, 13(3), 401-12. Huang, G., Song, F., 2006. The determinants of capital structure: Evidence from China, China
Economic Review 17(1), 14–36. Hyatt, L., 2001. A simple guide to strategy, Nursing Homes 50(1), 12-3. Jensen, M.C., 1986. Agency costs of free cash flow, corporate finance, and takeovers. AEA Papers
and Proceedings, May. Jensen M., Meckling W., 1976. Theory of the firm: managerial behavior, agency costs and
ownership structure. Journal of Financial Economics 3, 305–360. Jermias, J., 2008. The relative influence of competitive intensity and business strategy on the
relationship between financial leverage and performance, The British Accounting Review, 40, 71-86.

Social science section
Openly accessible at http://www.european-science.com 327
Jordan, J., Lowe, J., Taylor, P., 1998. Strategy and financial policy in UK small firms. Journal of Business Finance and Accounting 25, 1–27.
Kester, W., 1986. Capital and ownership structure: a comparison of United States and Japanese manufacturing corporations. Financial Management 15, 5–16.
Kim, L. and Lim, Y. 1988. Environment, generic strategies, and performance in a rapidly developing country: a taxonomic approach, Academy of Management Journal, 31, 802-27.
Kim, E., Nam, D. and Stimpert, J.L., 2004. The applicability of Porter’s generic strategies in the digital age: assumptions, conjectures, and suggestions, Journal of Management, 30, 569-90.
King, M.R., Santor, E., 2008. Family values: ownership structure, performance and capital structure of Canadian firms. Journal of Banking and Finance 32, 2423–2432.
Koo, C., Koh, C. E., and Nam, K. 2004. An Examination of Porter's Competitive Strategies in Electronic Virtual Markets: A Comparison of Two On-line Business Models. International Journal of Electronic Commerce 9(1), 163-180.
Lubatkin, M., Chatterjee, S., 1994. Extending modern portfolio theory into the domain of corporate diversification: does it apply? Academy of Management Journal 37, 109–136.
Maksimovic, V., Titman, S., 1991. Financial Policy and Reputation for Product Quality, The Review of Financial Studies 4(1), 175-200.
Miller, D., 1986. Configurations of strategy and structure, Strategic Management Journal, 7, 233-49. Margaritis, D., Psillaki, M., 2010. Capital structure, equity ownership and firm performance, Journal
of Banking and Finance 34, 621-632. Miller, A. and Dess, G., 1993. Assessing Porter’s (1980) model in terms of its generalizability,
accuracy and simplicity, Journal of Management Studies, 30, 553-85. Miller, A. 1988. Relating Porter’s business strategies to environment and structure: Analysis and
performance implications. The academy of Management Journal, 31(2), 280-308 Miller, A. (1998), Strategic Management, 3rd ed., Irwin McGraw-Hill, New York, NY. Modigliani, F., Miller, M.H., 1958. The cost of capital, corporate finance, and the theory of
investment. American Economic Review 53, 433–443. Modigliani F, Miller M. 1963. Corporate income taxes and the cost of capital: a correction.
American Economic Review 53, 433–443. Myers, S., Majluf, N., 1984. Corporate financing and investment decisions when firms have
information that investors do not have. Journal of Financial Economics 13, 157–187. Myers, S., 1977. Determinants of corporate borrowings. Journal of Financial Economics 5, 147–175.
. Nandakumar, M.K, Ghobadian, A., O'Regan, N., 2011. Generic strategies and performance –
evidence from manufacturing firms, International Journal of Productivity and Performance Management, 60(3), 222 – 251.
O’Brien, J.P., 2003. The financial leverage implications of pursuing a strategy of innovation. Strategic Management Journal 24, 415–431.
Park, K and Jang, S., 2013. Capital structure, free cash flow, diversification and firm performance: A holistic analysis, International Journal of Hospitality Management 33, 51–63.
Parker, B. & Helms, M.M., 1992. Generic strategies and firm performance in a declining industry. Management International Review, 32(1), 23-39.
Parnell, J.A., 1997. New evidence in the generic strategy and business performance debate: A research note. British Journal of Management, 8, 175-181.
Parnell, J.A., 2010, Strategic clarity, business strategy and performance, Journal of Strategy and Management, 3(4), 304 – 324.
Porter, M.E., 1980. Competitive Strategy. Free Press, New York.

Talat Afza, Naveed Ahmed
Openly accessible at http://www.european-science.com 328
Porter, M.E., 1985. Competitive Advantage. Free Press, New York. Porter, M.E., 1996. What is strategy. Harvard Business Review, November–December. Powers, T. and Hahn, W. 2004. Critical competitive methods, generic strategies, and firm
performance”, International Journal of Bank Marketing, 22(1), 43-64. Pulaj, E., Kume, V., Cipi, A., 2015. The impact of generic competitive strategies on organizational
performance. The evidence from Albanian context, European Scientific Journal October 11(28).
Rajan, R. G., & Zingales, L., 1995. What do we know about capital structure? Some evidence from international data. Journal of Finance, 50(5), 1421–14601
Ross, S., 1977. The determination of financial structure: the incentive-signaling approach. The Bell Journal of Economics 8, 23–40.
Salim, M., Yadav, R., 2012. Capital Structure and Firm Performance: Evidence from Malaysian Listed Companies, Procedia - Social and Behavioral Sciences, International Congress on Interdisciplinary Business and Social Sciences 2012.
Sheikh, N.A., Wang, Z., 2013. The impact of capital structure on performance An empirical study of non-financial listed firms in Pakistan, International Journal of Commerce and Management International Journal of Commerce and Management 23(4), 354-368.
Simerly, R.L, Li, M., 2000. Environmental dynamism, capital structure and performance: a theoretical integration and an empirical test, Strategic Management Journal 21(1), 31–49.
Singh, M., Faircloth, S. (2005). The Impact of Corporate debt on Long Term Investment and Firm performance; Applied Economics, 37, pp.875–883.
Stulz, R., 1990. Managerial discretion and optimal financing policies. Journal of Financial Economics, 26, 3–271.
Thompson, A. and Strickland, A., 1998. Crafting and Implementing Strategy, Irwin McGraw-Hill, New York, NY.
Titman, S., Wessels, R., 1988. The determinants of capital structure choice. Journal of Finance 43, 1–19.
Torgovicky, R., Goldberg, A., Shvarts, S., Bar Dayan, Y., Onn, E. and Levi, Y., 2005, “Application of Porters generic strategies in ambulatory health care: a comparison of managerial perceptions in two Israeli sick funds, Health Care Management Review, 30(1), 17-23.
Smith, C.W., Warner, J.B., 1977. Bankruptcy costs: some evidence. Journal of Finance 32, 337–347. Wright, P., Kroll, M., Tu, H. & Helms, M. 1991. Generic strategies and business performance: An
empirical study of the screw machine products industry. British Journal of Management, 2, pp 57-65.
Yang, J., Chou, S., Chang, H., Lee, C., 2010. The Effects of Capital Structure on Firm Performance in the Taiwan 50 and Taiwan Mid-Cap 100, Journal of Statistics and Management Systems, 13(5), 1069-1078.