capital planning task force update interim report november 18, 2003 the university of texas system
TRANSCRIPT

Capital Planning Task Force Update
Interim ReportNovember 18, 2003
THE UNIVERSITY OF TEXAS SYSTEM
Interim Report
Purpose
The purpose of the Capital Planning Task Force is to:
Assess the need for capital funding at the U.T. System academic institutions through fiscal year 2030, in light of record enrollment growth and the statewide “Closing the Gaps” initiative.
Develop a proposal to fund the needed infrastructure to accommodate expected enrollment growth at these institutions.

Interim Report
Closing the Gaps
“Closing the Gaps” is the Texas Higher Education Coordinating Board’s (THECB) statewide master plan that established goals of closing the gaps in higher education participation and success, in educational excellence, and in funded research over the next 15 years.
For the purpose of this analysis, the “gaps are closed” when enrollment rates for African American and Hispanic students equal the enrollment rate for Anglos. The Task Force has not attempted to address excellence and research goals that are a part of the THECB’s master plan.
Interim Report
Task Force
The Task Force was established in September by Chairman Miller and is co-chaired by Regent Hunt, Chairman of the Finance and Planning Committee, and Regent Krier, Chairman of the Academic Affairs Committee.
Support Staff:• Steve Murdock, State Demographer of Texas• Joe Stafford, Vice Provost, U. T. San Antonio• System Administration representatives: Terry Sullivan;
Pedro Reyes; Philip Aldridge; Sid Sanders; Ashley Smith; Francie Frederick; Terry Hull; Geri Malandra
Interim Report
Methodology for Statewide Enrollment Projections
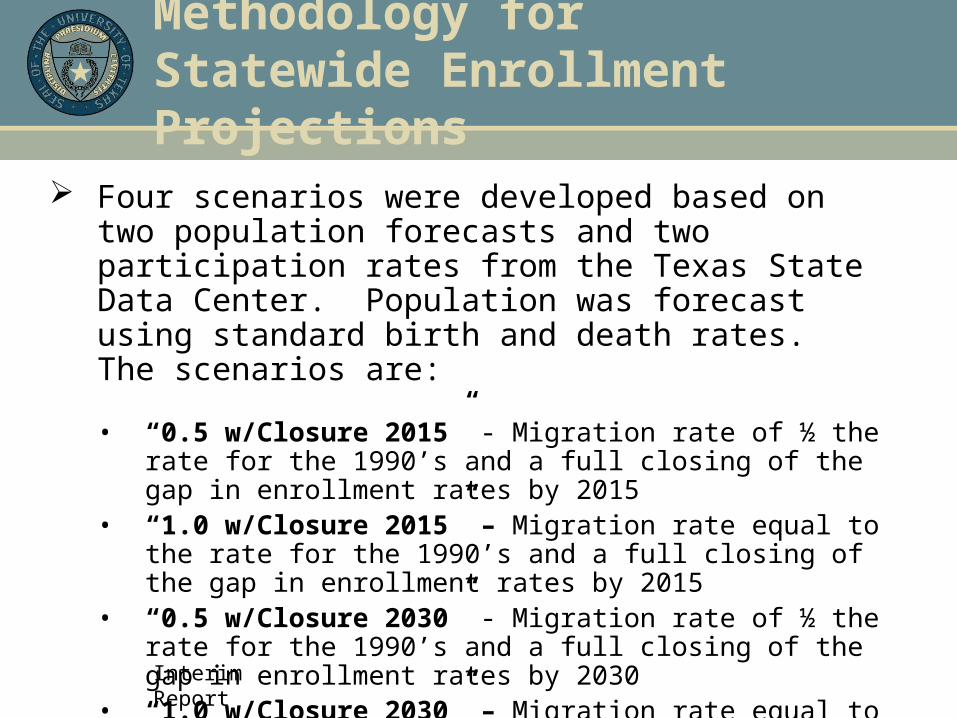
Four scenarios were developed based on two population forecasts and two participation rates from the Texas State Data Center. Population was forecast using standard birth and death rates. The scenarios are:
• “0.5 w/Closure 2015” - Migration rate of ½ the rate for the 1990’s and a full closing of the gap in enrollment rates by 2015
• “1.0 w/Closure 2015” – Migration rate equal to the rate for the 1990’s and a full closing of the gap in enrollment rates by 2015
• “0.5 w/Closure 2030” - Migration rate of ½ the rate for the 1990’s and a full closing of the gap in enrollment rates by 2030
• “1.0 w/Closure 2030” – Migration rate equal to the rate for the 1990’s and a full closing of the gap in enrollment rates by 2030
* Migration rate is the net increase in population from movement into and out of the state.
Interim Report
Methodology for Statewide Enrollment Projections, Cont.
Enrollments of out-of-state or non-resident students are not included in any of the scenarios.
Market share for each state university is held constant (at 2000 levels) throughout the projection period.
No change in admissions requirements included in any of the scenarios.

Interim Report
Enrollment Projections for all State Universities in Texas
State University Enrollment Increases (draft: Oct. 23, 2003)
0
100,000
200,000
300,000
400,000
500,000
600,000
Year
En
roll
men
t In
cre
ases (
Base Y
ear
2000)
.5 w/Closure 2015 1.0 w/ Closure 2015 .5 w/ Closure 2030 1.0 w/Closure 2030
Interim Report
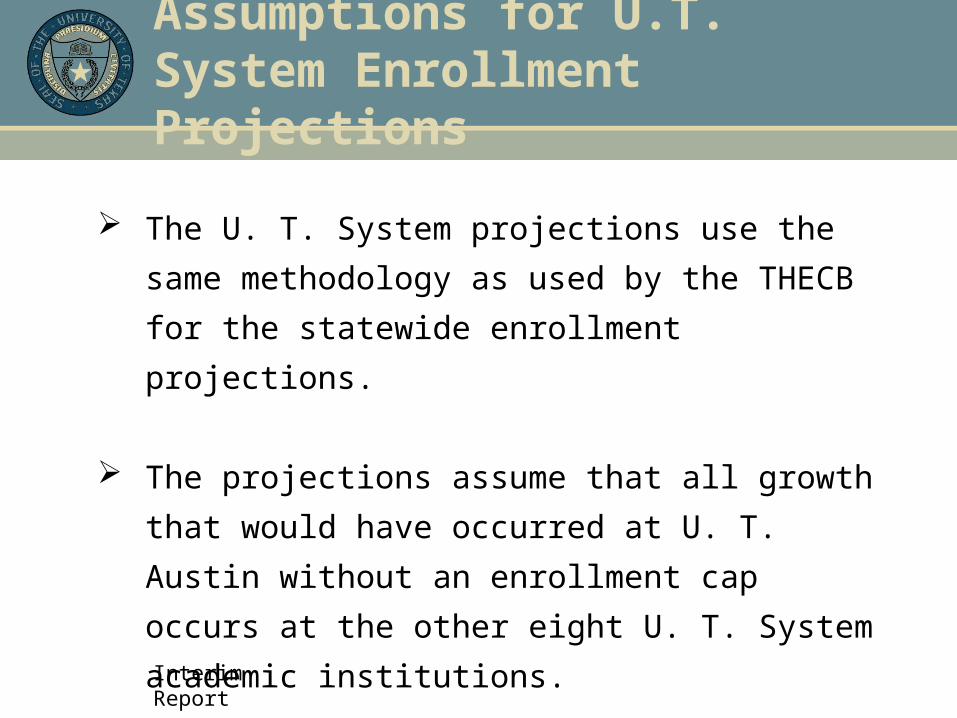
Assumptions for U.T. System Enrollment Projections
The U. T. System projections use the same
methodology as used by the THECB for the
statewide enrollment projections.
The projections assume that all growth that would
have occurred at U. T. Austin without an enrollment
cap occurs at the other eight U. T. System
academic institutions.

Interim Report
Enrollment Projections for U.T. System Academic Institutions (ex. U.T. Austin)
U.T. System Enrollment Increases (draft: Oct. 23, 2003)
0
50,000
100,000
150,000
200,000
250,000
Year
En
rollm
en
t In
cre
as
es
(B
as
e Y
ea
r 2
00
0)
0.5 w/ Closure 2015 1.0 w/ Closure 2015 0.5 w/ Closure 2030 1.0 w/ Closure 2030
Interim Report
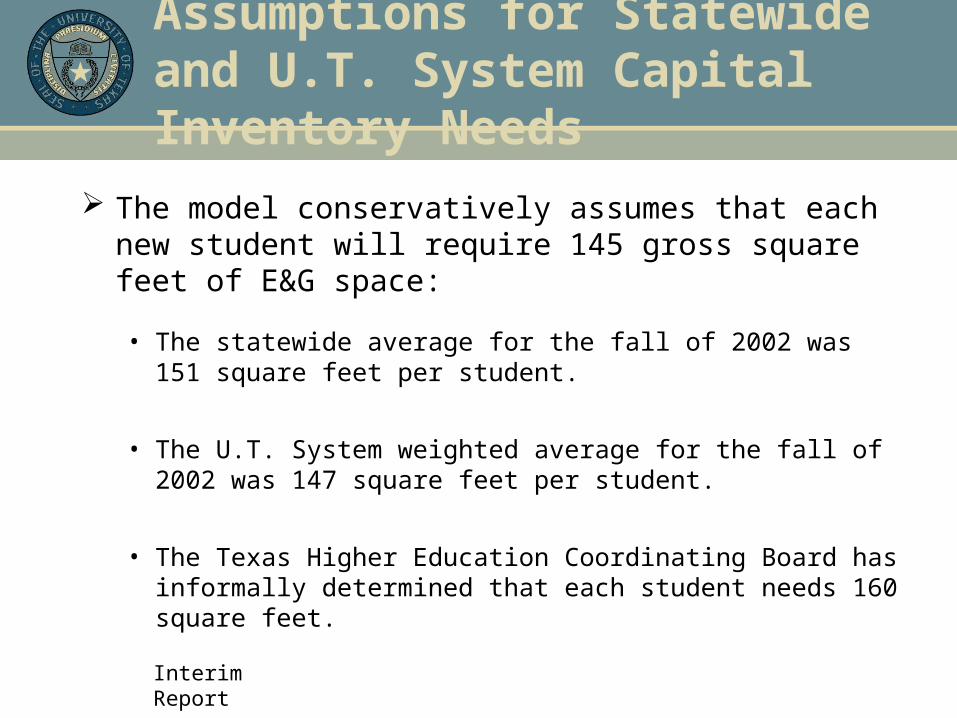
Assumptions for Statewide and U.T. System Capital Inventory Needs
The model conservatively assumes that each new student will require 145 gross square feet of E&G space:
• The statewide average for the fall of 2002 was 151 square feet per student.
• The U.T. System weighted average for the fall of 2002 was 147 square feet per student.
• The Texas Higher Education Coordinating Board has informally determined that each student needs 160 square feet.
Interim Report
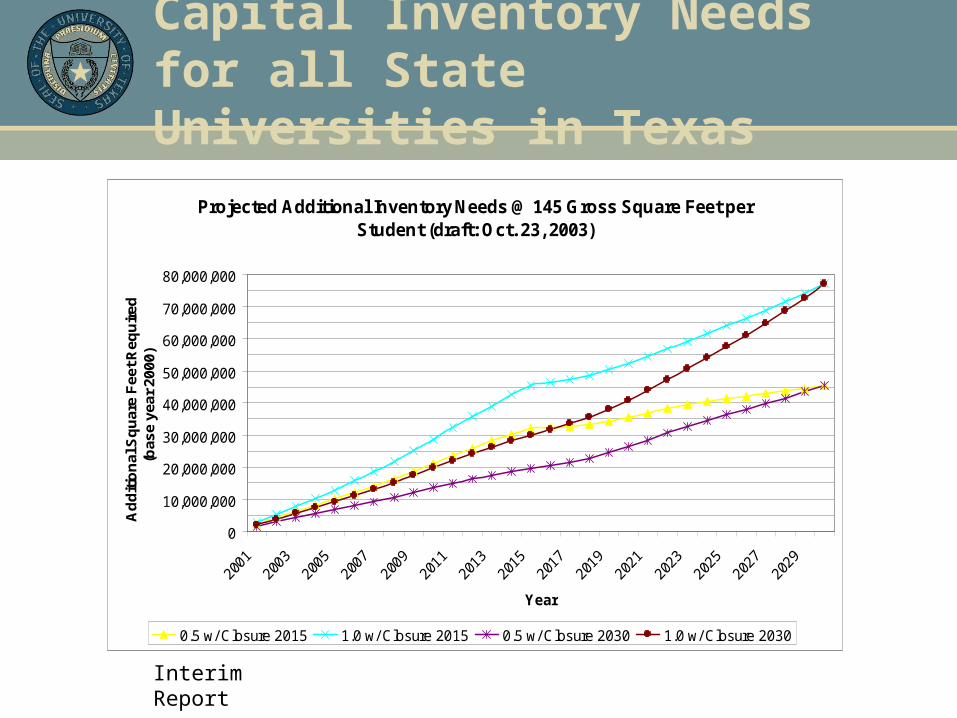
Capital Inventory Needs for all State Universities in Texas
Projected Additional Inventory Needs @ 145 Gross Square Feet per Student (draft: Oct. 23, 2003)
0
10,000,000
20,000,000
30,000,000
40,000,000
50,000,000
60,000,000
70,000,000
80,000,000
Year
Ad
diti
on
al S
qu
are
Fee
t Req
uir
ed
(bas
e ye
ar 2
000)
0.5 w/ Closure 2015 1.0 w/ Closure 2015 0.5 w/ Closure 2030 1.0 w/ Closure 2030
Interim Report
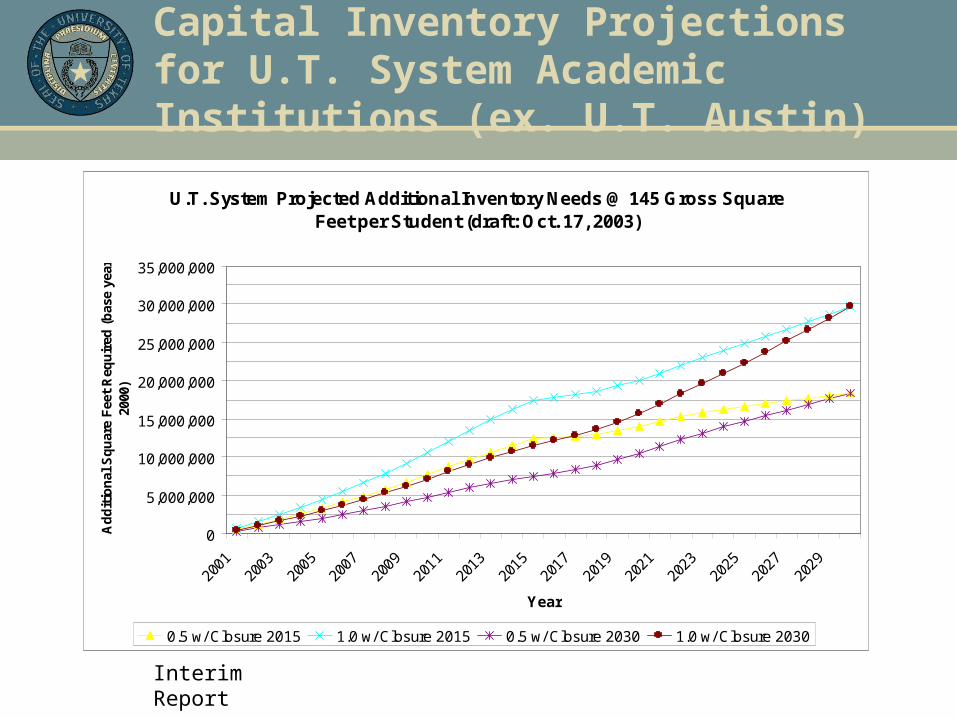
Capital Inventory Projections for U.T. System Academic Institutions (ex. U.T. Austin)
U.T. System Projected Additional Inventory Needs @ 145 Gross Square Feet per Student (draft: Oct. 17, 2003)
0
5,000,000
10,000,000
15,000,000
20,000,000
25,000,000
30,000,000
35,000,000
2001
2003
2005
2007
2009
2011
2013
2015
2017
2019
2021
2023
2025
2027
2029
Year
Ad
dit
ion
al S
qu
are
Fee
t R
equ
ired
(b
ase
year
20
00)
0.5 w/ Closure 2015 1.0 w/ Closure 2015 0.5 w/ Closure 2030 1.0 w/ Closure 2030
Interim Report
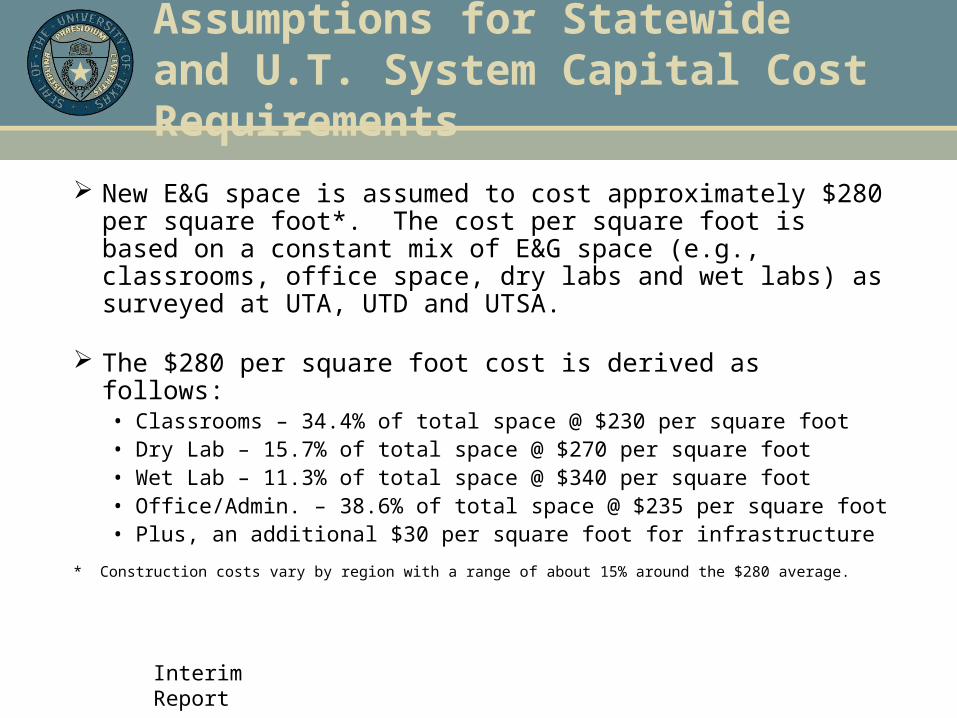
Assumptions for Statewide and U.T. System Capital Cost Requirements
New E&G space is assumed to cost approximately $280 per square foot*. The cost per square foot is based on a constant mix of E&G space (e.g., classrooms, office space, dry labs and wet labs) as surveyed at UTA, UTD and UTSA.
The $280 per square foot cost is derived as follows:• Classrooms – 34.4% of total space @ $230 per square foot• Dry Lab – 15.7% of total space @ $270 per square foot• Wet Lab – 11.3% of total space @ $340 per square foot• Office/Admin. – 38.6% of total space @ $235 per square foot• Plus, an additional $30 per square foot for infrastructure
* Construction costs vary by region with a range of about 15% around the $280 average.
Interim Report
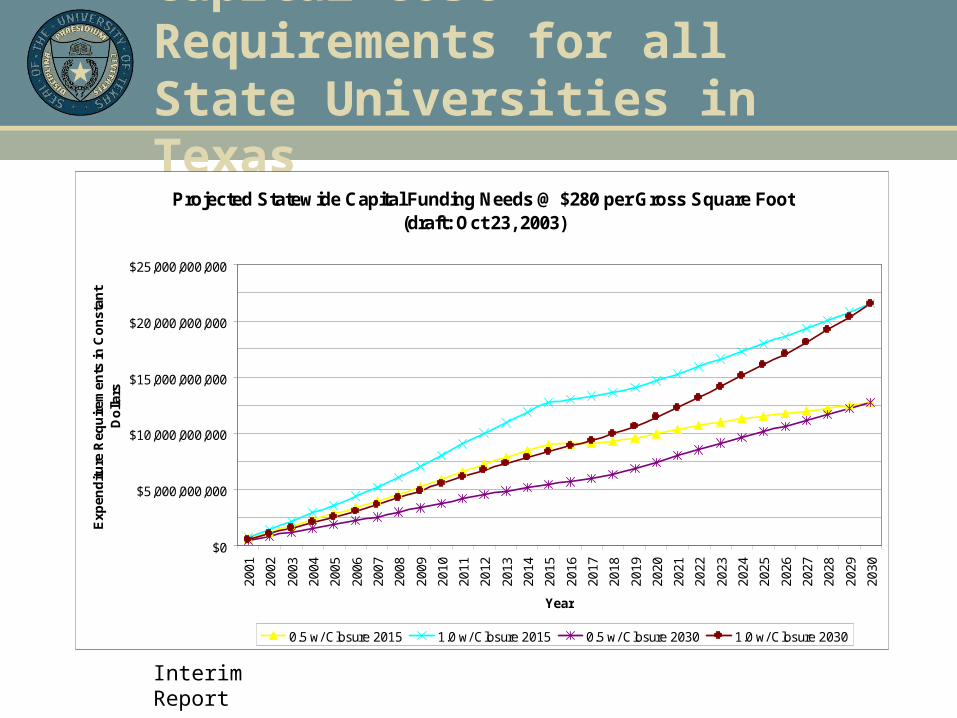
Capital Cost Requirements for all State Universities in Texas
Projected Statewide Capital Funding Needs @ $280 per Gross Square Foot (draft: Oct 23, 2003)
$0
$5,000,000,000
$10,000,000,000
$15,000,000,000
$20,000,000,000
$25,000,000,00020
01
2002
2003
2004
2005
2006
2007
2008
2009
2010
2011
2012
2013
2014
2015
2016
2017
2018
2019
2020
2021
2022
2023
2024
2025
2026
2027
2028
2029
2030
Year
Exp
end
iture
Req
uir
emen
ts in
Co
nst
ant
Do
llars
0.5 w/ Closure 2015 1.0 w/ Closure 2015 0.5 w/ Closure 2030 1.0 w/ Closure 2030

Interim Report
Capital Cost Projections for U.T. System Academic Institutions (ex. U.T. Austin
U.T. System Funding Needs @ $280 per Gross Square Foot (draft: Oct. 23, 2003)
$0
$1,000,000,000
$2,000,000,000
$3,000,000,000
$4,000,000,000
$5,000,000,000
$6,000,000,000
$7,000,000,000
$8,000,000,000
$9,000,000,000
2001
2002
2003
2004
2005
2006
2007
2008
2009
2010
2011
2012
2013
2014
2015
2016
2017
2018
2019
2020
2021
2022
2023
2024
2025
2026
2027
2028
2029
2030
Year
Ex
pe
nd
itu
re R
eq
uir
em
en
ts i
n C
on
sta
nt
Do
llars
0.5 w/ Closure 2015 1.0 w/ Closure 2015 0.5 w/ Closure 2030 1.0 w/ Closure 2030
Interim Report
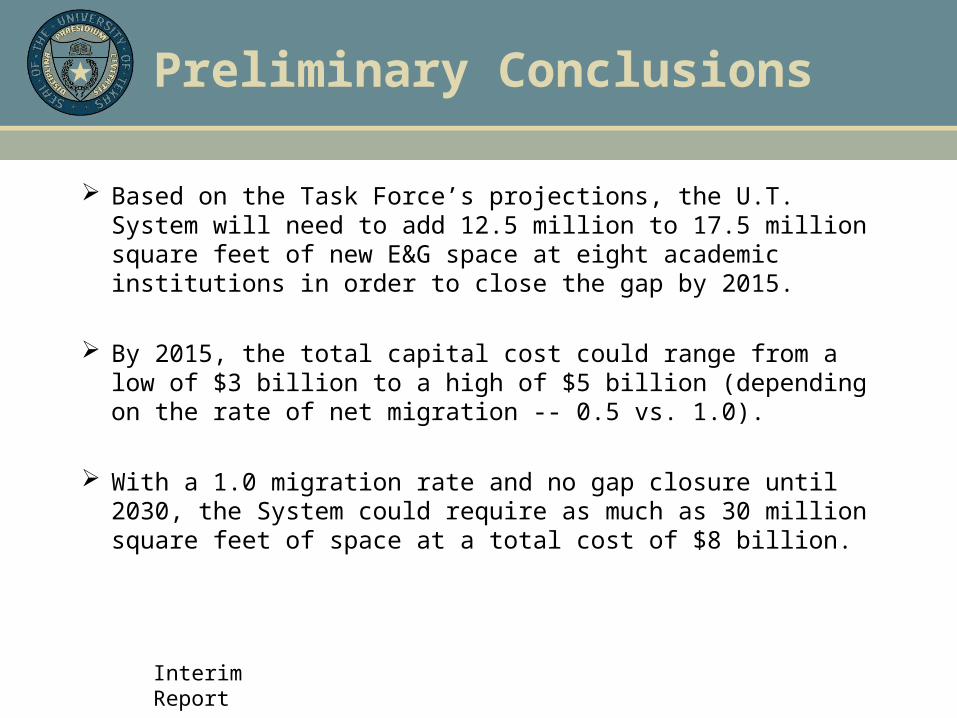
Preliminary Conclusions
Based on the Task Force’s projections, the U.T. System will need to add 12.5 million to 17.5 million square feet of new E&G space at eight academic institutions in order to close the gap by 2015.
By 2015, the total capital cost could range from a low of $3 billion to a high of $5 billion (depending on the rate of net migration -- 0.5 vs. 1.0).
With a 1.0 migration rate and no gap closure until 2030, the System could require as much as 30 million square feet of space at a total cost of $8 billion.
Interim Report
Next Steps
Final report will be prepared by mid-January, 2004.
• Finalize financial models to determine the annual equivalent cost to fund infrastructure needs by year.
• Determine viability of internal and external funding sources (PUF, Tuition Revenue Bonds, Gifts, etc.) to fill funding shortfall.
• Assess funding needs for repair and renovation at each academic institution (including U.T. Austin).
Interim Report
Next Steps, cont.
Final report will be prepared by mid-January, 2004, cont.
• Establish metrics to evaluate and adjust financial models as actual growth patterns emerge.
• Develop a proposed funding formula for infrastructure needs.
• Develop a strategy to present the Task Force’s findings and recommendations to the Board of Regents and State leadership.