capital nvestment as a realist oreign p - ucl€¦ · · 2015-11-16human capital-based models,...
TRANSCRIPT

INTERNATIONAL PUBLIC POLICY REVIEW, vol. 2 , no. 2 (November 2006): 68-91. [ISSN 1748-5207] © 2006 by The School of Public Policy, University College London, London, United Kingdom. All rights reserved.
68
HUMAN CAPITAL INVESTMENT AS A REALIST FOREIGN
POLICY Daniel Swift ‡
Abstract Policy-makers and theorists have yet to develop an accurate means to predict differential rates of state power growth over time. Early frameworks, starting with Robert Gilpin in 1981, relied on traditional power metrics, such as military and economic might, to predict power convergence over time. These models, however, failed to account for reality and were inconsistent with newer, widely-accepted notions of economic growth. Human capital-based models, in contrast, not only provide more informed and accurate predictions than neoclassical models; they yield valuable insights into the technology and weapons innovation process, military resource allocation decisions, and strategic incentives. These newer models place rates of human capital investment at the heart of cross-country income and technological inequality. As the distribution of power ultimately rests on an economic and technological base, states interested in maximizing their share of military power should, ironically, pay close attention to their domestic health and education levels. Keywords: human capital; foreign policy; and education 1. SYSTEMIC CHANGE AND DIFFERENTIAL RATES OF POWER GROWTH Students of international relations (IR) define international political systems according to the number of their great powers, just as economists distinguish markets by the number of major firms competing. Therefore, the structure of any international political system necessarily changes with shifts in the distribution of power among major states. In every international system there are continual occurrences of political, economic, and technological change that promise relative power gains and losses among major powers. Thus, “a process of disequilibrium and adjustment is constantly taking place”.1 After all, without relative shifts in the power balance, the world political system would remain indefinitely in equilibrium, and states would neither rise nor fall in comparison to one another. States, however, inevitably experience differential rates of power growth, and according to realist IR theory, this causes a “fundamental redistribution of power in the system” via armed conflict.2 In a realist world, leaders are assumed to be bent on maximizing their level of relative power; they are players in the so-called “zero sum” game. Yet the best means to evaluate and maximize one’s own power in relation to others seems unclear. In fact, no one, IR theorists included, has been able to establish a clear and accurate method to predict differential power growth – we only know
‡ LMI public policy fellow (PPF), came to LMI from the University of Chicago Contact with questions/comments:
[email protected] 1 Robert Gilpin, War and Change in World Politics (Cambridge: Cambridge University Press, 1981), 13. 2 Ibid.
V O L . 2 , N O . 2 — N O V E MBE R 2 0 0 6 6 9
that such shifts are inevitable. I believe that our predictive shortcomings are the result of outdated and ambiguous measurement tools.3 Whereas economists can simply look to marginal price changes to determine changes in market structure, world leaders have no clear metric to mark and predict power changes in today’s technology intensive, nuclear deterrence world. Traditional power measures, such as gross domestic product (GDP), conventional military size, and population do not translate cleanly into power and are not predictive of future levels of power.4 Thus, traditional measures tell us little about pending changes in the distribution of power across states. In working toward overcoming this impasse, I will turn to basic principles of human capital theory to formulate new power metrics, which will allow policy-makers to better predict and manage future structural shifts.5 2. PREDICTING STRUCTURAL CHANGE My theory relies on easily quantifiable measures of human capital investment, which are determinant of future GDP levels, population figures, organizational efficiency, and, most importantly, future rates of technological innovation. Extensive economic evidence suggests that human capital is the most significant determinant of future economic growth and technological capability.6 Since economic wealth and technology are the foundations of traditional power, relative rates of human capital investment should reliably predict shifts in the hierarchy of states.7 To bolster this important point I will illustrate the synergy between technology, economic growth, and human capital formulation, as described by human capital theorists. One major insight of this school, pioneered by Gary Becker, is that inter-generational investments in human capital are not subject to diminishing marginal returns. In other words, rates of return on investments in human capital rise rather than decline as the stock of human capital increases.8 In the study of strategy, a failure to “keep-up” with the economic growth literature results in a narrow reliance on neoclassical notions of power, which only consider traditional factor inputs – land, labour, capital, and sometimes technology; but not human capital nor industrial organization. Neoclassical models predict power convergence between rich and poor countries because of diminishing marginal returns (DMR) to reproducible capital.9 The core DMR prediction of the neoclassical growth models is not only inconsistent with empirical reality; it has been exposed as theoretically flawed.10 Yet the causal logic of one of the core IR studies relies on the neoclassical notion of diminishing marginal returns as a source of differential power growth among states: namely, Robert Gilpin’s War and Change in World Politics. After establishing that human capital is the most important determinant of future wealth, I will develop a model that examines the effect of human capital accumulation on military resource allocation and behaviour, especially the incentive and ability to invest in military technology.11
3 This predictive failure is most clearly demonstrated by the sudden and unforeseen end of the Cold War. Professor
Robert Pape, in an unpublished paper entitled “Major Power Declines: Why Some end Peacefully,” October 2001, states the end of the Cold War “did not appear to fit with our standard theories explaining conflict and cooperation in international politics.” Drawing on recently uncovered Soviet documents, Pape claims that the peaceful fall of the Soviet Union was precipitated by the apparent gap in technological capabilities between the USSR and the U.S., especially in microelectronics.
4 I assume that traditional power measures, such as GDP and conventional military strength, are dependant on economic wealth. Moreover, cross-country income levels in time t have no significant relationship to income levels in time period t + 1. Barrow, Robert. “Economic Growth in a Cross Section of Countries.” Quarterly Journal of Economics 106 (1991): 409.
5 It is worth noting that Waltz and Gilpin’s original theories are deeply rooted in microeconomic principles, and thus the field of IR has easily incorporated economic “imports” before.
6 Gary Becker, Human Capital (Chicago: University of Chicago Press, 1993); Theo Eicher, “Interaction between Endogenous Human Capital and Technological Change,” The Review of Economic Studies 63 (January 1996): 143-144; Sachs, Jeffery. “Fundamental Sources of Long-Run Economic Growth,” The American Economic Review 87 (May 1997): 187-188.
7 Gilpin. 8 Becker 1993. 9 Barrow. 10 Ibid. 11 Becker 1993; Barrow.

7 0 IN T E R N ATI O N AL PUBLIC P O L I C Y R E VIE W
Evidence indicates that technological breakthroughs are not random, as Gilpin suggests, but are rather a function of sustained investments in human capital. Human capital is not only the foremost input for technology production; it is also a necessary characteristic for the adoption of pre-existing technology.12 By increasing the marginal productivity of technology investments and increasing wage rates, I posit that human capital accumulation creates a strong incentive for militaries to substitute away from labour and toward technology. This strong substitution effect, along with a simple income effect, means that high human capital countries will experience increasing returns to technological investment, causing a divergent trend in technological capabilities across national militaries. The model’s divergence conclusion is consistent with the recursive nature of human capital theory. For instance, on a micro-level, poorer parents face capital constraints and a limited ability to invest in their children’s human capital. The children of poorer parents, in turn, face a low incentive to invest in their own human capital, as they begin life with relatively little education. Many factors, including health decisions, drive the vicious or virtuous cycles that are the root cause of cross-family and cross-country inequality. This is not to say convergence cannot happen. However, convergence only occurs when a country’s human capital investments far exceed those generally associated with a country at a similar per capita income level.13 While human capital theory is socio-economic at its core, it yields analysis that has serious implications for international and domestic policy-makers. The trade-offs implicit in the human capital development process imply that excessive military consumption can displace investments in a nation’s future ability to project power. In particular, America’s striking military outlays for Operation Iraqi Freedom (OIF) – conservatively estimated at $300 billion to $700 billion when compared to a continued policy of containment – combined with intensive Chinese human capital investment, is causing an unstable brand of power convergence.14 During the Cold War, in contrast, the U.S. was able to balance resource decisions relatively well. While the Soviets engaged in excessive military consumption, America invested in its people’s health and education and reaped the benefits. As China and India have learned from America’s rise, America should learn from Russia’s fall. The spread of nuclear weapons and the rise of the information economy have made technology more crucial, and thus education and health are necessarily more important. Policy-makers interested in predicting and avoiding dangerous periods of convergence in the international system should pay close attention to domestic health and education investment levels. 2.1. Traditional Vs. Human Capital Metrics of Power As mentioned, predicting changes in state power is essential to those engaged international policy formulation. Ideally, we would want a set of predictive tools which captures and tracks the roots of power by: (1) helping us forecast future economic growth; and (2) allowing us to assess relative growth in technological capabilities. Against these criteria, I will evaluate predictive models based on traditional measures of power versus human capital-based models. 2.1.1. Traditional Power Metrics In measuring the relative power of states, IR theorists commonly rely on traditional power metrics: GDP, population, conventional military strength, and technological sophistication. For instance, Robert Gilpin notes: “the concept of power is one of the most troublesome in the field of international relations…power refers simply to the military, economic, and technological capabilities of the states.”15 What can traditional power measures predict about our first criteria, or relative rates of future economic growth and decline? To answer this question, I turn again to Robert Gilpin’s “War and Change in International Politics.” In his seminal book, Gilpin seeks to
12 Eicher. 13 Barrow. 14 Steven J. Davis, Kevin M. Murphy and Robert H. Topel. “War in Iraq versus Containment”. NBER Working Paper No. 12092, March 2006. 15 Gilpin, 13.
V O L . 2 , N O . 2 — N O V E MBE R 2 0 0 6 7 1
explain changes in the international system through the differential growth of power across states. For Gilpin, the differential growth of power among states alters the cost-benefit calculations of states seeking to change the structure of the international system to their advantage, causing a disjuncture between prestige and actual power. Gilpin grimly predicts that “although resolution of a crisis through peaceful adjustment of the systemic disequilibrium is possible, the principle mechanism of change throughout history has been war.”16 In Gilpin’s theory, future power levels are determined by differential rates of economic growth. For Gilpin, “the distribution of power itself ultimately rests on an economic base, and as sources and foundations of wealth change…a corresponding redistribution of power among groups and states necessarily occurs.”17 The neoclassical notion of diminishing marginal returns causes much of the differential economic and power growth portrayed in his theory. The law of diminishing marginal returns (DMR), as formulated by neoclassical economists, states the following:
An increase in some inputs relative to other fixed inputs will, in a given state of technology, cause total output to increase; but after a point the extra output resulting from the same additions of extra inputs is likely to become less and less. This falling off of extra returns is a consequence of the fact that the new “doses” of the varying resources have less and less of the fixed resources to work with.18
Gilpin asserts that three general conclusions follow as a consequence of the law of DMR. First, as factor inputs are increased or added to another constant factor, the economic growth and power of a country will increase rapidly.19 Second, in the absence of technological innovation or increased factor input, output will increase at a decreasing rate or stagnate. Third, and most importantly, the economic growth of a country will follow an “S” curve. In other words, initially the society will grow slowly, and then it grows at an accelerated rate until it reaches a maximum rate of growth; thereafter, growth takes place at a decreasing rate.20 Gilpin predicts that in most cases a slowing growth rate is a prelude to an absolute decrease in the rate of economic growth, and therefore a prelude to the eventual economic and political decline of the society. In Gilpin’s view of differential power growth, which was consistent with the neoclassical growth models of the time, a country should not be able to maintain a leading position in the system because DMRs will make hegemony more and more difficult to maintain over time. Thus, the hegemonic power is left with three options in the face of inevitable declining power: (1) either conquer more territory, bringing more land and potentially labour into the production process; (2) innovate at a pace that outstrips the diffusion of technology; or (3) expand economically.21 In Gilpin’s theory, all three of these choices eventually create the same endpoint: a relative decline in the hegemony’s power and systemic adjustment. For Gilpin, this prediction neatly explains the rise and fall of empires over the course of human history. When we subject Gilpin’s notion of DMR returns to more modern economic theory and evidence, however, we start to see major flaws in his reasoning. Principally, the hypothesis that poor countries grow faster, on average, than rich countries – the convergence prediction – seems to be inconsistent with the cross-country evidence, which indicates that per capita growth rates have little correlation with initial levels of per capita product.22 For instance, Robert Barrow’s famous cross-country analysis of economic growth for 98 countries between 1960 and 1985 demonstrates that the average growth rate of per capita real gross domestic product from 1960 to 1985 is not significantly related to the 1960 value of real per capita GDP. In his book, however, Gilpin does consider the effect of technology in his DMR argument, which has increased at a growing rate over the relevant time period.23 Thus Gilpin’s theory can
16 Gilpin, 15. 17 Ibid, 67. 18 Paul Samuelson, Economics: An Introductory Analysis (New York: McGraw Hill, 1967), 26. 19 Gilpin. 20 Ibid. 21 Ibid. 22 Barrow. 23 Robert Fogel and Dora L. Costa, “A Theory of Technophysio Evolution, With Some Implications for Forecasting
Population, Health Care Costs, and Pension Costs,” Demography 34 (February 1997): 49-51.

7 2 IN T E R N ATI O N AL PUBLIC P O L I C Y R E VIE W
logically accommodate a system in a prolonged state of equilibrium: technology develops and spreads so quickly that all states maintain a steady rate of return on factor inputs. The seamless spread and adoption of technology, however, is a brave assumption, especially given the disparities in education levels across countries.24 Further, Gilpin provides no predictive framework or process in which to consider technology’s impact. Gilpin addresses technological innovation through the lenses of Marxism and the “new economic history,” and finds no adequate means to account for it.25 In other words, due to a lack of sufficient theory at the time, he is forced to treat technological innovation as random or exogenous, which gives us little foresight as to tomorrow’s differential rates of technological development. 3. HUMAN CAPITAL MEASURES OF POWER 3.1. Definition Human capital is the knowledge, skills, and health of people.26 The term “human capital” derives from the idea that expenditures on education, training, medical care, etc. are investments in capital. These investments share some similarities with traditional physical capital investments. For instance, human capital investments are subject to depreciation – human capital investments require maintenance and continuing investment (similar to learning and maintaining a foreign language). However, investments in education and health produce human, not physical or financial, capital because you cannot separate a person from his or her knowledge, skills, or health the way it is possible to move financial and physical assets while the owner stays put.27 Thus, human capital is not redeemable – it cannot be used as collateral.28 Also, human capital is latent. We cannot directly observe human capital. Yet we can observe it indirectly in wages (productivity), education levels, and health. Finally, human capital is unique in that the organizations that produce the educational aspect of human capital are not profit maximizing: families, universities (for the most part), and public schools.29 In an effort to keep complexity to a minimum, I will focus primarily on the educational aspects of human capital.30 However, some health aspects will be included in the modelling process. Thus, for the purposes of this paper, human capital is a function of education (EDU) and Health (HL) – measured only in quantity of years. Human Capital (H) = y (EDU, HL) 3.2. Human Capital as the Root of Current Power: Causing Economic Growth via Technology As mentioned, neoclassical economists have had no trouble explaining why, throughout history, so few countries have experienced sustained, persistent per capita economic growth. After all, if per capita economic growth is caused by the growth of land, labour, or capital, diminishing returns from additional factor inputs eventually eliminate future growth – much like what was outlined by Gilpin. The real puzzle, therefore, is not the lack of growth, but the fact that the U.S., Europe, and many Asian countries have had sustained exponential growth during the past one-hundred years.31 In turn, these select countries have utilized that economic growth to build powerful, large, and technologically sophisticated militaries, through which they project power.
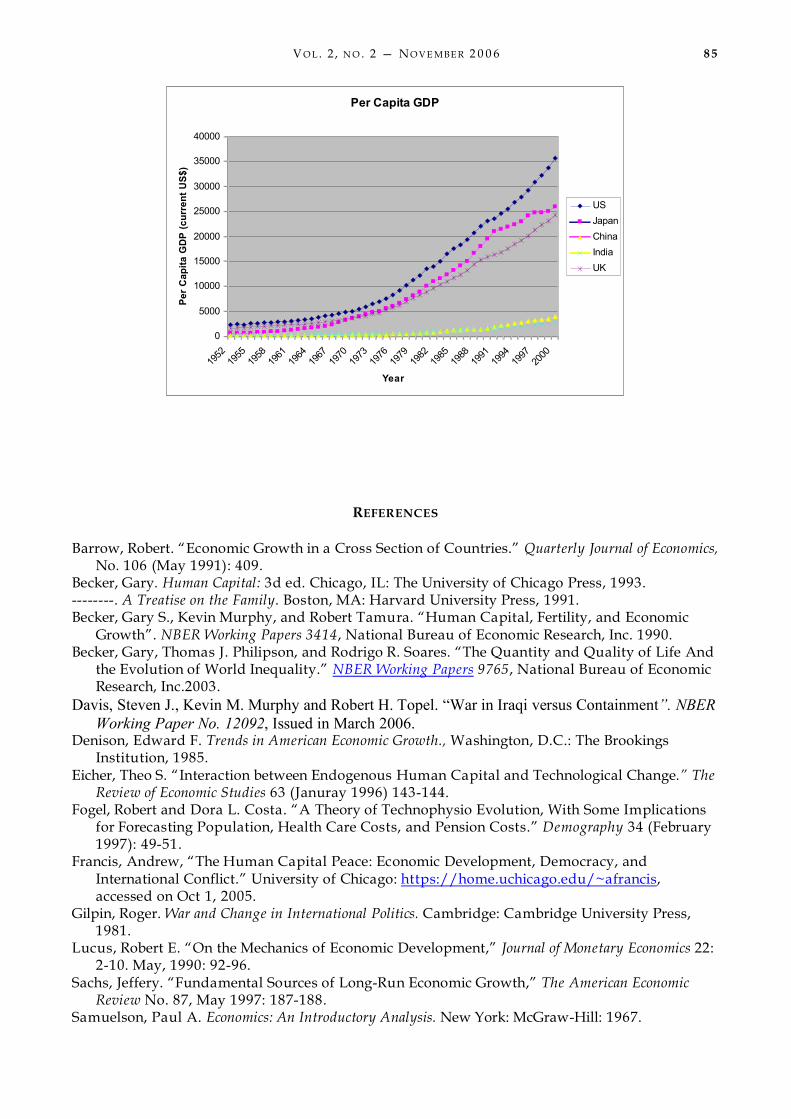
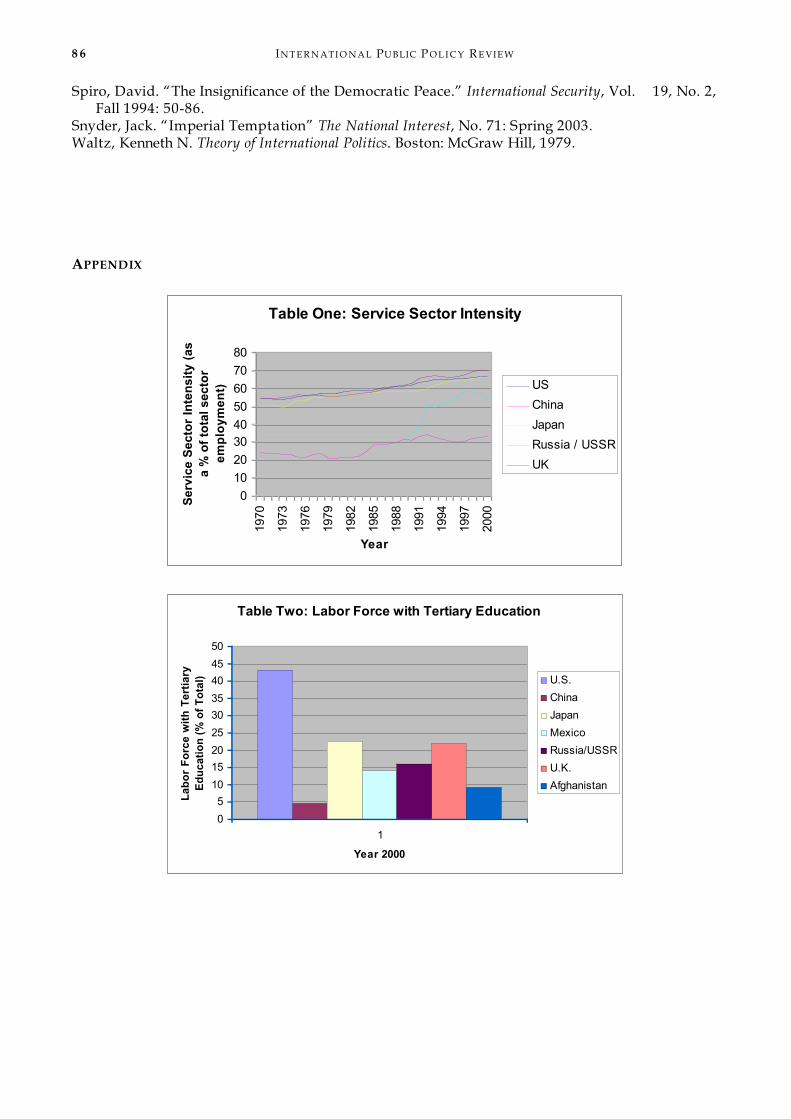
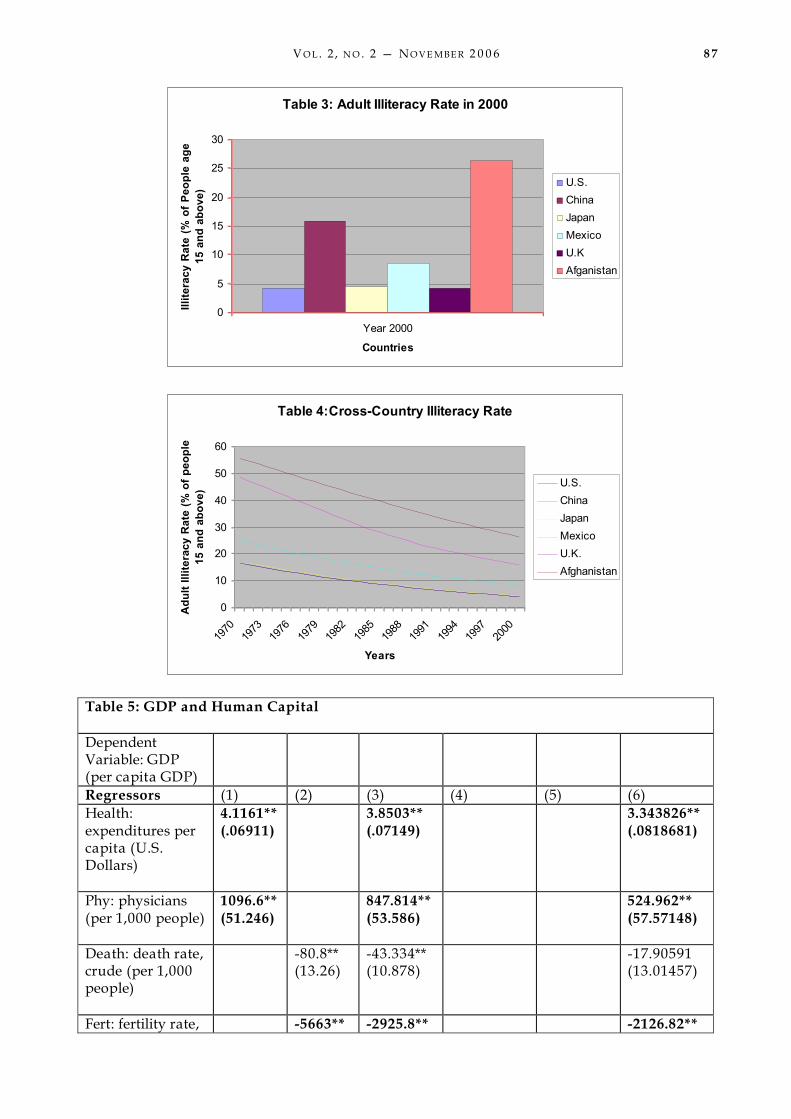
24 See Appendix, Table 2: Labour Force with Tertiary Education (as a % of the total), Table 3: Adult Illiteracy Rate in
2000, and Table 4: Cross-Country Illiteracy Rates Over Time. 25 Gilpin. 26 Becker 1993. 27 Becker 1993. 28 The fact that human capital can not be used as collateral has significant consequences. Because there is no collateral
– unless courts are willing to enforce indentured servitude or slavery contracts – human capital investments will be subject to imperfect capital markets. This makes it very hard for poorer families, as they will be forced to self-finance. Rich families, in contrast, will face no capital constraints.
29 Ibid. 30 In human capital theory, the effects of health investments reinforce and complement the education effects. Thus, the
theory does not “turn on” health aspects and I choose to omit them for simplicity. 31 Becker 1993.

V O L . 2 , N O . 2 — N O V E MBE R 2 0 0 6 7 3
Most growth analysts – including Gilpin – suspect that the answer to our puzzle lies in the accelerating rate of technological innovation among western nations, which raises the productivity of other factor inputs.32 Indeed, the rate of innovation has been staggering. Consider that in 1905 the first mechanized flying machine covered an aerial distance of only a few meters. Sixty years later, a man walked on the moon and one billion people watched it happen on television. Figure I33 The Effects of Technology on World Population
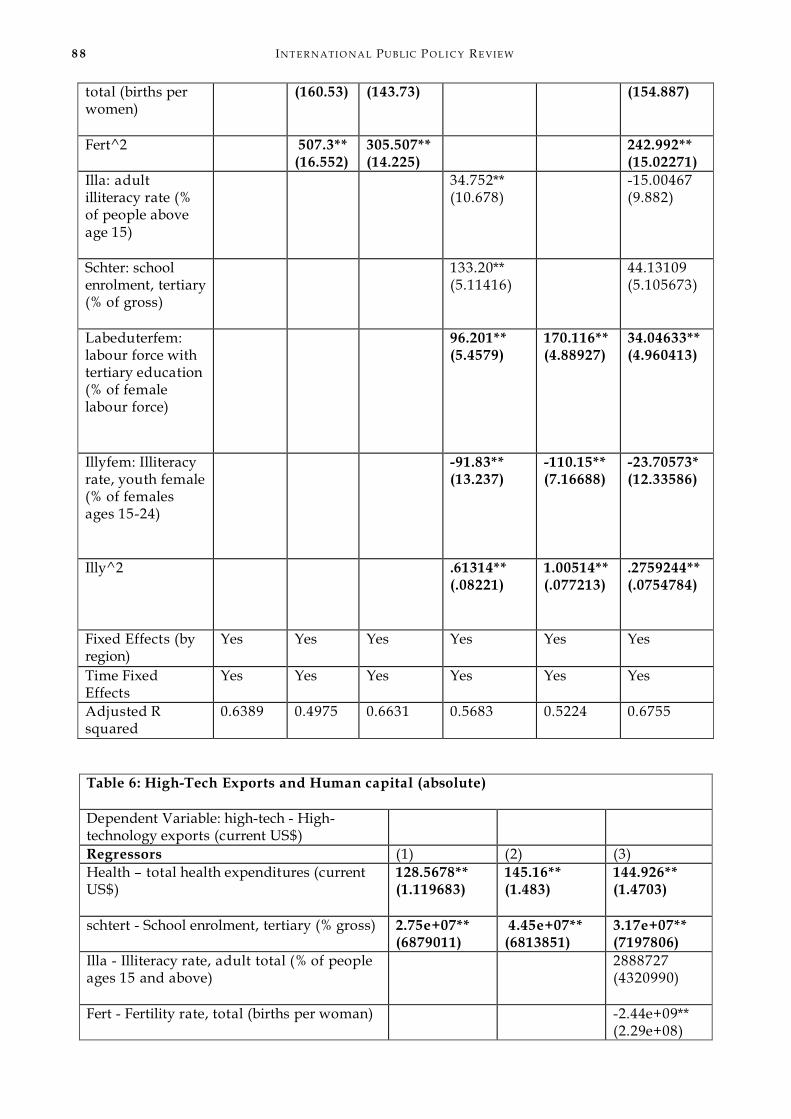
Human capital theorists agree, in part, with the assertion that technology causes growth. Human capital theorists also argue, however, that the application of scientific knowledge to the production of goods has greatly increased the value of education, technical schooling, and on-the-job training as the growth of knowledge has become embodied in people – in scientists, technicians, managers, and other contributors to output.34 Empirically, in all countries that have maintained persistent economic growth, we witness large increases in education levels and improvements to health, as measured by life quality and quantity. Table 5 in the appendix uses panel data for every country from 1950 to 2000, with fixed effects and time fixed effects, to demonstrate the robustness of the correlation between per capita GDP and nine human capital variables. 35 But which way is the causation running? Does education cause technological growth, which in turn causes growth? Or, is education simply a secondary effect of wealth, and not a cause? The answer to these various questions, as I will show, is that human capital, technology, and economic growth are synergistically linked. We should certainly be sceptical of claims that education is unrelated to technological innovation, and thus growth. After all, education is the largest input into organizations that produce technology. Universities run on brain power, not physical capital. Second, technology must be widely adopted to create substantial gains in per capital income. Education is essential to the rapid introduction of new goods and the widespread adoption of technology. The so-called “absorption effect” is widely credited for allowing inverse movements in the relative wage and supply of skilled labour in response to bursts of technological change.36 Education is also helpful in coping with changing technologies and advancing productivity in the manufacturing and service
32 See Figure I 33 This graph is taken from Robert W. Fogel’s article “Catching Up With the Economy.” American Economic Review
89 (March 1999): 2-3. 34 Becker 1993. 35 See Appendix, Table 5: Per Capita GDP and Human Capital. 36 Eicher.

7 4 IN T E R N ATI O N AL PUBLIC P O L I C Y R E VIE W
sectors. Therefore, it is difficult to presuppose a uniform, wide-spread adoption of new technologies across states – as is needed by Gilpin to account for the lack of income convergence – as states have vastly different absorption capabilities.37 Compelling evidence of the link between human capital and technology also comes from agriculture. Education is of little use in traditional agriculture because farming methods are easily passed down from parents to children. Farmers in developing countries are among the lowest skilled members of the labour force.38 By contrast, modern farmers must utilize hybrid seeds, breeding methods, chemical-based fertilizers, complicated equipment, and intricate futures markets for commodities.39 Education is of great value because it helps farmers adapt more quickly to changing technological conditions. Therefore, it is no surprise that farmers are about as well educated as industrial workers in a modern economy. The claim that human capital is the cause of growth and technology is well established in the economic growth literature.40 Economists have developed methods to break the simultaneous causation puzzle of education, human capital, and technology. For example, one study finds that the increase in schooling of the average worker between 1929 and 1985 accounts for about one-fourth of the rise in per capita GDP for that period, controlling for the effects of wealth.41 Keep in mind that this number does not consider the effects of health, on-the-job training, and other kinds of human capital.42 Since human capital is embodied knowledge and skills, and economic advancement depends on advances in technological and scientific knowledge, economic and technological development presumably depends on the accumulation of human capital.43 Tables 6 and 7 in the appendix examine the relative and absolute intensity of high tech experts for all countries from 1950 to 2000. Controlling for wealth, commercial energy production, fixed, and time fixed effects; countries that export more high technology goods (both as absolute value and as a % of exports) have higher per capita health spending, larger tertiary enrolment levels (as a % of gross), and a more highly educated labour force. Moreover, as we model human capital investment, we discover that initial levels of human capital are highly predictive of future human capital levels. Therefore, human capital levels are predictive of economic and technological advancement. 4. PREDICTING STRUCTURAL CHANGE WITH HUMAN CAPITAL VARIABLES 4.1. Model Assumptions While neoclassical economists and IR theorists, such as Robert Gilpin, predict convergence (in the absence of technological advancement), human capital theorists predict very different patterns of growth. Introducing human capital as a factor input allows us to introduce the concept of increasing marginal returns. The reasoning behind this assumption is that education and other sectors that produce human capital use educated and other skilled inputs more intensively than sectors that produce consumption goods and physical capital.44 The assumption of a rising rate of return on education is not unique to economists. There is a similar assumption in the education literature, which maintains that learning of complicated mathematics and other advanced materials is more efficient when the building blocks of elementary education are firmly in place.45
37 See Appendix: Tables 2,3, and 4. 38 Becker 1993. 39 Ibid. 40 Robert E. Lucus, On the Mechanics of Economic Development,” Journal of Monetary Economics 22 (May 1990): 92-96. 41 Edward F. Denison. Trends in American Economic Growth (Washington, D.C.: The Brookings Institute, 1985). 42 The effects of health are well documented by University of Chicago professor Robert Fogel, who notes that
dramatic health improvements over the past 100 years have allowed humans to dramatically increase body size, life expectancy, and vital organ function to the point that we are physiologically distinct from other generations of Homo sapiens.
43 Becker 1993. 44 Gary S. Becker, Kevin Murphy, and Robert Tamura. “Human Capital, Fertility, and Economic Growth”. NBER Working Papers 3414, National Bureau of Economic Research, Inc. 1990. 45 Ibid.
V O L . 2 , N O . 2 — N O V E MBE R 2 0 0 6 7 5
The inter-generational approach also relies on assumptions about fertility rates and population demographics. Namely, higher fertility rates in the current generation “increase the discount on per capita future consumption in the inter-temporal utility functions that guide consumption and other decisions.”46 Vp = u(c) + a(n)Vnt+1, where c = parental consumption, n = number of children, a = discount rate
This assumption means that high fertility rates discourage investment in human capital by increasing the discount rate of investment in children relative to consumption – a result backed by very robust empirical results.47 Conversely, high human capital stocks reduce the demand for children because time is the largest input in caring for and producing children, and time is expensive for high human capital individuals.48 Hence in developed countries, the shadow price of children overwhelms the income effect associated with an increase in income for a normal good (children) – even when strict separability in the utility function is assumed. Thus, in a country such as Somalia, where child mortality is very high, a parent faces a low shadow price of children; due to low returns for investment in human capital and a relatively high wage for child labour. In a modern economy the probability of death is very low, and the value of human capital investments to the child is very high and increasing. Thus, increasing human capital levels creates the incentive to make a shift from quantity to quality of children. This effect explains why poorer people, across and within countries, tend to have more children. The quantity / quality trade-off, along with the assumption of increasing returns to human capital investment, reinforces a two steady state conclusion: a high fertility, low human capital society that is stagnating; and a low fertility and high human capital society that is growing. Thus initial levels of human capital, technology, and subsequent productivity shocks, determines whether a country grows or stagnates. 5. A MODEL OF HUMAN CAPITAL To further demonstrate why human capital is the root of differential power growth, I will quickly present a family-based microeconomic model. The model examines investments in children. It will neatly and quickly illustrate the recursive properties of human capital investments, and how these virtuous and vicious cycles are the cause of cross-country and cross-family income inequality. 5.1 The Family Model49 Taking the assumptions above, the simple formulation is: Vt = U(Cp) + aU(Yc) •Utility function faced by parents, Cp is parental consumption, Yc is
parental investments in the child, and (a) is a discount rate Subject to budget constraint Wp = Cp + Yc •Budget constraint, parents can only spend on consumption or
invest in their children Hc = f(Yc, Hp, Ap) •The child’s human capital is some function of parental investment,
parental human capital, and ability - with a degree of inheritability greater than zero but less than one.
46 Ibid. 47 Barrow; See Table 5 in Appendix. 48 Gary S. Becker, A Treatise on the Family (Boston: Harvard University Press, 1991). 49 Becker 1991.
7 6 IN T E R N ATI O N AL PUBLIC P O L I C Y R E VIE W
Wp = (Hp) •Parent’s wealth is a function of their human capital. This assumption is based on a robust empirical base, as the correlation between education and income is one of the strongest in the social sciences (Becker 1993).50
With: U’ > 0, U’’ < 0, and a’ < 0 Although the model can be easily adapted to include many aspects, I chose to utilize the simplest possible formulation to demonstrate the recursive effects on human capital: a one parent, one child, and a two period model. To adopt the model to cross-country evaluations, simply use the average variable value for each country and the effects will hold. Without formally deriving a single variable we can witness an income effect in the budget constraint, whereby rich parents will spend more on both consumption (c) and investments in children (Yc). The fact that human capital cannot be used as collateral strengthens this effect. Because human capital cannot be used as collateral against a loan – unless courts are willing to enforce indentured servitude or slavery contracts – capital markets will be inefficient, forcing poor families to internally finance. Rich families, in contrast, will be able to invest in their children to the point where the marginal returns to capital equal the marginal returns to human capital investment. Thus, if we assume that poor parents are as good at investing their children as rich parents; imperfect capital markets mean that the children of richer parents still receive more human capital investment, even though the children of poorer parents have a higher marginal return. Evidence suggests, however, that high human capital parents are more able investors in their children’s human capital. In simple Markov form: Hc = α + IHp + ε, where Hc = child’s human capital, Hp = parent’s human capital, I = ability of investor (if 1 < I < 0, then high human capital parents are better investors), and ε = luck.51 Further, if we incorporate the child’s ability, the children of high human capital parents become even more productive investments. It makes no difference to us whether ability is genetically transmitted or learned. To arrive at this conclusion we only need to assume the following: (1) on average, the children of high ability parents will be more able than the children of less able parents; and (2) that more able children will pursue more education. In simple Markov form: Ac = α + hAp + ε, where Ac = child’s ability, h = degree of inheritability (if 1 < h < 0, then high ability parents are more likely to have high ability children). Now, the degree of inequality among families is a function of the investment skill of the parent (I), the degree of inheritability (h), and the willingness of poorer families to reduce current consumption in order to internally finance human capital investments. Hence, the theory makes two fundamental predictions: (1) an income effect where richer parents, unconstrained by capital markets, will invest more in their children’s human capital; (2) a substitution effect whereby the children of richer parents will be more productive investments, meaning that richer parents not only invest more absolute resources in their children, they invest more relative resources.52 Another feature of human capital investments is that investments in a single child are subject to diminishing marginal returns. After all, the learning of an individual child is limited by the finite nature of time – only 24 hours in the day. Recursive inter-generational human capital investments, however, are not subject to DMR. If we expand this model from two to three periods, we see that there is no DMR on the ability to create knowledge – this rests on the assumptions made above about the nature of learning and the factor inputs of knowledge. For instance, a few years ago, as part of a college-wide activity, undergraduates at the University of Chicago designed a nuclear reactor from scratch without faculty assistance. Fifty years ago, the same activity at the same university required the brightest minds in the world and the resources of the Manhattan Project. When we expand the model beyond two time periods, we also see how cross-family inequalities are reinforced over time. As children mature into adulthood, they face decisions about continued investments in human capital. Extensive evidence suggests that high human capital
50 See cross-country evidence in this paper. 51 Becker, 1991 52 Ibid.

V O L . 2 , N O . 2 — N O V E MBE R 2 0 0 6 7 7
people (or nations) will have a greater incentive to invest in human capital into adulthood because of increasing returns to human capital investment.53 For instance, the child of rich parents with an elite private school education is much better equipped than a poor child from Chicago’s South Side to pursue a graduate education. In fact, this inequality magnifies if we bring our ability and parental investment variables back into the analysis. Remember that initial human capital levels are determined by our parents’ investment choices. Thus, poor people and countries face a double disadvantage: namely, decisions to invest in human capital later in life will depend upon their parent’s investment decisions. When we integrate the models into a three period formulation we get a formal expression of the “double disadvantage” conclusion:54 Vt = U(Cp) + aU(Wc) Subject to budget constraint Wp = Cp + Yc Wc = rHc H1 = f(Yc, Hp), Childhood: human capital depends on parents’ investment decisions
and parents’ ability to invest in their children’s human capital, which is a function of parents’ human capital levels
H2 = f(H1, Y2), Early Adult: human capital depends on human capital levels in
childhood and self investments in early adulthood, which are dependent on childhood investments
H3 = rH2, Later Adult: human capital depends on human capital levels in the early adult period and r, which is the rental price of capital
These strong recursive effects explain patterns of economic growth over the past 150 years better than the neoclassical models. For instance, Barro’s cross-country economic growth study found that for a given starting value of per capita GDP, a country’s subsequent growth rate is positively related to measures of initial human capital. At first glance, the model seems to predict that the rich countries will get richer, while the poor get poorer or grow more slowly. Yet, if this is true, how do we explain the dramatic growth of countries like China and India? Over the past 15 years, they have grown rapidly from low levels of initial human capital. Barro goes on to explain that: “given the human capital variables, subsequent growth is substantially negatively related to the initial levels of per capita income.”55 Thus, for China and India, their growth can be explained by the fact that their human capital levels far exceed those generally associated with a country at a similar per capita income level. While current GDP levels, military strength, and technological development, tell us nothing about tomorrow; human capital investment levels are a sound predictor of economic and technological growth.56 Yet human capital is latent. How do we observe and measure human capital? Economists usually look at fertility rates and education levels to formulate human capital indices. Fertility rates are a key component of the family model, and are easily available.57 Education levels are somewhat more difficult to measure, especially in the developing world. However, both measures are easier to understand and use than most variables used in IR.58
53 Becker, 1991. 54 Ibid. 55 Barrow, 409-411. 56 See figure I, and Appendix, Table 5. 57 See figure V, and Appendix, Table 5. 58 For instance, the statistical side of the democratic peace debate remains bogged down by conflicting definitions of
what constitutes a war, a democracy, and even an alliance (Spiro 1994).
7 8 IN T E R N ATI O N AL PUBLIC P O L I C Y R E VIE W
Human capital variables are subject to measurement error, but are far more suitable for “large N” analysis. If we can agree to use human capital as a proxy for power, then new avenues in statistical testing should open up to IR theorists. 6. MODELLING HUMAN CAPITAL AND MILITARY TECHNOLOGY LEVELS Human capital formulation not only changes the incentives faced by families, it also changes the incentives faced by militaries – the organ most commonly associated with the balance of power. Andrew Francis, a Ph.D. candidate in the department of Economics at the University of Chicago, finds that human capital is negatively associated with the likelihood of conflict at both the dyad and nation levels of analysis.59 Since human capital raises the value of life and in turn the economic cost of injury and death, Francis postulates that it increases the cost of international conflict. At the dyad level, this relationship holds with and without controls for the potential complementarities between human capital and military productivity. This is not to argue that educated countries are morally superior or inherently more peaceful. In fact, when the countries in the dyadic pairs are labelled with either an L or an H (L corresponds to the lower level of human capital in the dyad and H the higher human capital country), the L is a more important determinant of peace than the H. In other words, holding real per capital GDP constant, changes in the human capital of the less developed country have a greater impact on the likelihood of militarized conflict between a pair of countries.60 Thus, low human capital countries become relatively more pacific with each additional “unit” of human capital. The pacifying effect of human capital, especially for low human capital countries, is, I believe, part of a military substitution effect driven by rising human capital stores. Human capital investments provide people with skills that are valued in the labour market. Hence, the opportunity cost associated with military service and, consequently, the amount that the government will have to compensate those who choose to work in the military sector both increase with human capital. Even if military service is not voluntary, human capital raises the cost of conflict on the budgetary, expenditure, and liability side, especially if civilian deaths are involved.61 The increasing cost of manpower (i.e. military labour) will affect military resource allocation decisions. Specifically, high human capital countries will face the incentive to substitute toward technology intensive warfare and weapons. This substitution effect is accelerated by the notion that countries with high human capital stores may be better able to develop military weapons through research and development effect.62 The extent to which there is an open market for weapons – i.e. countries with low human capital can purchase military technology developed by high human capital countries – moderates the second effect.63 Nevertheless these powerful substation incentives may be responsible for driving down U.S. troop numbers over the past decade. Also, this logic points to the folly of the Iraq occupation. Powerful incentives have made the U.S. military relatively technology intensive, and, therefore, unable to perform labour intensive tasks, such as large occupations.64
59 Andrew Francis, “The Human Capital Peace: Economic Development, Democracy, and International Conflict.”
University of Chicago: https://home.uchicago.edu/~afrancis, accessed on Oct 1, 2005. 60 Ibid. 61 The Coase Theorem implies that political leaders will generally have the incentive to utilize human resources in an
efficient manner, especially when powerful autocrats exercise de facto ownership over citizens. Note that this logic contrasts with the Kantian view that a monarch or dictator, isolated from the direct burdens of battle, will heedlessly enter into war (Francis 2005).
62 See Appendix, Tables 7 and 8, which demonstrate that levels of high technology exports are highly correlated with human capital levels, controlling for income, energy production, fixed, and time fixed effects.
63 Francis. 64 Under the theory, if occupation is to occur, then natural resource rich countries are more likely to be occupied. The
wealth of high human capital countries is embodied in its people. Such wealth can only be extracted via slavery – a difficult and frowned upon practice. In this sense, increasing human capital levels reduce the likelihood of being concurred by a rational advisory.
V O L . 2 , N O . 2 — N O V E MBE R 2 0 0 6 7 9
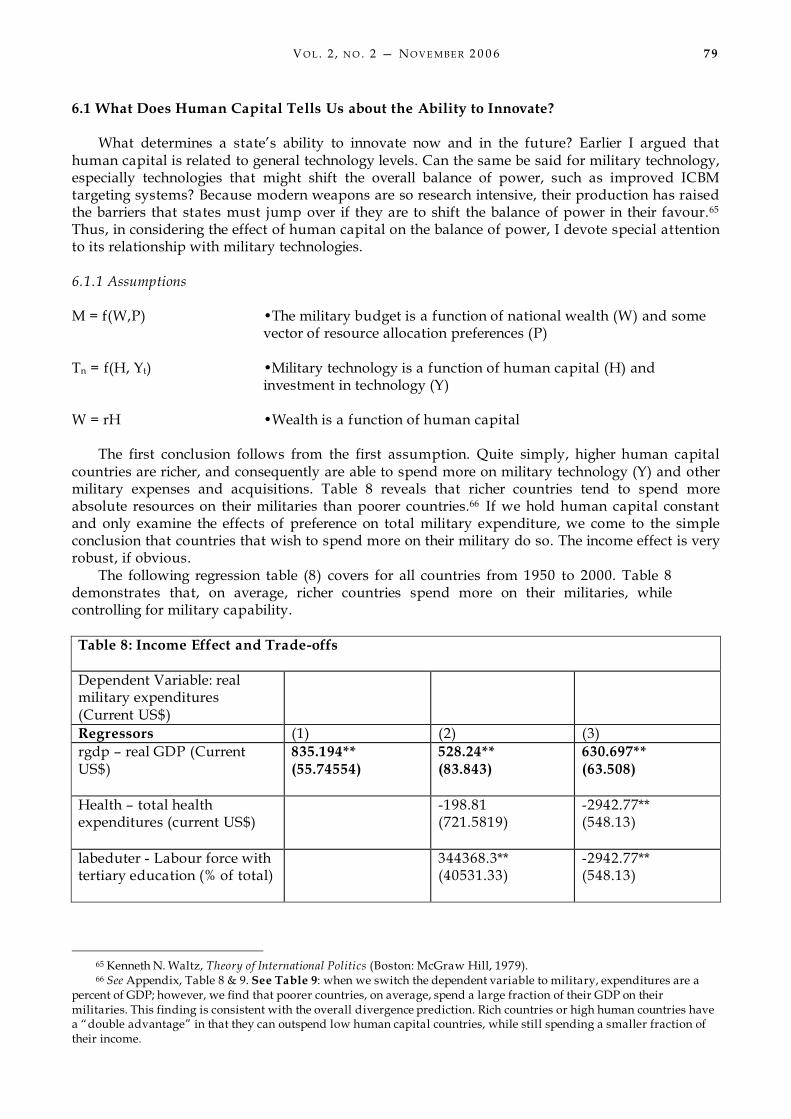
6.1 What Does Human Capital Tells Us about the Ability to Innovate? What determines a state’s ability to innovate now and in the future? Earlier I argued that human capital is related to general technology levels. Can the same be said for military technology, especially technologies that might shift the overall balance of power, such as improved ICBM targeting systems? Because modern weapons are so research intensive, their production has raised the barriers that states must jump over if they are to shift the balance of power in their favour.65 Thus, in considering the effect of human capital on the balance of power, I devote special attention to its relationship with military technologies. 6.1.1 Assumptions M = f(W,P) •The military budget is a function of national wealth (W) and some
vector of resource allocation preferences (P) Tn = f(H, Yt) •Military technology is a function of human capital (H) and
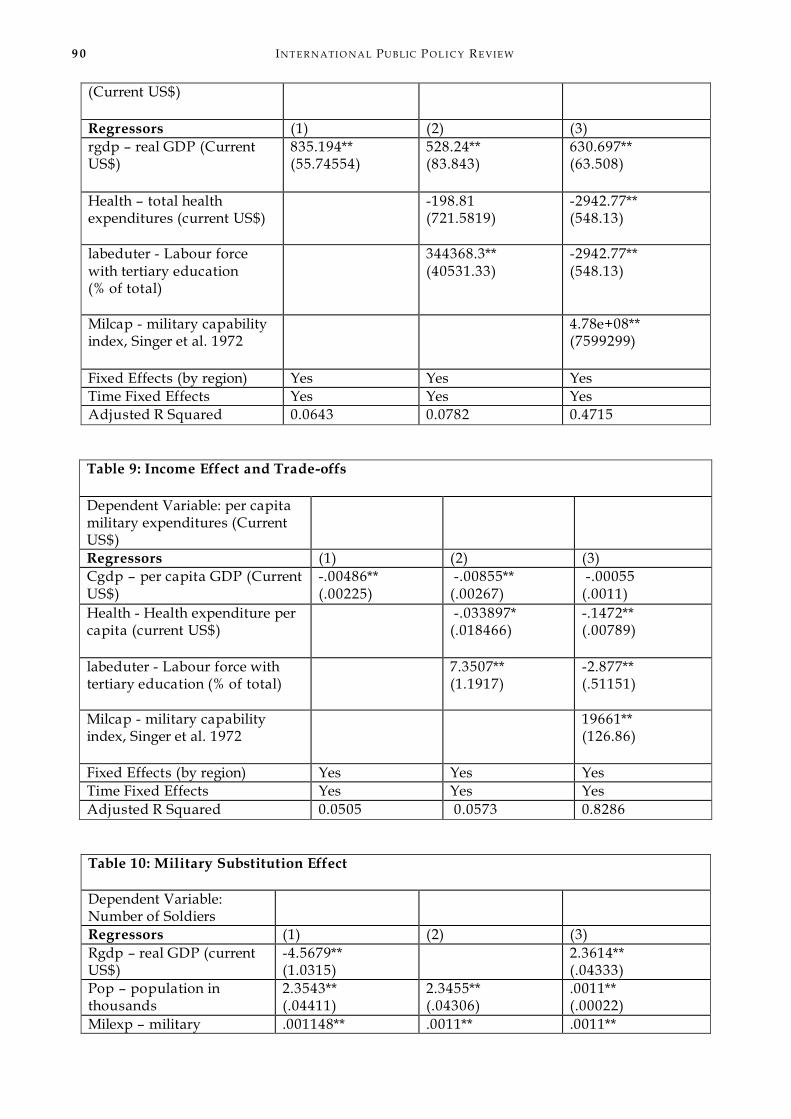
investment in technology (Y) W = rH •Wealth is a function of human capital The first conclusion follows from the first assumption. Quite simply, higher human capital countries are richer, and consequently are able to spend more on military technology (Y) and other military expenses and acquisitions. Table 8 reveals that richer countries tend to spend more absolute resources on their militaries than poorer countries.66 If we hold human capital constant and only examine the effects of preference on total military expenditure, we come to the simple conclusion that countries that wish to spend more on their military do so. The income effect is very robust, if obvious. The following regression table (8) covers for all countries from 1950 to 2000. Table 8 demonstrates that, on average, richer countries spend more on their militaries, while controlling for military capability. Table 8: Income Effect and Trade-offs
Dependent Variable: real military expenditures (Current US$)
Regressors (1) (2) (3) rgdp – real GDP (Current US$)
835.194** (55.74554)
528.24** (83.843)
630.697** (63.508)
Health – total health expenditures (current US$)
-198.81 (721.5819)
-2942.77** (548.13)
labeduter - Labour force with tertiary education (% of total)
344368.3** (40531.33)
-2942.77** (548.13)
65 Kenneth N. Waltz, Theory of International Politics (Boston: McGraw Hill, 1979). 66 See Appendix, Table 8 & 9. See Table 9: when we switch the dependent variable to military, expenditures are a
percent of GDP; however, we find that poorer countries, on average, spend a large fraction of their GDP on their militaries. This finding is consistent with the overall divergence prediction. Rich countries or high human countries have a “double advantage” in that they can outspend low human capital countries, while still spending a smaller fraction of their income.

8 0 IN T E R N ATI O N AL PUBLIC P O L I C Y R E VIE W
Milcap - military capability index, Singer et al. 1972
4.78e+08** (7599299)
Fixed Effects (by region) Yes Yes Yes Time Fixed Effects Yes Yes Yes Adjusted R Squared 0.0643 0.0782 0.4715
The model also allows us to witness and test a substitution effect. Because the production of military technology is a function of human capital (H) and absolute levels of military technology spending (Yt), we expect to see high (H) countries invest a larger percentage of their military budgets on technology, since high (H) countries experience higher returns to technological investment. This effect is catalyzed by the increasing cost of military labour associated with increases in human capital. Thus, an increase in human capital will cause a country to invest more relative resources in technology and less in labour: a substitute toward technology and away from labour. Table 10: Military Substitution Effect67 Dependent Variable: Number of Soldiers
Regressors (1) (2) (3) Rgdp – real GDP (current US$)
-4.5679** (1.0315)
2.3614** (.04333)
Pop – population in thousands
2.3543** (.04411)
2.3455** (.04306)
.0011** (.00022)
Milexp – military expenditures in thousands
.001148** (.00023)
.0011** (.0002)
.0011** (.00022)
Milcap - military capability index, Singer et al. 1972.
8756029** (23820.1)
90322** (309662)
88041** (318091.5)
Dem – Polity IV score -6614.9** (477.43)
-6461.472** (479.608)
Growth – % growth in real GDP
-3538.54** (36.61)
-6614.9** (477.43)
-3105.7** (528.065)
Hitech - High-technology exports (current US$)
-2.20e-06** (5.58e-07
-2.47e-06** (5.45e-07)
-2.28e-06** (5.48e-07)
Schtert – School enrolment, tertiary (% gross)
-539.0205* (434.054)
-145.65 (427.4513)
-71.4099* (427.7596)
labeduter - Labour force with tertiary education (% of total)
-4271.08** (971.04)
-1911.82** (970.384)
-1925.729** (969.559)
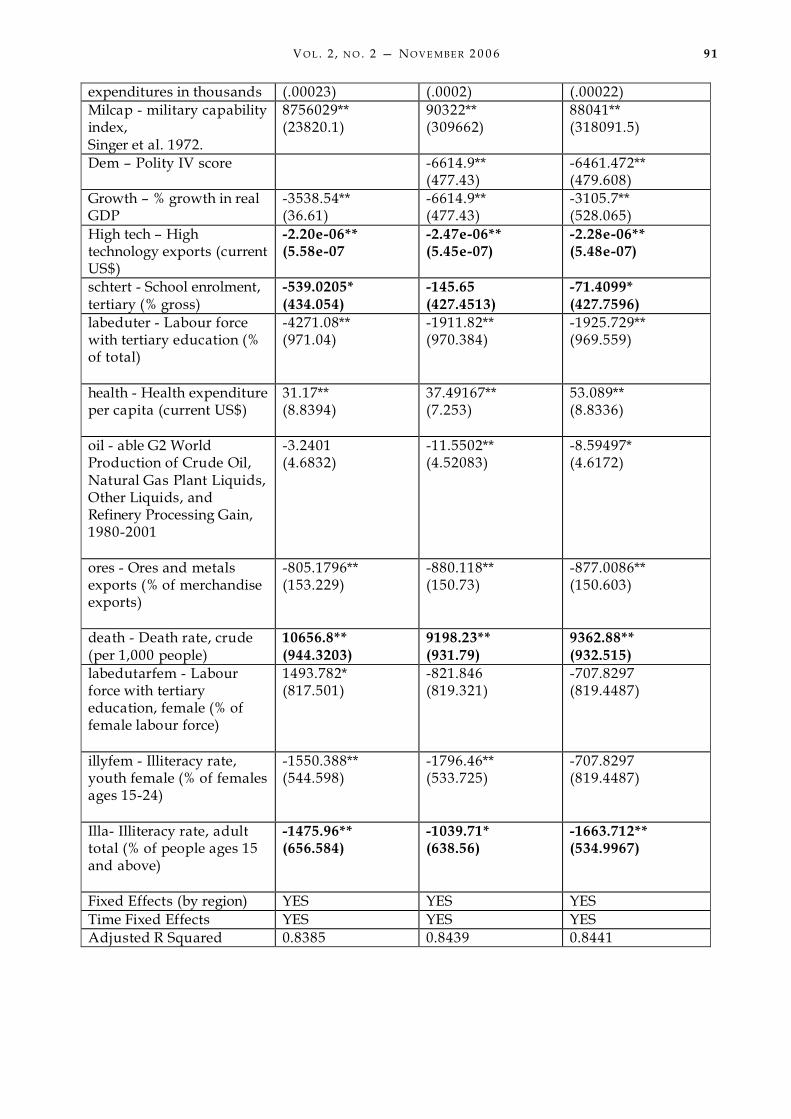
67The regression table (10) covers all countries from 1950 to 2000. The model examines the average effect of
increasing national troop numbers on seven human capital measures, controlling for: national wealth, population, military expenditures, military capability, form of government (polity score), economic growth, volume of high technology exports, and two measures of natural resource wealth. Even after controlling for so many variables, the negative effects on the human capital variables are uniformly negative and acute (except for health spending per capita). In this formulation, choosing a dependent variable is problematic. By selecting troop numbers and controlling for so many characteristics, I seek to demonstrate the substitution effect away from labour, or less spending per soldier. However, I cannot prove that resources are being shifted to technology investments. This is hard to prove because detailed cross-country time series military budgets are tough to acquire.
V O L . 2 , N O . 2 — N O V E MBE R 2 0 0 6 8 1
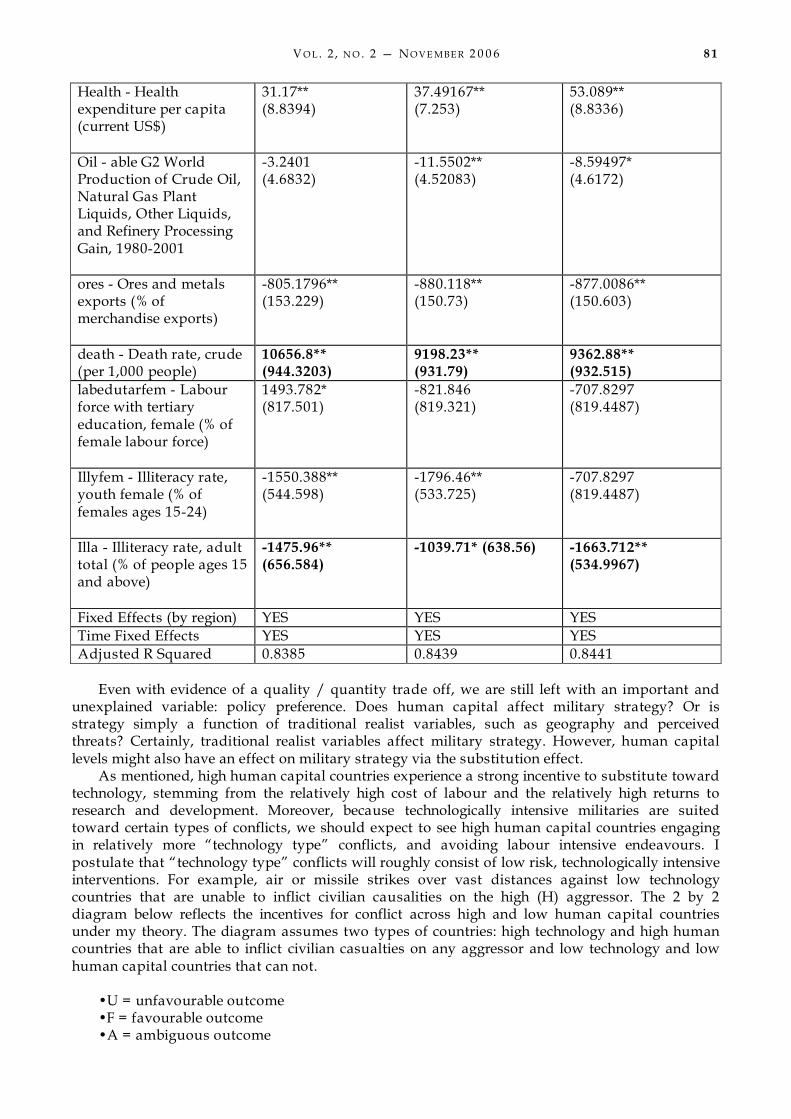
Health - Health expenditure per capita (current US$)
31.17** (8.8394)
37.49167** (7.253)
53.089** (8.8336)
Oil - able G2 World Production of Crude Oil, Natural Gas Plant Liquids, Other Liquids, and Refinery Processing Gain, 1980-2001
-3.2401 (4.6832)
-11.5502** (4.52083)
-8.59497* (4.6172)
ores - Ores and metals exports (% of merchandise exports)
-805.1796** (153.229)
-880.118** (150.73)
-877.0086** (150.603)
death - Death rate, crude (per 1,000 people)
10656.8** (944.3203)
9198.23** (931.79)
9362.88** (932.515)
labedutarfem - Labour force with tertiary education, female (% of female labour force)
1493.782* (817.501)
-821.846 (819.321)
-707.8297 (819.4487)
Illyfem - Illiteracy rate, youth female (% of females ages 15-24)
-1550.388** (544.598)
-1796.46** (533.725)
-707.8297 (819.4487)
Illa - Illiteracy rate, adult total (% of people ages 15 and above)
-1475.96** (656.584)
-1039.71* (638.56) -1663.712** (534.9967)
Fixed Effects (by region) YES YES YES Time Fixed Effects YES YES YES Adjusted R Squared 0.8385 0.8439 0.8441
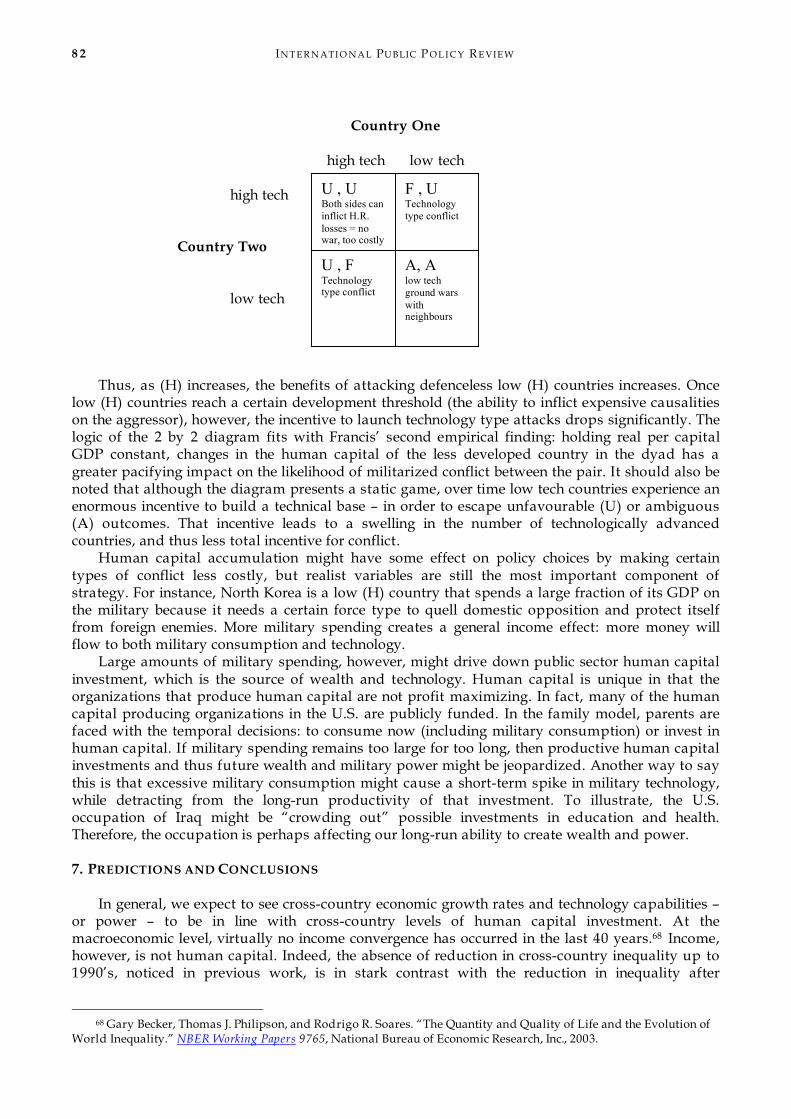
Even with evidence of a quality / quantity trade off, we are still left with an important and unexplained variable: policy preference. Does human capital affect military strategy? Or is strategy simply a function of traditional realist variables, such as geography and perceived threats? Certainly, traditional realist variables affect military strategy. However, human capital levels might also have an effect on military strategy via the substitution effect. As mentioned, high human capital countries experience a strong incentive to substitute toward technology, stemming from the relatively high cost of labour and the relatively high returns to research and development. Moreover, because technologically intensive militaries are suited toward certain types of conflicts, we should expect to see high human capital countries engaging in relatively more “technology type” conflicts, and avoiding labour intensive endeavours. I postulate that “technology type” conflicts will roughly consist of low risk, technologically intensive interventions. For example, air or missile strikes over vast distances against low technology countries that are unable to inflict civilian causalities on the high (H) aggressor. The 2 by 2 diagram below reflects the incentives for conflict across high and low human capital countries under my theory. The diagram assumes two types of countries: high technology and high human countries that are able to inflict civilian casualties on any aggressor and low technology and low human capital countries that can not. •U = unfavourable outcome •F = favourable outcome •A = ambiguous outcome
8 2 IN T E R N ATI O N AL PUBLIC P O L I C Y R E VIE W
Country One
high tech low tech high tech Country Two low tech Thus, as (H) increases, the benefits of attacking defenceless low (H) countries increases. Once low (H) countries reach a certain development threshold (the ability to inflict expensive causalities on the aggressor), however, the incentive to launch technology type attacks drops significantly. The logic of the 2 by 2 diagram fits with Francis’ second empirical finding: holding real per capital GDP constant, changes in the human capital of the less developed country in the dyad has a greater pacifying impact on the likelihood of militarized conflict between the pair. It should also be noted that although the diagram presents a static game, over time low tech countries experience an enormous incentive to build a technical base – in order to escape unfavourable (U) or ambiguous (A) outcomes. That incentive leads to a swelling in the number of technologically advanced countries, and thus less total incentive for conflict. Human capital accumulation might have some effect on policy choices by making certain types of conflict less costly, but realist variables are still the most important component of strategy. For instance, North Korea is a low (H) country that spends a large fraction of its GDP on the military because it needs a certain force type to quell domestic opposition and protect itself from foreign enemies. More military spending creates a general income effect: more money will flow to both military consumption and technology. Large amounts of military spending, however, might drive down public sector human capital investment, which is the source of wealth and technology. Human capital is unique in that the organizations that produce human capital are not profit maximizing. In fact, many of the human capital producing organizations in the U.S. are publicly funded. In the family model, parents are faced with the temporal decisions: to consume now (including military consumption) or invest in human capital. If military spending remains too large for too long, then productive human capital investments and thus future wealth and military power might be jeopardized. Another way to say this is that excessive military consumption might cause a short-term spike in military technology, while detracting from the long-run productivity of that investment. To illustrate, the U.S. occupation of Iraq might be “crowding out” possible investments in education and health. Therefore, the occupation is perhaps affecting our long-run ability to create wealth and power. 7. PREDICTIONS AND CONCLUSIONS In general, we expect to see cross-country economic growth rates and technology capabilities – or power – to be in line with cross-country levels of human capital investment. At the macroeconomic level, virtually no income convergence has occurred in the last 40 years.68 Income, however, is not human capital. Indeed, the absence of reduction in cross-country inequality up to 1990’s, noticed in previous work, is in stark contrast with the reduction in inequality after
68 Gary Becker, Thomas J. Philipson, and Rodrigo R. Soares. “The Quantity and Quality of Life and the Evolution of
World Inequality.” NBER Working Papers 9765, National Bureau of Economic Research, Inc., 2003.
U , U Both sides can inflict H.R. losses = no war, too costly
U , F Technology type conflict
F , U Technology type conflict
A, A low tech ground wars with neighbours

V O L . 2 , N O . 2 — N O V E MBE R 2 0 0 6 8 3
incorporating gains in health – measured in quality and quantity of years. Incorporating longevity into a “full” measure of income changes traditional results; countries starting with lower incomes tended to grow faster than countries starting with higher incomes. Becker, Philipson, and Soares, researchers at the University of Chicago, “estimate an average yearly growth in “full-income” of 4.1 percent for the poorest 50% countries in 1960, of which 1.7 percentage points are due to health, as opposed to a growth of 2.6 percent for the richest 50% countries, of which only 0.4 percentage points are due to health.”69 Thus, the neoclassical convergence prediction has the right conclusion, but with the wrong reasoning. In human capital models, convergence can still take place under two conditions: (1) long-term convergence; when the leading state in the system allocates too much wealth toward military consumption, thus “crowding-out” public sector human capital investments, while a non-hegemonic state(s) invest more wisely in their own human capital; or (2) a short-term convergence where a low (H) country engages in overly burdensome defence spending. Short-term convergence is short-term because such investments will become unsustainable due to depreciation of (H). The Soviet Union is a prime exemplar of short-term convergence. The technological emergence of China and India might seem to be unexplained by the two conditions of convergence put forward, but, in fact, both cases fit under long-term convergence. China and India’s technological and economic growth is underpinned by human capital investments that far exceed those generally associated with a country at a similar per capita income level – witness their vast improvements in life expectancy. Simply put, their relative rates of (H) investment are large, and the growths of their human capital investment rates can, theoretically, serve as a measure of their ability innovate and grow in the future. Despite China and India’s recent and intense investments in (H), however, the U.S. benefits from an enormous lead in initial human capital endowments. As initial levels of human capital are the best predictor of future human capital levels, it should come as no surprise that the United Sates enjoys technological primacy. Unable to spend or produce at American levels for research, development, and weapons production, middle powers who try to compensate with short-term spending sprees will find themselves constantly falling behind.70 The current state of affairs, however, does not mean that the U.S. is free to make poor allocation decisions without suffering any consequences. After all, just because the U.S. is experiencing strong incentives to invest in technology, avoid labour intensive wars, and invest in human capital does not mean that the U.S. will do so. The makers of U.S. foreign policy should be especially wary of China’s recent educational achievement, coupled with classic “imperial overstretch” – as described by Jack Snyder.71 Traditionally, the U.S. has been able to balance resource decisions relatively well. The spread of nuclear weapons and the modern economy have made technology more crucial, and thus education is necessarily more important. Policy-makers should be aware that the next great power shift will likely be the technological ability to break the dynamic of mutually assured destruction (MAD) that has keep the peace between the great powers for more than 50 years. That innovation will be the result of sustained investments in human capital. For the sake of stability, America’s educational and health infrastructure must up to the task.
69 Ibid, 1 70 Waltz. 71 Jack Snyder, “Imperial Temptation,” The National Interest 71 (Spring 2003).

8 4 IN T E R N ATI O N AL PUBLIC P O L I C Y R E VIE W
BASIC COMPARATIVE STATISTICS
School enrollment, tertiary (% gross)
0
10
20
30
40
50
60
70
80
90
1965
1967
1969
1971
1973
1975
1977
1979
1981
1983
1985
1987
1989
1991
1993
1995
1997
1999
Year
Sc
ho
ol
en
roll
me
nt,
te
rtia
ry (
% g
ros
s)
US
Japan
China
India
UK
Health Expenditure Per Person
0
500
1000
1500
2000
2500
3000
3500
4000
4500
1990 1991 1992 1993 1994 1995 1996 1997 1998 1999 2000
Year
He
alt
h E
xp
en
dit
ure
Pe
r P
ers
on
(th
ou
sa
nd
s
US
$)
US
Japan
China
India
UK
V O L . 2 , N O . 2 — N O V E MBE R 2 0 0 6 8 5
Per Capita GDP
0
5000
10000
15000
20000
25000
30000
35000
40000
19521955195819611964196719701973197619791982198519881991199419972000
Year
Pe
r C
ap
ita
GD
P (
cu
rre
nt
US
$)
US
Japan
China
India
UK
REFERENCES Barrow, Robert. “Economic Growth in a Cross Section of Countries.” Quarterly Journal of Economics,
No. 106 (May 1991): 409. Becker, Gary. Human Capital: 3d ed. Chicago, IL: The University of Chicago Press, 1993. --------. A Treatise on the Family. Boston, MA: Harvard University Press, 1991. Becker, Gary S., Kevin Murphy, and Robert Tamura. “Human Capital, Fertility, and Economic
Growth”. NBER Working Papers 3414, National Bureau of Economic Research, Inc. 1990. Becker, Gary, Thomas J. Philipson, and Rodrigo R. Soares. “The Quantity and Quality of Life And
the Evolution of World Inequality.” NBER Working Papers 9765, National Bureau of Economic Research, Inc.2003.
Davis, Steven J., Kevin M. Murphy and Robert H. Topel. “War in Iraqi versus Containment”. NBER Working Paper No. 12092, Issued in March 2006.
Denison, Edward F. Trends in American Economic Growth., Washington, D.C.: The Brookings Institution, 1985.
Eicher, Theo S. “Interaction between Endogenous Human Capital and Technological Change.” The Review of Economic Studies 63 (Januray 1996) 143-144.
Fogel, Robert and Dora L. Costa. “A Theory of Technophysio Evolution, With Some Implications for Forecasting Population, Health Care Costs, and Pension Costs.” Demography 34 (February 1997): 49-51.
Francis, Andrew, “The Human Capital Peace: Economic Development, Democracy, and International Conflict.” University of Chicago: https://home.uchicago.edu/~afrancis, accessed on Oct 1, 2005.
Gilpin, Roger. War and Change in International Politics. Cambridge: Cambridge University Press, 1981.
Lucus, Robert E. “On the Mechanics of Economic Development,” Journal of Monetary Economics 22: 2-10. May, 1990: 92-96.
Sachs, Jeffery. “Fundamental Sources of Long-Run Economic Growth,” The American Economic Review No. 87, May 1997: 187-188.
Samuelson, Paul A. Economics: An Introductory Analysis. New York: McGraw-Hill: 1967.
8 6 IN T E R N ATI O N AL PUBLIC P O L I C Y R E VIE W
Spiro, David. “The Insignificance of the Democratic Peace.” International Security, Vol. 19, No. 2, Fall 1994: 50-86.
Snyder, Jack. “Imperial Temptation” The National Interest, No. 71: Spring 2003. Waltz, Kenneth N. Theory of International Politics. Boston: McGraw Hill, 1979. APPENDIX
Table One: Service Sector Intensity
0
10
20
30
40
50
60
70
80
1970
1973
1976
1979
1982
1985
1988
1991
1994
1997
2000
Year
Se
rvic
e S
ec
tor
Inte
ns
ity
(a
s
a %
of
tota
l s
ec
tor
em
plo
ym
en
t) US
China
Japan
Russia / USSR
UK
Table Two: Labor Force with Tertiary Education
0
5
10
15
20
25
30
35
40
45
50
1
Year 2000
La
bo
r F
orc
e w
ith
Te
rtia
ry
Ed
ucati
on
(%
of
To
tal) U.S.
China
Japan
Mexico
Russia/USSR
U.K.
Afghanistan
V O L . 2 , N O . 2 — N O V E MBE R 2 0 0 6 8 7
Table 3: Adult Illiteracy Rate in 2000
0
5
10
15
20
25
30
Year 2000
Countries
Illi
tera
cy
Ra
te (
% o
f P
eo
ple
ag
e
15
an
d a
bo
ve
)
U.S.
China
Japan
Mexico
U.K
Afganistan
Table 4:Cross-Country Illiteracy Rate
0
10
20
30
40
50
60
1970
1973
1976
1979
1982
1985
1988
1991
1994
1997
2000
Years
Ad
ult
Ill
ite
rac
y R
ate
(%
of
pe
op
le
15
an
d a
bo
ve
)
U.S.
China
Japan
Mexico
U.K.
Afghanistan
Table 5: GDP and Human Capital Dependent Variable: GDP (per capita GDP)
Regressors (1) (2) (3) (4) (5) (6) Health: expenditures per capita (U.S. Dollars)
4.1161** (.06911)
3.8503** (.07149)
3.343826** (.0818681)
Phy: physicians (per 1,000 people)
1096.6** (51.246)
847.814** (53.586)
524.962** (57.57148)
Death: death rate, crude (per 1,000 people)
-80.8** (13.26)
-43.334** (10.878)
-17.90591 (13.01457)
Fert: fertility rate, -5663** -2925.8** -2126.82**
8 8 IN T E R N ATI O N AL PUBLIC P O L I C Y R E VIE W
total (births per women)
(160.53) (143.73) (154.887)
Fert^2 507.3** (16.552)
305.507** (14.225)
242.992** (15.02271)
Illa: adult illiteracy rate (% of people above age 15)
34.752** (10.678)
-15.00467 (9.882)
Schter: school enrolment, tertiary (% of gross)
133.20** (5.11416)
44.13109 (5.105673)
Labeduterfem: labour force with tertiary education (% of female labour force)
96.201** (5.4579)
170.116** (4.88927)
34.04633** (4.960413)
Illyfem: Illiteracy rate, youth female (% of females ages 15-24)
-91.83** (13.237)
-110.15** (7.16688)
-23.70573* (12.33586)
Illy^2 .61314** (.08221)
1.00514** (.077213)
.2759244** (.0754784)
Fixed Effects (by region)
Yes Yes Yes Yes Yes Yes
Time Fixed Effects
Yes Yes Yes Yes Yes Yes
Adjusted R squared
0.6389 0.4975 0.6631 0.5683 0.5224 0.6755
Table 6: High-Tech Exports and Human capital (absolute) Dependent Variable: high-tech - High-technology exports (current US$)
Regressors (1) (2) (3) Health – total health expenditures (current US$)
128.5678** (1.119683)
145.16** (1.483)
144.926** (1.4703)
schtert - School enrolment, tertiary (% gross)
2.75e+07** (6879011)
4.45e+07** (6813851)
3.17e+07** (7197806)
Illa - Illiteracy rate, adult total (% of people ages 15 and above)
2888727 (4320990)
Fert - Fertility rate, total (births per woman)
-2.44e+09** (2.29e+08)

V O L . 2 , N O . 2 — N O V E MBE R 2 0 0 6 8 9
Fert^2 2.54e+08**
(2.21e+07) RGDP (current US$) 273380.6**
(14749.63) 248231.8** (14523.07)
226371.3** (14985.04)
Energy - Commercial energy production (kt of oil equivalent)
-9555.325** (575.7069)
-9596.872** (569.7)
Fixed Effects (by region) Yes Yes Yes Time Fixed Effects Yes Yes Yes Adjusted R Squared 0.7714 0.7808 0.7855
Table 7: High Tech Exports and Human Capital (as a % of manufactured exports) Dependent Variable: high-tech - High-technology exports (% of manufactured exports)
Regressors (1) (2) (3) Health - health expenditure per capita (current US$)
.002997** (.00023)
Schtert - School enrolment, tertiary (% gross)
.051457** (.0117)
.06499** (.01240)
.05829** (.01226)
labeduter - Labour force with tertiary education (% of total)
.09244** (.01560)
.09839** (.01561)
.0140913 (.0167696)
Illa - Illiteracy rate, adult total (% of people ages 15 and above)
-.00288 (.006)
-.0033265 (.00593)
CGDP, per capita GDP (current US$)
.0003686** (.0000271)
.0003717** (.00002)
.0001977** (.00003)
Energy -Commercial energy production (kt of oil equivalent)
-3.21e-06** (6.81e-07)
-3.97e-06** (6.76e-07)
ores - Ores and metals exports (% of merchandise exports)
0194348** (.0054)
.021898** (.00534)
Fixed Effects (by region) Yes Yes Yes Time Fixed Effects Yes Yes Yes Adjusted R Squared 0.2435 0.2477 0.2663
Table 8: Income Effect and Trade-offs
Dependent Variable: real military expenditures
9 0 IN T E R N ATI O N AL PUBLIC P O L I C Y R E VIE W
(Current US$)
Regressors (1) (2) (3) rgdp – real GDP (Current US$)
835.194** (55.74554)
528.24** (83.843)
630.697** (63.508)
Health – total health expenditures (current US$)
-198.81 (721.5819)
-2942.77** (548.13)
labeduter - Labour force with tertiary education (% of total)
344368.3** (40531.33)
-2942.77** (548.13)
Milcap - military capability index, Singer et al. 1972
4.78e+08** (7599299)
Fixed Effects (by region) Yes Yes Yes Time Fixed Effects Yes Yes Yes Adjusted R Squared 0.0643 0.0782 0.4715
Table 9: Income Effect and Trade-offs
Dependent Variable: per capita military expenditures (Current US$)
Regressors (1) (2) (3) Cgdp – per capita GDP (Current US$)
-.00486** (.00225)
-.00855** (.00267)
-.00055 (.0011)
Health - Health expenditure per capita (current US$)
-.033897* (.018466)
-.1472** (.00789)
labeduter - Labour force with tertiary education (% of total)
7.3507** (1.1917)
-2.877** (.51151)
Milcap - military capability index, Singer et al. 1972
19661** (126.86)
Fixed Effects (by region) Yes Yes Yes Time Fixed Effects Yes Yes Yes Adjusted R Squared 0.0505 0.0573 0.8286
Table 10: Military Substitution Effect Dependent Variable: Number of Soldiers
Regressors (1) (2) (3) Rgdp – real GDP (current US$)
-4.5679** (1.0315)
2.3614** (.04333)
Pop – population in thousands
2.3543** (.04411)
2.3455** (.04306)
.0011** (.00022)
Milexp – military .001148** .0011** .0011**
V O L . 2 , N O . 2 — N O V E MBE R 2 0 0 6 9 1
expenditures in thousands (.00023) (.0002) (.00022) Milcap - military capability index, Singer et al. 1972.
8756029** (23820.1)
90322** (309662)
88041** (318091.5)
Dem – Polity IV score -6614.9** (477.43)
-6461.472** (479.608)
Growth – % growth in real GDP
-3538.54** (36.61)
-6614.9** (477.43)
-3105.7** (528.065)
High tech – High technology exports (current US$)
-2.20e-06** (5.58e-07
-2.47e-06** (5.45e-07)
-2.28e-06** (5.48e-07)
schtert - School enrolment, tertiary (% gross)
-539.0205* (434.054)
-145.65 (427.4513)
-71.4099* (427.7596)
labeduter - Labour force with tertiary education (% of total)
-4271.08** (971.04)
-1911.82** (970.384)
-1925.729** (969.559)
health - Health expenditure per capita (current US$)
31.17** (8.8394)
37.49167** (7.253)
53.089** (8.8336)
oil - able G2 World Production of Crude Oil, Natural Gas Plant Liquids, Other Liquids, and Refinery Processing Gain, 1980-2001
-3.2401 (4.6832)
-11.5502** (4.52083)
-8.59497* (4.6172)
ores - Ores and metals exports (% of merchandise exports)
-805.1796** (153.229)
-880.118** (150.73)
-877.0086** (150.603)
death - Death rate, crude (per 1,000 people)
10656.8** (944.3203)
9198.23** (931.79)
9362.88** (932.515)
labedutarfem - Labour force with tertiary education, female (% of female labour force)
1493.782* (817.501)
-821.846 (819.321)
-707.8297 (819.4487)
illyfem - Illiteracy rate, youth female (% of females ages 15-24)
-1550.388** (544.598)
-1796.46** (533.725)
-707.8297 (819.4487)
Illa- Illiteracy rate, adult total (% of people ages 15 and above)
-1475.96** (656.584)
-1039.71* (638.56)
-1663.712** (534.9967)
Fixed Effects (by region) YES YES YES Time Fixed Effects YES YES YES Adjusted R Squared 0.8385 0.8439 0.8441