capital markets day 2018 - Ørsted
TRANSCRIPT

CapitalMarketsDay 2018

DISCLAIMERThis presentation contains certain forward-looking statements, including but not limited to, the statements and expectations contained in the
“Financial Outlook” section of this presentation. Statements herein, other than statements of historical fact, regarding our future results of
operations, financial condition, cash flows, business strategy, plans and future objectives are forward-looking statements. Words such as
“targets”, “believe”, “expect”, “aim”, “intend”, “plan”, “seek”, “will”, “may”, “should” ”anticipate”, “continue”, “predict” or variations of these words,
as well as other statements regarding matters that are not historical fact or regarding future events or prospects, constitute forward-looking
statements.
Ørsted have based these forward-looking statements on its current views with respect to future events and financial performance. These views
involve a number of risks and uncertainties, which could cause actual results to differ materially from those predicted in the forward-looking
statements and from the past performance of Ørsted. Although, Ørsted believes that the estimates and projections reflected in the forward-
looking statements are reasonable, they may prove materially incorrect and actual results may materially differ due to a variety of factors,
including, but not limited to market risks, development of construction and production assets, regulatory risks, operation of offshore and onshore
wind farms, cost of electricity for offshore and onshore wind power. As a result you should not rely on these forward-looking statements. Please
also refer to the overview of risk factors in “Risk and Management” on p. 47 of the Annual Report 2017, available at www.orsted.com.
Unless required by law, Ørsted is under no duty and undertakes no obligation to update or revise any forward-looking statement after the
distribution of this presentation, whether as a result of new information future events or otherwise.

Time Agenda Speaker Page
09:00-09:05 Welcome
09:05-10:10 Update on Strategy & Capital Allocation Henrik Poulsen 5
10:10-10:35 US Acquisition – Deepwater Wind Thomas Brostrøm & Jeff Grybowski 29
10:35-11:00 US Acquisition – Lincoln Clean Energy Ole Kjems Sørensen & Declan Flanagan 41
11:10-15:00 Breakout sessions - 40 minutes each, with a 10-minute break in between
Global Offshore Wind Markets Breakout room Martin Neubert & Thyge Boserup 57
Offshore : EPC Excellence Breakout room Anders Lindberg 75
12:40-13:30 Lunch
Offshore : O&M Excellence Breakout room Mark Porter 93
Customer Solutions Breakout room Morten Hultberg Buchgreitz 107
15:10-16:00 Financials Marianne Wiinholt 123
16:00-16:30 Wrap-up and final Q&A Henrik Poulsen and the Executive Committee 145
Agenda


Capital Markets Day28 November 2018
Update on Strategy & Capital Allocation

2012 – Ørsted A/SCEO and President
2008 – 2012 TDC A/SCEO and President
2006 – 2008 KKR Capstone, LondonOperating Partner
1999 – 2006 LEGOExecutive Vice President, Markets and Products (2005-06)Regional Managing Director, Europe and Asia (2004-05)Senior Vice President, Global Innovation and Marketing (2002-03)Senior Vice President, Global Segment 8+ (2000-02)Vice President, Business Development (1999-2000)
1996 – 1999 McKinsey & CoSenior Engagement Manager
Henrik Poulsen
CEO and President
Born: 1967
Education: M.Sc., Finance and Accounting, Aarhus School of Business, Denmark, 1994
Offshore
Onshore
Bioenergy
Customer Solutions
Ørsted
Finance
6

7

Let’s create a world that runs entirely on green energy

1. Excludes Distribution and B2C businesses, currently being divested and EBITDA contribution from new partnerships9
We have transformed Ørsted to a green energy company
Operating profit (EBITDA)
DKKbn
Capital employed
DKKbn
CO2-emissions
g/kWh
452
151
2007 2017
-67%
16%
57
2007
94%
2017
63
Renewables
2007
9.3
20171 2018E
12.7
13-14
Renewables
Remaining business
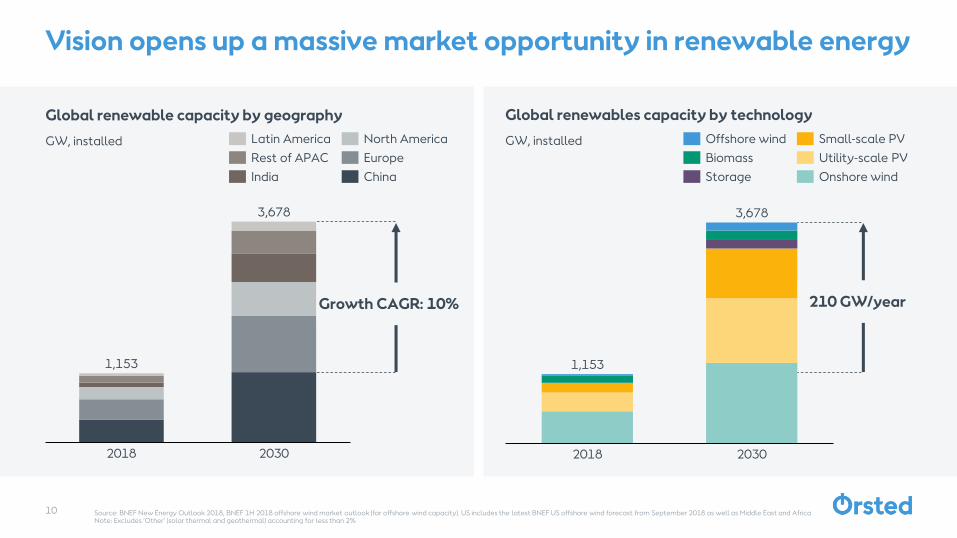
Vision opens up a massive market opportunity in renewable energy
Global renewable capacity by geography
GW, installed
Global renewables capacity by technology
GW, installed
Source: BNEF New Energy Outlook 2018, BNEF 1H 2018 offshore wind market outlook (for offshore wind capacity). US includes the latest BNEF US offshore wind forecast from September 2018 as well as Middle East and Africa Note: Excludes ‘Other’ (solar thermal and geothermal) accounting for less than 2%
2018 2030
1,153
3,678
Latin America
Rest of APAC
India
North America
Europe
China
2018 2030
3,678
1,153
Offshore wind
Storage
Biomass
Small-scale PV
Utility-scale PV
Onshore wind
Growth CAGR: 10% 210 GW/year
10

Berkshire Hathaway
Ørsted
16.6
EDPEnelIberdrola
10.6
NextEra RWE
14.9
EDF
18.1 17.7
13.3
10.89.9
Global installed renewables1 top 8
Installed and under construction2 capacity, GW
Note: Excludes Chinese players. Ørsted capacity based on constructed capacity; Source: BNEF Energy Asset Database as of November 20, 2018. 1. Includes onshore wind, offshore wind, solar PV, solar CSP, biomass, geothermal and marine generation2. Includes projects defined as ‘Under construction’ and ‘Finance secured’. Capacity allocation based on the ownership stake that the organisation holds (where ownership stakes are not disclosed, credit is pro-rated equally amongst all owners); 3. Includes geothermal and wave energy; 4. Includes offshore wind projects Changhua 1&2a, Changhua 2b&4, German Cluster 1, Gode Wind 3&4, Skipjack, Southfork, Revolution Wind, and onshore wind projects Sage Draw, Plum Creek, and solar PV project Permian Solar
11
Ørsted is strongly positioned to tap into long-term growth
Offshore wind
Onshore wind
Biomass
Utility-scale solar PV
Awarded
Other3
~4.7GW awarded renewable projects4
11.9

Ørsted’s strategic playing field
12
Renewables generation Storage Consumption
Bioenergy
Offshore wind
Electricity
storage
Corporate customers
Wholesale
Power-to-gas
Solar PV
Residential customersOnshore wind
Electric heating
Electric vehicles
Electricity
transmission and
distribution
T&D
Explore potentialInvest to grow Exit No presence
Power-to-gas
Electricity
transmission and
distribution
Electricity
storage
Offshore wind
Onshore wind
Electric heating
Electric vehicles
Residential customers
Corporate customers
Wholesale
Bioenergy
Solar PV

13
Portfolio changes support main focus on renewables generation
Bioenergy
Offshore
Onshore
Entering Ørsted portfolio
Lincoln Clean Energy
– Transaction closed
Deepwater Wind
– Transaction closed
Exiting Ørsted portfolio
Oil and gas pipeline infrastructure
– Transactions expected signed in 2019
Distribution and B2C Customer businesses
– Transaction expected signed in H1 2019
Customer Solutions

Europe Americas Asia
Offshore– Wind– Transmission– Storage
Onshore– Wind– Solar PV– Storage
Bioenergy– Biomass– Renescience– Biogas
Customer Solutions
Strategic growth platform
14
Leading US renewable company
– Strategic diversification
– Scale
– Technology integration
– New value-creating growth platform
?
– Explore growth and value creation potential of Bioenergy
Global leader in offshore wind
– Strategic core
– Growth and value creation
– Scale
– Keep pioneering and innovating
Estimated CAPEX allocation 2019-2025
75-85%
15-20%
0-5%– Route-to-market for
Ørsted product portfolio
– Risk management
– Incremental value creation

Global offshore wind capacity
GW
Note: Awarded includes project capacity secured through auctions and beauty contests since 2015, where FID has not yet been taken1. Includes Deepwater Wind2. RWE capacity based on combined Innogy and E.ON offshore wind portfolio
Ørsted remains uniquely positioned in offshore wind
0.30.3
0.9
0.5
1.4
0.5
3.8
0.10.8
0.91.4
5.1
0.30.4 0.3
1.10.60.7
0.6
3.4
2.03.9 0.8 0.9
0.4 0.31.4
1.8
0.3
0.6
12.8
3.5
0.81.8
0.5
5.6
Vattenfall Iberdrola EnBW Northland Power
Equinor CIP SSE ShellRWE2
Constructed Under Construction Awarded
Share of capacity constructed and under construction
30% 16% 7% 4% 3% 2%3% 3% 2% 2%
1
15

Offshore wind capacity secured in competitive processes since 2015
MW
16
Ørsted’s competitive position in offshore wind has proven its resilience
5,099
2,102
1,600
1,185
1,058
1,044
1,000
950
900
731
600
NorthlandPower
Iberdrola
Vattenfall
EDPR
RWE
5,699
WPD
EnBW
CIP
Shell / Eneco /Van Oord
Deepwater Wind

Unlevered project IRR development since FID
Percentage points
Strong execution track-record in offshore wind
2.5%
3.1%
2.3%
-0.3%
3.6%
1.1%
1.7%
0.1%
-0.8%
0.6%
3.8%
In operation Under construction
Driven by FX
17

Wind farms secured in competitive processes
– Borssele 1&2
– Hornsea 2
– German Cluster 1
– Gode Wind 3&4
– Greater Changhua 1&2a
– Greater Changhua 2b&4
– Revolution Wind
1. Based on capacity weighted average, current currency and market price assumptions, and on-time, on-budget construction18
Significant value creation from offshore wind projects secured in competitive processes
Lifecycle IRR1
7.5-8.5%
Average unlevered lifecycle IRR on wind farms secured in competitive processes
Lifecycle IRR includes:
– All development expenses
– Fully allocated overhead
– Deepwater purchase price allocated to projects
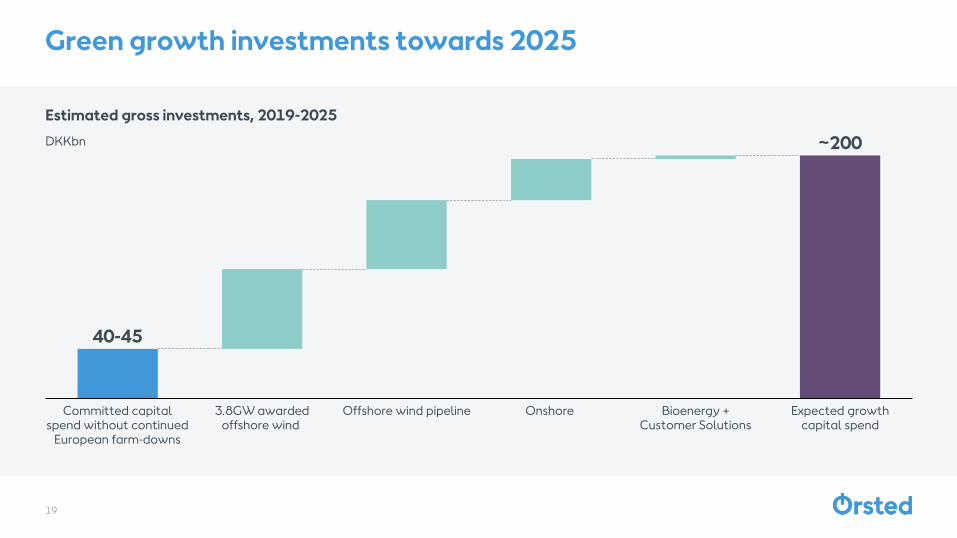
Estimated gross investments, 2019-2025
DKKbn
19
Green growth investments towards 2025
Offshore wind pipeline
~200
Committed capital spend without continued
European farm-downs
3.8GW awarded offshore wind
Onshore Expected growth capital spend
Bioenergy + Customer Solutions
40-45
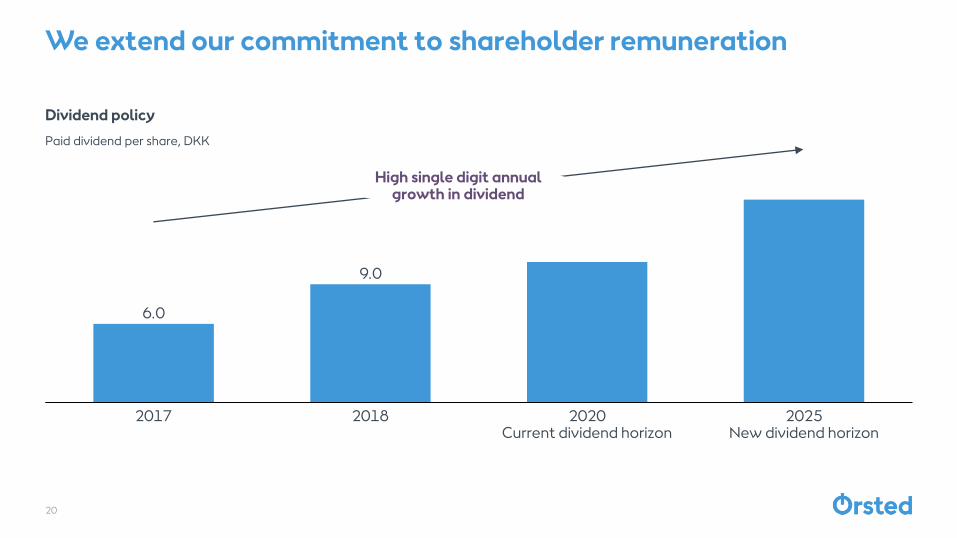
We extend our commitment to shareholder remuneration
Dividend policy
Paid dividend per share, DKK
20
6.0
9.0
2020Current dividend horizon
2017 2018
High single digit annual growth in dividend
2025New dividend horizon
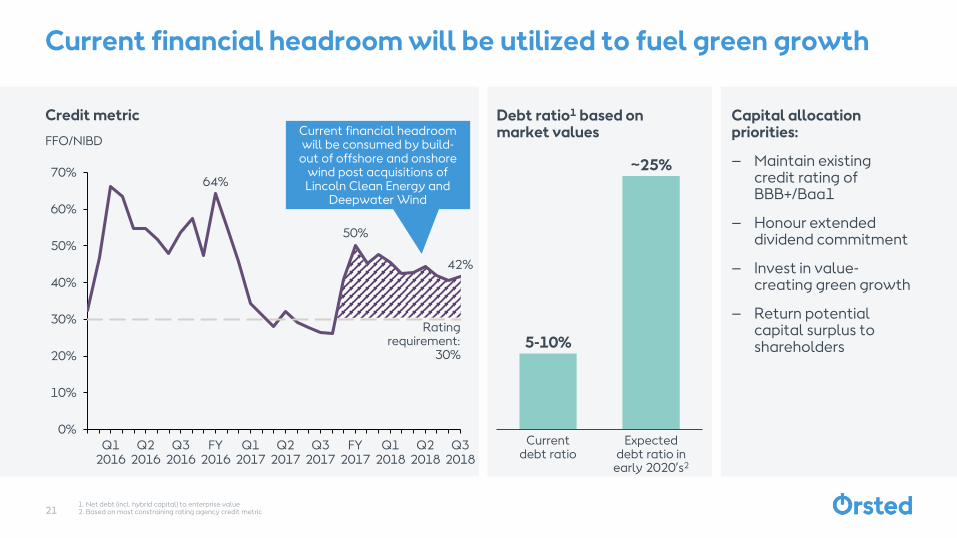
Credit metric
FFO/NIBD
1. Net debt (incl. hybrid capital) to enterprise value2. Based on most constraining rating agency credit metric21
Current financial headroom will be utilized to fuel green growth
Rating requirement:
30%
64%
50%
42%
0%
10%
20%
30%
40%
50%
60%
70%
Q3 2017
Q1 2017
Q1 2016
Q2 2016
Q3 2016
FY 2017
FY 2016
Q2 2017
Q1 2018
Q2 2018
Q3 2018
Current financial headroom will be consumed by build-
out of offshore and onshore wind post acquisitions of Lincoln Clean Energy and
Deepwater Wind
Current debt ratio
~25%
Expected debt ratio in
early 2020’s2
5-10%
Debt ratio1 based onmarket values
Capital allocation priorities:
– Maintain existing credit rating of BBB+/Baa1
– Honour extended dividend commitment
– Invest in value-creating green growth
– Return potential capital surplus to shareholders

ROCE
%
22
Expected average return on capital employed of ~10% towards 2025
~10%
Current guidance (2018-2023)
Current estimate (2018-2023)
12-14~13
Effect of excluding 2018 with Hornsea 1 farm-down, and no further
European farm-downs
Acquisition of Lincoln Clean
Energy and build-out pipeline
Acquisition of Deepwater Wind
and build-out pipeline
Updated guidance
(2019-2025)

EBITDA from wind farms (offshore + onshore) in operation
DKKbn
Note: Assumes no European farm-downs post Hornsea 1 and COD of Borssele 1&2 in Q4 2020/Q1 2021 and of Hornsea 2 in 2022. Assumes farm-down of Changhua 1&2a. Assumes today’s currency and market prices, and on-time, on-budget construction 2017-2023 based on linear 20% CAGR projection as an illustrative growth pattern. Will in reality not be linear.
Profit from operating wind farms expected to grow by an average ~20% towards 2023
23
8.5
20182017 2019 2020 202320222021
25-26
2017-2023 CAGR: ~20%
3x

Installed renewables capacity
GW
Note: 2020 includes Borssele 1&2 capacity, COD expected in Q4 2020/Q1 20211. Includes onshore wind, offshore wind, solar PV, storage and biomass
Green growth ambition for 2030
24
2010
2
2020 2030
10
+30
Offshore wind Onshore wind Bioenergy Renewables1
Volume growth not an objective in itself – focus is
on value creation

Share of green power and heat
%
Green share of power generation ~99% in 2025, approximating zero emissions
500
400
20502045
300
2035
200
0
2015
100
20302020 20252010 2040
600
Ørsted CO2 emissions
Global energy sector emission target to stay below 2-degree global warming
gCO2e/kWh
17
64
80
9599
20202006 2017 2023 2025
25

26
New strategic estimates towards 2025
Metric Strategic estimates
Total CAPEX spend, 2019-2025
CAPEX allocation split, 2019-2025
– Offshore
– Onshore
– Bioenergy + Customer Solutions
Average ROCE, 2019-2025
Average yearly growth in EBITDA from wind farms (offshore + onshore) in operation, 2017-2023
Share of contracted and regulated EBITDA, avg. 2019-2025
Green share of generation, 2025
DKK 200bn
75-85%
15-20%
0-5%
~10%
~20%
~90%
99%

Purpose-driven, global, greenenergy leader delivering market leading returns through scale, innovation, superior execution, and financial discipline

28
2019 key milestones
Offshore
– Commissioning of Hornsea 1
– FID on Changhua 1&2a in Taiwan
– Outcome of NJ, NY, RI and MA solicitations
– Full consent for Hornsea 3 project
– Successful integration of Deepwater Wind
Onshore
– Successful integration of Lincoln Clean Energy
– Commissioning of Lockett (184MW)
– FID on Sage Draw (300MW) and Plum Creek (230MW)
– First utility scale storage solution in operation (UK)
– Solar PV project (Permian)
Bioenergy
– Completion of Renescience plant in Northwich
– Biomass-conversion of Asnæs plant
– FID on two new biogas plants
Customer Solutions
– Divestment of Distribution and B2C businesses
– First corporate offshore PPAs signed
– Signing of oil and gas pipeline divestments

Capital Markets Day28 November 2018
Deepwater Wind

1. Partnerships & Structured Solutions, Revenue and Asset Management
2015 – Ørsted A/SPresident & CEO, Ørsted North America
2014 – 2015 Ørsted A/SDirector, Markets and Pipeline
2012 – 2014 Ørsted A/SSenior Manager, Head of Project Development UK
2009 – 2012 Ørsted A/SVarious senior positions, Head of Renewables Strategy and Performance, Business Developer and M&A
2007 – 2009 Straumur Investment BankAssociate
2005 – 2007 COWI and Bank Invest / NorthCap Partners
Board member American Wind Energy Association (2017 – Now)Former Board Member RenewableUK (2013 – 2015)
Thomas Brostrøm
President, Ørsted North America. CEO, Ørsted US Offshore
Born: 1979
Education: M.Sc. in Finance and International Business
Development, Regulatory &
Markets
EPC
Operations
Country Management
Offshore
Partnerships1
30

1. Partnerships & Structured Solutions, Revenue and Asset Management
2018 – Ørsted A/SCo-CEO, Ørsted North America
2012 – 2018 Deepwater WindCEO
2010 – 2012 Deepwater WindChief Administrative Officer and Senior Vice President, Strategy and External Affairs
2007 – 2010 Hinckley, Allen & Snyder LLPPartner
2003 – 2007 Office of the Governor, State of Rhode IslandChief of Staff
2001 – 2003 Hinckley, Allen & Snyder LLPAssociate
1998 – 2001 Sullivan & Cromwell LLP and the United states District Court for the District of Rhode Island
Jeffrey Grybowski
Co-CEO, Ørsted US Offshore
Born: 1971
Education: J.D. in Law
Development, Regulatory &
Markets
EPC
Operations
Country Management
Offshore
Partnerships1
31

Portfolio
– One 30MW project in operation, three projects with 850MW PPA’s secured and 1,700MW net development pipeline
Pioneer
– Permitting and operational experience from first US offshore wind farm
– Secured best lease areas along Eastern seaboard with proximity to shore and grid connection
Organisation
– Strong complementary fit merging leading local development skills with Ørsted’s global execution capabilities
Net capacity of US projects
MW
Source: Bloomberg New Energy Finance (BNEF), Bureau of Ocean Energy Management (BOEM)
The integration of Deepwater Wind creates the leading US offshore wind platform
4,500
6,200
30
850
1,700
850
307,080
Constructed Awarded Pipeline
32

Competitor projectsPartner projects
New leases
Deepwater Wind projectsØrsted projects
North East Atlantic Cluster
Mid Atlantic Cluster
Uniquely positioned with large adjacent projects, comprehensive geographic coverage and attractive partners
ScaleLarge scale cluster projects in the North East (MA, CT, RI, NY) and Mid Atlantic (NJ, DE, MD)
Site proximityAdjacent sites allow for significant synergy potential
Geographic coverageMost comprehensive geographic coverage with opportunity to bid into all states from MA to VA
Attractive partnersJV’s with leading utilities in New England (Eversource) and New Jersey (PSEG) bring strong, local transmission know-how
33 Source: Bureau of Ocean Energy Management (BOEM)

Block Island(30MW)
Power sold to Rhode Island
COP 2012
FID/COD 2015/2016
Turbines GE 6MW
Tax credit 30% ITC
Offtake solution USD 236/MWh3.5% price escalator 20 years
Tax creditFirst offshore wind project to obtain tax credit
Federal permitting
First offshore wind project to go through federal permitting. Significant stakeholder engagement and local knowledge required
Local supply chain
First offshore wind project to utilise the local supply chain
Block Island provides valuable experience for next rounds of projects
34

South Fork(90 + 40MW)
Revolution Wind(400MW)
South Fork
Revolution Wind
Revolution Wind(200MW)
Power sold to New York Rhode Island
FID/COD ~2021/2023
Turbines To be decided
Offtake solution
90 + 40MW approved by LIPA1
Under negotiation2
COP 2020/20212019/2020
~2020/2022
Connecticut
~2021/2023
Fully negotiated subject to regulatory approval2
2020/2021
1. Long Island Power Authority2. Option to participate in the capacity market35
Multiple projects with separate PPA’s constructed as one 730MW project
Tax credit Tax credit qualifying equipment secured
To be decided To be decided
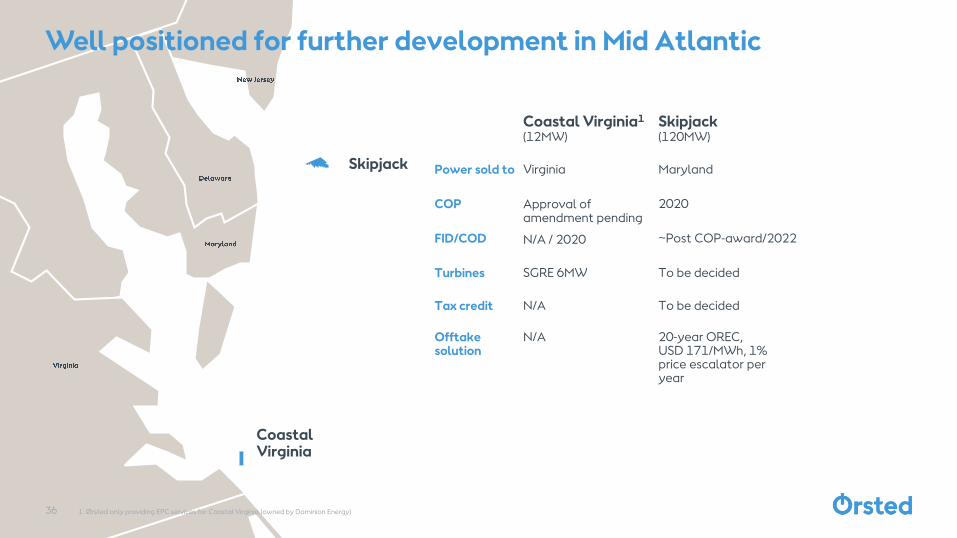
Skipjack
Coastal Virginia
Well positioned for further development in Mid Atlantic
Coastal Virginia1
(12MW)Skipjack(120MW)
Power sold to Virginia
FID/COD
Turbines SGRE 6MW
Tax credit N/A
Offtake solution
N/A
COP Approval of amendment pending
N/A / 2020
Maryland
~Post COP-award/2022
To be decided
To be decided
20-year OREC, USD 171/MWh, 1% price escalator per year
2020
36 1. Ørsted only providing EPC services for Coastal Virginia (owned by Dominion Energy)

Net project pipeline1
MW
1. Net capacity takes into account ownership share of sitesSource: Bureau of Ocean Energy Management (BOEM)
6,200MW development pipeline across the east coast
1,000
6,200
1,300
3,500
400
Revolution Wind
Bay State Wind
Garden State
Ocean Wind
Total pipeline
Competitor projectsPartner projects
New leases
Ørsted projects North East Atlantic Cluster
Mid Atlantic Cluster
37

State targets
GW
1. No official offshore wind target, but capacity already awarded or planned as auctions2. Auction result pending3. Part of Bay State Wind leaseSource: Source: Bloomberg New Energy Finance (BNEF), US National Renewable Energy Laboratory (NREL)38
Significant political ambitions and upcoming opportunities
Sep 20182
Connecticut zero-carbon solicitation~800MW
Ørsted opportunity:Constitution Wind3
Revolution Wind
Dec 2018New Jersey 1st
300-1,100MW
Ørsted opportunity:Ocean Wind Garden State
H1 2019Massachusetts 2nd
offshore wind RFP 800MW
Ørsted opportunity:Bay State WindRevolution Wind
H1 2021Massachusetts 3rd
offshore wind RFP 800MW
Ørsted opportunity:Bay State WindRevolution Wind
H2 2020New York 2nd
800-1,200MW
Ørsted opportunity:Bay State WindRevolution Wind
H2 2022New Jersey 3rd
1,200MW
Ørsted opportunity:Ocean Wind Garden State
Feb 2019New York 1st
800-1,200MW
Ørsted opportunity:Bay State WindRevolution Wind
Oct 20182
Rhode Island zero-carbon RFP200-400MW
Ørsted opportunity:Revolution Wind
0.4
0.2-1.0
0.4-0.8
Virginia
3.2
Up to2.0
3.5
2.4
MarylandRhode Island1
Connecticut
New York
Massachusetts
New Jersey
12-13 H2 2020New Jersey 2nd
1,200MW
Ørsted opportunity:Ocean Wind Garden State
Upcoming opportunities

Net capacity by developer1
MW First moverØrsted in a front-runner position by moving early into the US
Attractive partners
Selecting strong local partners provides robustness and complementary fit in new markets
Superior lease areas
Ørsted lease areas are superior to upcoming new leases: less conflicted areas, close to established markets and located in relatively shallow waters
1. Net capacity takes into account ownership share of sites2. Includes Ørsted’s opportunity to access Virginia from strategic partnership with Dominion Energy3. Geographic coverage is defined by the number of States which the developer has access to via its leasesSource: Bloomberg New Energy Finance (BNEF), US National Renewable Energy Laboratory (NREL)
Largest project pipeline, widest geographic reach and strong partnerships
CIP
~2,000
PSEG
Avangrid
Equinor
~3,900
US Wind
DominionEnergy
Eversource
~7,100
~1,500
~3,000
~1,000
~1,000
~400
Awarded
Development
Constructed
82
3
4
4
1
3
4
5
Geographic goverage3
Ørsted partner✓
✓
✓
✓
39

The leading offshore wind developer in the US
Strong organisation withcomplementary skills
Combined portfolio of Ørsted and Deepwater Wind creates the largest project pipeline in the US
Attractive PPA’s secured with further opportunities for optimisation
40

Capital Markets Day28 November 2018
Lincoln Clean Energy

42
2018 – Ørsted A/SEVP Onshore and M&A
2016 – 2018 Ørsted A/SSenior Vice President, Head of Partnerships, M&A & Asset Management in Wind Power
2014 – 2016 Ørsted A/SVice President, Head of Commercial Transactions & Market Development in Wind Power
2012 – 2014 Ørsted A/SVice President, Head of Partnerships and M&A in Wind Power
2011 – 2012 Ørsted A/SSenior Director, Head of Wind Power M&A
2006 – 2011 Ørsted A/SSenior Manager, Group M&A
2004 – 2006 ATPPrivate Equity Partners, Vice President
1999 – 2004 Gorrissen Federspiel Lawyer
Ole Kjems Sørensen
Executive Vice President, Onshore and M&A
Education: Master of Law, Aarhus University
Offshore
Onshore
Bioenergy
Customer Solutions
Ørsted
Born: 1972

43
Declan Flanagan
CEO, Lincoln Clean Energy
Offshore
Onshore
Bioenergy
Customer Solutions
Ørsted
Lincoln Clean Energy
2009 – Lincoln Clean EnergyFounder and CEO
2007 – 2009 E.ON Climate & Renewables North America Inc.CEO & Board member of Global Renewables Business
2003 – 2007 Airtricity North AmericaCEO
2000 – 2003 Airtricity HoldingsRegulation & Trading Manager
Former member of the boards of both the American Wind Energy Association and the Solar Industry Association
Born: 1974
Education: B.Sc., National University of Ireland, M.Sc., University of Ulster and MBA, Kellogg School of Management, Northwestern University
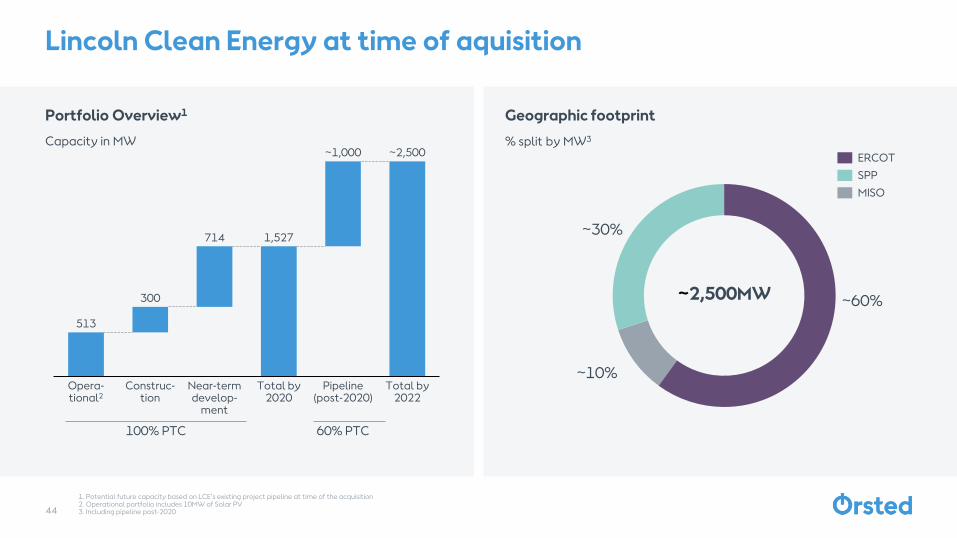
Portfolio Overview1
Capacity in MW
Geographic footprint
% split by MW3
1. Potential future capacity based on LCE’s existing project pipeline at time of the acquisition2. Operational portfolio includes 10MW of Solar PV3. Including pipeline post-2020
Lincoln Clean Energy at time of aquisition
513
1,527
300
714
Total by 2022
Construc-tion
Opera-tional2
Pipeline(post-2020)
Near-term develop-
ment
Total by 2020
~1,000 ~2,500
100% PTC 60% PTC
~30%
~10%
~60%~2,500MW
ERCOT
MISO
SPP
44

Purchase price breakdown
Illustrative
1. PTC Glide Path: projects eligible to Production Tax Credits (PTCs) at less than 100%
Acquisition price based on prudent assumptions, expect to achieve high single digit IRR
Pipeline to 2022PTC Glide Path1
Operating portfolio Pipeline to 2020100% PTC
Acquisition price
Upside opportunities
Probability adjusted
All pipeline to 2022 delivered
Grow pipeline
45

1. GE EFS: GE Energy Financial Services2. BAML: Bank of America Merrill Lynch3. BHE: Berkshire Hathaway Energy46
Operating portfolio813MW
Texas
Amazon Windfarm Texas
Willow Springs Wind Tahoka Wind
Amazon Windfarm Texas (Dermott)(253MW)
Willow Springs Wind
(250MW)
Tahoka Wind
(300MW)
ISO ERCOT ERCOT ERCOT
COD 2017 2017 2018
Turbines 110 GE / 2.3MW 100 GE / 2.5MW 120 GE / 2.5MW
Tax Equity 50% GE EFS1
50% BAML2
50% BHE3
50% BAML2
100% BHE3
Offtake solution
PPA with Amazon and Iron Mountain15 years
193MW (77%) Hedge with BAML2
13 years
231MW (77%) Hedge with BAML2
13 years
Bold = Development post acquisition
813MW includes Oak Solar a 10MW Solar Project, commissioned 2011, no tax equity, fully merchant power. RECs until May 2020

Key metrics Portfolio highlights
1. Weighted average including escalation for PPA lifetime2. Weighted average annual offtake volume47
Large scale, low capex portfolio with solid offtake
~45%
2 BNEF US Renewable Energy Market Outlook, Texas
22USD/MWh
– Large scale assets with top tier partners
– Over $1 billion in tax equity raised representing c. 80% of total capex at COD
– Tahoka was one of the largest single investor tax equity financings in US wind power at $305 million
– Amazon Windfarm Texas long term agreement was the largest volume corporate offtake in the US at time of execution
CAPEX multiples lower than BNEF 2017 benchmarks <1.5USDm/MW
Average historic load factor
Average nominal offtake pricing1
83% contracted2

1. BHE: Berkshire Hathaway Energy
Near term pipeline714MW
Nebraska
Texas
Plum Creek Wind
Lockett Wind
Sage Draw Wind
Lockett Wind(184MW)
Sage Draw Wind(300MW)
Plum Creek Wind(230MW)
ISO ERCOT ERCOT SPP
FID/COD Q4 18/Q3 19 Q2 19/Q1 20 Q4 19/Q4 20
Turbines 75 GE/2.45MW 120 GE/2.5MW GE +2.5MW
Tax Equity 100% BHE1 Expected 2019 Expected 2019
Offtake solution
PPA with Allianz for 80% capacity10 years
PPA with Blue Chip C&I for 83% capacity12 years
PPAs with Smucker Co, Avery Dennison and Vail Resort, >70% of capacity contracted12 years
Bold = Development post acquisition
48

Key metrics
All major contracts in place for near term pipeline with 80% volume contracted3:
Lockett: Final Investment Decision taken
Sage Draw: Executed PPA for 83% capacity
Plum Creek: >70% offtake and turbine supply agreement executed
1. Weighted average expected load factor2. Weighted average including escalation for PPA lifetime3. Weighted average annual offtake volume. Target offtake met, may add more opportunistically49
Capex and load factor improvements drive lower LCOE
2 BNEF US Renewable Energy Market Outlook, Texas
12-15$/MWh
~47%
Capex multiples lower than BNEF 2019 benchmarks <1.2$m/MW
Expected nominal range of offtake pricing2
Expected average load factor1
Increase in energy capture and capex reduction compensates for lower PPA pricing
Turbine
progression
Key developments since acquisition
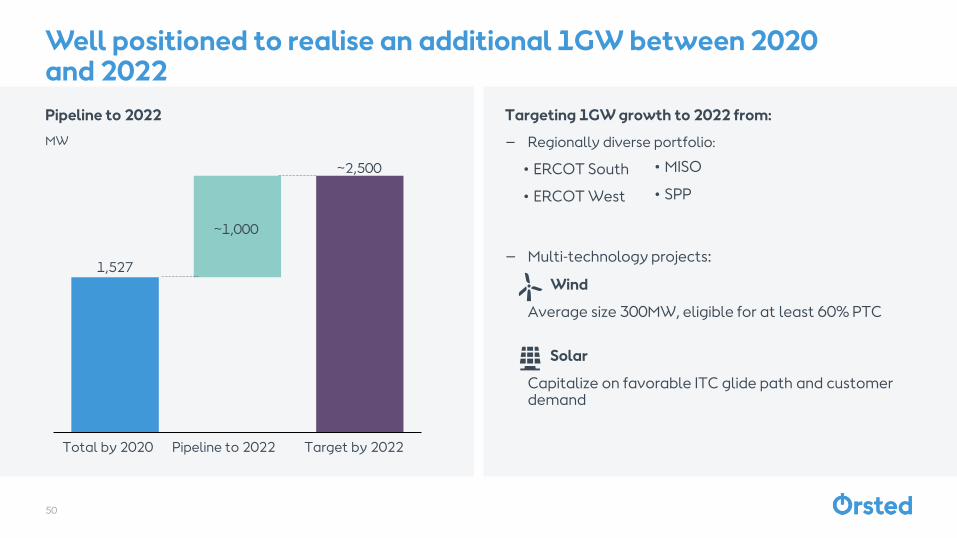
Pipeline to 2022
MW
Targeting 1GW growth to 2022 from:
– Regionally diverse portfolio:
• ERCOT South
• ERCOT West
– Multi-technology projects:
Wind
Average size 300MW, eligible for at least 60% PTC
Solar
Capitalize on favorable ITC glide path and customer demand
Well positioned to realise an additional 1GW between 2020 and 2022
1,527
Target by 2022
~1,000
Total by 2020 Pipeline to 2022
~2,500 • MISO
• SPP
50

1Sage Draw was already part of the communicated growth plan
Today we are announcing 500MW of wind and solar PPAs with ExxonMobil
Sage Draw Wind 300MW
250MW PPA
COD Q1 2020
Permian Solar 350MW
250MW PPA
COD Q2 2021
– Multi-technology to meet corporate demand for 24hr green energy
– Development/execution efficiency in the core West Texas wind footprint
– Further synergies possible in long term operations and capex
Potential for further additions of solar to portfolio but remain largely wind focused
The two long term PPA’s executed in Texas with ExxonMobil are a case study of where onshore renewables is heading
10
Oak SolarNew Jersey
– Full greenfield project
– COD 2011
10
Lone Valley 1California
– Early stage acquisition project
– Secured PPA with SoCal Edison
– COD 2014
– Sold to EDPR
20
Lone Valley 2California
– Expansion project
– Secured PPA with SoCal Edison
– COD 2014
– Sold to EDPR
350
PermianTexas
– Project in development
– Secured 250MW PPA with ExxonMobil
LCE solar track recordMW
51

Source: BNEF New Energy Outlook
LCE in a strong position to meet demand in the post subsidy era
US net wind capacity additions
GW
Growth driven by consumer demand and continued reduction in LCoE
Unprecedented buildout
PTC era Post PTC eraPTC Glide Path
8.2
10.2
11.4
5.9
4.6
8.0 8.4 8.2
6.0
4.5
5.7
4.24.9
2023 203020202018 20242019 2021 2022 2025 2026 2027 2028 2029
41.8 GW
18.5 GW
Some market recalibration
52

LCE has development capabilities to be competitive in the post PTC era
Maximising value of
acquisitions
– Phase 2 of a prior acquisition
– Utilised retained connection rights
– Increased interconnection agreement by 20% post acquisition
– Created a new project with a very competitive cost base
Willow Springs Wind
Proven execution
– Acquired as a project directed into the transmission system via a low value connection point in SPP
– Worked with the transmission company to bring a decommissioned line back into service
– Enabled Tahoka to secure access to the higher value ERCOT market
Tahoka Wind
Executing corporate solutions
– PPA with Amazon was the largest volume corporate offtake in the US at time of execution
– Involved extensive collaboration with Amazon management
– Full greenfield project
Amazon Windfarm Texas
Financing innovation
– Experienced in utilizing the spectrum of offtake structures
– Recently executed a hedge with Allianz effectively reducing shape risk
– Full greenfield project
Lockett Wind
Multi-technology
solutions
– Track record in both wind and solar leads to cross selling opportunities
– Leverage strong relationship with C&I
– Opportunity only accessible as a result of the acquisition
Multi-project
53

LCE and Ørsted a powerful combination to succeed in US market
LCE
Balance Sheet Strength
Credit assurance and funding availability
Scale
Procurement and ability to deploy resources
In-House Capabilities
Expertise in complex engineering
Relationships and Market Knowledge
Successful track record in multiple US states, over 150 years of combined experience in the US market
Tax Equity Capabilities
Close relationship with tax equity investors
Offtake Solutions
Corporate and utility PPAs, financial hedges
54

The leading onshore wind developer in the US
Significant progress since acquisition
Tahoka fully operational
Final Investment Decision taken for Lockett
Executed PPA on Sage Draw for 83% capacity
>70% offtake secured for Plum Creek
LCE/Ørsted have the right capabilities to be competitive in the post PTC era
A regional cross-technology platform to meetfuture corporate demand and drive growth
55


Capital Markets Day28 November 2018
Global Offshore Wind Markets
2018 – Ørsted A/SExecutive Vice President, CEO Offshore
2016 – 2018 Ørsted A/SChief Strategy Officer, Head of Strategy, Development and Regulatory, Offshore Wind
2012 – 2016 Ørsted A/SHead of Partnerships, Offshore Wind
2008 – 2012 Ørsted A/SHead of Group M&A, Head of Equity Partnerships
2005 – 2008 Bain CapitalAssociate in Private Equity
2000 – 2005 Arthur Andersen & EYVarious positions
Martin Neubert
Executive Vice President, CEO Offshore
Born: 1973
Education: M.Sc. in Economics and Finance (FAU) & CFA
Offshore
Onshore
Bioenergy
Customer Solutions
Ørsted
58

1. Partnerships & Structured Solutions, Revenue and Asset Management
2018 – Ørsted A/SSenior Vice President, Head of Development, Regulatory & Markets, Offshore
2016 – 2018 Ørsted A/SSenior Director, Head of Market & Project Development, Offshore Wind
2014 – 2015 TB advisoryIndependent advisor
2008 – 2014 Saxo Bank A/SExecutive Vice President, Chief Commercial Officer
2007 – 2008 Danisco A/SVice President, Head of Corporate Development
2002 – 2006 ISS A/SSenior Vice President, Head of Corporate Affairs and Investor Relations
Thyge Boserup
Senior Vice President, Head of Development, Regulatory & Markets, Offshore
Born: 1970
Education: M.Sc. in Economics
Development, Regulatory &
Markets
EPC
Operations
Partnerships1
CountryManagement
Offshore
59

Competitive tenders and auctions by market 2016-2018 Net offshore wind capacity secured2
MW secured since 2015
1. 33% excl. Deepwater Wind2. Net capacities are defined as the developer’s ownership share of the offshore wind project 3. Auction hit rate equal to number of auctions where capacity was secured divided by number of unique auctions participated in since 20154. Vattenfall capacity includes Horns Rev III (407MW) secured in 2015, Iberdrola capacity includes East Anglia ONE (714MW) secured in 20155. RWE winning capacity calculated as Innogy and E.ON’s aggregated winning capacity
Unprecedented track record in capturing valuable growth in competitive allocations
37% capacity secured in the past 36 months1
Auctionhit rate3
8/12
4/7
3/4
2/5
1/5
2/5
1/2
2/6
1/4
950
900
600
EDPR
WPD
5,099
Vattenfall4
Iberdrola4
RWE5
CIP
NorthlandPower
EnBW
5,699
2,102
1,600
1,185
1,058
1,044
1,000
752MW 590MW 1,386MW 552MW 900MW 920MW
✓ ✓ ✓ ✓ ✓ ✓
2016 2017 2018
2025 ambition set 2025 ambition secured
400MW
✓ ✓
200MW
60

Offshore wind competitive picture
2018 market share of global capacity constructed and under construction, %
Global offshore wind capacity (gross)2
Constructed, under construction, awarded and pipeline3, GW
1. RWE capacity and market share calculated as Innogy and E.ON combined2. Gross capacity implies full share of partnership projects3. Defined as net capacity of project rights exclusively owned by developer, if ownership share is not disclosed 100% is assumed
Market leader with the largest asset base in operation, in construction and in development
~3
3.8
5.6 1.4
0.60.3
~4
Vattenfall
0.4
3.4
~11
3.9
0.90.3
0.9
RWE1
1.4
Iberdrola
0.7
~7
0.8 ~1
EnBW
0.9
Constructed AwardedUnder construction Pipeline
30%
16%
7%4%3%
40%
Vattenfall
RWE
Iberdrola
EnBW
Other
~30GW
1
~24
~8 ~8
~9
~3
61

Ørsted Offshore capacity (gross)
GW
Ørsted Offshore capacity – updated ambition
GW
1. 2020 includes Borssele 1&2 capacity, COD expected in Q4 2020/Q1 2021
11-12 GW ambition secured ahead of time – new ambition set towards 2025
5.6
DeepwaterWind
2018 Hornsea 220201 2025 incl. Deepwater
Wind
GreaterChanghua
Germanprojects
2025 ambition
7.5
1.4
1.1
1.8
11.9
0.9
12.8
Under constructionConstructed Awarded Acquisition
✓
+2-3GW
2-3
New 2025 ambition
Additionalcapacity
~15
12.8 ✓
62

Upcoming firm opportunities in regions with existing footprint for Ørsted Offshore
1. Auction result pending. 2. Part of Bay State Wind lease. 3. Bids due on 28 December in New Jersey – winners expected to be selected by July 20194. Total opportunities estimated as the sum of the 14 opportunities combined with the average taken of the rangesSource: Bloomberg New Energy Finance (BNEF), Netherlands Enterprise Agency, Danish Ministry of Energy, Utilities and Climate, US National Renewable Energy Laboratory (NREL), UK Department of Energy & Climate Change, Belgium Energy Federal Public Services (FPS)63
Increased 2025 ambition on the back of a strong short-term opportunity pipeline
Jan 2019Holland Coast South 3&42x380MW
H2 2019Holland Coast North 1&22x380MW
H1 20193rd CfD round2,000-4,000MW
2020-2021Danish tender (1 of 3)800MW
2021Belgium tender~700MW
H2 2020Holland Coast West 12x380MW
2-3
New 2025 ambition
12.8
~15
Total opportunities4
5.8
~16
4.5
6.0 2-3
Additional ambition
H2 2021Holland Coast West 22x380MW
H1 2019Massachusetts 2nd
offshore wind RFP 800MW
Ørsted opportunity:Bay State WindRevolution Wind
H1 20214th CfD round2,000-4,000MW
Ørsted opportunity:Hornsea 3
Jan 2019New York 1st
800-1,200MW
Ørsted opportunity:Bay State Wind Revolution Wind
Dec 20183
New Jersey 1st
300-1,100MW
Ørsted opportunity:Ocean Wind Garden State
H2 2020New York 2nd
800-1,200MW
Ørsted opportunity:Ocean Wind Garden State
Sep 2018Connecticut zero-carbon solicitation1
~800MW
Ørsted opportunity:Constitution Wind2
Revolution Wind
+
✓
Oct 2018Rhode Island zero-carbon RFP1
200-400MW
Ørsted opportunity:Revolution Wind
H2 2020New Jersey 2nd
1,200MW
Ørsted opportunity:Bay State Wind Revolution Wind

Offshore wind installed capacity forecast excl. China
GW
Offshore wind capacity with firm political commitment3
1. Number of markets with installed capacity by BNEF above 200MW with US States treated as separate markets2. US includes the latest BNEF US offshore wind forecast from September 2018. This forecast is 3GW higher than H1 2018 Offshore Wind Outlook from July 20183. Firm political commitment is defined by a country’s public offshore wind target by 2025/2030Source: Bloomberg New Energy Finance (left side), Governments’ official energy outlook (right side)
Accelerated global growth towards 2030 – a substantial part is already backed by political commitments
24
43
68
1
9
18
10
56
APAC excl. China
2025
1
2020
4
2030
US2
Europe26
96
~6GW/y
~8GW/y
8Number of markets1 ~20 +20
The UK government has a CfD roadmap with bi-yearly auctions of 2-4GW towards 2030 to reach 30GW
Target of 15GW offshore wind by 2030
MA 2027 (2035) target: 1.6 (3.2) GW. VA 2028 target: 2.0GW.NJ 2030 target: 3.5GW. NY 2030 target: 2.4GW.
Offshore Wind Energy Roadmap 2030 outlines 11.5GW by 2030 through 1GW per year post 2023
Outlined plan for three 800MW (2.4GW) offshore wind projects before 2030 by the Danish Government leading to a total of 5GW in 2030
Current 2025 target of 5.5GW which has already been reached through grid allocation and price auction
Targets in existing footprint markets
Targets in next horizon markets
~81GW
The Indian government has target of 5GW before 2022 and 30GW by 2030
The South Korean government has a total wind target of 18GW by 2030 of which 13GW is allocated to offshore wind
Authorities of Belgium have announced plans for offshore wind targets of 2.2GW by 2020 and 4GW by 2030
France has a 2023 target of 3GW installed and 6GW in the pipeline post 2023
~46GW
64

DEVEX breakdown
Dedicated front end organisation managing the global development portfolio across the globe
Develop Build Operate Own
Global presence with three hubs: Europe, APAC and US
~11GW under development across six different markets
+250 FTEs focused on market, project and business development
Annual DEVEX of DKK ~1.8bn (2019-2022)
Project management, design and procurement
– Development and optimisation of projects through the development cycle
Site investigations
– Geotechnical and geophysical investigations of array area and cable route (primarily 3rd provider)
– Deployment of wind- and met ocean measurement equipment
– Technical analysis of site data, and development of geological models
Land rights
– Commercial agreements and acquisition of rights to onshore land for cable routes, onshore substation and harbour facilities
Consent and permits
– Permitting processes, including stakeholder engagement, permit applications, public hearings, and Environmental Impact Assessments (EIAs)
Market development
– Development of existing and new markets, including regulatory engagement and identification of new project opportunities
~10%
~15%
100%
~35%
~30%
~10%
65

Early stakeholder engagement
Value creation through diligent market and project selection and development
Market and project development approach
1. Horns Rev 1 (160MW, 2002), Horns Rev 2 (209MW, 2009), Walney 1&2 (367MW, 2012), London Array (630MW, 2012), Walney Extension (659MW, 2018), Hornsea 1 (1,218MW, 2021) and Hornsea 2 (1,386MW, 2022)
Successful market and project development approach established to ensure value creation when entering new markets
Strong stakeholder engagement and involvement in the development and build-up of UK offshore wind market
Early engagement with local stakeholders since 2013/2014 enabled an effective market entry in 2016
Partnership with leading transmission builder in New England, Eversource Energy, for the Bay State Wind project in Massachusetts
JV with Swancor and Macquarie for the first offshore wind farm in Taiwan, Formosa 1, to access local knowledge early in the development process
Strong track record by developing and building the largest offshore wind farms in the world1
Became largest developer in Taiwan by securing capacity in both grid allocation and price auction
Securing +6GW Hornsea zone has given Ørsted consistent opportunities through several bid rounds in the UK
Acquired small German projects in close proximity to gain significant scale advantages through Borkum Cluster, Gode Wind Cluster and Cluster 1
Market examples
Establish local offices and secure project rightseither through greenfield investments or M&A
Find local partner with complementary competencies
Ability to scale fast
1
2
3
4
66

Ørsted Offshore´s activities at UK East Coast Market update and Ørsted opportunities
UK 1st and 2nd CfD auction outcome
Market
– Next UK CfD auction to be initiated May 2019, subsequent auctions every two years
– Target annual build-out of 1-2GW towards 2030. Target of 30GW capacity by 2030
– The Crown Estate extension projects applications approved (3.4GW)
– Round 4 lease auctions in 2019
Ørsted
– Hornsea 3 and 4 consent process and preparation ongoing
– Satisfied application criteria for development of Race Bank Extension (573 MW) and further expectations to participate in process for new leasing rounds, expected to be initiated in 2019
1. Diamond Generating Europe2. The auction was won by Innogy
Strong position in the UK with +4 GW pipeline opportunities
Hornsea 2
Race Bank
WestermostRough
Hornsea 1
Grimsby
Lincs
Operational
Exclusive pipeline options
Under construction
O&M hub
Hornsea 3
– 2,400MW potential capacity
– ~120km from shore
– Water depths between 24-73m
– Wind speeds of ~10m/s
Hornsea 4
– 1,200MW potential capacity
– ~100km from shore
– Water depths of 24-68m
– Wind speeds of ~10m/s
950
860
714
448
1,386
EDPR, Engie,DGE1
RWE2
Scottish Power
Mainstream Renewable Power
2nd CfD round, 2017
1st CfD round, 2015
MW
Race Bank Ext.
– 573MW potential capacity
– Water depths of ~15m
– Wind speeds of 9-10m/s
67
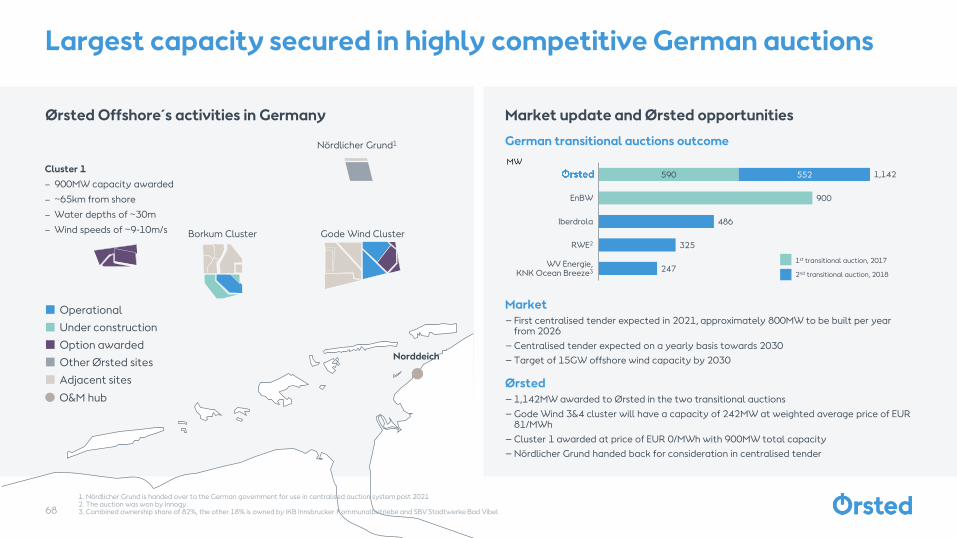
Ørsted Offshore´s activities in Germany Market update and Ørsted opportunities
German transitional auctions outcome
Market
– First centralised tender expected in 2021, approximately 800MW to be built per year from 2026
–Centralised tender expected on a yearly basis towards 2030
–Target of 15GW offshore wind capacity by 2030
Ørsted
– 1,142MW awarded to Ørsted in the two transitional auctions
–Gode Wind 3&4 cluster will have a capacity of 242MW at weighted average price of EUR 81/MWh
–Cluster 1 awarded at price of EUR 0/MWh with 900MW total capacity
–Nördlicher Grund handed back for consideration in centralised tender
1. Nördlicher Grund is handed over to the German government for use in centralised auction system post 20212. The auction was won by Innogy3. Combined ownership share of 82%, the other 18% is owned by iKB Innsbrucker Kommunalbetriebe and SBV Stadtwerke Bad Vibel
Largest capacity secured in highly competitive German auctions
590
900
486
325
247
552
RWE2
EnBW
Iberdrola
WV Energie,KNK Ocean Breeze3
1,142
2nd transitional auction, 2018
1st transitional auction, 2017
MW
Gode Wind ClusterBorkum Cluster
Norddeich
Operational
Option awarded
Under construction
Other Ørsted sites
O&M hub
Nördlicher Grund1
Adjacent sites
Cluster 1
– 900MW capacity awarded
– ~65km from shore
– Water depths of ~30m
– Wind speeds of ~9-10m/s
68

Ørsted Offshore´s activities in Taiwan Market update and Ørsted opportunities
Taiwan allocation and auction outcome
Market
–Taiwan has now met its target of awarding 5.5GW of capacity to be installed by 2025
– Future auctions are being planned for projects post 2025
Ørsted
– 900MW2 awarded in grid allocation in April – expected to be completed in 2021 subject to FID in 2019
– 920MW3 awarded in price-based auction in June. Expected to be completed in 2025, subject to FID in 2023. Winning bid price was TWD 2,548/MWh (~EUR 72.3/MWh)
–Greater Changhua 3 (583MW) available for future auctions
1. Capacity independently owned by Copenhagen Infrastructure Partners (CIP)2. Changhua 1&2a3. Changhua 2b&4
Market leading position in Taiwan with 1.8GW secured capacity
900
300
300
378
300
920
744
WPD
CIP, China Steel 6001
1,058
1,820
1,044
SWE, Macquarie, ENBW
Northland Power, Yushan EnergyMitsui & Co.
Taipower
900
Awarded in price auction
Awarded in grid allocation
MW
Exclusive pipeline options
Awarded projects
Changhua 1 & 2 & 4
– 1,820MW capacity awarded
– 35-60km from shore
– Water depths of 35-45m
– Wind speeds of 9-10m/s
Formosa 1
– 128MW capacity
– 2-6km from shore
– Water depths of 15-35m
– 35% ownership share
APAC Headquarters
69

Japan–90% of energy consumption is
imported
–Lack of space onshore
–Strong public pressure to phase out nuclear
–Clear political intention to increase renewables
Timeline
–New legislation expected to be in place early 2019 to develop offshore wind
Market
– Government renewable 2030 target of 24% and 10GW target for wind power
Support scheme
– FiT – 20 years in current legislation
– Auction system in place post 2019
South Korea–94% of energy consumption is
imported
–Lack of space onshore
–Strong public pressure to phase out nuclear and coal
–Clear political intention to increase renewables
Timeline
–First operational offshore wind project (30MW) to be commissioned in 2017
Market
– 18GW wind build-out target towards 2030 of which 13GW is offshore
Support scheme
– Renewable Energy Certificates (REC) for 20 years
Source: Wood Mackenzie, Japanese Ministry of Economy, Trade and Industry, South Korean Ministry of Trade, Industry and Energy
Selected next horizon markets for offshore wind
Offshore wind regionsSeveral offshore wind zones exist in Japan. Two major zones highlighted in Aomori and Akita
Offshore wind regionsFour identified provinces: South Jeolla, North Jeolla, South Gyeongsang and Jeju
70

Poland–Coal phase out (60% of electricity
consumption by 2030)
–Strong supply chain in place ready to expand if home market materialises
–Leverage the existing solid local position to become European hub
Timeline
–New energy bill expected end of 2018. Current expectation of 8GW build-out in first phase
Market
– Polish transmission system operator recently announced that 4GW of offshore wind capacity could be built by 2027
Support scheme
– No firm support scheme in place
India–Overall target of 175GW
renewables by 2022
–Mature onshore wind power supply chain to be leveraged
–Extra financial support from the government expected compared to onshore wind
Timeline
–Call of interest for 1GW expected to have auction rules announced before end of 2018
Market
– Indian government has set targets of 5GW of offshore wind before 2022 and 30GW by 2030
Support scheme
– 25-year PPA expected for first 1GW auction, but details on future support scheme still uncertain
1. Total pipeline includes operational, under construction, planned, proposed and pre-projectSource: Wood Mackenzie
Selected next horizon markets for offshore wind
Offshore wind regionsLocated in Baltic Sea.1,980m2 designated to offshore wind build-out
Offshore wind regionsCoast of Gujarat, where the first 1GW commercial offshore wind farm is expected, and Tamil Nadu in the South
71

Different technical concepts
Source: Bloomberg New Energy Finance (BNEF), Carbon Trust, Wood Mackenzie
Monitoring early stage development in floating wind
8
42
7
29
84
24 30
224
Total2009-2016
2017 2018 20222019 2020 2021
Installed
Pipeline
Total
Floating wind projectsMW
Potential floating wind markets
Semi-submersible Spar Buoy
Tension-leg platform
Barge
Pipeline– Floating projects remain small scale in the
short- to medium-term– Limited long term visibility due to current
lack of industrial cost-out roadmap
Limited pipeline visibility with only small scale projects
Key floating markets in areas with significant bottom fixed potential
Technology– Several foundation designs currently
being piloted– No single design with superior technical
capabilities in place
Markets– Major floating markets; UK, Germany, US,
France, Japan, Portugal, Norway– Market able to reach their offshore wind
targets through bottom-fixed (California only exception)
Floating wind areas and activitiesGlobal regions with activity
EXAMPLES
TetraSpar
72

Ørsted is the clear market leader in a rapidly growing industry
Strong market fundamentals to support increased growth ambition
Leading position in a high growth industry
Proven methodology and track record in securing high value projects
73


Capital Markets Day28 November 2018
EPC Excellence
1. Partnerships & Structured Solutions, Revenue and Asset Management
2018 – Ørsted A/SExecutive Vice President, Head of EPC & QHSE in Offshore
2015 – 2018 Ørsted A/SSenior Vice President, Head of EPC in Offshore Wind
2014 – IEC HoldenBoard member
2011 – 2014 Bombardier TransportationPresident Rolling Stock Central & Northern Europe and Asia
2007 – 2011 Bombardier TransportationPresident Rail Control Solutions
2004 – 2007 Bombardier TransportationPresident Propulsion & Controls
Anders Lindberg
Executive Vice President, Head of EPC & QHSE
Born: 1965
Education: EMBA in Business Administration (SSE) & MSc. in Electrical Engineering (KTH)
Development, Regulatory &
Markets
EPC
Operations
Partnerships1
CountryManagement
Offshore
QHSE
76

Large integrated EPC organisation with ~1,400 FTEs
Strong inhouse capabilities and first mover on new technologies
Strong technical capability with proprietary tools (layout, foundation, electrical system analysis, etc.)
First mover on innovation, e.g. turbine platforms, foundations and cables
Systematic, institutionalised approach to continuous LCoE reductions
Industry leading procurement scale
Multi-contracting approach with direct interactions with suppliers
Ability to handle risk and uncertainties
Ability to execute 4-6 large-scale projects at any given time
77

Global offshore wind farm projects# of projects
Strong track record delivering projects below budget and on time
1. RWE calculated as Innogy and E.ON’s capacity installed and under construction combined2. Delays have been due to grid issues at TSO or turbine supply delay
Ørsted has a strong track record in delivering offshore wind farm projects on time and on budget
25
17
11
53
5
3
1
Equinor SSE
1
RWE1 Vattenfall
Constructed Under construction
6 4 5 1 1FID budget Time schedule2
Borkum Riffgrund 2
Walney Extension
# of countries
Race Bank
Burbo Extension
Westermost Rough
Gode Wind 1&2
Borkum Riffgrund 1
2018
COD
2018
2018
2017
2016
2015
2015
Compensation for TSO delay received for Gode Wind 1&2 and despite timing delays, subsidy milestones have never been jeopardised
Below ✓
Below ✓
Below ✓
Below ✓
Below
Below ✓
✓
78

Ørsted has strong confidence in delivering the current project portfolio and updates the expected completion dates
Projects Hornsea 1 Borssele 1&2 Virginia (EPC) Hornsea 2
Country
Expected completionOriginal
Expected completionUpdated
Status, time
Status, cost
Capacity 1,218MW 752MW 12MW 1,386MW
2020 2020/2021 2020/2021 2022 Late-2021
H2 2019 Q4 2020/Q1 2021 H1 2021 H1 2022 n.a.
Ahead On track On track On track n.a.
Below Below On track On track n.a.
Changhua 1&2a(Expected FID Q1 2019)
900MW
79

1. CAPEX cost (capacity weighted) excluding transmission asset costs2. Gode Wind 1&2, Burbo Bank Extension, Race Bank, Walney Extension, Borkum Riffgrund 2 and Hornsea 1. Assumes 1% yearly inflation 3. Borssele 1&2, Hornsea 2, Gode Wind 3&4 and Cluster 14. IPO portfolio plus parks in note 35. Total Recordable Injury Rate per million working hours6. Lost Time Incident Frequency per million working hours
80
Ørsted continues to drive down cost while creating a strong safety culture
Significantly lower than IPO portfolio driven by continuous efforts to reduce costs, larger turbines and supply chain maturation
48-50
IPO portfolio Updated portfolio4
48-50
Safety record
TRIR5 and LTI6, 12 months rolling (Oct)
CAPEX
DKKm/MW, real 20191
Load factor
%
Safety in EPC significantly improved – well below 2018 TRIR target of 6.0
Maintaining load factor guidance for updated portfolio
3.6
2.5
0.9
0.4
TRIR Oct 2018
TRIR Jun 2016
LTIF Jun 2016
LTIF Oct 2018
13.5
Ørsted European projects3
IPO portfolio at CMD 20172
20.8

LCoE for EPC areas1
2013 – today, Index
Continuous improvements – reduced LCoE for EPC areas by more than 40% between 2013-18
1. LCoE only includes Turbines, Foundation, Transmission and Logistics, i.e. OPEX, Construction Management, resource and other categories outside EPC scope are not included
LCoE has decreased substantially up to today since the first large scale wind farms
100
Today2013 2025
60
~40%
TurbinesIntroduction of larger turbines
MHI Vestas Offshore Wind introduced as new supplier
FoundationsOptimisation of primary steel design and tools
Internal and external structures completely redesigned and optimised
TransmissionDynamic rating of cables
Analysing seabed conditions to increase throughput
Reduction of export cable cross section
Move from copper to aluminium conductors
LogisticsMove to purpose-built vessels
Single season installation
81

Continue working with turbine suppliers to be first movers in bringing new technology to the offshore wind market
Today– 8MW turbines deployed
– 10MW turbines commercially available but not deployed yet
2025
– 12MW turbine already announced
– 13-15MW turbine expected in 2025
– Qualification of new supplier, increasing competition
Technological updates towards 2025
LCoE for turbines
Today 2025
Rated power: 13-15MW
Rotor: >160m
What do larger turbines imply?– Increased production due to higher rating and larger rotor
– Fewer positions enabling savings on foundations, array cables and installation
– Reduction of OPEX
82

Rotor size
1. Balance of Plant2. Annual Energy Production
Larger turbines are always better – a truth with modifications
9.5MW turbine is larger on rated power, but has a smaller rotor than the 8MW
Rotor: 164m
8MW 9.5MW
In general the 9.5MW turbine will gain on CAPEX and OPEX and lose on revenue and vice versa for the 8.0MW
The total swept area will be ~23% larger with the 8.0MW turbine but 20 additional positions will be needed at a 1,000MW site
9-4
100
-4
8.0MW Turbine CAPEX
98
BoP CAPEX1
-3
OPEX Lost AEP2
9.5MW
Swept area
m2 per MW
LCoE illustrative
DKKm/MWh
Rotor: 167m
In some cases, a smaller 8MW turbine with a large rotor could therefore provide a better business case than a 9.5MW turbine with a similar rotor
2,738 2,223
8.0MW 9.5MW
+23%
125 105
9.5MW8.0MW
+19%
Number of turbines 1,000 MW site
11
100-3
8.0MW Lost AEP2
Turbine CAPEX
-3
BoP CAPEX1
-2
OPEX 9.5MW
103
83

Foundation costs will decrease even further by focusing on steel weight and fabricator specific design
Today– Optimised diameter/thickness ratio of
steel
– Improved design tools
2025
– Continue optimising diameter/ thickness ratio
Grouted Bolted
Technological updates towards 2025
LCoE for foundations
Today 2025
Bolted connection at Borkum Riffgrund 2 and Hornsea 1– Introduction of the bolted connection between monopile and
transition piece, replacing the grouted connection
– Solution to be used as standard going forward
– Large cost reductions (15-20%) on foundation supply and possibility for all year installation
– Consider the fabricators capabilities and the impact on steel while designing
– Improve modelling of fatigue over time and installation loads
– Secondary structures design optimisation
84

Increasing capacity of transmission systems will continue to decrease LCoE
Today– Export cables with dynamic rating
with a capacity of up to 230kV
– Reduced number of substations
2025
– Increase capacity of export cables by increasing voltage to 275kV and/or increase operating temperatures
Technological updates towards 2025
LCoE for transmission
Today 2025
Optimisation at Hornsea 2– Cable route and seabed conditions analysed, allowing an increase
in throughput from 400MW to 440MW per cable, while decreasing the average cross section size
– Reduction of number of substation from 3 to 1
– Asia Pacific sourcing
– ~20% steel saving on topside and ~40% CAPEX saving1
1. Including transportation and excluding electrical components
– Reduce weight of substations to eliminate use of large offshore substation installation vessels (primarily new markets)
85

1. Equivalent to approximately DKK 1m per position
Leverage supply chain and inhouse capabilities to further decrease logistics LCoE
Technological updates towards 2025
Today– Purpose-built vessels
– Improved vessel capabilities and dual turbine vessels to reduce installation time
– Work with the supply chain to promote new market entries and, thus, improved competition
LCoE for logistics
Today 2025
4xAdditional deck space
From jack-ups to floating installation vessels– No jackup-legs result in larger deck space which means more loading
capacity and hereby reduced number of trips
– No dependency on seabed conditions
– No seabed footprint reduce dependency towards cable installation
– Reduces positioning time (~15%)1 between turbine locations
2025– Introduce floating installation vessels that can carry larger
foundations
– Improve workability to decrease downtime, i.e. ability to install in harsher weather
– Use data to optimise installation concepts based on best practice cycle-times
86

1. Numbers exclude FX and power price2. Crew Transfer Vessel3. Service Operations Vessel87
Ørsted continues to optimise each project after FID to further reinforce economics
Value enhancement areas Hornsea 1 achievements1
– Enhanced foundation design, logistics and installation process improvements – CAPEX reduction of DKK 0.7bn
– Optimised O&M setup with new processes and best practice logistical solutions utilising helicopters, CTV1 and SOV2 when operating far from shore – OPEX reduction of DKK 0.5bn (lifetime)
Cost reductions
– Bringing forward the substations and cables to ensure there is time for testing and commissioning
– Address risks with supply chain delivery, such as re-allocating work to mitigate fabrication delays and ensure on-time installation
– De-risking CAPEX baseline has released DKK 1.7bn of contingency
Risk mitigation
– Accelerated turbine installation and commissioning – Production ramp up accelerated 2 months (average) per turbine
– Improved park production curves and lifetime availability – Energy production (AEP) increased 2.4% over project’s lifetime (similar uplift on load factor)
Revenue optimisation
Hornsea 1 has realised a significant IRR uplift (~2.0%-point) since FID excl. FX & power price impact

In addition to bringing down cost, Ørsted also pushes to deliver even faster
Installation duration (normalised)1
Days from first foundation installation to first power of last turbine
– Deployment of known turbine platforms
– Continuous installation schedule (i.e. incl. Winter)
– Smaller projects with 32 or 35 turbines each
– Both parks deployed a new turbine platform with delays from suppliers
1. Calculated as duration from foundation installation start until first power of last turbine scaled to 125 position. Based on full scope
705
559
448
1,543
Walney Extension2017/18
Westermost Rough
2014/15
Burbo Extension2015/16
Race Bank2017/18
Hornsea 12018/19
1,020
54% 64% 71%
88

Borkum Riffgrund 2
Germany
United Kingdom
Hornsea 1
Netherlands
Belgium
Our capabilities enable us to handle issues arising on all projects
Hornsea 1
Issue
Manufacturing delays, quality and HSE issues for Reactor Compensation Station (RCS) at supplier
Action taken
–Early and direct interaction with supplier to resolve issues
–Attempted to incentivise supplier to improve performance
–Qualification of impact on project time schedule utilising on-site Ørsted staff and in-house planning expertise
–Worked stopped by Ørsted several times to address HSE issues
–Scanning market for new supplier(s) to take over work and transportation
–Decision taken to move RCS to new supplier
–Tent erected at new supplier to secure optimal working conditions
–Physical presence at supplier – continuous monitoring and optimising works
Borkum Riffgrund 2
Issue
Financial restructuring (bankruptcy risk) at supplier of the 20 jacket structures for the suction bucket jackets
Action taken
–Task force created to deal with supplier
–Direct negotiations with supplier, owners, banks and other contractors
–Ørsted took over scope to allow supplier to continue with reduced scope
–Frequent visits to supplier by senior project management
–Physical presence at supplier – continuous monitoring of progress and financial situation
Increase in cost kept within project contingency
Overall time schedule maintained
89

1. NCUE: National Changhua University of Education 90
Establishing a presence in a new market takes time and hard work
Ørsted internal activity
Ørsted external EPC activity
Jun 2016Taipei office opened
Jan 2017Head of Procurement (expat)
Apr 2018Changhua 1&2a awarded
2018 EoY49 people on the ground(20 expat/29 local)
2019 EoY~100 people by 2019(40 expat/60 local)
Jan 2017Investment in Formosa I
Sep-Nov 2018Entered major local CAPEX contracts
Jan 2018Partners with National Kaohsiung University of Science and Technology
2017 EoY24 people on the ground(11 expat/13 local)
2016 EoY13 people on the ground(8 expat/5 local)
2013/14Taiwan market develop-mentkick-off
Nov 2016Meetings with ~15 local suppliers
Feb/Mar 2017Initiated development of 4 major suppliers of offshore components and construction
Jul 2017Involved EPC contractors and suppliers for onshore transmission Conducted
various supplier events, incl. local supplier network for SME
Nov 2017Signed MoUs with key collaboration partners incl. CSC and EGS
Mar 2018Awarded first TP mock-up contract
Mar-Jul 2018Tendered for major CAPEX contracts with Taiwan suppliers
EPC contract entered with Delta Electronics to build first MW-size energy storage project on NCUE1 campus
Oct/Nov 2016+170 local suppliers assessed
Jun 2018Changhua 2b&4 won
Selected key milestones in establishing Ørsted’s presence in Taiwan

Key parameters within organisation when entering new markets
Robust and experienced organisation to develop the supply chain in new markets
Balancing global supply chain opportunities with local supply chain requirements
Partnering with other important stakeholders in building the offshore wind industry
Major local contracts entered
Ørsted’s capabilities and in depth knowledge enable the development of the supply chain in Taiwan
Global suppliers
Local suppliers
Contract Supplier Localisation
Turbines Siemens Gamesa Renewable Energy
Locally produced towers and establishing nacelle assembly factory
Jacket foundation
Sing Da Marine Structures
56 jacket foundations
Onshore Substation
Taiwan Cogeneration Corporation
Full EPC contract
Foundation pin-piles
CSBC Corporation
Significant number
Foundation pin-piles
Formosa Heavy Industries
Significant number
Array cable installation
Woen Jinn Harbour Engineering
Significant scope
Balanced trade-off between global vs. local suppliers as
well as cost and quality
91

Ørsted has a leading EPC and innovation capability in offshore wind
On time and within budget
Delivering continuous reduction in LCoE
Fully capable of delivering in new markets
92

Capital Markets Day28 November 2018
O&M Excellence

2018 – Ørsted A/SSenior Vice President, Head of Operations in Offshore
2016 – 2018 E.ON Climate & RenewablesDirector Asset Management
2014 – 2016 E.ON Climate & RenewablesDirector Wind Operations
2009 – 2014 E.ON Climate & RenewablesRegional Director
1995 – 2009 E.ON UK & E.ON Sweden Various Management Positions
Mark Porter
Senior Vice President, Head of Operations
Born: 1972
Education: BSc(Hons) Engineering & Management (Durham University), MBA (Warwick University), Fellow of the Institution of Mechanical Engineers
Development, Regulatory &
Markets
EPC
Operations
Partnerships1
CountryManagement
Offshore
1. Partnerships & Structured Solutions, Revenue and Asset Management94

1. Turbine capacity operated not equal to capacity constructed by Ørsted (amongother due to operation of third party constructed assets such as Lincs Offshore Wind Farm in the UK).2. Excludes test/demonstration sites.
Largest offshore wind O&M owner/operator globally with growth of >50% since 2016 and operation across 3 hubs of 1-2GW each
UK East O&M hub(Grimsby) ~1.2GW
Global Engineering & Commercial Support
German O&M hub(Norddeich) ~0.9GW
Operated by ØrstedOperations FTEs Total
Capacity1 Turbines1 Sites2
2018 4.9GW ~1,100 21 ~850
2016 3.2GW ~860 18 ~720
Taiwan
USA
In operation
Under construction
Total wind farm 2018 operated capacity
Under development
Symbols
Hub O&M base
Global Support Functions
24/7 Control & Monitoring Centre
(GW)
UK West O&M hub(Barrow) ~1.9GW
24/7 O&M hub
O&M hub O&M hub
95
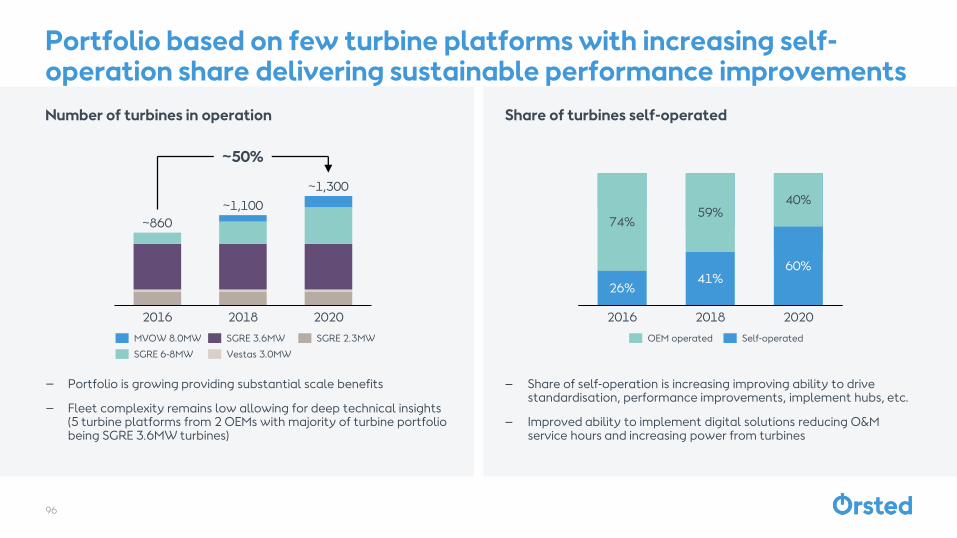
Number of turbines in operation
– Portfolio is growing providing substantial scale benefits
– Fleet complexity remains low allowing for deep technical insights (5 turbine platforms from 2 OEMs with majority of turbine portfolio being SGRE 3.6MW turbines)
Share of turbines self-operated
– Share of self-operation is increasing improving ability to drive standardisation, performance improvements, implement hubs, etc.
– Improved ability to implement digital solutions reducing O&M service hours and increasing power from turbines
Portfolio based on few turbine platforms with increasing self-operation share delivering sustainable performance improvements
2016 2018 2020
~860
~1,100
~1,300
~50%
MVOW 8.0MW SGRE 2.3MWSGRE 3.6MW
SGRE 6-8MW Vestas 3.0MW
26%
40%
74%
2016
60%
59%
41%
2018 2020
OEM operated Self-operated
96

Ørsted Offshore Operations Framework
Ørsted Operations Framework combines several elements to deliver world-class performance
20202018 OPEXLost revenue
÷ OPEX
÷ Lost revenue
Standard Operating Model Operational Excellence Digitalisation & Innovation+ + = World-class Performance
Solid & Compliant Good Practice Best Practice✓ ✓ ✓
External Technology
Impl.
Innovation & digitalization
Regional hubs
Operations Production
System
ISO Standards
Self-operation
97
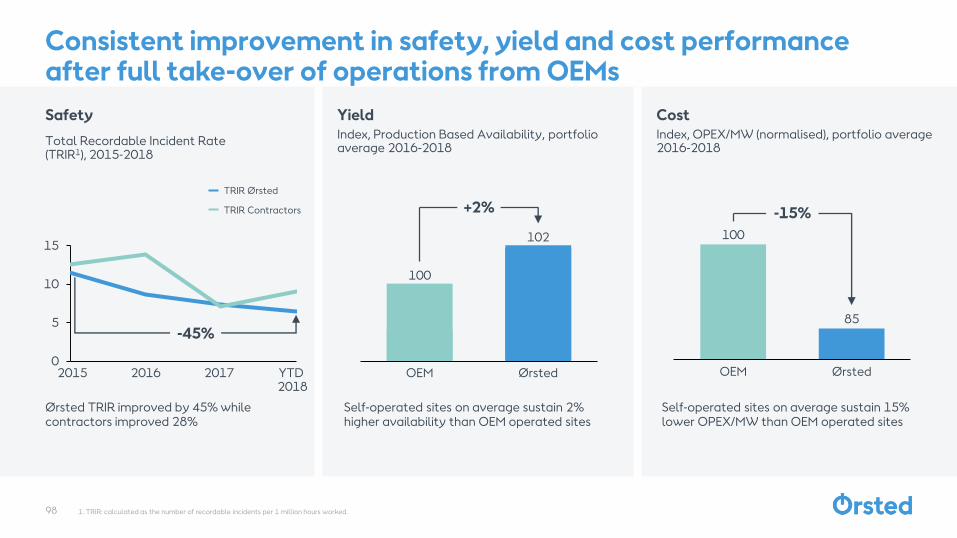
85
OEM Ørsted
100
-15%
Safety
Total Recordable Incident Rate (TRIR1), 2015-2018
1. TRIR: calculated as the number of recordable incidents per 1 million hours worked.
Consistent improvement in safety, yield and cost performance after full take-over of operations from OEMs
0
5
10
15
20162015 2017 YTD 2018
TRIR Ørsted
TRIR Contractors
OEM Ørsted
100
102
+2%
-45%
Ørsted TRIR improved by 45% while contractors improved 28%
Self-operated sites on average sustain 2% higher availability than OEM operated sites
Self-operated sites on average sustain 15% lower OPEX/MW than OEM operated sites
YieldIndex, Production Based Availability, portfolio average 2016-2018
CostIndex, OPEX/MW (normalised), portfolio average 2016-2018
98

Standardised (ISO certified) O&M system enabling portfolio wide optimization and a blueprint for globalization
55001:2014Asset Management (O&M & Integrity)
9001:2015Quality Management
14001:2015Environmental Management
45001:2018Health & Safety Management
First operator worldwide to become ISO certified for offshore wind power assets; ISO certified in Asset Management (O&M and Asset Integrity), Quality and HSE management
Full standardisation of workflows and site organisation (roles and responsibilities)
O&M setup transformed from site by site to portfolio optimisation
Centralised development and optimization of maintenance plans, Work Instructions, etc.
Control of HSE, risks, compliance and economic performance
Portfolio standardisation and optimisation of ways of working
Blueprint for future global expansion
Differentiating factor for equity partners and their lenders
Sites certified
Work Instructions
Troubleshooting guides
Approved Written Procedures
6
148
63
270
✓
✓
✓
✓
99
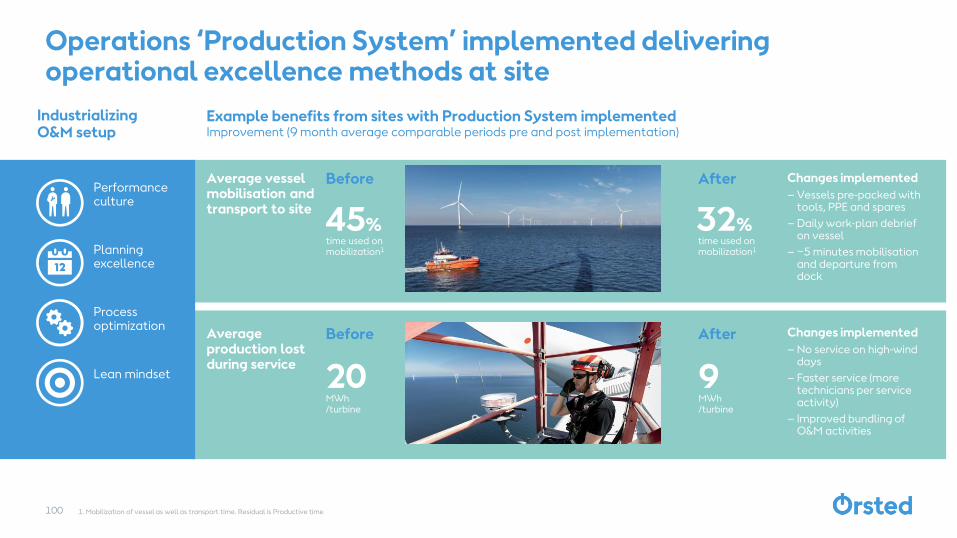
1. Mobilization of vessel as well as transport time. Residual is Productive time
Operations ‘Production System’ implemented delivering operational excellence methods at site
Example benefits from sites with Production System implementedImprovement (9 month average comparable periods pre and post implementation)
45%
Before
20
Average vessel mobilisation and transport to site
Average production lost during service
Changes implemented
– Vessels pre-packed with tools, PPE and spares
– Daily work-plan debrief on vessel
– ~5 minutes mobilisation and departure from dock
time used on mobilization1
32%
After
Changes implemented
– No service on high-wind days
– Faster service (more technicians per service activity)
– Improved bundling of O&M activities
Industrializing O&M setup
Performance culture
Planning excellence
Process optimization
Lean mindset
Before After
time used on mobilization1
MWh/turbine
9MWh/turbine
100
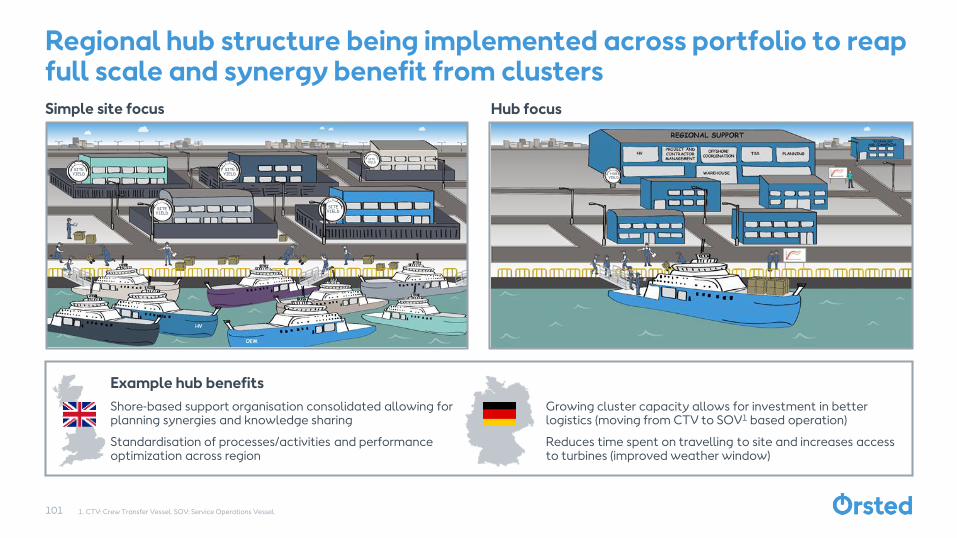
1. CTV: Crew Transfer Vessel. SOV: Service Operations Vessel.
Regional hub structure being implemented across portfolio to reap full scale and synergy benefit from clusters
Hub focusSimple site focus
Example hub benefits
Shore-based support organisation consolidated allowing for planning synergies and knowledge sharing
Standardisation of processes/activities and performance optimization across region
Growing cluster capacity allows for investment in better logistics (moving from CTV to SOV1 based operation)
Reduces time spent on travelling to site and increases access to turbines (improved weather window)
SITE YIELD
SITE YIELD
SITE YIELD
SITE YIELD
SITE YIELD
HUB YIELD
101

1. MVPs are products/solutions developed using agile workstreams.2. Equal to Ørsted ownership share from production uplift once implemented for SGRE 3.6MW and SGRE 6-8MW portfolio operated by Ørsted.
More than 40 Minimum Viable Products (MVPs1) released by the Ørsted Lab in 2018, including solution correcting yaw misalignments
Example site:Turbine alignment (degrees) – pre
Situation pre and post solution MVP & solution introduced Results achieved
Smart wind sensors installed replacing wind vanes (at low cost) for high accuracy wind speed and direction data capture
Data used - in the Ørsted Lab developed HYPE (patented) algorithm - to correct yaw misalignment
Turbine yaw misalignment data captured
Additional Service agreement entered into with JV partnerships to implement solution at site
1
2
3
4
Misalignment per turbine
Allowable design variation
-10
-5
0
5
10
15
Turbine alignment (degrees) – post
-10
-5
0
5
10
15
Patented
Uplift in production
0.2-0.3% for SGRE fleet equal to ~21m DKK in EBITDA2 per annum
Additional contract revenue
From agreements with JV partnerships
Reduced lifetime integrity cost
From reduced loads on the structure and components
102

Ørsted fast to identify, assess and implement 3rd party technology developments and innovations
Before After
Bla
de
insp
ec
tio
n
Ex.18 min.
out of operationBlade inspections
now performed via autonomous drones
equipped with HD cameras capturing
close up blade images
Bla
de
ma
inte
na
nc
e
Blade maintenance via remotely
operated robot currently being
tested
Minimal loss (simultaneous with scheduled service)
1 dayout of operation
1-2 daysout of operation
103
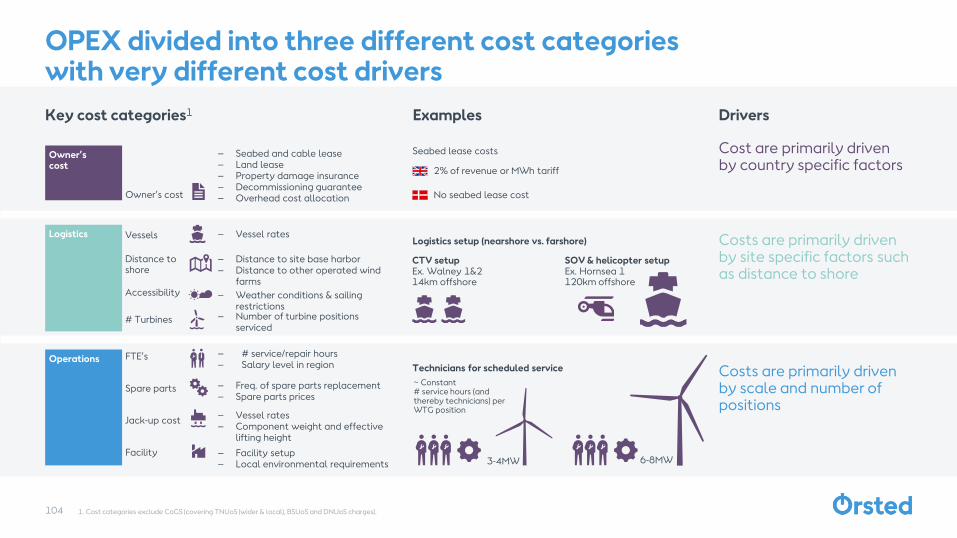
1. Cost categories exclude CoGS (covering TNUoS (wider & local), BSUoS and DNUoS charges).
OPEX divided into three different cost categories with very different cost drivers
Key cost categories1 Examples Drivers
Operations
Logistics
Owner’s cost
No seabed lease cost
2% of revenue or MWh tariff
SOV & helicopter setupEx. Hornsea 1120km offshore
Technicians for scheduled service
Logistics setup (nearshore vs. farshore)
CTV setupEx. Walney 1&214km offshore
Seabed lease costs
~ Constant # service hours (and thereby technicians) per WTG position
3-4MW 6-8MW
Cost are primarily driven by country specific factors
Costs are primarily driven by site specific factors such as distance to shore
Costs are primarily driven by scale and number of positions
Owner’s cost
FTE’s
Spare parts
Jack-up cost
Facility
Vessels
Distance to shore
Accessibility
# Turbines
– # service/repair hours– Salary level in region
– Freq. of spare parts replacement– Spare parts prices
– Vessel rates– Component weight and effective
lifting height
– Facility setup– Local environmental requirements
– Weather conditions & sailing restrictions
– Distance to site base harbor– Distance to other operated wind
farms
– Vessel rates
– Seabed and cable lease– Land lease– Property damage insurance– Decommissioning guarantee– Overhead cost allocation
– Number of turbine positions serviced
104

Categories Lifetime OPEX/MW guidance
1. Adjusted to real-2019 the range is 15.6-17.7 DKKm/MW.2. Adjusted to real-2015 the number is 14.3 DKKm/MW.Note: Difference between real term 2015 and 2019 assumes 1% yearly inflation
Offshore wind OPEX/MW continues to decrease driven by scale and continuous operational optimization
Guidance given at IPO
15-17DKKm/MWReal-20151
~ -50%
OPEX/MW
3-4MW
3-4MW
6-8MW
Development(portfolio level)
Operations
Logistics
Owner’s cost Roughly flat
development per MW on portfolio level
Roughly flat development per MW on portfolio level
Roughly constant per turbine position on portfolio level
OPEX/MW for existing operating portfolio
~15DKKm/MWReal-20192
OPEX/MW for 3-4MW turbines
~10DKKm/MWReal-2019
OPEX/MW for 6-8MW turbines
3-4MW
6-8MW
Guidance given at CMD 2018
105

106
World-class offshore wind operations
Standard Ørsted Operations framework delivering superior operational performance and platform
for global growth
Leverage market leading scale to implement industry best practices and technologies
World-class offshore wind operations creating value for our partners and shareholders

Capital Markets Day28 November 2018
Customer Solutions

2013 – Ørsted A/SExecutive Vice President, Distribution & Customer Solutions
2013 – 2013 Ørsted A/SExecutive Vice President, Energy Markets
2012 – 2013 Ørsted A/SActing Deputy CEO, Wind Power
2002 – 2012 Ørsted A/SSenior Vice President, Group Treasury & Risk Management
1999 – 2002 KPMGPartner, KPMG Consulting, Financial Services
1995 – 1999 KPMGConsultant, KPMG Consulting
1987 – 1995 Unibank / Privatbanken, Various positions in Intl. Division and in Treasury
Morten Hultberg Buchgreitz
Executive Vice President, CEO Customer Solutions
Born 1967
Education: M.Sc., Business Administration and Computer Science, Copenhagen Business School, 1992
Offshore
Onshore
Bioenergy
Customer Solutions
Ørsted
108

Customer Solutions is the route-to-market for Ørsted
Customer Solutions ambitionWe deliver world-class energy solutions to customers as their natural partner in the green transition
Energy generation… … packaged as products…
• Commodities
• Corporate PPA
• Certificates trading
• Balancing Service
• Solutions
• Green gas
• Portfolio management
• …
…sold across customer groups
Traded Markets
Wholesale Markets
Commercials & Industrials
Small and medium sized enterprises
Bioenergy
Onshore
Offshore
109

1. B2B sales volumes are for Denmark, Sweden and UK
Commodities: The backbone
Commodity sales is the foundation… … for building customer relationships
35 34 32 3525 26
7 6 68
6 7
FY2014 FY2015 FY2016 FY2017 9M2017 9M2018
41 39 3843
30 32
+7%
Point of access to customers
Capabilities enable other products377434
380 395
279 291
FY2014 FY2015 FY2016 FY2017 9M2017 9M2018
+4%
Highly competitive market
Power Gas
Gross margin
B2B sales volumes1
TWh
B2B gross margin
DKKm
110

Different sources of merchant risk
1. Race Bank offshore wind farm is an operational wind farm in the UK with a total capacity of 573MW and 50% owned by Ørsted 2. Nysted offshore wind farm has been operational since 2003 and full subsidy expired in 2016 on the DK 166MW and 42.75% owned wind farm 3. Cluster 1 is a development offshore wind farm project in Germany with a total capacity of 900MW111
Corporate PPA: Mitigates Ørsted’s merchant price risk
UK ROC wind farms
• Exposed to merchant power prices
• Need to reduce merchant price risk
Zero subsidy
• Fully exposed to power prices
• Need to provide revenue certainty to drive forward new build projects
Merchant risk can be mitigated through traded markets
Different markets to mitigate merchant risk
Merchant risk can be mitigated by corporate PPAs with C&Is
Key focus for Customer Solutions to market corporate PPAs to C&Is
E.g. Race Bank1
Existing offshore wind portfolio (UK)
New build zero subsidy offshore wind farms (DE & NL)
E.g. Cluster 13
Wind farms with ending subsidies
• Exposed to merchant power prices
• Need to reduce merchant price riskE.g. Nysted2
Existing offshore wind portfolio
Merchant risk can be mitigated by contracts on the wholesale market

Fixed price Corporate PPA
Corporate PPA framework: Fixed price PPAs with C&Is from Ørsted offshore wind farms
Benefits
Ørsted
– Long term price certainty for wind farm power production
– Develops long term customer partnerships
Customers
– Long term certainty on power costs
– Reduce carbon emissions
– Enable sustainable products (green value chain)
Customers
Sustainability focused
– Consumer facing companies (e.g. retail, water, telecoms, food manufacturing)
– Commitment to source 100% renewable (e.g. RE100 companies)
– Link to specific wind farms strengthen CSR communication
Cost certainty
– C&Is with high power costs and requirement for long term cost control (e.g. machinery and chemical production)
– Minimise exposure to future volatility of power prices
Long-term power purchase agreement under a fixed price structure
Customers purchase power from specific offshore wind farm
Green certificates transferred 100% to customers for sustainability claim
Ørsted can balance and shape wind output to match customer consumption
112

Customers
OFGEM - UK Office of Gas and Electricity Markets
Non-Renewable Generators
Renewable Generators
1. OFGEM
Certificates trading – ROCs: OFGEM rewards renewable UK assets with tradeable ROCs
Issuing ROCs
Sale of ROCs and power
Utilities
Utilities required to present a defined number of ROCs per GWh of power sold
– ~100m ROCs were delivered to OFGEM in 20181
– Renewable assets receive ROCs during the first 20 years of production
– Last ROCs will be issued in 2037 (no new assets entitled to ROCs since 2017)
Sale of power Sale of power
113

5-7
~13%
1. ~13m of the ~100m ROCs presented to OFGEM in 2018 were from Ørsted
Certificates trading – ROC Auction: Ørsted tenders ROCs from UK offshore wind portfolio
Billions DKK annual ROC sales
ROC market share1
Annual ROC tender selling excess ROCs from wind farms
ROC tender Benefits
Ørsted
– Effectively sells large volumes with a longer tenure
– Achieves competitive prices
Customers
– Fulfil their obligations towards OFGEM
– Effectively purchase large volumes with a longer tenure
Customers
– UK supply companies
– Without sufficient renewable generation, supply companies will have ROC imbalances
– ROC balance can be obtained by purchasing ROCs from renewable generators with surplus
– Potential imbalances are penalized annually by fees payable to OFGEM
114
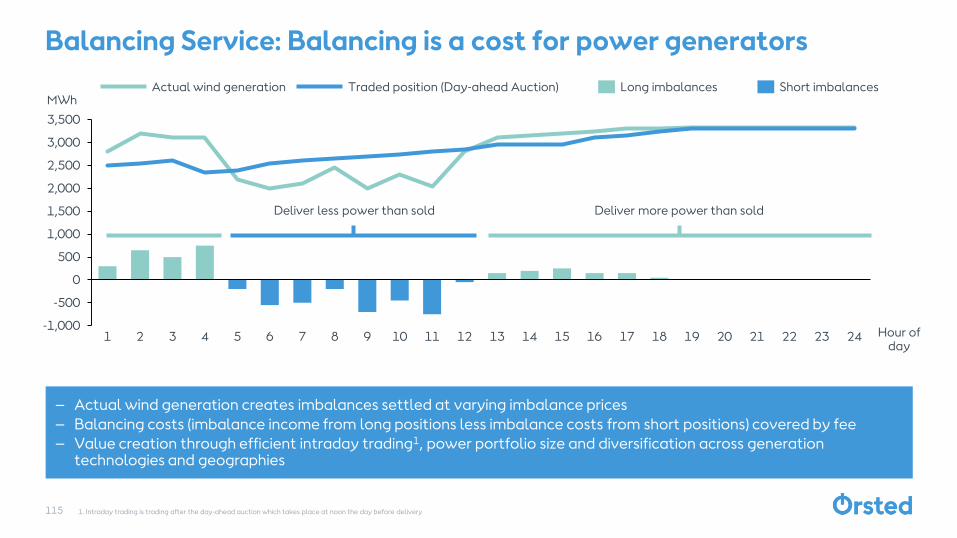
– Actual wind generation creates imbalances settled at varying imbalance prices
– Balancing costs (imbalance income from long positions less imbalance costs from short positions) covered by fee
– Value creation through efficient intraday trading1, power portfolio size and diversification across generation technologies and geographies
1. Intraday trading is trading after the day-ahead auction which takes place at noon the day before delivery
Balancing Service: Balancing is a cost for power generators
-1,000
-500
0
500
1,000
1,500
2,000
2,500
3,000
3,500
20131 62 3 4 95 7 8 10 11 12 14 15 16 17 18 19 21 22 23 24
MWhActual wind generation Traded position (Day-ahead Auction) Long imbalances Short imbalances
Deliver less power than sold Deliver more power than sold
Hour of day
115

1. Total balancing cost calculation: Energy produced form UK wind power last 12 months (54.5 TWh, source: Renewable UK) multiplied by wind power balancing costs (avg. €2-3/MWh, source: The European Wind Association) at EUR/DKK exchange rate of 7.46 2. BNEF
Balancing Service example: Triton Knoll - balances wind farms leveraging our existing setup
Power route-to-market
Balances and offtakes wind farm’s production
Year contract
No long-term power price risk, only balancing risk
Balancing services to Triton Knoll Benefits
Ørsted
– Obtains balancing fee less imbalance cost
– Leverages existing systems and processes
– Diversifies own portfolio
Customer
– Cost efficient route-to-market
– Eliminates imbalance risk
Triton Knoll
– 860 MW offshore wind farm to go into operation in 2021
– Owners
– Innogy 59%
– J Power 25%
– Kansai Electric Power 16%
– Innogy will operate the wind farm
UK wind power balancing market
– Total annual UK wind power balancing cost is DKK ~1.0bn1
– UK wind power capacity expected to grow 8% CAGR from 21GW in 2018 to 36GW in 20252
116
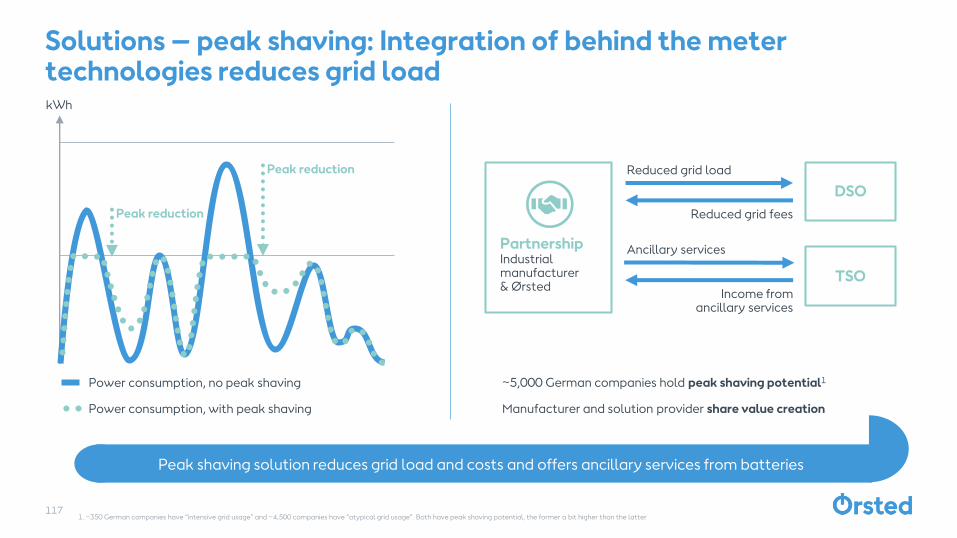
1. ~350 German companies have “intensive grid usage” and ~4,500 companies have “atypical grid usage”. Both have peak shaving potential, the former a bit higher than the latter
Solutions – peak shaving: Integration of behind the meter technologies reduces grid load
PartnershipIndustrial manufacturer& Ørsted
DSO
TSO
Reduced grid fees
Reduced grid load
Income from ancillary services
Ancillary services
Peak reduction
Power consumption, no peak shaving
Power consumption, with peak shaving
~5,000 German companies hold peak shaving potential1
Manufacturer and solution provider share value creation
Peak reduction
kWh
Peak shaving solution reduces grid load and costs and offers ancillary services from batteries
117
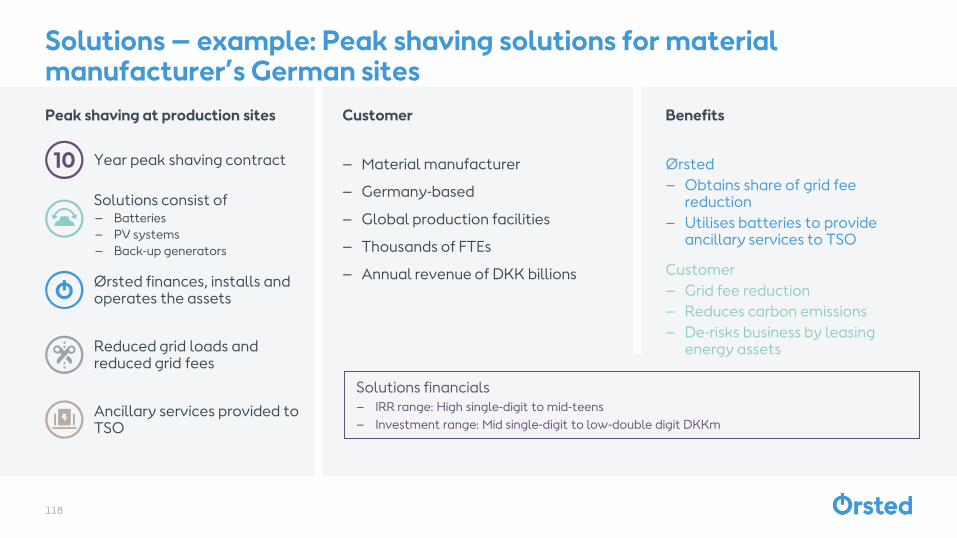
Solutions – example: Peak shaving solutions for material manufacturer’s German sites
Year peak shaving contract
Solutions consist of– Batteries
– PV systems
– Back-up generators
Ørsted finances, installs and operates the assets
Reduced grid loads and reduced grid fees
Ancillary services provided to TSO
Peak shaving at production sites Benefits
Ørsted
– Obtains share of grid fee reduction
– Utilises batteries to provide ancillary services to TSO
Customer
– Grid fee reduction
– Reduces carbon emissions
– De-risks business by leasing energy assets
Customer
– Material manufacturer
– Germany-based
– Global production facilities
– Thousands of FTEs
– Annual revenue of DKK billions
Solutions financials
– IRR range: High single-digit to mid-teens
– Investment range: Mid single-digit to low-double digit DKKm
118

Biomethane1 growth expectations are high
Expected annual biomethane supply in the EU, BCM2
1. Biomethane is upgraded biogas injected into grid or used in transportation 2. KPMG – Green Biogas for the Future
Green gas: destination fuel in the green transformation
CAGR
1
7
18
20302015 2020
+20%Unsorted
household wasteIndustrial waste Agricultural manure
Waste sorting
Anaerobic digestion
Upgrading
Renescience End to end biogas plant (AD + upgrading)
Key steps in biomethane production process
Different input sources require different process steps
119

8
17
Green gas example: Kalundborg Bioenergy – an industrial waste biogas plant
Million m3 production of biomethane (~5t households’ consumption)
Tonnes carbon emission reduction
Capacity: 300,000 tonnes of by-products
Annual figures Benefits
Ørsted
– Monetize the value in industrial by-products
– Delivers significant carbon savings by replacing fossil natural gas
Customers
– Reduce carbon emissions
– Utilise waste streams to produce green energy
Customers
– World-leading manufacturer of insulin Novo Nordisk
– World-leading manufacturer of enzymes Novozymes
– Co-owned with operator Bigadan
Biogas plant financials
– IRR range: High single-digit to low-teens
– CAPEX (AD + upgrading): DKK 200-400m
120

Ambition to co-create strong, green energy partnerships
… for a greener future
Years of climate partnership
Accumulated carbon emission reductions of +200,000 tonnes
Energy consumption reduced >20%
50
The full power consumption of Novo Nordisk’s Danish production facilities has been covered by renewables since 2011
Partnership with Novo Nordisk supported Ørsted’s FID on Horns Rev 2
By 2020, Novo Nordisk aims to run all global production facilities on green power
Novo Nordisk and Ørsted partners…
In 2018, the Kalundborg Bioenergy plant became operational
DKKm annual energy savings
121

Customer Solutions enables Ørsted’s green growth
Route-to-market for Ørsted’sproduct portfolio
Mitigates merchant risk through trading and green energy partnerships with customers
Drives incremental profits by supporting customers in becoming greener
122

Capital Markets Day28 November 2018
Financials

2013 – Ørsted A/SCFO
2006 – 2013 Ørsted A/SSVP, Group Finance incl. periods as Business Unit CFO at DCS & Energy Markets
2004 – 2006 Ørsted A/SVP, Group Finance
1997 – 2003 Borealis A/SVarious management positions with Finance
1987 – 1997 Arthur AndersenAccountant
Marianne Wiinholt
Chief Financial Officer
Born: 1965
Education: MSc in Business Administration and Auditing, Copenhagen Business School. State Authorised Public Accountant
Offshore
Onshore
Bioenergy
Customer Solutions
Ørsted
Finance
124

Group EBITDA
DKKbn
1. Based on expectation to recognise roughly 85% of expected profit of DKK 17-18bn from Hornsea 1 farm-down
Follow-up on 2018 EBITDA
9.4
12.7
4.7
5.0
9.8
2016 2017 2018Guidance
14.5-15.31
2018 incl. new offshore partnerships
19.1
22.5
13-14
~27.5-29.3
Significantly higher
Non-recurring items
Offshore new partnerships
Guidance range
Existing activities
Hornsea 1 farm-down
125

1. Excluding new partnership agreements (Borkum Riffgrund 2 and Walney Extension)126
Follow-up on business unit EBITDA and gross investments for 2018
23-25DKKbn
incl. Lincoln Clean Energy and Deepwater Wind acquisitions
Offshore Bioenergy Customer Solutions
Higher In lineHigher
DKK 10.8bn1 DKK 0.2bn DKK 2.1bn
Full year EBITDA 2017
Business unit directional EBITDA guidance
FY2018 vs. FY2017
Gross investments 2018 guidance

Sites generation capacity
GW
Construction agreements and divestment gains
EBITDA, DKKbn
Project development and other
EBITDA, DKKbn
– Earnings from operating wind farms expected to increase driven by ramp-up in generation from:– Race Bank, Walney Extension and
Borkum Riffgrund 2 commissioned in 2018
– Hornsea 1 commissioned in 2019– Increase of 44% in generation capacity
from 2017 to 2019
– Expected profit from Hornsea 1 amounts to DKK 17-18bn of which 85% will be included in 2018 and the remaining 15% in 2019
– Currently no further farm-downs in Europe expected
– Potential for future farm-downs in Taiwan
– Expected increased project development costs from 2017 to 2019. Thereafter, stable level expected
– Increase reflects higher level of activities related to market entry in new countries, regimes where FID is taken late in project lifetime and increased build-out ambitions
– All IRRs presented are lifecycle incl. project development costs
2017
9.8
3.9
2018E
13.7
14.5-15.3
2019E
2.6-2.7
2.5
2017 2019E2018E
3.6
3.0
44%
-1.6
2017 2018E
~1.8
~0.6
2019-2022E
~2.4
New partnerships agreements
Current partnerships
Offshore financials
Hornsea 1 farm-down
Other
Project development
127

1. Capacity weighted 2. Gode Wind 1&2, Burbo Bank Extension, Race Bank, Walney Extension, Borkum Riffgrund 2 and Hornsea 1Note: Difference between real term 2015 and 2019 assumes 1% yearly inflation
Update on Offshore CAPEX guidance
22-24 Real 2015
20 Real 2015
Guidance on Borssele 1&2, Hornsea 2, Gode Wind 3&4 and Cluster 1.Significantly lower than IPO portfolio driven by Ørsted’s continuous efforts to reduce costs through maturation of the supply chain incl. larger turbines, foundation updates, cable optimisation and reduction in installation time
Average CAPEX/MW for the FID’edbuild-out portfolio at IPO2
Updated guidance on FID’edbuild-out portfolio at IPO2.CAPEX/MW lowered as projects have been substantially matured, increasing visibility on CAPEX
13.0Real 2015
22.9-25.0 Real 2019
20.8 Real 2019
13.5Real 2019
Guidance at CMD 2018Updated guidance at FY2017Guidance at IPO
128
CAPEX cost development excluding transmission asset costs
DKKm/MW1

129
Significant higher CAPEX for the Changhua 1&2a project in Taiwan
Factor
Developingsupply chain
Design revisions
Installation
Transport
Transmission
− Localisation commitments (e.g. foundations, onshore transmission, towers, etc)
− Added costs to suppliers, e.g as part of their efforts to upgrade production facilities and finance new built vessels
− Upgrade of harbour facilities
− Adaptation of key components
• Turbines enhanced to withstand typhoons
• Piled-jacket foundations to withstand typhoons, earthquakes and poor soil conditions
− Longer installation campaign to accommodate delivery of local supply and adverse weather conditions during winter
− Transportation of key components from Europe and APAC
− Full-scope projects including on- & offshore transmission asset
− Costs related to build out of national grid infrastructure
Impact
CAPEX per MW for the Changhua 1&2a project is expected to be approx. twice as high as the CAPEX multiple of European projects under construction and development
Comment
High
Medium
Low
High
High

Offshore wind OPEX/MW continues to decrease driven by scale
Guidance at IPO
15.6-17.7Real 2019
3-4MW 6-8MW
~ -50%
Average lifetime OPEX/MW guidance
DKKm/MW
OPEX/MW
15Real 2019
Guidance at CMD 2018
10Real 2019
Guidance at CMD 2018
Owner’s cost
Logistics
Operations
3-4MW 6-8MW
Note: Difference between real term 2015 and 2019 assumes 1% yearly inflation
3-4MW
15-17 Real 2015
14.3 Real 2015
On a portfolio level the OPEX/MW profile is expected to decrease 2% annually in real terms over the operational lifetime
130

1. Gode Wind 1&2, Burbo Bank Extension, Race Bank, Walney Extension, Borkum Riffgrund 2 and Hornsea 12. Updated portfolio include: IPO portfolio, Borssele 1&2, Hornsea 2, Gode Wind 3&4 and Cluster 1
Strong load factors across Offshore portfolio
Load factors
Capacity weighted average
FY 2017 IPO portfolioat IPO1
44%
Updated portfolioat CMD 20182
48-50% 48-50%
IPO portfolio marked a step-up in load factor
− Load factor of 48-50%
− Burbo Bank Extension as a negative outlier with lower than average expected load factor
Updated portfolio with equivalent load factor
− IPO portfolio with addition of Borssele 1&2, Hornsea 2, German Cluster 1 and Gode Wind 3&4
− Load factor of 48-50% reiterated for the extended portfolio of assets
− Hornsea 1&2 are positive outliers with higher than average expected load factors
− German Cluster 1 is a negative outlier with lower than average expected load factor. Despite high wind speeds the turbine density will have adverse effect on load factor
131

Group regulated and contracted EBITDA average 2019-2025 Increased from 80-90 percent1
Offshore wind farms – Average subsidy/PPA lifetime
Ørsted ownership, GW
1. Based on EBITDA excluding project development cost. Market exposed includes activities related to the portion of wind power generation that is sold at market price and gas & power purchases and sale. Contracted comprises farm-downs from Offshore partnerships and construction agreements, long-term O&M agreements, PPAs and fixed price hedges, long-term ancillary service contracts and income from Renescience project. Regulated comprises subsidised income from wind farms (Production Tax Credits and Tax incentives in the US), income from regulated Power Distribution and Oil Pipe, and income from heat generation under long-term contracts with regulated heat prices
High visibility on future earnings
Average subsidy lifetimeProjects in operation, under construction and awarded
~90%
~15years
In operation
Under construction Awarded
5.0
4.0
2.0
1.0
3.0
2030
6.0
0.0
7.0
2020 2040
Key metrics
132

1Weighted average including escalation for PPA lifetime133
Onshore Wind key metrics
CAPEX multiples lower than BNEF 2017 benchmarks<1.5USDm/MW
Avg. nominal offtake pricingfor operational portfolio122USD/MWh
Average historical load factor ~45%
Operational portfolio – 813MW
Texas
Tahoka
Amazon Windfarm Texas
Willow Springs

1. Weighted average expected load factor2. Weighted average including escalation for PPA lifetime134
Onshore Wind key metrics
Near-term portfolio – 714MW
CAPEX multiples lower than BNEF 2019 benchmarks<1.2USDm/MW
Avg. nominal offtake pricingfor development portfolio212-15USD/MWh
Expected average load factor1~47%
Nebraska
Texas
Plum Creek
Lockett
Sage Draw

Cash flow profile - Illustrative
1. Example assumes a pay go structure. Depending on the project optimisation, a structure where everything is paid upfront is also common. In the this structure there is no risking of PTCs production, and therefore no pay go’s
Onshore wind farm including tax equity partner
Year 0
Year 20
Year 5
Year 10
Year 15
Year 30
CAPEX EBITDA, market price
Tax equity partner upfront payment
Pay go1
Paid tax
EBITDA, PPA/hedge (net of partner share of PTCs and Tax incentives)
PPA/hedge agreement typically run 12-15 years
PTCs run for 10 years (25USD/MWh in real 2017 if 100% PTC)
Market price
135

1. The power purchase agreements (PPAs) for Dermott, Willow Springs Tahoka and to some extent Plum Creek, which were entered into at closing of the LCE acquisition, are considered cancelled under IFRS 3, which results in the power being recognised at the market/spot price rather than the price in the PPAs
Onshore Wind – Acquisition, EBITDA and Operating cash flow
EBITDA full consolidation
Illustrative 2019
Operating cash flow
Illustrative 2019
Lincoln Clean Energy
Deal financials
Fixed costs &Project development
Derivative run off1
EBITDA
PTCs
Sale of power(mainly PPA price)
Pa
y g
o
Re
ve
rsa
l o
f P
TC
sa
nd
ta
x in
ce
nti
ve
s
Ch
an
ge
ind
eri
va
tiv
es
EB
ITD
A
Lo
ck
ett
ta
x e
qu
ity
co
ntr
ibu
tio
n
Inte
rest
s a
nd
oth
er
ch
an
ge
s in
NW
C
Op
era
tin
gc
ash
flo
w
− Acquired 100% of equity placing an enterprise value on LCE at USD 580 million
− Tax equity end of year estimate amounts to USD 600 million, split between:
– USD 550 million as NWC
– USD 50 million as NIBD
136
Tax incentives

Bioenergy expected to quadruple EBITDA from 2017 to 2020
Bioenergy EBITDA
DKKbn
2020E2017
0.15
~0.60
4x
Ancillary Services
Heat & Power
Directional 2020 EBITDA guidance
Heat & Power – Higher
−Recovery in power prices and spreads over the medium-term
−Bioconversions of CHP plants increase EBITDA driven by long-term heat contracts
Ancillary services – Stable
−Stable EBITDA supported by mid-term manual reserve contract with Energinet until the end of 2020
−Hereafter, the Daily Capacity Auction market is expected to replace the Kyndby agreement for manual reserves in DK2
137

Ongoing business
Enabling Ørsted through market access
Divestments agreed ahead of IPO
Oil and gas pipeline infrastructure
Strategic divestments
Power distribution and residential businesses
Structural change to Customer Solutions portfolio
Power Distribution
B2C Sales City Light Gas pipe system
B2BMarkets LNGOil pipe system
138

1. Adjusted for Power distribution (1,164m), Oil pipe (39m), Gas distribution (-3m), Residential Business (68m), City Light (40m), Oil pipe system (39m), Gas pipe system (248m) and adjustments to provision in LNG (-389m) and Markets (-77m)
2. Provision only covers earnings gap related to capacity without long-term sourcing contracts
Customer Solutions financials
2017
<0.1
-0.6
Markets
-0.1
1.4
1.2 1.3
-0.2
2017 ongoing business1
LNG
Distribution
2.1
1.0
Sales
Customer Solutions EBITDA
DKKbn
Mid-term EBITDA expected to be significantly lower
Compared to adjusted 2017
Markets - Significantly lower− In 2017 Markets was positively affected by high portfolio and
trading gains
− From 2018 negative effect from lower volumes managed following the 2017 divestment of O&G
− Volatile gas prices will continue to impact Markets through valuation of gas storage and gas storage hedges
− Partly offset by higher power volumes from our offshore wind farms
B2B - Higher− Earnings from B2B commodity and solutions sales expected to turn
positive following business development initiatives
LNG - Stable− LNG is expected to stabilise at the 2017 adjusted level going
forward
− Continued loss making as earnings from regasification and optimisation of volumes cannot cover capacity payments at the Gate terminal2
139

Capital employed - Net working capital
DKKbn
1. Our project companies in the UK are required to divest their offshore transmission assets to an OFTO within 18 months from the approximate date on which power is first generated from the asset. At 9M 2018, the balance primarily included Race Bank, Walney Extension and Hornsea 1, which we expect to divest in Q1 2019, Q4 2019 and Q1 2021, respectively
Net Working Capital development
3.9
-2.7
-5.7
20172016
-2.7
7.5
-3.0
10.1
-3.6
-1.1
9M 2018
-4.5
1.8
5.5
Work-in-progress– We tie up significant funds in offshore transmission assets in the UK.
The duration of the construction period until divestment is up to 3-4 years1
– Construction of offshore wind farms for partners tends to balance over the years (although with fluctuations) as we receive milestone payments from the partners
Trade payables related to capital expenditure (CAPEX payable) – These payables form part of our cash flow from investments and
will fluctuate with the investment activities
Other items– Standard NWC items such as trade receivables, trade payables,
inventories and VAT will fluctuate with the seasons– Prepayments from heat customers build up during the construction
period of our biomass conversions– Prepayments of approx. DKK 2bn related to grid connection
charges in the Power Distribution business will expectedly be divested in 2019
Tax equity Tax equity partners’ upfront payment (and Pay gos) related to PTCs and tax incentives will be included in NWC during Q4 2018
Work in progress
CAPEX payable
Other items
140

1. Net debt (incl. hybrid capital) to enterprise value
Ørsted leverage compared to project finance
Typical first year
stand-alone project finance
leverage level
(BBB-)
Avg. project finance
lifecycle leverage
Continued growth
investments increasing
market value
Remaining leverage
difference between
Ørsted financing and
project financing
Ørstedleverage1 in early 2020 based on market
capitalisation(BBB+)
~70%
~25%
A
A
Lower direct costs
Flexibility Business
Lower risk and higher parent rating enables benefits for Ørsted through
- Lower structuring and bank fees
- Scale in financing activities
- PCG’s instead of LC’s
- Simple and transparent debt structure
- No covenants or pledge of assets
- No restrictions on construction and operation
- Markets for senior bonds more stable
- Easy access to capital in new markets
- Long-term contracts, e.g. construction agreements, O&M and CPPAs
Lower return requirement
- Lower company risk profile
- Lower credit spreads on debt (discount of 100-120bps)
141

Key drivers of long-term wind capture power prices
Gas, CO2 and coal prices
Renewable build-out
Thermal phase-out
Interconnector
Electricity storage
Power demand
Gas, coal and CO2 prices are key when forecasting long-term wind capture prices
Build-out of wind and solar power would decrease wind capture prices
Phase-out of baseload power plants (nuclear, lignite, coal) would increase wind capture prices. Final effect depends on what replaces it as more renewable decrease wind capture prices
Increasing the interconnector capacity between price zones with respectively high and low wind capture prices will decrease wind capture prices in the high price zone and increase in the low price zone
Increasing amounts of electricity storage would increase wind capture prices
Increasing power demand would increase wind capture prices – and even more so if demand can be shifted in time, e.g. electric vehicles
Comment Correlation
Positive
Positive
Negative
Positive
Positive/Negative
Positive
Impact
142

Power generation mix for UK and DE
%
Prices above 10 EUR/MWh in UK and DE
Share of all hours, %
Fossil fuel expected to be price setting in 80-90% of hours in 2040
DEUK
10088
9581
20171 2040E2
52 30
Wind capture price (real 2017), EUR/MWhUK DE
1. Source 2017 production mix: Department for Business, Energy and Industrial strategy, UK Energy statistics 2017, AGEB Energy consumption in Germany in 2017Source 2017 electricity prices: ENTSO-E Transparency Platform https://transparency.entsoe.eu/dashboard/show2. Source 2040 numbers: © 2018 IHS Markit. All rights reserved. The use of this content was authorized in advance. Any further use or redistribution of this content is strictly prohibited without prior written permission by IHS Markit.
32
21
29
12
5044
12
79
6379
076
20171 2040E2
Nuclear
Renewables
UK DE
143

1. Borssele 1&2, Hornsea 2, German Cluster 1, Gode Wind 3&4, Greater Changhua 1&2a, Greater Changhua 2b&4 and Revolution Wind144
Key metrics, financial targets and policies
Financial targets
Total CAPEX spend, 2019-2025 DKK 200bn
CAPEX allocation split, 2019-2025
Offshore 75-85%
Onshore 15-20%
Bioenergy + Customer Solutions 0-5%
Unlevered lifecycle IRR from competitive offshore wind tenders1 7.5-8.5%
Average share of EBITDA from regulated and contracted activities, 2019-2025
90%
Average ROCE, 2019-2025 ~10%
Average yearly growth in EBITDA from offshore and onshore wind farms in operation, 2017-2023
~20%
Green share of generation, 2025 99%
Financial policies
Corporate rating Baa1/BBB+/BBB+ (Moody’s/S&P/Fitch)
Dividend policy
Ambition to increase the dividend paid by a high single-digit rate compared to the dividends for the previous year up until 2025

Capital Markets Day28 November 2018
Wrap-up

Leverage industry leading market positions and capabilities in green energy and balance sheet capacity.
Invest DKK 200bn in value creating, global growth towards 2025 with a strong emphasis on wind energy.
Grow dividend by high single digit annually and maintain financial strength and credit ratings.
Deliver long-term return on capital employed of ~10%.
Drive annual operating profit growth of ~20% between 2017 and 2023.
Maintain share of contracted and regulated revenues around 90% providing significant financial visibility and predictability.
Combines into a compelling value creation formula which we believe to be among the very best in the industry.
By 2030, Ørsted will remain a growing and value creating, global powerhouse in green energy with more than 30 GW of installed renewables capacity...
...and our production will be emission free.
Summing it all up
146

Capital Markets Day28 November 2018
Appendix

Accounting treatment for new wind farms – Illustrative, excl. derivatives run-off
148
Onshore wind farm including tax equity partner
Impact on accounts Y0 Y1 … Y11+12 Y13 → Accounting considerationsØrsted cash ownership 70% 70% 100% 100%
Ørsted tax ownership 1% 1% 100% 100%
Revenue (full consolidation) +100 +100 +300
OPEX (full consolidation) -75 -75 -75
Other operating income +250 - -
Partner’s share of PTCs and Pay go +200 - -
Partner’s share of tax incentives +50 - -
EBITDA (full consolidation) +275 +25 +225
Interest on tax equity -5 - -
Tax - -5 -47
NWC +1.525 -230 - -
Upfront payment +1.525
Pay go +20 - -
PTCs and tax incentives (added-back) -250 - -
Operating cash flow +1.525 +40 +20 +178
CAPEX -2.000
Free cash flow -475 +40 +20 +178
Financing cash flow
Cash distribution from and to equity partner +75 -10 - -
Tax equity partner receives PTCs, tax incentives and a small share of operating earnings to achieve an agreed upon return after which the partner exits the project. Partner receives part of operational earnings as cash contributions
Partner’s share of PTCs and tax benefits fully consolidated into EBITDA
Tax equity partner upfront payment related to PTCs and tax incentives included in NWC and amounts on average to 80% of CAPEX
Revenue from years 1-12 reflects presence of long-term, fixed price offtake arrangements, which are required to secure tax equity investments and efficiently monetise PTCs
Deferred contributions (Pay gos) represent the delta between actual PTCs generated and PTCs monetized upfront. Pay go is calculated as delta between actual and risked (approximately 80%) production

Power Distribution
2017 EBITDA DKK 1.2bn
2017 RAB DKK 10.6bn
Expected 2020 RAB DKK 13.7bn
The leading regulated power DSO serving c. 1 million connections in and around Copenhagen
149
Structural change to Customer Solutions portfolio
Strategic divestments - Power distribution and residential business
Sales, B2C
2017 EBITDA DKK <0.1bn
Denmark's largest power and gas sales company with 733,000 power connections and 91,000 gas connections
Operates mainly in Northern Zealand
City Light
2017 EBITDA DKK <0.1bn
Operates and services c. 157,000 street lights across 17 municipalities
Operates in Northern Zealand
Regulatory divestments - Oil and gas pipeline infrastructure
Oil pipe system
2017 EBITDA DKK <0.1bn
Oil pipeline with a total length of 330 kilometers
Gas pipe system
2017 EBITDA DKK 0.2bn
More than 600 kilometers pipeline

Daniel Lerup
Head of Investor Relations
Rasmus Hærvig
Senior Investor Relations Officer
Dennis Callesen
Lead Investor Relations Officer
Sabine Lohse
Senior Investor Relations Officer