capital market highlights: sectoral turnover summary ...s3.amazonaws.com/zanran_storage/…the...
TRANSCRIPT

STOCK/CORPORATEThe Financial Express Thursday, May 5, 2011 Page 10
....................................Continued to page 11
BANKAB Bank - A 920.0 917.5 929.8/900.3 915.80 1.28 904.25 53760 1903 1815/837 910.0 916.0 924.0/900.3 915.80 1.49 902.39 15340 542 1810/290 63.28 915.8 100/5 15/07/10 298.68 104.9 8.7 20%, 25%B 1209 138.5 7 Q3
City Bank - A 484.0 473.8 484.0/460.0 473.59 -0.60 476.46 75894 2302 1158/415 479.0 474.0 481.5/461.0 473.03 -0.48 475.29 11760 378 1200/419 41.51 473.5 100/5 22/06/11 227.87 45.7 10.4 30%B 1210 45.7 10 Ad
IFIC Bank - A 800.0 788.8 800.0/777.0 788.50 -0.51 792.56 24591 776 1650/750 800.0 794.0 800.0/780.0 791.69 -0.67 797.02 1268 54 1700/670 20.39 788.7 100/5 24/07/11 264.49 76.3 10.3 27%B 1210 57.6 14 Q1
Islami Bank BD - A 465.0 468.8 474.5/461.8 467.92 0.45 465.82 64253 1140 879/443 465.0 466.0 470.0/465.0 467.13 0.84 463.25 5410 125 2400/4 32.59 467.9 100/10 18/05/11 234.76 44.6 10.5 35%B 1210 44.6 10 Ad
National Bank - A 59.90 60.20 60.50/59.20 60.06 0.59 59.71 1883187 3084 878/55 60.00 60.00 65.00/58.00 60.09 0.42 59.84 368095 901 880/11 135.23 60.1 10/100 15/03/10 22.21 8.0 7.5 95%B 1210 8.0 8 Ad
Pubali Bank - A 47.00 47.10 47.50/46.00 46.73 0.58 46.46 371767 1366 880/43 47.00 47.00 47.30/46.20 46.86 1.10 46.35 74325 365 883/43 20.85 46.8 10/25 31/03/11 21.07 4.8 9.7 5%, 35%B 1210 4.8 10 Ad
Rupali Bank - Z 1380 1383 1385/1380 1383.33 -0.93 1396.38 30 32170/1200 ---- ---- ---- 1425.00 Not Traded ---- ---- 2120/1211 0.04 1383.3 100/10 19/05/11 1029.2 43.7 31.7 10%B 1210 43.7 32 Ad
Uttara Bank - A 66.00 66.20 66.80/64.70 65.79 1.09 65.08 212350 777 1869/60 66.00 66.00 66.50/65.00 65.79 0.95 65.17 56330 187 1850/59 17.68 65.8 10/25 15/05/11 28.28 5.4 12.2 20%, 20%B 1210 5.4 12 Ad
ICB Islamic Bank-Z 12.40 12.40 12.60/12.30 12.44 0.81 12.34 476000 334 2150/12 ---- ---- ---- ---- Not Listed ---- ---- -------- 5.92 12.4 10/500 21/06/11 -8.73 -2.0 -6.1 No Div. 1210 -2.0 -6 Ad
Eastern Bank - A 52.10 52.40 53.00/50.80 52.16 0.15 52.08 190625 438 746/45 52.10 53.00 53.50/51.10 52.71 1.25 52.06 38410 115 746/39 11.97 52.3 10/200 30/03/11 26.74 5.5 9.5 55%B 1210 5.5 10 Ad
Al Arafa Islami B-A 33.80 33.70 34.40/33.00 33.71 -0.09 33.74 776399 893 1000/30 33.90 34.00 34.20/33.20 33.77 0.96 33.45 764750 727 981/10 52.00 33.7 10/250 10/05/11 13.03 3.2 10.5 26%B 1210 3.2 11 Ad
Prime Bank-A 40.30 39.90 40.40/38.50 39.22 -2.41 40.19 937447 975 999/36 40.40 40.00 40.40/38.60 39.46 -1.69 40.14 127739 191 1020/33 41.80 39.3 10/250 27/03/11 29.03 4.2 9.3 35%B, 5% 1210 3.0 13 Q1
Southeast Bank-A 301.5 303.0 304.0/298.0 302.00 0.59 300.24 122748 1028 671/280 302.0 302.0 304.0/298.3 301.43 0.84 298.92 29966 609 674/279 46.10 301.9 100/50 22/03/11 197.82 45.2 6.7 20%B,10% 1210 45.2 7 Ad
Dhaka Bank -A 39.90 39.60 39.90/39.10 39.49 0.48 39.30 262688 536 590/36 38.50 40.00 40.50/38.10 39.57 1.57 38.96 17200 87 567/25 11.05 39.5 10/100 29/03/11 18.33 4.7 8.5 35%B 1210 4.5 9 Q1
N C C Bank -A 34.90 34.50 34.90/33.50 34.21 0.38 34.08 631611 1208 712/31 33.90 34.00 34.60/33.50 34.07 -0.09 34.10 334240 531 707/31 32.99 34.2 10/250 28/04/11 15.75 4.0 8.5 32%B 1210 4.0 8 Ad
Social Islami. B-A 23.00 23.00 23.30/22.30 22.90 1.28 22.61 1084104 1018 495/21 23.00 23.00 23.40/22.60 23.01 1.05 22.77 276250 371 720/20 31.18 22.9 10/250 28/04/11 12.32 1.9 12.1 14%B 1210 1.6 14 Q1
Dutch Ban. Bnk- A 1341 1361 1384/1312 1352.85 0.59 1344.93 8399 133 2570/995 1399 1394 1399/1380 1393.83 3.43 1347.63 300 6 18001/19 11.78 1354.3 100/50 24/03/11 350.05 100.1 13.5 30% 1210 100.1 14 Ad
MutualTrust Bank-A 367.0 370.3 372.0/365.5 368.65 0.72 366.03 49904 341 825/308 376.0 370.0 376.0/362.5 367.70 1.34 362.85 977 26 840/305 18.76 368.6 100/50 28/03/11 172.16 38.9 9.5 20%B 1210 38.9 9 Ad
Standard Bank -A 305.0 302.5 305.0/299.0 301.46 0.45 300.11 75700 478 724/265 301.0 302.0 304.5/296.3 301.14 0.36 300.06 14326 233 730/262 27.13 301.4 100/50 16/05/11 138.50 33.7 8.9 28%B 1210 33.7 9 Ad
One Bank -A 470.0 478.5 480.0/462.0 474.48 0.88 470.32 136099 1155 1196/424 475.0 478.0 482.0/465.0 475.00 1.01 470.23 7287 97 1214/411 68.04 474.5 100/50 28/03/11 152.55 59.2 8.0 55%B 1210 59.2 8 Ad
Bank Asia -A 452.0 454.8 464.0/447.0 453.95 2.65 442.24 44172 420 950/408 450.0 456.8 457.0/445.0 451.42 2.44 440.67 2100 26 965/350 21.00 453.8 100/50 30/03/11 167.94 45.9 9.9 40%B 1210 45.9 10 Ad
Mercantile Bank -A 306.0 303.3 306.0/296.0 302.75 1.13 299.37 90078 832 675/279 300.0 302.3 306.0/298.3 302.19 0.59 300.42 20016 224 699/1 33.32 302.7 100/50 11/04/11 169.61 33.6 9.0 22%B 1210 33.6 9 Ad
EXIM Bank-A 32.40 32.70 32.90/31.80 32.54 1.09 32.19 713137 1175 638/30 32.20 33.00 33.10/31.90 32.57 0.62 32.37 156350 365 670/28 28.30 32.5 10/100 09/06/11 13.50 4.0 8.2 35%B 1210 4.0 8 Ad
Jamuna Bank -A 31.10 31.30 31.70/30.70 31.32 0.93 31.03 393249 604 571/28 30.80 31.00 31.70/25.10 31.18 0.35 31.07 278665 291 580/23 21.00 31.3 10/250 19/05/11 23.56 2.9 10.6 22%B 1210 4.5 7 Q1
Brac Bank -A 458.0 455.0 458.0/446.0 453.31 -0.18 454.11 37406 343 1008/416 448.5 454.0 458.0/447.3 450.98 -0.42 452.87 8680 92 1019/10 20.87 452.9 100/50 24/03/11 291.14 56.8 8.0 10%,20%B 1210 56.8 8 Ad
Shahjalal Islami -A 38.00 39.10 39.80/37.20 38.55 2.61 37.57 1470542 2540 944/31 37.50 39.00 39.90/37.00 38.46 2.72 37.44 310650 833 942/31 68.64 38.5 10/50 09/05/11 19.70 6.1 6.4 30%B 1210 6.1 6 Ad
Premier Bank -A 32.80 33.40 33.70/32.20 32.87 0.06 32.85 771091 1005 600/30 32.80 34.00 34.00/32.20 33.04 0.55 32.86 166436 322 1224/15 30.85 32.9 10/250 06/04/11 15.65 4.6 7.1 31%B 1210 4.6 7 Ad
Trust Bank-A 399.0 395.3 399.0/385.0 389.32 -0.50 391.29 40311 319 845/346 391.0 395.8 401.0/391.0 396.44 2.05 388.49 1750 22 840/265 16.39 389.6 100/50 24/05/11 188.84 47.9 8.1 20%B 1210 47.9 8 Ad
First Security Bank-A 26.90 26.90 27.00/26.40 26.82 0.64 26.65 279060 580 415/25 27.20 27.00 27.30/26.70 27.06 1.08 26.77 125330 280 9999/10 10.88 26.9 10/100 31/07/10 2.61 1.3 20.8 10%B 1209 1.5 19 Q3
NBFIIDLC Finance -A 2195 2173 2195/2140 2171.81 1.14 2147.43 11135 3385398/2051 2200 2175 2200/2149 2170.06 0.81 2152.68 1574 225 5449/2062 27.60 2171.6 100/20 31/03/11 244.24 134.1 16.2 35%,65%B 1210 134.1 16 Ad
United Leasing - A 875.0 843.0 875.0/835.5 842.18 0.24 840.17 9460 313 2148/822 ---- ---- ---- ---- Not Listed ---- ---- -------- 7.97 842.2 100/20 09/06/11 171.14 40.9 20.6 7.5%,75%B 1210 39.7 21 Q1
Uttara Finance -A 163.0 156.1 163.0/148.2 153.55 -33.02 229.25 144960 880 4050/148 155.0 154.0 160.0/145.1 153.24 -32.73 227.81 21200 159 4050/145 25.51 153.5 10/50 30/05/11 62.68 11.4 13.4 40%B1210` 11.4 13 Ad
Midas Financing-A 1048 1099 1130/1048 1063.16 -4.84 1117.25 28650 380 2361/1011 1055 1078 1135/1055 1089.08 -3.21 1125.25 1325 23 2389/1000 31.90 1064.3 100/50 04/11/10 90.48 12.9 82.6 35%B 610 10.8 98 Q3
First Lease- A 733.0 733.5 744.0/718.3 731.43 2.18 715.81 8954 143 2030/680 740.0 746.0 750.0/730.0 744.93 5.72 704.60 700 12 2009/690 7.07 732.4 100/50 21/04/11 157.60 27.6 26.6 25%B 1210 56.1 13 Q1
People`s Leasing-A 127.9 129.8 131.0/127.0 129.48 1.54 127.52 364800 1601 1442/124 130.0 129.9 131.3/127.0 129.54 1.14 128.08 40800 231 1443/123 52.52 129.5 10/100 02/05/11 17.69 5.4 23.9 75%B 1210 5.4 24 Ad
Prime Finance-A 156.0 156.6 158.0/152.1 156.11 0.88 154.75 236876 1215 3524/147 156.5 158.0 160.0/153.2 157.04 1.84 154.21 51460 363 3510/149 45.06 156.3 10/50 29/03/11 21.47 10.6 14.7 80%B 1210 10.6 15 Ad
Premier Leasing-A 713.0 719.3 729.0/695.3 708.56 0.75 703.32 17200 234 1299/528 690.0 724.0 724.0/690.0 694.64 -0.72 699.67 3600 46 1280/15 14.69 706.2 100/50 26/05/11 125.84 26.3 26.9 26%B 1210 26.3 27 Ad
Islamic Finance-A 479.8 474.5 487.0/467.0 475.74 0.04 475.57 30062 330 1150/462 470.0 478.0 486.0/468.0 476.24 -0.83 480.24 2150 29 1129/462 15.33 475.8 100/50 19/05/11 134.99 18.0 26.4 16%B 1210 8.1 59 Q1
LankaBangla Fin. -A 178.1 180.7 184.8/178.1 181.29 -0.33 181.89 257774 363 570/177 180.0 181.0 185.0/178.8 180.91 0.68 179.69 60500 101 564/176 57.68 181.2 10/500 27/03/11 21.50 20.7 8.8 55%B 1210 12.3 15 Q1
B I F C -A 654.0 656.3 661.0/618.3 650.27 4.11 624.61 13800 180 1368/610 665.0 656.0 665.0/640.3 657.95 5.96 620.96 750 14 1370/570 9.47 650.7 100/50 12/05/11 137.21 37.3 17.5 25%B 1210 37.3 17 Ad
I P D C -A 416.8 423.5 430.0/413.0 422.71 2.32 413.11 18166 198 900/332 419.0 422.0 430.0/411.0 421.02 2.07 412.50 3200 49 904/38 9.03 422.5 100/50 14/06/11 229.50 15.4 27.4 10%B 1209 -21.5 -20 Q1
Union Capital -A 100.8 99.50 101.8/98.50 100.14 0.45 99.69 337420 510 270/98 99.30 101.0 103.3/99.20 100.70 0.08 100.62 30125 61 1299/10 36.82 100.2 10/500 25/04/11 12.78 7.2 14.0 75%B 1210 7.2 14 Ad
BD Finance-A 91.10 94.30 96.00/91.10 93.76 0.30 93.48 138000 539 2189/91 97.00 95.00 97.80/92.00 94.51 0.14 94.38 38300 163 2198/92 16.56 93.9 10/100 21/06/11 17.35 4.6 20.5 22%B 1210 0.2 470 Q1
Intl. Leasing-A 1360 1346 1360/1331 1347.33 0.90 1335.36 13825 2042950/1235 1400 1345 1435/1342 1420.55 5.10 1351.57 2100 8 2959/1200 21.61 1357.0 100/50 30/03/11 129.28 42.1 32.2 60%B 1210 42.1 32 Ad
Phoenix Finance-A 860.0 868.5 870.0/843.0 861.59 1.31 850.46 27950 204 2600/838 860.0 861.0 865.0/860.0 861.00 0.70 855.00 250 3 2590/855 24.30 861.6 100/50 13/06/11 226.76 33.8 25.5 35%B 1210 33.8 26 Ad
FAS Fin. & Inv. Ltd-A 520.0 515.5 526.0/505.3 514.13 0.80 510.06 7550 86 1175/429 520.0 520.0 520.0/520.0 520.00 -1.58 528.33 50 1 1250/424 3.91 514.2 100/50 16/06/11 186.27 1.1 476.1 15%B 1210 1.5 355 Q3
Delta Brac HFCL-A 1910 1942 1977/1890 1912.17 0.81 1896.76 7115 1213059/1380 1890 1890 1890/1890 1890.00 -2.33 1935.00 50 1 3070/532 13.70 1912.0 100/50 08/12/10 238.40 59.2 32.3 10%, 25%B 610 140.8 14 Q3
National Housing Fin.-A835.8 860.5 872.5/835.8 858.69 1.70 844.30 5050 87 1540/690 895.0 872.3 900.0/870.0 874.58 2.62 852.28 600 8 1500/730 4.86 860.4 100/50 22/06/11 155.71 31.2 27.6 10%,10%B 1210 31.2 28 Ad
Bay Leasing.-A 1840 1799 1840/1775 1803.13 -0.01 1803.36 19300 3023282/1391 1810 1808 1844/1800 1812.32 0.20 1808.63 1708 24 3340/1210 37.90 1803.9 100/50 15/05/10 306.33 51.2 35.2 50%B 1209 105.3 17 Q3
INVESTMENTICB -A 3741 3797 3814/3741 3783.01 3.94 3639.75 1594 335900/2787 ---- ---- ---- 3502.00 Not Traded ---- ---- 5899/850 6.03 3783.0 100/50 28/10/10 230.00 68.2 55.5 15%, 25%B 610 105.5 36 Q3
1st ICB M F -A 10675 10675 10675/10675 10675.0 1.68 10498.6 5 111050/7500 ---- ---- ---- 10300.0 Not Traded ---- ----10300/8000 0.0510675.0 100/5 12/08/10 3217.6 385.2 27.7 400% 610 577.1 18 HY
3rd ICB M F-A 2570 2570 2570/2570 2570.00 3.63 2480.00 20 22598/1580 ---- ---- ---- 2300.00 Not Traded ---- ---- 2449/1500 0.05 2570.0 100/5 12/08/10 415.05 121.4 21.2 140% 609 235.3 11 HY
5th ICB M F-A 1635 1640 1651/1630 1639.89 -4.69 1720.50 690 242200/1401 ---- ---- ---- 1815.00 Not Traded ---- ---- 1815/1450 1.13 1639.9 100/10 12/08/10 508.06 78.6 20.9 100% 609 157.4 10 HY
6th ICB M F-A 659.5 664.5 680.0/646.0 666.43 4.50 637.75 1010 57 919/550 ---- ---- ---- 647.25 Not Traded ---- ---- 969/533 0.67 666.4 100/10 12/08/10 196.03 50.0 13.3 75% 609 88.3 8 HY
8th ICB M F-A 732.8 735.8 737.8/732.8 734.91 4.77 701.45 1336 18 990/627 ---- ---- ---- 741.50 Not Traded ---- ---- 920/540 0.98 734.9 100/50 12/08/10 215.35 42.9 17.2 65% 609 98.2 7 HY
1st BSRS M F-A 1473 1460 1479/1448 1460.81 1.95 1432.82 1200 21 2379/958 ---- ---- ---- 1600.00 Not Traded ---- ---- 2600/980 1.75 1460.8 100/50 01/04/10 139.55 18.9 77.4 15% 609 277.1 5 HY
AIMS First -A 7.49 7.57 7.62/7.42 7.54 1.89 7.40 3307000 777 29/6 7.50 8.00 7.69/7.38 7.55 1.89 7.411036500 299 29/6 32.75 7.5 1/2500 09/10/07 2.25 0.3 22.8 10%1B:5 607 1.0 8 HY
ICB AMCL 1st M F-A 588.5 598.8 615.0/588.0 596.04 1.08 589.65 1950 27 849/483 ---- ---- ---- 705.00 Not Traded ---- ---- 810/550 1.16 596.0 100/50 12/08/10 170.99 38.0 15.7 50% 610 71.2 8 HY
ICB AMCL IslamicMF-A360.0380.5 391.0/341.0 380.94 9.32 348.46 20600 286 530/276 ---- ---- ---- 350.00 Not Traded ---- ---- 530/280 7.85 380.9 100/50 12/08/10 142.70 26.6 14.3 35% 610 48.4 8 HY
Grameen M F One-A 86.00 83.90 86.90/83.00 83.94 2.10 82.21 73500 99 124/62 84.00 84.00 84.50/83.00 83.46 1.16 82.50 7000 10 124/63 6.75 83.9 10/500 05/06/10 34.65 3.5 24.3 71% 609 16.2 5 HY
ICB AMCL 1st NRB -A431.0 430.8 432.8/418.0 430.98 0.53 428.71 1600 13 609/350 ---- ---- ---- 430.25 Not Traded ---- ---- 631/346 0.69 431.0 100/50 12/08/10 112.76 25.4 16.9 35% 610 53.7 8 HY
ICB AMCL 2nd NRB -A183.5183.0 184.8/181.3 182.87 1.25 180.61 13800 90 275/168 ---- ---- ---- 176.67 Not Traded ---- ---- 276/169 2.52 182.9 100/50 12/08/10 100.00 14.2 12.9 22.0% 610 40.1 5 HY
Grameen1:Scheme2 -A21.70 21.60 22.10/21.50 21.79 2.40 21.28 433000 325 35/19 21.90 22.00 22.20/21.50 21.89 2.15 21.43 80000 94 35/19 11.19 21.8 10/500 06/05/10 12.70 1.2 18.2 11.50% 609 3.1 7 HY
PrimeFin. 1st MF-A 21.60 22.00 22.30/21.00 21.76 3.18 21.09 180500 88 45/17 22.00 22.30 22.40/22.00 22.10 4.94 21.06 3000 3 45/18 3.99 21.8 10/500 04/03/10 10.00 1.4 15.5 12.5% 609 3.1 7 HY
EBL First M F-A 12.90 13.00 13.10/12.70 13.00 1.88 12.76 189500 114 22/12 13.10 13.00 13.10/12.80 13.00 1.80 12.77 26000 14 22/12 2.80 13.0 10/500 ---- 10.00 3.9 3 HY
AMCL 2nd MF-A 128.0 128.0 131.0/127.5 128.48 1.32 126.81 9700 72 185/121 129.3 129.0 131.0/127.5 129.22 0.81 128.18 1100 10 188/120 1.39 128.6 100/50 12/08/10 100.00 14% 610 25.7 5 HY
ICB Emp. PMF-A 12.60 12.80 13.00/12.50 12.74 2.74 12.40 309500 152 21/11 12.80 13.00 12.90/12.60 12.80 3.98 12.31 3000 6 21/11 3.98 12.7 10/500 12/08/10 10.00 11.50% 610 2.1 6 HY
Trust Bank 1st MF-A 11.50 11.70 11.80/11.50 11.69 1.74 11.49 808500 231 19/11 11.60 12.00 11.90/11.50 11.76 1.99 11.53 101500 56 19/11 10.64 11.7 10/500 ---- 10.00 2.8 4 HY
Prime Bank 1st MF-A 9.70 9.90 10.00/9.70 9.93 2.48 9.69 76500 60 16/9 9.60 9.90 9.90/9.60 9.82 2.94 9.54 8500 10 17/10 0.84 9.9 10/500 12/08/10 10.00 10% 610
DBH 1st MF-A 12.00 11.90 12.00/11.80 11.94 1.44 11.77 865500 252 19/11 11.90 12.00 12.10/11.90 12.00 1.78 11.79 215500 70 19/11 12.92 12.0 10/500 19/08/10 10.00 7% 610 4.0 3 Q3
IFIC 1st MF-A 11.10 11.30 11.40/11.10 11.24 1.63 11.06 436500 105 17/10 11.30 11.00 11.40/11.10 11.30 2.54 11.02 17000 16 17/10 5.10 11.2 10/500 ---- 10.00 3.4 3 HY
Phoenix Fin. 1st MF-A 12.20 13.10 13.40/12.20 13.02 3.66 12.56 361500 187 18/11 12.80 13.00 13.00/12.80 12.85 5.59 12.17 8500 10 17/11 4.82 13.0 10/500 ---- 10.00
ICB AMCL3rd NRB MF-A9.409.70 9.90/9.40 9.77 2.52 9.53 256500 131 16/9 9.60 10.00 10.00/9.40 9.74 1.14 9.63 77500 73 16/9 3.26 9.8 10/500 ---- 10.00
1st Janata Bank MF-A 9.00 8.90 9.10/8.80 9.04 2.61 8.81 632500 213 14/8 8.90 9.00 9.10/8.80 9.00 2.62 8.77 103000 68 14/8 6.64 9.0 10/500 ---- ----
Green Delta M.F.-A 8.60 8.80 8.90/8.50 8.81 3.04 8.55 308500 105 14/8 8.50 8.70 8.90/8.50 8.68 3.46 8.39 87000 59 14/8 3.47 8.8 10/500 ---- ---- 1.1 8 HY
Popular Life 1st M.F.-A 8.30 8.40 8.50/8.20 8.37 2.83 8.14 469000 180 12/8 8.30 8.00 8.50/8.20 8.35 3.21 8.09 53000 31 12/8 4.37 8.4 10/500 ---- ----
IFIL Islamic M.F.1-A 8.00 8.10 8.20/7.80 8.03 2.69 7.82 221000 109 12/7 7.90 8.00 8.10/7.80 7.99 3.50 7.72 108500 59 12/8 2.64 8.0 10/500 ---- ----
PHP 1st M. F.-A 8.40 8.40 8.60/8.20 8.39 2.32 8.20 604500 285 12/8 8.20 8.00 8.40/8.10 8.29 2.85 8.06 306000 163 12/8 7.61 8.4 10/500 ---- ----
AIBL 1st Is. M. F.-A 8.90 8.50 8.90/8.40 8.54 0.00 8.54 18500 19 20/8 8.70 9.00 8.80/8.70 8.72 0.23 8.70 3000 2 17/9 0.18 8.6 10/500 ---- ----
ENGINEERINGAftab Auto.-A 269.0 266.5 269.0/261.9 265.92 1.26 262.61 216775 1711 3031/161 266.9 266.0 269.0/261.0 265.60 0.41 264.52 97385 830 3010/167 83.51 265.8 10/50 22/12/10 55.51 15.1 17.6 10%, 30%B 810 6.8 39 Q1
Aziz PipesZ 390.3 397.0 405.0/380.0 387.39 -1.55 393.49 1435 111 789/312 ---- ---- ---- 542.01 Not Traded ---- ---- 830/325 0.56 387.4 100/5 29/06/11 -383.5 7.2 54.0 No Div. 1210 7.9 49 Q1
Olympic Ind. -A 2099 2083 2110/2046 2075.45 -0.87 2093.74 17360 270 4600/1110 2050 2060 2110/2050 2085.27 1.23 2060.00 550 9 4595/1133 37.18 2075.8 100/50 30/12/10 144.42 54.9 37.8 10%, 50%B 610 74.5 28 Q3
Bangladesh Lamps -A 2000 2009 2030/1940 1996.53 2.24 1952.76 1480 1623134/1714 ---- ---- ---- 2200.00 Not Traded ---- ---- 2850/2000 2.95 1996.5 100/5 11/05/11 1519.8 85.7 23.3 35% 1210 85.7 23 Ad
Eastern Cables-B 710.0 719.0 727.5/705.0 716.72 1.69 704.82 2210 95 848/510 710.0 704.0 710.0/703.0 704.17 0.58 700.09 120 2 860/400 1.67 716.1 100/10 26/06/10 156.76 0.8 918.0 5% 1209 18.8 38 Q3
Monno Jutex -A 2610 2607 2650/2522 2607.45 1.69 2564.22 100 154600/2014 ---- ---- ---- ---- Not Listed ---- ---- -------- 0.26 2607.5 100/5 30/12/10 1613.3 7.5 347.7 20%B 610 19.8 131 Q3
Monno Stafllers -A 2625 2558 2650/2521 2583.61 -1.37 2619.43 180 28 4250/896 ---- ---- ---- ---- Not Listed ---- ---- -------- 0.47 2583.6 100/5 27/06/11 411.50 39.1 66.1 15% 1210 39.1 66 Ad
Singer BD -A 3275 3289 3300/3249 3282.03 0.63 3261.40 1290 1828423/3100 3310 3336 3350/3299 3330.13 3.08 3230.61 245 42 9000/700 5.05 3289.7 100/5 27/04/11 799.77 87.3 37.7600%, 75%B 1210 156.6 21 Q1
Atlas BD-A 335.0 340.5 344.9/326.2 335.43 1.26 331.24 20480 203 720/252 ---- ---- ---- ---- Not Listed ---- ---- -------- 6.87 335.4 10/50 18/12/10 39.28 16.2 20.7 100%, 1B:3 610 9.9 34 Q3
BD. Autocars -B 523.0 524.8 536.0/505.3 525.09 1.02 519.77 1805 114 800/260 ---- ---- ---- 21.00 Not Traded ---- ---- 0/0 0.95 525.1 100/5 19/12/10 57.62 5.4 97.8 5%B 610 4.9 108 HY
Quasem Drycells -A 98.80 97.70 99.60/96.00 98.02 1.56 96.51 128700 202 198/58 97.00 97.00 99.90/96.60 98.10 4.32 94.04 3500 7 199/52 12.96 98.0 10/500 15/12/10 22.53 1.7 56.3 20%B 610 2.4 41 Q3
Renwick Jajneswar-Z 971.0 971.0 971.0/971.0 971.00 0.77 963.61 5 1 1470/545 ---- ---- ---- ---- Not Listed ---- ---- -------- 0.00 971.0 100/5 05/12/09 -273.6 35.6 27.3 10% 609 17.7 55 Q3
National Tubes -A 1048 1026 1048/1007 1025.08 1.38 1011.11 1275 83 2100/830 ---- ---- ---- ---- Not Listed ---- ---- -------- 1.31 1025.1 100/10 11/12/10 297.85 35.7 28.7 25% 610 1.4 759 Q3
BD. Thai Alum -A 805.5 809.0 826.0/803.0 814.66 0.43 811.14 29529 1035 1540/592 829.0 813.3 840.0/809.0 818.04 -0.18 819.49 2090 73 1540/400 25.77 814.9 100/10 04/06/11 531.00 24.5 33.2 25%B 1210 24.5 33 Ad
Kay & Que (BD) -B 420.0 404.8 421.0/391.0 405.74 5.70 383.87 4552 76 619/259 406.0 404.0 415.0/400.0 409.13 -2.47 419.50 400 8 640/269 2.01 406.0 100/50 23/06/11 105.22 4.5 89.6 5%B 1210 4.5 90 Ad
Rangpur Foundry -A 97.00 94.70 99.00/93.10 95.11 -0.03 95.14 41002 70 173/74 92.90 94.00 96.00/92.90 93.77 1.23 92.63 3000 6 167/71 4.18 95.0 10/500 23/06/11 17.39 2.2 42.6 21% 1210 2.8 34 Q1
S. Alam CR Steel -A 624.0 613.0 624.0/605.5 613.16 0.75 608.59 43714 488 999/357 609.0 613.0 620.0/607.0 614.52 1.55 605.13 6185 91 999/363 30.60 613.3 100/50 30/03/11 201.36 16.3 37.6 5%, 10%B 910 22.2 28 HY
Golden Son -A 75.00 75.30 76.00/73.00 74.98 1.65 73.76 540000 622 135/58 73.10 75.00 76.40/73.00 74.83 1.67 73.60 42000 66 138/58 43.63 75.0 10/500 16/06/11 29.62 3.5 21.2 5%,10%B 1210 3.5 21 Ad
BSRM Steels-A 1360 1352 1369/1317 1347.73 0.71 1338.26 59432 801 2600/1153 1350 1352 1366/1330 1352.05 1.02 1338.34 6300 96 2590/1173 88.62 1348.1 100/50 31/05/11 65.59 48.2 28.0 20%B 1210
Navana CNG-A 157.9 157.3 158.5/154.7 157.15 1.60 154.68 67940 357 270/123 155.5 157.0 158.5/154.1 156.69 0.81 155.43 19900 101 330/125 13.79 157.1 10/100 22/07/10 20.24 6.7 23.5 10%, 20%B 310 7.8 20 Q3
Deshbandhu Polymer-N79.90 78.10 80.60/76.00 78.93 -0.43 79.27 251500 326 96/46 78.00 79.00 81.00/77.70 79.49 0.63 78.99 56500 94 96/12 24.34 79.0 10/500 ---- 13.63 3.5 22.8 5.0 16 HY
National Polymer -A 869.0 864.8 879.0/850.0 866.36 1.14 856.61 1990 97 1198/516 841.0 840.0 841.0/840.0 840.13 -1.16 850.00 80 5 1167/520 1.79 865.4 100/10 11/11/10 411.86 24.0 36.1 18% 610 26.2 33 Q3
FOOD & ALLIEDApex Foods -A 1045 1014 1048/1000 1018.32 0.59 1012.33 2835 264 1550/662 ---- ---- ---- 1015.68 Not Traded ---- ---- 1530/711 2.89 1018.3 100/5 25/09/10 704.00 15.0 67.8 12% 610 23.8 43 HY
Bangas -A 1930 2011 2034/1929 1992.61 0.72 1978.39 225 26 3450/850 ---- ---- ---- 2134.50 Not Traded ---- ---- 3625/950 0.45 1992.6 100/5 19/12/10 134.45 14.6 136.4 25%B 610 16.2 123 HY
BATBCL -A 597.0 596.7 600.0/588.0 592.90 -0.10 593.52 9600 94 820/470 591.5 591.4 591.5/590.0 590.68 0.10 590.08 300 4 822/468 5.87 592.8 10/50 10/04/11 104.01 48.0 12.4 430% 1210 44.7 13 Q1
GeminiSeaFoodA 3450 3397 3549/3365 3446.56 -0.01 3446.88 425 68 4050/1110 ---- ---- ---- ---- Not Listed ---- ---- -------- 1.46 3446.6 100/5 11/12/10 -88.73 37.0 93.3 12% 610 149.3 23 HY
Zeal Bangla Sugar -Z 22.00 23.40 23.50/21.50 22.98 8.60 21.16 18450 55 28/14 ---- ---- ---- ---- Not Listed ---- ---- -------- 0.42 23.0 10/100 26/12/09 -110.7 -14.4 -1.6 No Div. 609 -8.4 -3 Q3
Chittagong Veg.-A 3260 3372 3372/3260 3361.97 4.03 3231.65 930 706699/1250 3354 3330 3399/3300 3348.71 2.64 3262.60 60 6 6500/1200 3.33 3361.2 100/10 27/12/10 114.28 18.1 185.9 20%B 610 87.5 38 Q3
AMCL (Pran) -A 1485 1541 1575/1485 1531.78 2.10 1500.29 1020 82 2300/1105 1560 1560 1560/1560 1560.00 5.69 1476.00 10 1 2400/1200 1.58 1532.1 100/10 23/12/10 445.10 54.5 28.1 30% 610 44.9 34 Q3
Shampur Sugar -Z 18.00 18.30 18.90/18.00 18.14 3.36 17.55 12300 88 26/13 ---- ---- ---- ---- Not Listed ---- ---- -------- 0.22 18.1 10/100 12/12/09 -251.1 No Div. 609 -22.6 -1 Q3
Rahima Food -A 528.0 516.3 528.0/498.0 510.70 1.49 503.19 8550 116 880/260 500.0 513.0 520.0/500.0 509.64 2.29 498.25 4700 71 864/267 6.76 510.3 100/50 26/12/10 47.75 8.2 62.1 10% 610 9.5 53 HY
Fu-Wang Food A 54.70 55.50 56.20/54.50 55.66 1.53 54.82 882544 1646 130/36 55.90 55.70 56.20/54.40 55.76 2.29 54.51 83700 248 129/36 53.79 55.7 10/100 04/12/10 10.89 0.6 92.8 20%B 610 3.7 15 Q3
Meghna PET Ind. -Z 19.30 20.30 20.70/19.10 19.84 -1.15 20.07 26000 36 33/14 ---- ---- ---- ---- Not Listed ---- ---- -------- 0.52 19.8 10/500 27/12/10 0.20 -1.6 -12.1 No Div. 610 0.0 -992 HY
Meghna Con. Milk -B 52.00 51.70 52.10/49.80 51.31 1.97 50.32 94000 118 97/33 ---- ---- ---- ---- Not Listed ---- ---- -------- 4.82 51.3 10/500 27/12/10 -34.71 0.6 87.0 5% 610 1.5 34 HY
Beach Hatchery -A 66.70 65.10 67.00/64.40 65.54 0.82 65.01 152000 182 126/48 65.80 65.50 67.00/65.00 65.73 -0.05 65.76 11500 18 260/50 10.72 65.6 10/500 24/05/11 13.68 2.5 25.8 15%B 1210 2.5 26 Ad
Fine Foods A 66.90 65.30 67.70/64.00 65.67 0.18 65.55 57500 97 142/44 65.00 65.00 66.90/65.00 65.38 -0.29 65.57 6625 13 138/46 4.21 65.6 10/500 05/12/10 11.41 2.5 26.4 25%B 610 2.9 23 Q3
Price Scale Turnover No.of Year Price Scale Turnover No.of Year Tover AVG FV/ Last NAV Audited Last Div. Yend Latest
Company Open Close High/Low T. Agv.Chn(%) Y.Avg Vol. Howla Hi/Lo Open Close High/Low TAvg. (%) YAvg. Vol. Howla Hi/Lo (M.Tk.) Price ML AGM PS(Tk.) EPS PER 15%B 1208 EPS PER R
TRADED ISSUESDhaka Stock Exchange Chittagong Stock Exchange Combined Other Information
Prepared exclusively for The Financial Express (FE) by Business Information Automation Service Line (BIASL), on the basis of information collected from daily stock quotations and audited reportsof the listed companies.High level of caution has been taken to collect and present the above information and data. The publisher will not take any responsibility if any body uses these information anddata for his/her investment decision. For any query please email to [email protected] or contact 01552153562[SMS ONLY] (at working days only) or go to www.biasl.net
BEXIMCO Ltd. -A 206124 54.837 9.04 9500 266.04 267.00 268.90 263.00 1.52
BEXTEX Ltd. -A 993640 50.544 8.34 9800 50.87 52.00 51.80 49.70 4.00
UNITED AIR-B 638610 29.105 4.80 10000 45.58 46.00 46.30 44.90 2.22
Aftab Auto.-A 97385 25.866 4.27 3300 265.60 266.00 269.00 261.00 1.14
Al Arafa Islami B-A 764750 25.826 4.26 15000 33.77 34.00 34.20 33.20 3.03
National Bank - A 368095 22.119 3.65 5200 60.09 60.00 65.00 58.00 1.69
AB Bank - A 15340 14.048 2.32 1290 915.80 916.00 924.00 900.25 2.81
Eastern Housing -A 14900 13.061 2.15 200 876.56 876.00 890.75 856.00 1.98
Shahjalal Islami -A 310650 11.948 1.97 5100 38.46 39.00 39.90 37.00 8.33
N C C Bank -A 334240 11.388 1.88 9500 34.07 34.00 34.60 33.50 0.00
RAK Ceramics-A 99470 11.192 1.85 1400 112.51 112.00 113.20 111.00 0.90
LankaBangla Fin. -A 60500 10.945 1.81 1000 180.91 181.00 185.00 178.80 1.69
Grameenphone-A 69000 10.702 1.77 2000 155.11 155.00 156.60 153.10 1.24
Salvo Chemicals-N 166500 10.063 1.66 1500 60.44 60.00 62.00 59.70 0.50
Maksons Spinning-A 195325 9.750 1.61 6000 49.92 49.90 50.50 49.00 2.46
BEXIMCO Ltd. -A 630719 167.974 4.40 3600 266.32 266.50 269.90 262.10 1.76
BEXTEX Ltd. -A 2821614 143.960 3.77 40000 51.02 51.50 52.00 49.90 4.04
DESCO Ltd. -A 77470 134.389 3.52 1000 1734.73 1726.25 1789.75 1718.00 -2.04
R. N. Spinning-A 1462800 126.569 3.32 20000 86.52 87.00 87.60 85.20 2.72
Titas Gas TDCLA 149800 122.737 3.22 1000 819.34 828.00 832.00 801.50 3.69
National Bank - A 1883187 113.110 2.97 21700 60.06 60.20 60.50 59.20 2.03
BSRM Steels-A 59432 80.098 2.10 450 1347.73 1351.50 1369.00 1317.00 1.52
UNITED AIR-B 1641060 74.672 1.96 14600 45.50 45.60 46.30 44.90 2.24
Malek Spinning-A 1073500 66.900 1.75 10000 62.32 62.30 63.80 60.70 2.30
Square Pharma -A 19531 65.134 1.71 156 3334.91 3342.25 3350.00 3295.00 1.06
One Bank -A 136099 64.576 1.69 2250 474.48 478.50 480.00 462.00 3.24
Grameenphone-A 382000 59.428 1.56 5000 155.57 155.20 157.00 153.00 1.44
Aftab Auto.-A 216775 57.644 1.51 1250 265.92 266.50 269.00 261.90 1.99
Shahjalal Islami -A 1470542 56.687 1.49 15000 38.55 39.10 39.80 37.20 6.25
AB Bank - A 53760 49.233 1.29 2275 915.80 917.50 929.75 900.25 2.51
Uttara Finance -A -31.25 -32.73 153.24 154.00 160.00 145.10 4,050.0 145.1 3.249Central Insur -A -8.51 -12.96 742.02 742.00 758.00 710.25 1,345.0 570.0 0.163The Ibn SinaA -5.88 -5.88 1,600.00 1,600.00 1,600.00 1,600.00 2,049.0 1,000.0 0.016Midas Financing-A -4.20 -3.21 1,089.08 1,078.00 1,135.00 1,055.00 2,389.0 1,000.0 1.443Kay & Que (BD) -B -3.81 -2.47 409.13 404.00 415.00 400.00 640.0 268.5 0.164Reliance Insur -A -2.77 -2.79 1,263.75 1,264.00 1,280.00 1,219.00 2,150.0 1,150.0 0.253Takaful Islami Insu-A -2.49 -3.15 872.67 860.00 890.00 860.00 1,505.0 535.0 0.960DESCO Ltd. -A -2.36 -3.28 1,736.85 1,738.00 1,741.00 1,731.00 3,780.0 1,333.0 1.997Delta Brac HFCL-A -2.33 -2.33 1,890.00 1,890.00 1,890.00 1,890.00 3,070.0 532.0 0.095National Polymer -A -1.18 -1.16 840.13 840.00 841.00 840.00 1,167.0 520.0 0.067
Uttara Finance -A -31.44 -33.02 153.55 156.10 163.00 148.20 4050.0 148.2 22.258Central Insur -A -9.99 -12.40 741.49 750.25 777.50 701.00 1350.0 513.8 10.919Apex SpinningA -5.66 -5.67 1668.00 1668.00 1668.00 1668.00 2247.0 665.0 0.067Savar Refractories-Z -4.84 -4.85 732.00 732.00 732.00 732.00 1425.3 411.0 0.0075th ICB M F-A -4.69 -4.69 1639.89 1639.75 1651.25 1630.00 2200.0 1401.0 1.132DESCO Ltd. -A -2.04 -2.54 1734.73 1726.25 1789.75 1718.00 3700.0 1316.0 134.389Samorita Hospital -A -1.99 -2.05 1254.30 1255.00 1265.00 1252.00 1950.0 1020.0 0.641GeminiSeaFoodA -1.92 -0.01 3446.56 3397.25 3549.00 3365.00 4050.0 1110.0 1.465Monno Stafllers -A -1.72 -1.37 2583.61 2558.00 2650.00 2521.00 4250.0 896.0 0.465Midas Financing-A -1.61 -4.84 1063.16 1099.25 1130.00 1047.50 2361.0 1011.0 30.459
Prime Insur -A 10.00 8.07 88.00 88.00 88.00 88.00 1998.0 58.0 0.022
Green Delta M.F.-A 8.75 3.46 8.68 8.70 8.90 8.50 14.0 8.3 0.755
ICB Emp. PMF-A 8.33 3.98 12.80 13.00 12.90 12.60 20.9 10.6 0.038
Phoenix Fin. 1st MF-A 8.33 5.59 12.85 13.00 13.00 12.80 17.0 10.5 0.109
Islami Ins.BD-Z 7.37 5.61 667.22 670.00 670.00 657.00 1112.5 375.0 0.867
Berger Paints-A 7.07 6.86 695.67 697.00 697.00 695.00 1125.0 525.0 0.104
Northern G Insur-A 6.40 3.46 532.28 532.00 537.00 522.00 1150.0 376.0 0.399
Continental Insur. -A 6.28 3.38 582.66 592.00 597.75 560.25 1275.0 331.0 0.700
Republic Insu.-A 6.13 3.20 630.68 641.00 645.00 610.00 1135.0 400.0 0.978
Eastern InsurA 6.05 5.62 1174.83 1175.00 1176.50 1170.00 2698.0 650.0 0.211
Grameenphone-A 210,066 9.56 155.57 0.59
ICB-A 94,575 4.31 3,783.01 3.94
Square Pharma-A 65,422 2.98 3,334.91 0.70
Titas Gas TDCL-A 61,904 2.82 819.34 2.44
National Bank-A 51,674 2.35 60.06 0.59
Islami Bank BD-A 46,828 2.13 467.92 0.45
BEXIMCO Ltd.-A 42,602 1.94 266.32 0.43
BATBCL-A 35,574 1.62 592.90 -0.10
UCBL-A 33,849 1.54 58.16 0.00
Padma Oil Co.-A 32,487 1.48 736.66 0.00
Pubali Bank-A 31,345 1.43 46.73 0.58
Prime Bank-A 30,584 1.39 39.22 -2.41
AB Bank-A 29,354 1.34 915.80 1.28
Summit Power -A 29,200 1.33 80.80 -0.22
Power Grid Co.-A 28,577 1.3 784.31 -0.27
RAK Ceramics-A 28,287 1.29 111.77 1.21
DESCO Ltd.-A 27,785 1.27 1,734.73 -2.54
Dutch Ban. Bnk- A 27,057 1.23 1,352.85 0.59
BSRM Steels-A 26,968 1.23 1,347.73 0.71
UNITED AIR-B 26,754 1.22 45.50 1.11
CompanyMkt Cap. % of T. Price Chan.
(M.Tk.) (M.Cap) (Tk.) (%)
Dhaka Stock Exchange
Grameenphone-A 209,445 10.19 155.11 0.56
ICB-A 87,550 4.26 3,502.00 0.00
Square Pharma-A 65,298 3.18 3,328.60 0.88
Titas Gas TDCL-A 61,969 3.02 820.20 2.90
National Bank-A 51,699 2.52 60.09 0.42
Islami Bank BD-A 46,749 2.27 467.13 0.84
BEXIMCO Ltd.-A 42,558 2.07 266.04 0.26
BATBCL-A 35,441 1.72 590.68 0.10
UCBL-A 33,825 1.65 58.12 0.00
Padma Oil Co.-A 32,541 1.58 737.88 0.00
Pubali Bank-A 31,432 1.53 46.86 1.10
Prime Bank-A 30,771 1.50 39.46 -1.69
AB Bank-A 29,354 1.43 915.80 1.49
Summit Power -A 29,142 1.42 80.64 -0.14
RAK Ceramics-A 28,474 1.39 112.51 0.98
Power Grid Co.-A 28,453 1.38 780.90 0.01
Dutch Ban. Bnk- A 27,877 1.36 1,393.83 3.43
DESCO Ltd.-A 27,819 1.35 1,736.85 -3.28
BSRM Steels-A 27,055 1.32 1,352.05 1.02
UNITED AIR-B 26,801 1.30 45.58 1.15
Chittagong Stock Exchange
CompanyMkt Cap. % of T. Price Chan.
(M.Tk.) (M.Cap) (Tk.) (%)
Company Price Chn. (%) Price Scale Turnover
Close Avg. Avg. Close DayHi DayLo YearHi YearLo M.Tk
Zeal Bangla Sugar -Z 9.35 8.60 22.98 23.40 23.50 21.50 27.9 13.9 0.42
Republic Insu.-A 7.37 4.09 629.02 644.50 645.00 601.50 1145.0 403.0 4.75
GlaxoSK (BD) -A 7.23 5.54 909.57 924.00 924.00 883.30 1580.0 648.0 5.28
Islami Ins.BD-Z 6.82 2.82 670.07 681.50 685.00 642.00 1180.0 354.5 5.60
B I F C -A 6.71 4.11 650.27 656.25 661.00 618.25 1368.0 610.0 8.97
Sonargaon Tex -A 6.68 3.47 613.39 626.50 630.00 595.00 1744.8 386.0 8.28
Samata LeatheR -Z 6.61 6.56 274.00 274.00 274.00 274.00 364.5 118.0 0.01
Agrani Insurance -A 6.34 4.02 652.93 662.25 667.00 633.00 1159.0 403.0 8.25
Shahjalal Islami -A 6.25 2.61 38.55 39.10 39.80 37.20 944.0 31.1 56.69
Peoples Insur -A 6.22 2.98 50.38 51.20 51.70 48.60 1210.0 46.2 7.20
Company Price Chn. (%) Price Scale Turnover
Close Avg. Avg. Close DayHi DayLo YearHi YearLo M.Tk
Capital Gainers
Capital Losers
Company Vol. Value % of Big Price Scale C. Price
Share (M.Tk.) Total Lot Avg. Close DayHi DayLo Chn%
Market Cap. Leader
Turnover Leaders
Dhaka Stock Exchange
Chittagong Stock Exchange
Chittagong Stock Exchange
Chittagong Stock Exchange
Dhaka Stock Exchange
Dhaka Stock Exchange
BEXIMCO Ltd. -A 836843 222.81 5.04 266.25 630719 167.97 4.40 206124 54.84 9.04
BEXTEX Ltd. -A 3815254 194.50 4.40 50.98 2821614 143.96 3.77 993640 50.54 8.34
DESCO Ltd. -A 78620 136.39 3.09 1734.76 77470 134.39 3.52 1150 2.00 0.33
National Bank - A 2251282 135.23 3.06 60.07 1883187 113.11 2.97 368095 22.12 3.65
R. N. Spinning-A 1550800 134.19 3.04 86.53 1462800 126.57 3.32 88000 7.63 1.26
Titas Gas TDCLA 158570 129.93 2.94 819.39 149800 122.74 3.22 8770 7.19 1.19
UNITED AIR-B 2279670 103.78 2.35 45.52 1641060 74.67 1.96 638610 29.11 4.80
BSRM Steels-A 65732 88.62 2.00 1348.14 59432 80.10 2.10 6300 8.52 1.40
Aftab Auto.-A 314160 83.51 1.89 265.82 216775 57.64 1.51 97385 25.87 4.27
Malek Spinning-A 1202500 74.93 1.69 62.31 1073500 66.90 1.75 129000 8.03 1.32
Square Pharma -A 21829 72.78 1.65 3334.25 19531 65.13 1.71 2298 7.65 1.26
Grameenphone-A 451000 70.13 1.59 155.5 382000 59.43 1.56 69000 10.70 1.77
Shahjalal Islami -A 1781192 68.64 1.55 38.53 1470542 56.69 1.49 310650 11.95 1.97
One Bank -A 143386 68.04 1.54 474.5 136099 64.58 1.69 7287 3.46 0.57
AB Bank - A 69100 63.28 1.43 915.8 53760 49.23 1.29 15340 14.05 2.32
Company Combined DSE CSE Vol. Share (M.Tk.)%of T Av.Pri V.Share (M.Tk.) %ofT V.Share M.Tk. %ofT
Combined
Turnover (Million Taka) 3,814.45 606.38 4,420.83 Turnover (Volume) 41,532,233 9,522,925 51,055,158 No. of Contract 96,372 21,778 118,150 Traded Issues 244 183 244 Issue Gain (Avg. Price Basis) 203 154 203 Issue Loss (Avg. Price Basis) 40 29 40 Unchanged Issue (Avg. Price Basis) 1 - 1
Market Cap. Equity (Billion. Tk.) 2,196.25 2,055.02 2,196.25 Market Cap. Equity (Billion US$) 32.06 30.00 32.06
Key Features - May 04, 2011Indicators DSE CSE TOTAL
Sectoral Turnover Summary
Bank 773.97 20.29 167.58 24.22 941.55 20.89
NBFI 411.56 10.79 51.90 7.50 463.46 10.28
Investment 127.03 3.33 21.22 3.07 148.25 3.29
Engineering 334.92 8.78 53.55 7.74 388.47 8.62
Food & Allied 88.39 2.32 8.64 1.25 97.04 2.15
Fuel & Power 369.25 9.68 20.94 3.03 390.18 8.66
Jute 2.80 0.07 85.52 12.36 88.32 1.96
Textile 503.37 13.20 85.52 12.36 588.89 13.07
Pharma & Chemical 263.04 6.90 28.31 4.09 291.35 6.47
Paper & Packaging 0.49 0.01 0.24 0.04 0.73 0.02
Service 34.04 0.89 16.17 2.34 50.21 1.11
Leather 26.27 0.69 0.25 0.04 26.52 0.59
Ceramic 108.34 2.84 20.66 2.99 129.00 2.86
Cement 64.56 1.69 10.99 1.59 75.55 1.68
Information Technology 11.34 0.30 4.08 0.59 15.42 0.34
General Insurance 239.68 6.28 17.18 2.48 256.86 5.70
Life Insurance 102.84 2.70 2.14 0.31 104.98 2.33
Telecom 59.43 1.56 10.70 1.55 70.13 1.56
Travel & Leisure 74.67 1.96 29.11 4.21 103.78 2.30
Miscellaneous 215.44 5.65 57.12 8.26 272.57 6.05
Debenture 3.03 0.08 0.08 0.01 3.11 0.07
Sector DSE CSE Total
Mill. (Tk) % Mill. Tk. % Mill. Tk. %
Bank 9.34 9.37 48.03 48.03NBFI 23.22 23.47 51.29 51.95Investment 39.80 37.29 35.57 35.57Engineering 27.01 27.54 50.12 47.67Food & Allied 16.44 16.03 139.65 152.92Fuel & Power 17.88 17.83 51.23 51.23Textile 19.94 19.95 31.34 31.42Pharma. & Chemical 30.25 31.13 67.66 56.18Paper & Printing 57.16 58.32 8.48 9.01Service 14.24 14.43 64.01 64.01Leather 15.52 15.38 98.36 118.93Ceramic 42.12 42.36 21.90 21.90Cement 21.58 21.52 102.49 102.49IT 27.13 27.10 12.43 12.43General Insurance 24.78 24.83 34.03 34.30Life Insurance 51.90 53.38 96.13 96.13Telecom 19.62 19.56 79.30 79.30Travel & Leisure 209.62 605.26 2.06 0.75Miscellaneous 15.05 15.19 153.70 144.78Stock Exchanges 16.31 16.13 49.92 49.62
Sector PER EPS(%)
DSE CSE DSE CSE
Sectoral PE & EPS
(Icons :Bull Means Up, Bear Means Down)
1.81%
Tk.2196.2b11.00%
Tk606.38m 15.80%
Tk3814.5m
1.54%Tk. 2055.0 b
DSE
CSE
INDEX
Turnover Market Cap.
Capital Market Highlights:May 04, 2011
DSE DSECSE CSE
CSCX
Notes: "Open" means first traded price of the day. Traded Issues means traded in both burses or either of the two."TAvg." prices indicate weighted average prices of all transactions of the day. "YDay" means price of the previous trading day. "High" and "Low" indicate the highest and lowest transacted price of the day. "Close" isthe Closing Price of the day as calculated by the stock exchanges. "Year Hi/Lo" means High and low price in the last running year. Running year moves every day. For the companies having no transaction on the day, the prices have been reported from the last transaction day. Companies which have no transaction in either of thetwo stock exchanges are not shown in the table . The companies having no transaction today have been shown as "Not Traded" and companies not listed in stock exchange are shown as "Not Listed". Category is mentioned beside company name . All EPS & NAV are diluted/restated (in applicable cases). Year end is mentionedbeside the declared dividend figure which is also applicable for Audited EPS & NAV. EPS/BV of Life Insurance was calculated by special formula which is approximate just to compair those figures among the companies under life insurance industry. These figures could not be compare with other industry’s figures. EPS & NAVare diluted at record date whenever it is applicable. Only the positive earning companies are considered in calculating the PER and EPS of the Sectors and Stock Exchanges. For latest EPS and PE corropsponding report is mentioned. Report note details are: Q1=1st Quarter, HY=Half Yearly, Q3= upto 3rd Quarter, Ad= Audited.Here all EPS are annualized and shown and used in PE calculation. For all company wise PE calculation weighted average price of the combined trasaction is used.
All Share
4966.81942(+) 1.79%
All Share
16661.94670(+) 1.58%
General
5973.09318(+) 1.83%
CSE SCX
10730.2931(+) 1.61%
DSE-20
3837.30382(+) 0.95%
CSE-30
14339.0245(+) 1.42%
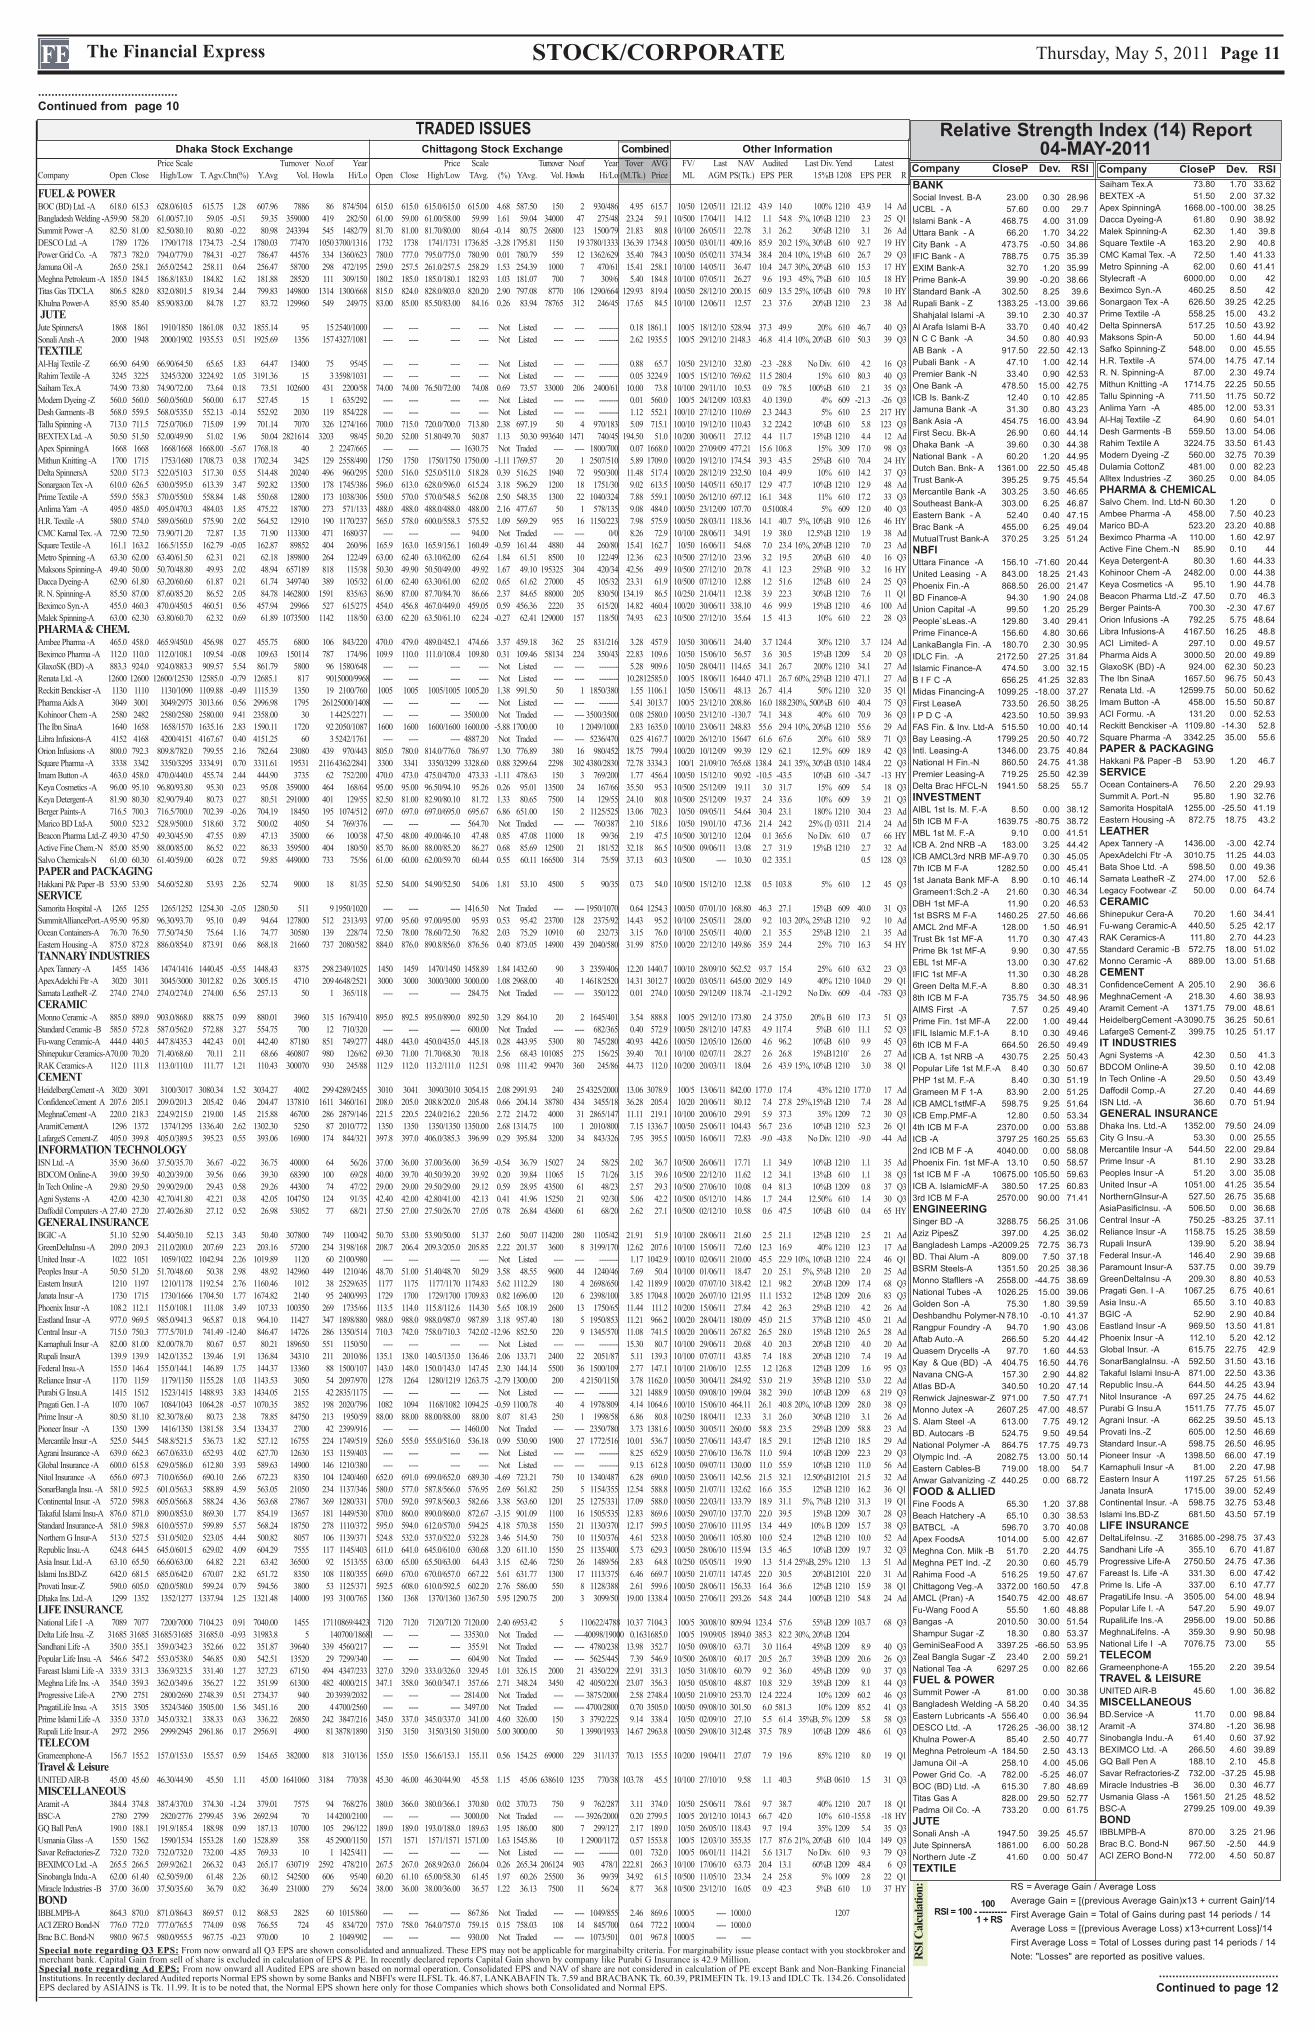
100RSI = 100 - ---------
1 + RS
STOCK/CORPORATEThe Financial Express Thursday, May 5, 2011 Page 11
..........................................Continued from page 10
FUEL & POWERBOC (BD) Ltd. -A 618.0 615.3 628.0/610.5 615.75 1.28 607.96 7886 86 874/504 615.0 615.0 615.0/615.0 615.00 4.68 587.50 150 2 930/486 4.95 615.7 10/50 12/05/11 121.12 43.9 14.0 100% 1210 43.9 14 Ad
Bangladesh Welding -A59.90 58.20 61.00/57.10 59.05 -0.51 59.35 359000 419 282/50 61.00 59.00 61.00/58.00 59.99 1.61 59.04 34000 47 275/48 23.24 59.1 10/500 17/04/11 14.12 1.1 54.8 5%, 10%B 1210 2.3 25 Q1
Summit Power -A 82.50 81.00 82.50/80.10 80.80 -0.22 80.98 243394 545 1482/79 81.70 81.00 81.70/80.00 80.64 -0.14 80.75 26800 123 1500/79 21.83 80.8 10/100 26/05/11 22.78 3.1 26.2 30%B 1210 3.1 26 Ad
DESCO Ltd. -A 1789 1726 1790/1718 1734.73 -2.54 1780.03 77470 10503700/1316 1732 1738 1741/1731 1736.85 -3.28 1795.81 1150 19 3780/1333 136.39 1734.8 100/50 03/01/11 409.16 85.9 20.2 15%, 30%B 610 92.7 19 HY
Power Grid Co. -A 787.3 782.0 794.0/779.0 784.31 -0.27 786.47 44576 334 1360/623 780.0 777.0 795.0/775.0 780.90 0.01 780.79 559 12 1362/629 35.40 784.3 100/50 05/02/11 374.34 38.4 20.4 10%, 15%B 610 26.7 29 Q3
Jamuna Oil -A 265.0 258.1 265.0/254.2 258.11 0.64 256.47 58700 298 472/195 259.0 257.5 261.0/257.5 258.29 1.53 254.39 1000 7 470/61 15.41 258.1 10/100 14/05/11 36.47 10.4 24.7 30%, 20%B 610 15.3 17 HY
Meghna Petroleum -A 185.0 184.5 186.8/183.0 184.82 1.62 181.88 28520 111 309/150 180.2 185.0 185.0/180.1 182.93 1.03 181.07 700 7 309/6 5.40 184.8 10/100 07/05/11 26.27 9.6 19.3 45%, 7%B 610 10.5 18 HY
Titas Gas TDCLA 806.5 828.0 832.0/801.5 819.34 2.44 799.83 149800 1314 1300/668 815.0 824.0 828.0/803.0 820.20 2.90 797.08 8770 106 1290/664 129.93 819.4 100/50 28/12/10 200.15 60.9 13.5 25%, 10%B 610 79.8 10 HY
Khulna Power-A 85.90 85.40 85.90/83.00 84.78 1.27 83.72 129960 549 249/75 83.00 85.00 85.50/83.00 84.16 0.26 83.94 78765 312 246/45 17.65 84.5 10/100 12/06/11 12.57 2.3 37.6 20%B 1210 2.3 38 Ad
JUTEJute SpinnersA 1868 1861 1910/1850 1861.08 0.32 1855.14 95 152540/1000 ---- ---- ---- ---- Not Listed ---- ---- -------- 0.18 1861.1 100/5 18/12/10 528.94 37.3 49.9 20% 610 46.7 40 Q3
Sonali Ansh -A 2000 1948 2000/1902 1935.53 0.51 1925.69 1356 1574327/1081 ---- ---- ---- ---- Not Listed ---- ---- -------- 2.62 1935.5 100/5 29/12/10 2148.3 46.8 41.4 10%, 20%B 610 50.3 39 Q3
TEXTILEAl-Haj Textile -Z 66.90 64.90 66.90/64.50 65.65 1.83 64.47 13400 75 95/45 ---- ---- ---- ---- Not Listed ---- ---- -------- 0.88 65.7 10/50 23/12/10 32.80 -2.3 -28.8 No Div. 610 4.2 16 Q3
Rahim Textile -A 3245 3225 3245/3200 3224.92 1.05 3191.36 15 33598/1031 ---- ---- ---- ---- Not Listed ---- ---- -------- 0.05 3224.9 100/5 15/12/10 769.62 11.5 280.4 15% 610 80.3 40 Q3
Saiham Tex.A 74.90 73.80 74.90/72.00 73.64 0.18 73.51 102600 431 2200/58 74.00 74.00 76.50/72.00 74.08 0.69 73.57 33000 206 2400/61 10.00 73.8 10/100 29/11/10 10.53 0.9 78.5 100%B 610 2.1 35 Q3
Modern Dyeing -Z 560.0 560.0 560.0/560.0 560.00 6.17 527.45 15 1 635/292 ---- ---- ---- ---- Not Listed ---- ---- -------- 0.01 560.0 100/5 24/12/09 103.83 4.0 139.0 4% 609 -21.3 -26 Q3
Desh Garments -B 568.0 559.5 568.0/535.0 552.13 -0.14 552.92 2030 119 854/228 ---- ---- ---- ---- Not Listed ---- ---- -------- 1.12 552.1 100/10 27/12/10 110.69 2.3 244.3 5% 610 2.5 217 HY
Tallu Spinning -A 713.0 711.5 725.0/706.0 715.09 1.99 701.14 7070 326 1274/166 700.0 715.0 720.0/700.0 713.80 2.38 697.19 50 4 970/183 5.09 715.1 100/10 19/12/10 110.43 3.2 224.2 10%B 610 5.8 123 Q3
BEXTEX Ltd. -A 50.50 51.50 52.00/49.90 51.02 1.96 50.04 2821614 3203 98/45 50.20 52.00 51.80/49.70 50.87 1.13 50.30 993640 1471 740/45 194.50 51.0 10/200 30/06/11 27.12 4.4 11.7 15%B 1210 4.4 12 Ad
Apex SpinningA 1668 1668 1668/1668 1668.00 -5.67 1768.18 40 2 2247/665 ---- ---- ---- 1630.75 Not Traded ---- ---- 1800/700 0.07 1668.0 100/20 27/09/09 477.21 15.6 106.8 15% 309 17.0 98 Q3
Mithun Knitting -A 1700 1715 1753/1680 1708.73 0.38 1702.34 3425 129 2558/490 1750 1750 1750/1750 1750.00 -1.11 1769.57 20 1 2507/510 5.89 1709.0 100/20 19/12/10 174.54 39.3 43.5 25%B 610 70.4 24 HY
Delta SpinnersA 520.0 517.3 522.0/510.3 517.30 0.55 514.48 20240 496 960/295 520.0 516.0 525.0/511.0 518.28 0.39 516.25 1940 72 950/300 11.48 517.4 100/20 28/12/19 232.50 10.4 49.9 10% 610 14.2 37 Q3
Sonargaon Tex -A 610.0 626.5 630.0/595.0 613.39 3.47 592.82 13500 178 1745/386 596.0 613.0 628.0/596.0 615.24 3.18 596.29 1200 18 1751/30 9.02 613.5 100/50 14/05/11 650.17 12.9 47.7 10%B 1210 12.9 48 Ad
Prime Textile -A 559.0 558.3 570.0/550.0 558.84 1.48 550.68 12800 173 1038/306 550.0 570.0 570.0/548.5 562.08 2.50 548.35 1300 22 1040/324 7.88 559.1 100/50 26/12/10 697.12 16.1 34.8 11% 610 17.2 33 Q3
Anlima Yarn -A 495.0 485.0 495.0/470.3 484.03 1.85 475.22 18700 273 571/133 488.0 488.0 488.0/488.0 488.00 2.16 477.67 50 1 578/135 9.08 484.0 100/50 23/12/09 107.70 0.51008.4 5% 609 12.0 40 Q3
H.R. Textile -A 580.0 574.0 589.0/560.0 575.90 2.02 564.52 12910 190 1170/237 565.0 578.0 600.0/558.3 575.52 1.09 569.29 955 16 1150/223 7.98 575.9 100/50 28/03/11 118.36 14.1 40.7 5%, 10%B 910 12.6 46 HY
CMC Kamal Tex. -A 72.90 72.50 73.90/71.20 72.87 1.35 71.90 113300 471 1680/37 ---- ---- ---- 94.00 Not Traded ---- ---- 0/0 8.26 72.9 10/100 28/06/11 34.91 1.9 38.0 12.5%B 1210 1.9 38 Ad
Square Textile -A 161.1 163.2 166.5/155.0 162.79 -0.05 162.87 89852 404 260/96 165.9 163.0 165.9/156.1 160.49 -0.59 161.44 4880 44 260/80 15.41 162.7 10/50 16/06/11 54.68 7.0 23.4 16%, 20%B 1210 7.0 23 Ad
Metro Spinning -A 63.30 62.00 63.40/61.50 62.31 0.21 62.18 189800 264 122/49 63.00 62.40 63.10/62.00 62.64 1.84 61.51 8500 10 122/49 12.36 62.3 10/500 27/12/10 23.96 3.2 19.5 20%B 610 4.0 16 Q3
Maksons Spinning-A 49.40 50.00 50.70/48.80 49.93 2.02 48.94 657189 818 115/38 50.30 49.90 50.50/49.00 49.92 1.67 49.10 195325 304 420/34 42.56 49.9 10/500 27/12/10 20.78 4.1 12.3 25%B 910 3.2 16 HY
Dacca Dyeing-A 62.90 61.80 63.20/60.60 61.87 0.21 61.74 349740 389 105/32 61.00 62.40 63.30/61.00 62.02 0.65 61.62 27000 45 105/32 23.31 61.9 10/500 07/12/10 12.88 1.2 51.6 12%B 610 2.4 25 Q3
R. N. Spinning-A 85.50 87.00 87.60/85.20 86.52 2.05 84.78 1462800 1591 835/63 86.90 87.00 87.70/84.70 86.66 2.37 84.65 88000 205 830/50 134.19 86.5 10/250 21/04/11 12.38 3.9 22.3 30%B 1210 7.6 11 Q1
Beximco Syn.-A 455.0 460.3 470.0/450.5 460.51 0.56 457.94 29966 527 615/275 454.0 456.8 467.0/449.0 459.05 0.59 456.36 2220 35 615/20 14.82 460.4 100/20 30/06/11 338.10 4.6 99.9 15%B 1210 4.6 100 Ad
Malek Spinning-A 63.00 62.30 63.80/60.70 62.32 0.69 61.89 1073500 1142 118/50 63.00 62.20 63.50/61.10 62.24 -0.27 62.41 129000 157 118/50 74.93 62.3 10/500 27/12/10 35.64 1.5 41.3 10% 610 2.2 28 Q3
PHARMA & CHEM.Ambee Pharma -A 465.0 458.0 465.9/450.0 456.98 0.27 455.75 6800 106 843/220 470.0 479.0 489.0/452.1 474.66 3.37 459.18 362 25 831/216 3.28 457.9 10/50 30/06/11 24.40 3.7 124.4 30% 1210 3.7 124 Ad
Beximco Pharma -A 112.0 110.0 112.0/108.1 109.54 -0.08 109.63 150114 787 174/96 109.9 110.0 111.0/108.4 109.80 0.31 109.46 58134 224 350/43 22.83 109.6 10/50 15/06/10 56.57 3.6 30.5 15%B 1209 5.4 20 Q3
GlaxoSK (BD) -A 883.3 924.0 924.0/883.3 909.57 5.54 861.79 5800 96 1580/648 ---- ---- ---- ---- Not Listed ---- ---- -------- 5.28 909.6 10/50 28/04/11 114.65 34.1 26.7 200% 1210 34.1 27 Ad
Renata Ltd. -A 12600 12600 12600/12530 12585.0 -0.79 12685.1 817 9015000/9968 ---- ---- ---- ---- Not Listed ---- ---- -------- 10.2812585.0 100/5 18/06/11 1644.0 471.1 26.7 60%, 25%B 1210 471.1 27 Ad
Reckitt Benckiser -A 1130 1110 1130/1090 1109.88 -0.49 1115.39 1350 19 2100/760 1005 1005 1005/1005 1005.20 1.38 991.50 50 1 1850/380 1.55 1106.1 10/50 15/06/11 48.13 26.7 41.4 50% 1210 32.0 35 Q1
Pharma Aids A 3049 3001 3049/2975 3013.66 0.56 2996.98 1795 26125000/1408 ---- ---- ---- ---- Not Listed ---- ---- -------- 5.41 3013.7 100/5 23/12/10 208.86 16.0 188.230%, 500%B 610 40.4 75 Q3
Kohinoor Chem -A 2580 2482 2580/2580 2580.00 9.41 2358.00 30 14425/2271 ---- ---- ---- 3500.00 Not Traded ---- ---- 3500/3500 0.08 2580.0 100/50 23/12/10 -130.7 74.1 34.8 40% 610 70.9 36 Q3
The Ibn SinaA 1640 1658 1658/1570 1635.16 2.83 1590.11 1720 922050/1087 1600 1600 1600/1600 1600.00 -5.88 1700.00 10 1 2049/1000 2.83 1635.0 100/10 23/06/11 248.83 55.6 29.4 10%, 20%B 1210 55.6 29 Ad
Libra Infusions-A 4152 4168 4200/4151 4167.67 0.40 4151.25 60 35242/1761 ---- ---- ---- 4887.20 Not Traded ---- ---- 5236/470 0.25 4167.7 100/20 26/12/10 15647 61.6 67.6 20% 610 58.9 71 Q3
Orion Infusions -A 800.0 792.3 809.8/782.0 799.55 2.16 782.64 23080 439 970/443 805.0 780.0 814.0/776.0 786.97 1.30 776.89 380 16 980/452 18.75 799.4 100/20 10/12/09 99.39 12.9 62.1 12.5% 609 18.9 42 Q3
Square Pharma -A 3338 3342 3350/3295 3334.91 0.70 3311.61 19531 21164362/2841 3300 3341 3350/3299 3328.60 0.88 3299.64 2298 302 4380/2830 72.78 3334.3 100/1 21/09/10 765.68 138.4 24.1 35%, 30%B 0310 148.4 22 Q3
Imam Button -A 463.0 458.0 470.0/440.0 455.74 2.44 444.90 3735 62 752/200 470.0 473.0 475.0/470.0 473.33 -1.11 478.63 150 3 769/200 1.77 456.4 100/50 15/12/10 90.92 -10.5 -43.5 10%B 610 -34.7 -13 HY
Keya Cosmetics -A 96.00 95.10 96.80/93.80 95.30 0.23 95.08 359000 464 168/64 95.00 95.00 96.50/94.10 95.26 0.26 95.01 13500 24 167/66 35.50 95.3 10/500 25/12/09 19.11 3.0 31.7 15% 609 5.4 18 Q3
Keya Detergent-A 81.90 80.30 82.90/79.40 80.73 0.27 80.51 291000 401 129/55 82.50 81.00 82.90/80.10 81.72 1.33 80.65 7500 14 129/55 24.10 80.8 10/500 25/12/09 19.37 2.4 33.6 10% 609 3.9 21 Q3
Berger Paints-A 716.5 700.3 716.5/700.0 702.39 -0.26 704.19 18450 195 1074/512 697.0 697.0 697.0/695.0 695.67 6.86 651.00 150 2 1125/525 13.06 702.3 10/50 09/05/11 54.64 30.4 23.1 180% 1210 30.4 23 Ad
Marico BD Ltd-A 500.0 523.2 528.9/500.0 518.60 3.72 500.02 4050 54 769/376 ---- ---- ---- 564.70 Not Traded ---- ---- 760/387 2.10 518.6 10/50 19/01/10 47.36 21.4 24.2 25% (I) 0311 21.4 24 Ad
Beacon Pharma Ltd.-Z 49.30 47.50 49.30/45.90 47.55 0.89 47.13 35000 66 100/38 47.50 48.00 49.00/46.10 47.48 0.85 47.08 11000 18 99/36 2.19 47.5 10/500 30/12/10 12.04 0.1 365.6 No Div. 610 0.7 66 HY
Active Fine Chem.-N 85.00 85.90 88.00/85.00 86.52 0.22 86.33 359500 404 180/50 85.70 86.00 88.00/85.20 86.27 0.68 85.69 12500 21 181/52 32.18 86.5 10/500 09/06/11 13.08 2.7 31.9 15%B 1210 2.7 32 Ad
Salvo Chemicals-N 61.00 60.30 61.40/59.00 60.28 0.72 59.85 449000 733 75/56 61.00 60.00 62.00/59.70 60.44 0.55 60.11 166500 314 75/59 37.13 60.3 10/500 ---- 10.30 0.2 335.1 0.5 128 Q3
PAPER and PACKAGINGHakkani P& Paper -B 53.90 53.90 54.60/52.80 53.93 2.26 52.74 9000 18 81/35 52.50 54.00 54.90/52.50 54.06 1.81 53.10 4500 5 90/35 0.73 54.0 10/500 15/12/10 12.38 0.5 103.8 5% 610 1.2 45 Q3
SERVICESamorita Hospital -A 1265 1255 1265/1252 1254.30 -2.05 1280.50 511 91950/1020 ---- ---- ---- 1416.50 Not Traded ---- ---- 1950/1070 0.64 1254.3 100/50 07/01/10 168.80 46.3 27.1 15%B 609 40.0 31 Q3
SummitAlliancePort.-A95.90 95.80 96.30/93.70 95.10 0.49 94.64 127800 512 2313/93 97.00 95.60 97.00/95.00 95.93 0.53 95.42 23700 128 2375/92 14.43 95.2 10/100 25/05/11 28.00 9.2 10.3 20%, 25%B 1210 9.2 10 Ad
Ocean Containers-A 76.70 76.50 77.50/74.50 75.64 1.16 74.77 30580 139 228/74 72.50 78.00 78.60/72.50 76.82 2.03 75.29 10910 60 232/73 3.15 76.0 10/100 25/05/11 40.00 2.1 35.5 25%B 1210 2.1 35 Ad
Eastern Housing -A 875.0 872.8 886.0/854.0 873.91 0.66 868.18 21660 737 2080/582 884.0 876.0 890.8/856.0 876.56 0.40 873.05 14900 439 2040/580 31.99 875.0 100/20 22/12/10 149.86 35.9 24.4 25% 710 16.3 54 HY
TANNARY INDUSTRIESApex Tannery -A 1455 1436 1474/1416 1440.45 -0.55 1448.43 8375 2982349/1025 1450 1459 1470/1450 1458.89 1.84 1432.60 90 3 2359/406 12.20 1440.7 100/10 28/09/10 562.52 93.7 15.4 25% 610 63.2 23 Q3
ApexAdelchi Ftr -A 3020 3011 3045/3000 3012.82 0.26 3005.15 4710 2094648/2521 3000 3000 3000/3000 3000.00 1.08 2968.00 40 1 4618/2520 14.31 3012.7 100/20 03/05/11 645.00 202.9 14.9 40% 1210 104.0 29 Q1
Samata LeatheR -Z 274.0 274.0 274.0/274.0 274.00 6.56 257.13 50 1 365/118 ---- ---- ---- 284.75 Not Traded ---- ---- 350/122 0.01 274.0 100/50 29/12/09 118.74 -2.1-129.2 No Div. 609 -0.4 -783 Q3
CERAMICMonno Ceramic -A 885.0 889.0 903.0/868.0 888.75 0.99 880.01 3960 315 1679/410 895.0 892.5 895.0/890.0 892.50 3.29 864.10 20 2 1645/401 3.54 888.8 100/5 29/12/10 173.80 2.4 375.0 20% B 610 17.3 51 Q3
Standard Ceramic -B 585.0 572.8 587.0/562.0 572.88 3.27 554.75 700 12 710/320 ---- ---- ---- 600.00 Not Traded ---- ---- 682/365 0.40 572.9 100/50 28/12/10 147.83 4.9 117.4 5%B 610 11.1 52 Q3
Fu-wang Ceramic-A 444.0 440.5 447.8/435.3 442.43 0.01 442.40 87180 851 749/277 448.0 443.0 450.0/435.0 445.18 0.28 443.95 5300 80 745/280 40.93 442.6 100/50 12/05/10 126.00 4.6 96.2 10%B 610 9.9 45 Q3
Shinepukur Ceramics-A70.00 70.20 71.40/68.60 70.11 2.11 68.66 460807 980 126/62 69.30 71.00 71.70/68.30 70.18 2.56 68.43 101085 275 156/25 39.40 70.1 10/100 02/07/11 28.27 2.6 26.8 15%B1210` 2.6 27 Ad
RAK Ceramics-A 112.0 111.8 113.0/110.0 111.77 1.21 110.43 300070 930 245/88 112.9 112.0 113.2/111.0 112.51 0.98 111.42 99470 360 245/86 44.73 112.0 10/200 20/03/11 18.04 2.6 43.9 15%, 10%B 1210 3.0 38 Q1
CEMENTHeidelbergCement -A 3020 3091 3100/3017 3080.34 1.52 3034.27 4002 2994289/2455 3010 3041 3090/3010 3054.15 2.08 2991.93 240 25 4325/2000 13.06 3078.9 100/5 13/06/11 842.00 177.0 17.4 43% 1210 177.0 17 Ad
ConfidenceCement A 207.6 205.1 209.0/201.3 205.42 0.46 204.47 137810 1611 3460/161 208.0 205.0 208.8/202.0 205.48 0.66 204.14 38780 434 3455/18 36.28 205.4 10/20 20/06/11 80.12 7.4 27.8 25%,15%B 1210 7.4 28 Ad
MeghnaCement -A 220.0 218.3 224.9/215.0 219.00 1.45 215.88 46700 286 2879/146 221.5 220.5 224.0/216.2 220.56 2.72 214.72 4000 31 2865/147 11.11 219.1 10/100 20/06/10 29.91 5.9 37.3 35% 1209 7.2 30 Q3
AramitCementA 1296 1372 1374/1295 1336.40 2.62 1302.30 5250 87 2010/772 1350 1350 1350/1350 1350.00 2.68 1314.75 100 1 2010/800 7.15 1336.7 100/50 25/06/11 104.43 56.7 23.6 10%B 1210 52.3 26 Q1
LafargeS Cement-Z 405.0 399.8 405.0/389.5 395.23 0.55 393.06 16900 174 844/321 397.8 397.0 406.0/385.3 396.99 0.29 395.84 3200 34 843/326 7.95 395.5 100/50 16/06/11 72.83 -9.0 -43.8 No Div. 1210 -9.0 -44 Ad
INFORMATION TECHNOLOGYISN Ltd. -A 35.90 36.60 37.50/35.70 36.67 -0.22 36.75 40000 64 56/26 37.00 36.00 37.00/36.00 36.59 -0.54 36.79 15027 24 58/25 2.02 36.7 10/500 26/06/11 17.71 1.1 34.9 10%B 1210 1.1 35 Ad
BDCOM Online-A 39.00 39.50 40.20/39.00 39.56 0.66 39.30 68390 100 69/28 40.00 39.70 40.50/39.20 39.92 0.20 39.84 11065 15 71/26 3.15 39.6 10/500 22/12/10 11.62 1.2 34.1 13%B 610 1.1 38 Q3
In Tech Online -A 29.80 29.50 29.90/29.00 29.43 0.58 29.26 44300 74 47/22 29.00 29.00 29.50/29.00 29.12 0.59 28.95 43500 61 48/23 2.57 29.3 10/500 27/06/10 10.08 0.4 81.3 10%B 1209 0.8 37 Q3
Agni Systems -A 42.00 42.30 42.70/41.80 42.21 0.38 42.05 104750 124 91/35 42.40 42.00 42.80/41.00 42.13 0.41 41.96 15250 21 92/30 5.06 42.2 10/500 05/12/10 14.86 1.7 24.4 12.50% 610 1.4 30 Q3
Daffodil Computers -A 27.40 27.20 27.40/26.80 27.12 0.52 26.98 53052 77 68/21 27.50 27.00 27.50/26.70 27.05 0.78 26.84 43600 61 68/20 2.62 27.1 10/500 02/12/10 10.58 0.6 47.5 10%B 610 0.4 65 HY
GENERAL INSURANCEBGIC -A 51.10 52.90 54.40/50.10 52.13 3.43 50.40 307800 749 1100/42 50.70 53.00 53.90/50.00 51.37 2.60 50.07 114200 280 1105/42 21.91 51.9 10/100 28/06/11 21.60 2.5 21.1 12%B 1210 2.5 21 Ad
GreenDeltaInsu -A 209.0 209.3 211.0/200.0 207.69 2.23 203.16 57200 234 3198/168 208.7 206.4 209.3/205.0 205.85 2.22 201.37 3600 8 3199/170 12.62 207.6 10/100 15/06/11 72.60 12.3 16.9 40% 1210 12.3 17 Ad
United Insur -A 1022 1051 1059/1022 1042.94 2.26 1019.89 1120 60 2100/980 ---- ---- ---- ---- Not Listed ---- ---- -------- 1.17 1042.9 100/10 02/06/11 210.00 45.5 22.9 10%, 10%B 1210 22.4 46 Q1
Peoples Insur -A 50.50 51.20 51.70/48.60 50.38 2.98 48.92 142960 449 1210/46 48.70 51.00 51.40/48.70 50.29 3.58 48.55 9600 44 1240/46 7.69 50.4 10/100 01/06/11 18.47 2.0 25.1 5%, 5%B 1210 2.0 25 Ad
Eastern InsurA 1210 1197 1210/1178 1192.54 2.76 1160.46 1012 38 2529/635 1177 1175 1177/1170 1174.83 5.62 1112.29 180 4 2698/650 1.42 1189.9 100/20 07/07/10 318.42 12.1 98.2 20%B 1209 17.4 68 Q3
Janata Insur -A 1730 1715 1730/1666 1704.50 1.77 1674.82 2140 95 2400/993 1729 1700 1729/1700 1709.83 0.82 1696.00 120 6 2398/100 3.85 1704.8 100/20 26/07/10 121.95 11.1 153.2 12%B 1209 20.6 83 Q3
Phoenix Insur -A 108.2 112.1 115.0/108.1 111.08 3.49 107.33 100350 269 1735/66 113.5 114.0 115.8/112.6 114.30 5.65 108.19 2600 13 1750/65 11.44 111.2 10/200 15/06/11 27.84 4.2 26.3 25%B 1210 4.2 26 Ad
Eastland Insur -A 977.0 969.5 985.0/941.3 965.87 0.18 964.10 11427 347 1898/880 988.0 988.0 988.0/987.0 987.89 3.18 957.40 180 5 1950/853 11.21 966.2 100/20 28/04/11 180.09 45.0 21.5 37%B 1210 45.0 21 Ad
Central Insur -A 715.0 750.3 777.5/701.0 741.49 -12.40 846.47 14726 286 1350/514 710.3 742.0 758.0/710.3 742.02 -12.96 852.50 220 9 1345/570 11.08 741.5 100/20 20/06/11 267.82 26.5 28.0 15%B 1210 26.5 28 Ad
Karnaphuli Insur -A 82.00 81.00 82.00/78.70 80.67 0.57 80.21 189650 551 1150/50 ---- ---- ---- ---- Not Listed ---- ---- -------- 15.30 80.7 10/100 29/06/11 20.68 4.0 20.3 20%B 1210 4.0 20 Ad
Rupali InsurA 139.9 139.9 142.0/135.2 139.46 1.91 136.84 34310 211 2010/86 135.1 138.0 140.5/135.0 136.46 2.06 133.71 2400 22 2051/87 5.11 139.3 10/100 07/07/11 43.85 7.4 18.8 20%B 1210 7.4 19 Ad
Federal Insu.-A 155.0 146.4 155.0/144.1 146.89 1.75 144.37 13360 88 1500/107 143.0 148.0 150.0/143.0 147.45 2.30 144.14 5500 36 1500/109 2.77 147.1 10/100 21/06/10 12.55 1.2 126.8 12%B 1209 1.6 95 Q3
Reliance Insur -A 1170 1159 1179/1150 1155.28 1.03 1143.53 3050 54 2097/970 1278 1264 1280/1219 1263.75 -2.79 1300.00 200 4 2150/1150 3.78 1162.0 100/50 30/04/11 284.92 53.0 21.9 35%B 1210 53.0 22 Ad
Purabi G Insu.A 1415 1512 1523/1415 1488.93 3.83 1434.05 2155 42 2835/1175 ---- ---- ---- ---- Not Listed ---- ---- -------- 3.21 1488.9 100/50 09/08/10 199.04 38.2 39.0 10%B 1209 6.8 219 Q3
Pragati Gen. I -A 1070 1067 1084/1043 1064.28 -0.57 1070.35 3852 198 2020/796 1082 1094 1168/1082 1094.25 -0.59 1100.78 40 4 1978/809 4.14 1064.6 100/10 15/06/10 464.11 26.1 40.8 20%, 10%B 1209 28.0 38 Q3
Prime Insur -A 80.50 81.10 82.30/78.60 80.73 2.38 78.85 84750 213 1950/59 88.00 88.00 88.00/88.00 88.00 8.07 81.43 250 1 1998/58 6.86 80.8 10/250 18/04/11 12.33 3.1 26.0 30%B 1210 3.1 26 Ad
Pioneer Insur -A 1350 1399 1416/1350 1381.58 3.54 1334.37 2700 42 2399/916 ---- ---- ---- 1460.00 Not Traded ---- ---- 2350/780 3.73 1381.6 100/50 30/05/11 260.00 58.8 23.5 25%B 1209 58.8 23 Ad
Mercantile Insur -A 525.0 544.5 548.8/521.5 536.73 1.82 527.12 16755 224 1749/519 526.0 555.0 555.0/516.0 536.18 0.99 530.90 1900 27 1772/516 10.01 536.7 100/50 27/06/11 143.47 18.5 29.1 12%B 1210 18.5 29 Ad
Agrani Insurance -A 639.0 662.3 667.0/633.0 652.93 4.02 627.70 12630 153 1159/403 ---- ---- ---- ---- Not Listed ---- ---- -------- 8.25 652.9 100/50 27/06/10 136.78 11.0 59.4 10%B 1209 22.3 29 Q3
Global Insurance -A 600.0 615.8 629.0/586.0 612.80 3.93 589.63 14900 146 1210/380 ---- ---- ---- ---- Not Listed ---- ---- -------- 9.13 612.8 100/50 09/07/11 130.00 11.0 55.9 10%B 1210 11.0 56 Ad
Nitol Insurance -A 656.0 697.3 710.0/656.0 690.10 2.66 672.23 8350 104 1240/460 652.0 691.0 699.0/652.0 689.30 -4.69 723.21 750 10 1340/487 6.28 690.0 100/50 23/06/11 142.56 21.5 32.1 12.50%B12101 21.5 32 Ad
SonarBangla Insu. -A 581.0 592.5 601.0/563.3 588.89 4.59 563.05 21050 234 1137/346 580.0 577.0 587.8/566.0 576.95 2.69 561.82 250 5 1154/355 12.54 588.8 100/50 21/07/11 132.62 16.6 35.5 12%B 1210 16.2 36 Q1
Continental Insur. -A 572.0 598.8 605.0/566.8 588.24 4.36 563.68 27867 369 1280/331 570.0 592.0 597.8/560.3 582.66 3.38 563.60 1201 25 1275/331 17.09 588.0 100/50 22/03/11 133.79 18.9 31.1 5%, 7%B 1210 31.3 19 Q1
Takaful Islami Insu-A 876.0 871.0 890.0/853.0 869.30 1.77 854.19 13657 181 1449/530 870.0 860.0 890.0/860.0 872.67 -3.15 901.09 1100 16 1505/535 12.83 869.6 100/50 29/07/10 137.70 22.0 39.5 15%B 1209 30.7 28 Q3
Standard Insurance-A 581.0 598.8 610.0/557.0 599.89 5.57 568.24 18750 278 1110/372 595.0 594.0 612.0/570.0 594.25 4.18 570.38 1550 21 1130/370 12.17 599.5 100/50 27/06/10 111.95 13.4 44.9 10% B 1209 15.7 38 Q3
Northern G Insur-A 513.0 527.5 531.0/502.0 523.05 4.44 500.82 8057 106 1139/371 524.8 532.0 537.0/522.0 532.28 3.46 514.50 750 10 1150/376 4.61 523.8 100/50 20/06/11 105.80 10.0 52.4 12%B 1210 10.0 52 Ad
Republic Insu.-A 624.8 644.5 645.0/601.5 629.02 4.09 604.29 7555 117 1145/403 611.0 641.0 645.0/610.0 630.68 3.20 611.10 1550 25 1135/400 5.73 629.3 100/50 28/06/10 115.94 13.5 46.5 10%B 1209 19.7 32 Q3
Asia Insur. Ltd.-A 63.10 65.50 66.60/63.00 64.82 2.21 63.42 36500 92 1513/55 63.00 65.00 65.50/63.00 64.43 3.15 62.46 7250 26 1489/56 2.83 64.8 10/250 05/05/11 19.90 1.3 51.4 25%B, 25% 1210 1.3 51 Ad
Islami Ins.BD-Z 642.0 681.5 685.0/642.0 670.07 2.82 651.72 8350 108 1180/355 669.0 670.0 670.0/657.0 667.22 5.61 631.77 1300 17 1113/375 6.46 669.7 100/50 21/07/11 147.45 22.0 30.5 20%B12101 22.0 31 Ad
Provati Insur.-Z 590.0 605.0 620.0/580.0 599.24 0.79 594.56 3800 53 1125/371 592.5 608.0 610.0/592.5 602.20 2.76 586.00 550 8 1128/388 2.61 599.6 100/50 28/06/11 156.33 16.4 36.6 12%B 1210 15.9 38 Q1
Dhaka Ins. Ltd.-A 1299 1352 1352/1277 1337.94 1.25 1321.48 14000 193 3100/765 1360 1368 1370/1360 1367.50 5.95 1290.75 200 3 3099/50 19.00 1338.4 100/50 27/06/11 293.26 54.8 24.4 100%B 1210 54.8 24 Ad
LIFE INSURANCENational Life I -A 7089 7077 7200/7000 7104.23 0.91 7040.00 1455 17110869/4423 7120 7120 7120/7120 7120.00 2.40 6953.42 5 110622/4788 10.37 7104.3 100/5 30/08/10 809.94 123.4 57.6 55%B 1209 103.7 68 Q3
Delta Life Insu. -Z 31685 31685 31685/31685 31685.0 -0.93 31983.8 5 140700/18681 ---- ---- ---- 33530.0 Not Traded ---- ----40098/19000 0.1631685.0 100/5 19/09/05 1894.0 385.3 82.2 30%, 20%B 1204
Sandhani Life -A 350.0 355.1 359.0/342.3 352.66 0.22 351.87 39640 339 4560/217 ---- ---- ---- 355.91 Not Traded ---- ---- 4780/238 13.98 352.7 10/50 09/08/10 63.71 3.0 116.4 45%B 1209 8.9 40 Q3
Popular Life Insu. -A 546.6 547.2 553.0/538.0 546.85 0.80 542.51 13520 29 7299/340 ---- ---- ---- 604.90 Not Traded ---- ---- 5625/445 7.39 546.9 10/500 26/08/10 60.17 20.5 26.7 35%B 1209 20.6 26 Q3
Fareast Islami Life -A 333.9 331.3 336.9/323.5 331.40 1.27 327.23 67150 494 4347/233 327.0 329.0 333.0/326.0 329.45 1.01 326.15 2000 21 4350/229 22.91 331.3 10/50 31/08/10 60.79 9.2 36.0 45%B 1209 9.0 37 Q3
Meghna Life Ins. -A 354.0 359.3 362.0/349.6 356.27 1.22 351.99 61300 482 4000/215 347.1 358.0 360.0/347.1 357.66 2.71 348.24 3450 42 4050/220 23.07 356.3 10/50 05/08/10 48.87 10.8 32.9 35%B 1209 8.1 44 Q3
Progressive Life-A 2790 2751 2800/2690 2748.39 0.51 2734.37 940 203939/2032 ---- ---- ---- 2814.00 Not Traded ---- ---- 3875/2000 2.58 2748.4 100/50 21/09/10 253.70 12.4 222.4 10% 1209 60.2 46 Q3
PragatiLife Insu. -A 3515 3505 3524/3460 3505.00 1.56 3451.16 200 44700/2560 ---- ---- ---- 3497.00 Not Traded ---- ---- 4700/2800 0.70 3505.0 100/50 09/08/10 301.50 6.0 581.3 10% 1209 85.2 41 Q3
Prime Islami Life -A 335.0 337.0 345.0/332.1 338.33 0.63 336.22 26850 242 3847/216 345.0 337.0 345.0/337.0 341.00 4.60 326.00 150 3 3792/225 9.14 338.4 10/50 02/09/10 27.10 5.5 61.4 35%B, 5% 1209 5.8 58 Q3
Rupali Life Insur.-A 2972 2956 2999/2945 2961.86 0.17 2956.91 4900 813878/1890 3150 3150 3150/3150 3150.00 5.00 3000.00 50 1 3990/1933 14.67 2963.8 100/50 29/08/10 312.48 37.5 78.9 10%B 1209 48.6 61 Q3
TELECOMGrameenphone-A 156.7 155.2 157.0/153.0 155.57 0.59 154.65 382000 818 310/136 155.0 155.0 156.6/153.1 155.11 0.56 154.25 69000 229 311/137 70.13 155.5 10/200 19/04/11 27.07 7.9 19.6 85% 1210 8.0 19 Q1
Travel & LeisureUNITED AIR-B 45.00 45.60 46.30/44.90 45.50 1.11 45.00 1641060 3184 770/38 45.30 46.00 46.30/44.90 45.58 1.15 45.06 638610 1235 770/38 103.78 45.5 10/100 27/10/10 9.58 1.1 40.3 5%B 0610 1.5 31 Q3
MISCELLANEOUSAramit -A 384.4 374.8 387.4/370.0 374.30 -1.24 379.01 7575 94 768/276 380.0 366.0 380.0/366.1 370.80 0.02 370.73 750 9 762/287 3.11 374.0 10/50 25/06/11 78.61 9.7 38.7 40% 1210 20.7 18 Q1
BSC-A 2780 2799 2820/2776 2799.45 3.96 2692.94 70 144200/2100 ---- ---- ---- 3000.00 Not Traded ---- ---- 3926/2000 0.20 2799.5 100/5 20/12/10 1014.3 66.7 42.0 10% 610 -155.8 -18 HY
GQ Ball PenA 190.0 188.1 191.9/185.4 188.98 0.99 187.13 10700 105 296/122 189.0 189.0 193.0/188.0 189.63 1.95 186.00 800 7 299/127 2.17 189.0 10/50 26/05/10 118.43 9.7 19.4 35% 1209 5.4 35 Q3
Usmania Glass -A 1550 1562 1590/1534 1553.28 1.60 1528.89 358 45 2900/1150 1571 1571 1571/1571 1571.00 1.63 1545.86 10 1 2900/1172 0.57 1553.8 100/5 12/03/10 355.35 17.7 87.6 21%, 20%B 610 10.4 149 Q3
Savar Refractories-Z 732.0 732.0 732.0/732.0 732.00 -4.85 769.33 10 1 1425/411 ---- ---- ---- ---- Not Listed ---- ---- -------- 0.01 732.0 100/5 06/01/11 114.21 5.6 131.7 No Div. 610 9.3 79 Q3
BEXIMCO Ltd. -A 265.5 266.5 269.9/262.1 266.32 0.43 265.17 630719 2592 478/210 267.5 267.0 268.9/263.0 266.04 0.26 265.34 206124 903 478/1 222.81 266.3 10/100 17/06/10 63.73 20.4 13.1 60%B 1209 48.4 6 Q3
Sinobangla Indu.-A 62.00 61.40 62.50/59.00 61.48 2.26 60.12 542500 606 95/40 60.20 61.10 65.00/58.30 61.45 1.97 60.26 25500 36 99/39 34.92 61.5 10/500 11/05/10 23.34 2.4 25.8 5% 1009 2.8 22 Q1
Miracle Industries -B 37.00 36.00 37.50/35.60 36.79 0.82 36.49 231000 279 56/24 38.00 36.00 38.00/36.00 36.57 1.22 36.13 7500 11 56/24 8.77 36.8 10/500 23/12/10 16.05 0.9 42.3 5%B 610 1.0 37 HY
BONDIBBLMPB-A 864.3 870.0 871.0/864.3 869.57 0.12 868.53 2825 60 1015/860 ---- ---- ---- 867.86 Not Traded ---- ---- 1049/855 2.46 869.6 1000/5 ---- 1000.0 1207
ACI ZERO Bond-N 776.0 772.0 777.0/765.5 774.09 0.98 766.55 724 45 834/720 757.0 758.0 764.0/757.0 759.15 0.15 758.03 108 14 845/700 0.64 772.2 1000/4 ---- 1000.0
Brac B.C. Bond-N 980.0 967.5 980.0/955.5 967.75 -0.23 970.00 10 2 1049/902 ---- ---- ---- 930.00 Not Traded ---- ---- 1073/501 0.01 967.8 1000/5 ---- ----
Price Scale Turnover No.of Year Price Scale Turnover No.of Year Tover AVG FV/ Last NAV Audited Last Div. Yend Latest
Company Open Close High/Low T. Agv.Chn(%) Y.Avg Vol. Howla Hi/Lo Open Close High/Low TAvg. (%) YAvg. Vol. Howla Hi/Lo (M.Tk.) Price ML AGM PS(Tk.) EPS PER 15%B 1208 EPS PER R
TRADED ISSUESDhaka Stock Exchange Chittagong Stock Exchange Combined Other Information
Relative Strength Index (14) Report 04-MAY-2011
BANKSocial Invest. B-A 23.00 0.30 28.96
UCBL - A 57.60 0.00 29.7
Islami Bank - A 468.75 4.00 31.09
Uttara Bank - A 66.20 1.70 34.22
City Bank - A 473.75 -0.50 34.86
IFIC Bank - A 788.75 0.75 35.39
EXIM Bank-A 32.70 1.20 35.99
Prime Bank-A 39.90 -0.20 38.66
Standard Bank -A 302.50 8.25 39.6
Rupali Bank - Z 1383.25 -13.00 39.66
Shahjalal Islami -A 39.10 2.30 40.37
Al Arafa Islami B-A 33.70 0.40 40.42
N C C Bank -A 34.50 0.80 40.93
AB Bank - A 917.50 22.50 42.13
Pubali Bank - A 47.10 1.00 42.14
Premier Bank -N 33.40 0.90 42.53
One Bank -A 478.50 15.00 42.75
ICB Is. Bank-Z 12.40 0.10 42.85
Jamuna Bank -A 31.30 0.80 43.23
Bank Asia -A 454.75 16.00 43.94
First Secu. Bk-A 26.90 0.60 44.14
Dhaka Bank -A 39.60 0.30 44.38
National Bank - A 60.20 1.20 44.95
Dutch Ban. Bnk- A 1361.00 22.50 45.48
Trust Bank-A 395.25 9.75 45.54
Mercantile Bank -A 303.25 3.50 46.65
Southeast Bank-A 303.00 6.25 46.87
Eastern Bank - A 52.40 0.40 47.15
Brac Bank -A 455.00 6.25 49.04
MutualTrust Bank-A 370.25 3.25 51.24
NBFIUttara Finance -A 156.10 -71.60 20.44
United Leasing - A 843.00 18.25 21.43
Phoenix Fin.-A 868.50 26.00 21.47
BD Finance-A 94.30 1.90 24.08
Union Capital -A 99.50 1.20 25.29
People`sLeas.-A 129.80 3.40 29.41
Prime Finance-A 156.60 4.80 30.66
LankaBangla Fin. -A 180.70 2.30 30.95
IDLC Fin. -A 2172.50 27.25 31.84
Islamic Finance-A 474.50 3.00 32.15
B I F C -A 656.25 41.25 32.83
Midas Financing-A 1099.25 -18.00 37.27
First LeaseA 733.50 26.50 38.25
I P D C -A 423.50 10.50 39.93
FAS Fin. & Inv. Ltd-A 515.50 10.00 40.14
Bay Leasing.-A 1799.25 20.50 40.72
Intl. Leasing-A 1346.00 23.75 40.84
National H Fin.-N 860.50 24.75 41.38
Premier Leasing-A 719.25 25.50 42.39
Delta Brac HFCL-N 1941.50 58.25 55.7
INVESTMENTAIBL 1st Is. M. F.-A 8.50 0.00 38.12
5th ICB M F-A 1639.75 -80.75 38.72
MBL 1st M. F.-A 9.10 0.00 41.51
ICB A. 2nd NRB -A 183.00 3.25 44.42
ICB AMCL3rd NRB MF-A9.70 0.30 45.05
7th ICB M F-A 1282.50 0.00 45.41
1st Janata Bank MF-A 8.90 0.10 46.14
Grameen1:Sch.2 -A 21.60 0.30 46.34
DBH 1st MF-A 11.90 0.20 46.53
1st BSRS M F-A 1460.25 27.50 46.66
AMCL 2nd MF-A 128.00 1.50 46.91
Trust Bk 1st MF-A 11.70 0.30 47.43
Prime Bk 1st MF-A 9.90 0.30 47.55
EBL 1st MF-A 13.00 0.30 47.62
IFIC 1st MF-A 11.30 0.30 48.28
Green Delta M.F.-A 8.80 0.30 48.31
8th ICB M F-A 735.75 34.50 48.96
AIMS First -A 7.57 0.25 49.40
Prime Fin. 1st MF-A 22.00 1.00 49.44
IFIL Islamic M.F.1-A 8.10 0.30 49.46
6th ICB M F-A 664.50 26.50 49.49
ICB A. 1st NRB -A 430.75 2.25 50.43
Popular Life 1st M.F.-A 8.40 0.30 50.67
PHP 1st M. F.-A 8.40 0.30 51.19
Grameen M F 1-A 83.90 2.00 51.25
ICB AMCL1stMF-A 598.75 9.25 51.64
ICB Emp.PMF-A 12.80 0.50 53.34
4th ICB M F-A 2370.00 0.00 53.88
ICB -A 3797.25 160.25 55.63
2nd ICB M F -A 4040.00 0.00 58.08
Phoenix Fin. 1st MF-A 13.10 0.50 58.57
1st ICB M F -A 10675.00 105.50 59.63
ICB A. IslamicMF-A 380.50 17.25 60.83
3rd ICB M F-A 2570.00 90.00 71.41
ENGINEERINGSinger BD -A 3288.75 56.25 31.06
Aziz PipesZ 397.00 4.25 36.02
Bangladesh Lamps -A2009.25 72.75 36.73
BD. Thai Alum -A 809.00 7.50 37.18
BSRM Steels-A 1351.50 20.25 38.36
Monno Stafllers -A 2558.00 -44.75 38.69
National Tubes -A 1026.25 15.00 39.06
Golden Son -A 75.30 1.80 39.59
Deshbandhu Polymer-N 78.10 -0.10 41.37
Rangpur Foundry -A 94.70 1.90 43.06
Aftab Auto.-A 266.50 5.20 44.42
Quasem Drycells -A 97.70 1.60 44.53
Kay & Que (BD) -A 404.75 16.50 44.76
Navana CNG-A 157.30 2.90 44.82
Atlas BD-A 340.50 10.20 47.14
Renwick Jajneswar-Z 971.00 7.50 47.71
Monno Jutex -A 2607.25 47.00 48.57
S. Alam Steel -A 613.00 7.75 49.12
BD. Autocars -B 524.75 9.50 49.54
National Polymer -A 864.75 17.75 49.73
Olympic Ind. -A 2082.75 13.00 50.14
Eastern Cables-B 719.00 18.00 54.7
Anwar Galvanizing -Z 440.25 0.00 68.72
FOOD & ALLIEDFine Foods A 65.30 1.20 37.88
Beach Hatchery -A 65.10 0.30 38.53
BATBCL -A 596.70 3.70 40.08
Apex FoodsA 1014.00 5.00 42.67
Meghna Con. Milk -B 51.70 2.20 44.75
Meghna PET Ind. -Z 20.30 0.60 45.79
Rahima Food -A 516.25 19.50 47.67
Chittagong Veg.-A 3372.00 160.50 47.8
AMCL (Pran) -A 1540.75 42.00 48.67
Fu-Wang Food A 55.50 1.60 48.88
Bangas -A 2010.50 30.00 51.54
Shampur Sugar -Z 18.30 0.80 53.37
GeminiSeaFood A 3397.25 -66.50 53.95
Zeal Bangla Sugar -Z 23.40 2.00 59.21
National Tea -A 6297.25 0.00 82.66
FUEL & POWERSummit Power -A 81.00 0.00 30.38
Bangladesh Welding -A 58.20 0.40 34.35
Eastern Lubricants -A 556.40 0.00 36.94
DESCO Ltd. -A 1726.25 -36.00 38.12
Khulna Power-A 85.40 2.50 40.77
Meghna Petroleum -A 184.50 2.50 43.13
Jamuna Oil -A 258.10 4.00 45.06
Power Grid Co. -A 782.00 -5.25 46.07
BOC (BD) Ltd. -A 615.30 7.80 48.69
Titas Gas A 828.00 29.50 52.77
Padma Oil Co. -A 733.20 0.00 61.75
JUTESonali Ansh -A 1947.50 39.25 45.57
Jute SpinnersA 1861.00 6.00 50.28
Northern Jute -Z 41.60 0.00 50.47
TEXTILE
Saiham Tex.A 73.80 1.70 33.62
BEXTEX -A 51.50 2.00 37.32
Apex SpinningA 1668.00 -100.00 38.25
Dacca Dyeing-A 61.80 0.90 38.92
Malek Spinning-A 62.30 1.40 39.8
Square Textile -A 163.20 2.90 40.8
CMC Kamal Tex. -A 72.50 1.40 41.33
Metro Spinning -A 62.00 0.60 41.41
Stylecraft -A 6000.00 0.00 42
Beximco Syn.-A 460.25 8.50 42
Sonargaon Tex -A 626.50 39.25 42.25
Prime Textile -A 558.25 15.00 43.2
Delta SpinnersA 517.25 10.50 43.92
Maksons Spin-A 50.00 1.60 44.94
Safko Spinning-Z 548.00 0.00 45.55
H.R. Textile -A 574.00 14.75 47.14
R. N. Spinning-A 87.00 2.30 49.74
Mithun Knitting -A 1714.75 22.25 50.55
Tallu Spinning -A 711.50 11.75 50.72
Anlima Yarn -A 485.00 12.00 53.31
Al-Haj Textile -Z 64.90 0.60 54.01
Desh Garments -B 559.50 13.00 54.06
Rahim Textile A 3224.75 33.50 61.43
Modern Dyeing -Z 560.00 32.75 70.39
Dulamia CottonZ 481.00 0.00 82.23
Alltex Industries -Z 360.25 0.00 84.05
PHARMA & CHEMICALSalvo Chem. Ind. Ltd-N 60.30 1.20 0
Ambee Pharma -A 458.00 7.50 40.23
Marico BD-A 523.20 23.20 40.88
Beximco Pharma -A 110.00 1.60 42.97
Active Fine Chem.-N 85.90 0.10 44
Keya Detergent-A 80.30 1.60 44.33
Kohinoor Chem -A 2482.00 0.00 44.38
Keya Cosmetics -A 95.10 1.90 44.78
Beacon Pharma Ltd.-Z 47.50 0.70 46.3
Berger Paints-A 700.30 -2.30 47.67
Orion Infusions -A 792.25 5.75 48.64
Libra Infusions-A 4167.50 16.25 48.8
ACI Limited- A 297.10 0.00 49.57
Pharma Aids A 3000.50 20.00 49.89
GlaxoSK (BD) -A 924.00 62.30 50.23
The Ibn SinaA 1657.50 96.75 50.43
Renata Ltd. -A 12599.75 50.00 50.62
Imam Button -A 458.00 15.50 50.87
ACI Formu. -A 131.20 0.00 52.53
Reckitt Benckiser -A 1109.80 -14.30 52.8
Square Pharma -A 3342.25 35.00 55.6
PAPER & PACKAGINGHakkani P& Paper -B 53.90 1.20 46.7
SERVICEOcean Containers-A 76.50 2.20 29.93
Summit A. Port.-N 95.80 1.90 32.76
Samorita HospitalA 1255.00 -25.50 41.19
Eastern Housing -A 872.75 18.75 43.2
LEATHERApex Tannery -A 1436.00 -3.00 42.74
ApexAdelchi Ftr -A 3010.75 11.25 44.03
Bata Shoe Ltd. -A 598.50 0.00 49.36
Samata LeatheR -Z 274.00 17.00 52.6
Legacy Footwear -Z 50.00 0.00 64.74
CERAMICShinepukur Cera-A 70.20 1.60 34.41
Fu-wang Ceramic-A 440.50 5.25 42.17
RAK Ceramics-A 111.80 2.70 44.23
Standard Ceramic -B 572.75 18.00 51.02
Monno Ceramic -A 889.00 13.00 51.68
CEMENTConfidenceCement A 205.10 2.90 36.6
MeghnaCement -A 218.30 4.60 38.93
Aramit Cement -A 1371.75 79.00 48.61
HeidelbergCement -A3090.75 36.25 50.61
LafargeS Cement-Z 399.75 10.25 51.17
IT INDUSTRIESAgni Systems -A 42.30 0.50 41.3
BDCOM Online-A 39.50 0.10 42.08
In Tech Online -A 29.50 0.50 43.49
Daffodil Comp.-A 27.20 0.40 44.69
ISN Ltd. -A 36.60 0.70 51.94
GENERAL INSURANCEDhaka Ins. Ltd.-A 1352.00 79.50 24.09
City G Insu.-A 53.30 0.00 25.55
Mercantile Insur -A 544.50 22.00 29.84
Prime Insur -A 81.10 2.90 33.28
Peoples Insur -A 51.20 3.00 35.08
United Insur -A 1051.00 41.25 35.54
NorthernGInsur-A 527.50 26.75 35.68
AsiaPasificInsu. -A 506.50 0.00 36.68
Central Insur -A 750.25 -83.25 37.11
Reliance Insur -A 1158.75 15.25 38.59
Rupali InsurA 139.90 5.20 38.94
Federal Insur.-A 146.40 2.90 39.68
Paramount Insur-A 537.75 0.00 39.79
GreenDeltaInsu -A 209.30 8.80 40.53
Pragati Gen. I -A 1067.25 6.75 40.61
Asia Insu.-A 65.50 3.10 40.83
BGIC -A 52.90 2.90 40.84
Eastland Insur -A 969.50 13.50 41.81
Phoenix Insur -A 112.10 5.20 42.12
Global Insur. -A 615.75 22.75 42.9
SonarBanglaInsu. -A 592.50 31.50 43.16
Takaful Islami Insu-A 871.00 22.50 43.36
Republic Insu.-A 644.50 44.25 43.94
Nitol Insurance -A 697.25 24.75 44.62
Purabi G Insu.A 1511.75 77.75 45.07
Agrani Insur. -A 662.25 39.50 45.13
Provati Ins.-Z 605.00 12.50 46.69
Standard Insur.-A 598.75 26.50 46.95
Pioneer Insur -A 1398.50 66.00 47.19
Karnaphuli Insur -A 81.00 2.20 47.98
Eastern Insur A 1197.25 57.25 51.56
Janata InsurA 1715.00 39.00 52.49
Continental Insur. -A 598.75 32.75 53.48
Islami Ins.BD-Z 681.50 43.50 57.19
LIFE INSURANCEDeltaLifeInsu. -Z 31685.00 -298.75 37.43
Sandhani Life -A 355.10 6.70 41.87
Progressive Life-A 2750.50 24.75 47.36
Fareast Is. Life -A 331.30 6.00 47.42
Prime Is. Life -A 337.00 6.10 47.77
PragatiLife Insu. -A 3505.00 54.00 48.94
Popular Life I. -A 547.20 5.90 49.07
RupaliLife Ins.-A 2956.00 19.00 50.86
MeghnaLifeIns. -A 359.30 9.90 50.98
National Life I -A 7076.75 73.00 55
TELECOMGrameenphone-A 155.20 2.20 39.54
TRAVEL & LEISUREUNITED AIR-B 45.60 1.00 36.82
MISCELLANEOUSBD.Service -A 11.70 0.00 98.84
Aramit -A 374.80 -1.20 36.98
Sinobangla Indu.-A 61.40 0.60 37.92
BEXIMCO Ltd. -A 266.50 4.60 39.89
GQ Ball Pen A 188.10 2.10 45.8
Savar Refractories-Z 732.00 -37.25 45.98
Miracle Industries -B 36.00 0.30 46.77
Usmania Glass -A 1561.50 21.25 48.52
BSC-A 2799.25 109.00 49.39
BONDIBBLMPB-A 870.00 3.25 21.96
Brac B.C. Bond-N 967.50 -2.50 44.9
ACI ZERO Bond-N 772.00 4.50 50.87
Company CloseP Dev. RSI Company CloseP Dev. RSI
....................................Continued to page 12
Special note regarding Q3 EPS:Special note regarding Q3 EPS: From now onward all Q3 EPS are shown consolidated and annualized. These EPS may not be applicable for marginabilty criteria. For marginability issue please contact with you stockbroker andmerchant bank. Capital Gain from sell of share is excluded in calculation of EPS & PE. In recently declared reports Capital Gain shown by company like Purabi G Insurance is 42.9 Million.Special note regarding Ad EPS:Special note regarding Ad EPS: From now onward all Audited EPS are shown based on normal operation. Consolidated EPS and NAV of share are not considered in calculation of PE except Bank and Non-Banking FinancialInstitutions. In recently declared Audited reports Normal EPS shown by some Banks and NBFI's were ILFSL Tk. 46.87, LANKABAFIN Tk. 7.59 and BRACBANK Tk. 60.39, PRIMEFIN Tk. 19.13 and IDLC Tk. 134.26. ConsolidatedEPS declared by ASIAINS is Tk. 11.99. It is to be noted that, the Normal EPS shown here only for those Companies which shows both Consolidated and Normal EPS.
RS
I C
alcu
lati
on: RS = Average Gain / Average Loss
Average Gain = [(previous Average Gain)x13 + current Gain]/14
First Average Gain = Total of Gains during past 14 periods / 14
Average Loss = [(previous Average Loss) x13+current Loss]/14
First Average Loss = Total of Losses during past 14 periods / 14
Note: "Losses" are reported as positive values.

STOCK/CORPORATEThe Financial Express Thursday, May 5, 2011 Page 12
NAV of Mutual Funds
On The Basis of Closing Operation at 26/04/2011:FirstICBM.F 100 10515.26 1183.83SecondICBM.F 100 2838.65 805.92ThirdICBM.F 100 2055.9 624.78FourthICBM.F 100 2419.43 600.02FifthICBM.F 100 2041.06 435.81SixthICBM.F 100 750.1 248.17SeventhICBM.F 100 1170.33 331.91EighthICBM.F 100 866.23 291.19IFILISLMF1 10 8.4 10.09 840.36 1008.81PF1STMF 10 10.25 11.38 615.12 682.61PRIME1ICBA 10 10.55 11.53 1055.04 1153.47ICBEPMF1S1 10 10.72 11.7 803.65 877.251STPRIMFMF 10 17.54 15.87 350.88 317.30ICBISLAMIC 100 281.38 263.07 281.38 263.07ICB2NDNRB 100 187.84 153.44 1878.41 1534.37ICB3RDNRB 10 9.65 11.03 965.12 1102.65ICB1STNRB 100 419.07 330.82 419.07 330.82ICBAMCL2ND 100 120.51 124.32 602.57 621.58ICBAMCL1ST 100 615.99 429.98 615.99 429.98ICBISLAMIC 100 281.38 263.07 281.38 263.07On The Basis of Closing Operation at 28/04/2011:GRAMEEN1 10 49.44 27.62 840.41GRAMEENS2 10 18.1 12.27 2262.32AIMS1STMF 1 4.46 1.53 1850.071STBSRS 100 1734.34 289.65 144.83GREENDELMF 10 9.45 10.34 1417.33 1551.03MBL1STMF 10 9.64 9.84 963.75 984.24DBH1STMF 10 11.96 12.72 1435.03 1526.78AIBL1STIMF 10 9.73 10.02 973.27 1002.06EBL1STMF 10 14.23 13.24 1422.64 1324.07TRUSTB1MF 10 13.7 12.48 2740.63 2496.48IFIC1STMF 10 13.03 12.35 1563.09 1481.771JANATAMF 10 10.07 10.86 2013.62 2172.60POPULAR1MF 10 9.82 10.71 1964.53 2142.72PHPMF1 10 9.36 10.46 1872.02 2091.23Where, CP= Cost Price; CMP=Current Market PriceFV=Face Value; NAV=Net Asset Value
NAV(PerUnit) NAV(M.Tk.)
Mutual Fund FV CMP CP CMP CP
FV/ML Last AGM Last B.Value DSE CSE
(Tk./No.)(dd/mm/yy)Div.(%) PS (Tk.)EPS(Tk.) PER PER
NON TRADED ISSUES
Company Last Last Yearly Last Last Yearly
Price T. Day H/L(Tk.) Price T.day H/L(Tk.)
DSE CSE Other Information
BANKUCBL-A 58.16 03/05/11 3140/56 58.12 03/05/11 13012/57 10/50 30/05/11 ---- 13.43 7.50 7.75 7.75INVESTMENT2nd ICB M F-A 4040.00 02/05/11 4260/2020 3560.00 20/03/113749/2200 100/5 12/08/10 200 480.33 135.55 29.80 26.264th ICB M F-A 2370.00 02/05/11 2650/1700 2330.00 26/04/112330/1800 100/10 12/08/10 125 586.36 114.28 20.74 20.397th ICB M F-A 1282.50 02/05/11 1379/862 1279.50 31/03/11 1300/800 100/50 12/08/10 70.0 271.70 50.00 25.65 25.59MBL 1st M. F.-A 9.10 03/05/11 11/9 8.50 20/04/11 11/9 10/500 ---- ---- ---- --- ---- ----ENGINEERINGAnwar Galvanizing-Z 449.60 17/04/11 620/220 455.88 17/04/11 610/275 100/50 24/03/11 ---- 75.55 0.13 3458.5 3506.8FOOD & ALLIEDAlpha Tobacco-Z 24.60 30/09/10 31/16 27.24 30/09/10 1032/17 10/50 12/06/10 ---- -153.3 -56.09 ---- ----BLTC-Z 243.76 30/09/10 399/180 Not Listed ------ 100/5 30/12/10 ---- -129.1 -1143 ---- -----E.L. Camellia 5787.50 21/06/07 0/0 Not Listed ------ 100/5 08/05/07 25.0 1974.2 611.00 9.47 -----National Tea-A 6285.58 24/04/11 8000/3690 5843.94 20/04/116051/3700 100/5 24/06/10 20.0 483.00 156.78 40.09 37.27Yousuf Flour-B 23.80 10/03/08 0/0 Not Listed ------ 10/50 22/12/09 3.00 0.51 0.64 37.19 -----BD. Plantation-A 2400.00 23/09/10 2400/2200 Not Listed ------ 100/5 24/12/09 10.0 -792.9 22.57 106.34 -----Hill Plantation-A 1617.75 19/08/10 1618/1400 Not Listed ------ 100/5 24/12/09 10.0 410.59 15.20 106.43 -----Dhaka Fisheries-B 321.71 19/10/10 530/261 330.00 06/09/10 341/270 100/50 17/12/09 ---- 93.17 -24.16 ---- ----Gulf Foods-Z 166.47 27/09/10 214/114 155.00 27/09/10 235/120 100/50 12/12/09 ---- 101.05 -3.01 ---- ----Modern Industries-Z 137.00 08/08/10 305/136 Not Listed ------ 100/5 17/06/10 ---- -433.6 6.87 19.94 -----FUEL & POWERPadma Oil Co.-A 736.66 29/03/11 1425/488 737.88 29/03/11 1405/490 10/100 30/04/11 50.0 50.15 14.46 50.94 51.03Eastern Lubricants-A 556.41 03/05/11 1010/440 Not Listed ------ 10/50 19/02/11 30.0 57.00 5.00 111.28 -----JUTENorthern Jute-Z 41.60 28/04/11 50/30 Not Listed ------ 10/200 30/12/09 ---- 22.20 -8.93 ---- -----TEXTILEStylecraft-A 6000.00 03/05/11 9725/3000 Not Listed ------ 100/10 26/09/10 30.0 2211.0 133.60 44.91 -----Quasem Silk Mills-Z 12.18 30/09/10 16/8 Not Listed ------ 10/500 26/05/10 ---- -0.06 -0.22 ---- -----Dulamia CottonZ 488.75 17/04/11 515/161 53.25 11/10/01 0/0 100/10 25/12/10 ---- -173.1 -8.32 ---- ----Apex Weaving-Z 156.15 19/10/10 249/105 159.63 19/10/10 242/105 100/50 27/12/09 ---- 50.06 -51.13 ---- ----Monno Fabrics-Z 77.84 19/10/10 180/66 78.30 19/10/10 181/58 100/50 27/06/10 ---- 157.93 -28.25 ---- ----Alltex Industries-Z 362.86 17/04/11 369/101 357.85 17/04/11 362/102 100/50 30/12/09 ---- 118.51 -12.20 ---- ----Safko Spinning-Z 557.13 03/05/11 918/85 552.92 03/05/11 905/82 100/50 26/05/11 ---- 43.23 -5.16 ---- ----PHARMA & CHEM.JMI-Bangla Co. Ltd.-B Not Listed ------- 298.25 30/09/10 388/267 100/50 26/04/10 7.50 126.36 15.82 ---- 18.85Bangla Process-B 1097.00 31/03/10 0/0 Not Listed ------ 100/5 31/12/09 6.00 103.51 2.48 442.34 -----ACI Limited-A 295.49 03/05/11 455/227 289.17 03/05/11 452/225 10/50 15/06/11 120 217.76 30.49 9.69 9.48Therapeutics-Z 410.33 30/09/10 536/405 420.00 20/09/10 475/420 100/10 17/06/10 ---- 0.07 -5.60 ---- ----ACI Formulations-A 131.24 03/05/11 242/75 131.14 03/05/11 1230/75 10/100 15/06/11 30.0 49.73 3.05 43.03 43.00SERVICEBD.Hotels-A 13.20 21/09/08 0/0 Not Listed ------ 10/50 25/08/10 35.0 284.67 13.64 0.97 -----BD.Service-A 11.70 07/01/10 0/0 Not Listed ------ 10/50 01/08/10 ---- 21.67 1.86 6.29 -----MISCELLANEOUSKhaza Mosaic Tiles Not Listed ------- 8.70 25/08/09 0/0 10/500 ---- ---- 11.35 0.76 ---- 11.45JAGO Corp. Ltd. Not Listed ------- 40.35 30/09/10 95/37 100/50 24/06/10 ---- 113.80 -1.57 ---- ----Bata Shoe Ltd.-A 599.33 03/05/11 830/430 582.15 03/05/11 845/431 10/100 23/06/11 105 86.07 39.66 15.11 14.68The Engineers-A 111.00 01/12/04 0/0 Not Listed ------ 100/5 29/12/07 25.0 4286.0 899.57 0.12 -----Himadri Ltd.-A 7.20 03/06/08 0/0 Not Listed ------ 10/100 28/06/10 12.0 18.01 1.49 4.83 -----Niloy Cement-Z 263.63 30/09/10 375/206 267.00 30/09/10 360/211 100/50 24/12/09 ---- 29.42 0.18 1464.6 1483.3Legacy Footwear-Z 49.92 17/04/11 69/25 50.12 17/04/11 74/27 10/500 16/08/10 10.0 18.88 0.51 97.88 98.27PadmaCement-Z 30.90 30/09/10 35/15 30.56 30/09/10 35/15 10/500 20/06/09 ---- 0.57 -1.44 ---- ----INSURANCEAsia Pasific Insu.-A 501.40 03/05/11 1249/401 501.00 03/05/11 1250/410 100/50 15/04/10 ---- 151.92 14.61 34.32 34.29Paramount Insur-A 539.03 03/05/11 1194/346 528.40 03/05/11 1150/320 100/50 03/07/11 ---- 121.82 11.85 45.49 44.59City G Insu.-A 53.09 03/05/11 1694/51 53.36 03/05/11 1748/51 10/100 23/06/11 ---- 13.54 2.37 22.40 22.51
..........................................Continued from page 11
Forth Coming IPO Approved By SEC
Reliance Insurance Mutual Fund(Subscription Open: 15.05.11, Close:22.05.11)
Draft Prospectus Submitted to SEC
LankaBangla Securities Ltd.
STS Holdings Ltd. (Apollo Hospitals Dhaka)
GBB Power Ltd.
Rangpur Dairy & Food Products Ltd.
Unique Hotel & Resorts Ltd.
Meghna Insurance Company Ltd.
Padma Islami Life Insurance Ltd.
Bangladesh National Insurance Company Ltd.
Alliance Holdings Ltd.
Janata Bank Limited
IPO
SECTORAL
INDEX
GRAPHS & CHARTS
TE
CH
NIC
AL
GR
AP
H
MISCELLANEOUS
Name of Company Year Dividend Date of Record Venue Time
end in (%) AGM/EGM Date
AGM/EGM/Dividend/Right/IPO
Asia Insurance Ltd. 31.12.10 25%C & 25%B 05.05.11 08.03.11 Bashundhara Convention Center-2, Ummekulsum Road, Block-C, Bashundhara R/A, Dhaka-1229. 11:30 AM
Meghna Petroleum Ltd. 30.06.10 45%C & 5%B 07.05.11 28.03.11 Hotel Agrabad, Chittagong. 10:30 AM
Berger Paints Bangladesh Ltd. 31.12.10 180%C 09.05.11 22.03.11 Bangabandhu International Conference Centre, Agargaon, Dhaka. 11:00 AM
Shahjalal Islami Bank Ltd. 31.12.10 30%B 09.05.11 21.04.11 Hall of Fame, Bangabandhu International Conference Centre, Sher-E-Bangla Nagar, Agargaon, Dhaka-1207. 10:00 AM
Bangladesh Lamps Ltd. 31.12.10 35%C 11.05.11 24.04.11 Emmanuelle's Banquet Hall, House # 4, Road # 134-135, Gulshan-1, Dhaka. 11:00 AM
BOC Bangladesh Ltd. 31.12.10 100%C (Final) 12.05.11 23.03.11 Officers Club, 26 Baily Road, Ramna, Dhaka-1000. 10:30 AM
Bangladesh Industrial Finance Company Ltd. 31.12.10 25%B 12.05.11 27.04.11 "Institution of Diploma Engineers, Bangladesh", IDEB Bhaban Complex, 160/A, Kakrail, Dhaka. 11:00 AM
Jamuna oil Company Ltd. 30.06.10 30%C & 20%B 14.05.11 07.04.11 Hotel Agrabad, Chittagong. 11:30 AM
Sonargaon Textiles Ltd. 31.12.10 10%B 14.05.11 17.04.11 Barisal Club, Barisal. 12:00 Noon
Standard Bank Ltd. 31.12.10 28%B 16.05.11 10.04.11 Bashundhara Convention Centre, Baridhara, Dhaka. 11:00 AM
Bangladesh Welding Electrodes Ltd. 31.12.10 5%C & 10%B 16.05.11 20.03.11 Institute of Engineers, Ramna, Dhaka. 11:30 AM
Islami Bank Bangladesh Ltd. 31.12.10 35%B 18.05.11(AGM & EGM) 13.04.11 Bangabandhu International Conference Centre, Agargaon, Sher-E-Bangla Nagar, Dhaka-1207. EGM: 9:30 AM AGM: 10:00 AM
Islami Bank Bangladesh Ltd. Mudaraba Perpetual Bond 31.12.10 12.35% (Annual Profit Rate) N/A 13.04.11 N/A N/A
Uttara Bank Ltd. 31.12.10 20%C & 20%B 19.05.11 24.03.11 Rangamati Waterfront, Sinaboho Bazar, Shafipur, Gazipur. 11:00 AM
Jamuna Bank Ltd. 31.12.10 22%B 19.05.11 06.04.11 Bangabandhu International Conference Centre, Sher-E-Bangla Nagar, Dhaka. 10:00 AM
Rupali Bank Ltd. 31.12.10 10%B 19.05.11 12.04.11 Engineers Institution, Ramna, Dhaka. 11:00 AM
Islamic Finance and Investment Ltd. 31.12.10 16%B 19.05.11 12.04.11 Institute of Diploma Engineers, Kakrail, Dhaka. 10:30 AM
Beach Hatchery Ltd. 31.12.10 15%B 24.05.11 15.05.11 Project Premises at Moheshkhalipara, Teknaf Sea Beach, Teknaf, Cox's Bazar. 11:00 AM
Ocean Containers Ltd. 31.12.10 25%B 25.05.11 12.04.11 Army Golf Club, 'Golf Garden', Airport Road, Dhaka Cantonment, Dhaka (opposite of Radisson Water Garden Hotel). 10:30 AM
Summit Alliance port Ltd. 31.12.10 20%C & 25%B (Final) 25.05.11 12.04.11 Army Golf Club, 'Golf Garden', Airport Road, Dhaka Cantonment, Dhaka (opposite of Radisson Water Garden Hotel). 11:30 AM
Summit Power Ltd. 31.12.10 30%B 26.05.11 10.04.11 Army Golf Club, "GOLF GARDEN" on the VIP Road, Opposite of Radisson Water Garden, Dhaka Cantonment, Dhaka. 11:00 AM
Premier leasing & Finance Ltd. 31.12.10 20%B & 1R:1* 26.05.11 13.04.11 Spectra Convention Center Ltd., House #19, Road #7, Gulshan-1, Dhaka-1212. 11:00 AM
Safko Spinning Mills Ltd. 31.12.10 16%B 26.05.11 04.05.11 Mill premises, Noyapara, P.O. Saihamnagar, Habigonj. 11:00 AM
Uttara Finance & Investments Ltd. 31.12.10 40%B 30.05.11 03.05.11 To be notified later To be notified later
United Commercial Bank Ltd. 31.12.10 25%B 30.05.11 04.05.11 Army Golf Club, Dhaka Cantonment, Dhaka. 10:30 AM
Pioneer Insurance Company Ltd. 31.12.10 25%B 30.05.11 09.05.11 Windy Town, Bangabandhu International Conference Centre, Agargaon, Sher-E-Bangla Nagar, Dhaka-1219. 11:00 AM
BSRM Steels Ltd. 31.12.10 20%B 31.05.11 12.04.11 Institution of Engineers, Bangladesh, Chittagong Centre, SS Khaled Road, Chittagong. 11:00 AM
Peoples Insurance Company Ltd. 31.12.10 5%C & 5%B 01.06.11 11.04.11 Dhaka Ladies Club, 36, Eskaton Garden Road, Dhaka. 10:30 AM
United Insurance Company Ltd. 31.12.10 10%C & 10%B 02.06.11 20.04.11 Bangabandhu International Conference Centre, Sher-E-Banglanagar, Dhaka. 10:30 AM
Bangladesh Thai Aluminium Ltd. 31.12.10 25%B 04.06.11 11.05.11 Factory premises, Haritakitala, Chandra, Kaliakoir, Gazipur. 11:00 AM
Trust Bank Ltd. 31.12.10 20%B & 1R:5* 07.06.11 04.04.11 Army Golf Club, Airport Road, Dhaka. 11:00 AM
Export Import Bank of Bangladesh Ltd. 31.12.10 35%B 09.06.11 10.04.11 Golf Garden', Army Golf Club, Airport Road, Dhaka. 10:30 AM
United Leasing Company Ltd. 31.12.10 7.5%C & 75%B 09.06.11 28.04.11 Celebrity Hall, Bangabandhu International Conference Centre, Agargaon, Dhaka. 11:00 AM
Active Fine Chemicals Ltd. 31.12.10 15%B 09.06.11 27.04.11 Institution of Diploma Engineers, Kakrail, Dhaka. 11:00 AM
Khulna Power Company Ltd. 31.12.10 20%B 12.06.11 (AGM & EGM) 12.05.11 Bashundhara Convention Centre, Bashundhara R/A, Baridhara, Dhaka-1229. EGM: 10:00 AM AGM: 11:00 AM
Phoenix Finance & Investments Ltd. 31.12.10 35%B 13.06.11 27.04.11 "Hall of Fame", Bangabandhu International Conference Centre (BICC), Agargaon, Sher-E-Bangla Nagar, Dhaka. 12:00 Noon
Heidelbergcement Bangladesh Ltd. 31.12.10 43%C 13.06.11 05.05.11 Factory Office, Tatki, Jatramora, Tarabow, Rupgonj, Narayangonj. 11:00 AM
Industrial Promotion and Development Co. of Bangladesh Ltd. 31.12.10 10%B 14.06.11 05.05.11 Trust Milonayaton, 545, Old Airport Road, Dhaka. 9:30 AM
Green Delta Insurance Company Ltd. 31.12.10 40%C 15.06.11 28.04.11 Hotel Purbani International, 1, Dilkusha C/A, Dhaka-1000. 11:00 AM
Reckitt Benckiser (Bangladesh) Ltd. 31.12.10 50%C (Final) 15.06.11 08.05.11 Trust Milonayatan, Shaheed Jahangir Gate, 545 Old Airport Road, Dhaka Cantonment, Dhaka-1206. 10:30 AM
ACI Formulations Ltd. 31.12.10 30%C 15.06.11 04.05.11 Bangabandhu International Conference Centre, Agargaon, Sher-E-Bangla Nagar, Dhaka. 12:00 Noon
Advanced Chemical Industries Ltd. (ACI) 31.12.10 120%C 15.06.11 04.05.11 Bangabandhu International Conference Centre, Sher-E-Bangla Nagar, Dhaka. 9:00 AM
Phoenix Insurance Company Ltd. 31.12.10 25%B & 1R:4* 15.06.11 15.05.11 Officers' Club, 26 Baily Road, Ramna, Dhaka. 11:30 AM
FAS Finance & Investment Ltd. 31.12.10 15%B 16.06.11 18.04.11 Trust Milonayaton, 545, Puratan Biman Bandar Sarak, Dhaka Cantonment, Dhaka. 10:00 AM
Lafarge Surma Cement Ltd. 31.12.10 Nil 16.06.11 27.04.11 Harmony Hall, Bangabandhu International Conference Centre, Agargaon, Sher-E-Bangla Nagar, Dhaka-1207. 11:00 AM
Square Textiles Ltd. 31.12.10 16%C & 20%B 16.06.11 10.05.11 Factory Premises, Sardaganj, Kashimpur, Gazipur, Dhaka. 10:30 AM
Golden Son Ltd. 31.12.10 5%C & 10%B 16.06.11 10.05.11 To be notified later 12:00 Noon
Renata Ltd. 31.12.10 60%C & 25%B 18.06.11 11.05.11 Officers' Club Dhaka, 26, Baily Road, Dhaka-1000. 10:30 AM
Northern General Insurance Co. Ltd. 31.12.10 12%B 20.06.11 27.04.11 Bangabandhu International Conference Centre (BICC), Carnival, Sher-E-Bangla Nagar, Dhaka. 11:00 AM
Central Insurance Company Ltd. 31.12.10 15%B & 1R:2* 20.06.11 03.05.11 Dhaka Ladies Club, 36, Eskaton Garden Road, Dhaka. 11:00 AM
Confidence Cement Ltd. 31.12.10 25%C & 15%B 20.06.11 12.05.11 Factory premises, Madambibirhat, Bhatiary, Sitakund, Chittagong. 11:00 AM
Bangladesh Finance and Investment Co. Ltd. 31.12.10 22%B 21.06.11 28.04.11 Institution of Diploma Engineers, Kakrail, Dhaka. 10:00 AM
ICB Islamic Bank Ltd. 31.12.10 Nil 21.06.11 05.05.11 "Golf Garden", Army Golf Club, Airport Road, Dhaka. 11:00 AM
Standard Insurance Ltd. 31.12.10 10%B 21.06.11 10.05.11 Spectra Convention Center Ltd., House #19, Road #7, Gulshan-1, Dhaka-1212. 10:30 AM
The City Bank Ltd. 31.12.10 30%B 22.06.11 20.04.11 Hall of Fame, Bangabandhu International Conference Centre, Sher-E-Bangla Nagar, Dhaka. 12:00 Noon
National Housing Finance and Investments Ltd. 31.12.10 10%C & 10%B 22.06.11 12.05.11 Windy Town, Bangabandhu International Conference Centre, Agargaon, Sher-E-Bangla Nagar, Dhaka. 3:00 PM
Bata Shoe Company (Bangladesh) Ltd. 31.12.10 105%C (Final) 23.06.11 04.05.11 Dhamrai Factory, Dhaka. 10:30 AM
City General Insurance Co. Ltd. 31.12.10 12%B 23.06.11 04.05.11 "Multipurpose Hall", Institution of Diploma Engineers, Bangladesh, Kakrail, Dhaka. 10:30 AM
Nitol Insurance Company Ltd. 31.12.10 12.50%B 23.06.11 05.05.11 "Golf Garden", Army Golf Club, Dhaka Cantonment, Dhaka. 11:00 AM
Kay & Que (Bangladesh) Ltd. 31.12.10 5%B 23.06.11 12.05.11 To be notified later 10:30 AM
The Ibn Sina Pharmaceutical Industry Ltd. 31.12.10 10%C & 20%B 23.06.11 16.05.11 To be notified later 10:00 AM
Rangpur Foundry Ltd. 31.12.10 21%C 23.06.11 10.05.11 Bir Muktijoddha Sadeque Hossain Khoka Community Centre Complex, Bir Muktijoddha Sadeque Hossain Koka Road (Opposite of Modhumita Cinema Hall), Dhaka. 10:30 AM
Aramit Ltd. 31.12.10 40%C 25.06.11 16.05.11 "Peninsula Chittagong", Chittagong. 12:00 Noon
Aramit Cement Ltd. 31.12.10 10%B 25.06.11 18.05.11 "Peninsula Chittagong", Chittagong. 12:45 PM
Information Services Network Ltd. 31.12.10 10%B & 1R:1* 26.06.11(AGM & EGM) 12.05.11 "BIAM Foundation", 63, New Eskaton, Dhaka. EGM: 11:00 AM AGM: 11:30 AM
Padma Oil Company Ltd. 30.06.10 50%C & 50%B 30.04.11 (Postponed) 04.04.11 Main Installation, Guptakhal, Patenga, Chittagong. 11:00 AM
Al-Arafah Islami Bank Ltd. 31.12.10 26%B 10.05.11 (Postponed) 10.04.11 Golf Garden, Army Golf Club, Dhaka Cantonment, Airport Road, Dhaka. 10:00 AM
Titas Gas Transmission & Distribution Co. Ltd. N/A N/A 27.11.10 (EGM) (Postponed) 01.11.10 To be notified later To be notified later
C = Cash Dividend, B = Bonus Dividend and R = Rights.* Note: Another record date for entitlement of the proposed right share to be notified after obtaining approval from SEC.
Record Date for Rights Entitlement, Denomination Change & Others(Last Updated on May 04, 2011)
Name of Company Ratio of Rights Issue Issue Price (Tk.) Record Date Subscription Period New Denomination Remarks
CMC-Kamal Textile Mills Ltd. 2R:1 17.50 22.02.2011 10.03.2011 to 12.05.2011 N/A Rights Entitlement
Social Islami Bank Ltd. 1R:1 10.00 24.03.2011 10.04.2011 to 08.05.2011 N/A Rights Entitlement
Sonargaon Textiles Ltd. 1R:1 150.00 24.03.2011 24.04.2011 to 19.05.2011 N/A Rights Entitlement
Mercantile Insurance Company Ltd. 1R:1 150.00 12.04.2011 28.04.2011 to 16.05.2011 N/A Rights Entitlement
City General Insurance Company Ltd. 1R:1 15.00 19.04.2011 24.05.2011 to 20.06.2011 N/A Rights Entitlement
Sinobangla Industries Ltd. 1R:1 20.00 05.05.2011 19.06.2011 to 14.07.2011 N/A Rights Entitlement
Pioneer Insurance Company Ltd. 1R:5 400.00 15.05.2011 31.05.2011 to 23.06.2011 N/A Rights Entitlement
Janata Insurance Company Ltd. 2R:1 200.00 15.05.2011 01.06.2011 to 23.06.2011 N/A Rights Entitlement
Keya Cosmetics Ltd. N/A N/A 25.05.2011 N/A N/A Amalgamation Purpose
Keya Detergent Ltd. N/A N/A 25.05.2011 N/A N/A Amalgamation Purpose