capital flows in risky times: risk-on / risk-off and
TRANSCRIPT
ISSN 1936-5330
Anusha Chari, Karlye Dilts Stedman, and Christian Lundblad July 2020RWP 20-08http://doi.org/10.18651/RWP2020-08
Capital Flows in Risky Times: Risk-On / Risk-Off and Emerging Market Tail Risk

Capital Flows in Risky Times: Risk-on / Risk-off and
Emerging Market Tail Risk
Anusha Chari* Karlye Dilts-Stedman † Christian Lundblad‡
This Version: July 1, 2020
Preliminary. Work in Progress.
ABSTRACT
This paper characterizes the implications of risk-on/risk-off shocks for emerging mar-ket capital flows and returns. We document that these shocks have important implicationsnot only for the median of emerging markets flows and returns but also for the left tail.Further, while there are some differences in the effects across bond vs. equity markets andflows vs. asset returns, the effects associated with the worst realizations are generally largerthan that on the median realization. We apply our methodology to the COVID-19 shock toexamine the pattern of flow and return realizations: the sizable risk-off nature of this shockengenders reactions that reside deep in the left tail of most relevant emerging market quan-tities.
*Professor of Economics, Department of Economics & Professor of Finance, Kenan-Flagler Business School,University of North Carolina at Chapel Hill & NBER. Email: [email protected].
†Economist, Research Department, Federal Reserve Bank of Kansas City. Email: [email protected] views expressed are those of the authors and do not necessarily reflect those of the Federal Reserve Bank ofKansas City or the Federal Reserve System.
‡Richard ”Dick” Levin Distinguished Professor of Finance, Kenan-Flagler Business School, University of NorthCarolina at Chapel Hill. Email:Christian [email protected].
1
1 Introduction
While portfolio flows to emerging markets offer well-documented benefits (Bekaert, Harvey
and Lundblad (2005); Chari and Henry (2004, 2008); Henry (2007)), tail events such as sud-
den stops present challenges that prove particularly pressing for investors and policy makers
(Forbes and Warnock (2012, 2019); Rey (2013); Miranda-Agrippino and Rey (2020)). There is,
of course, a large literature on cross-border capital flows and their implications for financial
market returns.1 However, extant research has largely focused on the first moment of the rel-
evant distributions of these important quantities. In sharp contrast, building on Gelos et al.
(2019), we focus on the full distributions of emerging market capital flows and returns; most
important, we characterize the manner in which extreme capital flow and returns realizations
are tied to global risk appetite (“risk-on/risk-off” or RORO).
Despite still being somewhat imprecisely defined, the RORO terminology has come into
pervasive use in the financial press and among policy makers in the years since the global fi-
nancial crisis. In this paper, we focus on RORO shocks as a reflection of variation in global
investor risk aversion. As investors rebalance their portfolios away from risk assets and to-
ward safe assets in the face of risk aversion shock, RORO variation has important implica-
tions for asset price determination, particularly for so-called “risk assets”. Jotikasthira, Lund-
blad, and Ramadorai (2012), for example, document this shock transmission mechanism to
emerging market capital flows and asset prices. In response to funding shocks from their in-
vestor base (possibly linked to RORO), global funds substantially alter their portfolio alloca-
1See for example a non-exhaustive list of papers, Alfaro, L., S. Kalemli-Ozcan, and V. Volosovych (2008, 2014);Avdjiev, S., L. Gambacorta, L. S. Goldberg, and S. Schiaffi (2017); Ammer, J., M. De Pooter, C. J. Erceg, and S. B.Kamin (2016); Baskaya, Y. S., J. di Giovanni, S. Kalemli-Ozcan, J.-L. Peydro, and M. F. Ulu (2017); Bauer, M. D.,& Neely, C. J. (2014); Broner, F., Didier, T., Erce, A., & Schmukler, S. L. (2013); Bruning, F. and V. Ivashina (2019);Bruno, V. and H. S. Shin (2014, 2015); Burger, J., R. Sengupta, F. Warnock, and V. Warnock (2015); Calvo, G. A., L.Leiderman, and C. M. Reinhart (1993, 1996).; Cerutti, E., S. Claessens, and D. Puy (2019); Chari, A., K. Dilts Sted-man, and C. Lundblad (2020); Chen, J., Mancini Griffoli, T., & Sahay, R. (2014); Clark, John, Nathan Converse,Brahima Coulibaly, and Steve Kamin (2016); Dedola, L., G. Rivolta, and L. Stracca (2017); Dilts Stedman, K. (2019);Eichengreen, B. and P. Gupta (2017); Forbes, K. J. and F. E. Warnock (2012, 2019); Fratzscher, M. (2012); Fratzscher,M., Duca, M. L., & Straub, R. (2016, 2018); Georgiadis, G., & Grab, J. (2015); Ghosh, A. R., Kim, J., Qureshi, M.,and Zalduendo, J. (2012); Gilchrist, S., Yue, V., & Zakrajsek, E. (2014, November); Gourinchas, P. O., & Obstfeld,M. (2012); Karolyi, G. A., & McLaren, K. J. (2016); Kim, S. (2001); Kroencke, T. A., Schmeling, M., & Schrimpf, A.(2015); Jotikasthira, P., C. Lundblad, and T. Ramadorai (2012); McCauley, R. N., McGuire, P., & Sushko, V. (2015);Miranda-Agrippino, S. and H. Rey (2019); Milesi-Ferretti, G., & Tille, C. (2011); Mishra, P., Moriyama, K., N’Diaye,P. M. B., & Nguyen, L. (2014); Moore, J., Nam, S., Suh, M., & Tepper, A. (2013); Neely, C. J. (2010); Obstfeld, M.(2015); Obstfeld, M., J. D. Ostry, and M. S. Qureshi (2018); Rogers, J.H., Scotti,C., & Wright,J.H.(2014); Reinhart, C.and V. Reinhart (2009); Rey, H. (2013).
2

tions to emerging markets with important implications for local asset prices.
In this project, we first build a multi-faceted RORO index to capture realized variation
in global investor risk appetite. We employ daily data from both the United States and the
Euro area to capture signals about global risk appetite. We summarize the risk-on and risk-
off states of the world using an amalgam of four broad categories that reflect variation in ad-
vanced economy credit risk, equity market volatility, funding conditions, and currencies and
gold. With an eye to inferring the risk bearing capacity of international investors, our RORO
index comprises the first principle component of daily changes in these series. Our index,
along with several associated sub-indices reflecting these four constituent groups, exhibits
interesting distributional features in the sense that it is well characterized by significant skew-
ness and fat tails. With fat tails, extreme events become both more probable and potentially
more destabilizing. As examples, we observe sharp risk-off movements during the global fi-
nancial crisis, the European debt crisis, the taper tantrum, and the COVID-19 crisis.
In recognition that our RORO measure reflects a largely statistical approach to measur-
ing risk appetite, we also consider the variance risk premium from Bekaert at al. (2020). A
complementary approach to measure risk aversion is to use a structural model to separate
the price of risk (or risk aversion) from the amount of physical uncertainty. The latter object
is a forecast of the variance, and the level of risk aversion is inferred from the amount over
and above that uncertainty that investors are willing to pay to avoid it. As with our headline
RORO index, these measures are also highly right-skewed and fat tailed, and they too spike
during the global financial and COVID-19 crises.
Understanding the implications of variation in RORO for emerging market capital flow
and return distributions is the focus of our paper. We focus on the extent to which RORO
shocks alter the range of the distribution versus shift the distribution. As an example, an ad-
verse, risk-off shock can make the whole emerging market capital flow or return distribution
wider by pulling out both of the tails. Alternatively, a risk-off shock could simply fatten the
left tail. These differences have important implications for how investors and policy makers
should consider downside risk.
Using a panel quantile regression approach as in Machado and Santos Silva (2019), we
characterize the distributional implications of RORO shocks for emerging market capital
3

flows and returns. In order to obtain a multilateral, high frequency proxy of capital flows
into and out of emerging markets, we use the country flows dataset from EPFR Global. EPFR
Global publishes weekly portfolio investment flows by more than 14,000 equity funds and
more than 7,000 bond funds, collectively with more than 8 trillion U.S. dollars of capital un-
der management. To measure returns on emerging market assets, we use country level USD
and local currency equity return indices from MSCI, and our fixed income returns come from
Bloomberg local currency bond indices and the Emerging Market Bond Index from JP Mor-
gan. Due to the availability of EPFR data, the sample runs from January 7, 2004 to Apr. 9,
2020.
We find that RORO shocks do have important implications, not only for the median of
emerging market flows and returns, but also for the left tail. We conclude that the focus in the
literature on measures of central tendency is incomplete. In particular, we find that the effects
associated with the worst realizations, say the fifth quantile, are often more heavily affected
by risk-off shocks, then the median realization.
We first consider the distributional implications for portfolio flows associated with EPFR
bond and equity mutual funds. For bond funds, risk-off shocks increase the worst portfolio
outflow realizations more than they decrease median flows, and therefore risk-off shocks sig-
nificantly fatten the left tail of the portfolio flow distribution. The net effect on bond flows
from a risk-off event is that the entire distribution moves to the left. In the equity fund space,
in contrast, while we observe that a risk-off shock negatively affects the overall distribution,
we also observe that a risk-off shock brings in both the tails. Further, our complementary vari-
ance risk premium estimates suggest that the reactions we observe in the equity flow distribu-
tion emanate more from changes in risk aversion than to uncertainty.
Next, we turn to the distributional implications for emerging market returns. We find
that risk-off shocks negatively affect the worst return realizations more than they affect the
median return realization. Further, that are important differences across asset class and cur-
rency denomination. First, the left-tail implications for equity returns, in particular, are more
severe than for bond returns. Second, within asset classes, U.S. dollar indices are more sensi-
tive than local currency indices for both fixed income and equity.
Finally, we apply our framework to the COVID-19 shock. We examine the distributional
4

pattern of the flow and returns realizations in the face of the sizable risk-off nature of this
shock. In the COVID-19 era, a one standard deviation RORO shock pulls (compresses) the
tail realizations of the weekly bond (equity) distribution by $25 ($16.1) million. A shock equal
in magnitude to the largest observation in the COVID-19 sample pulls (compresses) the tails
realizations of the weekly bond (equity) distribution by $92 ($59.5) million.
2 Data and Methodology
2.1 Measuring Risk-on/Risk-off
To measure changes in risk attitudes, we construct a Risk-On, Risk-Off (RORO) index simi-
lar to that described in Datta et al (2017). Our RORO index comprises the z-score of the first
principal component of daily changes in several standardized variables. First, we normalize
components such that positive changes imply risk-off behavior. Then, before taking the first
principal component, we scale these normalized changes by their respective historical stan-
dard deviations.
Our headline measure incorporates several series. To capture changes related to credit
risk, we use the change in the ICE BofA BBB Corporate Index Option-Adjusted Spread for the
United States and for the Euro Area. To capture changes in risk aversion emanating from ad-
vanced economy equity markets, we use the additive inverse of daily total returns on the S&P
500, STOXX 50 and MSCI Advanced Economies Index, along with associated changes in op-
tion implied volatilities from the VIX and the VSTOXX. To account for changes to funding liq-
uidity, we include the daily average change in the G-spread on 2-, 5-, and 10-year Treasuries,
along with the change in the TED spread. Finally, we include growth in the trade-weighted
U.S. Dollar Index against advanced foreign economies and the change in the price of gold.
Figure 1 displays the time series and histogram of the headline measure.
To shed light on differing sources of risk, we also construct four sub-indices. These group-
ings, chosen to maximize the total explained variation of the components, fall into the four
categories above: (1) spreads (credit risk), (2) advanced economy equity returns and implied
volatility, (3) funding liquidity, and (4) currency and gold. As in the headline index, the subindices
comprise the first principal component of the normalized series. Table 1 displays summary
5

statistics for the headline measure and subindices. Since they are expressed as z-scores, we
omit their means and standard deviations from the table.
Defining a risk measure comprising multiple sources of risk confers several advantages.
First, agglomerating multiple sources of risk allows us to abstract from any one source of
risk-off behavior in our baseline analysis. Elevating any particular asset price in the measure-
ment of risk sentiment hazards the possibility that the relationship between the measure-asset
and the risk-affected-asset arises from a particular set of market participants, the actions of
whom may not be generalizable across time and across assets. The group of market partici-
pants who take out, for example, S&P 500 options to hedge against U.S. equity volatility have
characteristics such as U.S. home bias that may not extend equally to all other risk assets we
might want to measure in the face of a risk-off shock. Second, our multivariate measure of
risk-on/risk-off further permits the decomposition of baseline results into underlying drivers,
offering insights into the source of a given risk-on or risk-off event, which itself may differen-
tially drive emerging market capital flows and returns. Third, our measure recognizes sources
outside of the United States which may drive risk-on/risk-off changes.
In recognition that a statistical approach such as ours does not structurally distinguish
the price of risk (risk aversion) from the amount of risk (economic uncertainty), we also use a
micro-founded variance risk premium and uncertainty index from Bekaert, Engstrom, and Xu
(2020; BEX). BEX filter a utility-based risk aversion index from a wide set of macro and finan-
cial risk variables, given asset pricing implications derived at the equilibrium, “. . . reflecting
the time-varying relative risk aversion coefficient of the representative agent in a generalized
habit-like model with preference shocks”.
Visualizing the time series of our chosen measures in Figures 1 and 2, along with Tables
1 and 2, reveals (risk-off) skewness, excess kurtosis, and time varying volatility in nearly all
measures.2 Each measure particularly spikes during the global financial, the European debt,
and the COVID-19 crises.2Only the funding liquidity and currency/commodities measures show low skewness, but these also show
excess kurtosis and time varying volatility.
6

2.2 Data
2.2.1 Capital Flows and Returns
In order to obtain a multilateral, high frequency proxy of capital flows into and out of emerg-
ing markets, we use the country flows dataset from EPFR Global. EPFR Global publishes
weekly portfolio investment flows by more than 14,000 equity funds and more than 7,000
bond funds, with more than USD 8 trillion of capital under management. The Country Flows
dataset combines EPFR’s Fund Flow and Country Weightings data to track the flow of money
into world equity and bond markets. While fund flow data reports the amount of cash flow-
ing into and out investment funds, the country weightings report tracks fund manager alloca-
tions to each of the various markets in which they invest. Combining country allocations with
fund flows produces aggregate fund flows into and out of emerging markets (see Jotikasthira,
Lundblad, and Ramadorai (2012)). Because the country flows comprise the sum of fund-level
aggregate re-allocations, they come cleansed of valuation effects and therefore represent real
quantities.
To measure returns on emerging market portfolio assets, we collect daily total returns
from a number of well-known indices. Individual country returns on USD and local currency
bonds come from J.P. Morgan’s Emerging Market Bond Index (EMBI) and the Bloomberg Bar-
clay’s Local Bond Index, while we measure country-level equity returns using the Morgan
Stanley Capital International (MSCI) local currency and USD indices. Table 4 displays sum-
mary statistics for return and flow measures.
Reflecting the availability of EPFR data, the sample runs from January 7, 2004 to Apr. 15,
2020.3 The sample of countries comprises emerging markets appearing in each of the flow
and return data sets. Of these, we include countries with widespread recognition as emerging
market economies.4 The list of included countries can be found in Table 5.5
3The exception is local currency bond returns, which only become available in 2008.4We exclude China due to its unique characteristics, including its size relative to other emerging market
economies and measurement issues.5EM classifications considered include the IMF, BRICS + Next 11, FTSE, MSCI, S&P, EMBI, Dow Jones, Russell,
Columbia University EMPG and BBVA.
7

2.2.2 Control variables
The literature on patterns of international capital flows separates determinants into common,
global “push” factors associated with external shocks, and “pull” country-specific factors.
Our control variables include both “push” and “pull” variables suggested by the literature
on capital flows.
Following the literature on capital flow determinants (see, for example, Calvo, Leider-
man, and Reinhart 1993; Fratzscher 2012; Fratzscher, Lo Duca, and Straub 2014; Passari and
Rey 2015; Milesi Ferretti and Tille 2011; Broner et al. 2013; Forbes and Warnock 2012), the cap-
ital flow and return regressions include a measure of advanced market returns (obtained from
Kenneth French’s website) and a quarterly fixed effect control for global financial conditions,
as well as a lag of the left-hand-side variable to account for autocorrelation (since the flows
are scaled by a stock). Quarterly time fixed effects account both for slow moving business cy-
cles and structural changes in the market for ETFs and mutual funds.
Country-specific (pull factor) controls (see, for example, Ahmed and Zlate 2014; Forbes
and Warnock 2012; Fratzscher 2012; Fratzscher, Lo Duca, and Straub 2013; Eichengreen and
Gupta 2014; Moore et al. 2013; Chen, Mancini Griffoli, and Sahay 2014) in the capital flow es-
timations include local policy rates, average real GDP growth in the previous eight quarters,
and the broad real effective exchange rate (REER).
To control for the influence of local macroeconomic news in the intervening week or
day, we include the Citigroup Economic Surprise Index (CESI) for emerging markets. The
CESI tracks how economic data compare to expectations, rising when economic data exceed
economists’ consensus forecasts and falling when data come in below forecast estimates.6
In the return estimates, we use country i’s lagged bilateral exchange rate return vis-a-vis the
United States (LC/USD) instead of the REER to obtain a higher-frequency measure of ex-
change rate fluctuations.
All control variables enter with a lag to rule out simultaneity. Both sets of controls af-
fect capital flows and returns, but also likely react directly to changes in risk sentiment. In
6Indices are defined as weighted historical standard deviations of data surprises (actual releases vs. Bloombergsurvey median) and are calculated daily in a rolling three-month window. The weights of economic indicators arederived from relative high-frequency spot FX impacts of one standard deviation data surprises. The indices alsoemploy a time decay function to replicate the limited memory of markets.
8

fact, our main “push” variable, advanced economy returns, not only reacts to risk-on/risk-off
shocks but likely also drives them. Note that all daily variables enter as the weekly moving
average leading up to the week’s EPFR reporting date.
2.3 Estimation
With risk indicators in hand, we regress weekly EPFR country-level flows and daily returns
onto our risk appetite measures using the panel quantile regression approach of Machado
and Santos Silva (2019) with country and quarter-year fixed effects, controlling for the “push”
and “pull” factors described previously. Country level flows enter as a percent of the previous
week’s allocation, while returns are expressed as daily percentage change. As stated in the
data description, in the EPFR flow regressions, changes in the risk measures are aggregated
by moving average.
R(q)it = α
(q)i + δ
(q)t + β
(q)i Riskt + γ
(q)1 PUSHR
t + γ(q)2 PULLR
it + εi,t (1)
k(q)it = α(q)i + δ
(q)t + ρk(q)it−1 + β
(q)i Riskt + γ
(q)1 PUSHk
t + γ(q)2 PULLk
it + εi,t (2)
k(q)it =( Kit
Hit−1∗ 100
)
where Rit is the EMBI, LC Bond index, MSCI LC or MSCI USD daily total return, Riskt is
either the RORO Index or the variance risk premium, kit is either equity or debt flows (Kit)
scaled by holdings of the same, Hit−1. We cluster bootstrapped standard errors by country to
account for serially correlated error terms.
9

3 Results
In general, risk-on, risk-off shocks have important implications not only for the median of
emerging market flows and returns, but also for the tails of the distribution. In each case, a
risk-off shock decreases flows and returns across the distribution. In most cases, however, the
“worst” realizations (in the left tail) change more than the median realization, and the “best”
(right tail) realizations change less than the median, lengthening the tails of the distribution
(|β(.05)| > |β(.5)| > |β(.95)|). The sole exception is for equity flows; while they decrease in
the face of a risk-off shock, the tails of the distribution shorten, with the left tail changing less
than the median and the right tail reacting more than the median (|β(.05)| < |β(.5)| < |β(.95)|).
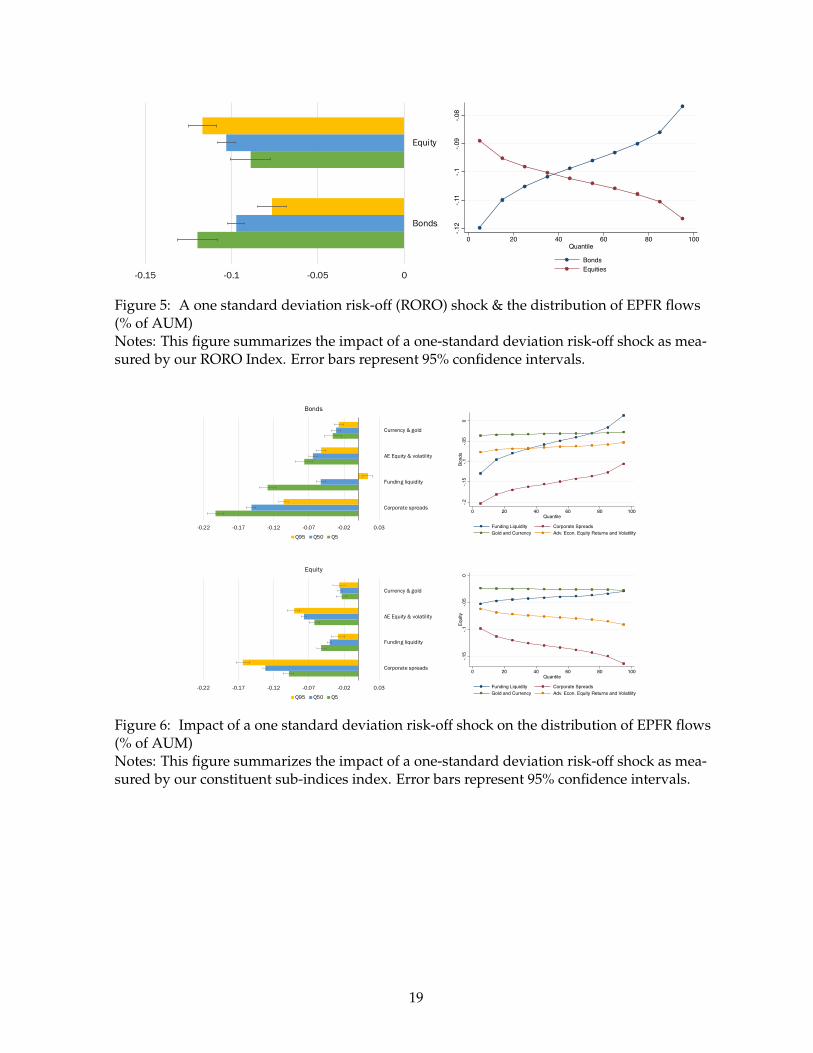
We summarize the results in Figures 5 - 8, while Tables 7 - 8 show the full results. Fig-
ure 5 summarizes the impact of a one standard deviation risk-off shock on the distribution of
our EPFR flow measures and offers an object lesson in the importance of measuring the im-
pact across the distribution. While the risk-off shock affects the median of the distribution in
a similar manner across classes, the tails behave differently. We observe that the risk-off shock
decreases bond outflow realizations in the left tail more than it decreases the median realiza-
tion, and in turn decreases the highest inflow realizations less then the median. The net result
is a leftward shift in the distribution, with a lengthening of the tails relative to the median.
Notably, as we will see in a later exercise, the lengthening in the left tail causes “large” out-
flow realizations in the unconditional distribution to appear more common in the post-shock
distribution.
As aforementioned, the equity flow distribution also shifts to the left in the face of a risk-
off shock; however, the largest outflow realizations change less than the median, while the
largest inflow realizations change more than the median. The net result is a leftward shift in
the distribution, with a shortening of the tails.
Figure 6 summarizes the impact of a one standard deviation risk-off sub-index shock on
the EPFR weekly country flows. In the case of both fixed income and equity, credit risk (as
measured by corporate spreads) appears to play an influential role in both the median impact
and the changes in dispersion from a risk-off shock. Advanced economy equity returns and
volatility also play a substantial role in driving both equity and fixed income reallocations.
10
Most of the subindices follow the patterns induced by the headline index—risk-off shocks
pull the distribution leftward, with tails lengthening in the fixed income flow distribution and
tails shortening in equities. The only exception arises from funding liquidity, a shock which
lengthens the tail of the equity flow distribution. Funding liquidity also contributes substan-
tially to the dispersion of the bond flow distribution, lengthening the left tail while leaving
the right tail essentially unchanged. In both asset classes, our currency factor, while statisti-
cally significant, evinces a comparatively smaller effect.
Figure 7 summarizes the the impact of a one standard deviation RORO shock on the dis-
tribution of fixed income and equity returns. Among all return types, a risk-off shock shifts
the distribution to the left and lengthen the tails, worsening the most negative return realiza-
tions more than the median. The magnitude and dispersion of the impact, however, differs
between fixed income and equity, and between local currency and USD denominated indices.
In particular, a risk-off shock impacts the total return on the equity indices at a rate more than
five times the impact on fixed income returns. In each asset class, dollar returns react more
than local currency returns. Fixed income bears this relationship out strikingly, decreasing
three to six times the rate of the local currency index in the face of the risk off shock.7 MSCI
USD total returns decrease 28 - 32% more than the local currency equity returns in the face of
a risk-off shock.
Figure 8 summarizes the impact of a one standard deviation risk-off sub-index shock on
emerging market returns. As in the case of flows, returns react most, in magnitude and dis-
persion, to changes in credit risk as measured by corporate spreads. However, the impact of
advanced economy equity returns and volatility comes in at a very close second. The cur-
rency factor plays more of a role in moving returns compared to the country flows, with USD
denominated indices reacting more than local currency indices. Also unlike the country flows,
funding liquidity exerts little force on returns whether fixed income or equity.
7While the impact on the local currency index is statistically insignificant, the comparison is still a useful onegiven that USD denominated bonds do react in a statistically significant manner.
11

3.1 Risk Aversion vs. Uncertainty
Turning to a structural decomposition that facilitates a separates of risk aversion from uncer-
tainty reveals an interesting pattern underlying the heterogeneous reactions of the equity and
fixed income distributions. Figure 9 summarizes the changes in the capital flow distributions
when we replace our statistical measures of RORO with Bekaert et al’s (2020) risk aversion
and uncertainty indices.
The impacts of risk aversion and uncertainty on the distribution of fixed income flows
follow the same pattern as our headline RORO measure; that is, a risk-off shock shifts the dis-
tribution to the left and lengthens the tails relative to the median. Interestingly, uncertainty
has a larger impact across the distribution and puts more weight in the left tail compared to
risk aversion.
Equity flows react to risk aversion and uncertainty in a manner which sheds light on the
distribution’s reaction to our statistical risk-off measures. In the fact of an uncertainty shock,
the distribution of equity flows reacts in step with the distribution of bond flows in that the
distribution shifts left, with tails lengthening relative to the median. In contrast, a risk-off
shock to risk aversion causes the equity flow distribution to behave as it does in the base-
line, with the range of the distribution shrinking as it shifts left. This suggests that the reac-
tion we observe in the distributional reaction to the headline index emanates from sensitivity
to changing risk aversion.
Figures 10 and 11 depict the changes in the capital flow distributions when we replace
our statistical measures of risk with Bekaert et al’s (2020) risk aversion and uncertainty in-
dices. Here we observe that a risk-off shock to either risk aversion or uncertainty shift the
distribution of returns to the left. However, changes in the level of uncertainty dramatically
lengthen the tails of the return distribution compared to risk aversion.
12

3.2 Quantitative Exercise
How has the distribution of capital flow realizations changed in the face of COVID-19 shocks?
k̂q = kq + β̂q ∗ shock ∗ H (3)
where k̂q is the estimated flow calculated from fitted values, kq is the qth percentile observed
country flow per week in the data since Jan. 2020, H is the average assets under management,
and shock is the magnitude of either the maximum, one standard deviation, or 10th percentile
shock realization in the COVID era (11.56, 3.1, and 5 units, respectively). Table 10 reveals the
economic magnitudes underlying the parameter values reported in the results.
Starting with bond flows, in the face of a unit shock, the median reallocation is an out-
flow of $14.09 million, compared to a pre-shock 2020 median weekly inflow of $3.7 million.
This size shock increases outflow realizations in the 5th quantile by $22 million per week,
compared to $17.8 million per week at the median. Inflow realizations at the 95th quantile de-
crease by $14.8 million. A one standard deviation shock, 3.1 units, increases outflow realiza-
tion by $68.03 million, compared to a change of $55.2 million at the median and $43.5 million
at the 95th quantile. In the peak observation of the COVID-19 crisis, the index reached 11.56
standard deviations, suggesting that Q5, Q50 and Q95 would fall by $256.7 million, $205.9
million, and $162.14 million respectively. A shock of this size pulls the tail realizations apart
by $92 million.
As aforementioned, equity flows show a shrinking of the tails in the event of a risk-off
shock. After a one unit shock, the median reallocation is an outflow of $18.84, compared to a
pre-shock 2020 median outflow of $5.8 million. This size shock increases outflow realizations
in the 5th quantile by $16.28 million per week, compared to $18.8 million per week at the me-
dian. Inflow realizations at the 95th quantile decrease by $21.4 million. A one standard de-
viation shock, 3.1 units, increases outflow realization by $50.5 million, compared to a change
of $58.4 million at the median and $66.3 million at the 95th quantile. In the peak observation
of the COVID-19 crisis, the index reached 11.56 standard deviations, suggesting that Q5, Q50
and Q95 would fall by $188.2 million, $217.7 million, and $247.3 million respectively. A shock
of this size pulls the tail realizations in by $59 million. Under the peak shock, even the “best”
13

realizations manifest as equity fund outflows.
We also fit a kernel density to the predicted values to visualize changes in the distribu-
tion from a 3-unit risk-off shock, displayed in Figures 14 and 15. We show 3-unit shocks be-
cause this magnitude represents the 10th percentile of risk-off shocks in 2020. The fitted dis-
tribution of fixed income flows has longer tails and is more highly skewed toward outflows
compared to the unconditional distribution (-.61 vs. -1.01). In terms of magnitude, in the face
of a 3-unit shock, what would be a tail event in the unconditional distribution looks more like
a 10th quantile shock, and therefore more probable. The post-shock median now falls in the
bottom 25% of pre-shock realizations. The equity flow distribution appears unchanged in
terms of skewness, although here as well the post-shock median falls in the bottom 25% of
pre-shock realizations.
The return distributions show more dramatic changes still, although the skewness of the
distributions show little change. What the unconditional equity distribution would label a tail
outcome lay near the median in the post-shock distribution. While our RORO shock affects
EMBI returns to a comparatively smaller degree, the pre-shock tail event still falls within the
interquartile range of the unconditional distribution.
4 Conclusion and Future Directions
Risk-on/risk-off shocks have important distributional implications for emerging market port-
folio flows and returns. In particular, we find that the effects associated with the worst real-
izations are often disproportionately affected by risk-off shocks. Specifically, while there are
some differences in the effects across bond vs. equity markets and flows vs. asset returns, the
effects associated with the left tail are generally larger than that on the median realization. We
conclude that the focus in the literature on measures of central tendency is incomplete.
A natural next question for our research agenda: do the implications of a RORO shock
differ across recipient countries? Given that the mutual fund business exhibits significant
variation in manager discretion, the heterogeneity question has two dimensions. The first is
country-level heterogeneity, meaning are the effects of an external RORO shock dispropor-
tionately experienced across countries along important dimensions. Gelos et al. (2019) show
14
that variation in recipient country economic policy and business fundamentals affect capital
flows. In the context of our setting, the question arises whether recipient country conditions
impact fund reallocation in the face of risk-off shocks. In particular, we want to be able to
address the extent to which fund managers view emerging markets as a single asset class or
whether country fundamentals matter for fund allocations.
An important caveat, however, is that the level of discretion fund managers possess varies
considerably across fund type. Representing about half of the emerging market fund space
towards the end of the sample, passive index funds and ETFs have very little manager dis-
cretion. As a consequence, passive index fund and ETF re-allocation in the face of a risk-off
shock may induce elevated correlations among countries and minimize the effect of cross-
country heterogeneity. Actively managed mutual funds, however, enjoy considerable discre-
tion. Country fundamentals may be central to their allocation decision. Going forward, we
will assess the complete effect of tail events on capital flows by closely examining the actual
vehicles that investors use to access emerging markets.
15

References
Bekaert, G., Engstrom, E. C., & Xu, N. R. (2019). The time variation in risk appetite and uncer-tainty. Technical report, National Bureau of Economic Research.
Bekaert, G., Harvey, C. R., & Lundblad, C. (2005). Does financial liberalization spur growth?Journal of Financial economics, 77(1):3–55.
Chari, A. & Henry, P. B. (2004). Risk sharing and asset prices: evidence from a natural experi-ment. The Journal of Finance, 59(3):1295–1324.
Chari, A. & Henry, P. B. (2008). Firm-specific information and the efficiency of investment.Journal of Financial Economics, 87(3):636–655.
Forbes, K. & Warnock, F. (2019). Capital flow waves—or ripples? extreme capital flow move-ments in an era of easy monetary and tight macroprudential policy. Technical report,working paper, MIT.
Forbes, K. J. & Warnock, F. E. (2012). Capital flow waves: Surges, stops, flight, and retrench-ment. Journal of International Economics, 88(2):235–251.
Gelos, G., Gornicka, L., Koepke, R., Sahay, R., & Sgherri, S. (2019). Capital flows at risk: Tam-ing the ebbs and flows.
Henry, P. B. (2007). Capital account liberalization: Theory, evidence, and speculation. Journalof economic Literature, 45(4):887–935.
Jotikasthira, C., Lundblad, C., & Ramadorai, T. (2012). Asset fire sales and purchases and theinternational transmission of funding shocks. The Journal of Finance, 67(6):2015–2050.
Machado, J. A. & Silva, J. S. (2019). Quantiles via moments. Journal of Econometrics, 213(1):145–173.
16

5 Figures & Tables
5.1 Figures
Figure 1: RORO Index
-8-6
-4-2
02
46
810
12R
isk-
on, r
isk-
off I
ndex
(z-s
core
s)
1/1/20
04
1/1/20
06
1/1/20
08
1/1/20
10
1/1/20
12
1/1/20
14
1/1/20
16
1/1/20
18
1/1/20
20
Date
(a) Time Series0
.1.2
.3.4
Den
sity
-8 -6 -4 -2 0 2 4 6 8 10 12Risk-on, risk-off Index (z-scores)
(b) Histogram
Figure 2: BEX 2020 Time Series
-10
12
34
56
78
910
Z-sc
ore
1/1/20
04
1/1/20
06
1/1/20
08
1/1/20
10
1/1/20
12
1/1/20
14
1/1/20
16
1/1/20
18
1/1/20
20
Date
Uncertainty Risk aversion
17

Figure 3: EPFR Country Flows (% of Lagged AUM)
+2sd
-2sd
-50
510
Equi
ty F
low
: Per
cent
of L
agge
d Al
loca
tion
01jan
2004
01jan
2006
01jan
2008
01jan
2010
01jan
2012
01jan
2014
01jan
2016
01jan
2018
01jan
2020
Date
+2sd
-2sd
-10
-50
510
Bond
Flo
w: P
erce
nt o
f Lag
ged
Allo
catio
n
01jan
2004
01jan
2006
01jan
2008
01jan
2010
01jan
2012
01jan
2014
01jan
2016
01jan
2018
01jan
2020
Date
Figure 4: Total Return Indices
020
0040
0060
00In
dex
1/1/20
04
1/1/20
06
1/1/20
08
1/1/20
10
1/1/20
12
1/1/20
14
1/1/20
16
1/1/20
18
1/1/20
20
Date
MSCI LC MSCI USD
100
150
200
250
LC B
onds
200
300
400
500
600
EMBI
1/1/20
04
1/1/20
06
1/1/20
08
1/1/20
10
1/1/20
12
1/1/20
14
1/1/20
16
1/1/20
18
1/1/20
20
Date
EMBI LC Bonds
18
-0.15 -0.1 -0.05 0
Bonds
Equity
-.12
-.11
-.1-.09
-.08
0 20 40 60 80 100Quantile
BondsEquities
Figure 5: A one standard deviation risk-off (RORO) shock & the distribution of EPFR flows(% of AUM)Notes: This figure summarizes the impact of a one-standard deviation risk-off shock as mea-sured by our RORO Index. Error bars represent 95% confidence intervals.
-0.22 -0.17 -0.12 -0.07 -0.02 0.03
Corporate spreads
Funding liquidity
AE Equity & volatility
Currency & gold
Bonds
Q95 Q50 Q5
-.2-.1
5-.1
-.05
0Bo
nds
0 20 40 60 80 100Quantile
Funding Liquidity Corporate SpreadsGold and Currency Adv. Econ. Equity Returns and Volatility
-0.22 -0.17 -0.12 -0.07 -0.02 0.03
Corporate spreads
Funding liquidity
AE Equity & volatility
Currency & gold
Equity
Q95 Q50 Q5
-.15
-.1-.0
50
Equi
ty
0 20 40 60 80 100Quantile
Funding Liquidity Corporate SpreadsGold and Currency Adv. Econ. Equity Returns and Volatility
Figure 6: Impact of a one standard deviation risk-off shock on the distribution of EPFR flows(% of AUM)Notes: This figure summarizes the impact of a one-standard deviation risk-off shock as mea-sured by our constituent sub-indices index. Error bars represent 95% confidence intervals.
19

-1.10 -0.90 -0.70 -0.50 -0.30 -0.10
LC Bonds
EMBI
MSCI
MSCI USD
Q95 Q50 Q5
-1-.8
-.6-.4
-.20
Poin
t est
imat
e: R
etur
ns
0 20 40 60 80 100Quantile
MSCI LC MSCI USDEMBI LC Bond Index
Figure 7: Impact of a one standard deviation risk-off (RORO) shock on the distribution ofreturnsNotes: This figure summarizes the impact of a one-standard deviation risk-off shock as mea-sured by our constituent sub-indices index. Error bars represent 95% confidence intervals.
Figure 8: Impact of a one standard deviation risk-off shock on the distribution of returns
-0.95 -0.75 -0.55 -0.35 -0.15 0.05
Funding Liquidity
Corporate Spreads
AE Equity Returns andVolatility
Gold and Currency
MSCI USD
Q95 Q50 Q5
-0.95 -0.75 -0.55 -0.35 -0.15 0.05
Funding Liquidity
Corporate Spreads
AE Equity Returns andVolatility
Gold and Currency
MSCI LC
Q95 Q50 Q5
-.6-.4
-.20
MSC
I LC
Ret
urn
0 20 40 60 80 100Quantile
-.8-.6
-.4-.2
0M
SCI U
SD R
etur
n
0 20 40 60 80 100Quantile
Funding Liquidity Corporate SpreadsAdv. Econ. Equity Returns and Volatility Gold and Currency
-0.30 -0.20 -0.10 0.00
Funding Liquidity
Corporate Spreads
AE Equity Returns andVolatility
Gold and Currency
EMBI
Q95 Q50 Q5
-0.30 -0.20 -0.10 0.00
Funding Liquidity
Corporate Spreads
AE Equity Returns andVolatility
Gold and Currency
LC Bonds
Q95 Q50 Q5
-.25
-.2-.1
5-.1
-.05
0EM
BI R
etur
n
0 20 40 60 80 100Quantile
-.06
-.04
-.02
0LC
Bon
d R
etur
n
0 20 40 60 80 100Quantile
Funding Liquidity Corporate SpreadsAdv. Econ. Equity Returns and Volatility Gold and Currency
20

-.8-.6
-.4-.2
Bond
flow
s
0 20 40 60 80 100Quantile
-.23
-.22
-.21
-.2-.1
9-.1
8Eq
uity
flow
s
0 20 40 60 80 100Quantile
Log Risk AversionLog Uncertainty
(a) Log levels
-.08
-.07
-.06
-.05
-.04
-.03
Bond
flow
s
0 20 40 60 80 100Quantile
-.08
-.06
-.04
-.02
0Eq
uity
flow
s
0 20 40 60 80 100Quantile
Log Diff Risk AversionLog Diff Uncertainty
(b) Log differences
Figure 9: Impact of a one standard deviation risk-off (BEX 2020) shock on the distribution ofEPFR country flows
-.6-.4
-.20
.2.4
Loca
l Cur
renc
y R
etur
n
0 20 40 60 80 100Quantile
-1.5
-1-.5
0.5
1U
SD R
etur
n
0 20 40 60 80 100Quantile
Log Risk AversionLog Uncertainty
-.6-.4
-.20
.2Lo
cal C
urre
ncy
Ret
urn
0 20 40 60 80 100Quantile
-2-1
.5-1
-.50
.5U
SD R
etur
n0 20 40 60 80 100
Quantile
Log Diff Risk AversionLog Diff Uncertainty
Figure 10: Impact of a one standard deviation risk-off (BEX 2020) shock on the distribution offixed income returns
-3-2
-10
12
Loca
l Cur
renc
y R
etur
n
0 20 40 60 80 100Quantile
-4-2
02
USD
Ret
urn
0 20 40 60 80 100Quantile
Log Risk AversionLog Uncertainty
-6-5
-4-3
-2-1
Loca
l Cur
renc
y R
etur
n
0 20 40 60 80 100Quantile
-8-6
-4-2
0U
SD R
etur
n
0 20 40 60 80 100Quantile
Log Diff Risk AversionLog Diff Uncertainty
Figure 11: Impact of a one standard deviation risk-off (BEX 2020) shock on the distribution ofequity returns
21

Figure 12: Emerging market capital flows in recent risk-off episodes
-45
-40
-35
-30
-25
-20
-15
-10
-5
0 tt+
7t+
14t+
21t+
28t+
35t+
42t+
49t+
56t+
63t+
70t+
77t+
84t+
91t+
98t+
105
t+11
2t+
119
t+12
6t+
133
GFC
Taper tantrum
China scare
COVID-19
(a) Equity flows (Billions USD)
-60
-50
-40
-30
-20
-10
0
10
tt+
7t+
14t+
21t+
28t+
35t+
42t+
49t+
56t+
63t+
70t+
77t+
84t+
91t+
98t+
105
t+11
2t+
119
t+12
6t+
133
GFCTaper tantrumChina scareCOVID-19
(b) Bond flows (Billions USD)
Figure 13: Emerging market returns in recent risk-off episodes
40
50
60
70
80
90
100
110
tt+
4t+
8t+
12t+
16t+
20t+
24t+
28t+
32t+
36t+
40t+
44t+
48t+
52t+
56t+
60t+
64t+
68t+
72t+
76t+
80t+
84t+
88
GFCTaper tantrumChina scareCOVID-19
(a) MSCI USD
70
75
80
85
90
95
100
105
110t
t+4
t+8
t+12
t+16
t+20
t+24
t+28
t+32
t+36
t+40
t+44
t+48
t+52
t+56
t+60
t+64
t+68
t+72
t+76
t+80
t+84
t+88
GFCTaper tantrumChina scareCOVID-19
(b) EMBI
40
50
60
70
80
90
100
110
tt+
4t+
8t+
12t+
16t+
20t+
24t+
28t+
32t+
36t+
40t+
44t+
48t+
52t+
56t+
60t+
64t+
68t+
72t+
76t+
80t+
84t+
88
GFCTaper tantrumChina scareCOVID-19
(c) MSCI LC
99
99.2
99.4
99.6
99.8
100
100.2
100.4
100.6
100.8
tt+
4t+
8t+
12t+
16t+
20t+
24t+
28t+
32t+
36t+
40t+
44t+
48t+
52t+
56t+
60t+
64t+
68t+
72t+
76t+
80t+
84t+
88
GFCTaper tantrumChina scareCOVID-19
(d) Local currency Bond Index
22
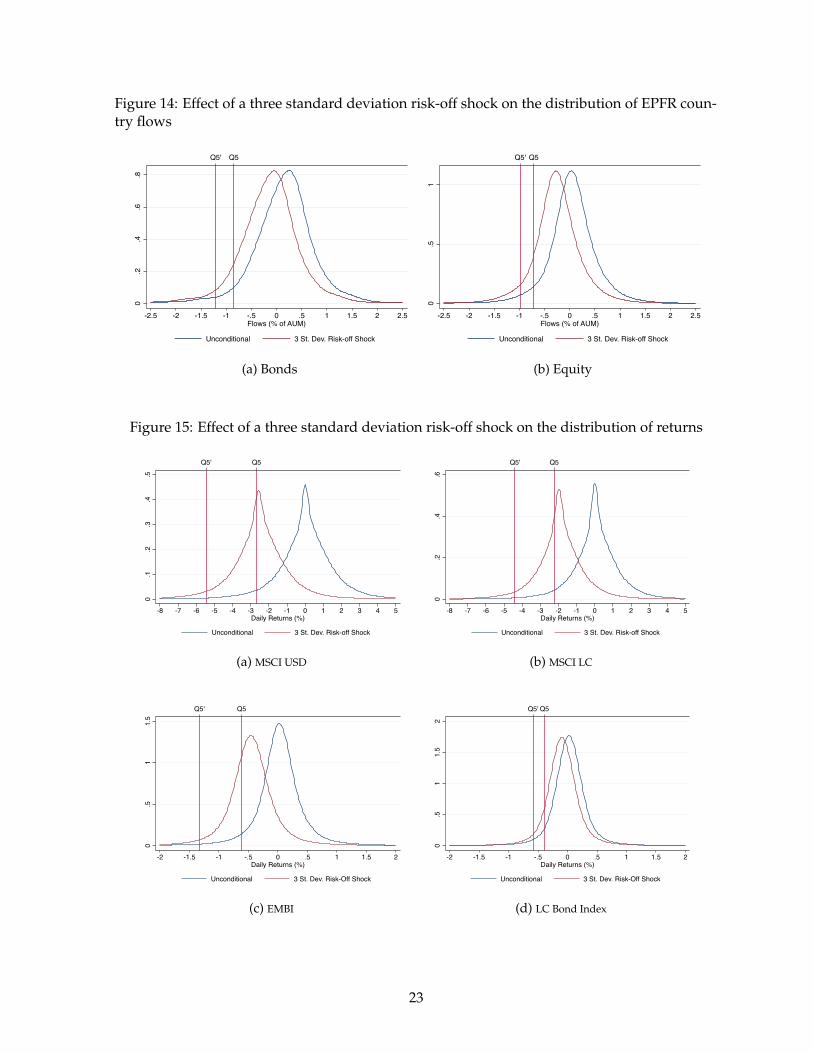
Figure 14: Effect of a three standard deviation risk-off shock on the distribution of EPFR coun-try flows
0.2
.4.6
.8
Q5Q5'
-2.5 -2 -1.5 -1 -.5 0 .5 1 1.5 2 2.5Flows (% of AUM)
Unconditional 3 St. Dev. Risk-off Shock
(a) Bonds
0.5
1
Q5Q5'
-2.5 -2 -1.5 -1 -.5 0 .5 1 1.5 2 2.5Flows (% of AUM)
Unconditional 3 St. Dev. Risk-off Shock
(b) Equity
Figure 15: Effect of a three standard deviation risk-off shock on the distribution of returns
0.1
.2.3
.4.5
Q5Q5'
-8 -7 -6 -5 -4 -3 -2 -1 0 1 2 3 4 5Daily Returns (%)
Unconditional 3 St. Dev. Risk-off Shock
(a) MSCI USD
0.2
.4.6
Q5Q5'
-8 -7 -6 -5 -4 -3 -2 -1 0 1 2 3 4 5Daily Returns (%)
Unconditional 3 St. Dev. Risk-off Shock
(b) MSCI LC
0.5
11.
5
Q5Q5'
-2 -1.5 -1 -.5 0 .5 1 1.5 2Daily Returns (%)
Unconditional 3 St. Dev. Risk-Off Shock
(c) EMBI
0.5
11.
52
Q5Q5'
-2 -1.5 -1 -.5 0 .5 1 1.5 2Daily Returns (%)
Unconditional 3 St. Dev. Risk-Off Shock
(d) LC Bond Index
23

5.2 Tables
Table 1: Headline RORO Index and Subcomponents Summary Statistics
Q5 Q50 Q95 Skewness KurtosisRORO Index -1.29 -0.06 1.47 1.57 20.98Funding Liquidity -0.99 0.00 0.97 -0.19 47.48AE Equity Returns/Volatility -1.30 -0.06 1.48 1.21 19.81Gold and Currencies -1.70 -0.02 1.73 0.14 5.78Corporate Spreads -1.22 -0.06 1.27 1.74 30.68Observations 4517
Table 2: BEX 2020 Summary Statistics
Q5 Q50 Q95 Skewness KurtosisLog Risk Aversion -0.60 -0.29 1.34 4.58 33.52Log Uncertainty -0.27 0.43 1.54 1.16 5.09Log Diff. Risk Aversion -0.21 -0.00 0.21 0.03 112.09Log Diff. Uncertainty -0.09 -0.00 0.10 1.36 30.86Observations 4330
Table 3: Sub-indices: Correlations Matrix
RORO AE Equity and Vol. Corporate spreads Funding liquidity Currency and gold log(RA) log(Uncertainty) ∆ log(RA) ∆ log(Uncertainty)
RORO 1.00AE Equity and Vol. 0.95 1.00Corporate spreads 0.83 0.63 1.00Funding liquidity 0.29 0.26 0.22 1.00Currency and gold 0.32 0.30 0.15 -0.12 1.00log(RA) 0.28 0.17 0.40 0.00 0.02 1.00log(Uncertainty) 0.03 -0.01 0.11 -0.06 -0.04 0.72 1.00∆ log(RA) 0.70 0.80 0.38 0.28 0.24 -0.01 -0.12 1.00∆ log(Uncertainty) 0.70 0.68 0.60 0.19 0.11 0.22 0.07 0.55 1.00
24

Table 4: Summary Statistics
(a) EPFR Country Flows
Mean St. Dev. Q5 Q50 Q95 Skewness KurtosisEquity Flow: % of Lagged AUM 0.05 0.49 -0.71 0.04 0.81 0.76 21.93Equity Flows (Millions USD) 6.52 117.79 -124.53 1.19 161.34 0.22 38.56Equity AUM (Billions USD) 18.64 27.13 0.39 6.42 82.84 2.23 7.88Bond Flow: % of Lagged AUM 0.14 0.69 -0.85 0.18 1.08 -1.01 20.39Bonds Flows (Millions USD) 6.37 85.76 -63.06 1.98 93.64 -18.46 862.13Bonds AUM (Billions USD) 8.15 10.75 0.08 3.91 35.14 2.03 7.04Observations 18474
(b) Returns
Mean St. Dev. Q5 Q50 Q95 Skewness KurtosisMSCI LC Return 0.04 1.53 -2.23 0.00 2.26 -0.39 21.07MSCI USD Return 0.04 1.79 -2.68 0.00 2.63 -0.37 17.81EMBI Return 0.02 0.62 -0.62 0.02 0.66 -5.11 316.02LC Bond Return 0.03 0.57 -0.39 0.02 0.47 0.55 1389.67Observations 92202
Table 5: Sample Countries
Argentina PakistanBrazil PeruChile PhilippinesColombia PolandCzech Republic QatarEgypt RussiaHungary South AfricaIndia Taiwan*Indonesia Thailand**Malaysia TurkeyMexico United Arab Emirates
* Indicates eventual exclusion from EMBI,returns extended using S&P Bond Index.
25

Table 6: Control Variables Summary Statistics
Mean St. Dev. Q5 Q50 Q95BIS Policy Rate (t-1) 6.39 6.12 1.00 5.00 15.00Adv. Market Return 0.02 0.31 -0.51 0.02 0.49Avg. RGDP Growth (8Q) 0.04 0.03 -0.00 0.04 0.09Emerging Mkt. News -0.01 2.81 -4.10 0.00 4.10Exchange rate return -0.00 1.53 -0.87 0.00 0.93REER Growth 0.05 2.12 -3.09 0.14 2.87Observations 92998
Table 7: A one standard deviation risk-off (RORO) shock & the distribution of bond flows
(1) (2) (3) (4) (5)Q5 Q25 Q50 Q75 Q95
RORO Index -0.120∗∗∗ -0.105∗∗∗ -0.0974∗∗∗ -0.0900∗∗∗ -0.0767∗∗∗
(-10.41) (-15.92) (-19.76) (-18.07) (-9.24)
Policy Rate (t-1) -0.00150 -0.000429 0.000141 0.000678 0.00166(-0.15) (-0.12) (0.11) (0.19) (0.17)
REER (t-1) -0.00189 -0.000901 -0.000377 0.000118 0.00102(-0.78) (-0.95) (-0.76) (0.13) (0.45)
Avg. RGDP Growth (8Q) -0.0571 0.163 0.280 0.390 0.591(-0.07) (0.43) (0.95) (1.06) (0.84)
Emerging Mkt. News 0.00527∗ -0.00620∗∗∗ -0.0123∗∗∗ -0.0180∗∗∗ -0.0285∗∗∗
(1.93) (-4.04) (-11.33) (-15.30) (-13.49)
Adv. Mkt. Index (t-1) -0.0256∗∗∗ -0.0148∗∗∗ -0.00901∗∗∗ -0.00359∗∗∗ 0.00628∗∗∗
(-5.32) (-5.92) (-7.00) (-5.04) (2.72)
AR(1) 0.503∗∗∗ 0.429∗∗∗ 0.389∗∗∗ 0.352∗∗∗ 0.284∗∗∗
(12.18) (14.64) (15.00) (14.22) (9.76)Observations 17680 17680 17680 17680 17680t statistics in parentheses+ p < 0.15, ∗ p < 0.10, ∗∗ p < 0.05, ∗∗∗ p < 0.01
Notes: This table summarizes the results of quantile regressions of EPFR country bond flows on ourheadline RORO index. Bootstrapped standard errors are clustered by country. *, **, and *** denotestatistical significance at the 10%, 5%, and 1% levels, respectively.
26

Table 8: A one standard deviation risk-off (RORO) shock & the distribution of equity flows
(1) (2) (3) (4) (5)Q5 Q25 Q50 Q75 Q95
RORO Index -0.0890∗∗∗ -0.0981∗∗∗ -0.103∗∗∗ -0.108∗∗∗ -0.117∗∗∗
(-15.20) (-29.43) (-33.65) (-28.18) (-17.72)
Policy Rate (t-1) -0.0000549 0.000324 0.000531 0.000726 0.00109(-0.01) (0.14) (0.30) (0.43) (0.43)
REER (t-1) -0.000532 -0.000789∗∗ -0.000930∗∗ -0.00106+ -0.00131(-0.66) (-2.09) (-2.06) (-1.54) (-1.06)
Avg. RGDP Growth (8Q) -0.848 0.00202 0.467∗∗ 0.904∗∗ 1.714∗∗
(-1.34) (0.01) (2.38) (2.31) (2.07)
Emerging Mkt. News -0.0242∗∗∗ -0.0194∗∗∗ -0.0167∗∗∗ -0.0142∗∗∗ -0.00964∗∗∗
(-7.58) (-12.30) (-13.72) (-9.18) (-3.05)
Adv. Mkt. Index (t-1) -0.0141∗∗∗ -0.00457∗∗∗ 0.000633 0.00552∗∗∗ 0.0146∗∗∗
(-7.18) (-4.27) (0.51) (2.99) (4.64)
AR(1) 0.275∗∗∗ 0.305∗∗∗ 0.322∗∗∗ 0.338∗∗∗ 0.367∗∗∗
(4.92) (9.27) (11.26) (10.22) (6.70)Observations 17732 17732 17732 17732 17732t statistics in parentheses+ p < 0.15, ∗ p < 0.10, ∗∗ p < 0.05, ∗∗∗ p < 0.01
Notes: This table summarizes the results of quantile regressions of EPFR country equity flows on ourheadline RORO index. Bootstrapped standard errors are clustered by country. *, **, and *** denotestatistical significance at the 10%, 5%, and 1% levels, respectively.
27

Table 9: A one standard deviation risk-off (RORO) shock & the distribution of USD equityreturns
(1) (2) (3) (4) (5)Q5 Q25 Q50 Q75 Q95
Risk-on, Risk-off Index -0.925∗∗∗ -0.883∗∗∗ -0.860∗∗∗ -0.837∗∗∗ -0.795∗∗∗
(-11.36) (-9.92) (-9.26) (-8.59) (-7.42)
Exchange rate return (t-1) -0.0326 -0.0147 -0.00517 0.00481 0.0227(-0.41) (-0.37) (-0.24) (0.24) (0.41)
BIS Policy Rate (t-1) -0.0302∗∗∗ -0.00983∗∗∗ 0.00108 0.0125∗ 0.0329∗∗
(-3.15) (-2.95) (0.30) (1.80) (2.33)
Emerging Mkt. News 0.0140∗∗∗ 0.00559∗∗∗ 0.00110 -0.00359 -0.0120∗∗∗
(5.27) (3.55) (0.60) (-1.39) (-2.72)
Adv. market index (t-1) -0.0358∗∗∗ -0.0184∗∗∗ -0.00912∗∗∗ 0.000609 0.0180∗∗∗
(-5.13) (-5.95) (-4.58) (0.23) (2.87)Observations 89536 89536 89536 89536 89536t statistics in parentheses+ p < 0.15, ∗ p < 0.10, ∗∗ p < 0.05, ∗∗∗ p < 0.01
Notes: This table summarizes the results of quantile regressions of MSCI USD daily total returnson our headline RORO index. Bootstrapped standard errors are clustered by country. *, **, and ***denote statistical significance at the 10%, 5%, and 1% levels, respectively.
28

Table 10: A one standard deviation risk-off (RORO) shock & the distribution of local cur-rency equity returns
(1) (2) (3) (4) (5)Q5 Q25 Q50 Q75 Q95
Risk-on, Risk-off Index -0.720∗∗∗ -0.681∗∗∗ -0.661∗∗∗ -0.640∗∗∗ -0.601∗∗∗
(-12.28) (-10.60) (-9.83) (-9.03) (-7.56)
Exchange rate return (t-1) -0.0134 -0.00544 -0.00132 0.00302 0.0110(-0.28) (-0.26) (-0.16) (0.25) (0.28)
BIS Policy Rate (t-1) -0.0264∗∗ -0.00915∗ -0.000225 0.00918∗∗∗ 0.0266∗∗∗
(-2.17) (-1.65) (-0.09) (3.32) (2.90)
Emerging Mkt. News 0.0122∗∗∗ 0.00455∗∗∗ 0.000602 -0.00355+ -0.0112∗∗∗
(5.03) (3.08) (0.37) (-1.60) (-2.94)
Adv. market index (t-1) -0.0300∗∗∗ -0.0145∗∗∗ -0.00638∗∗∗ 0.00212 0.0178∗∗∗
(-4.43) (-4.72) (-3.05) (0.77) (2.85)Observations 89557 89557 89557 89557 89557t statistics in parentheses+ p < 0.15, ∗ p < 0.10, ∗∗ p < 0.05, ∗∗∗ p < 0.01
Notes: This table summarizes the results of quantile regressions of MSCI LC daily total returnson our headline RORO index. Bootstrapped standard errors are clustered by country. *, **, and ***denote statistical significance at the 10%, 5%, and 1% levels, respectively.
29

Table 11: A one standard deviation risk-off (RORO) shock & the distribution of USD bondreturns
(1) (2) (3) (4) (5)Q5 Q25 Q50 Q75 Q95
Risk-on, Risk-off Index -0.238∗∗∗ -0.184∗∗∗ -0.161∗∗∗ -0.139∗∗∗ -0.0908∗∗∗
(-5.45) (-4.83) (-4.42) (-3.95) (-2.74)
Exchange rate return (t-1) -0.0739∗∗∗ -0.0362∗∗∗ -0.0207∗∗∗ -0.00543 0.0275∗∗
(-3.20) (-3.35) (-2.83) (-0.86) (1.99)
BIS Policy Rate (t-1) -0.0145∗ -0.00487∗∗∗ -0.000866 0.00305 0.0115(-1.79) (-3.30) (-0.53) (0.71) (1.11)
Emerging Mkt. News 0.00768∗∗∗ 0.00287∗∗∗ 0.000883 -0.00106 -0.00527∗∗∗
(7.81) (3.83) (1.01) (-0.95) (-2.98)
Adv. market index (t-1) -0.00900∗ -0.00479∗∗ -0.00305∗∗∗ -0.00134 0.00234(-1.73) (-2.47) (-3.09) (-1.04) (0.59)
Observations 76240 76240 76240 76240 76240t statistics in parentheses+ p < 0.15, ∗ p < 0.10, ∗∗ p < 0.05, ∗∗∗ p < 0.01
Notes: This table summarizes the results of quantile regressions of EMBI daily total returns on ourheadline RORO index. Bootstrapped standard errors are clustered by country. *, **, and *** denotestatistical significance at the 10%, 5%, and 1% levels, respectively.
30

Table 12: A one standard deviation risk-off (RORO) shock & the distribution of local cur-rency bond returns
(1) (2) (3) (4) (5)Q5 Q25 Q50 Q75 Q95
Risk-on, Risk-off Index -0.0640∗∗∗ -0.0455∗∗∗ -0.0397∗∗∗ -0.0331∗∗∗ -0.0157(-3.57) (-3.84) (-3.72) (-3.22) (-1.21)
Exchange rate return (t-1) -0.0672∗∗ -0.0322∗∗∗ -0.0211∗∗ -0.00851 0.0244(-2.28) (-2.86) (-2.31) (-1.17) (1.29)
BIS Policy Rate (t-1) -0.0381∗∗∗ -0.0100∗∗∗ -0.00107 0.00901∗ 0.0354∗∗∗
(-3.33) (-3.02) (-0.30) (1.73) (3.06)
Emerging Mkt. News 0.00148 -0.00213∗ -0.00329∗∗ -0.00458∗∗∗ -0.00798∗∗
(0.81) (-1.85) (-2.51) (-2.77) (-2.25)
Adv. market index (t-1) -0.00743∗∗∗ -0.00104 0.000999 0.00329∗∗∗ 0.00930∗∗∗
(-2.68) (-0.95) (1.36) (3.44) (3.06)Observations 51714 51714 51714 51714 51714t statistics in parentheses+ p < 0.15, ∗ p < 0.10, ∗∗ p < 0.05, ∗∗∗ p < 0.01
Notes: This table summarizes the results of quantile regressions of local currency daily total returnson our headline RORO index. Bootstrapped standard errors are clustered by country. *, **, and ***denote statistical significance at the 10%, 5%, and 1% levels, respectively.
Table 13: Effect of a COVID-era risk-off shock on the distribution of country EPFR flows
Panel A: Bonds Q5 Q50 Q95 Panel B: Equity Q5 Q50 Q95
Observed flows -473.56 3.73 178.13 Observed flows -258.62 -5.79 109.69
β (unconditional)σ = 1 % of AUM/week -0.12 -0.10 -0.08 % of AUM/week -0.09 -0.10 -0.12
Millions USD -495.50 -14.09 164.11 Millions USD -274.90 -24.62 88.30
β*Covid1Stdevσ = 3.1 % of AUM/week -0.37 -0.30 -0.24 % of AUM/week -0.28 -0.32 -0.36
Millions USD -541.59 -51.49 134.65 Millions USD -309.08 -64.18 43.36β*CovidPeak
σ = 11.56 % of AUM/week -1.39 -1.13 -0.89 % of AUM/week -1.03 -1.19 -1.35Millions USD -727.24 -202.18 15.99 Millions USD -446.77 -223.53 -137.65
31