capital consolidation for personal use only · 2008. 4. 28. · resources and then discovering...
TRANSCRIPT

CapitalConsolidationConsolidation
Sino Gold Mining LimitedAnnual Report 2007
(STOCK CODE: ASX: SGX, SEHK: 1862)
For
per
sona
l use
onl
y

2
contentsHighlights 2Summary - Growth Profi le 3Chairman’s Report 4CEO’s Report 6Board of Directors 8Risk Management 10Finance 12Sino Gold Projects 13Jinfeng Mine 14Jinfeng Exploration 16White Mountain 19Beyinhar 22Eastern Dragon 24Biogold 25Sino Gold Exploration 26Mineral Resources & Ore Reserves 30Financials 33Additional Stock Exchange Information 103
People are the heart of our Company and therefore it is appropriate that the Chinese character for people ‘ ‘ is at the centre of our logo. The colouring refl ects the product we produce and sell.The stars on the middle section represents the “Southern Cross” constellation which is visible in the night sky from Australia. This refl ects the Company’s relationship and link with Australia.
For
per
sona
l use
onl
y

3
visionTo be the largest and most profi table, sustainable producer of gold in China
valuesEnsure health and safety is always the priority
Look after and protect the environmentCommitted to superior performance and exceeding expectations
Respect our differences to combine our strengthsUnderstand and contribute to the broader community in which we operate
Operate and communicate in a lawful, honest and open manner
China’s gold industry will benefi t from increasing access to capital, consolidation of smaller mines and better outcomes for the community
For
per
sona
l use
onl
y

2
highlights
In 2007, Sino Gold consolidated its position as the leading foreign gold company in China.
JINFENG• Commercial gold production commenced in September 2007• Gold production of 56,981 ounces for the year• Ore Reserves increased to 3.2 million ounces• Mineral Resources increased to 4.6 million ounces• Jinfeng gold deposit remains open down plunge and at depth
WHITE MOUNTAIN• Development commenced in August 2007• Commissioning on-track to commence in late 2008• Ore Reserves increased to 0.8 million ounces• Mineral Resources increased to 1.2 million ounces• Mine life extended to greater than ten years
EXPLORATION• Sino Gold Fields Alliance commenced exploration for >5 million
ounce deposits• Gold discovery at Yandan Prospect in Guangxi Province• Largest gold exploration program in China
CORPORATE• Take-over of Golden China Resources Corporation completed, which
added the Beyinhar and Nibao resources to Sino Gold’s portfolio• Acquired 72% of high-grade Eastern Dragon gold-silver deposit• First ASX-listed company to list on Hong Kong Stock Exchange
Sino Gold now has a clear pathway to produce 500,000 ounces of low-cost gold annually by 2010.
For
per
sona
l use
onl
y

A n n u a l R e p o r t 2 0 0 7
3
250,000ounces
Known growth over coming 2-3
years
Summary - Growth Profi le
500,000ounces
For
per
sona
l use
onl
y

4
2007 was a landmark year for Sino Gold Mining Limited as our fl agship Jinfeng Mine commenced gold production and a clear path was put in place for the Company to achieve the objective of producing 500,000 ounces of low-cost gold annually by 2010.
Sino Gold is uniquely positioned with the gold price continuing to set new records and China being increasingly acknowledged as an attractive mining destination by the international investment community.
China’s gold production is growing rapidly and is set to become the dominant gold producing country in the world in 2008. Sino Gold is the leading foreign gold company in China.
The offi cial opening ceremony for the Jinfeng Mine was held in April 2007. Sino Gold was honoured by the attendance at the ceremony of the Australian Ambassador to China, Dr Geoff Raby, as well as a number of senior Chinese government offi cials.
China’s gold industry will continue to fl ourish as positive results fl ow from key recent industry trends of increasing access to capital, consolidation of smaller mines and better outcomes for the surrounding communities.
Capital
China’s transition to a market economy has begun to provide the country’s gold industry with better access to capital. Several of the larger Chinese gold producing companies are now publicly listed in Hong Kong or Shanghai.
However, China’s share market does not appear to value exploration yet so there are not any publicly listed local exploration companies. China’s exploration companies currently must access capital by entering into joint ventures with companies such as Sino Gold who can bring funding to evaluate their exploration licences.
Our ability to access capital markets in an effi cient manner has enabled Sino Gold to:• develop our Jinfeng Mine in a manner that maximises
the value of the resource for all stakeholders;• commence development of our White Mountain
Mine quickly;• take advantage of acquisition opportunites; and• maintain the largest gold exploration program in China.
Sino Gold raised A$237 million in equity during 2007. This access to capital has underpinned the Company’s ability to take advantage of being a “fi rst mover” in China and to grow rapidly.
Consolidation
The consolidation of China’s gold industry is another outcome of China’s transition to a market economy. The government is actively encouraging consolidation of the gold sector and the closure of unsafe, environmentally challenged, smaller mines.
Sino Gold’s successful combination of strong emphasis on the cultural interface, technical skills and fi nancial strength has led to the Company being viewed as a partner of choice for opportunities in the country. This will help ensure that we continue to be well placed to play a leading role in the rapidly consolidating gold industry and allow us to continue to expand our exploration portfolio and evaluate potential acquisition opportunities in China.
Sino Gold’s success has provided a critical mass to effectively explore, develop and operate mines in China, with approximately 800 employees and 800 contractors currently.
Sino Gold made two signifi cant acquisitions during 2007, Golden China Resources Corporation and Eastern Dragon. Both of these acquisitions provide identifi ed resources that can quickly be advanced towards becoming our next mines in prospective, under-explored districts.
Chairman’s ReportChairman
Jim Askew
For
per
sona
l use
onl
y

A n n u a l R e p o r t 2 0 0 7
5
Opportunities tend to fl ow towards established operators in a mining district. Sino Gold aims to add signifi cant value by adding to its ground position near its identifi ed resources and then discovering further resources nearby that would signifi cantly enhance mine economics.
Community
Consolidation leads to larger, more effi cient mining operations which provide various benefi ts to the community:• better safety and environmental practices;• access to employment and training opportunities;• additional taxes to local government; and• improved infrastructure, eg – schools, roads, power.
Our approach is to develop gold mines in a manner which provides long-term benefi ts to all stakeholders and optimises the returns from the gold resources. The Company’s management of safety, the environment and community relationships continues at the highest standards and we recognize that our continuing performance in these areas is crucial to our long-term success in China.
These issues are also increasingly important to China’s government, which recognizes their importance to the country’s health, stability and economic growth.
Conclusion
Sino Gold’s quality assets and competitive, strategic position in China is being recognised by investors and others as it grows into a signifi cant gold producing company.
Management is focussed on ensuring that the 2008 production goals for Jinfeng are achieved, leading to generation of strong profi ts and cash fl ow. Jinfeng is an outstanding orebody with excellent geological continuity and further exploration potential, and will provide the platform for the Company’s continued growth.
Development of the White Mountain, Beyinhar and Eastern Dragon projects is targeted to provide the Company with four mines producing 500,000 ounces by 2010.
I would like to thank Gold Fields Limited for their continued support during the year and notably their participation in share placements to maintain their ownership at approximately 15% of the Company. The 50:50 strategic alliance to explore for gold deposits containing more than 5 million ounces provides another exciting dimension to Sino Gold’s strategy. The Company’s long-term relationship with Gold Fields provides an indication of their belief in the quality of our people, gold assets and strategy in China.
A valuable asset of the Company is the team’s experience as an explorer, developer and operator of gold mines in China. Our people are integral to this success and their efforts are greatly appreciated.
On behalf of all shareholders, I would like to thank Jake Klein and his management team for their efforts and success during the year.
Sino Gold is very well positioned to capitalise on the enormous opportunity presented by China’s prospectivity and rapidly evolving gold industry. We look forward to your continuing support as shareholders as we turn this to account and deliver on our goals in 2008.
Jim AskewChairman
Stamping Jinfeng gold dore bar Australian Ambassador to China, Dr Geoff Raby, and the Vice
Chairman of the Guizhou Provincial Congress, Mr Xu Zhengwei
For
per
sona
l use
onl
y

6
Sino Gold made great strides during 2007 towards achieving our vision of becoming China’s largest, lowest cost gold producer.
Our fl agship Jinfeng Mine commenced gold production during 2007 and was approaching design throughput levels towards the end of the year. The operating experience we gain over the coming year should enable us to determine the optimal level of increased gold production that will maximise Jinfeng’s value.
Jinfeng is destined to be a long-life mine as Ore Reserves and Mineral Resources were again increased during 2007 to 3.2 million ounces and 4.6 million ounces, respectively.
We were able to quickly progress White Mountain into development during 2007 and the project remains on-schedule and on-budget to commence commissioning of the processing plant in late 2008. Ore Reserves were recently doubled to 0.8 million ounces and provide White Mountain with a mine life of at least 10 years.
A key goal for 2007 was to secure another major gold project to be developed after Jinfeng and White Mountain. The acquisitions of Golden China Resources Corporation and Eastern Dragon have put in place a clear path for the Company to produce 500,000 ounces of low-cost gold annually by 2010.
During 2007, Sino Gold spent US$15 million on exploration and completed approximately 90,000m of diamond drilling - the largest gold exploration program in China. Continued drilling success and acquisitions led to gold resources under the Company’s control increasing to 7.6 million ounces (on a 100% basis).
A review of the key goals set out in Sino Gold’s 2006 Annual Report highlights the signifi cant progress the Company has made.
2007 Goal 1: Commission Jinfeng successfully and establish the operation as a major, low-cost gold mine
The Jinfeng Gold Mine is the largest investment in China’s mining industry by a foreign company and will soon be China’s second largest gold mine.
Construction of the processing plant was completed in March 2007. By the end of the year, all areas of the processing plant were performing well. A key focus for 2008 is ensuring that the plant operates consistently and fl otation recoveries are increased to design levels.
Mining of the open pit proceeded on plan during 2007 and development of the underground mine progressed well over the second half of 2007. Initial ore stopes will be mined in the second half of 2008 and higher grade ore from the underground mine will provide an increasing proportion of mill feed from 2009 onwards.
Now that a large, modern processing facility has been built, Jinfeng is well positioned to generate strong cash fl ow and profi ts and quickly turn nearby discoveries into additional gold production.
2007 Goal 2: Progress White Mountain into development by obtaining required approvals
White Mountain continues to progress very quickly and Sino Gold’s Board approved a US$55 million development in August 2007. Planned gold production is approximately 70,000 ounces per annum.
Sino Gold is managing the development with an in-house team fl uent in Mandarin, many of whom were involved with developing the Company’s Jinfeng and Jianchaling Mines.
The White Mountain processing plant will be built with Chinese equipment utilising standard Chinese designs. White Mountain is located close to infrastructure in an established mining district.
White Mountain is shaping up as a robust, simple underground mining operation and is on-track for commissioning of the processing plant to commence in late 2008.
CEO’s ReportCEO Jake Klein
For
per
sona
l use
onl
y

A n n u a l R e p o r t 2 0 0 7
7
2007 Goal 3: Advance another property towards development by making a signifi cant discovery or acquisition
Our expectations for 2007 were exceeded with two acquisitions that provide projects with identifi ed resources that can be quickly advanced into development.
In January 2008, Sino Gold completed the friendly take-over of Golden China Resources Corporation. Golden China’s key assets are the Beyinhar project in Inner Mongolia, the Nibao project in Guizhou Province and the BioGold processing facility in Shandong Province.
The Beyinhar project is the most advanced with a Chinese Feasibility Study completed and permitting of a heap-leach “starter” operation in progress. Sino Gold is targeting to commence construction of a heap-leach operation at Beyinhar during 2008, as well as drilling to extend the oxide resource and test the potential for deeper, higher grade sulphide mineralisation.
In December 2007, Sino Gold entered into agreements to acquire an effective 72% interest in the Eastern Dragon Lode 5 gold-silver deposit in northern China’s Heilongjiang Province at a cost of US$90 million. Sino Gold has also secured an exclusive right to acquire up to 80% of the surrounding Exploration Licence for a price to be determined during 2008.
Eastern Dragon Lode 5 is a high-grade, low-sulphidation epithermal gold-silver deposit which has been tested by extensive trenching, diamond drilling and underground development. During 2008, Sino Gold intends to evaluate and rapidly progress Lode 5 towards development.
Our Project Generation group is comprised of three regional teams - Golden Triangle, Northern China and Shandong Province. These teams explore our existing tenements and also evaluate further acquisitions in each region. This regional approach develops the local knowledge and relationships which are key to effectively exploring in China.
In addition, Sino Gold’s 50:50 strategic alliance with Gold Fields Limited has the aim of discovering gold deposits containing more than 5 million gold-equivalent ounces. During 2007, this new group identifi ed four priority mineral belts to explore, evaluated numerous opportunities and entered into its fi rst joint venture.
Goals for 2008
Sino Gold’s key business goals for 2008 are to:• Establish Jinfeng as a major, low-cost gold mine;• Commence commissioning White Mountain on schedule; • Progress both Beyinhar and Eastern Dragon to
development decisions; and• Advance another property towards development by
making a signifi cant discovery or acquisition.
Sino Gold is well positioned to achieve these goals with a strong team in place and a strong balance sheet. The Group’s available cash position of A$39 million at 31 December 2007 was bolstered by shareholders approving in January 2008 the A$107 million second tranche of the Eastern Dragon placement.
Our technical skills, fi nancial strength and ability to rapidly progress projects has led to the Company being viewed as a partner of choice for opportunities in the country. With the largest gold exploration program in China and a number of acquisitions being evaluated, Sino Gold is very well placed to create value for shareholders.
In summary, Sino Gold has the people, cultural experience, projects and funding in place to deliver over the coming few years on our growth target of becoming a 500,000 ounce per annum gold producer in China.
Jake KleinPresident and CEO
Mining at Jinfeng White Mountain construction start-up ceremony
For
per
sona
l use
onl
y

8
James (Jim) AskewChairman
Jim was appointed a director in 2002 and became Chairman in 2006. He is a mining engineer with broad international experience as CEO for a wide range of Australian and international publicly listed mining, mining fi nance and other mining-related companies. He is also chairman of International Mining and Finance Corporation (a Denver-based venture capital group), Asian Mineral Resources and Oceana Gold Limited, as well as non-executive director of Ausdrill Limited and Golden Star Resources Inc.
Jacob (Jake) Klein President And CEO
Jake was appointed President and CEO of the Company at the time of its formation in June 2000. He has over 16 years experience in senior fi nance and managerial positions and joined Macquarie Bank in 1991. From 1996 to June 2000 he served as a member of Sino Mining International’s executive committee. Jake is a non-executive director of Lynas Corporation Limited and the Australia China Business Council, as well as a member of the NSW Asia Council.
Xu Hanjing Executive Director
Hanjing has been involved in the non-ferrous metal industry for more than 18 years. He co-founded Sino Mining International while president of CNIEC. Prior to his three-year presidency of CNIEC, he was a vice president from 1994 to 1996 and its Australian representative from 1989 to 1994. From 1984 to 1989 he was with the Foreign Affairs Bureau of CNNC. Hanjing heads up the group’s Business Development unit, which has been instrumental in securing all of Sino Gold’s joint venture agreements and positioning the Company for the acquisition of new projects.
Peter Cassidy Non-Executive Director
Peter was appointed a director in 2002 and was Chairman from November 2005 to November 2006. He is an experienced senior mining executive with over 37 years of exposure to the minerals industry in Australia, Papua New Guinea, Southeast Asia and the USA, including more than 15 years in the gold industry. His most recent executive role was as CEO of Goldfi elds Limited from 1995 until 2002. Peter has over 15 years experience as a director of Australian publicly listed companies and is currently a non-executive director of Lihir Gold Limited, Energy Developments Limited and Zinifex Limited.
Board of Directors
For
per
sona
l use
onl
y
A n n u a l R e p o r t 2 0 0 7
9
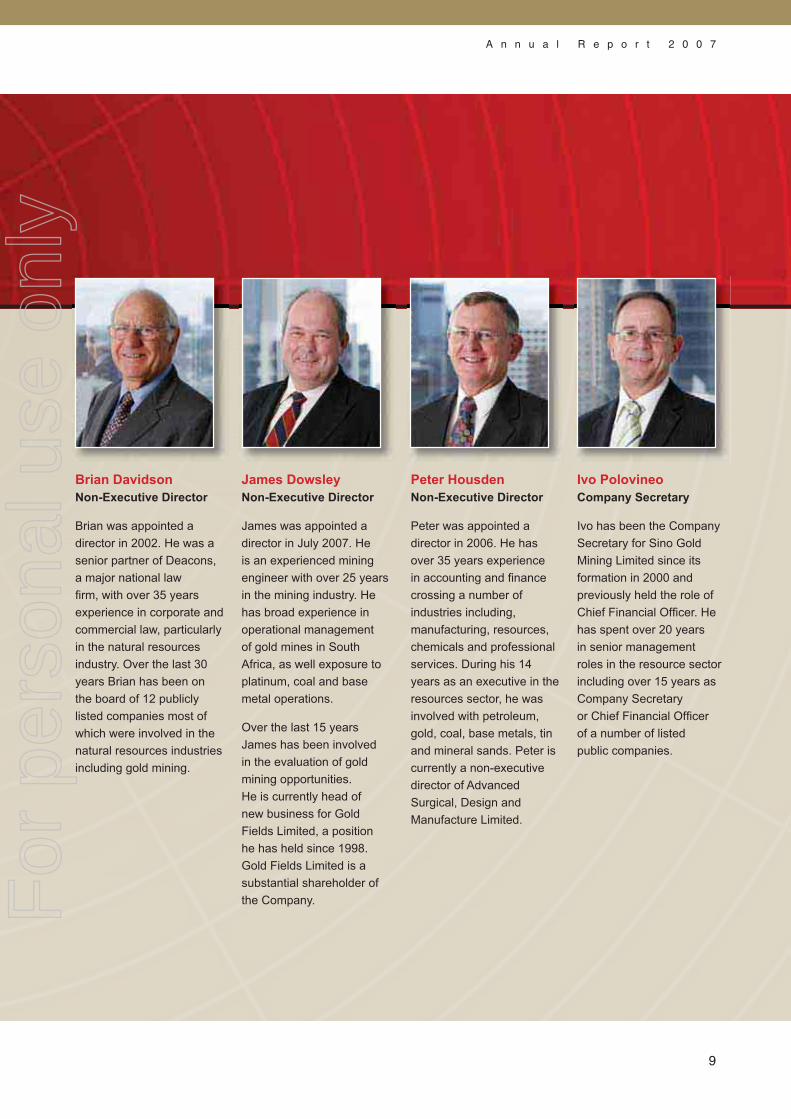
Brian DavidsonNon-Executive Director
Brian was appointed a director in 2002. He was a senior partner of Deacons, a major national law fi rm, with over 35 years experience in corporate and commercial law, particularly in the natural resources industry. Over the last 30 years Brian has been on the board of 12 publicly listed companies most of which were involved in the natural resources industries including gold mining.
James DowsleyNon-Executive Director
James was appointed a director in July 2007. He is an experienced mining engineer with over 25 years in the mining industry. He has broad experience in operational management of gold mines in South Africa, as well exposure to platinum, coal and base metal operations.
Over the last 15 years James has been involved in the evaluation of gold mining opportunities. He is currently head of new business for Gold Fields Limited, a position he has held since 1998. Gold Fields Limited is a substantial shareholder of the Company.
Peter HousdenNon-Executive Director
Peter was appointed a director in 2006. He has over 35 years experience in accounting and fi nance crossing a number of industries including, manufacturing, resources, chemicals and professional services. During his 14 years as an executive in the resources sector, he was involved with petroleum, gold, coal, base metals, tin and mineral sands. Peter is currently a non-executive director of Advanced Surgical, Design and Manufacture Limited.
Ivo PolovineoCompany Secretary
Ivo has been the Company Secretary for Sino Gold Mining Limited since its formation in 2000 and previously held the role of Chief Financial Offi cer. He has spent over 20 years in senior management roles in the resource sector including over 15 years as Company Secretary or Chief Financial Offi cer of a number of listed public companies.
For
per
sona
l use
onl
y

10
Risk ManagementSafety signs at Jinfeng processing plant
The delivery of sustainable benefi ts for all key stakeholders is a guiding value for Sino Gold’s activities. It is an area in which the Company has developed a strong reputation and track record and one that will become increasingly important in China.
Our approach refl ects both the country in which we operate, being the sovereign jurisdiction of China, and also the source of our capital, being international investors which do not differentiate on environment, health and safety standards between jurisdictions.
Sino Gold develops and manages operations in a manner that:• ensures health and safety is always the priority;• effectively controls and minimises pollution;• looks after and protects the environment; and• contributes to the broader community in which we
operate.
Appropriate policies are developed for each stage of our business and systems are implemented to identify, assess and minimise health, safety and environmental risks. The Company now has signifi cant experience in implementing these policies for operating mines, development projects and exploration prospects.
Incidents are recorded at all sites. These form an integral part of procedures recording safety, environmental and community incidents and provide a primary tool for improving the Company’s risk management performance.
Sino Gold classifi es all incidents, including potential incidents, as “Minor”, “Moderate”, “Signifi cant”, “Major” or “Catastrophic” based on defi ned severity consequences. The latter three classifi cations are rated as “serious” and are reported to senior management within 24 hours. Incidents of lesser classifi cation are reported in the site weekly and monthly reports. All incidents are reported to the Board and the Risk Management Committee.
Signifi cant Incidents for Sino Gold Group
2006 2007
Safety – Lost Time Injury 4 11
– Other Reportable 9 13
Environment 2 4
Community 1 1
Note: No incidents classified as Major or Catastrophic occurred during 2006 and 2007.
Safety
China is a challenging place to operate to an appropriate level of safety, particularly during construction when multiple contractors are working on a site.
Jinfeng maintained a low Lost Time Injury Frequency Rate (“LTIFR”) record of 1.38 per million man-hours worked in 2007 and 1.19 since the commencement of the project.
The majority of the Company’s Lost Time Injuries (“LTI”) during 2007 occurred either at Jinfeng as construction was nearing completion or at drilling sites.
At White Mountain, the construction has commenced in August with a total of 258,850 man hours recorded and without an LTI during 2007.
Safe practices continue to be reinforced by regular safety meetings and safety training, particularly for new staff and contractors.
Environment
Environmental management is a key area of differentiation for Sino Gold in China.
No reportable environmental incidents occurred during 2007. The majority of signifi cant incidents occurred during the commissioning stage at Jinfeng.
The commencement of operations at Jinfeng provides the Company with an ideal opportunity to showcase our environmental management. During 2007, the focus at Jinfeng was on optimising the environmental
For
per
sona
l use
onl
y

A n n u a l R e p o r t 2 0 0 7
1111
COO Cobb Johnstone and Party Secretary of Baishan City,
Mr Zhou Huachen
School children near Jinfeng
performance of the processing plant and improving management systems and monitoring programs.
A key challenge for 2008 will be minimising the water discharged from the CIL tailings facility.
Environmental approval for White Mountain was obtained in August 2007 from the State Environmental Protection Administration. During 2007, a signifi cant effort was made to developing environmental management system, procedures and monitoring capacity that will allow us to effectively manage the environmental risks identifi ed at White Mountain.
Community
In order to establish a community development strategy that will contribute to our community’s sustainable development, a specialist consulting fi rm completed a social risk and opportunity assessment during 2007. The assessment identifi ed community’s concerns and their short, medium and long-term needs. This information is now being utilised as primary input to forming Sino Gold’s community development strategy.
Jinfeng continued working on maximising employment opportunities for local people and procuring as many supplies as practical from the communities surrounding the project.
By the end of 2007, the Jinfeng workforce of 521 permanent employees included 178 (34%) employees from Guizhou Province, of which 82 (16%) employees are from the local county including 66 villagers who have been employed after they have successfully completed the training courses provided by the company. Further training opportunities have been provided to this group of employees with 8 completing an apprentice training program that includes studying at Guiyang technical college and on the job training at the mine site.
A number of programs aimed at improving the lifestyle of the local community have been continued in 2007 from the previous year. These include establishing drinking water supply systems and upgrading access to nearby villages.
In addition, two volunteer community programs have been initiated by employees and also their families, which focus on school children through regular donations of clothes, books and toys, and organising periodic creative art and music classes at local schools.
Primary school attendance in the local area has increased by 90% since 2004. Enhanced skills and education are amongst the most important benefi ts that can be provided to a community. Given the long-term nature of the Jinfeng Mine, we have the opportunity to impact at least one whole generation, and most likely more, of school children. It is an area in which we particularly look forward to making a difference.
“The Company’s management of safety, the environment and community relationships continues at the highest standards and we recognize that our continuing performance in these areas is crucial to our long-term success in China.”
For
per
sona
l use
onl
y

12
Finance activities during 2007 refl ect the Company putting in place the assets to rapidly grow gold production to 500,000 ounces annually.
2007 Financial Result
Sino Gold received gross proceeds of A$33.6 million from gold sold of 37,359 ounces following commencement of commercial production at Jinfeng on 1 September 2007 and recorded a net loss of A$23.5 million for the 2007 year.
Key non-operating expenses were hedging losses of A$9.3 million and fi nance costs of A$14.5 million which included a one-off cost of A$6.5 million relating to the early conversion of the US$35 million convertible notes.
Investment activities during 2007 absorbed a total of A$160.4 million, primarily comprised of A$63.7 million for development of the Jinfeng Gold Mine, A$53.6 million for Eastern Dragon acquisition, A$18.4 million for exploration activities and A$10.8 million for development of the White Mountain Gold Mine.
Funding
The Company’s rapid growth was funded by share issues raising a total of A$237 million during 2007.
In January 2007, a placement to Gold Fields Limited raised A$36 million by issuing 6.5 million shares at $5.58 per share. This placement was agreed when the Sino Gold Fields Alliance was formed in late 2006.
In March 2007, the issue of 19.7 million shares at A$7.00 per share raised A$133 million in relation to Sino Gold’s secondary listing on the Stock Exchange of Hong Kong.
In November 2007, the Company issued a total of 15.4 million shares for the early conversion of the US$35 million convertible notes.
In December 2007, an initial placement of 9.8 million shares at A$6.45 per share raised A$63 million in relation to the Eastern Dragon acquisition.
During the year, the Company issued 5.6 million shares on the conversion of options, raising A$5 million and issued a total of 13.4 million shares in relation to the take-over of Golden China Resources Corporation.
At 31 December 2007, Sino Gold was in a sound fi nancial position with net available cash of A$39.0 million, total assets of $743.6 million and net assets of $345.9 million.
In January 2008, completed the Eastern Dragon placement following shareholder approval for the issue of a further 16.7 million shares at A$6.45 per share, raising an additional A$107 million.
Hedging
A gold hedging program was required by lenders as part of the US$40 million Jinfeng Project Finance Facility put in place during 2005.
As at 31 December 2007, forward sales contracts totaling 303,173 ounces at a fi xed delivery price of US$525 per ounce were outstanding, with Sino Gold’s 82% attributable share comprising 248,602 ounces. The contracts are not subject to margin calls by counterparty banks.
At 31 December 2007, the mark-to-market value of the total gold hedge book was a negative US$107 million. It is the Board’s intention not to enter into any further committed gold hedging contracts. At year end, the Company did not have any foreign exchange contracts, interest rate contracts or other fi nancial derivatives in place.
F inanceCFO
Wayne Rossiter
For
per
sona
l use
onl
y

13
Projects
“Clear path in place for Sino Gold to achieve the objective of producing 500,000 ounces of low-cost gold annually by 2010.”
Jinfeng processing plant
13
A n n u a l R e p o r t 2 0 0 7
Shandong
Inner Mongolia
T
Liaoning
Jilin
Heilongjiang
Guizhou
GuangxiYunnan
Hong Kong
Shanghai
Jinfeng MineJinfeng Mine
White MountMine
White MountMine
ainain
Eastern DragonProject
Eastern DragonProject
BeyinharProject
BeyinharProject
Beijing
Chengdu
For
per
sona
l use
onl
y

14
Jinfeng, Sino Gold’s fl agship project, achieved commercial gold production in September 2007 and is already one of the largest gold mines in China.
With high-grade Ore Reserves totalling 3.2 million ounces and Mineral Resources totalling 4.6 million ounces, Jinfeng will be a long-life, low-cost operation.
The gold processing plant is one of the largest in China and has been designed to be readily expanded. Sino Gold is determined to increase Jinfeng’s gold production to optimal levels as quickly as possible.
Jinfeng location map
Jinfeng is located in Guizhou Province, 236km southwest of the provincial capital Guiyang. Sino Gold holds 82% equity in the Jinfeng Joint Venture with several Chinese partners.
The area consists of rugged karst topography with a sub-tropical, humid climate. Average annual rainfall of 1,200mm falls primarily during the wet season from May to August each year.
Sino Gold acquired the Jinfeng deposit in 2001,completed a Bankable Feasibility Study in April 2004 and construction commenced in February 2005.
Operations
In March 2007, construction of the processing plant was completed and fi rst commissioning gold was poured.
The ramp-up to planned gold production was limited by the project’s ability to discharge to the CIL tailings dam during the mid-2007 wet season. Whilst the wet season remains a risk to the operation, the ability to discharge into the dam during future wet seasons has been greatly enhanced by water diversion channels now being in place and a fi ltered tailings plant being constructed that will be able to produce relatively low-moisture tailings.
Commercial gold production was achieved in September 2007 and gold production for the year totaled 56,981 ounces. By the end of the year, all areas of the processing plant were performing well and mill throughput rates in excess of design capacity were being achieved.
Jinfeng ore is refractory with most of the microscopic gold particles locked up with pyrite. The ore concentrate has oxidised well in the BIOX® circuit with recoveries in the BIOX®/CIL circuit consistently achieving planned levels of about 93%. Recoveries in the fl otation circuit were less than planned for 2007. Consistent operation of the processing plant during 2008 should facilitate increasing fl otation recoveries to planned levels of approximately 92%, resulting in overall gold recoveries achieving the planned 85%.
Mining of the open pit progressed on plan during 2007 with a total of 692,000 tonnes of ore mined and stockpiled ore of 314,000 tonnes at the end of the year.
Underground Mine Development
Operational fl exibility will be provided by sourcing ore concurrently from the open pit and the underground mine. Decline development progressed during 2007 and initial ore stopes are planned to be accessed late in 2008.
The underground mine is planned to start contributing a signifi cant portion of mill feed from early 2009. At full capacity the underground mine is expected to operate on three main levels, with each level providing approximately 400,000 tonnes of ore.
J infeng Mine
100km
Jinfeng
Kunming
to Nanning
Anshun
Zhenfeng
XingyiCeheng
Guiyang
COO
Cobb Johnstone
For
per
sona
l use
onl
y

A n n u a l R e p o r t 2 0 0 7
1515
The contribution of underground ore is forecast to increase the mine’s gold production due to the reserve grade of underground ore being greater than the reserve grade of open-pit ore. Profi tability should also be enhanced as mining costs per tonne of underground ore are forecast to be similar to mining costs per tonne of open-pit ore.
Outlook
Gold production is planned to ramp up during 2008 to approximately 180,000 ounces per annum. The addition of higher grade ore from the underground mine from 2009 onwards should underpin further increases in gold production.
The Jinfeng processing plant is already achieving throughput rates in excess of the nameplate capacity of 1.2 million tonnes per annum. The layout of the plant site has been designed to accommodate an expansion of the treatment capacity.
The ultimate scale of any expansion to the Jinfeng processing plant will be primarily dependent on an assessment during 2008 of the capability of the current plant and mining conditions encountered in the underground mine.
Jinfeng is a high-quality asset which will underpin the Company’s rapid growth.
Conceptual Jinfeng Open Pit and Underground Development
Jinfeng decline developmentJinfeng processing plant at night
For
per
sona
l use
onl
y

16
The region surrounding Jinfeng is highly prospective for further discoveries of multi-million ounce gold deposits. Sino Gold has a very large tenement position in the region and many promising prospects are yet to be tested by drilling.
Exploration during 2007 continued to focus on drilling to confi rm and extend the Jinfeng orebody and drilling of prospects to the southwest of Jinfeng.
Geological Setting
Jinfeng lies within China’s “Golden Triangle” mineral district, which contains several gold resources containing in excess of one million ounces.
Jinfeng, the largest known Carlin-type deposit in China, lies within Triassic sedimentary rocks overlying the Permian and Carboniferous limestones of the Laizhishan Dome.
Jinfeng mine geology
The Jinfeng orebody is a structurally controlled gold deposit with some replacement style mineralisation. The majority of the mineralisation is hosted by the major east-southeast trending high-angle F3 Fault which is consistently mineralised over 1,300 metres of strike and to a depth of more than 1,000 metres.
The F3 Fault is linked to the major low-angle thrust fault (F7). To the west, the F3 Fault is terminated by the northeast-trending F2 Fault, which is weakly mineralised. Gold mineralisation continues northwest of the F2 into the Rongban area, similarly hosted by a series of high-angle faults and the F7 Fault.
Northeast-trending folding and the intersection of the F3 and the F7 has focused high-grade mineralisation, which plunges east-southeast.
J infeng Explorat ionGeologist Yin Dingming logging Jinfeng drill core
For
per
sona
l use
onl
y

A n n u a l R e p o r t 2 0 0 7
17
Gold Reserves and Resources
During 2007, updated estimates increased Ore Reserves by 12% to 17.6 million tonnes at 5.7g/t gold (containing 3.2 million ounces) and increased Mineral Resources by 14% to 28.6 million tonnes at 5.0g/t gold (containing 4.6 million ounces).
The Ore Reserves for the planned underground mine contain an estimated 2.2 million ounces of gold, with the remaining 1.0 million ounces contained in the planned open pit and ore stockpiles.
Ore from the underground mine is planned to provide a signifi cant proportion of mill feed from 2009 onwards. Jinfeng’s head grade should then approximate the overall Ore Reserve grade of 5.7g/t gold as the grade of underground ore is higher than the grade of open-pit ore.
Jinfeng Long Section
Resource Extension Drilling
Deep zone drilling during 2007 to extend the known Jinfeng deposit targeted high-grade mineralisation controlled by the intersection of the F3 and F7 Faults down-plunge to the east-southeast. Gold mineralisation continues to be very strong at depth and drilling during 2007 extended mineralisation a further 250 metres down plunge.
This deep zone has now been followed to near the contact of the Triassic sediments and underlying Permian limestones, which is considered very prospective for gold deposition. Several gold deposits in the Golden Triangle region are located in a similar stratigraphic position near the Triassic-Permian contact.
Drilling of an upper zone on the eastern margin of the orebody during 2007 confi rmed and extended an additional high-grade zone of mineralisation closer to
surface. This zone has the potential to provide an additional underground mining area as it is signifi cantly above the main mineralised portion of the F3 Fault.
Mineralisation remains open down plunge in the deep zone.
Jinfeng decline portal Jinfeng drill core with orpiment veining
For
per
sona
l use
onl
y

18
Jinfeng Explorat ion cont.Drilling at Jinluo Joint Venture
Near-Mine and Regional Potential
Sino Gold has entered into three joint ventures in the Jinfeng region, covering an extensive area of more than 400km2 around the Laizhishan Dome. These joint ventures provide Sino Gold with a dominant tenement holding in this prospective district. Sino Gold also has rights to other strategic tenements in the surrounding Golden Triangle region.
The near-mine area and surrounding district are highly prospective for adding signifi cantly to the Company’s gold resources.
Laizhishan Dome
The Jinfeng Joint Venture surrounds the area of the Jinfeng Mining Licence. Near-mine drilling during 2007 primarily tested extensions of the F3 and F7 Faults for signifi cant mineralisation to the southeast of the Jinfeng orebody.
Regional exploration is primarily aimed at prospects near the contact between Triassic sediments and Permian limestones around the Laizhishan Dome. A number of prospects have been defi ned by a combination of small-scale oxide gold mines, geophysical anomalies, and strong gold-arsenic soil, stream and trench geochemical anomalies.
The Jinluo Joint Venture area covers approximately 25km strike length along the margin of the Laizhishan Dome southwest of the Jinfeng deposit. A total of 4,752m of drilling was completed during 2007 at two main prospects, Banna and Bannian. Drilling intercepted low-grade gold and strong arsenic mineralisation at both prospects.
The Jindu Joint Venture area covers approximately 15km strike length along the margin of the Laizhishan Dome northwest of Jinfeng. An initial drilling program was completed at the Pogao Prospect during 2007.
Program for 2008
Jinfeng’s drilling program for 2008 will be scaled down as drilling is prioritised on other prospects in Sino Gold’s growing exploration portfolio in China.
Near-mine and regional exploration will continue to search for gold deposits within trucking distance of Jinfeng.
Sino Gold remains very confi dent that the gold endowment of Jinfeng district will provide benefi ts for our stakeholders for many years to come and looks forward to testing this potential further during 2008. F
or p
erso
nal u
se o
nly

A n n u a l R e p o r t 2 0 0 7
19
White Mountain decline portal area in January 2008
White Mountain
Development of the White Mountain Gold Mine was approved by Sino Gold’s Board in August 2007 at an estimated cost to develop the project of US$55 million. Commissioning of the White Mountain processing plant is planned to commence in late 2008.
In February 2008, White Mountain’s Ore Reserve estimate doubled to 0.8 million ounces and the Measured and Indicated Resource estimate increased to 1.1 million ounces of contained gold.
Gold mineralisation at White Mountain remains open at depth and along strike to the northeast with drilling to continue in 2008.
White Mountain location map
White Mountain is located 230km south-southeast of Changchun, the capital city of Jilin Province innortheast China.
The project is located in lightly forested public land, within 2km of a newly paved concrete road that is linked to the national highway and railway systems. Grid power and water are readily available as the mine site is only 7km from the prefecture level city of Baishan, a coal and iron ore mining centre.
In 2003, Sino Gold acquired an initial 80% interest in White Mountain. Sino Gold increased its equity in the joint venture to 95% during 2006. Exploration Licences held by the joint venture were added to during 2007 and these now cover a total of 128km2.
Project Parameters
The White Mountain operation now being developed is planned to comprise:• Gold production averaging 70,000 ounces per annum;• Cash operating costs of approximately US$250 per
ounce;• Head grade of approximately 4g/t gold;• Mill throughput of 650,000 tonnes per annum; and• Gold recoveries averaging 80%.
Project development capital costs are estimated to total US$55 million (including contingency). Sino Gold is responsible for funding the local joint-venture partner through development.
Ore is planned to be accessed via a decline with the sub-level open stoping mining method being used for portions of the orebody thicker than 10 metres, with the cut-and-fi ll method being utilised for the remainder of the deposit.
The White Mountain processing plant is being built with Chinese equipment and is a standard Chinese design carbon-in-leach plant. Many of the Sino Gold employees managing the project’s construction have gained substantial experience through their involvement in developing the Company’s Jinfeng and Jianchaling mines.
White Mountain
Changchun
Shenyang
Baishan
Meihekou
Ji’an
Siping
100km
For
per
sona
l use
onl
y

20
White Mountain cont.Mast of drill rig at White Mountain
Resources and Reserves
Sino Gold completed a further 34 kilometres of drilling in 111 holes during 2007, bringing total drilling completed at White Mountain to 83 kilometres in 297 holes.
In February 2008, updated estimates increased Ore Reserves by 81% to 6.5 million tonnes at 3.8g/t gold (containing 0.8 million ounces) and increased Measured and Indicated Resources by 92% to 10.7 million tonnes at 3.1g/t gold (containing 1.1 million ounces).
Drilling has extended the length of the resource to 1,520 metres and to a maximum depth of 530 metres.
Exploration and Geological Setting
Exploration at White Mountain has focused on mineralisation contained in a northeast trending regional fault zone.
Gold mineralisation at White Mountain is: • Contained within a major northeast trending regional
fault zone within Proterozoic sedimentary rocks;• Hosted by a silicifi ed breccia and pyrite veinlets
between a “hanging wall” quartzite and a “footwall” silicifi ed dolomite or marl;
• Associated with multi-stage silica, iron-oxide, pyrite and barite mineralisation; and
• Dipping between 25° and 70° (average 45°) to the southeast.
The primary control on mineralisation is interpreted to be the intersection of two major northeast-trending regional faults (F100 and F102). Transverse faults across the F100 Fault are interpreted to localise gold mineralisation into high-grade zones.
Exploration potential continues to the northeast associated with this plunging fault intersection, as indicated by a strong geophysical resistivity anomaly.
White Mountain Long Section
For
per
sona
l use
onl
y

A n n u a l R e p o r t 2 0 0 7
21
White Mountain decline portal
Outlook
Prior to onset of winter, major earthworks for the processing plant were completed and concrete foundations were poured for key areas of the plant.
Development of the underground mine, detailed engineering design, off-site fabrication and procurement are being carried out over winter with the majority of the construction work planned to start in April 2008.
Development of the White Mountain Gold Project remains on-schedule and on-budget to commence commissioning of the processing plant in late 2008.
As the resource remains open to the northeast and at depth, the Company intends to continue drilling in 2008 with the aim of further increasing the current White Mountain resource, as well as fi rst-pass drilling of near-mine prospects in the surrounding 128km2 licence areas.
White Mountain plant site in October 2007
White Mountain Geological Plan
White Mountain Site Plan
For
per
sona
l use
onl
y

22
BeyinharDrill rigs at Beyinhar
The Beyinhar Project in Inner Mongolia was acquired by Sino Gold as part of the take-over of Golden China Resources Corporation.
Sino Gold is targeting to commence development of a heap-leach, open-pit mining operation at Beyinhar by the end of 2008.
The Beyinhar Project is located approximately 500km northwest of Beijing in the Inner Mongolia Autonomous Region, People’s Republic of China.
Beyinhar is approximately 2km from a regional highway and within 10km of grid power. The gently rolling grasslands of the project area receive very little rainfall with fairly hot summers and cold, windy winters.
Beyinhar location map
Golden China commenced exploration work at Beyinhar in late 2003 and carried out geological mapping, rock sampling, soil geochemical surveys, geophysical surveys and drilling.
The 15km2 Beyinhar Joint Venture area is 95% owned by Sino Gold and an adjacent 33km2 Exploration Licence to the southwest is 100% owned by Sino Gold.
Gold Reserves and Resources
In early March 2008, Sino Gold released:• an initial Ore Reserve estimate for Beyinhar of 21.4
million tonnes at 0.72g/t gold, containing 0.49 million ounces; and
• a Mineral Resource estimate of 51.0 million tonnes at 0.62g/t gold, containing 1.0 million ounces.
The data used in this resource estimate is based on results from Golden China’s work program to 30 November 2007, including 292 diamond drill holes for a total of 42km.
The Ore Reserve is entirely in the oxide zone and approximately one-third is soft oxide ore. The waste to ore strip ratio is estimated to be 2.2 to 1.0.
A sulphide zone underlying the oxide resource is included in the total Mineral Resource and is estimated to contain an Inferred Resource of 17.3 million tonnes at 0.65g/t gold, containing 0.36 million ounces. The sulphide mineralisation includes high-grade epithermal quartz veins which will be the focus of future exploration at depth.
Geological Setting
Gold mineralisation at Beyinhar is: • hosted in the Beyinhar Shear Zone in Proterozoic
metasediments and Cretaceous rhyolite;• controlled by the interplay of primary metamorphic
fabric, the massive rhyolite and granodiorite abutting the metasediments and the Beyinhar Shear Zone, faulting along the Beyinhar shear and oxidation controlled by meteoric waters;
• known to extend over a strike length of approximately 2.2km and to a maximum depth of 200m.
For
per
sona
l use
onl
y

A n n u a l R e p o r t 2 0 0 7
23
Drilling at BeyinharExploration geologist Jack Yang at Beyinhar
The bulk of the deposit occurs in a well-developed oxide zone, which extends in some areas down to 125m vertical depth. Only limited drilling has intersected the sulphide mineralisation identifi ed below the oxide resource. High-grade gold mineralisation occurs in epithermal quartz veins, apparently related to the sub-volcanic rhyolite intrusion.
Silver is known to be associated with gold mineralisation at Beyinhar but samples have not been routinely analyzed for silver.
Gold mineralisation at Beyinhar remains open along strike in both directions (northeast and southwest) and at depth.
Beyinhar Outlook
The aim of the planned 2008 exploration program is to extend and upgrade both the oxide and sulphide resources. This program is planned to commence in late March 2008 and primarily comprise soil geochemistry, ground geophysics and drilling.
Drilling will test for extensions to the oxide resource, which remains open along the southwest-northeast striking Beyinhar Shear Zone.
Sulphide mineralisation below the oxide zone has been tested by very limited drilling to date. An extensive diamond drilling program will be aimed at defi ning high-grade gold mineralisation in the sulphide zone.
Studies and permitting are being progressed in order to enable the Sino Gold Board to approve development of a 2.5 million tonne per annum, heap-leach operation by the end of 2008.Beyinhar tenements
For
per
sona
l use
onl
y

24
Eastern DragonEastern Dragon quartz vein in underground cross-cut
Eastern Dragon Lode 5 is a high-grade, epithermal gold-silver deposit located in northern China’s Heilongjiang Province.
Sino Gold completed the acquisition of an effective 72% interest in the Eastern Dragon Lode 5 in early 2008 at a cost of US$90 million. Sino Gold also secured an exclusive right to acquire up to 80% of the surrounding Exploration Licence (53km2 in area) for a price to be determined by the end of 2008.
Gold mineralisation was discovered at Eastern Dragon in 1998 by an exploration brigade under the Heilongjiang Non-ferrous Metals Geology and Exploration Bureau (“Brigade”).
In 2005, Sino Gold formed a joint venture with the Brigade in relation to the adjacent Sanjianfang Exploration Licence and this long-standing relationship laid the foundation for Sino Gold’s acquisition of Eastern Dragon.
Geological Setting
Exploration at Eastern Dragon has focussed primarily on Lode 5 which is a low-sulphidation epithermal quartz-adularia vein system with a near vertical dip. Gold-silver mineralisation in Lode 5 has been identifi ed over a strike length of 600m and to a depth of 250m.
The Brigade has identifi ed a resource to Chinese standards based on data collected from 45 diamond drill holes and underground development on two levels. Further confi rmation work is required prior to reporting a Mineral Resource for Lode 5 in accordance with internationally accepted standards including Australasia’s JORC Code.
Sino Gold’s near-term conceptual exploration target is to verify and convert the Chinese resource to a JORC Code categorised resource of 600,000 to 800,000 ounces of contained gold potentially in the range of 7g/t to 8g/t gold and 70g/t to 75g/t silver, and 2.3 to 2.9 million tonnes.
Project Parameters
Preliminary studies of Eastern Dragon Lode 5 indicate the following potential development scenario:• Mining primarily via an underground operation;• Simple carbon-in-leach (CIL) plant processing 300,000
to 500,000 tonnes per annum; • Metallurgical recoveries of >90% for gold; and• Gold production of 80,000 to 120,000 ounces per
annum plus signifi cant silver production.
Outlook
During 2008, Sino Gold intends to:• Convert Lode 5 to a JORC Code categorised resource; • Undertake additional metallurgical, geotechnical and
mining studies;• Progress required permitting;• Progress acquisition of the surrounding Exploration
Licence; and• Explore the adjacent Sanjianfang Exploration Licence.
Eastern Dragon is an important part of Sino Gold’s growth strategy and is an asset that has the potential to be developed into a long-term, high-quality mine.
Eastern Dragon location map
For
per
sona
l use
onl
y

A n n u a l R e p o r t 2 0 0 7
25
BioGold BACOX© processing tanks
BioGold
The BioGold Facility was acquired by Sino Gold as part of the take-over of Golden China Resources Corporation.
The facility processes gold concentrates and is located in Shandong Province, which is China’s largest gold producing province.
BioGold location map
The gold in refractory concentrates is encapsulated in sulphide minerals such as pyrite and arsenopyrite. The facility primarily treats refractory gold concentrates using the proprietary bacterial oxidation technology known as BACOX© – a similar technology to BIOX® process used at Jinfeng. The BACOX© process destroys the sulphide minerals, enabling relatively high overall recovery of gold to be achieved by subsequent processing.
Processing refractory gold concentrates via bacterial leaching has many cost and environmental advantages compared with other processing techniques such as smelting.
BioGold purchases concentrates from a variety of sources. Concentrates from European Goldfi elds Limited’s Olympias Project in Greece provide a stable base feed for the facility.
During 2007, Golden China acquired the right to use the BACOX© technology free of royalities into perpetuity from BacTech Mining Corporation.
Sino Gold owns 99.5% of the BioGold Facility as well as a majority interest in the adjacent refi nery.
The refi ning process includes smelting and electro-winning, resulting in products assaying up to 99.99% gold and 99.5% silver.
BioGold has a seat on the Shanghai Gold Exchange, making Sino Gold the only foreign member.
Outlook
Sino Gold’s management is focused on optimising the cash fl ow and profi tability of the BioGold Facility.
An expansion to the facility is planned to be completed by mid-2008 which will double treatment capacity to 200 tonnes of concentrate per day.
The BioGold Facility will provide Sino Gold with valuable insights into the gold industry in China’s largest gold producing province.
For
per
sona
l use
onl
y

26
Explorat ion
Shandong
Inner Mongolia
T
Liaoning
Jilin
Heilongjiang
Guizhou
Guangxi
Yunnan
Hong Kong
Shanghai
Jinfeng MineJinfeng Mine
White MountMine
White MountMine
ainain
Beijing
Chengdu
Eastern DragonProject
Eastern DragonProject
BeyinharProject
BeyinharProject
China is now the largest gold producing country and Sino Gold has the largest gold exploration program in China
For
per
sona
l use
onl
y

A n n u a l R e p o r t 2 0 0 7
27
Sino Gold is the leading gold explorer in China with a strong track record of success. Gold resources under the Company’s control have increased by an average of one million ounces per year over the past fi ve years and now total more than seven million ounces.
Substantial drilling programs were undertaken during 2007 at a number of prospects in our extensive exploration portfolio.
Sino Gold’s three regional exploration teams - Golden Triangle, Northern China and Shandong Province are complemented by the Sino Gold Fields (“SGF”) Alliance exploring for very large gold deposits.
The SGF Alliance is exploring selected mineral belts across China for large gold deposits containing more than fi ve million ounces. The regional teams generally focus on a single mineral province and develop extensive databases, local knowledge and relationships with other tenement holders in that belt.
Our preferred strategy is to partner with Chinese groups who have powerful local experience and are major tenement holders in a selected gold district. Grassroots exploration by these groups have generally advanced prospects to the drilling stage. Sino Gold brings a fresh perspective to exploring these areas and provides funding to drill and quickly assess prospects.
Golden Triangle
The “Golden Triangle” mineral province in southern China contains a number of gold deposits containing in excess of one million ounces, of which Jinfeng is the largest.
The Golden China acquisition added the Nibao gold deposit to the Golden Triangle exploration portfolio during 2007.
Gold mineralisation in the Golden Triangle is considered to be genetically similar to the Carlin trend deposits in Nevada, USA. Most gold deposits in the Golden Triangle are located within tightly folded sedimentary sequences of Triassic age, near the unconformity with the underlying Permian carbonates. Gold mineralisation is generally localised within faults and by replacement of favourable rock types.
Sino Gold has several joint ventures in the Golden Triangle with licences that cover prospects containing gold mineralisation in a similar geological and structural setting to the Jinfeng orebody and other major gold deposits in the region. Previous exploration has advanced many prospects to the drilling stage through geological mapping, geochemical surveys, trenching, adits and limited shallow drilling.
In late 2007, the fi rst drill hole at the Yandan Prospect in the Guangxi Joint Venture intercepted 50m at 1.2g/t gold, including 5m at 4.3g/t gold. Yandan is at the western end of a 15km target zone on the margin of the Leye-Tian’er Dome, located approximately 70km southeast of Jinfeng.
The 70%-owned Nibao Project is located about 150km west-northwest of the Jinfeng Mine in western Guizhou Province and near Sino Gold’s Greatlands Joint Venture with Brigade 105.
Golden China estimated a Measured and Indicated Resource for Nibao of 5.8 million tonnes at 2.8g/t gold, containing 521,000 ounces (at a 1.0g/t gold cut-off), plus an Inferred Resource of 4.5 million tonnes at 1.7g/t gold containing 246,000 ounces. In light of current gold price and the size of the current resource, Sino Gold is developing an exploration strategy and assessing possible development opportunities for the refractory Nibao deposit.
Explorat ionChief Geologist
Phillip Uttley
0
1
2
3
4
5
6
7
8
2002
Jinfeng White Mountain Beyinhar Nibao
2003 2004 2005 2006 2007
Mill
ion
Oun
ces
Mineral Resources (100%)
For
per
sona
l use
onl
y

28
Explorat ion cont.
Shandong
Shandong Province is responsible for around one-quarter of China’s annual gold production. Located in the southeast portion of the Precambrian North China Craton, Shandong hosts more than 100 known gold deposits. More than 80% of these lodes are hosted within Mesozoic granitoid rocks or their contacts with Archean basement rocks.
Regional, deep-seated, northeast trending faults such as the Jiaojia Fault, and its footwall splays, host most of the major gold deposits in Shandong Province.
Several prospects in the Hexi Gold Joint Venture were drilled during 2007, primarily aimed at testing the northern portion of the Jiaojia Fault and footwall structures parallel to the Jiaojia Fault.
Golden Triangle gold deposits
Walking to drill site at White Mountain
For
per
sona
l use
onl
y

A n n u a l R e p o r t 2 0 0 7
29
SGF Alliance geologists prospecting in Jiangxi ProvinceDrilling at Yandan Prospect in Guangxi Province
Sino Gold’s Ludi Joint Venture, with Shandong Provincial Bureau of Geo-Mineral Exploration & Development, acquired three strategic Exploration Licences during 2007. These licences cover postulated extensions of the prolifi c Jiaojia Fault directly south of several major gold deposits. This prospective area has not been previously explored as the Jiaojia Fault is obscured by shallow Quarternary sediments.
Northern China
During 2007, the Northern China team was responsible for the Eastern Dragon acquisition and also progressed exploration at the nearby Sanjianfang Joint Venture in Heilongjiang Province.
The Northern China team also managed the successful program to increase and upgrade the White Mountain resource, as well as regional exploration near White Mountain.
Sino Gold Fields Alliance
Formed in late 2006, the SGF Alliance is exploring China for projects that meet Gold Fields’ benchmark “rule of fi ves” gold deposit criteria: • Reserves of at least 5,000,000 gold-equivalent
ounces; and• Potential to produce at least 500,000 ounces of gold
per annum.
The SGF Alliance is exploring primarily for large bulk-mineable styles of gold and/or copper-gold mineralisation.
Sino Gold manages exploration undertaken by the SGF Alliance, which is equally funded by both parties. Gold Fields will manage the development and operation of any new projects resulting from the alliance that meet the agreed Gold Fields’ benchmark criteria. Sino Gold has the right to retain properties which do not meet the benchmark criteria.
During 2007, the SGF Alliance exploration team was established and undertook a thorough analysis and ranking of 58 mineral belts in China. Four mineral belts were selected as priority belts for the SGF Alliance to explore.
In early 2008, the Bengge Project became the fi rst joint venture of the SGF Alliance. Bengge is located in the Pulang Belt in northwest Yunnan Province, which hosts a number of porphyry-style copper-gold deposits.
Exploration Outlook
Sino Gold continued to have the largest gold exploration program in China with approximately 90,000 metres of diamond drilling completed during 2007.
Exploration expenditure totalled US$15.3 million for 2007 and similar expenditure is planned for 2008.
Drilling is planned to test for extensions to resources at Jinfeng, White Mountain, Beyinhar, Nibao and Eastern Dragon, as well as drill testing of a number of prospects and follow-up drilling at the Yandan Prospect.
During 2008, the SGF Alliance plans initial drilling at the Bengge Project as well as pursuing further opportunities in the four selected mineral belts.
Sino Gold has the people, partners and funding in place to rapidly assess our growing exploration portfolio as well as evaluating further acquisitions.
For
per
sona
l use
onl
y

30
Mineral Resources & Ore Reserves
Category Tonnes Millions
Grade g/t Au
Gold ’000oz
Share %
Gold ’000oz
Jinfeng Measured 15.4 5.3 2,617 82% 2,146
Indicated 8.6 4.7 1,305 82% 1,070
Sub-Total M+I 24.0 5.1 3,922 82% 3,216Inferred 4.6 4.7 692 82% 567
Total Jinfeng 28.6 5.0 4,614 82% 3,783White Mountain Measured 6.7 3.1 674 95% 640
Indicated 4.0 3.1 407 95% 386
Sub-Total M+I 10.7 3.1 1,081 95% 1,027Inferred 1.7 2.1 110 95% 104
Total White Mountain 12.4 3.0 1,191 95% 1,131Beyinhar Measured (Oxide Zone) 1.0 1.06 35 95% 33
Indicated (Oxide Zone) 28.0 0.61 552 95% 524
Sub-Total M+I 29.0 0.63 587 95% 558Inferred (Oxide Zone) 4.6 0.47 69 95% 66
Total Oxide 33.7 0.61 656 95% 623Inferred (Sulphide Zone) 17.3 0.65 360 95% 342
Total Beyinhar 51.0 0.62 1,016 95% 965Nibao Measured 2.8 3.67 327 70% 229
Indicated 3.0 1.99 194 70% 136
Sub-Total M+I 5.8 2.79 521 70% 364Inferred 4.5 1.70 246 70% 172
Total Nibao 10.3 2.32 767 70% 537Sino Gold Measured 25.9 4.4 3,653 3,048
Indicated 43.6 1.8 2,458 2,117
Sub-Total M+I 69.6 2.7 6,110 5,165Inferred 32.6 1.4 1,477 1,252
Total Sino Gold 102.2 2.3 7,587 6,416
Summary of Mineral Resources
For
per
sona
l use
onl
y

A n n u a l R e p o r t 2 0 0 7
31
Jinfeng processing plant from decline portalJinfeng gold dore bars
Category TonnesMillions
Gradeg/t Au
Gold’000oz
Share%
Gold’000oz
Jinfeng Open Pit Proved 5.3 5.2 889 82% 729
Probable 0.5 3.9 63 82% 52
Sub-Total Jinfeng Open Pit 5.8 5.1 952 82% 781Jinfeng Underground Proved 6.4 6.2 1,282 82% 1,051
Probable 5.1 5.7 929 82% 762
Sub-Total Jinfeng Underground 11.5 6.0 2,211 82% 1,813Jinfeng Stockpile Proved 0.3 5.7 47 82% 39
Total Jinfeng Proved 12.0 5.8 2,218 82% 1,819
Probable 5.6 5.5 992 82% 813
Total Jinfeng 17.6 5.7 3,210 82% 2,632White Mountain Proved 4.2 3.7 494 95% 469
Probable 2.3 4.0 290 95% 276
Total White Mountain 6.5 3.8 784 95% 745Beyinhar Proved 1.0 1.07 35 95% 33
Probable 20.4 0.71 464 95% 441
Total Beyinhar 21.4 0.72 499 95% 474Total Sino Gold Proved 17.2 5.0 2,747 2,321
Probable 28.3 1.9 1,746 1,530
Total Sino Gold 45.5 3.1 4,493 3,851
Summary of Ore Reserves
Notes applicable to the Mineral Resources and Ore Reserves:1. Mineral Resources are inclusive of Ore Reserves.
2. At the time of fi nalising this Annual Report, these Jinfeng Mineral Resources and Ore Reserves estimates are being revised to include mining, processing and drilling completed over the past year.
3. Details of the methodologies used to estimate Mineral Resources and Ore Reserves are available under the Projects section of the Sino Gold website (www.sinogold.com.au).
4. Key changes since the Mineral Resources and Ore Reserves estimates in the 2006 Annual Report are:• Drilling at Jinfeng during 2006 led to increases in both Mineral Resources and Ore Reserves for the project. • Drilling at White Mountain during 2007 led to increases in both Mineral Resources and Ore Reserves for the project.• The Nibao Mineral Resources and Beyinhar Mineral Resources and Ore Reserves are reported for the fi rst time as both projects were acquired by Sino Gold through the take-over of Golden China.• The Scott Wilson Roscoe Postle Associates report estimated the Nibao Mineral Resources at a 0.5g/t gold cut-off and also reported values at 0.75g/t gold and 1.0g/t gold. Sino Gold considers that reporting the Nibao Mineral Resources at a 1.0g/t gold cut-off better refl ects currently estimated operating costs.
For
per
sona
l use
onl
y

32
Mineral Resources & Ore Reserves cont.
Date Released
Gold Price Basis (US$/oz)
Cut-off Grade (g/t gold)
Competent Person
Mineral ResourcesJinfeng - Open Pit 30 April 2007 1.0 1
- Underground “ 2.0 1
White Mountain 13 February 2008 1.0 1
Beyinhar 5 March 2008 0.2 2
Nibao 25 September 2006 1.0 3, 4
Ore ReservesJinfeng - Open Pit 30 May 2007 US$500/oz 1.5 5
- Underground “ “ 2.9 5
White Mountain 13 February 2008 US$650/oz 1.7/2.0 5
Beyinhar 5 March 2008 US$650/oz 0.22/0.25 6
Competent Persons
The following individuals take responsibility for the Mineral Resources and Ore Reserves estimates as noted in the table above:
1. Mr Phillip Uttley (FAusIMM) is a full-time employee of Sino Gold in the capacity of Chief Geologist. He is a geologist with more than 27 years relevant experience in exploration and evaluation of gold deposits, including the exploration for and estimation of resources of structurally controlled-gold deposits and replacement-style gold deposits.
2. Mr Mario Rossi (FAusIMM) is an independent consultant geostatistician and mining engineer from the international consulting firm Geo Systems International. He has over 19 years relevant experience in exploration and evaluation of various styles of gold deposits.
3. Mr Neil Gow (P.Geo. with Association of Professional Geoscientists of Ontario) is an independent consultant geologist with Scott Wilson Roscoe Postle Associates. He has over 40 years experience as a geologist and sufficient relevant experience in evaluation of gold deposits.
4. Dr. William Roscoe (P.Eng. with Professional Engineers Ontario) is an independent consultant geological engineer with Scott Wilson Roscoe Postle Associates. He has over 36 years experience as a geologist and sufficient relevant experience in evaluation of gold deposits.
5. Dr John Chen (MAusIMM) is a full-time employee of Sino Gold in the capacity of Manager – Mining, Technical Services. He is a mining engineer with more than 20 years experience in the mining industry in Australia and China.
6. Mr Steve Craig (MAusIMM) is an independent consultant with Orelogy and has over 20 years relevant experience in evaluation of gold deposits.
These Mineral Resources and Ore Reserves are presented in accordance with the 2004 Edition of the “Australasian Code for Reporting of Exploration Results, Mineral Resources and Ore Reserves (“JORC Code”), which is equivalent under the corresponding categories of mineral reserves and mineral resources to Canada’s National Instrument 43-101 – Standards for Disclosure for Mineral Projects (“NI43-101”) and CIM Standards.
Each of the above individuals:• have sufficient experience that is relevant to the style of mineralisation and type of deposit under consideration;• are Competent Persons as defined in the JORC Code and “qualified persons” under NI43-101; and• consent to the publication of this information in the form and context in which it appears.
For
per
sona
l use
onl
y

A n n u a l R e p o r t 2 0 0 7
33
Financial ReportConsolidated Financial Statements for the year ended 31 December 2007
Contents
Directors’ Report 34
Auditor Independence and Non-audit Services 46
Corporate Governance Statement 47
Income Statement 49
Balance Sheet 50
Statement of Cash Flows 51
Statement of Changes in Equity 52
Notes to the Financial Statements 54
Directors’ Declaration 100
Independent Audit Report 101
For
per
sona
l use
onl
y

Directors’ ReportFor the year ended 31 December 2007
The Board of Directors of Sino Gold Mining Limited is pleased to submit its report in respect of the financial year ended 31 December 2007.
DIRECTORSThe names and details of the company directors in office during the financial year and to the date of this report are as follows. Directors were in office for this entire period unless otherwise stated.
Names, qualifications, experience and special responsibilities
James Askew (59), ChairmanB.E.(Mining) Hons, M.Eng.Sci,FAusIMM, MCIMM, MSMEMr. Askew is a mining engineer with broad international experience as chief executive officer for a wide range of Australian and international publicly listed mining, mining finance and other mining-related companies. In a 21-year tenure as chief executive officer (of which 15 has been in the gold sector) he has been instrumental in founding and growing several companies and overseeing subsequent mergers and acquisitions.
Mr. Askew’s most recent full time roles have been as president and chief executive officer of North American listed Golden Star Resources (1999) and Rayrock Resources (1998-1999), which merged with Glamis Gold in 1999 and president and managing director of Golden Shamrock Mines Ltd (1986-1996), which merged with Ashanti Goldfields in 1996.
He is currently chairman of International Mining and Finance Corporation, a Denver-based venture capital group targeting gold and base metal opportunities.
Mr. Askew is currently a non-executive director of Ausdrill Ltd and Golden Star Resources Inc, plus the non-executive chairman of Asian Mineral Resources, Sino Gold Mining Limited and Oceana Gold Ltd. Mr. Askew is a member of the Remuneration and Risk Management Committees of Sino Gold. Mr. Askew was appointed Chairman of Sino Gold Mining Limited in November 2006.
During the past four years Mr. Askew has served as a director of the following public listed companies:
• Climax Mining Ltd (until November 2007)
• AGD Mining Ltd (until August 2005)
• Yamana Gold Inc (until March 2007)
Jacob Klein (42), President and CEOBCom(Hons), ACA, DipFinMarkets (Sec Inst)Mr. Klein was appointed President and CEO of the Company at the time of its formation in June 2000. In this time he has overseen the development of the Company from a single project company into one that holds interests in a number of projects in China including Jinfeng.
He has over 16 years experience in senior finance and managerial positions in both South Africa and Australia. He joined Macquarie Bank in 1991 and in 1995, as an associate director at Macquarie, and participated in the formation of Asia Resource Capital Limited, a joint venture between Macquarie Bank and CNNC. From 1996 to June 2000 he worked for Sino Mining International. During this time he served as a member of Sino Mining International’s executive committee and was its executive vice president for the period 1999 to June 2000. Mr. Klein is a non-executive director of Lynas Corporation Ltd and director of the Australia China Business Council and member of the NSW Asia Council.
During the past four years the only other listed company directorship held by Mr. Klein was in Lynas Corporation Limited.
Xu Hanjing (54), Executive DirectorMr. Xu has been involved in the non-ferrous metal industry for more than 18 years and has extensive experience in trading, commercial negotiations and management.
He co-founded Sino Mining International while president of CNIEC. Prior to his three-year presidency of CNIEC, he was a vice president from 1994 to 1996 and its Australian representative from 1989 to 1994. From 1984 to 1989 he was with the Foreign Affairs Bureau of CNNC.
His understanding of the impact of the economic changes taking place in China, and his communication and negotiating skills, have been instrumental in achieving agreements which work for both Chinese owners and Western investors and developers; as well as in orienting Chinese staff and managers towards the requirements of the market economy.
Mr. Xu heads up the group’s Business Development unit, which has been instrumental in securing all of Sino Gold’s joint venture agreements and positioning the Company for the acquisition of new projects.
Mr. Xu has held no other listed company directorships in the past three years.
34
For
per
sona
l use
onl
y
A n n u a l R e p o r t 2 0 0 7
Brian Davidson (73), Non-executive DirectorLLB, FAICDMr. Davidson is a consultant to Deacons, a major national law firm, having retired in 2004 after 37 years as a partner. Throughout that period, he practised in corporate and commercial law, capital raisings and project finance. He has served on the board of directors of 12 publicly listed companies, including 5 as Chairman, most of which were involved in the mining and exploration industries. Currently, he is also a director of a number of large private company groups and of the Pain Management Research Institute Ltd, Royal North Shore Hospital, Sydney. He is Chairman of the Audit Committee and the Remuneration and Nomination Committee and a member of the Risk Committee. He is a Fellow of the Australian Institute of Company Directors.
Peter Cassidy (61), Non-executive DirectorBSc(Eng), Ph.D., C.Eng, FAusIMM, FIMMMr. Cassidy is an experienced and successful senior mining executive with over 37 years exposure to the minerals industry in Australia, Papua New Guinea, Indonesia and the USA, including more than 15 years in the gold industry.
Mr. Cassidy’s most recent executive role was as chief executive officer of Goldfields Limited from 1995-2002. Following the merger of Goldfields and Delta Gold Limited to form AurionGold Limited in 2002, he stepped down as chief executive officer and following completion of its acquisition by Placer Dome he resigned as a director of the company.
He is also a non-executive director of Lihir Gold Limited, Energy Developments Limited and Zinifex Limited. Previous major board positions include Goldfields Kalgoorlie Limited (previously Pancontinental Mining Limited) from 1995 to 1999 and RGC Limited from 1990 to 1995. Mr. Cassidy is chairman of the Risk Management Committee and a member of the Remuneration Committee. Mr. Cassidy was previously Chairman of Sino Gold Mining Limited until November 2006.
During the past four years Mr. Cassidy has served as a director of the following public listed companies:
• Lihir Gold Limited
• Oxiana Limited (until November, 2007)
• Zinifex Limited
• Energy Developments Limited
Zhong Jianguo (50), Non-executive DirectorMr. Zhong has a teaching and practical background in accounting and finance, with detailed knowledge of the Chinese sector coupled with extensive international experience. He is a Senior Accountant certificated by the Finance Ministry of China.
He has been involved with the Chinese accounting and finance sector for more than 24 years and has held a number of senior management positions with China Minmetals Group Corporation and its subsidiaries during the past 18 years. Since March 2004 Mr. Zhong has been vice-president and chief financial officer of Sino Mining International Limited, a wholly owned subsidiary of Minmetals and a significant shareholder in Sino Gold Mining Limited. Sino Mining International’s main business is alumina and nickel concentrate trading between Australia and China.
Mr. Zhong is a member of the Audit Committee.
Mr. Zhong has held no other listed company directorships in the past three years.
Peter Housden (60), Non-executive DirectorB.Comm (Hons), FCPA, CFTP, FAICDMr. Housden has over 36 years experience in the accounting / finance / commercial fields crossing a number of industries including, manufacturing, resources, chemicals and professional services. During his 14 years as an executive in the resources sector, he was involved with petroleum, gold, coal, base metals, tin and mineral sands.
Mr. Housden’s experience is wider than accounting and finance. He has led strategy reviews, managed business units and had responsibility for human resources and information technology. In addition he has continuing interest in corporate reporting and governance through membership of the AICD Reporting Committee.
Executive board experience includes; Director, Australian Chemicals Limited; Finance Director, RGC Limited and CFO / Company Secretary, MIA Group Limited. Peter is currently a non-executive director of Advanced Surgical, Design and Manufacture Limited.
Mr. Housden is a member of the Audit Committee.
Mr. Housden has held the following other listed company directorships in the past three years:
• Kaz Group Limited
• Data Dot Technology Limited
35
For
per
sona
l use
onl
y

36
James Dowsley (49), Non-Executive DirectorMr. Dowsley is an experienced mining engineer with over 25 years in the mining industry. He has broad experience in operational management of gold mines in South Africa, as well exposure to platinum, coal and base metal operations.
Over the last 15 years Mr. Dowsley has been involved in the evaluation of gold mining opportunities. He is currently head of new business for Gold Fields Limited, a position he has held since 1998. Gold Fields Limited is a substantial shareholder of the Company.
Mr. Dowsley joined the Board on 30 July 2007.
SECRETARY
Ivo Polovineo (57)PNAMr. Polovineo has been the company secretary for Sino Gold Mining Limited since its formation in 2000 and previously held the role of Chief Financial Officer. He has spent over 20 years in senior management roles in the resource sector including over 15 years as company secretary or Chief Financial Officer of a number of listed public companies.
INTERESTS IN SHARES AND OPTIONS OF THE COMPANY AND RELATED BODIES CORPORATEAs at the date of this report, the interests of the directors in the shares and options of Sino Gold Mining Limited were:
Ordinary Shares
ESIS Shares
Employee Options**
ESIS loans *
$
J Askew 140,000 - - -
J Klein 1,032,178 1,650,000 1,400,000 758,232
H Xu 200,000 600,000 975,000 275,723
B Davidson 215,347 - 20,000 -
P Cassidy 143,831 - 20,000 -
J Zhong - - 120,000 -
P Housden 10,000 - 120,000 -
J Dowsley - - - -
* Loans outstanding pursuant to the terms of the Employee Share Incentive Scheme (“ESIS”)
Please refer to note 17(c) for further details of options outstanding.
** The Board has approved additional option issues to J. Klein (500,000), H Xu (350,000) and J Dowsley (120,000) which are subject to shareholder approval.
PRINCIPAL ACTIVITIESThe principal activities during the financial year of entities within the group continue to be:
• Mining and processing of gold ore and sale of recovered gold.
• Exploration and development of mining properties.
REVIEW AND RESULTS OF OPERATIONS
Jinfeng Mine (82% Equity)Open-cut mining performed efficiently with a total of 692,000 tones of ore mined. Development of the underground mine continues to make steady progress with total development of 741m.
Jinfeng commenced commissioning in late May. The operation achieved commercial production on 1 September 2007. A total of 449,000 tonnes of ore have been treated in the year with an overall recovery of 71.9% producing 56,981 ounces of recovered gold. Over the year 43,483 ounces of gold were sold.
Towards the end of December the mill was able to achieve a throughput rate of 190 tones per hour verses a design rate of 150 tones per hour. Mill throughput rates, BIOX throughput rates and CIL recovery were all at or ahead of design capacity but flotation recoveries remained lower than design at 82% (versus 91% design).
In late 2007 an in-principle agreement was reached with local government to amend Jinfeng’s concessional tax treatment in return for improved infrastructure for Jinfeng. The Jinfeng Joint Venture has agreed to forego its entitlement to reduced income tax until 2010. By agreeing to pay an additional 10% tax equalisation amount to local government until 2010, the applicable income tax rate is now an effective 25%, the same as the national income tax rate. The highest priority infrastructure projects to be undertaken by the local government are an upgrade and surfacing of the road and an upgrade to the power supply lines, both of which have already commenced.
White Mountain (95% Equity)In August 2007, the Board of Directors approved the development of White Mountain for an estimated project development cost of US$55 million.
Prior to the onset of winter, major earthworks for the processing plant were completed and concrete foundations poured for key areas of the plant in preparation for construction activities to resume in mid-March 2008. As of 31 December 2007 the 230m of underground development was achieved and, over the winter months, both the decline and the south
Directors’ ReportFor the year ended 31 December 2007
For
per
sona
l use
onl
y

A n n u a l R e p o r t 2 0 0 7
37
ventilation decline will continue to be advanced. In addition detailed engineering design and procurement activities will be carried on over the winter months.
Eastern Dragon (72% Equity)In late 2007, the Company entered into agreements to acquire an effective 72% interest in the Eastern Dragon Lode 5 gold-silver deposit in northern China’s Heilongjiang Province at a cost of US$90 million. The Company has also secured an exclusive right to acquire up to 80% of the surrounding Exploration Licence (53km2 in area) for a price to be determined.
Eastern Dragon Lode 5 is a high-grade, low-sulphidation epithermal gold-silver deposit with mineralisation identified over a strike length of 600m and to a depth of 250m. A Chinese exploration Brigade has identified a resource to Chinese standards however further confirmation work is required prior to reporting a Mineral Resource for Lode 5 in accordance with internationally accepted standards including Australasia’s JORC Code.
At 31 December 2007 U$45 million of the total acquisition cost of U$90 million had been paid. This has enabled the Joint Venture company to make a significant payment to the Heilongjiang Ministry of Land and Resources in relation to the agreed valuation of the asset. The investment is via a 90% interest in Rockmining Group Company Limited which holds an 80% interest in the Joint Venture company.
Golden China Resource Corporation AcquisitionOn 13 August 2007, Sino Gold announced an offer of one Sino Gold share for every 4.5 shares of Golden China Resources Corporation. At 31 December 2007 Sino had acquired a 94% interest in Golden China. Compulsory acquisition of the remaining shares was completed on 16 January 2008. A total of 14.2 million shares were issued under this offer plus a number of replacement options and warrants to existing Golden China option and warrant holders.
Golden China’s key assets are the Beyinhar project in Inner Mongolia, the Nibao project in Guizhou Province and the BioGold processing facility in Shandong Province. These assets are complementary and are located within the three areas in which Sino Gold already has significant activity and capacity. The process to integrate Golden China’s assets and management into Sino Gold is already well underway.
The preliminary acquisition accounting for the Golden China acquisition includes a restructuring provision in relation to the closure of the Golden China corporate office. The final allocation of purchase price consideration will be made in 2008.
FINANCIAL RESULTSThe Group recorded a loss of A$24.9 million for the year ended 31 December 2007 compared to a loss of A$20.1 million for the year to 31 December 2006.
The current period results are primarily made up of earnings from Jinfeng mine following commercial production commencing on 1 September 2007, hedging losses realised for the full period, depreciation and amortisation charges, interest income, finance costs (including costs associated with early conversion of the convertible note), corporate costs, exploration expenditure written off, foreign exchange gains and a gain on the accounting impact on embedded derivatives on seed share options. The results in the previous year included the results from the Jianchaling Mine which was disposed of in the previous year.
Gross sales revenues were A$33.6 million on gold sales of 37,359 ounces made after achieving commercial production at Jinfeng on 1 September 2007. All gold is sold as dorè to refineries approved by the Shanghai gold exchange. Proceeds of A$4.1 million on the 6,124 ounces sold prior to 1 September 2007 have been offset against capitalised commissioning costs. Costs of sales of A$27.9 million includes depreciation and ammortisation (A$3.5 million), royalties (A$1.4 million), rehabilitation (A$0.3 million) and gold in circuit and finished goods movements from 30 August to 31 December 2007. Hedging losses of A$9.3 million relate to the cash settlement of 31,827 ounces of gold at an average price of US$523 per ounce. Of these A$2.1 million are related to pre-commercial production that were expensed though related to gold sales that were capitalised.
Interest income of A$3.8 million was earned on cash and cash equivalents but excluding restricted cash. Restricted cash represents cash held on deposit to secure the Remimbi working capital loan within China with China Construction Bank and interest earned on this cash is netted against interest and fees paid on the facility. Net finance costs on this facility were A$1.1 million and are included in finance costs.
Finance costs of A$14.5 million include the costs to induce early conversion of the US$35 million convertible note (A$6.5 million), borrowing costs expensed (A$0.7 million), interest charges on the US$42 million Jinfeng project facility (A$4.3 million), net interest charges on Jinfeng Standby L/C Loan (A$1.1 million) and coupon payments on the US$35 million convertible note (A$1.6 million).
For
per
sona
l use
onl
y

38
During the period the company relinquished the Zhengyuan and Heishan tenements in Shandong Province and the North Mountain tenements in Xinjiang Province. The costs associated with exploration on these tenements have been written off. New exploration licences have subsequently been added to our exploration portfolio in the Shandong area by our joint venture partner to replace the relinquished properties.
The Group result was impacted by a gain of A$1.3 million (A$11.4 million loss in 2006) due to the accounting impact on embedded derivatives on seed share options which are treated as derivative liabilities rather than equity resulting in the movement in their value, along with any foreign exchange impact, being recognised as a gain or loss. During the year 4,477,776 of these options were exercised prior to maturity leaving 500,000 options maturing in 2010.
Net cash flows utilised in operating activities was A$19.8 million for the year, which included finance cost payments of A$15.2 million (including A$6.5 million of costs for conversion of the convertible note) and interest received of A$6.1 million, but excluded revenue from gold sales prior to achieving commercial production which were netted against commissioning costs. During the year A$160.4 million was absorbed by investment activities, the bulk of which pertained to exploration, evaluation and development activities.
Of this investment expenditure A$32.9 million was incurred to completion of construction of the Jinfeng plant and tailings facilities, A$15.7 million pertained to net capitalised commissioning cost until commercial production was declared at Jinfeng and A$15.1 million related to underground development and other sustaining and improving capital expenditures at Jinfeng.
Other major investment expenditure includes White Mountain development costs (A$10.8 million), Eastern Dragon acquisition payments (A$53.6 million), Golden China investment (A$5.9 million), joint venture acquisition costs (A$9.0 million) and exploration activities including exploration at Jinfeng and White Mountain (A$18.4 million).
Financing activities during the period include A$236.9 million generated from new share issues, A$56.6 million proceeds from the Reminbi working capital facility from China Construction Bank (“CCB”), loan repayment totally of A$5.1 million made up by the Jinfeng project finance facility (A$2.0 million), CCB Renminbi loan (A$1.6 million), deferred put option premium (A$0.7 million) and Jinfeng financial lease (A$0.7 million).
The Company had cash reserves of A$109.0 million at the end of the period including restricted cash of A$70.0 million. The financial statements recognise total assets of A$743.6 million and net assets of A$345.9 million giving a book value of net assets per share of A$1.55. At 31 December 2007 net current liabilities were A$82.6 million and total assets less current liabilities were A$504.8 million. In accordance with Accounting Standards net assets do not recognise the full value of the Company’s Ore Reserves.
GROUP 2007
A$’000
GROUP 2006
A$’000
Financial Results
Sales revenue – spot 33,573 8,695
Hedging loss – pre commercial production (2,050) -
Hedging loss – post commercial production (7,242) -
Net revenue 24,281 8,695
Loss before depreciation, finance costs, exploration written off and tax (5,218) (13,800)
Conversion of convertible notes (6,484)
Other finance costs (7,981) (6,176)
Depreciation and amortisation (3,573) (78)
Deferred exploration costs written off (1,545) -
Loss before income tax (24,801) (20,054)
Income tax expense (138) -
Net loss (24,939) (20,054)
HedgingAs part of the Jinfeng project loan facility, the Jinfeng project was required to enter into a hedging program and all outstanding contracts are summarised in the table below, of which 18% is attributable to the minority partner.
Directors’ ReportFor the year ended 31 December 2007
For
per
sona
l use
onl
y

A n n u a l R e p o r t 2 0 0 7
39
Hedging Position Fixed Forwards Bought Put Options
Ounces US$/oz Ounces US$/oz
2008 73,548 524 74,184 400
2009 64,612 525 74,178 400
2010 64,612 525 - -
2011 64,612 525 - -
2012 35,789 530 - -
Total 303,173 525 148,362 400
Hedges cash settled prior to commercial production ceased to be classified as effective hedges. Accordingly the losses on these instruments was expensed in the income statement instead of being capitalised and these form part of the A$9.3 million in hedging losses recorded in the period. All other forward sales and put options are regarded as effective hedges and the mark to market impact is recognised in the balance sheets as a liability and in equity.
Issued CapitalIn January 2007 the company completed a share placement with the issue of 6,500,000 ordinary shares at A$5.58 per share raising a total of A$36.0 million.
In March 2007 the company successfully completed a secondary listing on the Main Board of the Stock Exchange of Hong Kong Limited (“SEHK”). Total shares issued on SEHK were 19,708,912 ordinary shares at A$7.00 per share raising a total of A$133.1 million. This secondary listing was the first for an Australian company and the Company was the first pre-production mining company listed in Hong Kong.
Following approval by note holders at a meeting on 2 November 2007, the Company has issued a total of 15,383,045 shares in relation to the early conversion of its US$35 million 5.75% convertible subordinated notes due 2012.
As of 31 December 2007 a total of 13,367,870 ordinary shares were issued to acquire a 94% interest in Golden China Resources Corporation. Following compulsory acquisition completed on 16 January 2008 a total of 14,189,642 ordinary shares were issued in relation to this acquisition along with a number of replacement options and warrants issued to existing Golden China option and warrant holders.
On 14 December 2007, Sino Gold successfully arranged a A$170 million placement through the issue of 26.46 million ordinary shares to institutional investors at A$6.45 per share. Settlement of the Placement
took place in two tranches of 9.79 million shares on 19 December 2007 and 16.67 million shares following shareholder approval at an Extraordinary General Meeting held on 24 January 2008. The placement was joint lead managed by Macquarie Equities Limited and Merrill Lynch and the final price represented a 4.4% discount to the closing share price of $6.75 on the day immediately prior to the announcement of the placement.
In addition, during the year a total of 5,621,776 ordinary shares were issued on the exercise of unlisted options, details of which are as follows:
• 1,777,776 shares at US$0.625 per share
• 214,000 shares at $2.69 per share
• 75,000 shares at $1.20 per share
• 3,540,000 shares at $1.00 per share
• 15,000 shares at $2.00 per share
The Company has not redeemed any of its shares during the year ended 31 December 2007. Neither the Company nor any of its subsidiaries has purchased or sold any of the Company’s shares during the period.
At 31 December 2007 Sino Gold Mining Limited had 223,432,323 ordinary shares and 10,315,559 unlisted options on issue.
Pursuant to the heads of agreement with Gold Fields Australasia, Gold Fields has a right to participate pro-rata in any future issues of shares or securities convertible into shares by the Company. No other pre-emptive rights exist in relation to issues of shares or securities.
DIVIDENDSNo dividends have been recommended, declared or paid during the year ended 31 December 2007.
SIGNIFICANT CHANGES IN AFFAIRSThere were no significant changes to the state of affairs of the Company or the Group during the year other than the issue of shares by the Parent company as stated in the Review and Results of Operations.
SIGNIFICANT EVENT AFTER BALANCE DATEThe following significant events have occurred after 31 December 2007:
• Second tranche of private placement of 16,669,459 shares at A$6.45 per share was approved at an Extraordinary General Meeting held on 24 January 2008 and the issue was completed on 31 January 2008.
• Compulsory acquisition of Gold China Resource Corporation was completed on 16 January 2008.
For
per
sona
l use
onl
y
40
LIKELY DEVELOPMENTS AND EXPECTED RESULTSThe focus for 2008 will be on ramping Jinfeng up to design gold production rates of 15,000 ounces per month, primarily by achieving consistent production and by increasing flotation recovery rates to design rates. The development of the Jinfeng underground mine is planned to advance sufficiently to enable mining of initial ore via underground mining methods in late 2008.
The White Mountain Project will continue to be developed during 2008 and commissioning of the processing plant is planned to commence in late 2008.
A comprehensive drilling and feasibility program to test the deeper Beyinhar sulphide mineralisation will be conducted during 2008.
At the Eastern Dragon Project, work to verify and convert the Chinese resource to a JORC Code categorised resource will be conducted in 2008. Various studies are planned for 2008 to enable the project to progress towards a development decision by year end.
ENVIRONMENTAL REGULATIONThe group’s operating subsidiaries hold permits issued by Provincial Environmental Protection Bureau of the People’s Republic of China (“PRC”) which specify limits for discharges to the environment from operations as a result of group activities.
These limits are determined by State Environmental Laws and Regulations which are reviewed from time to time. The permits regulate the management of discharges to the air and storm water run-off associated with the mining operations as well as the storage of hazardous materials.
There were no significant breaches of license conditions in the financial year.
INDEMNIFICATION AND INSURANCE OF DIRECTORS AND OFFICERSThe Company has arranged Directors & Officers Liability/Company Reimbursement Insurance Policies which cover all the Directors & Officers of the Company and its controlled entities. The terms of the policies prohibit disclosure of details of the amount of the insurance cover, the nature thereof and the premium paid.
DIRECTORS’ MEETINGSThe numbers of meetings of directors held during the year and the number of meetings attended by each director were as follows:
Meetings entitled to
attendMeetings attended
J Askew 12 12
J Klein 12 12
H Xu 12 12
P Cassidy 12 12
B Davidson 12 11
J Zhong 12 10
P Housden 12 12
J Dowsley (appointed 30/07/07) 8 7
ROUNDINGThe amounts contained in this report have been rounded off under the option available to the company under ASIC Class Order 98/100. The company is an entity to which the Class Order applies.
CORPORATE GOVERNANCEIn recognising the need for the highest standards of corporate behaviour and accountability, the directors of Sino Gold Mining Limited support and have adhered to the principles of corporate governance as recommended by the ASX Corporate Governance Council. The company’s corporate governance statement is contained later in this annual report.
Through-out the year ended 31 December 2007 the Company has also complied with the provisions of the Code on Corporate Governance Practices as set out in Appendix 14 to the Rules Governing the Listing of Securities on the Stock Exchange of Hong Kong Limited (“SEHK”).
During the year ended 31 December 2007 the Company has, in respect of the Model Code set out in Appendix 10 of the SEHK Listing Rules:
(a) adopted a code of conduct regarding directors’ securities transactions on terms no less exacting than the required standard set out in the Model Code; and
(b) there has been no instance of non-compliance with, the required standard set out in the Model Code and its code of conduct regarding directors’ securities transactions.
Directors’ ReportFor the year ended 31 December 2007
For
per
sona
l use
onl
y

A n n u a l R e p o r t 2 0 0 7
41
AUDIT COMMITTEEThe Group’s financial report for the year ended 31 December 2007 has been reviewed by the audit committee. The audit committee notes the ongoing interpretation under International Financial Reporting Standards which deems certain share options to be derivative liabilities rather than equity and the resultant impact of this on the balance sheet and income statement of the Company as highlighted in the financial results.
REMUNERATION REPORT (AUDITED)The Company’s remuneration policy is designed to attract, retain and motivate highly talented individuals to ensure the capability of our workforce to deliver the business strategy and to maximize shareholder wealth creation.
Remuneration StructureIn accordance with best practice corporate governance, the structure of non-executive director and executive remuneration is separate and distinct.
Non-Executive Director RemunerationThe Board seeks to set aggregate remuneration at a level that provides the Company with the ability to attract and retain directors of the highest calibre, whilst incurring a cost that is acceptable to shareholders.
Structure
The Constitution and the ASX Listing Rules specify that the aggregate remuneration of non-executive directors shall be determined from time to time by a general meeting.
The latest determination was at the Annual General Meeting held on 30 May 2006 when shareholders approved an aggregate remuneration of $650,000 per year. Directors will be seeking to increase this amount at the next Annual General Meeting.
The amount of aggregate remuneration sought to be approved by shareholders and the fee structure is reviewed annually. The Board considers advice from external consultants as well as the fees paid to non-executive directors of comparable companies when undertaking the annual review process.
Each non-executive director receives a base fee of $85,000 for being a director of the Group. The Chairman receives a base fee of $175,000. From 1 January 2008 an additional fee of $7,500 will also be paid for each Board committee on which a non-executive director sits and $10,000 if the director is a Chair of a Board Committee with $15,000 being paid to the Chair of the Audit Committee. The payment of
additional fees for serving on a committee recognises the additional time commitment required by non-executive directors who serve on one or more sub committees.
The non-executive directors do not receive retirement benefits, nor do they participate in any incentive programs
Executive RemunerationThe Remuneration Committee of the Board of Directors is responsible for determining and reviewing compensation arrangements for the Directors, the Chief Executive Officer and the executive team. The Remuneration Committee assesses the appropriateness of the nature and amount of emoluments of such officers on a periodic basis by reference to relevant employment market conditions with the overall objective of ensuring maximum stakeholder benefit from the retention of a high quality board and executive team.
Cash bonuses paid and numbers of options granted are at the complete discretion of the Board and are based on individual and company performance based on set performance targets.
To assist in achieving these objectives, the Remuneration Committee considers the nature and amount of Executive Directors’ and Officers’ emoluments to the Company’s financial and operational performance. All senior executives have the opportunity to qualify for participation in the Executive and Employee Option Plan which currently provides incentives. The options vest over 3 years and expire in 5 years provided that the employee/director remains as employee/director of the company.
Details of the nature and amount of each element of the remuneration of each director of the company and 5 named executives who receive the highest remuneration are shown below.
The key principles of the remuneration policy are to:
• Set competitive rewards to attract, retain and motivate highly skilled people.
• Implement challenging key performance indicators (KPIs) including financial and non-financial measures of performance through our Performance Management Program.
• Establish short and long-term incentive programs across the organization, for which the following principles apply:
– Short term annual cash bonus: • Individual bonus is earned and not a right;
For
per
sona
l use
onl
y

42
• Bonus is discretionary and distribution is related to outstanding achievement;
• Bonus is determined according to individual, team and Company performance;
• General labour market conditions for the position will be considered; and
• Frequency, timing and quantum of any incentive program must be approved by the CEO and the Board in respect of senior executives and executive directors.
– Long term performance based share options: Senior staff will be offered participation in the
Company’s approved Executive and Employee Option Plan. The Board will determine the conditions on which options are issued under this Plan. The options are issued at an exercise price being the weighted average sale price of the Company’s shares on ASX over the 5 trading days immediately prior to the date of issue of the options.
• Ensure remuneration planning continues to be integrated within the Company’s business planning process.
• Total reward levels and performance targets will be set at appropriate levels to reflect the competitive market in which we operate; the prevailing economic environment and the relative performance of comparator companies. The aim is to position outstanding performance within the top quartile of the industry.
The remuneration structure maintains its validity by conducting annual reviews taking into account individual performance, the economic environment, the unique requirement for certain employees to travel to and spend time in China, particularly at mine sites, and relevant job and industry comparisons. The company values the contribution of both individuals and teams in achieving the goals and objectives of the business and through our Performance Management Program our employees understand how their plans and efforts are linked to the organisation’s objectives and the interests of the shareholders.
The remuneration structure further recognises that whilst the Company is in the process of developing its projects and pursuing new opportunities, it should conserve its cash resources, and accordingly, where appropriate, should issue options under the approved Executive and Employee Option Plan as an integral part of its remuneration policy.
The total number of options over unissued shares that may be issued under the EOP, which added to the number of shares or options issued under all other employee or executive share or option plans of the Company must not exceed 10% of the total number of shares on issue from time to time.
Director remuneration for the year ended 31 December 2007Annual Emoluments Long Term Emoluments
Name Base Fee Other* BonusSuper-
annuation
Amortised value of options
granted * Total
% of remuneration for the year
consisting of options
$ $ $ $ $
J Askew 175,000 - - - - 175,000 -% J Klein 565,039 60,000 200,000 51,461 659,484 1,535,984 42.9% H Xu 366,972 22,000 125,000 33,028 423,323 970,323 43.6% B Davidson 85,000 - 25,000 - - 110,000 -% P Cassidy 42,500 - - 42,500 - 85,000 -% J Zhong 83,245 - - 1,755 13,200 98,200 13.4% P Housden 38,991 - 25,000 46,009 63,677 173,677 36.7% J Dowsley 35,417 - - - - 35,417 -%
1,392,164 82,000 375,000 174,753 1,159,684 3,183,601 36.4%
* Interest benefits under ESIS loans. During the year Mr. Klein repaid $390,665 ESIS loans and Mr. Xu repaid $137,880. The loans are interest free – details of the terms of the ESIS loans are set out in note 22 of the financial statements.
Directors’ ReportFor the year ended 31 December 2007
For
per
sona
l use
onl
y

A n n u a l R e p o r t 2 0 0 7
43
Director remuneration for the year ended 31 December 2006Annual Emoluments Long Term Emoluments
Name Base Fee Other* BonusSuper-
annuation
Amortised value of options
granted ** Total
% of remuneration
for the year consisting of
options
$ $ $ $ $
J Askew 94,799 - - 8,467 103,266 8.2% J Klein 527,969 80,000 150,000 47,031 303,833 1,108,833 27.4% H Xu 345,559 29,000 125,000 24,440 189,750 713,749 26.6% B Davidson 85,000 - - 8,467 93,467 9.1% P Cassidy 131,250 - 31,425 8,467 171,142 4.9% J Zhong 77,982 - 7,018 13,200 98,200 13.4% P Housden - - 42,500 - 42,500 -
1,262,559 109,000 275,000 152,414 532,184 2,331,157 22.8%
* Interest benefits under ESIS loans.
No housing or other allowances are paid to directors and no inducements are paid to directors to join the Board. No director has waived or agreed to waive any emoluments.
Remuneration of the 5 named executives who receive the highest remuneration for the year ended 31 December 2007
Annual Emoluments Long Term Emoluments
Name Base Fee BonusSuper-
annuation
Amortised value of options
granted ** Total
% of remuneration
for the year consisting of
options
$ $ $ $ $
C Johnstone – Chief Operating Officer 366,972 60,000 33,028 361,944 821,944 44.0%
P Uttley – Chief Geologist 253,211 125,000 2,752 378,229 759,192 49.8%
I Polovineo – Company Secretary 208,142 80,000 52,097 189,283 529,522 35.7%
T Norman – DGM Geology 183,486 50,000 16,514 106,011 356,011 29.8%
W Rossiter** - Chief Financial Officer 142,304 25,000 28,360 97,917 293,581 33.4%
1,154,115 340,000 132,751 929,456 2,556,322 36.4%
* The fair value of options granted have been valued using an option pricing model which takes account of factors such as the option exercise price, the current level and volatility of the underlying share price and the time to maturity of the option. The fair value of these options has not been recorded as an expense in the financial statements. The options granted have a 3 year vesting period and accordingly the benefits are allocated over that vesting period.
These options were issued pursuant to the Company’s Executive and Employee Option Plan approved by the Board on 28 August 2002 – refer Note 17(d).
** W. Rossiter commenced employment on 7 May 2007.
For
per
sona
l use
onl
y

44
Remuneration of the 5 named executives who receive the highest remuneration for the year ended 31 December 2006
Annual Emoluments Long Term Emoluments
Name Base Fee BonusSuper -
annuation
Amortised value of options
granted ** Total
% of remuneration
for the year consisting of
options
$ $ $ $ $
P Uttley – Chief Geologist 221,101 125,000 43,899 122,000 512,000 23.8%
C Johnstone – Chief Operating Officer
254,587 60,000 22,913 34,750 372,250 9.3%
I Polovineo – Chief Financial Officer
206,304 50,000 43,696 86,283 386,243 22.3%
S Zhang - GM HR and Administration
155,731 40,000 49,269 50,650 295,650 17.1%
D Zhang – Financial Controller 169,725 15,000 15,275 40,417 240,417 16.8%
1,007,448 290,000 175,052 334,100 1,806,600 18.5%
Employment Agreements• The Company entered into an agreement (“Employment Agreement”) dated 18 February 2008 with Mr. J Klein
for the provision of Mr. Klein’s services as President and Chief Executive Officer. The Employment Agreement is for a rolling 12 months period. There are no other benefits under the Agreement including termination benefits other than normal redundancy provisions. The remuneration under the Agreement is subject to review on an annual basis. There are no contractual entitlements to any bonuses.
• The Company entered into an agreement (“Employment Agreement”) dated 18 February 2008 with Mr. H Xu for the provision of Mr. Xu’s services as Executive Director. The Employment Agreement is for a rolling 12 months period. There are no other benefits under the Agreement including termination benefits other than normal redundancy provisions. The remuneration under the Agreement is subject to review on an annual basis. There are no contractual entitlements to any bonuses.
• The Company has entered into an agreement (“Employment Agreement”) with Mr. I Polovineo on 1 January 2004 for the provision of his services as Company Secretary. The Employment Agreement is for a rolling 12 month period. There are no other benefits under the Agreement including termination benefits other than normal redundancy provisions. The remuneration under the Agreement is subject to review on an annual basis. There are no contractual entitlements to any bonuses.
Save as disclosed above none of the Directors or Directors of any member of the Group have entered or proposed to enter into a service agreement expiring or determinable by the Company within one year without payment of compensation beyond statutory requirements.
During and at the end of the financial year, no director had any interest directly or indirectly in any contract of significance other than those stated above.
Directors’ ReportFor the year ended 31 December 2007
For
per
sona
l use
onl
y

A n n u a l R e p o r t 2 0 0 7
45
Compensation options: Granted and vested during the year
31/12/2007Granted Number Grant Date
Fair Value per option
at grant date ($)
Exercise price per
option ($) Expiry Date
First Exercise
Date
Last Exercise
DateVested
number %
Directors
J Klein 750,000 30/05/2007 2.35 6.50 31/12/2011 31/05/2010 31/12/2011 100,000 7.1
H Xu 500,000 30/05/2007 2.35 6.50 31/12/2011 31/05/2010 31/12/2011 75,000 7.7
P Housden 120,000 30/05/2007 2.35 6.50 31/12/2011 31/05/2010 31/12/2011 - -
Executives
C Johnstone 275,000 8/11/2007 3.76 7.65 9/11/2012 9/11/2010 9/11/2012 - -
P Uttley 150,000 8/11/2007 3.76 7.65 9/11/2012 9/11/2010 9/11/2012 150,000 19.5
I Polovineo 75,000 8/11/2007 3.76 7.65 9/11/2012 9/11/2010 9/11/2012 20,000 5.1
T Norman 20,000 8/11/2007 3.76 7.65 9/11/2012 9/11/2010 9/11/2012 - -
W Rossiter 150,000 9/05/2007 2.82 5.87 30/09/2012 10/05/2010 30/09/2012 - -
W Rossiter 75,000 8/11/2007 3.76 7.65 9/11/2012 9/11/2010 9/11/2012 - -
Total 2,115,000 345,000
31/12/2006Granted Number Grant Date
Fair Value per option
at grant date ($)
Exercise price per
option ($) Expiry Date
First Exercise
Date
Last Exercise
DateVested
number %
Directors
J Klein 500,000 31/12/2005 1.47 3.29 31/12/2010 1/01/2009 31/12/2010 300,000 28.6
H Xu 300,000 31/12/2005 1.47 3.29 31/12/2010 1/01/2009 31/12/2010 200,000 42.1
Executives
C Johnstone 300,000 31/12/2006 2.35 6.50 31/12/2011 1/01/2010 31/12/2011 - -
P Uttley 300,000 31/12/2006 2.35 6.50 31/12/2011 1/01/2010 31/12/2011 - -
I Polovineo 125,000 31/12/2006 2.35 6.50 31/12/2011 1/01/2010 31/12/2011 25,000 7.8
T Norman 130,000 31/12/2006 2.35 6.50 31/12/2011 1/01/2010 31/12/2011 - -
W Rossiter - - - - - - - - -
Total 1,655,000 525,000
Options granted as part of remuneration
31/12/2007
Value of options granted during the
year ($)
Value of options exercised during the
year ($)
Value of options lapsed during the
year ($)
Total value of options granted,
exercised and lapsed during the
year ($)
Remuneration consisting of
options for the year %
J Klein 1,762,000 569,000 - 2,331,000 42.90H Xu 1,175,000 - - 1,175,000 43.60P Housden 282,000 - - 282,000 36.70C Johnstone 1,034,000 - - 1,034,000 44.00P Uttley 564,000 - - 564,000 49.80I Polovineo 282,000 - - 282,000 35.70T Norman 75,200 - - 75,200 29.80W Rossiter 705,000 - - 705,000 33.40
For
per
sona
l use
onl
y

46
Auditor Independence and Non-audit Services
The directors received the following declaration from the auditors of Sino Gold Mining Limited.
AUDITOR’S INDEPENDENCE DECLARATION TO THE DIRECTORS OF SINO GOLD MINING LIMITEDIn relation to our audit of the financial report of Sino Gold Mining Limited for the financial year ended 31 December 2007, to the best of my knowledge and belief, there have been no contraventions of the auditor independence requirements of the Corporations Act 2001 or any applicable code of professional conduct.
Ernst & Young
Paul FlynnPartner20 February 2008
NON-AUDIT SERVICESThe following non-audit service was provided by the entity’s auditor, Ernst & Young. The directors are satisfied that the provision of non-audit services is compatible with the general standard of independence for auditors imposed by the Corporations Act 2001. The nature and scope of each type of non-audit service provided means that auditor independence was not compromised.
Ernst & Young received or are due to receive the following amounts for the provision of non-audit service:
$
Golden China prospectus costs 79,000Total 79,000
Signed in accordance with a resolution of directors.
J Askew J. Klein Chairman CEO
Sydney 20 February 2008
For
per
sona
l use
onl
y

A n n u a l R e p o r t 2 0 0 7
47
Corporate Governance StatementFor the year ended 31 December 2007
The Board of Directors of Sino Gold Mining Limited is responsible for the corporate governance of the consolidated entity. The Board guides and monitors the business and affairs of Sino Gold Mining Limited on behalf of the shareholders by whom they are elected and to whom they are accountable.
In accordance with the Australian Stock Exchange Corporate Governance Council’s recommendations, the Corporate Governance Statement must contain certain specific information and also report on the Company’s adoption of the Council’s best practice recommendations on an exception basis, whereby disclosure is required of any recommendations that have not been adopted by the Company, together with the reasons why they have not been adopted. Sino Gold Mining Limited’s corporate governance principles and policies are therefore structured with reference to the Corporate Governance Council’s best practice recommendations, which are as follows:
Principle 1. Lay solid foundations for management and oversight
Principle 2. Structure the board to add value
Principle 3. Promote ethical and responsible decision making
Principle 4. Safeguard integrity in financial reporting
Principle 5. Make timely and balanced disclosure
Principle 6. Respect the rights of shareholders
Principle 7. Recognise and manage risk
Principle 8. Encourage enhanced performance
Principle 9. Remunerate fairly and responsibly
Principle 10. Recognise the legitimate interests of stakeholders
Sino Gold Mining Limited’s corporate governance practices were in place throughout the year ended 31 December 2007 and were fully compliant with the Council’s best practice recommendations other than Principle 9 whereby the Company issued 120,000 options to a newly appointed non-executive director, Peter Housden. Such issue was approved by shareholders at the Annual General Meeting held on 30 May 2007. The Options were issued on the terms and conditions of Sino’s Executive and Employee Option Plan and were issued as part of the Company’s usual remuneration and incentive policies and in accordance with the policy adopted by the Company in respect of the issue of options to all non-executive directors under the Executive and Employee Option Plan.
STRUCTURE OF THE BOARDThe skills, experience and expertise relevant to the position of director held by each director in office at the date of the annual report is included in the Directors’ Report on page 1.
Corporate Governance Council Recommendation 2.1 requires a majority of the board to be independent directors. In addition, Recommendation 2.2 requires the chairperson of the company to be independent. The Corporate Governance Council defines independence as being free from any business or other relationship that could materially interfere with – or could reasonably be perceived to materially interfere with – the exercise of unfettered and independent judgment.
In accordance with the definition of independence above, and the materiality thresholds set, James Askew, Peter Cassidy, Brian Davidson and Peter Housden are viewed as the 4 independent Directors of the total 8 Directors of Sino Gold Mining Limited directors. Each of these independent directors have confirmed their independence pursuant to Rule 13.13 of SEHK and the Company therefore still considers the independent directors to be independent.
There are procedures in place, agreed by the board, to enable directors, in furtherance of their duties, to seek independent professional advice at the company’s expense.
The term in office held by each director in office at the date of this report is as follows:
Name Term in office Name Term in office
J Askew 5 years J Klein 7 yearsH Xu 7 years B Davidson 5 yearsP Cassidy 5 years J Zhong 4 yearsP Housden 2 years J Dowsley 6 months
PERFORMANCEThe board has functioned efficiently and effectively to achieve its goals during the financial year. The company had measurable and qualitative indicators to assess the performance of key executives for the 2007 financial year.
It is intended that the performance criteria against which directors and executives will be assessed will be aligned with the financial and non-financial objectives of Sino Gold Mining Limited.
For
per
sona
l use
onl
y
48
Corporate Governance StatementFor the year ended 31 December 2007
BOARD COMMITTEES
Nomination and Remuneration CommitteeRecommendation 2.4 requires listed entities to establish a nomination committee. During the year ended 31 December 2007, Sino Gold Mining Limited operated a joint nomination and remuneration committee. The duties and responsibilities typically delegated to such a committee are expressly included in the board’s own charter as being the responsibility of the full board. The board does not believe that any marked efficiencies or enhancements would be achieved by the creation of a separate nomination committee.
The Board is responsible for determining and reviewing compensation arrangements for the directors themselves and the chief executive officer and the executive team. The Board has established, as a single unit, a nomination and remuneration committee, comprising three non-executive directors. Members of this committee throughout the year were:
B. Davidson (Chairman) P Cassidy J Askew
This Committee convened 2 meetings during the year which was attended by all members.
Audit CommitteeThe Board has established an audit committee, which operates under a charter approved by the Board. It is the Board’s responsibility to ensure that an effective internal control framework exists within the entity. This includes internal controls to deal with both the effectiveness and efficiency of significant business processes, the safeguarding of assets, the maintenance of proper accounting records, and the reliability of financial information as well as non-financial considerations such as the benchmarking of operational key performance indicators. The Board has delegated the responsibility for the establishment and maintenance of a framework of internal control and ethical standards for the management of the consolidated entity to the audit committee.
The committee also provides the board with additional assurance regarding the reliability of financial information for inclusion in the financial reports. Recommendation 4.3 deals with the structure of the audit committee and requires independence of the members of the audit committee.
The members of the audit committee during the year were:
B. Davidson (Chairman) J Zhong P Housden
The Audit Committee convened 3 meetings during the year which were attended by all members entitled to attend.
Qualifications of audit committee members
Mr. Davidson LL.B. (Hons) is Chairman of the audit committee. Mr. Davidson is a consultant to Deacons, a major national law firm, having retired in 2004 after 37 years as a partner. Throughout that period, he practised in corporate and commercial law, capital raisings and project finance. He has served on the board of directors of 12 publicly listed companies, including 5 as Chairman, most of which were involved in the mining and exploration industries. Currently, he is also a director of a number of large private company groups and of the Pain Management Research Institute Ltd, Royal North Shore Hospital, Sydney. He is a Fellow of the Australian Institute of Company Directors.
Mr. Zhong is the Chief Financial Officer of Sino Mining International Limited and has held a number of senior finance positions with Minmetals Group Limited, Beijing, including Vice General Manager Finance and General Manager Auditing.
Mr. Housden has over 35 years experience in the accounting / finance / commercial fields crossing a number of industries including, manufacturing, resources, chemicals and professional services. During his 14 years as an executive in the resources sector, he was involved with petroleum, gold, coal, base metals, tin and mineral sands. He is a Fellow CPA, a member of the Finance and Treasury Association, a Fellow of the AICD and a member of its Reporting Committee.
Risk Management CommitteeThe members of the Risk committee during the year were:
P Cassidy (Chairman) J Askew B Davidson
The Risk Management Committee convened 2 meetings during the year which were attended by all members.
The group takes a proactive approach to risk management. The Risk Committee is responsible for ensuring that risks, and also opportunities, are identified on a timely basis and that the group’s objectives and activities are aligned with the risks and opportunities identified by the Board.
Areas of risk which are considered by the Risk Management Committee include:
• safety • the environment • the community in which the company operates| • minimization of business risk.
For
per
sona
l use
onl
y

A n n u a l R e p o r t 2 0 0 7
49
Group Group Parent Parent 2007 2006 2007 2006 Note $’000 $’000 $’000 $’000
Sales revenue (net of hedging) 2 24,281 8,695 - -Cost of sales (24,509) (7,803) - -Depreciation and amortisation 2 (3,449) - - -
Gross profit /(loss) (3,677) 892 - -
Other income 2 3,818 3,962 3,818 19,928Occupancy expenses (590) (636) (590) (636)Staff costs (2,836) (2,086) (2,836) (2,086)Share base payment (3,793) (1,296) (3,793) (1,296)Administrative expenses (4,580) (4,255) (4,580) (3,958)Deferred exploration costs written off (1,545) - (1,545) -Gain/(Loss) on fair value of vested share options 2 1,303 (11,421) 1,303 (11,421)Foreign exchange gain/(loss) 1,564 962 (2,070) -
(Loss)/profit before tax and finance costs (10,336) (13,878) (10,292) 531
Conversion of convertible notes 2 (6,484) - (6,484) Other finance costs 2 (7,981) (6,176) (11) (3,705)Loss before income tax (24,801) (20,054) (16,788) (3,174)Income tax expense 3 (138) - - -
Net loss for the period (24,939) (20,054) (16,788) (3,174)
Attributable to: Minority interest (1,443) - - -Members of the parent (23,497) - (16,788) -Basic earnings per share (cents per share) 29 (13.23) (13.7) Diluted earnings per share (cents per share) 29 (13.23) (13.7)
Income StatementFor the year ended 31 December 2007
For
per
sona
l use
onl
y

50
Balance SheetYear ended 31 December 2007
Group Group Parent Parent 2007 2006 2007 2006 Note $’000 $’000 $’000 $’000
CURRENT ASSETS Cash and cash equivalents 26(a) 108,953 21,505 101,380 19,119Trade and other receivables 4 5,196 2,550 996 1,735Inventories 5 35,529 1,412 - -Other 6 6,453 6,967 2,180 6,967
Total Current Assets 156,131 32,434 104,556 27,821
NON-CURRENT ASSETS Receivables 7 1,331 3,067 97,528 83,304Other financial assets 8 11,381 - 284,804 55,116Property, plant and equipment 9 304,862 226 277 226Deferred exploration, evaluation and development costs 10 269,859 240,074 - -Total Non-Current Assets 587,433 243,367 382,609 138,646
TOTAL ASSETS 743,564 275,801 487,165 166,467
CURRENT LIABILITIES Trade and other payables 11 101,766 25,258 53,172 7,803Provisions 12 783 645 783 645Interest bearing liabilities 13 106,998 9,742 - -Derivatives 16 29,216 25,205 2,456 19,845
Total Current Liabilities 238,763 60,850 56,411 28,293
NON-CURRENT LIABILITIES Interest bearing liabilities 13 34,547 89,900 - 39,998Provisions 14 24,546 - - -Deferred tax liabilities 3 4,073 - - -Derivatives 16 95,755 71,138 2,475 -
Total Non Current Liabilities 158,921 161,038 2,475 39,998
TOTAL LIABILITIES 397,684 221,888 58,886 68,291
NET ASSETS 345,880 53,913 428,279 98,176
EQUITY Issued capital 17 527,970 168,259 527,970 168,259Convertible notes - equity component - 3,228 - 3,228Other reserves 18 (137,600) (87,343) (24,197) (14,605)Accumulated losses (87,802) (64,305) (75,494) (58,706)Total parent entity interest 302,568 19,839 428,279 98,176Outside equity interests 43,312 34,074 - -
TOTAL EQUITY 345,880 53,913 428,279 98,176
For
per
sona
l use
onl
y

A n n u a l R e p o r t 2 0 0 7
51
Group Group Parent Parent 2007 2006 2007 2006 Note $’000 $’000 $’000 $’000
CASH FLOWS FROM OPERATING ACTIVITIES Cash receipts from customers 33,767 8,695 - -Hedging loss (9,292) - - -Payments to suppliers and employees (35,225) (14,838) (9,644) (7,214)Interest received 4,946 1,516 4,946 1,510Finance costs paid (15,225) (3,842) (7,255) (2,671)Other receipts 66 317 66 21
Net Cash Flows used in Operating Activities 26 (b) (20,963) (8,152) (11,887) (8,354)
CASH FLOWS FROM INVESTING ACTIVITIES Proceeds from sale of property, plant & equipment 1,251 - 1,251 -Payment for property, plant and equipment (278) (107) (278) (107)Exploration, evaluation and development (104,467) (117,893) - -Acquisition of Golden China Resources Corporation (5,867) - - -Acquisition of Eastern Dragon asset (51,044) - - -
Net Cash Flows (used in)/from Investing Activities (160,405) (118,000) 973 (107)
CASH FLOWS FROM FINANCING ACTIVITIES Proceeds from employee loan repayments 1,243 394 1,243 394Repayment of loans (5,077) - - -Loans (to)/from related entities - - (114,030) (51,012)Proceeds from share issues 236,863 66,034 236,863 66,034Share issue costs (11,842) (3,685) (11,842) (3,685)Proceeds from bank loan 56,640 60,640 - -Hong Kong listing fees prepaid - (854) - (854)
Net Cash Flows from Financing Activities 277,827 122,529 112,234 10,877
NET (DECREASE)/INCREASE IN CASH AND CASH EQUIVALENTS 96,459 (3,623) 101,320 2,416
Add opening cash brought forward 21,505 28,769 19,119 14,565Effects of exchange rate changes on cash (9,011) (3,641) (19,059) 2,138
CLOSING CASH 26 (a) 108,953 21,505 101,380 19,119
Statement of Cash FlowsYear ended 31 December 2007
For
per
sona
l use
onl
y

52
Statement of Changes in EquityFor the year ended 31 December 2007
Year to 31 December 2007
Issued capital
Convertible notes
Equity component
Retained earnings
Other Reserves
Outside
equity interest Total
CONSOLIDATED $’000 $’000 $’000 $’000 $’000 $’000
At 1 January 2007 168,259 3,228 (64,305) (87,343) 34,074 53,913Currency translation differences - - - (6,090) (3,015) (9,105)Effective hedging loss recycled to income statement - - - 6,423 - 6,423Ineffective hedging loss expensed - - - 2,869 - 2,869Movement in fair value of cashflow hedges – Note 16 - - - (59,648) - (59,648)Total income and expenses for the year recognised directly in equity - - - (56,446) (3,015) (59,461)Loss for the year - - (23,497) - - (23,497)Total income and expenses for the period - - (23,497) (56,446) (3,015) (82,958)Allotment of new shares 321,587 - - - - 321,587Convertible notes conversion into equity 44,457 (3,228) - - - 41,229Exercise of options 5,509 - - - - 5,509Share issue costs (11,842) - - - - (11,842)Movement in the fair value of share options - - - 16,092 - 16,092Cost of share based payments - - - 3,793 - 3,793Re-measurement of minority interest - - - (13,696) 13,696 -Minority interest share of loss for the period - - - - (1,443) (1,443)At 31 December 2007 527,970 - (87,802) (137,600) 43,312 345,880At 1 January 2006 101,949 3,228 (44,251) (32,243) 11,491 40,174Hedge mark to market – Note 16 - - - (52,550) - (52,550)Currency translation differences - - - (3,846) - (3,846)Total income and expenses for the year recognised directly in equity - (56,396) - (56,396)Loss for the year - - (20,054) - - (20,054)Total income and expenses for the period - - (20,054) (56,396) - (76,450)Allotment of new shares 63,531 - - - - 63,531Share issue costs (3,685) - - - - (3,685)Exercise of options 6,464 - - - - 6,464Cost of share based payments - - - 1,296 - 1,296Share of Jinfeng construction costs - - - - 22,583 22,583At 31 December 2006 168,259 3,228 (64,305) (87,343) 34,074 53,913
For
per
sona
l use
onl
y

A n n u a l R e p o r t 2 0 0 7
53
Year to 31 December 2006
Issued capital
Convertible notes
Equity component
Retained earnings
Other Reserves Total
PARENT $’000 $’000 $’000 $’000 $’000
At 1 January 2006 101,949 3,228 (55,532) (31,305) 18,340Accounting restatement - recognised hedging reserve on Parent * 28,435 28,435Restated balance at 1 January 2006 101,949 3,228 (55,532) (2,870) 46,775Currency translation differences - - - 15,404 15,404Total income and expenses for the year recognised directly in equity - - - 15,404 15,404Loss for the period - - (3,174) - (3,174)Total income and expenses for the year - - (3,174) 15,404 12,230Allotment of new shares 63,531 - - - 63,531Share issue costs (3,685) - - - (3,685)Exercise of options 6,464 - - - 6,464Cost of share based payments - - - 1,296 1,296At 31 December 2006 168,259 3,228 (58,706) (14,605) 98,176Currency translation differences - - - (26,996) (26,996)Total income and expenses for the year recognised directly in equity - - - (26,996) (26,996)Loss for the period - - (16,788) - (16,788)Total income and expenses for the year - - (16,788) (26,996) (43,784)Allotment of new shares 321,587 - - - 321,587Convertible notes conversion into equity 44,457 (3,228) - - 41,229Exercise of options 5,509 - - - 5,509Share issue costs (11,842) - - - (11,842)Movement in the fair value of share options - - - 13,611 13,611Cost of share based payments - - - 3,793 3,793At 31 December 2007 527,970 - (75,494) (24,197) 428,279
* The cash-flow hedge liabilities and equity reserve have previously been disclosed within the parent entity balance sheet. The cash-flow hedges are recorded in Sino Gold Guizhou Pty Limited, which is a wholly-owned subsidiary of the parent entity. The effect was to understate the parent entity equity by $28.4 million and overstate liabilities by $28.4 million as at 1/1/06, and to understate parent equity by $79.0 million and overstate liabilities by $79.0 million as at 31/12/06. There is no 2006 income statement impact. The cash-flow hedges remain accounted for correctly in the consolidated entity and so have not required restatement. There is no impact on the underlying hedge accounting treatment in Sino Gold Guizhou Pty Limited.F
or p
erso
nal u
se o
nly

54
Notes to the Financial StatementsFor the year ended 31 December 2007
1. SUMMARY OF SIGNIFICANT ACCOUNTING POLICIES
(a) Basis of preparationThe financial report is a general-purpose financial report, which has been prepared in accordance with the requirements of the Corporations Act 2001 and Australian Accounting Standards. The financial report has been prepared in accordance with the historical cost convention except for derivative financial instruments that have been measured at fair value.
The financial report is presented in Australian dollars and all values rounded to the nearest thousand dollars ($’000) unless otherwise stated under the option
available to the company under ASIC class order 98/100. The company is an entity to which the class order applies.
(b) Statement of complianceThe financial report complies with Australian Accounting Standards, which include Australian equivalents to International Financial Reporting Standards (‘AIFRS’). The financial report also complies with International Financial Reporting Standards (IFRS).
The following table lists all applicable standards/interpretations not yet effective for the 31 December 2007 year end that the group has elected not to early adopt.
Reference Title Summary
Application date of standard* Impact on Group financial report
Application date for Group*
AASB 2007-1 Amendments to Australian Accounting Standards arising from AASB Interpretation 11
[AASB 2]
Amending standard issued as a consequence of AASB Interpretation 11 AASB 2 – Group and Treasury Share Transactions.
1 March 2007
This is consistent with the Group’s existing accounting policies for share-based payments, so the amendments are not expected to have any impact on the Group’s financial report.
1 January 2008
AASB 2007-3 Amendments to Australian Accounting Standards arising from AASB 8
[AASB 5, AASB, AASB 6, AASB 102, AASB 107, AASB 119, AASB 127, AASB 134, AASB 136, AASB 1023 & AASB 1038]
Amending standard issued as a consequence of AASB 8 Operating Segments.
1 January 2009
AASB 8 is a disclosure standard so will have no direct impact on the amounts included in the Group’s financial statements. However the amendments may have an impact on the Group’s segment disclosures as segment information included in internal management reports is more detailed than is currently reported under AASB 114 Segment Reporting.
1 January 2009
For
per
sona
l use
onl
y

A n n u a l R e p o r t 2 0 0 7
55
Reference Title Summary
Application date of standard* Impact on Group financial report
Application date for Group*
AASB 2007-4 Amendments to Australian Accounting Standards arising from ED 151 and Other Amendments
[AASB 1, 2, 3, 4, 5, 6, 7, 102, 107, 108, 110, 112, 114, 116, 117, 118, 119, 120, 121, 127, 128, 129, 130, 131, 132, 133, 134, 136, 137, 138, 139, 141, 1023 & 1038]
Amendments arising as a result of the AASB decision that, in principle, all options that currently exist under IFRSs should be included in the Australian equivalents to IFRSs and additional Australian disclosures should be eliminated, other than those now considered particularly relevant in the Australian reporting environment.
1 July 2007
These amendments are expected to reduce the extent of some disclosures in the Group’s financial report.
1 January 2008
AASB 2007-6 Amendments to Australian Accounting Standards arising from AASB 123
[AASB 1, AASB 101, AASB 107, AASB 111, AASB 116 & AASB 138 and Interpretations 1 & 12]
Amending standard issued as a consequence of revisions to AASB 123 Borrowing Costs.
1 January 2009
The amendments to AASB 123 require that all borrowing costs associated with a qualifying asset be capitalised. The Group has capitalised borrowing costs associated with qualifying assets and as such the amendments are not expected to have any impact on the Group’s financial report.
1 January 2009
AASB 2007-7 Amendments to Australian Accounting Standards
[AASB 1, AASB 2, AASB 4, AASB 5, AASB 107 & AASB 128]
Amending standards for wording errors, discrepancies and inconsistencies.
1 July 2007
The amendments are minor and do not affect the recognition, measurement or disclosure requirements of the standards. Therefore the amendments are not expected to have any impact on the Group’s financial report.
1 January 2008
For
per
sona
l use
onl
y

Notes to the Financial StatementsFor the year ended 31 December 2007
56
Reference Title Summary
Application date of standard* Impact on Group financial report
Application date for Group*
AASB 2007-8 Amendments to Australian Accounting Standards arising from AASB 101
Amending standard issued as a consequence of revisions to AASB 101 Presentation of Financial Statements
1 January 2009
The amendments are expected to only affect the presentation of the Group’s financial report and will not have a direct impact on the measurement and recognition of amounts under the current AASB 101. The Group has not determined at this stage whether to present the new statement of comprehensive income as a single or two statements.
1 January 2009
AASB 8 Operating Segments
New standard replacing AASB 114 Segment Reporting, which adopts a management approach to segment reporting.
1 January 2009
Refer to AASB 2007-3 above. 1 January 2009
AASB 101 (revised)
Presentation of Financial Statements
Introduces a statement of comprehensive income.
Other revisions include impacts on the presentation of items in the statement of changes in equity, new presentation requirements for restatements or reclassifications of items in the financial statements, changes in the presentation requirements for dividends and changes to the titles of the financial statements.
1 January 2009
Refer to AASB 2007-8 above. 1 January
2009
AASB 123 (revised)
Borrowing Costs The amendments to AASB 123 require that all borrowing costs associated with a qualifying asset must be capitalised.
1 January 2009
Refer to AASB 2007-6 above. 1 January 2009F
or p
erso
nal u
se o
nly

A n n u a l R e p o r t 2 0 0 7
57
Reference Title Summary
Application date of standard* Impact on Group financial report
Application date for Group*
AASB Interpretation 4 (revised)
Determining whether an Arrangement contains a Lease
The revised Interpretation specifically scopes out arrangements that fall within the scope of AASB Interpretation 12.
1 January 2008
Refer to AASB 2007-2 above. 1 January 2008
AASB Interpretation 11
AASB 2 – Group and Treasury Share Transactions
Addresses whether certain types of share-based payment transactions with employees (or other suppliers of good and services) should be accounted for as equity-settled or as cash-settled transactions under AASB 2. It also specifies the accounting in a subsidiary’s financial statements for share-based payment arrangements involving equity instruments of the parent.
1 March 2007
Refer to AASB 2007-1 above. 1 January 2008
*designates the beginning of the applicable annual reporting period unless otherwise stated
(c) Basis of consolidationThe consolidated financial statements comprise the financial statements of Sino Gold Mining Limited and its subsidiaries (‘the Group’).
The financial statements of subsidiaries are prepared for the same reporting period as the parent company, using consistent accounting policies.
Adjustments are made to bring into line any dissimilar accounting policies that may exist. All inter-company balances and transactions, including unrealised profits arising from intra-group transactions, have been eliminated in full. Unrealised losses are eliminated unless costs cannot be recovered.
Subsidiaries are consolidated from the date on which control is transferred to the Group and cease to be consolidated from the date on which control is transferred out of the Group. The parent entity measures its investment in subsidiaries at cost.
Where there is loss of control of a subsidiary, the consolidated financial statements include the results for the part of the reporting period during which Sino Gold Mining Limited has control.
The minority interests represent the interest not held by the Group.
For
per
sona
l use
onl
y

Notes to the Financial StatementsFor the year ended 31 December 2007
58
(d) Foreign currency translationBoth the functional currency of Sino Gold Mining Limited and its Australian subsidiaries is United States dollars (“US$”). The presentation currency of the Group is Australian dollars (“A$”).
Transactions in foreign currencies are initially recorded in the functional currency at the exchange rates ruling at the date of the transaction. Monetary assets and liabilities denominated in foreign currencies are retranslated at the rate of exchange ruling at the balance sheet date.
All differences in the consolidated financial report are taken to the income statement with the exception of differences on foreign currency borrowings that provide a hedge against a net investment in a foreign entity. These are taken directly to equity until the disposal of the net investment, at which time they are recognised in the income statement. Tax charges and credits attributable to exchange differences on those borrowings are also recognised in equity.
Non-monetary items that are measured in terms of historical cost in a foreign currency are translated using the exchange rate as at the date of the initial transaction.
Non-monetary items measured at fair value in a foreign currency are translated using the exchange rates at the date when the fair value was determined.
The functional currency of the overseas subsidiaries is Renmimbi Yuan (“RMB”).
As at the reporting date the assets and liabilities of these overseas subsidiaries are translated into the presentation currency of Sino Gold Mining Limited at the rate of exchange ruling at the balance sheet date and the income statements are translated at the weighted average exchange rates for the period. The exchange differences arising on the retranslation are taken directly to a separate component of equity.
On disposal of a foreign entity, the deferred cumulative amount recognised in equity relating to that particular foreign operation is recognised in the income statement.
(e) Property, plant and equipmentCost and ValuationItems of property, plant and equipment are carried at cost less accumulated depreciation and any impairment in value.
Mineral propertiesAcquired mineral rights and pre-stripping costs are capitalised and classified as ‘Mineral properties’.
Waste pre-stripping costs incurred during the production phase are charged to the income statement as operating costs when the ratio of waste material to ore extracted is expected to be constant throughout its estimated life. When the ratio of waste to ore is not expected to be constant, production stripping costs are accounted for as follows:
• All costs are initially charged to the income statement and classified as operating costs.
• When the current ratio of waste to ore is greater than the estimated life-of-mine ratio, a portion of the stripping costs is capitalised.
• In subsequent years when the ratio of waste to ore is less than the estimated life-of-mine ratio, a portion of capitalised stripping costs is charged to the income statement as operating costs.
DepreciationDepreciation is provided on a straight-line basis over the estimated useful life of the asset, other than mine property and equipment, which are depreciated on a unit of production basis to an estimated residual value.
Major depreciation periods are 5 to 15 years for non-mining plant and equipment or the lease term for leasehold improvements.
ImpairmentThe carrying values of plant and equipment are reviewed for impairment when events or changes in circumstances indicate the carrying value may not be recoverable.
For an asset that does not generate largely independent cash inflows, the recoverable amount is determined for the cash-generating unit to which the asset belongs. If any such indication exists and where the carrying values exceed the estimated recoverable amount, the assets or cash-generating units are written down to their recoverable amount.
The recoverable amount of plant and equipment is the greater of fair value less costs to sell and value in use. In assessing value in use, the estimated future cash flows are discounted to their present value using a pre-tax discount rate that reflects current market assessments of the time value of money and the risks specific to the asset.
For
per
sona
l use
onl
y

A n n u a l R e p o r t 2 0 0 7
59
(f) Recoverable amount of assetsAt each reporting date, the Group assesses whether there is any indication that an asset may be impaired. Where an indicator of impairment exists, the Group makes a formal estimate of recoverable amount. Where the carrying amount of an asset exceeds its recoverable amount the asset is considered impaired and is written down to its recoverable amount.
Recoverable amount is the greater of fair value less costs to sell and value in use. It is determined for an individual asset, unless the asset’s value in use cannot be estimated to be close to its fair value less costs to sell and it does not generate cash inflows that are largely independent of those from other assets or groups of assets, in which case, the recoverable amount is determined for the cash-generating unit to which the asset belongs.
In assessing value in use, the estimated future cash flows are discounted to their present value using a pretax discount rate that reflects current market assessments of the time value of money and the risks specific to the asset.
(g) Interest-bearing loans and borrowingsAll loans and borrowings are initially recognised at cost, being the fair value of the consideration received net of issue costs associated with the borrowing.
After initial recognition, interest-bearing loans and borrowings are subsequently measured at amortised cost using the effective interest method. Amortised cost is calculated by taking into account any issue costs, and any discount or premium on settlement.
Gains and losses are recognised in the income statement when the liabilities are de-recognised and as well as through the amortisation process.
Borrowing costsBorrowing costs are recognised as an expense when incurred. In relation to qualifying assets, the borrowing costs directly associated with this asset are capitalised (including any other associated costs directly attributable to the borrowing and temporary investment income earned on the borrowing).
(h) Convertible NotesThe component of the convertible notes that exhibits characteristics of a liability is recognised as a liability in the balance sheet, net of issue costs.
On the issue of the convertible notes, the fair value of the liability component is determined using a market rate for an equivalent non-convertible bond and
this amount is carried as a long-term liability on the amortised cost basis until extinguished on conversion or redemption. The increase in the liability due to the passage of time, is recognised as a finance cost.
The remainder of the proceeds is allocated to the conversion option that is recognised and included in shareholders’ equity, net of issue costs. The value of the conversion option is not changed in subsequent years.
The corresponding equity dividends on those shares are charged as a distribution of profit and loss.
Issue costs are apportioned between the liability and equity components of the convertible notes based on the allocation of proceeds to the liability and equity components when the instruments are first recognised.
(i) Provisions and employee benefitsProvisions are recognised when the Group has a present obligation (legal or constructive) as a result of a past event, it is probable that an outflow of resources embodying economic benefits will be required to settle the obligation and a reliable estimate can be made of the amount of the obligation.
Where the Group expects some or all of a provision to be reimbursed, for example under an insurance contract, the reimbursement is recognised as a separate asset but only when the reimbursement is virtually certain. The expense relating to any provision is presented in the income statement net of any reimbursement.
If the effect of the time value of money is material, provisions are determined by discounting the expected future cash flows at a pre-tax rate that reflects current market assessments of the time value of money and, where appropriate, the risks specific to the liability. Where discounting is used, the increase in the provision due to the passage of time is recognised as a finance cost.
RehabilitationProvisions are made for mine rehabilitation and restoration. The present value of restoration obligations is recognised at commencement of the mining operations where a legal or constructive obligation exists at that time. The provision is recognised as a non-current liability with a corresponding asset recognised in relation to the mine site. At each reporting date the rehabilitation liability is remeasured in line with changes in discount rates, and timing or amount of the costs to be incurred.
For
per
sona
l use
onl
y

Notes to the Financial StatementsFor the year ended 31 December 2007
60
The provision recognised represents management’s best estimate of the present value of the future costs required. Significant estimates and assumptions are made in determining the amount of restoration and rehabilitation provisions. Those estimates and assumptions deal with uncertainties such as: requirements of the relevant legal and regulatory framework; the magnitude of possible contamination and the timing, extent and costs of required restoration and rehabilitation activity. These uncertainties may result in future actual expenditure differing from the amounts currently provided.
The provision recognised is periodically reviewed and updated based on the facts and circumstances available at the time. Changes to the estimated future costs for operating sites are recognised in the balance sheet by adjusting both the restoration and rehabilitation asset and provision. Such changes give rise to a change in future depreciation and financial charges.
Employee leave benefitsWages, salaries, annual leave and sick leave
Liabilities for wages and salaries, including non-monetary benefits, annual leave and accumulating sick leave expected to be settled within 12 months of the reporting date are recognised in respect of employees’ services up to the reporting date. They are measured at the amounts expected to be paid when the liabilities are settled. Expenses for non-accumulating sick leave are recognised when the leave is taken and are measured at the rates paid or payable.
Long service leaveThe liability for long service leave is recognised and measured as the present value of expected future payments to be made in respect of services provided by employees up to the reporting date using the projected unit credit method. Consideration is given to expected future wage and salary levels, experience of employee departures, and periods of service. Expected future payments are discounted using market yields at the reporting date on national government bonds with terms to maturity and currencies that match, as closely as possible, the estimated future cash outflows.
(j) Share-based payment transactionsThe Group provides benefits to employees (including directors) of the Group in the form of share-based payment transactions, whereby employees render services in exchange for shares or rights over shares (‘equity-settled transactions’). The Executive and Employee Option Plan (EOP) is in place to provide
these benefits. Options granted under this vest over a three year period and have no attaching market or performance conditions.
The cost of these equity-settled transactions with employees is measured by reference to the fair value at the date at which they are granted. The fair value is determined by an external valuer using a Black Scholes model and amortised over the vesting period.
The fair value of options as at the grant date is expensed to the income statement over the vesting period to the extent that it is expected that that these options will ultimately vest (ie - the service and performance conditions will be met). No adjustment is made for the likelihood of market performance conditions being met as the effect of these conditions is included in the determination of fair value at the grant date.
No expense is recognised for awards that do not ultimately vest, except for awards where vesting is conditional upon a market condition.
Where the terms of an equity-settled award are modified, as a minimum an expense is recognised as if the terms had not been modified. In addition, an expense is recognised for any increase in the value of the transaction as a result of the modification, as measured at the date of modification. Where an equity-settled award is cancelled, it is treated as if it had vested on the date of cancellation, and any expense not yet recognised for the award is recognised immediately. However, if a new award is substituted for the cancelled award, and designated as a replacement award on the date that it is granted, the cancelled and new award are treated as if they were a modification of the original award, as described in the previous paragraph.
The dilutive effect, if any, of outstanding options is reflected as additional share dilution in the computation of earnings per share.
Options granted to investors where there is no share based payment relationship and are denominated in a foreign currency are accounted for as derivative liabilities. These options are recorded on the balance sheet at fair value with any movements in fair value recorded directly in the income statement.F
or p
erso
nal u
se o
nly

A n n u a l R e p o r t 2 0 0 7
61
(k) RevenueRevenue is recognised to the extent that it is probable that the economic benefits will flow to the Group and the revenue can be reliably measured. The following specific recognition criteria must also be met before revenue is recognised:
Sale of goodsRevenue is recognised when the significant risks and rewards of ownership of the goods have passed to the buyer and can be measured reliably. Risks and rewards are considered passed to the buyer at the time of delivery of the goods to the customer, being when the gold bullion leaves the mine site.
InterestRevenue is recognised as the interest accrues (using the effective interest method, which is the rate that exactly discounts estimated future cash receipts through the expected life of the financial instrument) to the net carrying amount of the financial asset.
(l) InventoriesInventories are valued at the lower of cost and net realisable value.
Costs incurred in bringing each product to its present location and conditions are accounted for as follows:
• Consumable stores and spares – purchase cost on first-in-first-out basis; and
• Finished goods and work-in-progress – cost of direct material and labour and a proportion of manufacturing overhead based on normal operating capacity.
• Gold in circuit and in transit - cost of direct material and labour and a proportion of manufacturing overhead based on normal operating capacity.
• Ore stockpiles - cost of direct material and labour and a proportion of manufacturing overhead based on normal operating capacity.
(m) Derivative financial instrumentsForward Gold HedgesThe consolidated entity enters into forward gold hedges where it agrees to sell specified ounces of gold at a predetermined gold price. The objective of these hedges is to match the forward agreements with anticipated cash flows from future gold sales and as such are considered “cash flow” hedges under AASB139. The fair value of all qualifying cash flow hedges is recorded on the balance sheet. Movements in fair value, to the extent the hedges are effective, are recorded as a separate component of equity and released to the profit and loss at the time the hedged transaction occurs.
The fair value of forward gold hedge contracts are calculated by reference to current gold forward hedge contracts with similar maturity profiles on similar instruments. If the forecast transaction is no longer expected to occur, amounts recognised in equity are transferred to the income statement.
As at 31 December 2007, all gold derivatives have been treated as qualifying cash flow hedges.
(n) Income tax and other taxesCurrent tax assets and liabilities for the current and prior periods are measured at the amount expected to be recovered from or paid to the taxation authorities based on the current period’s taxable income. The tax rates and tax laws used to compute the amount are those that are enacted or substantively enacted by the balance sheet date.
Deferred income tax is provided on all temporary differences at the balance sheet date between the tax bases of assets and liabilities and their carrying amounts for financial reporting purposes. Deferred income tax liabilities are recognised for all taxable temporary differences except:
• When the deferred income tax liability arises from the initial recognition of goodwill or of an asset or liability in a transaction that is not a business combination and that, at the time of the transaction, affects neither the accounting profit nor taxable profit or loss; or
• When the taxable temporary difference is associated with investments in subsidiaries, associates or interests in joint ventures, and the timing of the reversal of the temporary difference can be controlled and it is probable that the temporary difference will not reverse in the foreseeable future.
For
per
sona
l use
onl
y

Notes to the Financial StatementsFor the year ended 31 December 2007
62
Deferred income tax assets are recognised for all deductible temporary differences, carry forward of unused tax credits and unused tax losses, to the extent that it is probable that taxable profit will be available against which the deductible temporary differences and the carry forward of unused tax credits and unused tax losses can be utilised, except:
• When the deferred income tax asset relating to the deductible temporary difference arises from the initial recognition of an asset or liability in a transaction that is not a business combination and, at the time of the transaction, affects neither the accounting profit nor taxable profit or loss; or
• When the deductible temporary difference is associated with investments in subsidiaries, associates or interests in joint ventures, in which case a deferred tax asset is only recognised to the extent that it is probable that the temporary difference will reverse in the foreseeable future and taxable profit will be available against which the temporary difference can be utilised.
The carrying amount of deferred income tax assets is reviewed at each balance sheet date and reduced to the extent that it is no longer probable that sufficient taxable profit will be available to allow all or part of the deferred income tax asset to be utilised.
Unrecognised deferred income tax assets are reassessed at each balance sheet date and are recognised to the extent that it has become probable that future taxable profit will allow the deferred tax asset to be recovered.
Deferred income tax assets and liabilities are measured at the tax rates that are expected to apply to the year when the asset is realised or the liability is settled, based on tax rates (and tax laws) that have been enacted or substantively enacted at the balance sheet date.
Deferred tax assets and deferred tax liabilities are offset only if a legally enforceable right exists to set off current tax assets against current tax liabilities and the deferred tax assets and liabilities relate to the same taxable entity and the same taxation authority.
Other taxesRevenues, expenses and assets are recognised net of the amount of GST except:
• When the GST incurred on a purchase of goods and services is not recoverable from the taxation authority, in which case the GST is recognised as
part of the cost of acquisition of the asset or as part of the expense item as applicable; and
• Receivables and payables, which are stated with the amount of GST included.
The net amount of GST recoverable from or payable to, the taxation authority is included as part of receivables or payables in the balance sheet.
Cash flows are included in the Cash Flow Statement on a gross basis and the GST component of cash flows arising from investing and financing activities, which is recoverable from, or payable to, the taxation authority is classified as part of operating cash flows.
Commitments and contingencies are disclosed net of the amount of GST recoverable from, or payable to, the taxation authority.
Value Added TaxGold sales in China are exempt from value added tax and no value added tax refunds are available for input tax credits other than for value added tax incurred on fixed assets for enterprises classified under the Encouraged Category as defined by the Chinese Development and Reform Committee.
Accordingly input value added tax paid is attached to the expenditure items and accounted for in the same manner as those items except where an input value added tax credit can be claimed in which case a current receivable is recognised.
(o) Cash and cash equivalentsCash in the balance sheet comprise cash at bank and short term deposits with an original maturity of three months or less.
For the purposes of the Cash Flow Statement, cash and cash equivalents consist of cash and cash equivalents as defined above, net of outstanding bank overdrafts.
Restricted cash represents cash held on deposit to secure the RMB working capital loans within China. These loans are securitised by Standby Letters of Credit issued by off-shore China banks on which restricted cash is held on deposit.
(p) Exploration and evaluation costsCosts arising from exploration and evaluation activities are carried forward provided such costs are expected to be recouped through successful development, or by sale, or where exploration and evaluation activities have not at balance date reached a stage to allow a reasonable assessment regarding the existence of economically recoverable reserves.
For
per
sona
l use
onl
y

A n n u a l R e p o r t 2 0 0 7
63
Grants and subsidies are offset against costs as incurred. Costs carried forward in respect of an area of interest that is abandoned are written off in the period in which the decision to abandon is made.
(q) Development costsCosts incurred in the development and construction of a mining operation are capitalized to the extent that the carrying amount does not exceed recoverable amount. Once production commences the carrying value is transferred to property, plant and equipment and depreciated accordingly.
(r) Significant accounting estimatesOption ValuesThe Group is required to determine the fair value of options granted to employees and seed investors as per the accounting policy note in paragraph (j) above. The fair value is determined using a Black Scholes model with the assumption detailed in Note 17(c).
Gold DerivativesThe Group is also required to determine the fair value of gold derivatives as per the accounting policy note in paragraph (m) above.
RehabilitationThe group is required to estimate the rehabilitation costs of its operations in the accounting policy note in paragraph (i) above. The estimate is based on management best estimate of the cost.
Exploration and evaluation costsThe group applies judgment in determining which exploration costs should be capitalised or expensed as per the accounting policy in above note (p).
ReservesReserves are estimates of the amount of metal that can be economically and legally extracted from the Group’s mining properties. In order to calculate reserves, estimates and assumptions are required about a range of geological, technical and economic factors, including quantities, grades, production techniques, recovery rates, production costs, transport costs, commodity prices and exchange rates.
Estimating the quantity and/or grade of reserves requires the size, shape and depth of ore bodies or fields to be determined by analysing geological data such as drilling samples. This process may require
complex and difficult geological judgments and calculations to interpret the data.
The Group is required to determine and report ore reserves in Australia under the principles incorporated in the Australasian Code for Reporting of Mineral Resources and Ore Reserves December 2004, known as the JORC Code. The JORC Code requires the use of reasonable investment assumptions to calculate reserves.
Because the economic assumptions used to estimate reserves change from period to period, and because additional geological data is generated during the course of operations, estimates of reserves may change from period to period. Changes in reported reserves may affect the Group’s financial results and financial position in a number of ways, including the following:
• Asset carrying values may be affected due to changes in estimated future cash flows.
• Depreciation, depletion and amortisation charged in the income statement may change where such charges are determined by the units of production basis, or where the useful economic lives of assets change.
• Overburden removal costs recorded on the balance sheet or charged to the income statement may change due to changes in stripping ratios or the units of production basis of depreciation.
• Decommissioning, site restoration and environmental provisions may change where changes in estimated reserves affect expectations about the timing or cost of these activities.
• The carrying value of deferred tax assets may change due to changes in estimates of the likely recovery of the tax benefits.
(s) Business combinationsThe purchase method of accounting is used to account for all business combinations regardless of whether equity instruments or other assets are acquired. Cost is measured as the fair value of the assets given, shares issued or liabilities incurred or assumed at the date of exchange plus costs directly attributable to the combination. Where equity instruments are issued in a business combination, the fair value of the instruments is their published market price as at the date of exchange. Transaction costs arising on the issue of equity instruments are recognised directly in equity.
For
per
sona
l use
onl
y

Notes to the Financial StatementsFor the year ended 31 December 2007
64
Except for non-current assets or disposal groups classified as held for sale (which are measured at fair value less costs to sell), all identifiable assets acquired and liabilities and contingent liabilities assumed in a business combination are measured initially at their fair values at the acquisition date. Goodwill on acquisition, being the excess of the cost of the business combination over the net fair value of the Group’s share of the identifiable net assets acquired, is recognised mineral reserves as goodwill does not exist within the mining industry. If the cost of acquisition is less than the Group’s share of the net fair value of the identifiable net assets of the subsidiary, the difference is recognised as a gain in the income statement, but only after a reassessment of the identification and measurement of the net assets acquired.
Where settlement of any part of the consideration is deferred, the amounts payable in the future are discounted to their present value as at the date of exchange. The discount rate used is the entity’s incremental borrowing rate, being the rate at which a similar borrowing could be obtained from an independent financier under comparable terms and conditions.
(t) Segment reportingA business segment is a distinguishable component of the entity that is engaged in providing products or services that are subject to risks and returns that are different to those of other operating business segments. Management has assessed the reportable business segments under AASB 114 Segment Reporting and have determined that on adoption of AASB 8 Segment Reporting (applicable from 1 January 2009), no additional operating segments will most likely be reported. A geographical segment is a distinguishable component of the entity that is engaged in providing products or services within a particular economic environment and is subject to risks and returns that are different than those of segments operating in other economic environments.
(u) Investments and other financial assetsInvestments and financial assets in the scope of AASB 139 Financial Instruments: Recognition and Measurement are categorised as either financial assets at fair value through profit or loss, loans and receivables, held-to-maturity investments, or available-for-sale financial assets. The classification depends on the purpose for which the investments were acquired. Designation is re-evaluated at each financial year end, but there are restrictions on reclassifying to other categories.
When financial assets are recognised initially, they are measured at fair value, plus, in the case of assets not at fair value through profit or loss, directly attributable transaction costs.
Recognition and de-recognition.Regular purchases or sales are purchases or sales of financial assets under contracts that require delivery of the assets within the period established generally by regulation or convention in the market place. All regular purchases and sales of financial assets are recognised on the trade date being the date that the Group commits to purchase the asset. Financial assets are de-recognised when the right to receive cash flows from the financial assets have expired or been transferred.
Financial assets at fair value through profit or lossFinancial assets classified as held for trading are included in the category ‘financial assets at fair value through profit or loss’. Financial assets are classified as held for trading if they are acquired for the purpose of selling in the near term with the intention of making a profit. Derivatives are also classified as held for trading unless they are designated as effective hedging instruments. Gains or losses on financial assets held for trading are recognised in profit or loss and the related assets are classified as current assets in the balance sheet.
For
per
sona
l use
onl
y

A n n u a l R e p o r t 2 0 0 7
65
Available-for-sale securitiesAvailable-for-sale investments are those non-derivative financial assets, principally equity securities, that are designated as available-for-sale or are not classified as any of the three preceding categories. After initial recognition available-for sale securities are measured at fair value with gains or losses being recognised as a separate component of equity until the investment is de-recognised or until the investment is determined to be impaired, at which time the cumulative gain or loss previously reported in equity is recognised in profit or loss.
The fair values of investments that are actively traded in organised financial markets are determined by reference to quoted market bid prices at the close of business on the balance sheet date. For investments with no active market, fair values are determined using valuation techniques. Such techniques include: using recent arm’s length market transactions; reference to the current market value of another instrument that is substantially the same; discounted cash flow analysis and option pricing models making as much use of available and supportable market data as possible and keeping judgmental inputs to a minimum.
Investments in subsidiary are held at cost.
(v) Trade and other payablesTrade and other payables are carried at amortised cost due to their short term nature and are not discounted. They represent liabilities for goods and services provided to the Group prior to the end of the financial year that are unpaid and arise when the Group becomes obliged to make future payments in respect of the purchase of these goods and services. The amounts are unsecured and are usually paid within 30 days of recognition, except retention amounts which will be due after 12 months. Amounts due after 12 months are discounted where the effect is material.
(w) Earnings per shareBasic earnings per share is calculated as net profit attributable to members of the parent, adjusted to exclude any costs of servicing equity (other than dividends) and preference share dividends, divided by the weighted average number of ordinary shares, adjusted for any bonus element.
Diluted earnings per share is calculated as net profit attributable to members of the parent, adjusted for:
• costs of servicing equity (other than dividends) and preference share dividends;
• the after tax effect of dividends and interest associated with dilutive potential ordinary shares that have been recognised as expenses; and
• other non-discretionary changes in revenues or expenses during the period that would result from the dilution of potential ordinary shares; divided by the weighted average number of ordinary shares and dilutive potential ordinary shares, adjusted for any bonus element.
(x) Contributed equityOrdinary shares are classified as equity. Incremental costs directly attributable to the issue of new shares or options are shown in equity as a deduction, net of tax, from the proceeds.
For
per
sona
l use
onl
y

Notes to the Financial StatementsFor the year ended 31 December 2007
66
Group Group Parent Parent 2007 2006 2007 2006 $’000 $’000 $’000 $’000
2. PROFIT AND LOSS ITEMS
Loss from ordinary activities is after crediting the following revenues: Revenue from operating activities: Product sales - spot 33,573 8,695 - -Hedging loss – pre commercial production (2,050) - - -Hedging loss – post commercial production (7,242) - - -
Sales revenue 24,281 8,695 - -
Income from non-operating activities: Interest received 3,752 1,516 3,752 1,510Gain on sale of Jianchaling - 2,129 - 18,397Other 66 317 66 21
Total other income 3,818 3,962 3,818 19,928
Loss from ordinary activities is after charging the following expenses: Depreciation and amortisation: Depreciation of: - Leasehold improvements 678 12 20 12- Plant, property and equipment 2,895 66 104 66
3,573 78 124 78
Finance costs: Conversion of convertible notes* 6,484 - 6,484 -Amortization of borrowing costs 696 555 209 449Borrowing costs** 7,285 5,620 (198) 3,255
14,465 6,176 6,495 3,705
Other expense items: Government mining royalties incurred 198 253 - -Operating lease rental 268 250 268 250Deferred exploration costs written off 1,545 - 1,545 -Share based payment 3,793 1,296 3,793 1,296(Gain)/Losses on fair value movement of vested seed options*** (1,303) 11,421 (1,303) 11,421 * Refer to Note 13 – comment (a).
** Under the Jinfeng Standby L/C facility RMB lending is secured by cash held on deposit that earns interest by the parent entity. This interest income is, on consolidation, netted against the interest paid on the RMB lending in relation to Jinfeng.
*** Last year’s loss and this year’s gain are both related to the movement in the fair value of options granted to seed shareholders. The accounting policy is described in note 1(j) above.
For
per
sona
l use
onl
y

A n n u a l R e p o r t 2 0 0 7
67
Group Group Parent Parent 2007 2006 2007 2006 $’000 $’000 $’000 $’000
3. INCOME TAX
(a) Income tax expense The major components of income tax expense are: Current income tax charge - - - -Deferred income tax Relating to origination and reversal of temporary differences (138) - - -
Income tax expense reported in the income statement (138) - - -
(b) A reconciliation of income tax expense applicable to accounting loss before income tax at the statutory income tax rate to income tax expense is as follows:Accounting loss before income tax (24,801) (20,054) (16,788) (3,174)At the statutory income tax rate of 30% (2006: 30%) (7,440) (6,016) (5,036) (952)Overseas tax rate differential 1,240 - - -Deferred tax asset not recognized 6,062 6,016 5,036 952
Income expense relating to ordinary activities (138) - - -
Deferred tax asset* arising from tax losses and timing differences not brought to account at balance date as realisation of the benefit is not regarded as probable 6,299 10,491 6,299 10,491 Group Balance Sheet Group Income Statement
2007 2006 2007 2006 $’000 $’000 $’000 $’000
(c) Recognised deferred tax assets & liabilities Deferred tax liabilities: Accelerated depreciation (777) - (777) -Mineral tenements (3,935) - - -Deferred tax assets: Expenses not immediately deductible 639 - 639 -
Net deferred tax liabilities (4,073) - (138) -
The net movement of $138,000 has been recognized in the tax expense in the income statement for 2007. There was no income tax expense impact for 2006. There are no deferred tax balances in the parent entity.
*This deferred tax asset will only be obtained if:
(a) Future assessable income is derived of a nature and of an amount sufficient to enable the benefit to be realised
(b) The conditions for deductibility imposed by tax legislation continue to be complied with
(c) No changes in tax legislation adversely affect the company in realizing the benefit and
(d) The company continues to satisfy either the continuity of ownership test or same business test
For
per
sona
l use
onl
y

Notes to the Financial StatementsFor the year ended 31 December 2007
68
Group Group Parent Parent 2007 2006 2007 2006 $’000 $’000 $’000 $’000
4. RECEIVABLES – CURRENT Amounts due from sale of non-current assets** 454 1,315 454 1,315Concentrate deposits 3,774 - - -Insurance compensation 269 - - -Other 699 1,235 542 420
5,196 2,550 996 1,735
Due to the short term nature of these receivables, their carrying value is assumed to approximate their fair value. No amounts are past their due date or impaired.
The maximum exposure to credit risk is the fair value of receivables. Collateral is not held as security, nor is it the Group’s policy to transfer (on-sell) receivables to special purpose entities.
Detail regarding liquidity risk and foreign currency risk exposure is disclosed in note 28.
5. INVENTORIES – CURRENT Gold in Circuit and in transit - at cost 15,003 - - -Ore stockpiles 5,573 145 - -Consumable stores and spares 6,522 1,267 - -Gold in safe 4,338 - - -Concentrate inventory 4,093 - - -
35,529 1,412 - -
6. OTHER – CURRENT Prepaid costs 1,465 6,345 1,294 6,345Prepaid development costs 3,190 - - -Prepayment for salary 886 - 886 -Other prepayments 912 622 - 622
6,453 6,967 2,180 6,967
7. RECEIVABLES – NON-CURRENT Employee loans * 1,180 2,423 1,180 2,423Amounts due from sale of non-current assets** 151 644 151 644Amounts due from controlled entities - - 96,197 80,237
1,331 3,067 97,528 83,304
* Loans to employees pursuant to the terms of the Sino Gold Mining Limited Employee Share Incentive Scheme (“ESIS”) – secured only against issued shares – refer note 17(d).
** Relates to amounts due from the sale of Tianjianshan in 2003. This amount is interest free and the remaining amount due is US$400,000 on 31 December 2008 and US$150,000 on 31 December 2009.
Due to the nature of these receivables, their carrying value is assumed to approximate their fair value.
The maximum exposure to credit risk is the fair vale of receivables. Collateral is not held as security, nor is it the Group’s policy to transfer (on-sell) receivables to special purpose entities.
Detail regarding liquidity risk and foreign currency risk exposure is disclosed in note 28.
For
per
sona
l use
onl
y

A n n u a l R e p o r t 2 0 0 7
69
Group Group Parent Parent Interest 2007 2006 2007 2006 held % $’000 $’000 $’000 $’000
8. OTHER FINANCIAL ASSETS – NON-CURRENT
Investments in subsidiaries Sino Mining Copper Ltd (a) 100 - - - -Sino Mining Guizhou Pty Ltd (b) 100 - - - -Sino Mining Sichuan Pty Ltd (b) 100 - - - -Sino Gold Jinluo Limited (a) 100 - - - -Sino Gold Jindu Limited (a) 100 - - - -Sino Gold BMZ Limited (a) 100 - - - -Sino Gold HLJ Limited (a) 100 - - - -Sino Gold Guoxin Limited (a) 100 - - - -Sino Gold Jiaodong Limited (a) 100 - - - -Sino Gold Golden Triangle Limited (a) 100 - - - -Sino Gold Greatland Limited (a) 100 - - - -Sino Gold SPD Limited (c) 100 - - - -Sino Gold SEL Limited (c) 100 - - - -Sino Guizhou Jinfeng Mining Limited (d) 82 - - 39,701* 44,231Sino Guizhou Jinluo Mining Limited (d) 65 - - 2,269* 2,527Sino Gold Jilin BMZ Mining Limited (d) 95 - - 11,025 7,582Shandong Sino Gold Fields Ludi Limited (d) 70 - - 1,169 646Shandong Sino Gold Fields Zhengyuan Limited (d)** 80 - - - 130Sino Guangxi Golden Triangle Mining Limited (d) 70 - - 1,265 -Sino Guizhou Greatland Mining Limited (d) 70 - - 306 -Sino Zhaoyuan Xinxin Mining Limited (d) 70 - - 510 -Heilongjiang Sino Gold Strike Mining Limited (d) 70 - - 567 -Sino Gold Guizhou Jindu Mining Limited (d) 75 - - 1,163 -Golden China Resources Corporation (e)*** 94 - - 90,233 -Golden China International Inc. (f)*** 94 - - - -Golden China Subsidiary Australia (b)*** 94 - - - -Golden China Nibao Gold Corporation (c)*** 94 - - - -Golden China Neimen Gold Exploration Corporation (c)*** 94 - - - -Michelago Limited (b)*** 94 - - - -Guizhou APAC Minerals Inc. (d)*** 65.8 - - 13,371 -Neimen APAC Resources Corporation (d)*** 94 - - 7,963 -Sashimo Pty Ltd (b)*** 94 - - - -Michelago (Hong Kong) Limited (g)*** 94 - - - -Michelago (China Mining) Pty Ltd (b)*** 94 - - - -Michelago (China) Exploration Pty Ltd (b)*** 94 - - - -Michelago China (Xinjiang) Pty Ltd (b) *** 94 - - - -
For
per
sona
l use
onl
y

Notes to the Financial StatementsFor the year ended 31 December 2007
70
Group Group Parent Parent Interest 2007 2006 2007 2006 held % $’000 $’000 $’000 $’000
8. OTHER FINANCIAL ASSETS – NON-CURRENT (CONTINUED) Shandong MIC BioGold Limited (d)*** 93.5 - - 36,766 -Rockmining Group Company Limited (g) 90 - - - -Hei He Rockmining Development Limited (d)**** 72 - - 77,132 -Sub-total - - - 283,440 55,116
Investments other Golden Tiger 19.9 1,364 - 1,364 -Australian Solomons Gold Limited (b)*** 19.3 10,017 - - -Sub-total - 11,381 - 1,364 -
Grand-total - 11,381 - 284,804 55,116
* Movement is due to foreign exchange fluctuation only. All investments are denominated in US$.
** During the financial year, all of Sino Gold Fields Zhengyuan Limited related costs were written off.
*** All of these subsidiaries are acquired with Golden China Resources Corporation.
**** Acquired in December 2007.
(a) Incorporated in the Cayman Islands.
(b) Incorporated in Australia.
(c) Incorporated in British Virgin Islands.
(d) Co-operative Joint Venture incorporated in PRC.
(e) Incorporated in Canada.
(f) Incorporated in Barbados.
(g) Incorporated in Hong Kong.
All subsidiaries operate in the country of incorporation.
There were no significant contracts for the provision of services to the parent entity or any of its subsidiaries by a controlling shareholder or any of its subsidiaries other than inter-company loans and services recharges which were on normal commercial terms.
Group Group Parent Parent 2007 2006 2007 2006 $’000 $’000 $’000 $’000
Non-Current Assets Available-for-sale financial assets At fair value Shares- Australian listed 1,364 - 1,364 -Shares- Canadian listed – Note 13 (e) 10,017 - - -
11,381 - 1,364 -
Listed sharesThe fair value of listed available-for-sale investments has been determined directly by reference to published price quotations in an active market.
For
per
sona
l use
onl
y

A n n u a l R e p o r t 2 0 0 7
71
9. PROPERTY, PLANT & EQUIPMENT
Consolidated
BuildingsPlant and
equipmentOffice and computer WIP
Leasehold improve-
mentMineral
properties Total
$’000 $’000 $’000 $’000 $’000 $’000 $’000
Year ended 31 December 2007
At 1 January 2007 net of accumulated depreciation - - 202 - 24 - 226
Transfer from deferred exploration & development costs 874 1,490 2,697 116,439 686 94,489 216,676
Additions 15,303 60,433 1,830 (93,785) 578 94,553 78,912
Acquisition of subsidiary (note 19) - 10,515 158 3,458 - 1,529 15,659
Disposals/transfer to assets - - (84) - (24) - (108)
Net foreign currency movements arising from self-sustaining foreign operations (146) (668) (44) (239) (12) (1,989) (3,098)
Depreciation and amortisation charge for the year (208) (792) (142) - (29) (2,425) (3,596)
At 31 December 2007 net of accumulated depreciation 15,822 70,978 4,617 25,873 1,224 186,348 304,862
At 31 December 2007
Cost 16,104 72,478 5,929 25,873 1,724 189,399 311,506
Accumulated depreciation (282) (1,500) (1,312) - (500) (3,050) (6,645)
Net carrying amount 15,822 70,978 4,617 25,873 1,224 186,349 304,862
For
per
sona
l use
onl
y

Notes to the Financial StatementsFor the year ended 31 December 2007
72
9. PROPERTY, PLANT & EQUIPMENT (CONTINUED)
Consolidated
BuildingsPlant and
equipmentOffice and computer WIP
Leasehold improve-
mentMineral
properties Total
$’000 $’000 $’000 $’000 $’000 $’000 $’000
Year ended 31 December 2006At 1 January 2006 net of accumulated depreciation - - 303 - 36 - 339Additions - - 107 - - - 107Disposals - - (142) - - - (142)Depreciation charge for the year - - (66) - (12) - (78)At 31 December 2006 net of accumulated depreciation - - 202 - 24 - 226At 1 January 2006Cost - - 561 - 77 - 638Accumulated depreciation - - (258) - (41) - (299)Net carrying amount - - 303 - 36 - 339At 31 December 2006Cost - - 526 - 77 - 603Accumulated depreciation - - (324) - (53) - (377)Net carrying amount - - 202 - 24 - 226
Parent
BuildingsPlant and
equipmentOffice and computer WIP
Leasehold improve-
mentMineral
properties Total
$’000 $’000 $’000 $’000 $’000 $’000 $’000
Year ended 31 December 2007At 1 January 2007 net of accumulated depreciation - - 202 - 24 - 226Additions - - 149 - 129 - 278Disposals - - (84) - (24) - (108)Depreciation charge for the year - - (99) - (20) - (119)At 31 December 2007 net of accumulated depreciation - - 168 - 109 - 277At 31 December 2007Cost - - 433 129 562Accumulated depreciation - - (265) (20) (285)Net carrying amount - - 168 - 109 - 277
For
per
sona
l use
onl
y

A n n u a l R e p o r t 2 0 0 7
73
9. PROPERTY, PLANT & EQUIPMENT (CONTINUED)Parent
BuildingsPlant and
equipmentOffice and computer WIP
Leasehold improve-
mentMineral
properties Total
$’000 $’000 $’000 $’000 $’000 $’000 $’000
Year ended 31 December 2006At 1 January 2007 net of accumulated depreciation - - 303 - 36 - 339Additions - - 107 - - - 107Disposals - - (142) - - - (142)Depreciation charge for the year - - (66) - (12) - (78)At 31 December 2006 net of accumulated depreciation - - 202 - 24 - 226At 1 January 2006Cost - - 561 - 77 - 638Accumulated depreciation - - (258) - (41) - (299)Net carrying amount - - 303 - 36 - 339At 31 December 2006Cost - - 526 - 77 - 603Accumulated depreciation - - (324) - (53) - (377)Net carrying amount - - 202 - 24 - 226
Group Group Parent Parent 2007 2006 2007 2006 $’000 $’000 $’000 $’000
10. DEFERRED EXPLORATION, EVALUATION AND DEVELOPMENT COSTS
Deferred exploration and evaluation costs– Jinfeng - 81,501 - -– White Mountain 11,067 9,008 - -– Other projects* 247,822 14,390 - -
258,889 104,899 - -
Capitalised development costs – Jinfeng - 135,175 - -– White Mountain 10,970 - - -
269,859 240,074 - -
* Other projects include interests in deferred exploration evaluation and development costs in relation to the acquisition of Golden China Resources Corporation (refer to note 19) and the investment in Rockmining Group Company Limited.
For
per
sona
l use
onl
y

Notes to the Financial StatementsFor the year ended 31 December 2007
74
10. DEFERRED EXPLORATION, EVALUATION AND DEVELOPMENT COSTS (CONTINUED) Group Group Parent Parent 2007 2006 2007 2006 $’000 $’000 $’000 $’000
ReconciliationReconciliations of the carrying amounts of deferred exploration, evaluation and development costs at the beginning and end of the current and previous financial years.
Opening balance 240,074 102,868 - -Transferred to production (216,676) - - -Additions 29,104 121,917 - -Acquisition of subsidiary - Golden China Resources Corporation 117,261 - - -Acquisition of Eastern Dragon asset 102,255 - - -Write-off of relinquished property (1,545) - - -Value of exploration license contributed by minority interest partner - 22,583 - -Net foreign currency movements arising from self-sustaining foreign operations (614) (7,294) - -
Net book value 269,859 240,074 - -
11. PAYABLES - CURRENTTrade creditors* 23,805 142 289 -Accruals 19,179 - 52,883 -Eastern Dragon acquisition 51,044 - - -Other creditors and accruals 7,738 25,116 - 7,803
101,766 25,258 53,172 7,803
*Aged Trade Creditors
Less than 30 days 14,970 142 289 -30 days to 60 days 5,112 - - -60 days to 90 days 1,798 - - -Greater than 90 days 1,925 - - -
23,805 142 289 -
Fair valueDue to the short term nature of these payables, their carrying value is assumed to approximate their fair value.
Interest rate, foreign exchange and liquidity riskInformation regarding interest rate, foreign currency and liquidity risk exposure is set out in note 28.
For
per
sona
l use
onl
y

A n n u a l R e p o r t 2 0 0 7
75
Group Group Parent Parent 2007 2006 2007 2006 $’000 $’000 $’000 $’000
12. PROVISIONS - CURRENT Employee entitlements - note 24 783 645 783 645
783 645 783 645
13. INTEREST BEARING LIABILITIES
Current Jinfeng Project Loan (b) 10,889 2,061 - -Jinfeng Standby L/C Loan (c) 60,339 6,847 - -Jinfeng Financing Lease (d) - 148 - -Golden China Resources Corporation Debentures (e) 19,264 - - -BioGold short term loan (f) 15,531 - - -Deferred gold put option premium (g) 975 686 - -
106,998 9,742 - -
Non-current Deferred gold put option premium (g) 696 1,828 - -Convertible notes (a)
Convertible notes at face value - 41,122 - 41,122Accrued interest - 376 - 376Un-amortized borrowing costs - (1,500) - (1,500)
39,998 39,998
Jinfeng Project Loan (b)
Principal 34,247 48,884 - - Un-amortized borrowing costs (993) (1,403) - -Total of current 33,254 47,481 - -Golden China Resources Corporation long-term loan (f) 597 - - -Jinfeng Financing Lease (d) - 593 - -Total of non-current 34,547 89,900 - 39,998
141,545 99,642 - 39,998
(a) In March 2005 the company issued 35,000 convertible notes at an issue price of USD1,000 per note, raising a total of US$35 million. The notes were seven-year convertible notes maturing in March 2012. Interest is payable on the notes at the rate of 5.75% per annum. The price for conversion of the notes into ordinary shares in the Company was $2.89 per share.
The fair value of the liability was originally assessed at US$32.5 million. All of the convertible notes were converted into fully paid ordinary shares on 12 November 2007, following the payment of an US$4.51 million inducement payment for early conversion of the note. This inducement payment has been expensed.
(b) Jinfeng Project Loan - this financing facility is arranged and jointly underwritten by Standard Bank London Limited and Bayeriisch Hypo-und Vereinsbank AG for US$ 40 million plus US$ 2 million capitalised interest with a 7 year term including a 2 year grace period. Repayments are made quarterly commencing 31 December 2007. Interest rate is LIBOR plus 3.25% margin pre-financial completion and 2.75% margin after financial completion.
For
per
sona
l use
onl
y

Notes to the Financial StatementsFor the year ended 31 December 2007
76
13. INTEREST BEARING LIABILITIES (CONTINUED)The facility is secured against the following:
• Mortgage on all present and future immovable assets in the project;
• Pledge over all present and future movable equipment in the project;
• Pledge over the projects land use right, mining license, exploration license and operating permits;
• Pledge over all material project contracts.
In addition, the Company and Sino Mining Guizhou Pty Limited has guaranteed until completion of the project construction, a first ranking charge over all shares of the Company in Sino Mining Guizhou Pty Limited and a first ranking pledge of the interest of Sino Mining Guizhou Pty Limited in the Borrower.
At 31 December 2007 the outstanding principal amount was US$39.79 million (A$50.95 million) following a principal repayment of US$1.75 million in the period.
(c) Jinfeng Standby L/C loan - The company has secured a standby cash collaterised L/C facility issued by its bankers to secure advances made by China Construction Bank, Guizhou Branch to the Jinfeng Project.
RMB A$ Maturity Annual interest rate
RMB’000 $’000
68,960 10,710 07/03/2008 6.0705%34,030 5,285 05/04/2008 6.0705%33,980 5,277 05/05/2008 6.2415%13,550 2,104 15/06/2008 6.2415%20,200 3,137 04/07/2008 6.4980%33,800 5,249 30/07/2008 6.6690%164,500 25,548 15/11/2008 6.9255%19,500 3,029 03/12/2008 7.0965%Total 60,339
(d) Jinfeng Financing Lease - The contract period was for 5 years. During that time, monthly payments of RMB 97,000 were made to the lessor. This contract was terminated in May 2007.
(e) Golden China Corporation Debentures: Golden China Corporation senior secured debentures with the total amount A$19,263,732 are payable upon maturity on April 27, 2008. The debentures bear interest at 11.5% per annum and secured by an assignment of the corporation’s interest in the shares of Michelago Hong Kong, Sashmo and Australian Solomons Gold Limited. Debenture holders have the right to elect to receive interest payments in common shares subject to the receipt of any required legal or regulatory approval.
(f) BioGold RMB short term and long term loans are domiciled in China and secured by mortgages over BioGold’s land and buildings and concentrate stockpile. The overall loan facility is split into several smaller components with various expiry dates as detailed below, and these smaller loan components are rolled over at each maturity.
No interest on these loans was capitalised during the financial year.For
per
sona
l use
onl
y

A n n u a l R e p o r t 2 0 0 7
77
13. INTEREST BEARING LIABILITIES (CONTINUED)RMB A$ Maturity Annual interest rate
RMB’000 $’000
Short term10,000 1,553 22/02/2008 6.03%20,000 3,106 18/03/2008 6.39%10,000 1,553 15/04/2008 6.03%10,000 1,553 23/05/2008 6.03%10,000 1,553 08/09/2008 7.29%10,000 1,553 05/11/2008 7.29%10,000 1,553 26/11/2008 7.29%20,000 3,107 22/12/2008 6.75%
Total of short term 15,531Long term
3,840 597 26/03/2021 2.55%
(g) Total of 204,000 ounces of put options were bought under gold hedging schedule with an average premium of US$9/ounce. The premium is repayable over the life of the options as disclosed in Note 16.
Group Group Parent Parent 2007 2006 2007 2006 $’000 $’000 $’000 $’000
14. PROVISIONS – NON-CURRENT Restoration and rehabilitation* 24,546 - - -
24,546 - - -
Movement in provision:Carrying Amount at the beginning of the financial year - 1,984 - -Write-back - (1,984) - -Rehabilitation provision provided 24,546 - - -
End of financial year 24,546 - - -
* Rehabilitation costs are expected to be incurred between 2007 and 2022. The provision has been estimated using existing technology at current prices and discounted using a real discount rate of 6.5% p.a.
15. DEFERRED TAX LIABILITIESDeferred tax liabilities 138 Deferred tax liabilities* 3,935 - - -
4,073 - - -
* This amount was recognised on the acquisition of a subsidiary of Golden China Resources.For
per
sona
l use
onl
y

Notes to the Financial StatementsFor the year ended 31 December 2007
78
Group Group Parent Parent 2007 2006 2007 2006 $’000 $’000 $’000 $’000
16. DERIVATIVE LIABILITIES
- Current Fair value of non-employee vested share options* 2,456 19,845 2,456 19,845Fair value of gold forward contracts & options** 26,760 5,360 - -
29,216 25,205 2,456 19,845
- Non-current Fair value of non-employee vested share options* 2,475 - 2,475 -Fair value of gold forward contracts & options** 93,280 71,138 - -
95,755 71,138 2,475 -
* Relates to options granted to seed investors that are denominated in Australian dollars and to warrants and options issued as part consideration for the acquisition cost of Golden China Resources. These are treated as derivatives in accordance with the accounting policy detailed in note 1 (j). Movement in their value along with any foreign exchange impact is recognized as a gain or loss. During the year 4,477,776 of these Australian dollar denominated options were exercised prior to maturity leaving 500,000 options maturing in 2010. The fair value of options granted have been valued using an option pricing model which takes account of factors such as the option exercise price, the current level and volatility of the underlying share price and the time to maturity of the option. Assumptions used at 31 December 2007 are: volatility 40%, risk free interest rate 7.175% and expected life of options 2.7 years. There was no fair value movement in the Canadian dollar denominated options.
** These relate to the Company’s hedge position as at 31 December 2007, refer below. Hedging losses are recognised by Jinfeng.
The consolidated entity enters into forward gold hedges where it agrees to sell specified ounces of gold at a predetermined gold price. The objective of these hedges is to match the forward agreements with anticipated cash flows from future gold sales and, as such, are considered “cash flow” hedges under AASB139. The fair value of all qualifying cash flow hedges is recorded on the balance sheet. Movements in fair value, to the extent the hedges are effective, are recorded as a separate component of equity and released to the profit & loss at the time the hedged transaction occurs.
As at 31 December 2007, all gold derivatives have been treated as qualifying cash flow hedges.
Hedging Position Fixed Forwards Bought Put Options
Ounces US$/oz Ounces US$/oz
2008 73,548 524 74,184 4002009 64,612 525 74,178 4002010 64,612 525 - -2011 64,612 525 - -2012 35,789 530 - -Total 303,173 525 148,362 400F
or p
erso
nal u
se o
nly

A n n u a l R e p o r t 2 0 0 7
79
16. DERIVATIVE LIABILITIES (CONTINUED) Group Group Parent Parent 2007 2006 2007 2006 $’000 $’000 $’000 $’000
Fair value of gold forward contracts & options Opening balance 76,498 25,776 - -Effective hedge loss recycled in the income statement (6,423) - - -Ineffective hedge loss expensed (2,869) - - -Foreign exchange effect (6,814) (1,828) - -Charged to equity 59,648 52,550 - -
Closing balance 120,040 76,498 - -
17. ISSUED CAPITAL
(a) Issued and paid up capital - ordinary shares fully paid (no par value) 527,970 168,259 527,970 168,259
527,970 168,259 527,970 168,259
(b) Movements in ordinary shares on issue 2007 2006
Number Number of shares of shares (’000) ($’000) (‘000) ($’000)
Beginning of financial year 153,061 168,259 131,444 101,949Issued during the year - share purchase plan - - 752 2,481- exercise of options 5,622 5,509 2,365 6,464- private placement 16,290 98,233 18,500 61,050- Hong Kong IPO 19,709 133,121 - -- less share issue and transaction costs - (11,842) - (3,685)- convertible notes conversion shares 15,383 44,457 - -- purchase consideration for
Golden China Resources Corporation 13,368 90,233 - -End of financial year 223,432 527,970 153,061 168,259
For
per
sona
l use
onl
y

Notes to the Financial StatementsFor the year ended 31 December 2007
80
17. ISSUED CAPITAL (CONTINUED)
(c) OptionsThe following table illustrates the number and movements in share options during the relevant period
Year ended 31 December
2007 2006 Number of Number of options options
Outstanding at the beginning of the year 10,946,776 10,656,776Granted during the year 3,665,000 2,655,000Replacement Golden China Resources Corporation options 1,325,559 -Exercised during the year (5,621,776) (2,365,000)Forfeited during the year - -Outstanding at end of the year 10,315,559 10,946,776
Exercisable at end of the year 2,081,974 6,371,776
The following unlisted options were on issue at balance-date.
NumberDate of
issueExercise
price ExpiryNumber
vestedVesting
date
Other
500,000 16/09/2005 $2.53 16/09/2010 500,000 N/A
39,996** 09/02/2006 C$7.88 09/02/2008 39,996 N/A
74,278** 27/04/2006 C$7.88 27/04/2008 74,278 N/A
777,700** 07/08/2007 C$5.63 08/08/2012 777,700 N/A
Directors 215,000 31/12/2003 $2.69 31/12/2008 215,000 N/A
370,000 31/12/2004 $2.00 31/12/2009 370,000 N/A
800,000 31/12/2005 $3.29 31/12/2010 - 31/12/2008
1,370,000* 31/12/2006 $6.50 31/12/2011 - 31/12/2009
Employees 50,000 31/12/2003 $2.69 31/12/2008 50,000 N/A
150,000 15/10/2004 $2.06 15/10/2009 150,000 N/A
25,000 27/10/2004 $2.12 27/10/2009 25,000 N/A
80,000 15/12/2004 $2.08 15/12/2009 80,000 N/A
300,000 31/12/2004 $2.00 31/12/2009 300,000 N/A
980,000 31/12/2005 $3.29 31/12/2010 - 31/12/2008
150,000 06/03/2006 $3.81 06/03/2011 - 06/03/2009
40,000 03/06/2006 $4.88 03/06/2011 - 03/06/2009
1,665,000 31/12/2006 $6.50 31/12/2011 - 31/12/2009
150,000* 31/12/2006 $6.50 30/09/2012 - 30/09/2010
200,000* 11/09/2007 $6.20 30/09/2012 - 30/09/2010
150,000* 09/05/2007 $5.87 30/09/2012 - 30/09/2010
1,795,000* 09/11/2007 $7.65 09/11/2012 - 09/11/2010
For
per
sona
l use
onl
y

A n n u a l R e p o r t 2 0 0 7
81
17. ISSUED CAPITAL (CONTINUED)
NumberDate of
issueExercise
price ExpiryNumber
vestedVesting
date
109,730** 12/04/2005 C$9.68 12/04/2010 - 12/04/2008
35,552** 22/12/2006 C$15.35 31/12/2009 - 31/12/2009
33,433** 22/12/2006 C$3.07 31/12/2009 - 31/12/2009
29,626** 22/12/2006 C$7.88 03/11/2010 - 22/12/2009
203,269** 14/03/2007 C$3.83 14/03/2012 - 14/03/2010
21,975** 04/04/2007 C$3.16 04/04/2012 - 04/04/2010
10,315,559 2,581,974 * The following options were granted during the year:
• 1,370,000 options – fair value per option is $2.35 (share price on issue date was $5.70) • 150,000 options – fair value per option is $2.35 (share price on issue date was $5.70) • 200,000 options – fair value per option is $2.90 (share price on issue date was $6.20) • 150,000 options – fair value per option is $2.82 (share price on issue date was $5.86) • 1,795,000 options – fair value per option is $3.76 (share price on issue date was $7.95)
** Replacement securities issued pursuant to the takeover offer for Golden China Resources Corporation. The issue dates on these options represent the original issue date of the options by Golden China Resources Corporation.
• 39,996 options – fair value per option is $0.01 (share price on issue date was $6.75) • 74,278 options – fair value per option is $0.09 (share price on issue date was $6.75) • 777,700 options – fair value per option is $3.18 (share price on issue date was $6.75) • 109,731 options – fair value per option is $0.90 (share price on issue date was $6.75) • 35,552 options – fair value per option is $0.19 (share price on issue date was $6.75) • 33,435 options – fair value per option is $3.86 (share price on issue date was $6.75) • 29,626 options – fair value per option is $1.64 (share price on issue date was $6.75) • 203,269 options – fair value per option is $3.94 (share price on issue date was $6.75) • 21,975 options – fair value per option is $4.36 (share price on issue date was $6.75)
The following unlisted warrants were on issue at balance-date.
NumberDate of
issueExercise
price ExpiryNumber
vestedVesting
date
Other 399,960** 27/04/2006 C$7.88 27/04/2009 399,960 N/A 410,126** 23/05/2007 C$5.63 23/05/2009 410,126 N/A
810,086 810,086
• 399,960 warrants – fair value per option is $0.77 (share price on issue date was $6.75) • 410,126 warrants – fair value per option is $1.75 (share price on issue date was $6.75)
The assumptions used in determining the fair value of options in a Black-Scholes model are:
2006 2007
Expected volatility 45% 40%Risk free interest rate 6.5% 7.175%Expected life of options (years) 5 5Dividend yield Nil Nil
For
per
sona
l use
onl
y
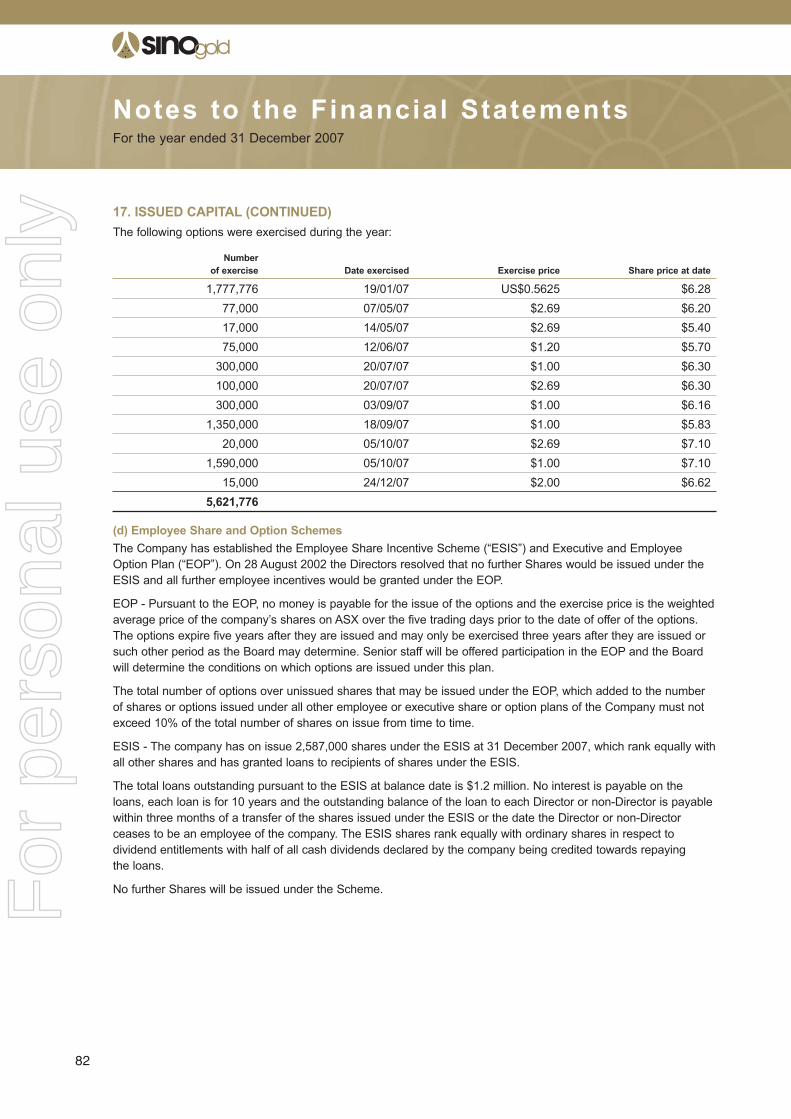
Notes to the Financial StatementsFor the year ended 31 December 2007
82
17. ISSUED CAPITAL (CONTINUED)The following options were exercised during the year:
Number of exercise Date exercised Exercise price Share price at date
1,777,776 19/01/07 US$0.5625 $6.2877,000 07/05/07 $2.69 $6.2017,000 14/05/07 $2.69 $5.4075,000 12/06/07 $1.20 $5.70
300,000 20/07/07 $1.00 $6.30100,000 20/07/07 $2.69 $6.30300,000 03/09/07 $1.00 $6.16
1,350,000 18/09/07 $1.00 $5.8320,000 05/10/07 $2.69 $7.10
1,590,000 05/10/07 $1.00 $7.1015,000 24/12/07 $2.00 $6.62
5,621,776
(d) Employee Share and Option SchemesThe Company has established the Employee Share Incentive Scheme (“ESIS”) and Executive and Employee Option Plan (“EOP”). On 28 August 2002 the Directors resolved that no further Shares would be issued under the ESIS and all further employee incentives would be granted under the EOP.
EOP - Pursuant to the EOP, no money is payable for the issue of the options and the exercise price is the weighted average price of the company’s shares on ASX over the five trading days prior to the date of offer of the options. The options expire five years after they are issued and may only be exercised three years after they are issued or such other period as the Board may determine. Senior staff will be offered participation in the EOP and the Board will determine the conditions on which options are issued under this plan.
The total number of options over unissued shares that may be issued under the EOP, which added to the number of shares or options issued under all other employee or executive share or option plans of the Company must not exceed 10% of the total number of shares on issue from time to time.
ESIS - The company has on issue 2,587,000 shares under the ESIS at 31 December 2007, which rank equally with all other shares and has granted loans to recipients of shares under the ESIS.
The total loans outstanding pursuant to the ESIS at balance date is $1.2 million. No interest is payable on the loans, each loan is for 10 years and the outstanding balance of the loan to each Director or non-Director is payable within three months of a transfer of the shares issued under the ESIS or the date the Director or non-Director ceases to be an employee of the company. The ESIS shares rank equally with ordinary shares in respect to dividend entitlements with half of all cash dividends declared by the company being credited towards repaying the loans.
No further Shares will be issued under the Scheme.For
per
sona
l use
onl
y

A n n u a l R e p o r t 2 0 0 7
83
17. ISSUED CAPITAL (CONTINUED)Details of movements of shares issued pursuant to the ESIS are as follows:
Number
of shares
Consideration received
$’000
Loans outstanding
$’000
Balances at beginning of financial year 5,374,226 2,423Issued during the year - - -Loan repayments (2,787,226) - (1,243)Balances at end of financial year 2,587,000 - 1,180
Group Group Parent Parent 2007 2006 2007 2006 $’000 $’000 $’000 $’000
18. RESERVESForeign currency translation reserve (1,892) (4,784) (38,968) (9,181)Minority interest (13,696) - - -Share based payments 5,089 2,070 5,089 2,070Vested share options 9,682 (7,494) 9,682 (7,494)Derivatives – cashflow hedges (136,783) (77,135) - -
(137,600) (87,343) (24,197) (14,605)
Foreign currency translation reserve:The foreign currency translation reserve is used to record exchange differences arising from the translation of the financial statements of foreign subsidiaries.
Share based payments reserve:The share based payments reserve is used to record the value of equity benefits provided to employees and directors as part of their remuneration.
Vested share options:This reserve is used to record the value of foreign currency denominated options granted to seed investors from the date such options are granted to their vesting date.
Derivatives – cashflow hedges:This reserve is used to record the effective component of the fair value of all qualifying cash flow hedges at period end.
Minority interest:The minority interest in the Jinfeng mine was re-measured upon completion of project construction.
For
per
sona
l use
onl
y

Notes to the Financial StatementsFor the year ended 31 December 2007
84
19. BUSINESS COMBINATIONAcquisition of Golden China Resources Corporation.On 12 December 2007, Sino Gold Mining Limited acquired 94% of the voting shares of Golden China Resources Corporation, whose shares were listed on the main boards of both the Toronto Stock Exchange and as CDIs on the Australian Securities Exchange.
The total cost of the combination was A$103.0 million and comprised an issue of equity instruments, the payment of cash and costs directly attributable to the combination. The Group issued 13,367,870 ordinary shares with a fair value of A$6.75 each, based on the quoted price of the shares of Sino Gold Limited at the date of exchange.
The provisional fair value of the identifiable assets and liabilities of Gold China Resources Corporation as at the date of acquisition were:
Consolidated
Recognised Carrying on Acquisition Value $000 $000
Cash and cash equivalents 1,727 1,727Inventories 16,136 16,136Investment in listed company 10,017 10,017Property, plant and equipment 15,659 15,659Interest in mineral properties 117,261 68,407Other receivable 3,774 3,774
164,574 115,720
Trade payables (13,386) (13,386)Short term debts (34,795) (34,795)Unsecured loans(deferred put option premium) (596) (596)Accruals (4,206) (4,206)Other payables (253) (253)Deferred income tax liability (3,935) (3,935)Outside Equity Interest (4,396) (4,396)
(61,567) (61,567)
Identifiable net assets 103,007 54,153Cost of the combination: Shares issued, at fair value 90,233 Cash paid 7,594 Direct costs relating to the acquisition 493 Warranties & options base payment 4,687 Sub-total 103,007
103,007
The cash outflow on acquisition is as follows: Net cash acquired with the subsidiary 1,727 Cash paid (7,594)
Net consolidated cash outflow (5,867)
For
per
sona
l use
onl
y

A n n u a l R e p o r t 2 0 0 7
85
19. BUSINESS COMBINATION (CONTINUED)From the date of acquisition, Golden China Resources Corporation’s net profit contribution was nil. If the combination had taken place at the beginning of the year the revenue from continuing operations would have been $21,122,436 and the loss from continuing operations for the Group would have been $19,732,717. This loss is driven by head office costs ($9.9 million), debenture ammortisation and interest costs ($3.8 million), write down in mineral properties ($3.9 million) and impairment on the carrying value of the investment in Australian Solomon Gold ($4.4 million). These costs are generally not recurrent costs.
The group has recognised a provision for the estimated costs, base on a detail restructure plan, in relation to the redundancy cost of former Golden China Resources Corporation employees and contractors, whose services are no longer expect to be required.
The provisional fair values will be finalized during 2008.
Acquisition of Rockmining Group Company LimitedThe Eastern Dragon asset, held within the Rockmining Group, was acquired in late December 2007 for US$90 million which represents the fair value of the tenement. There are no other identifiable net assets.
20. EXPENDITURE COMMITMENTS Group Group Parent Parent 2007 2006 2007 2006 $’000 $’000 $’000 $’000
Operating leases Within one year 278 260 278 260After one year but not more than 2 years 289 278 289 278After 2 years but not more than 5 years 612 901 612 901Later than 5 years - 78 - 78
Aggregate lease expenditure contracted for at balance date but not provided for 1,179 1,517 1,179 1,517
The above commitments relate to a lease for office premises with an expiry date of 1 April 2012.
Capital CommitmentsDevelopment and construction of the group’s White Mountain Project in Jilin Province PRC commenced in 2007 and the construction was on-going at the year end. Accordingly the Company has entered into contracts and commitments in relation to the construction of the project. As at 31 December 2007, U$9.7 million (A$11 million) had been spent. The total capital expenditure estimate for the processing plant, infrastructure and underground development is estimated at U$55 million (A$62.4 million).
Hedge commitmentsDetails of hedge commitments are set out in note 16.
For
per
sona
l use
onl
y

Notes to the Financial StatementsFor the year ended 31 December 2007
86
21. RELATED PARTY DISCLOSURES
a) The directors of Sino Gold Mining Limited during the financial year were:
J Askew B DavidsonJ Klein P CassidyH Xu P HousdenJ Zhong J Dowsley
b) The following related party transactions occurred during the financial period:(i) Transactions with related parties in wholly owned group.Interest free funding by the parent entity to wholly owned entities mainly relating to payment for offshore acquisitions of equipment and consumables (refer note 7) and are repayable on demand.
(ii) Transactions with director – related entities.Interests in equity instruments held by directors and their related entities at balance date. The loans are interest free and have no formal repayment terms.
Key Management Personnel Option HoldingsBalance 1 Jan 07
Granted as Remuneration
Options Exercised
Net Change Other
Balance 31 Dec 07
Vested at 31 Dec 07
J Askew 140,000 - (140,000) - - -J Klein 1,050,000 750,000* (400,000) - 1,400,000 400,000H Xu 475,000 500,000* - - 975,000 175,000B Davidson 20,000 - - - 20,000 20,000P Cassidy 140,000 - (120,000) - 20,000 20,000J Zhong 120,000 - - - 120,000 120,000P Housden - 120,000* - - 120,000 -J Dowsley - - - - - -P Uttley 600,000 150,000* - 20,000 770,000 170,000I Polovineo 320,000 75,000* - - 395,000 45,000W Rossiter - 225,000* - - 225,000 -C Johnstone 450,000 275,000* - - 725,000 -
3,315,000 2,095,000 (660,000) 20,000 4,770,000 950,000
The following options were granted during the year:
• 750,000 options – exercise price $6.50, fair value per option $2.35, share price on issue date $5.70 • 500,000 options – exercise price $6.50, fair value per option $2.35, share price on issue date $5.70 • 120,000 options – exercise price $6.50, fair value per option $2.35, share price on issue date $5.70 • 150,000 options – exercise price $7.65, fair value per option $3.76, share price on issue date $7.95 • 75,000 options – exercise price $7.65, fair value per option $3.76, share price on issue date $7.95 • 225,000 options—150,000 of them, exercise price $5.87, fair value per option $2.82, share price on issue date
$5.86; 75,000 of them, exercise price $7.65, fair value per option $3.76, share price on issue date $7.95.• 275,000 options– exercise price $7.65, fair value per option $3.76, share price on issue date $7.95
The Board has approved additional option issues to J. Klein (500,000), H Xu (350,000) and J Dowsley (120,000) which are subject to shareholder approval.
For
per
sona
l use
onl
y

A n n u a l R e p o r t 2 0 0 7
87
21. RELATED PARTY DISCLOSURES (CONTINUED)
Key management personnel option holdings as of 2006:
Key Management Personnel Option HoldingsBalance 1 Jan 06
Granted as Remuneration
Options Exercised
Net Change Other
Balance 31 Dec 06
Vested at 31 Dec 06
J Askew 140,000 - - - 140,000 140,000J Klein 550,000 500,000* - - 1,050,000 400,000H Xu 375,000 300,000* (200,000) - 475,000 275,000B Davidson 140,000 - (120,000) - 20,000 20,000P Cassidy 140,000 - - - 140,000 140,000J Zhong 120,000 - - - 120,000 -P Housden - - - - - -P Uttley 300,000 300,000* - - 600,000 -I Polovineo 270,000 125,000* (75,000) - 320,000 25,000C Johnstone - 450,000* - - 450,000 -
2,035,000 1,675,000 (395,000) - 3,315,000 1,000,000
Key Management Personnel Shareholdings
Balance 1 Jan 07
Acquisitions Disposals/ Options Exercised
Balance 31 Dec 07
J Askew - - 140,000 140,000J Klein 3,132,178 - (450,000) 2,682,178H Xu 1,100,000 - (300,000) 800,000B Davidson 215,347 - - 215,347P Cassidy 23,831 - 120,000 143,831J Zhong - - - -P Housden 10,000 - - 10,000P Uttley - - - -I Polovineo 207,315 - (25,000) 182,315W Rossiter - - - -C Johnstone - - - -
4,688,671 - (515,000) 4,173,671 (iii) Transactions with director – related entities. (Continued)
Employee Share Incentive Scheme (“ESIS”) loansLoans are outstanding pursuant to the terms of the ESIS, refer to note 17(d). At balance date outstanding loans were held by J Klein and H Xu for $758,232 and $275,723 respectively. This was the highest amount of the loans during the reporting period.F
or p
erso
nal u
se o
nly

Notes to the Financial StatementsFor the year ended 31 December 2007
88
21. RELATED PARTY DISCLOSURES (CONTINUED)(iv) Employment Agreements• The Company entered into an agreement (“Employment Agreement”) dated 18 February 2008 with Mr. J Klein
for the provision of Mr. Klein’s services as President and Chief Executive Officer. The Employment Agreement is for a rolling 12 months period. There are no other benefits under the Agreement including termination benefits other than normal redundancy provisions. The remuneration under the Agreement is subject to review on an annual basis. There are no contractual entitlements to any bonuses.
• The Company entered into an agreement (“Employment Agreement”) dated 18 February 2008 with Mr. H Xu for the provision of Mr. Xu’s services as Executive Director. The Employment Agreement is for a rolling 12 months period. There are no other benefits under the Agreement including termination benefits other than normal redundancy provisions. The remuneration under the Agreement is subject to review on an annual basis. There are no contractual entitlements to any bonuses.
• The Company has entered into an agreement (“Employment Agreement”) with Mr. I Polovineo on 1 January 2004 for the provision of his services as Company Secretary. The Employment Agreement is for a rolling 12 month period. There are no other benefits under the Agreement including termination benefits other than normal redundancy provisions. The remuneration under the Agreement is subject to review on an annual basis. There are no contractual entitlements to any bonuses.
Compensation options: Granted and vested during the year
31/12/2007Granted Number Grant Date
Fair Value per option
at grant date ($)
Exercise price per
option ($) Expiry Date
First Exercise
Date
Last Exercise
DateVested
number %
Directors
J Klein 750,000 30/05/2007 2.35 6.50 31/12/2011 31/05/2010 31/12/2011 100,000 7.1
H Xu 500,000 30/05/2007 2.35 6.50 31/12/2011 31/05/2010 31/12/2011 75,000 7.7
P Housden 120,000 30/05/2007 2.35 6.50 31/12/2011 31/05/2010 31/12/2011 - -
Executives
C Johnstone 275,000 8/11/2007 3.76 7.65 9/11/2012 9/11/2010 9/11/2012 - -
P Uttley 150,000 8/11/2007 3.76 7.65 9/11/2012 9/11/2010 9/11/2012 150,000 19.5
I Polovineo 75,000 8/11/2007 3.76 7.65 9/11/2012 9/11/2010 9/11/2012 20,000 5.1
T Norman 20,000 8/11/2007 3.76 7.65 9/11/2012 9/11/2010 9/11/2012 - -
W Rossiter 150,000 9/05/2007 2.82 5.87 30/09/2012 10/05/2010 30/09/2012 - -
W Rossiter 75,000 8/11/2007 3.76 7.65 9/11/2012 9/11/2010 9/11/2012 - -
Total 2,115,000 345,000
For
per
sona
l use
onl
y

A n n u a l R e p o r t 2 0 0 7
89
21. RELATED PARTY DISCLOSURES (CONTINUED)
31/12/2006Granted Number Grant Date
Fair Value per option
at grant date ($)
Exercise price per
option ($) Expiry Date
First Exercise
Date
Last Exercise
DateVested
Number %
Directors
J Klein 500,000 31/12/2005 1.47 3.29 31/12/2010 1/01/2009 31/12/2010 300,000 28.6
H Xu 300,000 31/12/2005 1.47 3.29 31/12/2010 1/01/2009 31/12/2010 200,000 42.1
Executives
C Johnstone 300,000 31/12/2006 2.35 6.50 31/12/2011 1/01/2010 31/12/2011 - -
P Uttley 300,000 31/12/2006 2.35 6.50 31/12/2011 1/01/2010 31/12/2011 - -
I Polovineo 125,000 31/12/2006 2.35 6.50 31/12/2011 1/01/2010 31/12/2011 25,000 7.8
T Norman 130,000 31/12/2006 2.35 6.50 31/12/2011 1/01/2010 31/12/2011 - -
W Rossiter - - - - - - - - -
Total 1,655,000 525,000
22. COMPENSATION OF KEY MANAGEMENT PERSONNELThe Company’s remuneration policy is designed to attract, retain and motivate highly talented individuals to ensure the capability of our workforce to deliver the business strategy and to maximize shareholder wealth creation.
Remuneration StructureIn accordance with best practice corporate governance, the structure of non-executive director and executive remuneration is separate and distinct.
Non-Executive Director RemunerationThe Board seeks to set aggregate remuneration at a level that provides the Company with the ability to attract and retain directors of the highest calibre, whilst incurring a cost that is acceptable to shareholders.
StructureThe Constitution and the ASX Listing Rules specify that the aggregate remuneration of non-executive directors shall be determined from time to time by a general meeting.
The latest determination was at the Annual General Meeting held on 30 May 2006 when shareholders approved an aggregate remuneration of $650,000 per year. Directors will be seeking to increase this amount at the next Annual General Meeting.
The amount of aggregate remuneration sought to be approved by shareholders and the fee structure is reviewed annually. The Board considers advice from external consultants as well as the fees paid to non-executive directors of comparable companies when undertaking the annual review process. Directors will be seeking to increase this amount at the next Annual General Meeting.
Each non-executive director receives a base fee of $85,000 for being a director of the Group. The Chairman receives a base fee of $175,000. From 1 January 2008 an additional fee of $7,500 will also be paid for each Board committee on which a non-executive director sits and $10,000 if the director is a Chair of a Board Committee with $15,000 being paid to the Chair of the Audit Committee.. The payment of additional fees for serving on a committee recognises the additional time commitment required by non-executive directors who serve on one or more sub committees.
For
per
sona
l use
onl
y
Notes to the Financial StatementsFor the year ended 31 December 2007
90
22. COMPENSATION OF KEY MANAGEMENT PERSONNEL (CONTINUED)The non-executive directors do not receive retirement benefits, nor do they participate in any incentive programs
Executive RemunerationThe Remuneration Committee of the Board of Directors is responsible for determining and reviewing compensation arrangements for the Directors, the Chief Executive Officer and the executive team. The Remuneration Committee assesses the appropriateness of the nature and amount of emoluments of such officers on a periodic basis by reference to relevant employment market conditions with the overall objective of ensuring maximum stakeholder benefit from the retention of a high quality board and executive team.
Cash bonuses paid and numbers of options granted are at the complete discretion of the Board and are based on individual and company performance. There are no specified financial or other conditions that are required to be achieved.
To assist in achieving these objectives, the Remuneration Committee considers the nature and amount of Executive Directors’ and Officers’ emoluments to the Company’s financial and operational performance. All senior executives have the opportunity to qualify for participation in the Executive and Employee Option Plan which currently provides incentives. The options vest over 3 years and expire in 5 years provided that the employee/director remains as employee/director of the company. There are no performance vesting conditions.
Details of the nature and amount of each element of the remuneration of each director of the company and 5 named executives who receive the highest remuneration are shown below.
The key principles of the remuneration policy are to:
• Set competitive rewards to attract, retain and motivate highly skilled people.
• Implement challenging key performance indicators (KPIs) including financial and non-financial measures of performance through our Performance Management Program.
• Establish short and long-term incentive programs across the organization, for which the following principles apply:
– Short term annual cash bonus: • Individual bonus is earned and not a right;
• Bonus is discretionary and distribution is related to outstanding achievement;
• Bonus is determined according to individual, team and Company performance;
• General labour market conditions for the position will be considered;
• Frequency, timing and quantum of any incentive program must be approved by the CEO and the Board in respect of senior executives and executive directors.
– Long term performance based share options: Senior staff will be offered participation in the Company’s approved Executive and Employee Option Plan. The
Board will determine the conditions on which options are issued under this Plan. The options are issued at an exercise price being the weighted average sale price of the Company’s shares on ASX over the 5 trading days immediately prior to the date of issue of the options.
• Ensure remuneration planning continues to be integrated within the Company’s business planning process.
• Total reward levels and performance targets will be set at appropriate levels to reflect the competitive market in which we operate; the prevailing economic environment and the relative performance of comparator companies. We aim to position outstanding performance within the top quartile of the industry.
For
per
sona
l use
onl
y

A n n u a l R e p o r t 2 0 0 7
91
22. COMPENSATION OF KEY MANAGEMENT PERSONNEL (CONTINUED)Our remuneration structure maintains its validity by conducting annual reviews taking into account individual performance, the economic environment, the unique requirement for certain employees to travel to and spend time in China, particularly at mine sites, and relevant job and industry comparisons. The company values the contribution of both individuals and teams in achieving the goals and objectives of the business and through our Performance Management Program our employees understand how their plans and efforts are linked to the organisation’s objectives and the interests of the shareholders.
Our remuneration structure further recognises that whilst the Company is in the process of developing its projects and pursuing new opportunities, it should conserve its cash resources, and accordingly, where appropriate, should issue options under the approved Executive and Employee Option Plan as an integral part of its remuneration policy.
The total number of options over unissued shares that may be issued under the EOP, which added to the number of shares or options issued under all other employee or executive share or option plans of the Company must not exceed 10% of the total number of shares on issue from time to time.
Below table are the details of compensations to the key management personnel:
Short TermPost
Employment
Share- based
Payment Total
% of remuneration
for the year consisting of
options
NameSalary and
Fees OtherCash
BonusSuper-
annuation Options %
$ $ $ $ $ $
J AskewChairman (non-executive)2007 175,000 - - - 175,000 -%2006 94,799 - - 8,467 103,266 8.2%J KleinChief Executive Officer2007 565,039 60,000 200,000 51,461 659,484 1,535,984 42.9%2006 527,969 80,000* 150,000 47,031 303,833 1,108,833 27.4%H XuDirector (executive)2007 366,972 22,000 125,000 33,028 423,323 970,323 43.6%2006 345,559 29,000* 125,000 24,440 189,750 713,749 26.6%B DavidsonDirector (non-executive)2007 85,000 25,000 - - 110,000 -%2006 85,000 - - 8,467 93,467 9.1%P CassidyDirector (non-executive)2007 42,500 - 42,500 - 85,000 -%2006 131,250 - 31,425 8,467 171,142 4.9%J ZhongDirector (non-executive)2007 83,245 - 1,755 13,200 98,200 13.4%2006 77,982 - 7,018 13,200 98,200 13.4%
For
per
sona
l use
onl
y

Notes to the Financial StatementsFor the year ended 31 December 2007
92
22. COMPENSATION OF KEY MANAGEMENT PERSONNEL (CONTINUED)
Short TermPost
Employment
Share- based
Payment Total
% of remu-neration
for the year consisting of options
NameSalary and
Fees OtherCash
BonusSuper-
annuation Options %
$ $ $ $ $ $
P HousdenDirector (non-executive)2007 38,991 25,000 46,009 63,677 173,677 36.7%2006 - - 42,500 - 42,500 -J DowsleyDirector (non-executive)2007 35,417 - - - 35,417 -%2006 - - - - - -P UttleyChief Geologist2007 253,211 - 125,000 2,752 378,229 759,192 49.8%2006 221,101 - 125,000 43,899 122,000 512,000 23.8%C JohnstoneChief Operating Officer2007 366,972 60,000 33,028 361,944 821,944 44.0%2006 254,587 60,000 22,913 34,750 372,250 9.3%I PolovineoCompany Sectary and Administration 2007 208,142 - 80,000 52,097 189,283 529,522 35.7%2006 206,304 - 50,000 43,696 86,283 386,283 22.3%W RossiterChief Financial Officer (appointed in May 2007)2007 142,304 - 25,000 28,360 97,917 293,581 33.4%2006 - - - - - - -%Totals2007 2,362,793 82,000 665,000 290,990 2,187,057 5,587,840 39.1%2006 1,944,551 109,000 510,000 262,922 775,217 3,601,690 21.5%
* Interest benefits under ESIS loans
During the year a total of 5,621,776 ordinary shares were issued on the exercise of unlisted options, details of which are as follows:
• 1,777,776 shares at US$0.625 per share • 214,000 shares at $2.69 per share • 75,000 shares at $1.20 per share • 3,540,000 shares at $1.00 per share • 15,000 shares at $2.00 per share
For
per
sona
l use
onl
y

A n n u a l R e p o r t 2 0 0 7
93
22. COMPENSATION OF KEY MANAGEMENT PERSONNEL (CONTINUED)
ESIS Loans to DirectorsLoans have been made to executive directors Jake Klein and Xu Hanjing pursuant to the ESIS plan details and terms of which are set out in note 21. The loans were initially made in 2001, are interest free and have a ten year term. The balances outstanding are as follows:
2007 2006 $000 $000
J Klein 758 1,149H Xu 276 414
1,034 1,563
23. CONTINGENT LIABILITIESThe Group is aware that there may exist a potential liability of an undetermined amount for underpaid value added tax at one of its Chinese subsidiaries, acquired as part of the acquisition of Golden China Resources. The Group cannot reasonably estimate the amount as the accounting records and information for the period in question, 1 January 2000 to 31 July 2005, have been retained by the previous owners, Tiancheng Mining. At the time that Golden China Resources acquired this subsidiary it received an indemnity from Tiancheng Mining for any outstanding taxation liabilities up until the acquisition date.
24. EMPLOYEE ENTITLEMENTS AND SUPERANNUATION COMMITMENTS Group Group Parent Parent 2007 2006 2007 2006 Employee Entitlements $’000 $’000 $’000 $’000
The aggregate employee entitlement liability is comprised of:
Provisions: - Long service leave 339 287 339 287- Annual leave 444 358 444 358
783 645 783 645
Superannuation CommitmentsThe Parent Company and Subsidiaries within the Group contribute to a superannuation fund, which exists to provide benefits for employees and their dependants in retirement, disability or death.
All Australian employees are entitled to varying levels of benefits on retirement, disability or death. The superannuation plans provide defined contributions by reference to accumulated contributions plus income from funds contributed. Contributions by the Group of up to 9% of Australian employees wages and salaries are legally enforceable in Australia.
During the year the average number of employees in the economic entity was 611 (2006: 524).
25. SEGMENT INFORMATIONThe group operates entirely in the mining industry and in the sole geographical area of China. The operations comprise the mining and processing of gold ore and the sale of extracted gold.F
or p
erso
nal u
se o
nly

Notes to the Financial StatementsFor the year ended 31 December 2007
94
Group Group Parent Parent 2007 2006 2007 2006 $’000 $’000 $’000 $’000
26. STATEMENT OF CASH FLOWS
(a) Reconciliation of Cash Cash balance comprises - Cash on hand 68 61 3 3- Cash at bank 38,899 9,444 31,391 7,116- Restricted cash* 69,986 12,000 69,986 12,000
108,953 21,505 101,380 19,119
*Restricted cash relates to cash held in term deposits as security for the Jinfeng Standby L/C loan (refer note 13 (c)).
(b) Reconciliation of operating loss after tax to net cash flows from operations
Operating (loss)/profit after tax (24,940) (20,054) (16,788) (3,174)Non cash items:
Depreciation of non-current assets 3,574 78 124 78Write off of property, plant & equipment - 142 - 142Provision for rehabilitation 286 (1,984) - -Share options expensed 3,973 12,717 3,973 12,717Deferred exploration costs written off 1,545 - 1,545 - Profit of disposal subsidiaries - (2,129) - (18,397) Provision for annual leave 138 - 138 -Changes in assets and liabilities:
Receivables (567) (5,551) 5,732 (6,477)Inventories (33,380) 799 - -Prepayments (843) - (672) -Trade and other payables (142) 7,752 - 6,679Accrued liabilities 29,394 - (5,939) -
Net Cash Flows used in Operating Activities (20,963) (8,152) (11,887) (8,354)
27. AUDITORS’ REMUNERATION Amounts received or due and receivable by Ernst & Young for:
- audit or review of the financial report of the entity and any other entity in the group 120,124 104,000 80,124 40,250
- Hong Kong Initial Public Offering costs - 467,000 - 467,000- Golden China prospectus costs 79,000 - 79,000 - 199,124 571,000 159,124 507,250Amounts received or due and receivable by KPMG for: - Golden China auditing fee 119,204 - 119,204 -
119,204 - 119,204 -
For
per
sona
l use
onl
y

A n n u a l R e p o r t 2 0 0 7
95
28. FINANCIAL INSTRUMENTSFinancial risk management objectives and policies
The Group’s principal financial instruments, other than derivatives, comprise interest-bearing bank and other loans and cash at bank. The main purpose of these financial instruments is to raise finance for the Group’s operations. The Group has various other financial assets and liabilities such as other receivables and trade and others payables, which arise directly from its operations.
The Group also enters into gold derivative transactions, including principally forward contracts and purchased put options. Gold derivatives are used to partly mitigate the Group’s exposure to gold price movements.
It is, and has been, throughout the year under review, the Group’s policy that no trading in financial instruments shall be undertaken without board approval.
The main risks arising from the Group’s financial instruments are interest rate risk, liquidity risk, credit risk and commodity price risk. The Directors review and approve policies for managing each of these risks and they are summarised below:
(i) Interest rate riskThe Group’s income statement is affected by changes in interest rates due to the impact of such changes on interest income and expenses from bank balances and other interest-bearing loans. The Group’s policy is to obtain the most favourable interest rates available. The Group has not used any derivatives to mitigate its interest rate risk exposure.
At balance date, the Group had the following mix of financial assets and liabilities exposed to variable interest rate risk that are not designated as cash flow hedges:
Group Group Parent Parent 2007 2006 2007 2006 $’000 $’000 $’000 $’000
Financial Assets
Cash and cash equivalents 108,953 21,505 101,380 19,119
Financial Liabilities (note 13) CCB standby L/C loan 60,339 6,847 - -BioGold short term loan 15,531 - - -Jinfeng project loan 44,143 49,542 - -Golden China Resources Corporation long-term loan 597 - - -Convertible notes net value - 39,998 - 39,998SUB-TOTAL 120,610 96,387 - 39,998
Net exposure (11,657) (74,882) 101,380 (20,879)
The Group’s policy is to manage its finance costs by using an appropriate balance of fixed and variable rate debt. It is acknowledged that fair value exposure is a by-product of the Group’s attempt to manage its cash flow volatility arising from interest rate changes. At 31 December 2007, approximately 14.8% of the Group’s borrowings are at a fixed rate of interest (2006: 3.3%).
The Group constantly analyses its interest rate exposure. Within this analysis consideration is given to potential renewals of existing positions, alternative financing, alternative hedging positions and the mix of fixed and variable interest rates.
For
per
sona
l use
onl
y

Notes to the Financial StatementsFor the year ended 31 December 2007
96
28. FINANCIAL INSTRUMENTS (CONTINUED)The following sensitivity analysis is based on the interest rate risk exposures in existence at the balance sheet date.
At 31 December 2007, if interest rates had moved, as illustrated in the table below, with all other variables held constant, post tax profit and equity would have been affected as follows:
Post Tax Profit Equity Higher/(Lower) Higher/(Lower)
2007 2006 2007 2006 $’000 $’000 $’000 $’000
Consolidated +1% (100 basis points) (120) (740) (120) (740)
- .5% (50 basis points) 60 370 60 370
Parent +1% (100 basis points) 1,000 (210) 1,000 (210)
- .5% (50 basis points) (500) 105 (500) 105
The movements in profit are due to higher/lower interest costs from variable rate debt and cash balances. The movement in equity is due to the impact on profit of these interest rate movements. The sensitivity is lower in 2007 than in 2006 as a result of increased cash from the share issued.
(ii) Liquidity riskThe Group’s objective is to maintain a balance between continuity of funding and flexibility through the use of other interest-bearing loans. The Group’s financing activities are managed centrally by maintaining an adequate level of cash and cash equivalents to finance the Group’s operations. The Group also ensures the availability of bank credit facilities to address any short term funding requirements. The Group’s surplus funds are also managed centrally by placing them with reputable financial institutions.
The risk implied from the values shown in the following table, reflects a balanced view of cash inflows and outflows. Trade payables and other financial liabilities mainly originate from the financing of assets used in our ongoing operations such as property, plant, equipment and investments in working capital, inventories and trade receivables. These assets are considered in the Group’s overall liquidity risk. To monitor existing financial assets and liabilities as well as to enable an effective controlling of future risks, the group has established comprehensive risk reporting covering its worldwide business units that reflects expectations of management of expected settlement of financial assets and liabilities.
Year ended 31 December 2007
<=6 months
$’000
6-12 months
$’000
1-5 years $’000
>5 years $’000 Total
Consolidated Financial AssetsCash & cash equivalent 108,953 - - - 108,953Trade & other receivables 9,730 454 151 1,180 11,515
118,683 454 151 1,180 120,468Consolidated Financial LiabilitiesCCB standby L/C loan - - 60,339 - 60,339BioGold short term loan - - 15,531 - 15,531Jinfeng project loan 5,445 5,445 33,254 - 44,144Golden China Resources Corporation long-term loan - - - 596 596Golden China Resources Corporation Debentures 19,264 - - 19,264Trade & other payables 30,883 - - - 30,883Derivatives 13,669 15,547 95,755 - 124,971
69,261 20,992 204,879 596 295,728Net maturity 49,422 (20,538) (204,728) 584 (175,260)
For
per
sona
l use
onl
y

A n n u a l R e p o r t 2 0 0 7
97
28. FINANCIAL INSTRUMENTS (CONTINUED)
Year ended 31 December 2007
<=6 months
$’000
6-12 months
$’000
1-5 years $’000
>5 years $’000 Total
Parent Financial assetsCash & Cash equivalent 101,380 - - - 101,380Trade & other receivables 1,427 454 151 1,180 3,212
102,807 454 151 1,180 104,592Parent Financial liabilitiesTrade & other payables 289 - - - 289
289 - - - 289Net maturity 102,518 454 151 1,180 104,303
(iii) Credit riskCredit risk arises mainly from the risk that counterparties defaulting on the terms of their agreements. The carrying amounts of cash and cash equivalents and other receivables represent the Group’s maximum exposure to credit risk in relation to financial assets.
All gold derivatives have been taken out pursuant to the Company’s approved project financing facility. The counterparty for all gold derivatives is Standard Bank Plc.
As at 31 December 2007, there was no significant concentration of credit risk.
(iv) Commodity price riskThe Group is exposed to future movements in the price of gold. As part of its project financing for the Jinfeng mine, the Group was required to enter into gold forwards and options as set out in note 16.
Post Tax Profit Equity Higher/(Lower) Higher/(Lower)
2007 2006 2007 2006 $’000 $’000 $’000 $’000
Consolidated US$/oz +10% (3,010) - (31,688) (26,900)
US$/oz -5% 1,505 - 15,844 13,450
Parent US$/oz +10% - - - -
US$/oz -5% - - - -
There is no profit or loss impact to 2006 as no forward contracts matured during the year.
(v) Foreign currency riskAs a result of significant operations in the People’s Republic of China and large purchases of inventory denominated in RMB, the Group’s balance sheet can be affected significantly by movements in the RMB$/US$ exchange rates. At 31 December 2007, the A$/US$ exchange rate was 0.8816, and the US$/RMB$ exchange rate was 7.3037. The primary mitigate to this risk is that sales proceeds are denominated in RMB, and the group actively monitors its debt currency exposure and manage this within the limits of its lending arrangement.
For
per
sona
l use
onl
y

Notes to the Financial StatementsFor the year ended 31 December 2007
98
28. FINANCIAL INSTRUMENTS (CONTINUED)At 31 December 2007, the Group had the following exposure to A$/RMB foreign currency that is not designated in cash flow hedges:
Group Group Parent Parent 2007 2006 2007 2006 A$ $’000 $’000 $’000 $’000
Financial Assets Cash and Cash Equivalents 1,036 622 1,036 622Other Debtors 1,162 733 1,162 733 2,198 1,355 2,198 1,355Financial Liabilities - - - -
- - - -
Net exposure 2,198 1,355 2,198 1,355
Group Group Parent Parent 2007 2006 2007 2006 RMB $’000 $’000 $’000 $’000
Financial Assets Cash and Cash Equivalents 7,573 2,386 - -Other Debtors 8,446 815 - -
16,019 3,201 - -
Financial Liabilities Trade Creditors 23,516 (258) - -Other Creditors 7,078 5,166 - -
30,594 4,908 - -
Net exposure (14,575) (1,708) - -
The following sensitivity is based on the foreign currency risk exposures in existence at the balance sheet date.
At 31 December 2007, had the US Dollar moved, as illustrated in the table below, with all other variables held constant, post tax profit and equity would have been affected as follows:
Post Tax Profit Equity Higher/(Lower) Higher/(Lower)
2007 2006 2007 2006 A$ $’000 $’000 $’000 $’000
Consolidated A$/US$ +10% (200) (123) (200) (123)
A$/US$ -5% 116 71 116 71
Parent A$/US$ +10% (200) (123) (200) (123)
A$/US$ -5% 116 71 116 71
For
per
sona
l use
onl
y

A n n u a l R e p o r t 2 0 0 7
99
28. FINANCIAL INSTRUMENTS (CONTINUED) Post Tax Profit Equity Higher/(Lower) Higher/(Lower)
2007 2006 2007 2006 RMB $’000 $’000 $’000 $’000
Consolidated RMB/US$ +10% 1,325 155 1,325 155
RMB/US$ -5% (767) (90) (767) (90)
Parent RMB/US$ +10% - - - -
RMB/US$ -5% - - - -
The movements in profit in 2007 are more sensitive than in 2006 due to the higher level of RMB payables at balance date.
Management believes the balance date risk exposures are representative of the risk exposure inherent in the financial instruments.
(vi) Debt/Equity ManagementThe Group funds its exploration, development and operating activities using both debt and equity. The mix of debt and equity is determined by consideration of regulatory, commercial and risk factors as well as tax efficiencies and the impact on earnings per share. The Company prepares detailed medium to long term cash forecasts and determines funding requirements accordingly. Debt is preferentially utilised on production assets where tax shields can be effective.
Equity is ordinary shares, not preference capital.
29. EARNINGS PER SHARE 2007 2006
Basic earnings per share (cents per share) (13.23) (13.7)Diluted earnings per share (cents per share) (13.23) (13.7)Earnings used in calculating basic and diluted earnings per share $(23,496,817) $(20,054,360)Weighted number of ordinary shares on issue used in calculation of basic earnings per share 177,586,981 146,168,242Effect of dilutive securities - -Number of potential ordinary shares that are not dilutive and not used in the calculation of diluted earnings per share 8,651,645 5,764,086Weighted number of ordinary shares on issue used in calculation of diluted earnings per share 177,586,981 146,168,242
30. SUBSEQUENT EVENTSThe following significant events have occurred after 31 December 2007:
• On 11 December 2007, the company announced that it had received over 90% acceptances for the acquisition of Golden China Resources Corporation and was moving into compulsory acquisition to acquire the outstanding shares. On 16 January 2008, the compulsory acquisition was completed by the issue of a further 821,772 shares for a total number of shares issued in consideration of 14,189,642.
• On 14 December 2007, an equity raising of A$170 million was transacted for the issue of 26,459,459 fully paid ordinary shares at A$6.45 per share. The issue of 16,669,459 shares was conditional upon shareholder approval which was received at an Extraordinary General Meeting held on 24 January 2008. As a result of this approval these shares were issued and gross proceeds of A$107,518,010 realised.
For
per
sona
l use
onl
y
100
Directors’ DeclarationFor the year ended 31 December 2007
DIRECTORS’ DECLARATIONIn accordance with a resolution of the directors of the company, we state that:
In the opinion of the directors:
(a) The financial statements, notes and additional disclosures included in the Directors’ Report designated as audited, of the company and consolidated entity are in accordance with the Corporations Act 2001, including:
(i) giving a true and fair view of the company’s and the consolidated entity’s financial position as at 31 December 2007 and of their performance for the year ended on that date; and
(ii) Complying with Accounting Standards and Corporations Regulations 2001; and
(b) There are reasonable grounds to believe that the company will be able to pay its debts as and when they become due and payable.
This declaration has been made after receiving the declarations required to be made to the directors in accordance with section 295A of the Corporations Act 2001 for the financial year ending 31 December 2007.
On behalf of the board
J Askew J. Klein Chairman CEO
Sydney 20 February 2008
For
per
sona
l use
onl
y

A n n u a l R e p o r t 2 0 0 7
101
Independent Audit ReportAs at 31 December 2007
For
per
sona
l use
onl
y

102
Independent Audit ReportAs at 31 December 2007
For
per
sona
l use
onl
y

A n n u a l R e p o r t 2 0 0 7
103
Additional Stock Exchange InformationFor the year ended 31 December 2007
Additional information required by the Hong Kong Stock Exchange and not shown elsewhere in this report is as follows.
Sufficient Public Float
In accordance with to the Listing Rules of the Hong Kong Stock Exchange the Company confirms that, at the date of this report, at least 25% of its ordinary shares are in public hands.
Historical Financial Results2007$’000
2006$’000
2005$’000
2004$’000
2003$’000
Sales revenue - spot 33,573 8,695 11,024 20,044 37,296Hedging losses (9,292) 0 0 0 0Net revenue 24,281 8,695 11,024 20,044 37,296Loss before depreciation, finance costs, exploration written off and tax
(5,218) (13,800) (12,652) (143) 11,852
Profit/(loss) before income tax (24,801) (20,054) (23,707) (20,856) 3,378Net profit/(loss) after tax (24,939) (20,054) (26,210) (20,856) 3,378
Assets 743,564 275,801 140,925 90,097 121,883Liabilities (397,684) (221,888) (100,751) (15,728) (23,023)Net assets 345,880 53,913 40,174 74,369 98,860Minority interest (13,696) 0 0 0 0
Number of shares on issue (‘000s) 223,432 153,061 131,444 129,244 128,847Earnings per share (13.2) (13.7) (20.2) (16.1) 3.1
Additional information required by the Australian Stock Exchange Ltd and not shown elsewhere in this report is as follows. The information is current as at 25 March 2008.
(a) Distribution of equity securitiesThe number of shareholders, by size of holding, in each class of share are:
Ordinary shares Number of holders Number of shares
1 - 1,000 2,350 905,8361,001 - 5,000 1,095 2,630,4965,001 - 10,000 211 1,603,48210,001 - 100,000 202 6,177,857100,001 and over 67 232,403,731 3,925 243,721,402
The number of shareholders holding less than amarketable parcel of shares are: 388 16,903
For
per
sona
l use
onl
y

Additional Stock Exchange InformationFor the year ended 31 December 2007
(b) Distribution of optionsThe number of holders, by size of holding, in each class of unlisted options are: $2.53 Various Various Golden China Golden China 16/09/10 Directors Employees Warrants Options
1 - 1,000 - - - 9 21,001 - 5,000 - - 24 11 35,001 - 10,000 - - 18 5 310,001 - 100,000 - 2 23 11 3100,001 and over 1 4 10 2 2Total 1 6 75 38 13
(c) Twenty largest shareholdersThe names of the twenty largest holders of quoted ordinary shares are: Ordinary shares Number of Percentage of shares ordinary shares
1 HSBC Custody Nominees (Australia) Limited 56,535,817 23.22 Gold Fields Australasia (BVI) Limited 37,369,421 15.33 National Nominees Limited 30,367,614 12.54 Citicorp Nominees Pty Limited 17,108,991 7.05 ANZ Nominees Limited <Cash Income A/C> 15,176,536 6.26 J P Morgan Nominees Australia Limited 14,187,457 5.87 HKSCC Nominees Limited 10,880,200 4.58 Sino Mining International Limited 10,020,805 4.19 Citicorp Nominees Pty Limited <CFS W/Sale Gbl Res Fund A/C> 5,092,115 2.110 HSBC Custody Nominees (Australia) Limited - GSI ECSA 3,481,581 1.411 Mr Jacob Klein 2,203,831 0.912 HSBC Custody Nominees (Australia) Limited - A/C 2 2,192,557 0.913 HSBC Custody Nominees (Australia) Limited - A/C 3 1,771,925 0.714 Merrill Lynch (Australia) Nominees Pty Limited 1,702,463 0.715 HSBC Custody Nominees (Australia) Limited - GSCO ECA 1,684,717 0.716 Citicorp Nominees Pty Limited < CFSIL CFS Ws Small Comp A/C> 1,670,740 0.717 Citicorp Nominees Pty Limited < CFS Future Leaders Fund A/C> 1,550,000 0.618 Citicorp Nominees Pty Limited < CFS Wsle Imputation Fund A/C> 1,538,450 0.619 Standard Bank London Limited 1,350,000 0.620 Cogent Nominees Pty Limited 1,337,923 0.6 217,223,143 89.1
(d) Substantial shareholdersThe names of substantial shareholders who have notified the Company in accordance with section 671B of the Corporations Act are: Number of shares
Gold Fields Limited 34,621,842Merrill Lynch & Co Inc 21,942,151Commonwealth Bank of Australia 21,416,826
(e) Voting rightsAll ordinary shares carry one vote per share without restriction.
104
For
per
sona
l use
onl
y

A n n u a l R e p o r t 2 0 0 7
Corporate Directory
Company InformationSino Gold Mining LimitedABN: 42 093 518 579Australian Stock Exchange Code: SGXHong Kong Stock Exchange Code: 1862Website: www.sinogold.com.au
DirectorsJames Askew, Chairman Jacob Klein, President and CEOXu Hanjing, Executive DirectorPeter Cassidy, Non-Executive DirectorBrian Davidson, Non-Executive DirectorJames Dowsley, Non-Executive Director
Company SecretaryAustralia - Ivo PolovineoHong Kong - Jane Chan Yuen Bik
Registered OfficesAustralia (Principal Place of Business)Level 22, 44 Market StreetSydney NSW 2000Telephone: +61 2 8259 7000Facsimile: +61 2 8259 7070Email: [email protected]
Hong KongSino Gold Mining Limited31st Floor, Gloucester TowerThe Landmark, CentralHong Kong
Share RegistriesRegistries LimitedLevel 7, 207 Kent StreetSydney NSW 2000Telephone: +61 2 9290 9600Facsimile: +61 2 9279 0664Website: www.registriesltd.com.au
Computershare Hong KongShops 1712-1716, 17th Floor, Hopewell Centre183 Queen’s Road East, WanchaiHong Kong
AuditorsErnst & Young680 George StreetSydney NSW 2000
LawyersDeaconsLevel 18, Grosvenor Place225 George StreetSydney NSW 2001
In this report the words ‘Sino Gold’, ‘the Group’ or ‘the Company’ are used to refer to Sino Gold Limited and/or its related bodies corporate, ‘Golden China’ is used to refer to Golden China Resources Corporation and/or its related bodies corporate and ‘Gold Fields’ is used to refer to Gold Fields Limited and/or its related bodies corporate.
All currency is expressed in Australian dollars unless otherwise indicated. All weights expressed in ounces are troy ounces.
The information contained in this report has been prepared using the information available to Sino Gold at the time of preparation. This report contains forward-looking statements that were based on expectations, estimates and projections as of the date of this report. Any forward-looking statement is subject to known and unknown factors which may cause actual results and developments to materially differ from those expressed by, or implied by the forward-looking statements in this report.
The information contained in this report which relates to mineralisation, reserves or resources has been prepared in accordancewith the Australasian Code for Reporting of Exploration Results, Mineral Resources and Ore Reserves (2004 Edition) and accurately reflects information compiled or audited by Sino Gold’s Chief Geologist Phillip Uttley and those named in the Notes to Mineral Resources and Ore Reserves, who are Competent Persons in relation to such mineralisation.
Des
igne
d an
d pr
oduc
ed b
y Ve
rsa
Prin
ted
by
For
per
sona
l use
onl
y

Sino Gold Mining LimitedLevel 22, 44 Market Street, Sydney NSW 2000 AustraliaPhone: +61 2 8259 7000 Fax: +61 2 8259 7070
www.sinogold.com.au
For
per
sona
l use
onl
y