cape fear valley medical center - east carolina university€¦ · 1 cape fear valley medical...
TRANSCRIPT

1
Cape Fear Valley Medical Center
2013-2015 Community Health Needs Assessment
A comprehensive assessment of the health needs of Cumberland County residents

2
TABLE OF CONTENTS
Sections Page
Cover Page 1
Table of Contents 2
Executive Summary 3
Methodology 4
Primary Data 8
Secondary Data
County Overview 10
Demographics 11
Socioeconomic Factors 15
Health Status and Behavior 18
Mortality and Morbidity Statistics 25
EMS Statistics 44
Existing Health Care Facilities and Resources 49
Identified Health Needs and Prioritization / Available Resources 55
Appendices
# 1 Cumberland County CHNA Survey – Results and Feedback 57
# 2 Cumberland County CHNA Survey – English Version 89
# 3 Cumberland County CHNA Survey – Spanish version 93
# 4 Letter to Partners from Buck Wilson and Michael Nagowski 97
# 5 Partner Collaborative Meeting October 2012 99
# 6 Ongoing Community Health Activities 105
References 121

3
EXECUTIVE SUMMARY
Overview and Background Provisions of the Patient Protection and Affordable Care Act (ACA) require all non-profit hospital facilities in the United States to conduct a community health needs assessment and adopt an implementation strategy to meet the identified community health needs. In the process of conducting a community health needs assessment, all non-profit hospitals are required to take into account input from individuals who represent a broad interest of the community served, including those individuals with special knowledge and/or expertise in public health. Cape Fear Valley Medical Center conducted a community health needs assessment to evaluate the health of the community, identify high priority health needs, and develop strategies to address the needs of the community.
Data Collection and Analysis The 2013-2015 Cape Fear Valley Medical Center Community Health Needs Assessment represents a combination of quantitative and qualitative information from reputable statistical sources, and community survey and feedback provided by community partners. Primary data included qualitative information from interviews conducted with the target population, including both community members and health service providers. Secondary data included public data on demographics, health and healthcare resources, behavioral health surveys, county rankings, and disease trends, , and emergency services. The results of the 2013-2015 Community Health Needs Assessment are summarized in this Report. A comprehensive implementation plan will be developed based on the results of the 2013-2015 Community Health Needs Assessment.
Inquiries regarding the 2013-2015 Cape Fear Valley Medical Center Community Health Needs Assessment should be directed to: Michael Nagowski Chief Executive Officer Cape Fear Valley Medical Center 1638 Owen Drive Fayetteville, NC 28304 [email protected] (910) 615-7000

4
METHODOLOGY
Overview The assessment process included data collection from a combination of primary and secondary sources. Valuable input from community survey respondents provided primary data for the assessment. Secondary data sources included the 2010 U.S. Census Data and the North Carolina State Center for Health Statistics, and county level data from Cape Fear Valley Medical Center and Cumberland County Department of Health. Cape Fear Valley Medical Center was an integral part of the Community Health Assessment Team (CHAT) established to analyze the community health needs of Cumberland County (see Appendix 4, 5). The CHAT reviewed the primary and secondary data, and discussed community health needs that may be addressed by the Cape Fear Valley Medical Center. The Community Health Needs Assessment utilized the following six step process:
Step 1: Establishing the Assessment Infrastructure The CHAT participants included representatives from Cape Fear Valley Medical Center, Cumberland County Department of Health, Methodist University, Fayetteville State University, Fayetteville Technical Community College, The Care Clinic, United Way, Carolina Collaborative Community Care, Local Ministry Services, Community Health Interventions, Better Health, and Southeastern Area Health Education Center. On October 9, 2012, Cape Fear Valley Medical Center and Cumberland County Department of Health hosted a CHAT meeting at which an overview of the Community Health Needs Assessment process and community survey were presented (see Appendix 5). Additionally, results from the 2010-2012 Community Health Needs Assessment Implementation Plan were discussed with the group. Attendees provided input regarding community health strengths and concerns, as well as identified the top health concerns in Cumberland County. Those individuals, representing diverse groups in Cumberland County were chosen to participate in the CHAT because of their insights about the community’s health needs.

METHODOLOGY
5
Community Health Needs Assessment Team (CHAT) PROJECT FACILITATORS Cape Fear Valley Health System Michael Nagowski, Chief Executive Officer, Cape Fear Valley Health System Sandy Godwin, Executive Director of Corporate Strategic Planning, Cape Fear
Valley Health System Nicole McMillan, Analyst, Cape Fear Valley Health System Shea Poteet, Analyst, Cape Fear Valley Health System.
Cumberland County Department of Health Buck Wilson, Director Brenda Jackson, Director for Department of Social Services Barbara Carraway, Department of Public Health Rodney Jenkins, Department of Public Health.
WORK GROUP Community Health Needs Assessment Partners Fayetteville-Cumberland Parks and Recreation, Michael Gibson, Director Fayetteville State University, Dr. James Anderson, Chancellor Cumberland County Mental Health, Hank Debnam, Director Methodist University, Dr. Hancock, President Cumberland County Schools, Dr. Frank Till, Superintendant Fayetteville Metro Housing Authority, Dawn Driggers, Director Care Clinic, Cathy Ory, Director Fayetteville/Cumberland County Ministerial Council, Dr. McLauchlin,
President Fayetteville Technical Community College, Larry Keen, President United Way, Crystal McNair March of Dimes, Catherine Heindselman, Director Community Health Interventions, Mary E. McAllister, M. Ed., Executive
Director Better Health, Jim Kerchmar, President Carolina Collaborative Community Care, Brenda Sparks, Executive Director Southern Regional AHEC, Deborah Teasley, President Southern Regional AHEC, Karen Goble Cumberland County Sheriff’s Office, Earl Butler, Sheriff

METHODOLOGY
6
Partnership for Children of Cumberland County, Eva Hanson, President. Cape Fear Valley Health System and Cumberland County Department of Health were co-facilitators of the Community Health Needs Assessment process. Cape Fear Valley Health System and Cumberland County Department of Health roles and responsibilities:
Coordinate the overall Community Health Needs Assessment process
Provide the meeting space
Motivate other community organizations to participate
Conduct a community survey to collect primary data
Collect and organize secondary data
Identify priority issues
Develop and implement initiatives to address priority issues. Partner organizations, contributions, and roles:
Provide participants and input. Key factors in developing and maintaining partnerships:
Maintaining mutual respect and a common language
Following through on commitments
Step 2: Defining Purpose and Scope (Defining the Community) The purpose of the Community Health Needs Assessment was to evaluate health needs of the community, and to identify resources in place to meet those needs and major gaps between the two. The CHAT developed a Community Health Needs Assessment Survey (CHNA Survey). CHAT participants disbursed the CHNA Survey to residents of Cumberland County. Data from the CHNA Survey was analyzed by the CHAT, and are included in this Report. The CHNA data will be used to develop an action plan to bridge the gap and better meet the health needs of the community.
Step 3: Collecting and Analyzing Data Primary data was collected during period of December 2012 to February 2013 using the CHNA Survey. CHAT partners distributed the CHNA Survey to the community at various community locations. CHAT partners reviewed the data and provided input regarding community health strengths and concerns. From that data and input, the top health concerns in Cumberland County were identified by

METHODOLOGY
7
the CHAT. Secondary data was collected through several sources, to include the 2010 U.S. Census Data and the North Carolina State Center for Health Statistics.
Step 4: Selecting Priorities The CHAT reviewed the primary and secondary data, and discussed the health needs that should be addressed by Cape Fear Valley Medical Center. The CHAT determined that it was best to focus on services that impact the community as a whole versus patient-specific services.
Step 5: Documenting and Communicating Results The CHAT meetings were recorded for future reference and results of the input were tallied to determine the community’s strengths/values, barriers/concerns, and the top 3 health needs. Those results will be presented to the Cape Fear Valley Medical Center’s Senior Leadership Team for approval.
Step 6: Planning for Action and Monitoring Progress Following the completion of the 2013-2015 Community Health Needs Assessment Report, an Implementation Plan will be created to meet the applicable identified needs. The Implementation Plan will be presented to the Cape Fear Valley Medical Center Board of Trustees for review and approval. Efforts will be measured appropriately and progress will be reported regularly.

8
PRIMARY DATA: Community Health Survey Document and Partners Cape Fear Valley Medical Center and Cumberland County Department of Health hosted two meetings for CHAT participants. At the first the CHAT participants reviewed the Community Health Needs Assessment process, primary and secondary data collection methods, and the required community survey. Additionally, results from the 2010-2012 Community Health Needs Assessment Implementation Plan were shared with the group. Each participant was encouraged to share the following ideas: strengths and values of the community; and concerns and barriers of the community. Results of the CHA Survey were analyzed at the second meeting. Attendees provided input regarding community health strengths and concerns, as well as top health concerns seen throughout the Cumberland County area.
Community Health Needs Assessment Findings The CHAT reviewed information and details regarding the Community Health Needs Assessment process, including primary and secondary data collection methods (see Appendices 1 – 3 and references). Additionally, results from the 2010-2012 Community Health Needs Assessment Implementation Plan also were reviewed. CHAT participants were asked to share perceived strengths and values of the community in an effort to identify potential resources to assist in addressing the community’s top health needs. The top strengths and values identified include:
Collaboration between community organizations Ongoing Community Health Activities (see Appendix 6) Caring professionals Variety of resources Quality clinical care Public transportation Strong local government Affordable wellness activities.
The CHAT participants were then asked to share their perceived barriers and concerns within the community in an effort to identify potential community health needs. The top barriers and concerns are:
Patient motivation and compliance Awareness and education

PRIMARY DATA: Community Health Survey Document and Partner
9
Lack of financial resources Sexual Activity
• Teen pregnancy • Sexually Transmitted Diseases
Obesity Mental health Aging population Safety concerns.
The CHAT reviewed the primary data and identified the community’s barriers and concerns. The CHAT continued to research community health needs by utilizing a variety of secondary data. Recommendations and data will be shared with the Cape Fear Valley Medical Center’s senior leadership team.

10
SECONDARY DATA: County Overview Cumberland County, located in the eastern part of the state, is 65 miles south of Raleigh in an area often referred to as the Sandhills. Cumberland County has a total area of 658.11 square miles, with 652.43 square miles of land area. Fayetteville is Cumberland County’s county seat and its largest municipality. Other municipalities in Cumberland County are Eastover, Falcon, Godwin, Hope Mills, Linden, Spring Lake, Stedman, and Wade. Fayetteville has been the home of Fort Bragg since 1918 when 127,000 acres of sand hills and pine trees were designated as a U.S. army installation. Pope Air Force Base located here in 1919. It is the ”Home of the 82nd Airborne and Special Operations Forces.” Most recently, the United States Army Forces Command and United States Army Reserve Command moved their headquarters to Fort Bragg. Pope Air Force Base became Pope Army Field in accordance with 2005 BRAC law. The strong bond between the community and Fort Bragg has served to enhance the relationship with defense and homeland security companies who support the installation’s mission and the United States. Over 6,000 soldiers transitioned out of the armed forces annually and a large number stay in the area taking jobs in local companies. Highly disciplined and highly skilled, those talented individuals strengthen the existing labor pool.
North Carolina Map – Cumberland County Highlighted in Dark Blue

11
SECONDARY DATA: Demographics Population Growth and Age Distribution Cumberland County has an approximate population of 319,431 persons in 2010 according to the U.S. Census Bureau. The population of Cumberland County increased by 5.4% between 2000 and 2010, with a mean age increase from 29 years in 2009 to 31 years in 2010.
Age Distribution, Cumberland County (2010)
Age Range Number Percent
< 5 26,539 8.3%
5-19 years 69,035 21.6%
20-29 years 58,828 18.4%
30-39 years 42,507 13.3%
40-49 years 41,324 12.9%
50-59 years 37,161 11.6%
60 years and older 44,037 13.8%
Total 319,431 100.0% Source: U.S. Census Bureau, American Fact Finder Based upon 2010 Census
Age Distribution, Cumberland County (2011)
Age Range Number Percent
< 5 27,251 8.4%
5-19 years 68,738 21.2%
20-29 years 61,974 19.1%
30-39 years 42,647 13.1%
40-49 years 40,705 12.5%
50-59 years 37,768 11.6%
60 years and older 45,802 14.1%
Total 324,885 100.0% Source: North Carolina State Center for Health Statistics ("NC SCHS") Based upon 2010 Census + estimated growth
As shown in the previous table, population growth in Cumberland County increased at an annual rate of 1.7% from 2010 to 2011.

SECONDARY DATA: Demographics
12
Age Distribution, North Carolina (2011)
Age Range Number Percent
< 5 629,791 6.5%
5-19 years 1,933,183 20.0%
20-29 years 1,309,482 13.6%
30-39 years 1,267,262 13.1%
40-49 years 1,369,585 14.2%
50-59 years 1,300,991 13.5%
60 years and older 1,846,107 19.1%
Total 9,656,401 100.0% Source: North Carolina State Center for Health Statistics ("NC SCHS") Based upon 2010 Census + estimated growth
Gender, Cumberland County and North Carolina (2010)
Gender Cumberland Percent NC Percent
Female 165,103 51.7% 4,889,991 51.3%
Male 154,328 48.3% 4,645,492 48.7%
Total 319,431 100.0% 9,535,483 100.0% Source: US Census Bureau, American Fact Finder; North Carolina State Center for Health Statistics ("NC SCHS")
Gender, Cumberland County and North Carolina (2011)
Gender Cumberland Percent NC Percent
Female 167,145 51.4% 4,952,679 51.3%
Male 157,740 48.6% 4,703,722 48.7%
Total 324,885 100.0% 9,656,401 100.0% Source: US Census Bureau, American Fact Finder; North Carolina State Center for Health Statistics ("NC SCHS")
In comparison, North Carolina’s mean age is 37.4 and Cumberland County’s population is slightly younger at 31. In addition, the population of Cumberland County was projected to increase by an additional 1.7%.
Race and Ethnicity
According to the U.S. Census Bureau, the racial composition of Cumberland County residents is predominately White (47.2%) and African American (35.7%), with 17.1% representing racial or ethnic minority groups. As shown in the following table, the race distribution in Cumberland County is more diverse than that of North Carolina.

SECONDARY DATA: Demographics
13
Race and Ethnicity, Cumberland County and North Carolina (2010)
Race and Ethnicity Cumberland County North Carolina
White 150,749 47.2% 6,223,995 65.3%
Black or African American 113,939 35.7% 2,019,854 21.2%
American Indian and Alaska Native 4,655 1.5% 108,829 1.1%
Asian 6,885 2.2% 206,579 2.2%
Native Hawaiian and Other Pacific Islander 1,114 0.3% 5,259 0.1%
Two or More Races 11,228 3.5% 155,759 1.6%
Hispanic or Latino Origin 30,190 9.5% 800,120 8.4%
Other 671 0.2% 15,088 0.2%
Total 319,431 100.0% 9,535,483 100.0% Source: U.S. Census Bureau, American Fact Finder
Family Configuration As evident by the population age distribution, there are more households with one or more members under the age of 19 years in Cumberland County, compared to North Carolina. Additionally, there are fewer households with one or more person age 65 and over in Cumberland County. With the average North Carolina household size of 2.5 persons, Cumberland County households are slightly larger at 2.56, with a mean size of 3.06 persons per family. Furthermore, the Cumberland County divorce rate is 6.9 almost twice as high as North Carolina, which has a divorce rate of 3.8.
Education Cumberland County School’s mission emphasizes safety in all schools and student achievement will continually increase with no differences among subgroups. Cumberland County community education level is comparable to the state of North Carolina, as shown in the following table.

SECONDARY DATA: Demographics
14
Education Breakdown, Cumberland County and North Carolina (2010)
Factor Cumberland County North Carolina
Less than 9th Grade 3.7% 6.0%
High School, No Diploma 7.3% 9.8%
High School Graduate (includes equivalency) 27.6% 27.7%
Some College, No Degree 29.0% 21.4%
Associate's Degree 10.6% 8.5%
Bachelor's Degree 14.3% 17.7%
Graduate or Professional Degree 7.5% 8.9%
Total 100.0% 100.0% Source: U.S. Census Bureau, American Fact Finder About 1,729 (54.1%) of Cumberland County students took the SAT test with an average SAT score of 1,393. Approximately 57,841 (63.0%) of students across North Carolina took the SAT test with an average SAT score of 1,485. The North Carolina SAT scores are approximately 6.6% higher than Cumberland County, as shown in the following table.
SAT Scores, Cumberland County and North Carolina (2010)
Cumberland County North Carolina
1,393 1,485 Source: ncpublicschools.org

15
SECONDARY DATA: Socioeconomic Factors Employment, Household Income and Poverty Fort Bragg is the backbone of Cumberland County’s economy. The County has a heritage of agriculture but began the transition to manufacturing in the early 1920s. Some of the areas major private employers include Cape Fear Valley Health System, Wal-Mart, The Goodyear Tire & Rubber, Food Lion, LLC, Purolator Filters NA, LLC, ITT Industries, and M.J. Soffee, LLC. Public employers include Cumberland Co. Board of Education, U.S. Department of Defense, Veteran Administration Hospital, US Postal Service, County of Cumberland, City of Fayetteville and Public Works Commission.
The U.S. Census Bureau reports Cumberland County’s mean income of $58,098, which is $5,200 less than the mean household income in North Carolina. The per capita income is $22,888 for Cumberland County and $25,256 for North Carolina. Cumberland County’s lower mean and per capita income can be attributed to a high unemployment rate 9.7% in Cumberland County compared to 8.9% for the state of North Carolina according to Bureau of Labor Statistics April 2013 figures.
Household Income and Benefit Dollars
Cumberland County and North Carolina (2007-2011)
Income Level Cumberland County North Carolina
Below $10,000 9.0% 8.2%
$10,000 - $24,999 16.7% 18.4%
$25,000 - $49,999 29.2% 26.8%
$50,000 - $99,999 30.3% 29.8%
$100,000 - $199,999 12.9% 13.7%
$200,000 and Above 1.9% 3.1% Source: U.S. Census Bureau, American Fact Finder
Income Level Cumberland County North Carolina
Median Household Income $44,861 $46,291
Mean Household Income $58,098 $63,298 Source: U.S. Census Bureau, American Fact Finder
Income Level Cumberland County North Carolina
Per Capita Income $22,888 $25,256 Source: U.S. Census Bureau, American Fact Finder

SECONDARY DATA: Socioeconomic Factors
16
As shown in the previous table, over half (55%) Cumberland County households report an annual income (including benefit dollars) of under $50,000. In 2011, 16.7 percent of Cumberland County residents lived below the poverty level compared to 16.1 percent of state residents. Cumberland County had a higher percentage (26.0%) of children in poverty compared to North Carolina’s percentage of 25.0%, as shown in the following table.
Poverty Rates, Cumberland County and North Carolina (2011)
County / State % of Residents living in
Poverty % of Children living in
Poverty
Cumberland County 16.7% 26.0%
North Carolina 16.1% 25.0% Source: countyhealthrankings.org & quickfactcensus.gov
The number of Cumberland County residents living in poverty is 3.7% higher than the North Carolina average.
Housing and Cost of Living Historically, one of the greatest wealth building opportunities for families living in America was home ownership. Home equity was by far one of the most effective means of obtaining wealth for middle class Americans. Recession and foreclosures have caused a negative impact on financial institutions, home-owners and the community as a whole. The table below shows the values of owner occupied homes in Cumberland County and the state. Median home values in Cumberland County are almost 20% less than the median home value for North Carolina. Only 19.9% of homes in the Cumberland County are valued at or above $200,000, while 33.8% of homes in North Carolina are valued at or above the same price point, as shown in the following table

SECONDARY DATA: Socioeconomic Factors
17
Values of Owner Occupied Homes Cumberland County and North Carolina (2010)
Factor Cumberland County North Carolina
Less than $50,000 8.1% 9.6%
$50,000 to $99,999 28.4% 18.5%
$100,000 to $149,999 25.5% 20.8%
$150,000 to $199,999 18.1% 17.3%
$200,000 to $299,999 12.6% 17.0%
$300,000 to $499,999 5.5% 11.3%
$500,000 to $999,999 1.4% 4.5%
$1,000,000 or more 0.4% 1.0%
Median 123,400 152,700 Source: U.S. Census Bureau, American Fact Finder
In 2010, Cumberland County had 118,117 occupied housing units. 57.8 percent (68,313) of the units were owner-occupied and 42.2 per cent (49,804) of the units were renter occupied.

SECONDARY DATA: Health Status and Behavior
18
SECONDARY DATA: Health Status and Behavior
North Carolina Statewide and Cumberland County Trends in Key Health Indicators The following section reviews a broad range of Cumberland County specific data that provide insight into the health status and health-related behavior of residents. Publicly reported data is based on statistics of actual occurrences, such as the incidence of certain diseases, as well statistics based on interviews of individuals about their personal health condition and health concerns from the Behavioral Risk Factor Surveillance System (BRFSS) consolidated through www.countyhealthrankings.com website. As shown in the following table, Cumberland County ranks 74th out of 100 for health outcomes and 50th out of 100 for health factors among North Carolina counties. Cumberland County rankings reflect high mortality and morbidity with negative rankings for health behaviors (smoking, diet and exercise, binge drinking, and STDs), clinical care (uninsured population, preventable hospital stays, diabetic and mammography screening), physical environment (access to healthy foods) and social and economic factors (26% of children live in poverty, 22% without family and social support, 43% of children live in single parent households and violent crime is almost 10 times as high as the national average and 1.6 times higher than the North Carolina average).
Focus Area Measure WeightCumberland
County
North
Carolina
National
Benchmark
Cumberland
Rank
Mortality
Premature Death (years of potential life
lost before age 75 per 100,000 population
age- adjusted) 50% 8,956 7,480 5,317
Poor or fair health (percent of adults
reporting fair or poor health age-adjusted)10% 19% 18% 10%
Poor physical health days (avg number of
unhealthy days in past 30 days, age-
adjusted) 10% 4.5 3.6 2.6
Poor mental health days (avg number in
past 30 days age-adjusted) 10% 4.0 3.4 2.3
Low birthweight (percent of live births
with birthweight < 2500 grams) 20% 9.9% 9.1% 6.0%
Source: www.countyhealthrankings.org
HEALTH OUTCOMES
Morbidity
74

SECONDARY DATA: Health Status and Behavior
19
Focus Area Measure WeightCumberland
County
North
Carolina
National
Benchmark
Cumberland
Rank
Tobacco Use
Adult smoking (percent of adults that
report smoking >= 100 cigarettes and
currently smoking) 10% 23.0% 21.0% 13.0%
Adult obesity (percent of adults that report
a BMI > or = 30 7.5% 33.0% 29.0% 25.0%
Physical inactivity (percent of adults that
report no leisure time physical activity) 2.5% 30.0% 25.0% 21.0%
Excessive drinking (percent of adults who
report heavy or binge drinking) 2.5% 12.0% 13.0% 7.0%
Motor vehicle crash deaths per 100,000
population 2.5% 19 17 10
Sexually transmitted infections (chlamydia
rate per 100,000) 2.5% 542 441 92
Teen birth rate (per 1,000 females ages 15-
19) 2.5% 55 46 21
Source: www.countyhealthrankings.org
74
Alcohol Use
Sexual Activity
HEALTH FACTORS / HEALTH BEHAVIORS
Diet and
Exercise
Focus Area Measure WeightCumberland
County
North
Carolina
National
Benchmark
Cumberland
Rank
Uninsured (percent of population < 65
without health insurance) 5.0% 17% 19% 11%
Primary Care (ratio of population to
primary care physicians) 3.0% 1,329:1 1,480:1 1,067:1
Preventable hospital stays (rate for
ambulatory sensitive conditions per 1,000
Medicare enrollees) 2.0% 58 63 47
Diabetic screening (percent of diabetic
Medicare enrollees that receive HbA1c
screening) 2.5% 83% 88% 90%
Mammography screening (percent of
female Medicare enrollees) 2.5% 59% 69% 73%
Source: www.countyhealthrankings.org
24
Quality of Care
Access to Care
HEALTH FACTORS / CLINICAL CARE

SECONDARY DATA: Health Status and Behavior
20
Focus Area Measure WeightCumberland
County
North
Carolina
National
Benchmark
Cumberland
Rank
High school graduation (percent of ninth
grade cohort that graduates in four years) 5.0% 81% 80%
Some college (percent of adults aged 25-44
years with some post-secondary
education) 5.0% 68% 62% 70%
EmploymentUnemployment rate (percent of
population age 16+ unemployed) 10.0% 10.2% 10.5% 5.0%
IncomeChildren in poverty (percent of children
under age 18 in poverty) 10.0% 26% 25% 14%
Inadequate social support (percent of
adults without social/emotional support) 2.5% 22% 21% 14%
Percent of children that live in single-
parent household 2.5% 43% 35% 20%
Community
SafetyViolent crime rate per 100,000 population
5.0% 647 411 66
Source: www.countyhealthrankings.org
43
Education
HEALTH FACTORS / SOCIAL AND ECONOMIC FACTORS
Family and
Social Support
Focus Area Measure WeightCumberland
County
North
Carolina
National
Benchmark
Cumberland
Rank
Air pollution (particulate matter days)2.0% 12.9 12.9 8.8
Air pollution (ozone days) 2.0% 3% 3% 0%
Access to recreational facilities (rate per
100,000 population) 2.0% 6 11 16
Limited access to health foods (percent of
population who are low-income and do
not live close to a grocery store) 2.0% 13% 7% 1%
Fast food restaurants (percent of all
restaurants that are fast food) 2.0% 54% 49% 27%
Source: www.countyhealthrankings.org
Environmental
Quality
Built
Environment
91
HEALTH FACTORS / PHYSICIAL ENVIRONMENT

SECONDARY DATA: Health Status and Behavior
21
North Carolina Statewide and Cumberland County Birth Rates The birth rate in Cumberland County is higher than the North Carolina average, which is consistent with the younger/military population in the County.
Cumberland County and North Carolina Resident Live Birth Rates per 1,000 Population – 2011
Total Births Total Rate White Births Minority Births
North Carolina 120,403 12.5 67,541 52,861
Cumberland County 6,071 18.7 2,940 3,131 Source: North Carolina Center of Health Statistics
As shown in the following table, the percentage of low birth weight in Cumberland County is higher than the North Carolina average. There is room for improvement when compared to NC at 9.1 percent as well as the national benchmark of 6.0 percent. Factors influencing low birth weight are included in the Cumberland County Health Rankings. Those rankings reflect a higher than normal percentage of clinical and socio economic risks to include smoking, obesity, diabetes, 26% of children live in poverty, 22% without family and social support and 43% of children live in single parent households.
Cumberland County and North Carolina Resident Low Birth Weight by Race Rates per 1,000 Population – 2011
County/State Total White Minority
Number Percent Number Percent Number Percent
North Carolina 10,939 9.1% 5,065 7.7% 5,874 12.4%
Cumberland County 576 9.9% 217 7.4% 359 13.1% Source: North Carolina Center of Health Statistics; county health rankings.com
Factors influencing low birth weight are included in the Cumberland County Health Rankings. Those rankings reflect a higher than normal percentage of clinical and socio-economic risks to include smoking, obesity, diabetes, 26% of children live in poverty, 22% without family and social support, and 43% of children live in single parent households. The following table shows the percentage of live births classified as low birthweight (2,500 grams/5 lbs) for Cumberland County and North Carolina, respectively, in four year increments from 1997 through 2011.

SECONDARY DATA: Health Status and Behavior
22
Source: North Carolina State Center of Health Statistics
As shown in the previous table, Cumberland County’s percentage of live births classified as low birthweight has increased since 1997, while North Carolina’s percentage has remained constant. The following table shows the percentage of residents with live birth that were premature (less than 37 weeks gestation) for Cumberland County and North Carolina, respectively.
Source: North Carolina State Center of Health Statistics
As shown in the previous table, Cumberland County’s percentage of live births
8.9
9.1 9.1
9.3
9.89.9
8.4
8.6
8.8
9
9.2
9.4
9.6
9.8
10
1997-2001 2002-2006 2007-2011
NC Cumberland
Percentage of Resident Live Births Classified As Low Birthweight (2,500 grams/ 5 lbs 8 ozs or less)
13.1
13.5
12.8
14.6
15.2
14.2
11.5
12
12.5
13
13.5
14
14.5
15
15.5
1997-2001 2002-2006 2007-2011
NC Cumberland
Percentage of Resident Live Births That Were Premature (<37 Weeks Gestation)

SECONDARY DATA: Health Status and Behavior
23
classified as premature has decreased since 2006. Cumberland County’s percentage remains higher than North Carolina. The following table compares rate of teen pregnancy per 1,000 female residents of Cumberland County to North Carolina between 1997 and 2011 in four-year increments.
Source: North Carolina State Center of Health Statistics
As shown in the previous table, Cumberland County’s rate of teen pregnancies decreased considerably since 1997-2001, while remaining higher than North Carolina’s rate in each four-year increment. The following table compares rate of repeat teen pregnancies per 1,000 female residents of Cumberland County to North Carolina between 1997 and 2011 in four-year increments.
77.6
6455.3
96.4
75.3 74.2
0
20
40
60
80
100
120
1997-2001 2002-2006 2007-2011
NC Cumberland
Teen Pregnancies (Ages 15-19) per 1,000 Female Residents

SECONDARY DATA: Health Status and Behavior
24
As shown in the previous table, Cumberland County’s rate of repeat teen pregnancies decreased considerably since 1997-2001, and is lower than North Carolina’s rate in the last two four-year increments.
31.629.5
28
32.2
27.1 26.7
0
5
10
15
20
25
30
35
1997-2001 2002-2006 2007-2011
NC Cumberland
Percentage of Resident Teen Pregnancies (Ages 15-19) that Were Repeat

25
SECONDARY DATA - Mortality and Morbidity Age Adjusted Death Rates The following charts reflect the ten leading causes of death for Cumberland County and North Carolina, respectively. As shown in the first chart, cancer and heart disease rank as the two leading causes of death in the County and North Carolina.
Cumberland County and North Carolina 2007-2011 Age-Adjusted Death Rates per 100,000 Population
Cause of Death Cumberland County North Carolina
Overall 890.8 808.4
Heart Disease 206.0 179.3
Cancer 193.4 179.7
Chronic Lower Respiratory Diseases 51.8 46.6
Cerebrovascular Disease 45.8 46.0
Diabetes 32.4 22.0
Other Unintentional Injuries 26.1 29.2
Nephritis, Nephrotic Syndrome and Nephrosis 25.7 18.6
Alzheimer’s Disease 23.0 29.0
Septicemia 17.3 13.6
Unintentional Motor Vehicle Injuries 16.5 15.5
Source: North Carolina Center of Health Statistics; county health rankings.com
According to the 2007-2011 Age-Adjusted Death Rates, per 100,000 population obtained from the NC State Center for Health Statistics, the ten leading causes of death for Cumberland County are:
1. Diseases of the Heart 2. Cancer 3. Chronic Lower Respiratory Diseases 4. Cerebrovascular Disease 5. Diabetes 6. Other Unintentional Injuries 7. Nephritis, Nephrotic Syndrome and Nephrosis 8. Alzheimer’s 9. Septicemia 10. Unintentional Motor Vehicle Injuries.

SECONDARY DATA: Mortality and Morbidity
26
Cumberland County rates for leading causes of death exceed North Carolina’s rates for all causes of death except Other Unintentional Injuries and Alzheimer’s Disease, as shown in the following chart.
Important to note that Cumberland County’s death rate for Diabetes is almost 50% higher than North Carolina rate. For more detail on the 2007-2011 Ten Leading Causes of Death for Cumberland County, please refer to the North Carolina Center for Health Statistics website at: http://www.schs.state.nc.us/SCHS/pdf/HealthProfile2011_WEB.pdf The report is titled: “Profile of North Carolinians: 2011 Update”.
Cases % Cases %
1 1 Cancer 511 22.4% 18,201 22.8%
2 2 Diseases of heart 474 20.8% 16,959 21.3%
3 3 Chronic lower respiratory diseases 121 5.3% 4,705 5.9%
4 5 All other unintentional injuries 99 4.3% 2,996 3.8%
5 4 Cerebrovascular diseases 94 4.1% 4,290 5.4%
6 7 Diabetes mellitus 83 3.6% 2,276 2.9%
7 8 Nephritis, nephrotic syndrome and nephrosis 69 3.0% 1,705 2.1%
8 10 Septicemia 47 2.1% 1,319 1.7%
9 9 Influenza and pneumonia 46 2.0% 1,616 2.0%
10 Intentional self-harm (suicide) 41 1.8% 0.0%
6 Alzheimer's Disease 2,820 3.5%
All Other Causes (residual) 694 30.5% 22,793 28.6%
2,279 100.0% 79,680 100.0%
Source: State Center for Health Statistics, North Carolina
Rate per 100,000
CUMBERLAND COUNTY NORTH CAROLINA
Total Deaths -- All Causes
2007 - 2011 Leading Causes of Death in Cumberland County and North Carolina
(not age adjusted)
CAUSE OF DEATHRankRank
SECONDARY DATA: Mortality and Morbidity
27
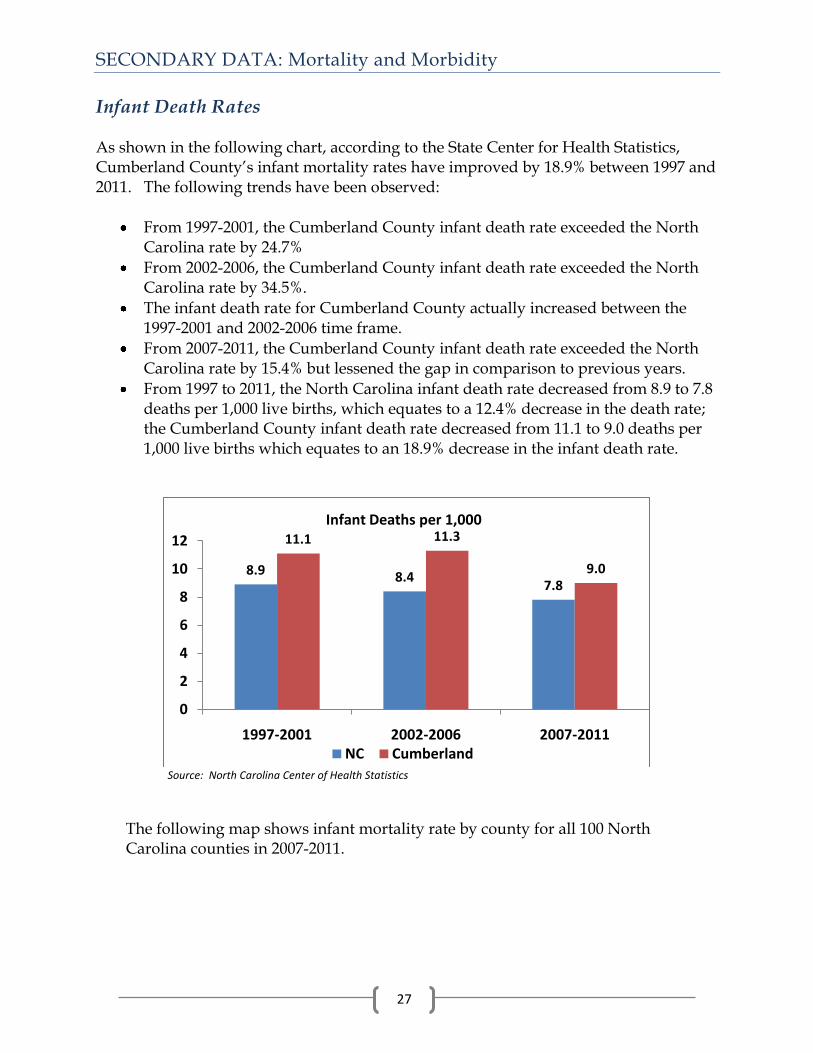
Infant Death Rates As shown in the following chart, according to the State Center for Health Statistics, Cumberland County’s infant mortality rates have improved by 18.9% between 1997 and 2011. The following trends have been observed:
From 1997-2001, the Cumberland County infant death rate exceeded the North Carolina rate by 24.7%
From 2002-2006, the Cumberland County infant death rate exceeded the North Carolina rate by 34.5%.
The infant death rate for Cumberland County actually increased between the 1997-2001 and 2002-2006 time frame.
From 2007-2011, the Cumberland County infant death rate exceeded the North Carolina rate by 15.4% but lessened the gap in comparison to previous years.
From 1997 to 2011, the North Carolina infant death rate decreased from 8.9 to 7.8 deaths per 1,000 live births, which equates to a 12.4% decrease in the death rate; the Cumberland County infant death rate decreased from 11.1 to 9.0 deaths per 1,000 live births which equates to an 18.9% decrease in the infant death rate.
Source: North Carolina Center of Health Statistics
The following map shows infant mortality rate by county for all 100 North Carolina counties in 2007-2011.
8.9 8.47.8
11.1 11.3
9.0
0
2
4
6
8
10
12
1997-2001 2002-2006 2007-2011NC Cumberland
Infant Deaths per 1,000

SECONDARY DATA: Mortality and Morbidity
28
Source: North Carolina Center of Health Statistics
Child Death Rates According to the State Center for Health Statistics, from 1997-2011, Cumberland County’s child death rates (ages 0-17) decreased 17.2%, a shown in the following chart.
Source: North Carolina Center of Health Statistics

SECONDARY DATA: Mortality and Morbidity
29
Cumberland County Leading Causes of Death Data regarding the leading causes of death in Cumberland County are provided in the following charts and graphs in the order of severity, and are trended over the past eight years. Information sources include is:
NC State Center for Health Statistics Behaviorial Risk Factor Surveillance System (“BRFSS”) NC Cancer Central Cancer Registry Other databases as noted.
Heart Disease Heart Disease is the leading cause of death (age-adjusted) in Cumberland County. The number of deaths from heart disease continues to be consistently higher than North Carolina. Over the past 10 years, Cumberland’s heart disease age-adjusted death rate decreased from 299.2 to 206.0, a 31% decrease. The heart disease age-adjusted death rate for the state also decreased 31% during that same timeframe.
Source: North Carolina Center of Health Statistics
261.4
216.5
179.3
299.2
262.3
206.0
0
50
100
150
200
250
300
350
1997-2001 2002-2006 2007-2011
NC Cumberland
Age-Adjusted Heart Disease Death

SECONDARY DATA: Mortality and Morbidity
30
Cancer Cancer is the 2nd leading cause of death (age-adjusted) in Cumberland County. The number of deaths from cancer continues to be higher than the North Carolina rate by 7.6%. Over the past 10 years, Cumberland’s rate has decreased from 218.5 to 193.4 or 11.5%. The state rate has also decreased 204.3 to 179.7 or 12%.
Source: North Carolina Center of Health Statistics
204.3193.6
179.7
218.5197.4 193.4
0
50
100
150
200
250
1997-2001 2002-2006 2007-2011
NC Cumberland
Age-Adjusted Total Cancer Death Rates per 100,000 Residents

SECONDARY DATA: Mortality and Morbidity
31
The number of deaths from Colon, Rectum, Anus Cancer is higher than the North Carolina average by 8.3%. Over the past 10 years, Cumberland’s death rate decreased from 19.0 to 16.8 or 11.6% and the North Carolina death rate decreased from 20.1 to 15.5 or 23%.
Source: North Carolina Center of Health Statistics
The number of deaths from Trachea, Bronchus, & Lung Cancer is consistently higher than the North Carolina average by 10%. Over the past 10 years, Cumberland’s death rate decreased from 70.4 to 60.0 or 14.8% and the North Carolina death rate decreased from 61.5 to 54.5 or 11.4%.
Source: North Carolina Center of Health Statistics
20.117.9
15.5
19.0 19.116.8
0
5
10
15
20
25
1997-2001 2002-2006 2007-2011
NC Cumberland
Age-Adjusted Colon, Rectum, Anus Cancer Death Rates per 100,000 Residents
61.5 58.854.5
70.4
60.4 60.0
0
10
20
30
40
50
60
70
80
1997-2001 2002-2006 2007-2011
NC Cumberland
Age-Adjusted Trachea, Bronchus, & Lung Cancer Death Rates per 100,000 Residents

SECONDARY DATA: Mortality and Morbidity
32
The incidence rate for Female Breast Cancer has been similar to the North Carolina average over the past 10 years. Early detection and testing has improved over the last decade which has increased awareness and incidence. Evidence indicates early detection increases survival and improves quality of life. Since 2010, Cumberland’s incidence rate has been higher than the North Carolina by 1.3%. Cumberland’s incidence rate increased since 2000 by 8.2% and the North Carolina average increased by 5.9%.
Source: North Carolina Center of Health Statistics
147.2
149.7
155.9
146
150
157.9
140142144146148150152154156158160
1996-2000 2001-2005 2006-2010
NC Cumberland
Age-Adjusted Female Breast Cancer Incidence Rates per 100,000 Residents

SECONDARY DATA: Mortality and Morbidity
33
The age-adjusted death rate for Prostate Cancer in Cumberland County was similar to the NC average in 2001, higher in 2006 and less than the North Carolina average in 2011. Early detection and testing has improved over the last decade which has increased awareness and incidence. Evidence indicates early detection increases survival and improves quality of life. In 2011, Cumberland’s death rate was lower than North Carolina by 13%. While Cumberland’s death rate has favorably decreased since 2001 by 13%, North Carolina average remains static with little improvement over the last 10 years.
Source: North Carolina Center of Health Statistics
The following table compares percent of cancer deaths for Cumberland County, North Carolina, and counties of similar size to Cumberland County in 2007.
Percent of Cancer Deaths North Carolina, Cumberland and Comparable Counties - 2007
Cumberland County North Carolina Guilford Pitt Wake
22.9% 23.0% 22.4% 21.2% 24.7% Source: North Carolina Center of Health Statistics; NC Central Cancer Registry Report for Cumberland County 2009 Cancer is the 2
nd leading cause of death in North Carolina and in the USA
Cumberland County’s percent of cancer deaths in 2007 was the third lowest among the counties included and slightly lower than North Carolina’s percentage, as shown in the previous table.
154.5162.1
153.7153.7
176.8
133.8
0
20
40
60
80
100
120
140
160
180
200
1997-2001 2002-2006 2007-2011
NC Cumberland
Age-Adjusted Prostate Cancer Death Rates per 100,000 Residents

SECONDARY DATA: Mortality and Morbidity
34
The following table compares projected cancer cases per 100,000 population by site for Cumberland County and North Carolina in 2009.
Projected Cancer Cases per 100,000 Population Cumberland and North Carolina - 2009
Site Cumberland County North Carolina
Lung/Bronchus 185 7,307
Colon/Rectum 120 4,672
Female Breast 216 7,781
Prostate 167 6,800
Pancreas 27 1,077
All Cancers 1,221 46,417 Source: North Carolina Center of Health Statistics; NC Central Cancer Registry Report for Cumberland County 2009
Cumberland County projected a higher total number of cancer cases in 2009 than the average number of cases among North Carolina’s 100 counties 464.17, as shown in the previous table.
The following table compares cancer case incidence rates per 100,000 population by site for Cumberland County and North Carolina.
2006-2010 Cancer Cases Incidence Rates per 100,000 Population Cumberland and North Carolina - 2009
County/ State
Colon/Rectum Lung/Bronchus Female Breast Prostate All Cancers
Cases Rate Cases Rate Cases Rate Cases Rate Cases Rate North Carolina 20,968 43.4 36,287 74.8 41,169 155.9 34,733 153.7 242,433 498.1
Cumberland County 541 43.0 984 78.7 1,127 157.9 747 133.8 6258 489.5
Source: North Carolina Center of Health Statistics; NC Central Cancer Registry Report for Cumberland County 2009
As shown in the previous table, Cumberland County projected a higher incidence rate of lung/bronchus and female breast cancers, and a lower overall incidence rate than North Carolina.

SECONDARY DATA: Mortality and Morbidity
35
The following table compares cancer case incidence rates per 100,000 population by site for Cumberland County, North Carolina, and other roughly comparably-sized counties in 2009.
2006-2010 Cancer Cases Incidence Rates per 100,000 Population By County for Selected Sites - 2009
County/ State
Colon/Rectum Lung/Bronchus Female Breast Prostate All Cancers
Cases Rate Cases Rate Cases Rate Cases Rate Cases Rate North
Carolina 20,968 43.4 36,287 74.8 41,169 155.9 34,733 153.7 242,433 498.1
Cumberland County 541 43.0 984 78.7 1,127 157.9 747 133.8 6,258 489.5
Durham County 443 38.9 747 69.0 1,066 161.6 841 166.9 5,674 489.9
Guilford County 1,037 42.6 1,792 7.9 2193 162.4 2,099 193.4 12,954 531.7
Pitt County 301 44.2 428 65.1 677 176.1 498 160.2 3,429 495.8
Wake County 1,296 38.0 1,883 59.5 3,353 163.8 2,838 178.8 17,216 485.9
Source: North Carolina Center of Health Statistics; NC Central Cancer Registry Report for Cumberland County 2009
As shown in the previous table, Cumberland County projected the lowest incidence rate for prostate cancer than all comparable counties and North Carolina. Cumberland County’s incidence rates for lung/bronchus cancers is the highest among all comparable counties and North Carolina. It projects the lowest overall rate for all cancers among all comparable counties and North Carolina.
The following table compares cancer case mortality rates per 100,000 population by site for Cumberland County, North Carolina, and other roughly comparably-sized counties in 2009.
2007-2011 Cancer Cases Mortality Rates per 100,000 Population By County for Selected Sites - 2009
County/ State
Colon/Rectum Lung/Bronchus Female Breast Prostate All Cancers
Cases Rate Cases Rate Cases Rate Cases Rate Cases Rate North
Carolina 7,523 15.3 27,087 54.6 6,358 22.8 4,385 24.4 88,518 179.9
Cumberland County 210 16.9 774 61.0 200 27.5 142 33.1 2,462 196.6
Durham County 162 14.2 536 49.0 170 25.1 125 31.5 2,074 183.2
Guilford County 341 13.8 1,233 49.8 304 21.3 226 25.0 4,141 167.1
Pitt County 107 15.6 320 47.1 105 25.9 79 34.9 1,252 180.9
Wake County 397 11.7 1,369 41.9 473 22.8 262 24.3 5,247 157.2
Source: North Carolina Center of Health Statistics; NC Central Cancer Registry Report for Cumberland County 2009

SECONDARY DATA: Mortality and Morbidity
36
As shown in the previous table, Cumberland County projected the highest mortality rates for colon/rectum, lung/bronchus, female breast, and all cancers than North Carolina and comparable counties.
Chronic Lower Respiratory Disease Chronic Lower Respiratory Disease is the 3rd leading cause of death (age-adjusted) in Cumberland County and North Carolina, respectively.
Source: North Carolina Center of Health Statistics
Death rates for Chronic Lower Respiratory Disease in Cumberland County and North Carolina are very similar at 51.8 and 46.6 deaths per 100,000 population, as shown in the previous map and on the following website: http://www.schs.state.nc.us/schs/deaths/lcd/2011/lowerresp.html
North Carolina Chronic Lower Respiratory Disease Mortality Rates
2006-2010
Ashe
Wa ta ug a
Alle gh an y
Wi lke s
Surry
Sto kes
Rock ing ha m
Casw el l
Perso n
Gra nvi lle
Va nce
Wa rren
North amp to n
Hal ifax
Hertford
Ga te s
Mad ison
Mitche ll
Ya nce y
Avery
Cal dw ell
Burke
Alex and er
Ya dkin Fo rsyth
Davi e
Ire de ll D avi dso n
Gu ilfo rd
Ora ng e
Alam anc e
Durh am
Wa ke
Fra nkl in
Nash
Edge com be
Bertie
Martin
Wa shin gton
Tyrre ll
Dare
Gra ha m
Swa in
Hayw oo d
Jackso n
Bunc omb e
Hen de rson
McDo we ll
Ruth erford
Polk
Cle vel an d
Cata wba
Lin col n
Ga ston
Row an
Cab arru s
Sta nl y
Ran do lph Moo re
Cha tham
Lee
Harn ett
John ston
Wi lso n
Wa yne
Gre en e
Pitt
Beau fort
Hyde
Che roke e Cla y
Maco n Tra nsyl vani a Mon tg ome ry Meckl enb urg
Cum berl an d
Len oi r
Jone s
Crav en Paml ico
Uni on Anso n Rich mon d
Scotla nd
Hoke Samp son Dup li n
On slo w
Carte ret
Age Adjusted Rates per 100,000 Population
27.7 - 38.2
38.3 - 46.7
46.8 - 55.3
55.4 - 76.4
Rob eso n Blad en
Col umb us
Brun swic k
Pend er
New
Han ove r
North Carolina Resident Data

SECONDARY DATA: Mortality and Morbidity
37
Cumberland County Ashtma related hospital discharges is 13% higher than the North Carolina average for children 14 years and younger. Cumberland County Ashtma related hospital discharges is 34.5% higher than North Carolina average for all patients of all ages. As shown in the chart below, Cumberland County Ashtma related admissions is alarmingly higher than other similar counties.
Cerebrovascular Disease
Cerebrovascular Disease (stroke) is the 4th leading cause of death (age-adjusted) in Cumberland County.
Source: North Carolina Center of Health Statistics
75.6
60.9
46.0
67.5
57.4
45.8
0
10
20
30
40
50
60
70
80
1997-2001 2002-2006 2007-2011
NC Cumberland
Age-Adjusted Stroke Death Rates per 100,000 Residents

SECONDARY DATA: Mortality and Morbidity
38
As shown in the previous chart, Cumberland County’s number of deaths from cerebrovascular disease has been lower than the North Carolina average. Over the past 10 years, Cumberland County’s rate decreased from 67.5 to 45.8 (or 32.2%). North Carolina also decreased from 75.6 to 46.0 (or 39.2%). Significant improvement has been made in preventing, diagnosing, and treating cerebrovascular disease.
Diabetes
Diabetes is the 5th leading cause of death (age-adjusted) in Cumberland County.
Source: North Carolina Center of Health Statistics
As shown in the previous chart, the number of deaths from diabetes in Cumberland County has been consistently higher than North Carolina by 47.3%. Over the past 10 years, Cumberland County’s’s rate decreased from 39.9 to 32.4 (or 18.8%). North Carolina’s deaths decreased from 26.7 to 22.0 (or 17.8%). While diabetes is reflected as the 5th leading cause for death, it is often a secondary and a complicating factor that co-exists with heart disease, renal disease, and obesity.
Other Unintentional Injuries
Other Unintentional Injuries is the 6th leading cause of death (age-adjusted) in Cumberland County.
26.7 26.822.0
39.942.3
32.4
0
10
20
30
40
50
1997-2001 2002-2006 2007-2011NC Cumberland
Age-Adjusted Diabetes Death

SECONDARY DATA: Mortality and Morbidity
39
Source: North Carolina Center of Health Statistics
As shown in the previous chart, the number of deaths from unintentional injuries in Cumberland Countyhas been lower than the North Carolina average. Over the past 10 years, Cumberland County’s rate increased from 19.5 to 26.1 (or 33.8%). North Carolina increased from 22.0 to 29.2 (or 32.7%.) Both Cumberland County and North Carolina experience significant increases in unintentional injury deaths.
Nephritis, Nephrotic Syndrome and Nephrosis
Nephritis, Nephrotic Syndrome and Nephrosis is the 7th leading cause of death (age-adjusted) in Cumberland County.
Source: North Carolina Center of Health Statistics
22.0
27.029.2
19.5
22.7
26.1
0.0
5.0
10.0
15.0
20.0
25.0
30.0
35.0
1997-2001 2002-2006 2007-2011
NC Cumberland
Age-Adjusted Unintential Injury Death Rates per 100,000 Residents(excludes Motor Vehicle Deaths)

SECONDARY DATA: Mortality and Morbidity
40
As shown in the previous map, the number of deaths from Nephritis, Nephrotic Syndrome, and Nephrosis is higher in Cumberland County than the North Carolina average. The 2007-2011 rate for Cumberland County is 25.7 compared to 18.6 for North Carolina. Cumberland County’s rate is 38% higher than North Carolina. This disease state is often a secondary and a complicating factor that co-exists with diabetes, heart disease, cancer and renal disease.
Alzheimer’s Disease
Alzheimer’s is the 8th leading cause of death (age-adjusted) in Cumberland County.
Source: North Carolina Center of Health Statistics
As shown in the previous map, Cumberland County’s deaths from Alzheimers is lower than the North Carolina average. The 2007-2011 rate for Cumberland County is 23 compared to 29 for North Carolina. The population in Cumberland County is younger (median age of 32) than North Carolina Alzheimer’s Disease affects an older population.
Septicemia
Septicemia is the 9th leading cause of death (age-adjusted) in Cumberland County.

SECONDARY DATA: Mortality and Morbidity
41
Source: North Carolina Center of Health Statistics
The number of deaths from Septicemia in Cumberland County is higher than the North Carolina average, as shown in the previous map. The 2007-2011 rate for Cumberland County is 17.3 compared to 13.6 for North Carolina, which is 27% higher than North Carolina’s rate.
Unintentional Motor Vehicle Injuries
Unintentional Motor Vehicle Injuries is the 10th leading cause of death (age-adjusted) in Cumberland County.
Source: North Carolina Center of Health Statistics
19.9 19.2
15.5
18.1
20.3
16.5
0.0
5.0
10.0
15.0
20.0
25.0
1997-2001 2002-2006 2007-2011
NC Cumberland
Age-Adjusted Unintential Motor Vehicle Injury Death Rates per 100,000 Residents

SECONDARY DATA: Mortality and Morbidity
42
The number of deaths from unintentional motor vehicle injuries has historically been lower than the North Carolina average, as shown in the previous chart. Over the past 10 years, Cumberland County’s rate decreased from 18.1 to 16.5 (or 8.8%). North Carolina’s rate also decreased from 19.9 to 15.5 (or 22.2%). Both Cumberland County and North Carolina experienced significant decreases in unintentional motor vehicle injury deaths.
Suicide
Suicide is a leading cause of death in Cumberland County but not amongst the top 10 when age-adjusted .
Source: North Carolina Center of Health Statistics
As shown in the previous chart, the number of deaths from suicide is 11.6% higher in Cumberland County than North Carolina. Over the past 10 years, Cumberland County’s rate increased from 10.7 to 13.52 (or 26.2%). North Carolina’s rate also increased from 11.4 to 12.1 (or 16.1%).
11.4 11.6 12.1
10.712
13.5
0
2
4
6
8
10
12
14
16
1997-2001 2002-2006 2007-2011
NC Cumberland
Age-Adjusted Suicide Rates per 100,000 Residents

SECONDARY DATA: Mortality and Morbidity
43
Homicide Homicide is a leading cause of death in Cumberland County but not amongst the top 10 when age-adjusted .
Source: North Carolina Center of Health Statistics As shown in the previous chart, Cumberland County’s number of deaths from homicide is 52.4% higher than North Carolina. Over the past 10 years, Cumberland County’s rate decreased from 11.2 to 9.6 (or 14.3%). North Carolina’s rate also decreased from 7.9 to 6.3 (or 20.3%).
7.97.2
6.3
11.2
9.4 9.6
0
2
4
6
8
10
12
1997-2001 2002-2006 2007-2011
NC Cumberland
Age-Adjusted Homicide Rates per 100,000 Residents

44
SECONDARY DATA: EMS Statistics Trauma Statistics Trauma Care Summary Cumberland County
The following table shows a comparison of trauma care data for Cumberland County from Cape Fear Valley Medical Center, and North Carolina, respectively.
Source: EMStoolkits.org
As shown in the previous table, a slightly higher percentage of trauma patients were transported by EMS for treatment in Cumberland County than in North Carolina. A higher percentage of patients in Cumberland County refused care than the North Carolina average.
Date Range: 5/1/2012 - 4/30/2013
Cape Fear Valley Medical Center
North
Carolina
Total Records Found for Date Range 63,381 1,639,028
Total Patient Records Usable for Toolkit 52,680 (83%) 1,449,358 (88%)
Injured Patients 9,595(18%) 172,777(12%)
Other Patients 241(<1%) 1,921(<1%)
Not Recorded 13(<1%) 1,494(<1%)
Total Patients 9,849 176,192
Disposition of Injured Patients
No Treatment Required 41(<1%) 7,653(4%)
Patient Refused Care 1,050(11%) 12,293(7%)
Treated and Released 613(6%) 13,897(8%)
Treated, Transferred Care 174(2%) 3,010(2%)
Treated, Transported by EMS 7,953(81%) 138,875(79%)
Treated, Transported by Law Enfo 13(<1%) 189(<1%)
Treated, Transported by Private 5(<1%) 275(<1%)

SECONDARY DATA: EMS Statistics
45
Trauma Injured Patients
The following chart shows trauma injured patients transported by Cumberland County EMS data during the date range May 1, 2012 through April 30, 2013.
The previous chart shows that approximately 98% of patients transported had a trauma injury.
CDC Injury Fatality Rates (1999-2006) Fatality Rates are defined as deaths per 100,000 population per year. Injuries shaded yellow in the following table indicate high injury rates in Cumberland County when compared to North Carolina and the United States.

SECONDARY DATA: EMS Statistics
46
Injury Type Cumberland County
Fatality Rate North Carolina
Fatality Rate US Fatality Rate
Cut/Pierce 2.0 1.4 1.1
Drowning 1.2 1.3 1.4
Fall 8.1 8.0 7.6
Fire/Flame 1.9 1.8 1.4
Firearm 7.6 6.3 2.9
Motor Vehicle Traffic 3.4 3.3 7.8
Natural/Environmental 0.3 0.6 0.7
Other Pedal Cyclist 0.1 0.1 0.1
Other Pedestrian 0.5 0.4 0.4
Other Transport 0.4 0.4 0.7
As shown in the previous table, Cumberland County has higher fatality rates for:
cut/pierce
fall,
fire/flame
firearm
motor vehicle than North Carolina and the United States, respectively.
EMS Cardiac Arrest Statistics The following chart illustrates the cardiac arrest death rates per 100,000 population during the period May 1, 2012 through April 30, 2013.
CDC Cardiovascular Disease Death Rates

SECONDARY DATA: EMS Statistics
47
The previous chart shows that Cumberland County has a far higher cardiac arrest death rate per 100,000 population than North Carolina and the United States, respectively.
Cardiac Arrest Incidence by Age The following chart shows cardiac arrest incidence by age of patients transported by Cumberland County EMS during the period May 1, 2012 through April 30, 2013.
The previous chart shows that patients ages 65+ account for approximately 46% of cardiac arrest patients transported by Cumberland County EMS.
EMS Acute Care Statistics Acute Cardiac Patients
The following chart shows acute cardiac patients transported by Cumberland County EMS during the period May 1, 2012 through April 30, 2013.

SECONDARY DATA: EMS Statistics
48
As shown in the previous chart, acute cardiac patients transported by Cumberland County EMS account for only 18% of total patients transported.
Acute Cardiac Patient’s Incidence by Age The following chart shows acute cardiac patients by age group transported by Cumberland County EMS during the period May 1, 2012 through April 30, 2013.
The previous chart shows that a majority of acute care cardiac patients transported by Cumberland County EMS were ages 65+ (47.69%).

49
SECONDARY DATA: Existing Healthcare Facilities and Resources The following section provides a description of the health care landscape in Cumberland County, including the available health care facilities and services, the need for additional health care facilities and services as identified by North Carolina, and the impact the military population has on the health care needs of the County.
Hospital Services
Cape Fear Valley Health System Cape Fear Valley Medical Center (CFVMC) is the flag-ship of Cape Fear Valley Health System (CFVHS). CFVHS operates a variety of health care facilities from its headquarters in Fayetteville, North Carolina including a tertiary acute care hospital, a long-term acute care hospital, a critical access hospital, an inpatient rehabilitation facility, county emergency medical services, an outpatient psychiatric facility, a detoxification facility, a wellness center, 14 primary care clinics, 16 specialty care clinics, 5 walk-in clinics, and Health Pavilion North, an outpatient complex. CFVHS, includes Hoke Healthcare, LLC in Hoke County and Bladen Healthcare, LLC d/b/a Bladen County Hospital (BCH) in Bladen County. CFVHS operates a tertiary health delivery system in eastern North Carolina with 830 inpatient beds (includes licensed and CON approved beds under development, including Hoke Community Medical Center with 41 CON beds and Cape Fear Valley North Hospital with 65 Certificate of Need approved beds, and serves a long-standing six-county primary and secondary service area. CFVHS draws from all areas within the 15-county Health Service Area V and provides a broad range of patient services. Hospital services began in 1956 under the name of Cumberland County Hospital Authority offering 200 acute care beds. Within 10 years of the 1956 original bed-opening, construction began on another 195 acute care beds and 100 bassinets, allowing CFVMC to claim ownership of the largest newborn-care facility in the state. In 1976 a 60-bed state-of-the-art rehabilitation facility opened for Cumberland and surrounding Counties. Eighteen additional rehabilitation beds were added in 1995. In 1999, Highsmith-Rainey Memorial Hospital (“HRMH”), licensed for 133 acute beds was acquired. To maximize utilization of all hospital acute care beds in Cumberland County, 67 acute care beds have been relocated from HRMH, now recognized as Highsmith-Rainey Specialty Hospital (HRSH) to CFVMC. HRSH is now a 66-bed long-term acute care (LTAC) facility currently operating at 90% occupancy.
Today, Cape Fear Valley Health System has 830 licensed and Certificate of Need approved beds, and provides a wide variety of health care services including:

SECONDARY DATA: Existing Healthcare Facilities and Resources
50
Cumberland County Cape Fear Valley Medical Center, Main Campus, Owen Drive
o 490 Acute Care Beds o 78 Rehabilitation Beds o 32 Behavioral Health Beds
Highsmith-Rainey Specialty Hospital, Robeson Street o 66 Long Term Acute Care Beds
Cape Fear Valley North o 65 Certificate of Need approved, not yet operational Acute Care Beds o Medical Office Building Express Care Medical and Radiation Oncology Primary Care and Pediatric Services Outpatient PT and OT Services
Primary Care, Neurosurgery and General Surgery Clinics Services provided include:
o Cancer Care o Heart and Vascular o Birth Center o Pediatrics o Neuroscience o Orthopedics o Weight Loss Surgery o Surgical Services o Acute and Chronic Medical Care o Geriatrics o Imaging / Diagnostics o Rehabilitation o Outpatient Services o Minority Health o Infectious Diseases o Nephrology o Physician Practices o Emergency Care o Other Services

SECONDARY DATA: Existing Healthcare Facilities and Resources
51
Bladen County (Secondary Market, South of Cumberland County) Bladen Healthcare, LLC, Bladen County
o 48 Acute Care Beds (operates 25 acute care beds as CAH, includes 10 swing beds)
o 10 Skilled Nursing Beds.
Hoke County (Secondary Market, West of Cumberland County) Hoke Community Medical Center, Hoke County
o 41 CON Approved, not operational Acute Care Beds Medical Office Building
o Primary Care Services o Obstetrical Services o Express Care o Imaging Services to include Mammography, Diagnostic X-Ray and
Ultrasound Primary Care Clinic – Raeford.
Military Hospitals
Womack Army Medical Center Located in Cumberland County, the Army Medical Center is committed to providing quality, cost-efficient care for "The Total Army Family." Womack Army Medical Center serves more than 160,000 eligible beneficiaries in the region, the largest beneficiary population in the Army. Services include Medical/Surgical Services, Obstetrics, Orthopedics, Optometry, Hematology-Oncology, Dental, Chiropractic, Behavioral Health, Primary Care, and Specialty Care Services.
Fayetteville Veterans Administration Medical Center The Fayetteville Veterans Administration Medical Center is a Clinical Core Level III facility with 90 general medical/surgical and mental health beds, and a 69-bed long-term care unit. The Fayetteville location is in an area populated by more than 155,000 veterans in 21 counties.
Other Provider Services Primary Care
Specialty Care
Outpatient Physical Medicine and Rehabilitation

SECONDARY DATA: Existing Healthcare Facilities and Resources
52
Outpatient Imaging and Diagnostics
Ophthalmology
Dentistry
Outpatient Behavioral Health
Allergy / Immunology
Dermatology
Nephrology
Urology
Plastic Surgery
Podiatry
Oncology
Rheumatology
Other Services
Relationships with Other Health Care Providers Relationships are developed and enhanced by frequent communications with local physicians and health care providers with regard to activities and programs of CFVHS. Quarterly newsletters are provided which introduce new physicians, services, programs, and/or achievements.
The blood service at CFVHS assists the local VA Medical Center and Womack Army Medical Center with blood needs as requested. Similar exchange arrangements exist with other surrounding facilities. CFVHS has supported the Hoke County Senior Services through active support of the Diabetes Health Fair. The Medical Oncology Department established relationships with Betsy Johnson Regional Hospital in Dunn, North Carolina over five years ago to help facilitate satellite services for Medical Oncology. Cardiologists from Fayetteville accept cardiac referrals from Clinton, North Carolina, on site and in collaboration with Sampson Regional Medical Center. Staff and physicians participate in working with The Care Clinic, Better Health of Cumberland County, and the Cumberland County Community Health Care Council. Over the last several years, communication with Womack Army Medical Center officials has been directed heavily toward the growing health needs for military dependents in the area. Discussions have indicated the need for the expansion of tertiary level services as BRAC moved forward, creating the need for expanded capacity at CFVMC. Structured and unstructured communication channels continue to exist to ensure that CFVHS and Womack are providing the needed services for military personnel and dependents. The Fort Bragg Regional Alliance Recruitment Project, which was formed to identify and target the recruitment of needed physician specialties

SECONDARY DATA: Existing Healthcare Facilities and Resources
53
and clinical personnel in the Fort Bragg service area, has included CFVHS in its planning efforts. Members of the CFVHS management team serve on boards of local health care providers to include The Care Clinic, Fayetteville Ambulatory Surgery Center, Southern Regional Area Health Education Center and Carolina Collaborative Community Care. In addition, CFVHS has an excellent working relationship with the Cumberland County Health Department, working together on local emergency medical planning as well as providing services to their patients. A few years ago, such collaboration with the Health Department and Care Clinic resulted in the provision of a medication assistance program (MAP) for eligible low-income patients in Cumberland County. The MAP has been a huge success and was awarded a subsequent grant to expand the services. Cape Fear Valley Health System’s Pharmacy oversees the staff operations of the program. A Senior Pharmacy Management section has also been added with the receipt of grant monies to provide medication assistance to the senior citizens of the community. CFVHS has a family practice clinic in Hoke County and through the CFV OB GYN practice, high risk and indigent prenatal care is provided for Hoke and Cumberland County in collaboration with the local health departments. CFV perinatology provides prenatal diagnostic and management consultation for patients in Cumberland and surrounding counties. Cardiology support has been provided to Sampson and Robeson counties over the past 4-6 years and Cardiology and Orthopedic care is now being provided in Bladen County. The System’s intentions and plans to establish various technologies, services and programs over the past few years have been shared with health care providers in Cumberland County and hospitals/medical centers in contiguous counties. In order to continue to serve the local providers and their patients, CFVHS, in recent years, expanded its affiliations with regional, tertiary providers. CFVHS partnered with the University of North Carolina Healthcare System to bring helicopter services to the CFVMC campus and to bring a diabetes specialist to Fayetteville. Collaboration with Duke University Health System was fruitful in providing a pediatric cardiologist for the community. CFVHS’s Pediatric Endocrinologist collaborates with both specialists as needed. In June 2008, CFVHS, through Bladen Healthcare, LLC, began operating Bladen County Hospital, which is licensed for 58 beds, but operates as a Critical Access Hospital utilizing only 25 beds. Since that time CFVHS has expanded both inpatient and outpatient services available to residents of Bladen County. The affiliation with CFVHS provided many opportunities for cost savings and operational efficiencies. On May 2, 2011, the Bladen County Commissioners adopted a resolution approving the sale of Bladen County Hospital’s assets to Cape Fear Valley Health System. On May 25, 2011, the Cape Fear Valley Health System Board of Trustees adopted a resolution ratifying

SECONDARY DATA: Existing Healthcare Facilities and Resources
54
the sale. On March 19, 2012, Cape Fear Valley finalized a transaction with Bladen County whereby Cape Fear Valley acquired all of the assets and operations of Bladen County Hospital, which it subsequently transferred to and operates through its wholly owned subsidiary, Bladen Healthcare, LLC.

55
HEALTH NEEDS, PRIORITIZATION PROCESS, AND RESULTS The final portion of the CHNA includes a summary of the priority health needs identified. Although a large number of potential needs have been discussed, it is simply not feasible for Cape Fear Valley Medical Center to apply significant resources to each and every area of need. To determine which needs are priorities, Cape Fear Valley Medical Center reviewed outcomes and findings from the CHAT Survey and utilized an objective approach to estimate which areas of need are of greatest concern. The process and associated results are as follows:
Prioritization Process Each section of the CHAT Survey has been incorporated not only to measure and estimate the level of health needs for Cumberland County residents, but also to highlight key factors and conditions expected to have the greatest impact on those needs going forward. Those sections included the following:
Existing Health care Facilities and Resources Demographics Socioeconomic Factors Access to Care Health Data/Indicators Health Utilization Interviews/Community Feedback.
Leveraging the analyses and findings from those sections and based upon our community survey and review of secondary data, Cape Fear Valley Medical Center has condensed its list to select areas which it believes to be the priorities for Cumberland County. The health issues in Cumberland County include:
Heart Disease Diabetes Stroke Obesity Chronic Respiratory Disease Fitness and Nutrition Teen Pregnancy HIV/STDs

HEALTH NEEDS, PRIORITIZATION PROCESS AND RESULTS
56
Results
At the conclusion of the prioritization process, Cape Fear Valley Medical Center identified seven health needs as the key areas for action. These areas of concern impact utilization at Cape Fear Valley Medical Center and to some extent Highsmith-Rainey Specialty Hospital. Both hospitals will work collaboratively on these health concerns. The seven priority health needs are:
Heart and Vascular Disease (1st leading cause of death) Cancer (2nd leading cause of death) Chronic Obstructive Pulmonary Disease (3rd leading cause of death) Stroke (4th leading cause of death) Diabetes (5th leading cause of death) Teen Pregnancy (Major concern per community survey and state) Obesity (Major health issue per community survey and state)

57
Appendix 1 PRIMARY DATA: Community Health Needs Assessment Survey Results - Feedback
A Community Health Needs Assessment (CHNA Survey) was administered in January and February 2013 in Cumberland County. The CHNA Survey provided the community with an opportunity to provide feedback regarding health care-related concerns in their community. CHNA Surveys were placed in physician offices and clinics, various locations at Cape Fear Valley Medical Center, the Cumberland County Health Department, other locations, advertised in the newspaper, and administered both in paper copy and on the web through a link utilizing Survey Monkey. The CHNA Survey was administered in both English and Spanish (see Appendix 2 and 3). The information included below provides descriptive information on all questions/variables used in the CHNA Survey questionnaire. The variables/questions were cross-tabulated against the demographic questions/variables namely gender, age, and race and indicates lack of variation. The results of the CHNA Survey are illustrated through the use of graphs in this Appendix.
Demographics 1,751 CHNA Surveys were returned: 1,444 (83%) were female respondents, 301 (17%) were male respondents, and 6 respondents did not identify their gender. As such, the total number of respondents does not match the total number of CHNA Surveys completed.
1,444
301
83%
17%
-
200
400
600
800
1,000
1,200
1,400
1,600
Female Male
GENDER

Appendix 1: PRIMARY DATA: Community Health Survey Results - Feedback
58
CHNA Surveys were completed by respondents of different ages. The majority of respondents were ages 45-54 (28%).
88
302
373
486
405
77 20
5.0%
17.2%
21.3%
27.8%
23.1%
4.4% 1.1%
0
100
200
300
400
500
600
Under 25 25-34 35-44 45-54 55-64 65-74 75+
AGE

Appendix 1: PRIMARY DATA: Community Health Survey Results - Feedback
59
CHNA Surveys were distributed by team members representing each community in the county, as well as the Fayetteville Observer, and a link to Survey Monkey for those persons preferring electronic participation. The following graph shows the race and ethnicity of respondents to the CHNA Survey:
58.2% of respondents identified as Caucasian
29.3% identified as African-American
6.2% identified as Other
3.8% identified as Hispanic
2.2% identified as Native American.
1,020
514
67
110
40
- 200 400 600 800 1,000 1,200
Caucasian
African-American
Hispanic
Other
Native American
Race

Appendix 1: PRIMARY DATA: Community Health Survey Results - Feedback
60
The following table shows a comparison of the race and ethnicity of respondents and the percentages reported by the US Census Bureau for Cumberland County.
Based upon the US Census Bureau, the racial makeup of Cumberland County is Caucasian 47.2%, African-American 35.7%, Native American 1.5%, Hispanic 9.5%, and other 6.1%. Survey respondents included the following: Caucasian 58.3%; African American 29.4%; Native American 2.3%; Hispanic 3.8%; and Other 6.2%. To ensure that a diverse group of citizens was reached, the CHAT distributed CHNA Surveys to a variety of organizations, agencies, and community clubs throughout the county, as well as through the Fayetteville Observer, and a link to Survey Monkey. CHNA Surveys were offered in both English and Spanish. A minimum target return rate of 500 respondents was set. A total of 1,751 surveys were returned; not all respondents answered all questions. Data collection and analysis was completed by the Work Group, which consisted of members from various communities, agencies and organizations. A summary report was prepared by Fayetteville State University.
58.3%
29.4%
3.8%
6.3%
2.3%
47.2%
35.7%
9.5%
6.1%
1.5%
Caucasian
African-American
Hispanic
Other
Native American
Race
US CensusSurvey

Appendix 1: PRIMARY DATA: Community Health Survey Results - Feedback
61
A majority of persons completing CHNA Surveys live in Cumberland County as shown in the following chart.
1,429
275
- 200 400 600 800 1,000 1,200 1,400 1,600
Cumberland
Other
Residency of Respondents

Appendix 1: PRIMARY DATA: Community Health Survey Results - Feedback
62
Education As shown in the following two charts, almost 98% of respondents received at least a High School Diploma. Respondents with less than a high school diploma accounted for only 2% of the total. Almost 66% of the respondents completed their Associate or Graduate Degrees.
10
27
141
422
344
480
327
0 100 200 300 400 500 600
No Response
11th Grade or less
High School
Some college, but no degree
Associate's Degree
Bachelor's Degree
Graduate Degree
The highest level of education completed
0.6%
1.5%
8.1%
24.1%
19.6%
27.4%
18.7%
0.0% 5.0% 10.0% 15.0% 20.0% 25.0% 30.0%
No Response
11th Grade or less
High School
Some college, but no degree
Associate's Degree
Bachelor's Degree
Graduate Degree
The highest level of education completed

Appendix 1: PRIMARY DATA: Community Health Survey Results - Feedback
63
For comparison purposes, the US Census Bureau reported that 11% of the county population, ages > 25 had dropped out of school compared to a rate of 15.8% for North Carolina. While the dropout rate for Cumberland County is lower than the rate for North Carolina, it is still considered too high.
Income As shown in the following two charts, a majority of respondents (75%) reported a household income last year of $30,000 or more. 18% of respondents reported an income less than $30,000.
42 74
202
413374
266 266
114
050
100150200250300350400450
Household Income last year

Appendix 1: PRIMARY DATA: Community Health Survey Results - Feedback
64
For comparison purposes, North Carolina Quick Facts from the US Census Bureau & countyhealthrankings.org reported persons below poverty level for 2007-11 were 16.1% in North Carolina and 16.7% in Cumberland County. Per capita money income in the past 12 months (2007-11), North Carolina reported $25,256 and Cumberland County reported $22,888. Median household income in the past 12 months (2007-2011), North Carolina reported $46,291 and Cumberland County reported $44,861. As shown in the following graph, 6.3% of respondents reported that he/she was unemployed, while 91% reported being employed.
2.4% 4.2%
11.5%
23.6%21.4%
15.2% 15.2%
6.5%
0.0%
5.0%
10.0%
15.0%
20.0%
25.0%
Household Income last year
1,589
111 51
EmployedUnemployedRetired
Employment Status

Appendix 1: PRIMARY DATA: Community Health Survey Results - Feedback
65
According to the Bureau of Labor Statistics, the unemployment rate for Cumberland County in April 2013 was 9.7% compared to the North Carolina rate of 8.9%.
The following graph illustrates the number of the population surveyed job fields. The respondents’ job fields consisted of the following:
42% Healthcare workers
24.8% Government workers
13.1% Education workers
10.5% Other
4.7% Business/Industry
2.1% Not employed
1.8% Students
1.0% Homemakers.
735
435
230
183
82
37
32
17
0 200 400 600 800
Healthcare
Government
Education
Other
Business/Indu…
Not Employed
Student
HomemakerJob Field

Appendix 1: PRIMARY DATA: Community Health Survey Results - Feedback
66
Health Care Related Questions The following chart shows health insurance status of respondents. Respondents reported that 6% do not have insurance, while 94% do have health insurance.
The following graph shows by percentage the type of insurance of the respondents:
80.3% have private insurance
14.3% Tricare
4.0% Medicare
1.4% Medicaid
94%
6%
Do you have health insurance?
Yes No
4.0% 1.4%
80.3%
14.3%
If Insured, Type of Insurance?
Medicare
Medicaid
Private Insurance
Tricare

Appendix 1: PRIMARY DATA: Community Health Survey Results - Feedback
67
For comparison purposes, discharged inpatients from Cape Fear Valley Medical Center in FY2012 consisted of:
79% government payors to include Medicare, Medicaid and Tricare
4% self-pay
17% commercial and other payors. The following chart shows that 6% of respondents had not seen a medical provider in the past year; 92% had seen a medical provider in the past year.
92%
6%
2%
Have you seen a medical provider in the past year?
YES
No
Not answered

Appendix 1: PRIMARY DATA: Community Health Survey Results - Feedback
68
The following chart shows that 19% of respondents are single parents; 79% are not single parents.
The following chart shows the percentage of respondents who have children under 18 in their households. A majority of respondents do not have children under 18 living in their households.
Of those surveyed, 59.8% have one or more children in their households.
19%
79%
2%
Are you a single parent?
Yes
No
missing
59.8%
20.1%
13.6%
5.0%
1.5%
0.0% 10.0% 20.0% 30.0% 40.0% 50.0% 60.0% 70.0%
None
One
Two
Three or more
Missing Info
Number of children under 18 in your household?

Appendix 1: PRIMARY DATA: Community Health Survey Results - Feedback
69
The following chart shows the number respondents whose children are up to date on immunizations.
Of the respondents who have children in their household, 96.9% have up to date immunizations. The following chart shows less than 0.5% of respondents were homeless.
8
1,703
Are You Homeless?YES
NO
648
21
1,074
Child immunizations up to date?
Yes
No
N/A

Appendix 1: PRIMARY DATA: Community Health Survey Results - Feedback
70
The following chart shows the percentage of respondents by type of water in their homes.
Of the respondents, 84.7% had town/county water at home; 13.3% had well water. In 2006, the North Carolina General Assembly passed Session Law 2006-202, which requires local health departments to initiate programs for permitting, inspection and testing of private drinking water wells which are constructed, repaired or abandoned, on or after July 1, 2008. As a result, county health departments enforce state statutes and rules, and receive technical and legal assistance from the Environmental Health Section of the Division of Public Health, North Carolina Department of Health and Human Services. The types of wells covered by the program include (1) private wells that serve a single residence and (2) transient non-community water supply wells that do not meet the definition of “public water supply” in 15A NCAC 18C (i.e. restaurants, churches, and medical facilities). Program implementation date for all 100 counties was July 1, 2008.
1,450
262
What type of Water in the Home
Town/County Water
Well Water

Appendix 1: PRIMARY DATA: Community Health Survey Results - Feedback
71
The following chart shows the percentage of respondents who smoke or use tobacco products.
A majority of respondents reported that they do not smoke or use tobacco products; 13% smoked or used tobacco products. The following chart shows the percentage of respondents who smoke or use tobacco products or live with individuals who smoke or use tobacco products.
13%
85%
2%
Do you smoke or use tobacco products?
YES
NO
Missing Info
24%
76%
Do you or anyone in your home smoke or use tobacco products?
YES
NO

Appendix 1: PRIMARY DATA: Community Health Survey Results - Feedback
72
A majority of respondents reported that they do not smoke or use tobacco products or live with a person who smokes or uses tobacco products; 24% smoked or used tobacco products or lived in a household with a smoker or tobacco product user. The following chart shows the number of respondents who drive.
Among those surveyed, 97% drive. The following chart shows the number of respondents who have their own transportation.
Among those surveyed, 97% have their own transportation.
1,679
37
Do you drive?
Yes
No
1,657
49
Do you have your own transportation?
Yes
No

Appendix 1: PRIMARY DATA: Community Health Survey Results - Feedback
73
The following chart shows the number of respondents who have a primary care physician. Among those surveyed, 87% have a primary care physician
The following chart shows that 87% of respondents were seen by their primary care physicians within the last year.
1,485
222
Do you have a primary physician?
Yes
No
1,485
222
If yes, have you been seen by your primary care physician within the last year?
Yes
No

Appendix 1: PRIMARY DATA: Community Health Survey Results - Feedback
74
The following chart shows the number of respondents who have been treated in a hospital emergency room in the past year.
Of those surveyed, 17% were treated in a Hospital Emergency Room in the past year. The following graph illustrates the five leading causes of death in their community based upon the population surveyed:
1. Heart Disease/Stroke 2. Cancer 3. Various 4. Violence 5. Diabetes
285
1,360
Have you been treated in the Hospital Emergency Room in the past year?
Yes
No

Appendix 1: PRIMARY DATA: Community Health Survey Results - Feedback
75
The causes of death identified by the survey respondents are consistent with the leading causes of death identified by the Division of Health and Human Serves (DHHS), North Carolina Center for Health Statistics (NCCHS). The population surveyed is reasonably knowledgeable about their community and its health problems. The following graph and chart illustrate the number and the percentage of the respondents who identified the leading health issues in their community. The top three issues according to the community’s perception are:
1. Obesity 2. High Blood Pressure 3. Various/ Other etc.
Obesity, lack of exercise, poor eating habits, and high blood pressure increase the risk of cancer and heart disease.
100
175
207
280
989
0 200 400 600 800 1000 1200
Diabetes
Violence
Various
Cancer
Heart Disease/Stroke
In your opinion, what do most people die from in your community?

Appendix 1: PRIMARY DATA: Community Health Survey Results - Feedback
76
While similar, it is important to note that there are some inconsistencies between the respondents’ identified causes of death and the identified health related issues. The following charts illustrate the number and percentage of the population surveyed and identified the main reasons that people in their community do not seek medical treatment. As shown the top four reasons for not seeking medical care are:
1. Wait times 2. Unable to pay for medical costs 3. Fear/not ready to face health problems 4. Inconvenient locations
17
16
13
52
55
96
115
123
124
134
146
166
182
223
289
0 100 200 300 400
HIV/AIDS/STD
Dental Health
Vehicle Crashes
Teen Pregnancy
Stroke
Drug/Alcohol …
Poor eating habits
Cancer
Diabetes
Crime
Lack of Exercise
Mental Health
Other
High Blood …
Obesity
In your opinion, what are the the three top health issues in your community?

Appendix 1: PRIMARY DATA: Community Health Survey Results - Feedback
77
Rank Health Issue Percent
1 Obesity 16.5%
2 High Blood Pressure 12.7%
3 Other 10.4%
4 Mental Health 9.5%
5 Lack of Exercise 8.3%
6 Crime 7.7%
7 Diabetes 7.1%
8 Cancer 7.0%
9 Poor eating habits 6.6%
10 Drug/Alcohol Abuse 5.5%
11 Stroke 3.1%
12 Teen Pregnancy 3.0%
13 Vehicle Crashes 0.7%
14 Dental Health 0.9%
15 HIV/AIDS/STD 1.0%
100.0%
Community Ranking of Health Issues
TOTAL

Appendix 1: PRIMARY DATA: Community Health Survey Results - Feedback
78
13
18
28
37
66
114
485
539
0 100 200 300 400 500 600
Transportation
Confidential Concerns
Dislike Provider
Unfriendly Staff
Inconvenient locations
Fear/not ready to face health problems
Unable to pay for medical services/medicine
Wait Times
What factors keep you or your family from seeking medical treatment?
1%
1%
2%
3%
5%
9%
37%
41%
0% 5% 10% 15% 20% 25% 30% 35% 40% 45%
Transportation
Confidential Concerns
Dislike Provider
Unfriendly Staff
Inconvenient locations
Fear/not ready to face health problems
Unable to pay for medical services/medicine
Wait Times
What factors keep you or your family from seeking medical treatment?

Appendix 1: PRIMARY DATA: Community Health Survey Results - Feedback
79
Responses will help to assist the CHAT in its efforts to increase the community’s access to health care. The following graph identifies the goods and services for which respondents believe that community members do not have funds to access. As shown the top two are:
1. Health Insurance 2. Medicine
Food, utilities, and transportation are very closely ranked with little variation among them. The following graph shows the resources identified by respondents as needed to improve the health of their community. As shown the top five resources needed are:
1. More Access to After-Hour Health Facilities 2. Healthier Food Choices 3. Wellness Screens 4. Sports Programs for All Ages 5. Smoke Free Places.
86
92
111
408
893
0 100 200 300 400 500 600 700 800 900 1000
Transportation
Utilities
Food
Medicine
Health Insurance
In your community, which do people lack the funds

Appendix 1: PRIMARY DATA: Community Health Survey Results - Feedback
80
A third of respondents identified after-hour health facilities as the most likely to improve the health of the Cumberland County community.
49
121
172
306
418
532
0 100 200 300 400 500 600
Smoke Free Places
None
Sports Programs for All Ages
Wellness Screens
Healthier Food Choices
More After-hour Health Facilities
What would you like to see in your community to improve the health of its citizens?

Appendix 1: PRIMARY DATA: Community Health Survey Results - Feedback
81
The following charts show the types of health problems in families of respondents. The top seven health problems identified are:
1. High Blood Pressure – 31.5% 2. Weight Problems – 23.9% 3. Diabetes – 17.5% 4. Heart Disease – 9.8% 5. Asthma – 9.6% 6. Cancer – 7.3%.
13
226
297
303
538
736
970
0 200 400 600 800 1000 1200
HIV/AIDS
Cancer
Asthma
Heart Disease
Diabetes
Weight Problems
High Blood Pressure
Do you or anyone in your family have the following health problems?

Appendix 1: PRIMARY DATA: Community Health Survey Results - Feedback
82
Asthma was identified by more respondents than cancer and HIV/AIDS combined. In 2011, Cumberland County’s rate for all asthma patients was 137.6 cases per 100,000 population compared to the North Carolina rate of 102.3 cases per 100,000 population. In 2011, the rate for patients 14 years and younger was 177.8 for Cumberland County and 157.3 for North Carolina. The following graph shows the services that respondents reported that they and their families lacked in the community.
0.4%
7.3%
9.6%
9.8%
17.5%
23.9%
31.5%
0.0% 5.0% 10.0% 15.0% 20.0% 25.0% 30.0% 35.0%
HIV/AIDS
Cancer
Asthma
Heart Disease
Diabetes
Weight Problems
High Blood Pressure
Do you or anyone in your family have the following health problems?
1
4
25
54
93
1,407
0 200 400 600 800 1000 1200 1400 1600
Running Water
Indoor Plumbing
Electricity/fuel
Transportation
Medicine
None
Does your family lack any of the following services?

Appendix 1: PRIMARY DATA: Community Health Survey Results - Feedback
83
A majority (89%) of those surveyed reported that they did not lack any of the services. The top services that those surveyed reported needing in their community were Medicine 93 (6%) and Transportation 54 (3%).
As shown in the previous chart, of those surveyed, the top seven reported health programs that they would like to see in their community are:
1) Physical activity programs 2) Nutrition 3) Alcohol/drug abuse programs 4) Women’s Health 5) Parenting 6) Teen Pregnancy Prevention 7) Literacy education.
The following graph illustrates the number of the population surveyed who identified that they are having problems finding services or information about services in Cumberland County.
11
50
60
67
90
131
153
157
209
229
423
0 50 100 150 200 250 300 350 400 450
Child Safety Seat Use
Self Esteem
Men's Health
Quit Smoking
Literacy Education
Teen Pregnancy Prevention
Parenting
Women's Health
Alcohol/drug abuse
Nutrition
Physical Activity
What health programs would you like to be available in your community?

Appendix 1: PRIMARY DATA: Community Health Survey Results - Feedback
84
The top five health care services that respondents identified as having problems finding or having information about using are:
1. Nutrition 2. Mental health care 3. After hours urgent care 4. Dental care 5. Help with utilities.
3
3
7
9
12
13
18
23
30
35
36
37
41
42
44
50
61
63
64
72
102
180
215
223
0 50 100 150 200 250
Care for Pregnant Women
Pharmacy Drug
Immunizations
911 EMS
Hospice
Hospital
Home Health
Emergency Care
Transportation
Child Day Care
Food Assistance
Adult Day Care
Social Services
After School Care
Enrolling in Mcare/Mcaid
Long term care
Housing Assistance
Drug & Alcohol treatment
Public Health
Help with Utilities
Dental Care
After Hours Urgent Care
Mental health care
Nutition
Which health services do you have problems finding or having information
about using?

Appendix 1: PRIMARY DATA: Community Health Survey Results - Feedback
85
The following graph shows the number of respondents who received a flu shot last year.
A majority of respondents (63.2%) reported that they had received a flu shot in the past year. The following graph shows respondents’ satisfaction with the health care services in Cumberland County.
1,032
602
Did you receive a flu shot in the past year?
Yes
No
295
1,054
183
101
Are you satisfied with the health care services in your community?
Very
Somewhat
Not at All
No Opinion

Appendix 1: PRIMARY DATA: Community Health Survey Results - Feedback
86
A majority of respondents are very or somewhat satisfied (82.6%) with the health care services in their community. The following graph documents the problems that exist in the Cumberland County community identified by CHNA Survey respondents. The top three problems are:
1. Crime 2. Employment Opportunities 3. Traffic Safety.
According the North Carolina Employment Security Commission, the unemployment rate in Cumberland County for April 2013 was 9.7%, which indicates a lack of jobs available to residents. The following graph shows the places to which respondents go for health care when he/she is sick.
7
7
15
23
26
35
50
85
97
115
541
559
0 100 200 300 400 500 600
Solid Waste Disposal
Air Quality
Animal Control
Water Supply & Quality
ED Prepardness
Racial / Ethinic Discrimination
Public Transportation
Recreational programs & facilities
Affordable Housing
Traffic Safety
Employment Opportunities
Crime
In your opinion, does your community have problems with any of the following?

Appendix 1: PRIMARY DATA: Community Health Survey Results - Feedback
87
The vast majority of respondents (80%) responded that he/she goes to a doctor’s office for routine health care. The following graph shows by percentage major problems impacting health in Cumberland County identified by respondents.
4
17
26
29
40
49
156
1,304
- 200 400 600 800 1,000 1,200 1,400
Chiropractor
Free Clinic
Health Dept
Other
Hospital ED
I don't seek health care
Urgent Care
Doctor's Office
Where do you go for Routine Healthcare when you sick?
461
358
354
315
268
189
159
143
96
52
43
22
- 50 100 150 200 250 300 350 400 450 500
Alcohol Drug / Abuse
Poor eating habits
Homelessness
Violent Behavior
Juvenile Delinquency
Access to and use of weapons
Smoking / Tobacco Use
Teen Pregnancy
Child Abuse
Suicide
Not use seatbelts
Work Safety
In your opinion, which issue is a major problem in Cumberland County

Appendix 1: PRIMARY DATA: Community Health Survey Results - Feedback
88
Alcohol/drug abuse was identified as the major problem in Cumberland County. Respondents identified poor eating habits and homelessness as the second and third major problems in Cumberland County. The following chart shows by percentage the opinion of Cumberland County as a place to live. 59.4% of respondents said Cumberland County is good or excellent place to live.
7.4%
52.0%
29.3%
4.7%
0.0% 10.0% 20.0% 30.0% 40.0% 50.0% 60.0%
Excellent
Good
Fair
Poor
In your opinion, what kind of a place is Cumberland County to live?

89
Appendix 2: Community Health Needs Assessment Survey - English The following pages include a complete copy of the Community Health Needs Assessment
Survey in English.

Appendix 2: Community Health Needs Assessment Survey - English
90

Appendix 2: Community Health Needs Assessment Survey - English
91

Appendix 2: Community Health Needs Assessment Survey - English
92

93
Appendix 3: Community Health Needs Assessment Survey - Spanish The following pages include a complete copy of the Community Health Needs Assessment
Survey in Spanish.

Appendix 3: Community Health Needs Assessment Survey - Spanish
94

Appendix 3: Community Health Needs Assessment Survey - Spanish
95

Appendix 3: Community Health Needs Assessment Survey - Spanish
96

97
Appendix 4: Letter from CFVHS and Cumberland County
The following page includes a letter from Buck Wilson, Cumberland County Health
Director and Michael Nagowski, President of Cape Fear Valley Health System to the
Community Health Needs Assessment Partners.

Appendix 4: Letter from CFVHS and Cumberland County
98

99
Appendix 5: Partner Collaborative Meeting October 2012 The following pages include discussion points provided at the Partner Collaborative Meeting in October 2012.

Appendix 5: Partner Collaborative Meeting October 2012
100

Appendix 5: Partner Collaborative Meeting October 2012
101

Appendix 5: Partner Collaborative Meeting October 2012
102

Appendix 5: Partner Collaborative Meeting October 2012
103

Appendix 5: Partner Collaborative Meeting October 2012
104

105
Appendix 6: Cape Fear Valley Community Outreach Programs The following list itemizes the number and type of Community Outreach Programs provided by Cape Fear Valley Health System.
Date Activity Name County Purpose # Served
4/6/2010 Take A Loved One To the Doctor Day Hoke Blood Pressure, Blood Sugar & Cholesterol screening 100
8/10/2010 Umoja Festival Cumberland Blood Pressure, Blood Sugar & Cholesterol Screening 100
9/18/2010 Turkey Festival Hoke Blood Pressure & Blood Sugar screening 262
10/23/2010 Linden Harvest Health Festival Cumberland
Cholesterol, Blood Sugar, Lung Function screenings; brown bag pharmacy consults 70
4/15/2011 Forget Me Not Project Health Fair Cumberland EKG, Blood Pressures 300
4/30/2011 Dogwood Festival Cumberland Blood Pressures 264
6/8/2011 Prestage Foods Health Fair Robeson Cholesterol, Blood Sugar 200
6/11/2011 Cliffdale Recreation Center Community Day Cumberland Heart Attack info 150
9/17/2011 Raeford Turkey Festival Hoke Heart Attack info, Blood Pressure 300
10/8/2011 Flat Branch Fire Department Anniversary Celebration Harnett Heart Attack info 75
10/15/2011 Linden Volunteer Fire Department Fall Festival & Health Fair Cumberland
Heart Attack info, Blood Pressures, Blood Sugar, Cholesterol 150
1/17/2012 MLK Parade Bladen Community Awareness/PR 500
1/27/2012 BCH Blood Drive Bladen Community Awareness/PR 30
2/3/2012 Job Shadowing Day Bladen Community Awareness/PR 25
2/22/2012 Cape Fear Farm Heritage Day Columbus Community Awareness/PR 100
2/23/2012 Heart Failure Community Education Event Cumberland Heart Failure Awareness 30
3/3/2012 Read Across America Day Bladen Public Relations 32
3/9/2012 Career & Technical Awareness Day Bladen Community Awareness/PR 600
3/10/2012 Community Disaster Drill Bladen Community Awareness/PR 100
3/14/2012 Community Alternatives Program Cumberland Heart Failure Education 12
3/17/2012 Career Day Booker T. Washington Bladen Community Awareness/PR 250
3/21/2012 Bethesda Skilled Nursing Facility Cumberland Heart Failure Education 9
3/23/2012 Cumberland County Coordinating Council on Older Adults Cumberland Heart Failure Education 16
3/24/2012 Bladen County Special Olympics Bladen Community Awareness/PR 300
4/4/2012 Quarterly Skilled Nursing Facility Meeting Cumberland Heart Failure Education 11
4/6/2012 BCH Blood Drive Bladen Community Awareness/PR 26
4/7/2012 Family Fun Day: Hoke Masonic Lodge Hoke Awareness/Education 80
4/8/2012 Spring & Grow Expo Bladen Community Awareness/PR 500
4/14/2012 Community Event: Abundant Life Ministries Cumberland Blood Pressure & Education 50
4/14/2012 Zumbathon: Fuller Recreation Center Cumberland Awareness & Education 55
4/17/2012 Haymount Skilled Nursing & Rehab Cumberland Heart Failure Education 11
4/21/2012 Mens Health Conference: Spring Lake Cumberland Blood Pressure, Blood Sugar & Cholesterol screening 102
4/22/2012 Spring Fest Camp Clearwater Bladen Community Awareness/PR 500
4/22/2012 Boost the Boro Fundraiser Bladen Public Relations 125
4/25/2012 Bladen Comm.College Job Fair Bladen Community Awareness/PR 100

Appendix 6: Cape Fear Valley Community Outreach Programs
106
Date Activity Name County Purpose # Served
4/27/2012 Bladen We Care Golf Tourn Bladen Public Relations 75
4/28/2012 Health Fair: Eastover/Mt. Zion AME Cumberland Blood Pressure, Blood Sugar & Cholesterol screening 30
5/3/2012 Eaton Corporation Cumberland Blood Drive 45
5/4/2012 Pine Forrest High School Cumberland Blood Drive 61
5/5/2012 Dragon's Lair Cumberland Blood Drive 14
5/5/2012 Duck Derby Cumberland Awareness and Education: Blood Donor Center uknown
5/5/2012 Bladen County Relay for Life Bladen Community Awareness/PR 1000
5/5/2012 Bladenboro Rotary Golf Tourn Bladen/Columbus Public Relations 60
5/8/2012 Douglas Bryd High School Cumberland Blood Drive 80
5/9/2012 Fayetteville Academy Cumberland Blood Drive 11
5/10/2012 E.E. Smith High School Cumberland Blood Drive 72
5/11/2012 Gray's Creek High School Cumberland Blood Drive 82
5/12/2012 Asthma Action Fair Cumberland Lung Function Screenings, Awareness & Education 173
5/12/2012 Altman Grocery Barn and Grill Sampson Blood Drive 17
5/15/2012 Cape Fear Valley Medical Center Cumberland Blood Drive 39
5/16/2012 Dupont Cumberland Blood Drive 18
5/17/2012 Beaver Dam Volunteer Fire Department Cumberland Blood Drive 46
5/18/2012 Seventy-First High School Cumberland Blood Drive 65
5/19/2012 Pint-for Pint Blood Donor Center Cumberland Blood Drive/Event 52
5/20/2012 White Lake Water Festival Parade Bladen Community Awareness/PR 1000
5/22/2012 Highsmith-Rainey Specialty Hospital Cumberland Blood Drive 18
5/22/2012 Arthritis of the Hip & Knee Cumberland Orthopedic Awareness 34
5/23/2012 Health Pavilion North Cumberland Blood Drive 10
5/24/2012 Headquarters Library Cumberland Blood Drive 18
5/24/2012 Cumberland County Government Cumberland Blood Drive 26
5/26/2012 Health Fair: Hope Christian Church Cumberland Awareness & Education unknown
5/26/2012 Zion Hill Baptist Church Robeson Blood Drive 35
5/28/2012 Shoulder Pain Cumberland Orthopedic Awareness 28
5/30/2012 Miller-Motte College Cumberland Blood Drive 28
6/1/2012 Don Steed Elementary Hoke Blood Drive 14
6/2/2012 NICU Reunion Cumberland Reunion & Blood Drive 400
6/2/2012 Speaker/Health Fair Cumberland Awareness & Education unknown
6/2/2012 Swampdogs: EMS Night Cumberland EMS and Blood Donation Awareness and Education uknown
6/3/2012 Cancer Center National Survivor Day Picnic Cumberland
Prevention, Self-care and Community Resources 400
6/4/2012 Unilever Hoke Blood Drive 24
6/5/2012 PWC Cumberland Blood Drive 17
6/7/2012 New Light Church Bladen Public Relations 100
6/8/2012 Hendrick Chrysler Jeep Cumberland Blood Drive 19
6/8/2012 Hutchens, Senter, Kellam & Pettit Cumberland Blood Drive 19
6/9/2012 Health Fair: Fuller Recreation Center Cumberland Awareness & Education unknown
6/9/2012 Manna Church Cumberland Blood Drive 15
6/9/2012 Carmike Westwood Cumberland Blood Drive 13
6/12/2012 Home Care Provided Agency Meeting Cumberland Heart Failure Education 25
6/12/2012 FTCC Cumberland Blood Drive 45
6/13/2012 Piedmont Natural Gas Cumberland Blood Drive 29
6/14/2012 CC Department of Social Services Cumberland Blood Drive 15

Appendix 6: Cape Fear Valley Community Outreach Programs
107
Date Activity Name County Purpose # Served
6/14/2012 CC Health Department Cumberland Blood Drive 21
6/14/2012 Mended Hearts Cumberland Support for Cardiac Patients 7
6/14/2012 Galeed Baptish Church Bladen Public Relations 100
6/15/2012 Wal-Mart Cumberland Blood Drive 35
6/16/2012 Asthma Day Camp Cumberland Education & Physical Activities for Children with Asthma 136
6/19/2012 SR-AHEC Cumberland Blood Drive 12
6/19/2012 LaFayette Ford Cumberland Blood Drive 7
6/20/2012 Health Fair: Prestage Farms Robeson Awareness & Education 200
6/20/2012 DMV Call Center Bladen Blood Drive 18
6/20/2012 Bladen County Hospital Bladen Blood Drive 25
6/20/2012 Chamber of Commerce Banquet Bladen Public Relations 150
6/21/2012 Bryan Honda Pontiac Cadillac Cumberland Blood Drive 5
6/21/2012 City Hall Cumberland Blood Drive 25
6/21/2012 BCH Blood Drive Bladen Community Awareness/PR 35
6/22/2012 Plainview Volunteer Fire Department Sampson Blood Drive 3
6/23/2012 Speaker/Health Fair: Cedar Creek Cumberland Blood Pressure, Blood Sugar & Cholesterol screening 20
6/23/2012 US Cellular Bladen Blood Drive 13
6/23/2012 DYB Coach Pitch State Tourn Bladen/Columbus Community Awareness/PR 375
6/24/2012 US Cellular Customer App.Day Bladen Community Awareness/PR 75
6/26/2012 Pastor's Coalition Cumberland Heart Failure Education 40
6/26/2012 Golden Years Skilled Nursing Facility Cumberland Heart Failure Education 15
6/26/2012 Valley Auto World Cumberland Blood Drive 11
6/26/2012 Chick-fil-A (Skibo Road) Cumberland Blood Drive 20
6/27/2012 FTCC (Spring Lake) Cumberland Blood Drive 31
6/27/2012 Farm Bureau Healthy Living Day Bladen Community Awareness/PR 250
6/28/2012 Arthritis of the Hip & Knee Cumberland Orthopedic Awareness 31
6/28/2012 Pre-Fourth/ On the Border Cumberland Blood Drive/Event 109
7/2/2012 Cross Creek Subaru Cumberland Blood Drive 5
7/2/2012 Rick Hendrick Toyota Cumberland Blood Drive 11
7/3/2012 Fayetteville Association of Realtors Cumberland Blood Drive 11
7/6/2012 Wal-Mart Hoke Blood Drive 12
7/10/2012 Bladen County Hospital Bladen Blood Drive 11
7/11/2012 Ed V. Baldwin Elementary Cumberland Blood Drive 3
7/12/2012 Cape Fear Valley Health Cumberland Blood Drive 25
7/12/2012 Mended Hearts Cumberland Support for Cardiac Patients 7
7/12/2012 Pacemaker Support Group Cumberland Support 31
7/13/2012 Highsmith-Rainey Specialty Hospital Cumberland Blood Drive 7
7/13/2012 Wal-Mart (Hope Mills) Cumberland Blood Drive 12
7/14/2012 Altman Grocery Barn and Grill Sampson Blood Drive 16
7/17/2012 Systel Cumberland Blood Drive 10
7/18/2012 Raeford Fire Department Hoke Blood Drive 3
7/20/2012 Methodist University PA Program Cumberland Blood Drive 27
7/21/2012 Christmas in July/ Buffalo Wild Wings Cumberland Blood Drive/Event 49
7/24/2012 Danaher Controls Bladen Blood Drive 20
7/25/2012 Health Pavilion North Cumberland Blood Drive 17
7/25/2012 Cancer Center Open House Cumberland Awareness, Cyberknife 75
7/26/2012 Town of Spring Lake Cumberland Blood Drive 8
7/26/2012 Arthritis of the Hip & Knee Cumberland Orthopedic Awareness 37
7/27/2012 Highland Centre Cumberland Blood Drive 5

Appendix 6: Cape Fear Valley Community Outreach Programs
108
Date Activity Name County Purpose # Served
7/28/2012 Elite Zone Cumberland Blood Drive 27
7/28/2012 AME Zion Cumberland Blood Drive 19
7/31/2012 Falcons Children Home Sampson Blood Drive 28
8/1/2012 Woodlands Skilled Nursing Facility Cumberland Heart Failure Education 8
8/2/2012 Boots vs Badges Cumberland Blood Drive/Event 29
8/3/2012 Highland House Skilled Nursing Facility Cumberland Heart Failure Education 21
8/3/2012 Logan's Roadhouse Cumberland Blood Drive 19
8/4/2012 Digging for Diamonds Cumberland Blood Drive/Event 57
8/8/2012 Eaton Corporation Cumberland Blood Drive 68
8/9/2012 Woodlands Skilled Nursing Facility Cumberland Heart Failure Education 11
8/9/2012 Hendrick Chrysler Jeep Cumberland Blood Drive 13
8/9/2012 Mended Hearts Cumberland Support for Cardiac Patients 7
8/13/2012 Unilever Hoke Blood Drive 21
8/14/2012 SR-AHEC Cumberland Blood Drive 10
8/14/2012 PWC Cumberland Blood Drive 14
8/14/2012 LaFayette Ford Cumberland Blood Drive 13
8/15/2012 Piedmont Natural Gas Cumberland Blood Drive 33
8/16/2012 Hutchens, Senter, Kellam & Pettit Cumberland Blood Drive 23
8/17/2012 Hoke County High School Hoke Blood Drive 100
8/18/2012 Umoja Festival Cumberland
Blood Pressure, Blood Sugar & Cholesterol screening, Blood Typing, awareness and education uknown
8/21/2012 Cumberland Skilled Nursing Facility Cumberland Heart Failure Education 11
8/21/2012 Headquarters Library Cumberland Blood Drive 21
8/21/2012 Cumberland County Government Cumberland Blood Drive 31
8/22/2012 Dupont Cumberland Blood Drive 16
8/23/2012 Arthritis of the Hip & Knee Cumberland Orthopedic Awareness 24
8/23/2012 Valley Auto World Cumberland Blood Drive 14
8/23/2012 City Hall Cumberland Blood Drive 17
8/24/2012 Howard Health & Life Sciences Cumberland Blood Drive 20
8/24/2012 Elizabethtown Comm. Night out Bladen Community Awareness/PR 100
8/25/2012 Omega Psi Phi Fraternity, Inc. Cumberland Blood Drive 26
8/26/2012 Health Panel: New Covenant Cumberland Blood Pressure uknown
8/27/2012 Cross Creek Early College Cumberland Blood Drive 56
8/28/2012 FTCC Cumberland Blood Drive 95
8/29/2012 Chick-fil-A (Ramsey St.) Cumberland Blood Drive 14
8/29/2012 Bladen County Hospital Bladen Blood Drive 17
8/30/2012 Beaver Dam Volunteer Fire Department Cumberland Blood Drive 56
8/31/2012 Bullard Furniture Cumberland Blood Drive/Event 13
9/5/2012 FTCC (Spring Lake) Cumberland Blood Drive 15
9/6/2012 CC Health Department Cumberland Blood Drive 8
9/6/2012 CC Department of Social Services Cumberland Blood Drive 12
9/6/2012 BCC Nursing Student Luncheon Bladen Community Awareness/PR 25
9/7/2012 Cape Fear High School Cumberland Blood Drive 15
9/8/2012 Community Event: Kingdom Impact Cumberland Blood Pressure, Blood Sugar & Cholesterol screening 500
9/8/2012 Passport To Health Cumberland Peripheral Arterial Disease Screening 69
9/8/2012 Sts. Constantine & Helen Greek Church Cumberland Blood Drive 10

Appendix 6: Cape Fear Valley Community Outreach Programs
109
Date Activity Name County Purpose # Served
9/8/2012 Cumberland County Fair: Fair Fight Cumberland Breast self-care and education unknown
9/9/2012 Bladenboro Fun Day Bladen Community Awareness/PR 350
9/10/2012 Campbell University Harnett Blood Drive 28
9/11/2012 E.E. Smith High School Cumberland Blood Drive 60
9/12/2012 Methodist University Cumberland Blood Drive 52
9/13/2012 East Bladen High School Bladen Blood Drive 56
9/13/2012 Mended Hearts Cumberland Support for Cardiac Patients 7
9/14/2012 Fayetteville Observer Cumberland Blood Drive 26
9/14/2012 Cumberland County Fair: Fair Fight Cumberland Breast self-care and education unknown
9/14/2012 Palliative & End of Life Care: First Presbyterian Cumberland Awareness & Education 12
9/15/2012 Education Booth at Cancer Center's Ribbon Walk Cumberland Breast Care Awareness & Education unknown
9/15/2012 Turkey Festival Hoke Awareness and Outreach 200
9/16/2012 Dublin Peanut Festival Bladen Community Awareness/PR 1200
9/18/2012 Gray's Creek High School Cumberland Blood Drive 90
9/19/2012 Reid Ross Classical Cumberland Blood Drive 50
9/20/2012 South View High School Cumberland Blood Drive 67
9/20/2012 Minister's Association Meeting Bladen/Columbus Public Relations 40
9/22/2012 First Baptist Church Cumberland Blood Drive 23
9/24/2012 Massey Hill Classical Cumberland Blood Drive 22
9/25/2012 South River Electric Company Harnett Blood Drive 20
9/25/2012 BB&T Westwood Cumberland Blood Drive 19
9/26/2012 Prestage Foods Robeson Blood Drive 43
9/27/2012 Stoney Point Fire Department Cumberland Blood Drive 36
9/28/2012 Jack Britt High School Cumberland Blood Drive 98
9/28/2012 Camp Rockfish & Camp Coming Together Hoke Cancer Education & Support 75
9/29/2012 AKA Health Fair Cumberland Blood Drive 7
9/29/2012 Camp Rockfish & Camp Coming Together Hoke Cancer Education & Support 111
10/2/2012 Douglas Bryd High School Cumberland Blood Drive 96
10/3/2012 Salem United Methodist Church Cumberland Blood Drive 6
10/3/2012 Eastover Elementary School Cumberland Blood Drive 13
10/4/2012 For Women Only Fitness Center Cumberland Healthy Eating to Reduce Cancer Risks unknown
10/5/2012 Pine Forrest High School Cumberland Blood Drive 65
10/5/2012 BCC Foundation Fundraiser Bladen Public Relations 25
10/6/2012 Fall Safety Day Cumberland Blood Drive/Community 23
10/9/2012 Terry Sanford High School Cumberland Blood Drive 90
10/10/2012 Haymount United Methodist Church Cumberland Blood Drive 19
10/11/2012 Seventy-First High School Cumberland Blood Drive 72
10/11/2012 Mended Hearts Cumberland Support for Cardiac Patients 7
10/11/2012 Pacemaker Support Group Cumberland Support 24
10/11/2012 East Regional Branch: Cumberland County Library Cumberland Heart Health, Blood Pressures 20
10/12/2012 Stedman Primary School Cumberland Blood Drive 11
10/12/2012 Stedman Elementary School Cumberland Blood Drive 9
10/13/2012 Rose Care Shop Community Block Cumberland Blood Drive 3
10/13/2012 Dublin Primary School Clinic Tour Bladen Public Relations 28
10/13/2012 Emp. Fall Party Bladen Employee Satisfaction 125
10/14/2012 Grape Festival Bladen Community Awareness/PR 200

Appendix 6: Cape Fear Valley Community Outreach Programs
110
Date Activity Name County Purpose # Served
10/16/2012 Highsmith-Rainey Specialty Hospital Cumberland Blood Drive 33
10/17/2012 Touchdown for Life (Cape Fear Valley Medical Center) Cumberland Blood Drive 100
10/18/2012 Touchdown for Life (Cape Fear Valley Medical Center) Cumberland Blood Drive 100
10/19/2012 Health Pavilion North Cumberland Blood Drive 15
10/21/2012 Harvest Party Camp Clearwater Bladen Community Awareness/PR 375
10/22/2012 Cross Creek Early College Cumberland Blood Drive 48
10/23/2012 West Bladen High School Bladen Blood Drive 67
10/24/2012 DuPont Cumberland Blood Drive 15
10/25/2012 Arthritis of the Hip & Knee Cumberland Orthopedic Awareness 18
10/25/2012 Plainview Elementary School Sampson Blood Drive 17
10/25/2012 Bladen County Hospital Bladen Blood Drive 31
10/25/2012 Department of Social Services Bladen Blood Drive 16
10/26/2012 Howard Health & Life Sciences Cumberland Blood Drive 26
10/26/2012 BCH Blood Drive Bladen Community Awareness/PR 30
10/29/2012 E. Melvin Honeycutt Elementary Cumberland Blood Drive 30
10/30/2012 Heritage Place Assisted Living Cumberland Heart Failure Education 15
10/31/2012 FTCC Cumberland Blood Drive 95
11/1/2012 Beaver Dam Volunteer Fire Department Cumberland Blood Drive 56
11/2/2012 Passport To Health Cumberland AARP 55 Alive Mature Driving Class 30
11/2/2012 Cracker Barrel Cumberland Blood Drive 6
11/3/2012 Beast of Bladenboro Festival Bladen Blood Drive/Community 11
11/4/2012 Beast Festival Bladen Community Awareness/PR 450
11/4/2012 BCH Foundation Gala Bladen Public Relations 300
11/5/2012 Passport to Health Luncheon Cumberland Long-Term Consequences of Trauma 115
11/6/2012 Passport To Health Cumberland Medicare & Services For Older Adults Seminar 16
11/6/2012 PWC Cumberland Blood Drive 12
11/7/2012 Carillon Assisted Living of Fayetteville Cumberland Blood Drive 2
11/8/2012 Miller-Motte College Cumberland Blood Drive 23
11/8/2012 Mended Hearts Cumberland Support for Cardiac Patients 7
11/9/2012 Hoke County High School Hoke Blood Drive 76
11/12/2012 FTCC (Spring Lake) Cumberland Blood Drive 45
11/12/2012 Gamestop Cumberland Blood Drive 19
11/13/2012 Headquarters Library Cumberland Blood Drive 17
11/13/2012 Cumberland County Government Cumberland Blood Drive 14
11/14/2012 Eaton Corporation Cumberland Blood Drive 48
11/15/2012 Passport To Health Dinner Cumberland Long-Term Consequences of Trauma 103
11/15/2012 Reid Ross Classical Cumberland Blood Drive 56
11/16/2012 Cape Fear High School Cumberland Blood Drive 107
11/17/2012 Zion Hill Baptist Church Cumberland Blood Drive 34
11/17/2012 T-Mobile Cumberland Blood Drive 5
11/17/2012 FireAntz Blood Donor Night Cumberland Education & Awareness on Blood Donation 500
11/18/2012 Elite Zone Cumberland Blood Drive 12
11/18/2012 Bladen Crisis 4K for Food Bladen Community Awareness/PR 40
11/19/2012 Massey Hill Classical Cumberland Blood Drive 19
11/21/2012 BMA Bladenboro Clinic Open House Bladen Community Awareness/PR 150
11/26/2012 Elizabethtown Christmas Parade Bladen Community Awareness/PR 325
11/27/2012 E.E. Smith High School Cumberland Blood Drive 75

Appendix 6: Cape Fear Valley Community Outreach Programs
111
Date Activity Name County Purpose # Served
11/28/2012 Smithfield Packing Bladen Blood Drive 23
11/29/2012 Arthritis of the Hip & Knee Cumberland Orthopedic Awareness 15
11/29/2012 South View High School Cumberland Blood Drive 95
11/30/2012 Pine Forrest High School Cumberland Blood Drive 95
12/1/2012 Holiday Buffalo Wild Wings Cumberland Blood Drive 52
12/2/2012 Bladenboro Christmas Parade Bladen Community Awareness/PR 1000
12/3/2012 Unilever Hoke Blood Drive 21
12/4/2012 Douglas Bryd High School Cumberland Blood Drive 105
12/5/2012 Cumberland County EMS Cumberland Blood Drive 11
12/7/2012 Jack Britt High School Cumberland Blood Drive 108
12/11/2012 Gray's Creek High School Cumberland Blood Drive 105
12/12/2012 East Bladen High School Bladen Blood Drive 77
12/12/2012 Epicenter Church Cumberland Blood Drive 18
12/13/2012 Time Warner Cable Cumberland Blood Drive 13
12/13/2012 Mended Hearts Cumberland Support for Cardiac Patients 7
12/14/2012 Valley Auto World Cumberland Blood Drive 9
12/14/2012 Benjamin Martin Elemetary Cumberland Blood Drive 9
12/14/2012 Piedmont Natural Gas Cumberland Blood Drive 23
12/17/2012 Cape Fear Valley Human Resources Cumberland Blood Drive 41
12/18/2012 Rockfish Hoke Elementary Hoke Blood Drive 32
12/18/2012 Hutchens, Senter, Kellam & Pettit Cumberland Blood Drive 14
12/18/2012 Hendrick Chrysler Jeep Cumberland Blood Drive 13
12/19/2012 City Hall Cumberland Blood Drive 10
12/20/2012 Board of Education Cumberland Blood Drive 4
12/21/2012 Highsmith-Rainey Specialty Hospital Cumberland Blood Drive 13
12/21/2012 Chick-fil-A (Skibo Road) Cumberland Blood Drive 5
12/28/2012 Rick Hendrick Toyota Cumberland Blood Drive 4
1/4/2013 Terry Sanford High School Cumberland Blood Drive 90
1/8/2013 Passport To Health Dinner Cumberland Stroke Prevention & Treatment 130
1/8/2013 Cape Fear Valley Medical Center Cumberland Blood Drive 26
1/9/2013 Dupont Cumberland Blood Drive 16
1/10/2013 Department of Social Services Bladen Blood Drive 11
1/10/2013 Bladen County Hospital Bladen Blood Drive 32
1/10/2013 Mended Hearts Cumberland Support for Cardiac Patients 7
1/10/2013 Pacemaker Support Group Cumberland Support 30
1/13/2013 Human Heart & Blood Drop Cumberland
Education & Awareness on Blood Donation & Heart Hawareness Month 50
1/14/2013 Passport to Health Luncheon Cumberland Stroke Prevention & Treatment 139
1/14/2013 Cross Creek Early College Cumberland Blood Drive 30
1/15/2013 PWC Cumberland Blood Drive 18
1/15/2013 South River Electric Company Harnett Blood Drive 11
1/16/2013 Methodist University Cumberland Blood Drive 48
1/18/2013 Logan's Roadhouse Cumberland Blood Drive 9
1/19/2013 Altman Grocery Barn and Grill Sampson Blood Drive 11
1/21/2013 Campbell University- Multicultural Harnett Blood Drive 39
1/22/2013 FTCC (Spring Lake) Cumberland Blood Drive 15
1/23/2013 Falcons Children Home Sampson Blood Drive 12
1/24/2013 Uterine Fibroid Seminar Cumberland Education 40
1/24/2013 Cape Fear High School Cumberland Blood Drive 76
1/25/2013 Westover High School Cumberland Blood Drive 86
1/26/2013 Elite Zone Cumberland Blood Drive 21

Appendix 6: Cape Fear Valley Community Outreach Programs
112
Date Activity Name County Purpose # Served
1/28/2013 Howard Health & Life Sciences Cumberland Blood Drive 20
1/30/2013 FTCC Cumberland Blood Drive 102
1/31/2013 South View High School Cumberland Blood Drive 85
2/1/2013 Jack Britt High School Cumberland Blood Drive 110
2/2/2013 True Vine Ministries Cumberland Blood Drive 39
2/2/2013 Play 4 Kay: Methodist College Cumberland Breast Health and Early Detection, mammography 200
2/4/2013 E.E. Smith High School Cumberland Blood Drive 73
2/4/2013 Bartender's Ball at Itz Entertainment Cumberland Breast Health and Early Detection, mammography 500
2/5/2013 Passport To Health Dinner Cumberland Early Heart Attack Care: Reducing Heart Damage From A Heart Attack 128
2/5/2013
Community Visitor During Heart Awareness Month at E.E. Miller Prime Time Program Cumberland Heart Failure Education 45
2/5/2013 Gray's Creek High School Cumberland Blood Drive 104
2/6/2013 Reid Ross Classical Cumberland Blood Drive 45
2/7/2013 Beaver Dam Volunteer Fire Department Cumberland Blood Drive 50
2/8/2013 Fayetteville Observer Cumberland Blood Drive 21
2/10/2013 FireAntz Kidz Night Cumberland Awareness: Blood Donor Center 200
2/11/2013
Heart Failure: Risk Factors & Treatment Health Fair & Keynote Address Cumberland
Blood Pressure Screening, more than 20 exhibits including low-cost prescription services, diabetes education, stroke prevention
2/11/2013 Heart Failure Community Education Event Cumberland Heart Failure Education 130
2/11/2013 Massey Hill Classical Cumberland Blood Drive 19
2/11/2013 Heart Failure Symposium Cumberland Heart Failure Education uknown
2/12/2013 Headquarters Library Cumberland Blood Drive 14
2/12/2013 Cumberland County Government Cumberland Blood Drive 24
2/14/2013 West Bladen High School Bladen Blood Drive 66
2/15/2013 Seventy-First High School Cumberland Blood Drive 74
2/16/2013 Family & Friends CPR: Hands Only CPR Cumberland Teaching Hands Only CPR
2/16/2013 Delta Sigma Theta Sorority Inc. Cumberland Blood Drive 5
2/19/2013 Miller-Motte College Cumberland Blood Drive 40
2/20/2013 Eaton Corporation Cumberland Blood Drive 40
2/21/2013 CC Health Department Cumberland Blood Drive 15
2/21/2013 CC Department of Social Services Cumberland Blood Drive 15
2/21/2013 Gray's Creek Fire Department Cumberland Blood Drive 21
2/22/2013 Hoke County High School Hoke Blood Drive 105
2/23/2013 Women in Action Health Fair Cumberland Awareness & Education 45
2/23/2013 FastMed Urgent Care Cumberland Blood Drive 5
2/25/2013 Passport To Health Luncheon Cumberland Early Heart Attack Care: Reducing Heart Damage From A Heart Attack 138
2/25/2013 Cumberland County Employee Wellness Fair Cumberland
Blood Pressure & Blood Sugar screening, Awareness and Education 1000
2/25/2013 Girl Scout Health Fair Cumberland Breast Health and Early Detection, mammography 25
2/26/2013 Cumberland County Employee Wellness Fair Cumberland
Blood Pressure & Blood Sugar screening, Awareness and Education 500
2/26/2013 Douglas Bryd High School Cumberland Blood Drive 92

Appendix 6: Cape Fear Valley Community Outreach Programs
113
Date Activity Name County Purpose # Served
2/27/2013 Cumberland County Employee Wellness Fair Cumberland
Blood Pressure & Blood Sugar screening, Awareness and Education 500
2/27/2013 Prestage Foods Robeson Blood Drive 37
2/28/2013 Arthritis of the Hip & Knee Cumberland Orthopedic Awareness 18
2/28/2013 Amedisys Hospice Care Cumberland Blood Drive 12
3/1/2013 Pine Forrest High School Cumberland Blood Drive 90
3/6/2013 Smithfield Packing Bladen Blood Drive 9
3/7/2013 East Bladen High School Bladen Blood Drive 69
3/8/2013 Max Abbott Middle School Cumberland Blood Drive 12
3/8/2013 Bryan Honda Cumberland Blood Drive 7
3/8/2013 State Farm Insurance (Rodney Sherrill) Cumberland Blood Drive 14
3/11/2013 Passport To Health Luncheon Cumberland Reduce Your Risk Of Colon Cancer 140
3/11/2013 Department of Social Services Bladen Blood Drive 5
3/11/2013 Health Department Bladen Blood Drive 11
3/12/2013 Valley Auto World Cumberland Blood Drive 12
3/12/2013 Systel Cumberland Blood Drive 19
3/13/2013 Berean Baptist Academy Cumberland Blood Drive 34
3/14/2013 Union Pines High School Moore Blood Drive 94
3/14/2013 Statewide Cancer Survivors Summit Cumberland
Per therapy to Cancer Patients, caregiving, education and awareness 250
3/14/2013 Mended Hearts Cumberland Support for Cardiac Patients 7
3/15/2013 Wal-Mart Cumberland Blood Drive 26
3/18/2013 Passport To Health Dinner Cumberland Reduce Your Risk Of Colon Cancer 97
3/18/2013 Cumberland County EMS Cumberland Blood Drive 12
3/19/2013 Health Pavilion North Cumberland Blood Drive 12
3/19/2013 Highsmith-Rainey Specialty Hospital Cumberland Blood Drive 9
3/19/2013 Rick Hendrick Toyota Cumberland Blood Drive 10
3/19/2013 PWC Cumberland Blood Drive 13
3/20/2013 Terry Sanford High School Cumberland Blood Drive 120
3/21/2013 FTCC (Spring Lake) Cumberland Blood Drive 23
3/21/2013 City Hall Cumberland Blood Drive 30
3/22/2013 Cape Fear Valley Medical Center Cumberland Blood Drive 52
3/23/2013 Health Pavilion Hoke Hoke Blood Drive 9
3/23/2013 Health Pavilion Hoke Open House Hoke Awareness 450
3/25/2013 Cape Fear High School Cumberland Blood Drive 104
3/26/2013 Howard Health & Life Sciences Cumberland Blood Drive 12
3/26/2013 Rockfish Hoke Elementary Hoke Blood Drive 12
3/26/2013 LaFayette Lincoln Ford Cumberland Blood Drive 9
3/27/2013 Westover High School Cumberland Blood Drive 85
3/28/2013 DMV Call Center Bladen Blood Drive 21
3/28/2013 Bladen County Hospital Bladen Blood Drive 11
3/29/2013 Bullard Furniture Cumberland Blood Drive 18
3/30/2013 Carmike Westwood Cumberland Blood Drive 5
4/2/2013 Passport To Health Dinner Cumberland Advance Directives 93
4/3/2013 Bladen Community College Bladen Blood Drive 18
4/4/2013 Falcons Children Home Sampson Blood Drive 11
4/4/2013 Coca-Cola Cumberland Blood Drive 23
4/5/2013 Fayetteville Mortgage Bankers Association Cumberland Blood Drive 20
4/6/2013 Passport To Health Cumberland Peripheral Arterial Disease Screening 12

Appendix 6: Cape Fear Valley Community Outreach Programs
114
Date Activity Name County Purpose # Served
4/6/2013 Mt. Zion AME Health Workshop Cumberland Awareness & Education, Heart Health 50
4/6/2013 Spring & Grow Expo Bladen Blood Donor Center Awareness & Education unknown
4/6/2013 Altman Grocery Barn and Grill Sampson Blood Drive 12
4/9/2013 South River Electric Company Harnett Blood Drive 10
4/10/2013 Methodist University Cumberland Blood Drive 30
4/10/2013 Dupont Cumberland Blood Drive 13
4/11/2013 Passport To Health Cumberland AARP Driver Safety Class 13
4/11/2013 FTCC Cumberland Blood Drive 82
4/11/2013 Mended Hearts Cumberland Support for Cardiac Patients 7
4/11/2013 Pacemaker Support Group Cumberland Support 28
4/12/2013 FTCC Cumberland Blood Drive 30
4/16/2013 Gray's Creek High School Cumberland Blood Drive 140
4/17/2013 Reid Ross Classical Cumberland Blood Drive 42
4/18/2013 SR-AHEC Cumberland Blood Drive 10
4/18/2013 Lillian Black Elementary School Cumberland Blood Drive 11
4/18/2013 WT Brown Elementary School Cumberland Blood Drive 9
4/18/2013 Family Fun Fitness Night and Community Health Fair Cumberland
Breast Health and Early Detection, mammography 100
4/20/2013 Fayetteville Police Department Loch Lomand Community Day Cumberland Awareness & Education 200
4/23/2013 E.E. Smith High School Cumberland Blood Drive 92
4/24/2013 Teen Pregnancy Prevention: Real Talk Cumberland Awareness & Education 500
4/24/2013 Passport To Health Cumberland Healthy Recipe Demonstration 23
4/24/2013 M.J.Soffe Cumberland Blood Drive 38
4/24/2013 UPS Cancer Awareness Cumberland Breast self-care and education 30
4/25/2013 West Bladen High School Cumberland Blood Drive 88
4/26/2013 Jack Britt High School Cumberland Blood Drive 110
4/27/2013 Dogwood Festival: Hands Only CPR Cumberland CPR Education 60
4/29/2013 Passport To Health Luncheon Cumberland Advance Directives 149
4/29/2013 Massey Hill Classical Cumberland Blood Drive 33
4/30/2013 Passport To Health Cumberland Plastic Surgery seminar 48
4/30/2013 South View High School Cumberland Blood Drive 120
5/2/2013 Hoke County High School Hoke Blood Drive 125
5/2/2013 Hoke County High School Hoke Blood Drive 125
5/3/2013 Pine Forest High School Cumberland Blood Drive 120
5/3/2013 Pine Forest High School Cumberland Blood Drive 120
5/4/2013 Eastover Heritage Day 2013 Cumberland Blood Drive 22
5/4/2013 Dragon's Lair Cumberland Blood Drive 15
5/4/2013 Eastover Heritage Day 2013 Cumberland Blood Drive 22
5/4/2013 Dragon's Lair Cumberland Blood Drive 15
5/6/2013 Cross Creek Early College Cumberland Blood Drive 8
5/6/2013 Cross Creek Early College Cumberland Blood Drive 8
5/7/2013 Passport To Health Dinner Cumberland Hearing Loss & How To Buy A Hearing Aid 96
5/7/2013 Douglas Byrd High School Cumberland Blood Drive 110
5/7/2013 Douglas Byrd High School Cumberland Blood Drive 110
5/8/2013 Smithfield Packing Bladen Blood Drive 17
5/8/2013 Smithfield Packing Bladen Blood Drive 17
5/9/2013 Mended Hearts Cumberland Support for Cardiac Patients 7
5/9/2013 Beaver Dam Fire Dept. Sampson Blood Drive 53

Appendix 6: Cape Fear Valley Community Outreach Programs
115
Date Activity Name County Purpose # Served
5/9/2013 Beaver Dam Fire Dept. Sampson Blood Drive 53
5/10/2013 Seventy-First High School Cumberland Blood Drive 105
5/10/2013 Seventy-First High School Cumberland Blood Drive 105
5/11/2013 Japanese American Seniors Association Cumberland Heart Health, EHAC & Awareness 25
5/13/2013 Passport To Health Luncheon Cumberland Hearing Loss & How To Buy A Hearing Aid 125
5/14/2013 Miller-Motte College Cumberland Blood Drive 32
5/14/2013 Miller-Motte College Cumberland Blood Drive 32
5/15/2013 Terry Sanford High School Cumberland Blood Drive 140
5/15/2013 Terry Sanford High School Cumberland Blood Drive 140
5/16/2013 Haymount Methodist Health Fair Cumberland Heart Health unknown
5/16/2013 Highsmith Rainey Cumberland blood Drive 15
5/16/2013 HPN Cumberland blood Drive 12
5/16/2013 Cumberland County Health Dept. Cumberland Blood Drive 12
5/16/2013 Cumberland County Dept. of Social Services Cumberland Blood Drive 19
5/16/2013 Highsmith Rainey Cumberland blood Drive 15
5/16/2013 HPN Cumberland blood Drive 12
5/16/2013 Cumberland County Health Dept. Cumberland Blood Drive 12
5/16/2013 Cumberland County Dept. of Social Services Cumberland Blood Drive 19
5/17/2013 Howard Hall Elementary Cumberland Blood Drive 20
5/17/2013 Howard Hall Elementary Cumberland Blood Drive 20
5/18/2013 S.O.S. Pint for a Pint Cumberland In-Center 54
5/18/2013 S.O.S. Pint for a Pint Cumberland In-Center 54
5/21/2013 Headquarters Library Cumberland Blood Drive 21
5/21/2013 Cumberland County Courthouse Cumberland Blood Drive 22
5/21/2013 Cumberland County EMS Cumberland Blood Drive 9
5/21/2013 Headquarters Library Cumberland Blood Drive 21
5/21/2013 Cumberland County Courthouse Cumberland Blood Drive 22
5/21/2013 Cumberland County EMS Cumberland Blood Drive 9
5/22/2013 BB&T Commercial Lending Group Cumberland Blood Drive 23
5/22/2013 CFV-Main Cumberland blood Drive 40
5/22/2013 BB&T Commercial Lending Group Cumberland Blood Drive 23
5/22/2013 CFV-Main Cumberland blood Drive 40
5/23/2013 Boots vs. Badges Cumberland Blood Drive 20
5/23/2013 Cumberland County EMS Cumberland Blood Drive 8
5/23/2013 Boots vs. Badges Cumberland Blood Drive 20
5/23/2013 Cumberland County EMS Cumberland Blood Drive 8
5/28/2013 Pastor's Coalition Cumberland Speakers and Awareness on CFV and BDC 30
5/28/2013 Minority Health Summit Cumberland Education 100
5/28/2013 Health Pavilion Hoke Cumberland Blood Drive 11
5/28/2013 Health Pavilion Hoke Cumberland Blood Drive 11
5/29/2013 Chick-fil-A Ramsey Street Cumberland Blood Drive 17
5/29/2013 Autumn Care of Fayetteville Cumberland Blood Drive 19
5/29/2013 Chick-fil-A Ramsey Street Cumberland Blood Drive 17
5/29/2013 Autumn Care of Fayetteville Cumberland Blood Drive 19
5/30/2013 Stroke Awareness & Prevention Cumberland Awareness & Education 36
5/30/2013 Celebration of Life Survivors Day Picnic Cumberland
Community Awareness & Cancer Education
5/30/2013 DMV Call Center Bladen Blood Drive 14

Appendix 6: Cape Fear Valley Community Outreach Programs
116
Date Activity Name County Purpose # Served
5/30/2013 Bladen County Hospital Bladen Blood Drive 21
5/30/2013 DMV Call Center Bladen Blood Drive 14
5/30/2013 Bladen County Hospital Bladen Blood Drive 21
6/1/2013 NICU Reunoin Cumberland Community Awareness
6/1/2013 Spring Lake Springfest Cumberland Education/bp screening 50
6/1/2013 Cliffdale Community Church Cumberland Blood Drive 25
6/1/2013 Cliffdale Community Church Cumberland Blood Drive 25
6/4/2013 NC Dept of Transportation Cumberland Blood Drive 23
6/4/2013 PWC Cumberland Blood Drive 15
6/4/2013 NC Dept of Transportation Cumberland Blood Drive 23
6/4/2013 PWC Cumberland Blood Drive 15
6/5/2013 Eaton Cumberland Blood Drive 58
6/5/2013 Eaton Cumberland Blood Drive 58
6/6/2013 Don Steed Elementary School Hoke Blood Drive 17
6/6/2013 Hutchens, Senter, Kellam & Pettit Cumberland Blood Drive 20
6/6/2013 Hendrick Jeep Chrysler Cumberland Blood Drive 8
6/6/2013 Don Steed Elementary School Hoke Blood Drive 17
6/6/2013 Hutchens, Senter, Kellam & Pettit Cumberland Blood Drive 20
6/6/2013 Hendrick Jeep Chrysler Cumberland Blood Drive 8
6/8/2013 Cultural Heritage Celebration Hoke Education/bp screening 60
6/8/2013 Zion Hill Baptist Church Robeson Blood Drive 40
6/8/2013 Zion Hill Baptist Church Robeson Blood Drive 40
6/11/2013 FTCC main campus Cumberland Blood Drive 45
6/11/2013 FTCC main campus Cumberland Blood Drive 45
6/12/2013 WIDU Radio Station Cumberland Blood Drive 21
6/12/2013 WIDU Radio Station Cumberland Blood Drive 21
6/13/2013 City Hall Cumberland Blood Drive 19
6/13/2013 City Hall Cumberland Blood Drive 19
6/14/2013 Cargill, Inc. Cumberland Blood Drive 11
6/14/2013 Altman Grocery Barn & Grill Sampson Blood Drive 6
6/14/2013 Cargill, Inc. Cumberland Blood Drive 11
6/14/2013 Altman Grocery Barn & Grill Sampson Blood Drive 6
6/15/2013 Juneteenth event Cumberland Education 50
6/15/2013 Anderson Creek Christian Center Cumberland Blood Drive 30
6/15/2013 Anderson Creek Christian Center Cumberland Blood Drive 30
6/17/2013 Unilever Hoke Blood Drive 15
6/17/2013 Unilever Hoke Blood Drive 15
6/18/2013 Piedmont Natural Gas, Office Cumberland Blood Drive 23
6/18/2013 Bryan Honda Cumberland Blood Drive 9
6/18/2013 Piedmont Natural Gas, Office Cumberland Blood Drive 23
6/18/2013 Bryan Honda Cumberland Blood Drive 9
6/18/2013 Bryan Honda Cumberland Blood Drive 9
6/19/2013 Prestage Foods Health Fair Robeson Blood Donor Info, Early Heart attack care, Stroke, Fibroids 130
6/19/2013 Dupont Cumberland Blood Drive 11
6/19/2013 Dupont Cumberland Blood Drive 11
6/19/2013 Dupont Cumberland Blood Drive 11
6/20/2013 SR-AHEC Cumberland Blood Drive 9
6/20/2013 Fayetteville Asso. Realtors Cumberland Blood Drive 3
6/20/2013 Rick Hendrick Toyota Cumberland Blood Drive 6
6/20/2013 LaFayette Ford Lincoln Cumberland Blood Drive 2

Appendix 6: Cape Fear Valley Community Outreach Programs
117
Date Activity Name County Purpose # Served
6/20/2013 SR-AHEC Cumberland Blood Drive 9
6/20/2013 Fayetteville Asso. Realtors Cumberland Blood Drive 3
6/20/2013 Rick Hendrick Toyota Cumberland Blood Drive 6
6/20/2013 LaFayette Ford Lincoln Cumberland Blood Drive 2
6/20/2013 SR-AHEC Cumberland Blood Drive 9
6/20/2013 Fayetteville Asso. Realtors Cumberland Blood Drive 3
6/20/2013 Rick Hendrick Toyota Cumberland Blood Drive 6
6/20/2013 LaFayette Ford Lincoln Cumberland Blood Drive 2
6/22/2013 True Vine Ministries Cumberland Blood Drive 3
6/22/2013 True Vine Ministries Cumberland Blood Drive 3
6/22/2013 True Vine Ministries Cumberland Blood Drive 3
6/25/2013 Valley Auto World Cumberland Blood Drive 10
6/25/2013 Systel Building Cumberland Blood Drive 15
6/25/2013 Omni Fitness Cumberland Blood Drive 7
6/25/2013 Valley Auto World Cumberland Blood Drive 10
6/25/2013 Systel Building Cumberland Blood Drive 15
6/25/2013 Omni Fitness Cumberland Blood Drive 7
6/25/2013 Valley Auto World Cumberland Blood Drive 10
6/25/2013 Systel Building Cumberland Blood Drive 15
6/25/2013 Omni Fitness Cumberland Blood Drive 7
6/26/2013 FTCC Spring Lake Cumberland Blood Drive 13
6/26/2013 FTCC Spring Lake Cumberland Blood Drive 13
6/26/2013 FTCC Spring Lake Cumberland Blood Drive 13
6/27/2013 Arthritis of the Hip & Knee Cumberland Orthopedic Awareness 29
6/27/2013 Pre-Fourth On The Border Cumberland Blood Drive 110
6/27/2013 Pre-Fourth On The Border Cumberland Blood Drive 110
6/27/2013 Pre-Fourth On The Border Cumberland Blood Drive 110
6/28/2013 Methodist University PA Program Cumberland Blood Drive 30
6/28/2013 Methodist University PA Program Cumberland Blood Drive 30
6/28/2013 Methodist University PA Program Cumberland Blood Drive 30
6/29/2013 All things in common ministries Cumberland Education/bp screening 35
6/29/2013 2nd chance ministries Cumberland Education/bp screening/speaker 30
7/2/2013 Chick-fil-A Skibo Cumberland Blood Drive 22
7/2/2013 Chick-fil-A Skibo Cumberland Blood Drive 22
7/2/2013 Chick-fil-A Skibo Cumberland Blood Drive 22
7/10/2013 Hoke County Health Dept Hoke Blood Drive 4
7/10/2013 Hoke County Health Dept Hoke Blood Drive 4
7/10/2013 Hoke County Health Dept Hoke Blood Drive 4
7/11/2013 CFVHS-Benefit's Fair Cumberland Blood Drive 16
7/11/2013 CFVHS-Benefit's Fair Cumberland Blood Drive 16
7/11/2013 CFVHS-Benefit's Fair Cumberland Blood Drive 16
7/12/2013 CFVHS-HSRMH Benefit's Fair Cumberland Blood Drive 13
7/12/2013 CFVHS-HPN Cumberland Blood Drive 9
7/12/2013 CFVHS-HSRMH Benefit's Fair Cumberland Blood Drive 13
7/12/2013 CFVHS-HPN Cumberland Blood Drive 9
7/12/2013 CFVHS-HSRMH Benefit's Fair Cumberland Blood Drive 13
7/12/2013 CFVHS-HPN Cumberland Blood Drive 9
7/13/2013 Country-Hoe Down Cumberland Blood Drive 72
7/13/2013 Country-Hoe Down Cumberland Blood Drive 72
7/13/2013 Country-Hoe Down Cumberland Blood Drive 72
7/15/2013 Bladen Co. Dept. of Social Services Bladen Blood Drive 14

Appendix 6: Cape Fear Valley Community Outreach Programs
118
Date Activity Name County Purpose # Served
7/15/2013 Bladen Co. Health Dept. Bladen Blood Drive 7
7/15/2013 Bladen Co. Dept. of Social Services Bladen Blood Drive 14
7/15/2013 Bladen Co. Health Dept. Bladen Blood Drive 7
7/15/2013 Bladen Co. Dept. of Social Services Bladen Blood Drive 14
7/15/2013 Bladen Co. Health Dept. Bladen Blood Drive 7
7/15/2013 Bladen Co. Dept. of Social Services Bladen Blood Drive 14
7/15/2013 Bladen Co. Health Dept. Bladen Blood Drive 7
7/15/2013 Bladen Co. Dept. of Social Services Bladen Blood Drive 14
7/15/2013 Bladen Co. Health Dept. Bladen Blood Drive 7
7/16/2013 Cross Creek Subaru Cumberland Blood Drive 6
7/16/2013 Cross Creek Subaru Cumberland Blood Drive 6
7/16/2013 Cross Creek Subaru Cumberland Blood Drive 6
7/16/2013 Cross Creek Subaru Cumberland Blood Drive 6
7/16/2013 Cross Creek Subaru Cumberland Blood Drive 6
7/18/2013 Loyal Seniors Cumberland Education 60
7/18/2013 Falcons Childrens Home Cumberland Blood Drive 17
7/18/2013 Falcons Childrens Home Cumberland Blood Drive 17
7/18/2013 Falcons Childrens Home Cumberland Blood Drive 17
7/18/2013 Falcons Childrens Home Cumberland Blood Drive 17
7/18/2013 Falcons Childrens Home Cumberland Blood Drive 17
7/19/2013 Rodney Sherrill - State Farm Insurance Cumberland Blood Drive 8
7/19/2013 Rodney Sherrill - State Farm Insurance Cumberland Blood Drive 8
7/19/2013 Rodney Sherrill - State Farm Insurance Cumberland Blood Drive 8
7/19/2013 Rodney Sherrill - State Farm Insurance Cumberland Blood Drive 8
7/19/2013 Rodney Sherrill - State Farm Insurance Cumberland Blood Drive 8
7/20/2013 BBW Christmas in July Cumberland Blood Drive 57
7/20/2013 BBW Christmas in July Cumberland Blood Drive 57
7/20/2013 BBW Christmas in July Cumberland Blood Drive 57
7/20/2013 BBW Christmas in July Cumberland Blood Drive 57
7/20/2013 BBW Christmas in July Cumberland Blood Drive 57
7/21/2013 Village Baptist Church Cumberland Blood Drive 10
7/21/2013 Village Baptist Church Cumberland Blood Drive 10
7/21/2013 Village Baptist Church Cumberland Blood Drive 10
7/21/2013 Village Baptist Church Cumberland Blood Drive 10
7/21/2013 Village Baptist Church Cumberland Blood Drive 10
7/24/2013 Prestage Foods Cumberland Blood Drive 52
7/24/2013 Prestage Foods Cumberland Blood Drive 52
7/24/2013 Prestage Foods Cumberland Blood Drive 52
7/24/2013 Prestage Foods Cumberland Blood Drive 52
7/24/2013 Prestage Foods Cumberland Blood Drive 52
7/25/2013 Bladen County Hospital Bladen Blood Drive 26
7/25/2013 Bladen County Hospital Bladen Blood Drive 26
7/25/2013 Bladen County Hospital Bladen Blood Drive 26
7/25/2013 Bladen County Hospital Bladen Blood Drive 26
7/25/2013 Bladen County Hospital Bladen Blood Drive 26
7/26/2013 Angels healthcare community event Cumberland Education 25
7/26/2013 CFVHS-Main Cumberland Blood Drive 40
7/26/2013 CFVHS-Main Cumberland Blood Drive 40

Appendix 6: Cape Fear Valley Community Outreach Programs
119
Date Activity Name County Purpose # Served
7/26/2013 CFVHS-Main Cumberland Blood Drive 40
7/26/2013 CFVHS-Main Cumberland Blood Drive 40
7/26/2013 CFVHS-Main Cumberland Blood Drive 40
7/27/2013 FPD Community Empowerment Murchison Cumberland Education 400
7/27/2013 Fayetteville District New Bethel Church Cumberland Blood Drive 8
7/27/2013 Elite Zone Gaming Lounge Cumberland Blood Drive 11
7/27/2013 Fayetteville District New Bethel Church Cumberland Blood Drive 8
7/27/2013 Elite Zone Gaming Lounge Cumberland Blood Drive 11
7/27/2013 Fayetteville District New Bethel Church Cumberland Blood Drive 8
7/27/2013 Elite Zone Gaming Lounge Cumberland Blood Drive 11
7/27/2013 Fayetteville District New Bethel Church Cumberland Blood Drive 8
7/27/2013 Elite Zone Gaming Lounge Cumberland Blood Drive 11
7/27/2013 Fayetteville District New Bethel Church Cumberland Blood Drive 8
7/27/2013 Elite Zone Gaming Lounge Cumberland Blood Drive 11
7/30/2013 Health Pavilion Hoke Hoke Blood Drive 6
7/30/2013 Health Pavilion Hoke Hoke Blood Drive 6
7/30/2013 Health Pavilion Hoke Hoke Blood Drive 6
7/30/2013 Health Pavilion Hoke Hoke Blood Drive 6
7/30/2013 Health Pavilion Hoke Hoke Blood Drive 6
7/31/2013 Epicenter Church Cumberland Blood Drive 29
7/31/2013 Epicenter Church Cumberland Blood Drive 29
7/31/2013 Epicenter Church Cumberland Blood Drive 29
7/31/2013 Epicenter Church Cumberland Blood Drive 29
7/31/2013 Epicenter Church Cumberland Blood Drive 29
8/3/2013 Smithfield Packing Bladen Education 50
8/3/2013 Annual Digging for Diamonds Event - Cross Creek Mall Cumberland Blood Drive 62
8/3/2013 Annual Digging for Diamonds Event - Cross Creek Mall Cumberland Blood Drive 62
8/3/2013 Annual Digging for Diamonds Event - Cross Creek Mall Cumberland Blood Drive 62
8/3/2013 Annual Digging for Diamonds Event - Cross Creek Mall Cumberland Blood Drive 62
8/3/2013 Annual Digging for Diamonds Event - Cross Creek Mall Cumberland Blood Drive 62
8/6/2013 2301 Robeson Plaza Cumberland Blood Drive 11
8/6/2013 Highsmith Rainey Cumberland Blood Drive 8
8/6/2013 Fayetteville Beauty College Cumberland Blood Drive 14
8/6/2013 2301 Robeson Plaza Cumberland Blood Drive 11
8/6/2013 Highsmith Rainey Cumberland Blood Drive 8
8/6/2013 Fayetteville Beauty College Cumberland Blood Drive 14
8/6/2013 2301 Robeson Plaza Cumberland Blood Drive 11
8/6/2013 Highsmith Rainey Cumberland Blood Drive 8
8/6/2013 Fayetteville Beauty College Cumberland Blood Drive 14
8/6/2013 2301 Robeson Plaza Cumberland Blood Drive 11
8/6/2013 Highsmith Rainey Cumberland Blood Drive 8
8/6/2013 Fayetteville Beauty College Cumberland Blood Drive 14

Appendix 6: Cape Fear Valley Community Outreach Programs
120
Date Activity Name County Purpose # Served
8/6/2013 2301 Robeson Plaza Cumberland Blood Drive 11
8/6/2013 Highsmith Rainey Cumberland Blood Drive 8
8/6/2013 Fayetteville Beauty College Cumberland Blood Drive 14
8/7/2013 Maidenform - Fayetteville Distribution Cumberland Blood Drive 26
8/7/2013 Maidenform - Fayetteville Distribution Cumberland Blood Drive 26
8/7/2013 Maidenform - Fayetteville Distribution Cumberland Blood Drive 26
8/7/2013 Maidenform - Fayetteville Distribution Cumberland Blood Drive 26
8/7/2013 Maidenform - Fayetteville Distribution Cumberland Blood Drive 26
8/10/2013 Marvin United Methodist Church Cumberland Blood Drive 19
8/10/2013 Marvin United Methodist Church Cumberland Blood Drive 19
8/10/2013 Marvin United Methodist Church Cumberland Blood Drive 19
8/10/2013 Marvin United Methodist Church Cumberland Blood Drive 19
8/10/2013 Marvin United Methodist Church Cumberland Blood Drive 19
8/24/2013 Umoja Festival Cumberland Outreach to Minority Health, Multiple Screenings
9/7/2013 Greek Festival Cumberland Blood Drive, Community Awareness, CPR, Blood Pressure
9/29/2013 Shoulder Pain Cumberland Orthopedic Awareness 19
1/-/13 African American Quiz Bowl Cumberland Awareness & Education 250

121
REFERENCES
Cumberland County Health Department. 2010-2012 Community Health Needs Assessment http://www.co.cumberland.nc.us/health/downloads/Community_Health_Assessment-2010.pdf Office of State Budget and Management http://www.osbm.state.nc.us/ EMS Data: Provided by Cape Fear Valley Health System EMS Department Director Pre-Hospital Medical Information System and EMS Tool Kits North Carolina State Center for Health Statistics http://www.schs.state.nc.us/SCHS/ County Health Rankings http://www.countyhealthrankings.org/#app/north-carolina/2012/rankings/outcomes/overall US Census Bureau www.census.gov/2010census NC Census (uses US Census Bureau) http://quickfacts.census.gov/qfd/states/37000.html Bureau of Labor Statistics http://data.bls.gov