cape cod regional wastewater management plan estimating ... · pdf fileregional wastewater...
TRANSCRIPT
CAPE COD
Regional Wastewater Management Plan Estimating Cape-Wide Costs of Wastewater Infrastructure
MARCH 2013


Table of Contents
INTRODUCTION .....................................................................1
APPROACH .............................................................................3
LAND AREA ....................................................................4DEVELOPED PARCELS ....................................................5DEVELOPMENT DENSITY ................................................6EXISTING WASTEWATER INFRASTRUCTURE ....................6WATER USE ...................................................................7WASTEWATER FLOWS ...................................................10WASTEWATER FLOWS NEEDING BETTER MANAGEMENT ...11THE WASTEWATER MANAGEMENT PLAN THAT IS THE BASIS OF THE COST ESTIMATE .....................................12GROWTH .....................................................................13
COST ESTIMATES .................................................................14METHODOLOGY ...........................................................14SCENARIOS EVALUATED ..............................................15RESULTS ......................................................................15FACTORS MOST INFLUENCING COST .............................17AREAS OF FUTURE REFINEMENT ...................................18


REGIONAL WASTEWATER MANAGEMENT PLAN | ESTIMATING CAPE-WIDE COSTS 1
Introduction
Providing adequate wastewater infrastructure is arguably the most costly challenge Cape Cod has faced in its history. Many back-of-the-envelope “guesstimates” have been made about the expense confronting the region—mostly based on extrapolation of costs from the few towns that have undertaken studies or, in the case of Chatham, implemented a plan. Questions continue about potential savings from a regional approach ver-sus a town-by-town approach to the provision of wastewater treatment.
With funding from Barnstable County, the Town of Orleans supplemented its Comprehensive Wastewater Management Plan with a focused study of the options available to share wastewater facilities with the towns of Eastham and Brewster. The details of this evaluation are presented in the December 2009 Wastewater Regionalization Study (Orleans-Brewster-Eastham). The principal conclusions are as follows:
1. Compared with each town building its own separate wastewater facilities, two-town and three-town regional solutions may offer 6% to 9% capital cost savings and 18% to 25% operation-and-mainte-nance (O&M) cost savings. Capital cost savings by town are:
�� Brewster.....................$3.0 to $8.4 million
�� Eastham ..................... $2.5 to $6.9 million
�� Orleans .....................$1.9 to $10.5 million
2. The overall savings to the individual towns may be allocated in many ways, hence the range in savings per town shown above. Two example allocation formulas are presented that yield significantly different results. Determination of the best approach will require detailed discussion among town officials.
Two identified options involve the installation of public sewers in Brew-ster and Eastham, and the associated pipelines to transport the collected wastewater to the regional treatment facility. It is also possible for Orleans to remove Brewster’s and Eastham’s shares of the watershed nitrogen loads by expanding the proposed Orleans sewer system. In essence, Orleans could eliminate more Orleans septic systems to offset Brews-ter and Eastham nitrogen loads, and have those two towns pay for that
ESTIMATING CAPE-WIDE COSTS | REGIONAL WASTEWATER MANAGEMENT PLAN2
expansion. In this way, regionalization could occur without the construc-tion of public wastewater facilities in either Brewster or Eastham. This approach has been termed “nutrient trading.”
The Cape Cod Regional Wastewater Management Plan (RWMP) must reflect the nature and extent of the wastewater problems faced by the entire region. Accordingly, this section of the RWMP accomplishes the following:
1. Presents estimates of wastewater flows currently generated by Cape Cod homes and businesses;
2. Estimates the portion of those flow that require better management;
3. Lays out a conceptual management plan;
4. Estimates the cost to build and operate the elements of that man-agement plan; and
5. Identifies the principal factors that most influence the overall costs, as a basis for formulating an action plan to minimize costs.
REGIONAL WASTEWATER MANAGEMENT PLAN | ESTIMATING CAPE-WIDE COSTS 3
APPROACH
Many coastal areas of the United States have addressed wastewater-related water quality problems by constructing extensive sewer systems and centralized treatment facilities. Complete sewering of near-shore areas has often been the norm. On Cape Cod, the Massachusetts Estuar-ies Project (MEP) has applied state-of-the-art science to identify those specific geographic areas where control of septic nitrogen loads is neces-sary, and has determined the degree of nitrogen control that will result in protection of coastal waters. That scientific approach lays the groundwork for limiting public wastewater infrastructure to only those areas where it is needed.
Therefore, the most fundamental premise of the RWMP is the goal to maximize the use of on-site septic systems and to build public infrastruc-ture only where needed to accomplish well-defined needs for better waste-water management. The RWMP relies heavily on MEP studies to define the watersheds where septic systems must be upgraded or replaced. It also uses a sophisticated Geographic Information System (GIS) to identify specific parcels, and the type of development they support, to guide the formulation of a targeted wastewater management plan.
The following steps lead to an estimate of Cape-wide costs:
1. Identify the number of developed parcels in each of the 105 Cape Cod watersheds and determine the associated land use as either “residential” or “non-residential.”
2. Evaluate the density of development in each of the watersheds.
3. Document the nature and extent of existing wastewater infrastruc-ture and determine the watershed location of the parcels connected to that infrastructure.
4. Estimate Cape-wide wastewater flows based on water use records and allocate that flow to specific watersheds using the GIS.
5. Estimate the percentage of unsewered wastewater flow in each watershed that should be more effectively managed, based on MEP studies and the goal to maximize the use of Title 5 septic systems.

ESTIMATING CAPE-WIDE COSTS | REGIONAL WASTEWATER MANAGEMENT PLAN4
6. Formulate a conceptual wastewater management plan to deal with both current wastewater flows and those that may exist in the future as a result of growth.
7. Develop a cost model that predicts capital and O&M costs of new infrastructure based on actual local construction projects and current operating budgets of local towns.
The paragraphs that follow describe the methodology and results for each of these steps.
LAND AREAThe total land surface in the 15 towns that comprise Barnstable County is approximately 264,000 acres or 412 square miles. That land area falls into four types of watersheds:
1. Watersheds of nitrogen-sensitive coastal waters with completed MEP reports (termed “MEP Complete Watersheds”)—37 in total
2. Watersheds of nitrogen-sensitive coastal waters with pending MEP reports (termed “MEP Pending Watersheds”)—9 in total
3. Watersheds of coastal embayments that are not nitrogen sensitive and therefore not part of the MEP (termed “Other Watersheds”)—11 in total
4. Watersheds where groundwater flows directly to well-mixed ocean waters (termed “Direct Discharge Watersheds”)—48 in total.
The geographic extent of these categories is listed in Table CWC-1.
TABLE CWC-1: Geographical Extent of Land Area in Four Types of Watersheds CATEGORY AREA (ACRES) PORTION OF TOTAL AREA (%)
MEP Complete Watersheds 128,717 49%
MEP Pending Watersheds 53,072 20%
Other Watersheds 20,681 8%
Direct Discharge Watersheds 61,456 23%
Cape-wide total 263,926 100%

REGIONAL WASTEWATER MANAGEMENT PLAN | ESTIMATING CAPE-WIDE COSTS 5
Approximately two-thirds of the Cape land area is tributary to nitrogen-sensitive coastal waters.
DEVELOPED PARCELSAccording to the Commission’s GIS, there are approximately 162,000 separate parcels Cape-wide. Using the state land use codes, 133,215 par-cels are developed in residential, commercial, and industrial uses. Other developed parcels are in the categories of public facilities, recreational facilities, etc. A review of the Annual Statistical Reports published by the 16 public water purveyors indicates that about 1,000 developed parcels are in these other categories, which have been termed “municipal.” There-fore the best current estimate is:
Developed parcels .....................134,000 Vacant parcels............................ 28,000 All parcels .................................162,000
The number of developed parcels (residential, commercial, and indus-trial only) ranges from fewer than 500 in many watersheds to more than 10,000 in the Bass River watershed.
Since there is no apparent way to include watershed-specific counts of “municipal” parcels, watershed-specific wastewater flows have been based primarily on the residential, commercial, and industrial categories, an approach that understates the total flows by less than 1%.
If developed parcels are aggregated in two broad categories (“residential” and “non-residential”), their locations are summarized in Table CWC-2.
TABLE CWC-2: Developed Residential and Non-Residential Parcels LOCATION BY WATERSHED RESIDENTIAL NON-RESIDENTIAL TOTAL
MEP Complete 78,333 3,205 81,538
MEP Pending 15,748 649 16,397
Other and Direct Discharge 33,782 1,498 35,280
Total 127,863 5,352 133,215
About 74% of developed parcels are located in watersheds subject to MEP study. Of all the currently developed parcels, 96% are residential.
ESTIMATING CAPE-WIDE COSTS | REGIONAL WASTEWATER MANAGEMENT PLAN6
DEVELOPMENT DENSITYThe simplest density indicator is land area per developed parcel. Cape-wide, the density is 1.9 acres per parcel, including all land area and all developed parcels. (This figure includes undeveloped acreage, but not undeveloped parcels.) The higher this number, the less densely developed is the area.As expected, the gross density is higher in MEP watersheds (1.86 acres per parcel) than in non-MEP watersheds (2.33 acres per parcel).
A more-refined density indicator is the road length per developed parcel. Cape-wide there are 138 feet of roadway per developed parcel and 132 feet per parcel in MEP watersheds. (Again, the higher the number, the lower the density.)
To investigate the variation in density across and within watersheds, the Commission’s GIS staff applied a rectangular grid over the entire Cape, one-quarter mile by one-quarter mile. This exercise creates 40-acres “grid cells,” for which a development density can be estimated. There are approximately 7,600 such grid cells Cape-wide and about 2,200 in MEP watersheds. About 55–60% of the grid cells in MEP watersheds have development density less than 150 feet per parcel, and such cells account for about 80% of the developed parcels. The average density in these cells is 96 feet per parcel Cape-wide and 97 feet per parcel in MEP watersheds. For more information on these Cape-wide grid cells, see the Environmen-tal Assessment - Land Use section of the RWMP.
EXISTING WASTEWATER INFRASTRUCTUREThe vast majority of homes and businesses on Cape Cod are served by on-site septic systems that provide for basic wastewater treatment and disposal of wastewaters generated on the parcel. Best available estimates are that about 129,000 such systems are in use today and that 1,500 of them have some sort of innovative/alternative (I/A) treatment system aimed at pro-viding some additional nitrogen removal. The remaining developed parcels, 4,570 in number, are served by off-site treatment and disposal systems. A small number of parcels are served by cluster systems whose capacities are less than 10,000 gallons per day (gpd) and therefore do not require a Mas-sachusetts Department of Environmental Protection (MassDEP) Ground-water Discharge Permit. Approximately 100 parcels are served by facilities larger than 10,000 gpd with Groundwater Discharge Permits.

REGIONAL WASTEWATER MANAGEMENT PLAN | ESTIMATING CAPE-WIDE COSTS 7
Key statistics are as follows:
�� There are 62 active Groundwater Discharge Permits on Cape Cod.
�� Of the 62 permits, five are related to central wastewater treat-ment facilities (Falmouth, Hyannis, Chatham, Provincetown and the Massachusetts Military Reservation) and two are regional septage facilities (the Yarmouth-Dennis plant and the Tri-Town facility in Orleans). That leaves 55 so-called satellite plants.
�� Included in the 55 satellite plants are three serving state parks, none of which provides nitrogen removal. Therefore these esti-mates of wastewater flow currently treated for nitrogen focus on 52 satellite plants and the five central facilities.
�� The permitted capacity of the five central plants is just over 8 million gallons per day (mgd).
�� The 52 satellite plants have an aggregate capacity of 2.3 mgd.
�� Of all the capacity in satellite systems, 61% is associated with 20 residential developments (including resorts, hotels, and inns), 12% is related to commercial projects, and 11% is associ-ated with medical facilities and nursing homes.
Of the 133,215 developed parcels on Cape Cod, 4,570 are connected to satellite or central facilities currently removing nitrogen, and 128,645 are served by on-site systems, the vast majority of which are simple Title 5 systems or more rudimentary predecessors.
WATER USEApproximately 90% of the developed parcels on Cape Cod are served by public water systems, and reliable data exist on the water use variability, geographically and by type of development. Principal data sources and key parameters are as follows.
MEP TECHNICAL REPORTS
The MEP team has estimated per-property residential water use in areas served by town water to extrapolate to properties on private wells. This information is generally reported in Chapter 4 of the technical reports for

ESTIMATING CAPE-WIDE COSTS | REGIONAL WASTEWATER MANAGEMENT PLAN8
each watershed. For 35 watersheds covered by draft or completed MEP reports, the following data have been found:
Range of residential water use ....................... 102 to 227 gpd/parcel Average ...................................................................... 169 gpd/parcel
WATER SUPPLY ANNUAL STATISTICAL REPORTS
Water purveyors report to MassDEP annually on a large number of oper-ating parameters. APCC compiled data for 16 purveyors for the years 2007 and 2008, and data have been added to that analysis for the Buzzards Bay Water District for 2009 and 2010. Key statistics include:
Range of residential water use ............... 118 to 244 gpd/connection Average residential water use ........................... 167 gpd/connection Range of non-residential water use .... 184 to 1,290 gpd/connection Average non-residential water use ....................586 gpd/connection
The 17 (of the total 18) water purveyors reported a total of 7,293 non-residential connections, compared to the Cape Cod Commission’s parcel count of 5,352. This indicates an average of 1.36 connections per non-residential parcel. If this is a good estimate, then 586 gpd per connection translates to about 800 gpd per property. (This extrapolation is approxi-mate because the 7,293 total includes 766 municipal connections and the 5,353 figure includes only 383 municipal parcels that are connected to publicly owned treatment works, or POTWs.)
The total metered water reported by the 17 purveyors is about 9.2 billion gallons per year. Based on the Cape Cod Commission’s estimate that 90% of all properties are served by public water systems, this indicates a Cape-wide water use of about 10 billion gallons per year. The water purveyors report that, in the aggregate, 82.4% of the metered water goes to residential customers.
POTW FLOW RECORDS
Operators of the four town-owned wastewater treatment plants provided wastewater flow information, which was then compared with the sew-ered parcel counts available from the Cape Cod Commission to arrive at
REGIONAL WASTEWATER MANAGEMENT PLAN | ESTIMATING CAPE-WIDE COSTS 9
estimates of sewered flow per parcel, from which per-parcel water use estimates were made. The resulting water use for non-residential sewered parcels ranges from 345 gpd to 4,400 gpd, and averages 1,985 gpd. The average water use for all sewered parcels (both residential and non-resi-dential) is 680 gpd per parcel.
All data from this analysis were combined and cross-checked for consis-tency. The most weight was placed on the MEP residential water use data and the POTW flow data. In general, the water supply annual statistical reports were used for confirmation.
The results of this analysis are summarized as follows and listed in Table CWC-3:
1. Residential water use of 169 gpd/parcel. This matches both the water supply annual statistical reports and the MEP technical reports.
2. Water use of 173 gpd/parcel at sewered residential parcels and 169 gpd at un-sewered residential parcels. The MEP reports indicate slightly higher water use in watersheds that now have sewer service.
3. Non-residential water use of 884 gpd/parcel. This figure is 11% higher than that estimated from annual statistical reports, once a correction is made for multiple connections per parcel. This may reflect the fact that some of the reported POTW flow is infiltration and/or inflow, which have not been accounted for in this analysis.
4. Non-residential water use of 1,985 gpd/parcel at sewered parcels and 549 gpd at un-sewered parcels. It would be expected that the larger water users would be selected to connect to a sewer system.
5. Total Cape-wide water use of 9.6 billion gallons per year matches well with the annual statistical reports and the Cape Cod Commis-sion’s estimates of the percentage of all properties served by public water systems.
6. Cape-wide residential water use that is 82.0% of all water use compares with 82.4% derived from the water supply annual statis-tical reports, indicating we may have slightly over-estimated non-residential flows.
ESTIMATING CAPE-WIDE COSTS | REGIONAL WASTEWATER MANAGEMENT PLAN10
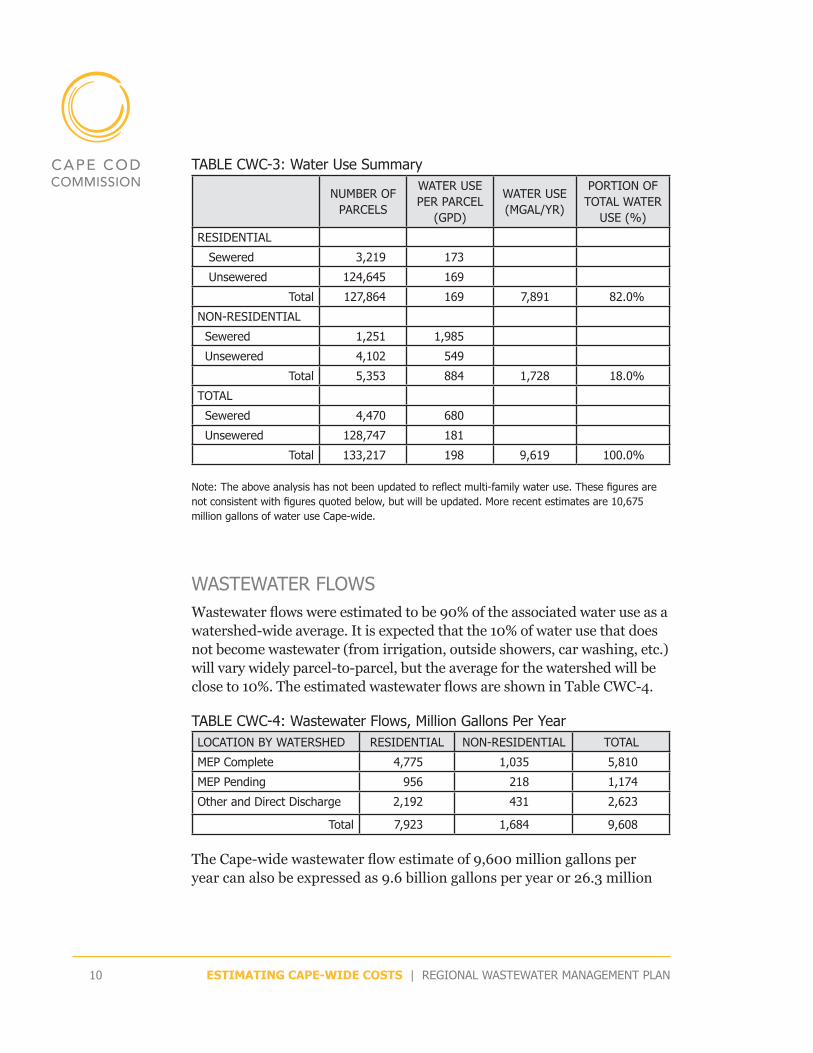
TABLE CWC-3: Water Use Summary
NUMBER OF PARCELS
WATER USE PER PARCEL
(GPD)
WATER USE (MGAL/YR)
PORTION OF TOTAL WATER
USE (%)
RESIDENTIAL
Sewered 3,219 173
Unsewered 124,645 169
Total 127,864 169 7,891 82.0%
NON-RESIDENTIAL
Sewered 1,251 1,985
Unsewered 4,102 549
Total 5,353 884 1,728 18.0%
TOTAL
Sewered 4,470 680
Unsewered 128,747 181
Total 133,217 198 9,619 100.0%
Note: The above analysis has not been updated to reflect multi-family water use. These figures are not consistent with figures quoted below, but will be updated. More recent estimates are 10,675 million gallons of water use Cape-wide.
WASTEWATER FLOWSWastewater flows were estimated to be 90% of the associated water use as a watershed-wide average. It is expected that the 10% of water use that does not become wastewater (from irrigation, outside showers, car washing, etc.) will vary widely parcel-to-parcel, but the average for the watershed will be close to 10%. The estimated wastewater flows are shown in Table CWC-4.
TABLE CWC-4: Wastewater Flows, Million Gallons Per Year LOCATION BY WATERSHED RESIDENTIAL NON-RESIDENTIAL TOTAL
MEP Complete 4,775 1,035 5,810
MEP Pending 956 218 1,174
Other and Direct Discharge 2,192 431 2,623
Total 7,923 1,684 9,608
The Cape-wide wastewater flow estimate of 9,600 million gallons per year can also be expressed as 9.6 billion gallons per year or 26.3 million

REGIONAL WASTEWATER MANAGEMENT PLAN | ESTIMATING CAPE-WIDE COSTS 11
gallons per day, on average. Cape-wide, 73% of wastewater flow is from MEP watersheds and 82% is residential.
WASTEWATER FLOWS NEEDING BETTER MANAGEMENTOnce total wastewater flows were estimated for each watershed, estimates were made of the portion of that flow that needs better management. So-called “wastewater needs” were estimated as the sum of:
Nitrogen control needs—the wastewater flow that should be subject to nitrogen removal to achieve the Total Maximum Daily Loads (TMDLs) resulting from the MEP studies
and
Non-nitrogen control needs, such as:
�� correction of basic sanitary conditions,
�� protection of public and private water supplies,
�� control of phosphorus in the watersheds of freshwater ponds,
�� promotion of more development than on-site disposal would allow, and
�� addressing convenience and aesthetic issues.
Nitrogen control needs were estimated by applying the “septic nitrogen removal percentage” presented in the MEP technical reports to the total wastewater flow estimated for the watershed. The key assumption is that collecting, for example, 55% of the wastewater from existing septic sys-tems (and disposing of it outside the watershed) will remove 55% of the septic load.
Non-nitrogen control needs were estimated to be 10% of all the waste-water flow in the watershed, based on a survey of completed Comprehen-sive Wastewater Management Plans (CWMPs).
ESTIMATING CAPE-WIDE COSTS | REGIONAL WASTEWATER MANAGEMENT PLAN12
THE WASTEWATER MANAGEMENT PLAN THAT IS THE BASIS OF THE COST ESTIMATEA conceptual wastewater management plan was developed that includes these elements:
1. Maximizing the number of properties that can continue to rely on Title 5 systems.
2. Optimizing the viability of Title 5 systems by instituting a program of periodic pumping, repair and upgrading.
3. Using on-site denitrification systems in locations of low devel-opment density and/or where local conditions (such as proximity to private wells) require a higher level of treatment than can be achieved in a Title 5 system.
4. Constructing cluster and satellite systems in areas remote from central facilities where off-site disposal is needed, but disposal can occur nearby and in the same watershed to maintain water balances.
5. Constructing public sewers to allow the elimination of septic sys-tems in sensitive areas, with the sewers leading to central treatment facilities capable of the highest level of nitrogen removal at the low-est feasible cost per gallon, and from which effluent disposal can be situated outside of the sewered watersheds (where possible).
6. Treating and disposing of septage at the two existing septage facili-ties (Yarmouth and the Tri-Town facility in Orleans) or at central wastewater facilities.
7. Using sludge-thickening and dewatering facilities at the central plants to handle sludge produced there or at nearby cluster and satel-lite plants, with the dewatered sludge trucked to suitable off-Cape processing facilities.
REGIONAL WASTEWATER MANAGEMENT PLAN | ESTIMATING CAPE-WIDE COSTS 13
GROWTHThe conceptual management plan must accommodate growth in resi-dential and commercial development across the Cape. Future growth scenarios were considered that would result in three levels of increased wastewater flow:
�� 15% increase over current flows,
�� 30% increase over current flows, and
�� 45% increase over current flows

ESTIMATING CAPE-WIDE COSTS | REGIONAL WASTEWATER MANAGEMENT PLAN14
COST ESTIMATES
METHODOLOGYThis effort was based largely on the methodology and data presented in the April 2010 report Comparison of Costs for Wastewater Management Systems Applicable to Cape Cod.
Capital costs were developed in the following categories, where applicable:
�� Wastewater collection (not applicable to on-site denitrification and cluster systems)
�� Transport of collected wastewater to the treatment site (not applicable to on-site denitrification and cluster systems)
�� Treatment of wastewater to remove nitrogen
�� Transport of effluent to one or more disposal sites
�� Effluent disposal
�� Septic system repair and upgrading
�� Non-construction costs such as legal, permitting and engineering expenses
�� Land
Estimates of ongoing annual costs (generally termed O&M costs) were developed to include:
�� Operational expenses (including labor, energy, chemicals, sludge disposal, etc.)
�� Maintenance activities for the collection system, treatment plant, and disposal facilities
�� Equipment replacement
�� Administrative functions such as billing

REGIONAL WASTEWATER MANAGEMENT PLAN | ESTIMATING CAPE-WIDE COSTS 15
SCENARIOS EVALUATEDTwo basic scenarios were evaluated, supplemented by numerous sensitiv-ity analyses. In the first scenario, it was assumed that significant efforts would be expended to achieve a Cape-wide solution based on watershed needs and not on individual town boundaries and interests. The second scenario was developed to illustrate a town-centric approach, much like is currently under way with CWMPs being formulated by individual towns, with limited consideration of watershed-wide issues.
The following assumptions were made for the two scenarios:
TABLE CWC-5: Cost Estimate Assumptions
PARAMETEROPTIMIZED WATERSHED-
BASED APPROACHINDIVIDUAL TOWN
APPROACH
Number of central treatment facilities 7 13
Percentage of parcels with on-site denitrification systems (current/future)
3.4%, 5.7% 3.4%, 5.0%
Percentage of parcels served by clus-ter/satellite systems (current/future)
4.6%, 7.6% 4.6%, 6.7%
Density of sewered area, feet per connection (current/future)
105, 108 115, 118
Number of disposal sites 10 13
Percentage of effluent disposal in nitrogen-sensitive watersheds (current/future)
30, 35 40, 45
Percentage of effluent disposed of in water supply Zone IIs (current/future)
15, 25 20, 30
Growth in nitrogen-sensitive water-sheds compared with non-sensitive watersheds
7.5%, 15%, 22.5% 15%, 30%, 45%
RESULTSThe cost estimates table summarizes the capital and O&M costs for the two scenarios.

ESTIMATING CAPE-WIDE COSTS | REGIONAL WASTEWATER MANAGEMENT PLAN16
CAPITAL COSTS
In the first scenario, the optimized Cape-wide approach would have a cap-ital cost of $4.2 billion to $5.1 billion, depending on the amount of future growth. Approximately 20% of each cost is associated with the repair or upgrading of Title 5 systems that would continue to serve 40% to 45% of the developed parcels.
In the second scenario, with a more localized approach, the capital costs are projected to be $4.6 billion to $6.2 billion, depending on the amount and location of growth. Compared with the first scenario, a smaller per-centage of the total cost is associated with Title 5 replacement, since fewer homes and businesses would be able to continue to use these systems.
These capital costs should not be thought of as one-time expenditures occurring over the next few years. The magnitude of the cost, and the need for an adaptive management approach to implementation, means that these costs will be incurred over an extended period of perhaps several decades. Similarly, the replacement or major repair of Title 5 systems would occur as systems fail, not all at once. Some of the repairs would be needed on systems that are expected to be eliminated by public infrastruc-ture, but fail before that infrastructure is implemented.
O&M COSTS
For the first scenario, the optimized Cape-wide solution, the O&M costs are projected to be $48 million to $53 million per year. For the local solu-tion that is the basis for the second scenario, O&M costs range from $57 to $81 million per year.
TYPICAL USER FEES
The cost estimates table shows projected user fees for the typical property owner. These estimates are derived by amortizing the capital cost over 30 years at 2% interest, adding the O&M costs and assuming that all devel-oped properties would be required to pay for the solutions.
Compared to the optimized Cape-wide scenario, the local approach has 12% higher user costs in the absence of growth and 27% higher user costs with 30% growth.

REGIONAL WASTEWATER MANAGEMENT PLAN | ESTIMATING CAPE-WIDE COSTS 17
FACTORS MOST INFLUENCING COSTThe cost estimates summarized in Table 1, and the supporting sensitivity analyses, demonstrate that several very important factors determine the costs of wastewater infrastructure on Cape Cod:
1. Extent of Sewers. Wastewater collection costs represent about 70% of the cost of constructing a system of sewers, treatment plants, and effluent disposal facilities. Costs can be reduced by focusing on the most densely developed areas, where the least amount of sewer pipe is needed to collect the wastewater flow requiring nitrogen control. One of the cost advantages of the watershed-based Cape-wide sce-nario is the assumed greater ability to find and serve those densely developed areas regardless of town boundaries.
2. Growth. Growth in nitrogen-sensitive watersheds carries a heavy price. While only a portion of the current nitrogen must be removed in those locations, all of the future nitrogen load must be mitigated. For the new wastewater infrastructure projected in this analysis, a 15% growth in wastewater flow translates to a 20% increase in capital cost. A 30% growth increases the capital cost by 40%. In the 35% growth case, if “smart-growth” policies can focus that new develop-ment in non-sensitive watersheds, with only 15% growth in sensitive watersheds, there is a significant savings in capital cost.
3. Location of Effluent Disposal Sites. Even highly treated effluent contains some nitrogen. If effluent is disposed of within nitrogen-sensitive watersheds, more septic systems in that watershed must be eliminated or fitted with denitrification systems to meet the TMDL, compared with effluent disposal in non-sensitive locations. If land availability dictates that effluent must be disposed of in water supply recharge areas, then a higher level of treatment is needed at sharply increased costs for both capital facilities and for O&M. The optimized Cape-wide solution modeled herein assumes less dependence on disposal sites in these sensitive areas, compared to a solution based on sites available in a single town.
4. Economies of Scale. It is well documented that wastewater treat-ment costs, on a per-gallon basis, decline as the size of the facility increases. Significant cost savings can accrue if Cape Cod wastewater is treated at expanded existing public facilities, with selected new facilities, compared with a larger number of smaller facilities.

ESTIMATING CAPE-WIDE COSTS | REGIONAL WASTEWATER MANAGEMENT PLAN18
AREAS OF FUTURE REFINEMENTWhile significant detailed analyses have occurred to produce this report, many subjects deserve additional consideration. The following questions should be answered:
1. Would costs be less if the watershed-based solution includes only six instead of seven central treatment plants? (Said another way: Is it best to supplement the existing five public facilities with one or two more?)
2. Sewer layouts that focus on sub-watersheds that are not subject to natural attenuation may allow less wastewater to be collected to meet TMDLs. Do such layouts have a lower density of development that would increase wastewater collection costs?
3. Would a more-detailed search for effluent disposal sites allow closer estimates of the percentage of effluent that must be disposed of in sensitive areas?
4. A significant fraction of the O&M costs estimated herein is asso-ciated with small-scale systems (on-site denitrification and cluster systems). Are the conditions that warrant small-scale solutions prevalent enough to justify the relatively high use portrayed in this analysis?
5. Is it realistic for smart-growth approaches to shelter sensitive watersheds from expensive wastewater solutions to the extent portrayed in the first scenario studied here?


CAPE COD REGIONAL WASTEWATER MANAGEMENT PLAN | ESTIMATING CAPE-WIDE COSTS MARCH 2013