cape cod canal highway bridges - united states army
TRANSCRIPT

Major Rehabilitation Evaluation Report And Environmental Assessment
Cape Cod Canal Highway Bridges Bourne, Massachusetts
US ARMY CORPS OF ENGINEERS New England District
March 2020

This Page Intentionally Left Blank
Reverse of Front Cover
Front Cover Photograph: Looking Southwest through
the Bourne Bridge to the Railroad Bridge at Buzzards Bay

Cape Cod Canal Federal Navigation Project
Bourne, Massachusetts
Major Rehabilitation Evaluation Report Cape Cod Canal Highway Bridges
March 2020

This Page Intentionally Left Blank
Reverse of Front Title Sheet

Cape Cod Canal Highway Bridges, MA Executive Summary Major Rehabilitation Evaluation Report ES-1 March 2020
Cape Cod Canal Highway Bridges Major Rehabilitation Evaluation Study
Executive Summary
This Major Rehabilitation Evaluation Report (MRER) presents the results of a study examining the relative merits of rehabilitating or replacing the two high-level highway bridges, the Bourne and Sagamore, which cross the Cape Cod Canal, and are part of the Cape Cod Canal Federal Navigation Project (FNP) operated and maintained by the U.S. Army Corps of Engineers (USACE), New England District (NAE). The USACE completes a MRER whenever infrastructure maintenance construction costs are expected to exceed $20 million and take more than two years of construction to complete. The MRER is a four-part evaluation: a structural engineering risk and reliability analysis of the current structures, cost engineering, economic analysis, and environmental evaluation of all feasible alternatives. The MRER is intended only as a means of determining the likely future course of action relative to rehabilitation or replacement. While conceptual plans were developed in order to facilitate the analysis no final determination has been made as to the final location or type of any new Canal crossings. Those would be determined in the next phase of the study and design effort. Project Purpose and History The Cape Cod Canal was constructed to provide coastwise shipping traffic with a more direct and safer route from northern New England ports to other areas on the U.S. eastern seaboard. The Canal allows vessels capable of navigating its 32-foot deep channel to avoid the much longer route around Cape Cod, or the even longer route around the islands and Nantucket Shoals. The Canal was originally constructed by the Boston, Cape Cod, and New York Canal Company (Canal Company) under a Charter issued by the Commonwealth of Massachusetts. The Charter required the Canal Company to build and operate two highway bridges and a railroad bridge over the Canal, which were built as low-level draw spans. Construction began in 1909 and the Canal was opened to marine traffic in 1914 and deepened to 25 feet in 1916. The Federal government took control of the Canal during World War I, along with other national transportation infrastructure, and operated the Canal through the 1920s.

Cape Cod Canal Highway Bridges, MA Executive Summary Major Rehabilitation Evaluation Report ES-2 March 2020
The Canal was acquired by the Federal Government in 1928, and the USACE immediately began a program to re-establish the 25-foot channel depth. Under the authority of the National Industrial Recovery Act of June 1933 the Public Works Administration authorized the construction of three bridges over the canal, two highway and one railroad, in keeping with the terms of the original state charter. Work began to widen the channel through the land cut, clearing seaward approaches of obstructions, and provide bank stabilization, lighting and other improvements to navigation. The original plans for Canal deepening called for construction of locks, however this was abandoned in favor of a larger sea level canal after severe icing showed that locks would be impractical. Work on the two new highway bridges and the railroad bridge began in December 1933, and the two highway bridges were completed in 1935. The Rivers and Harbors Act of August 30, 1935 authorized the USACE to assume maintenance of the three bridges. The 1935 Act also authorized further deepening and widening of the Canal to 32 feet MLW and 17.4 miles long, approach channels in Buzzards Bay 500 to 700 feet wide, with a bottom width of 540 feet in the land cut. That work was completed in 1940. Since that time the USACE has maintained the Canal, its channels, small boat basins, the railroad bridge and the two highway bridges at Federal expense. The bridge locations are shown in Figure ES-2. The Canal remains an important waterway for coastwise traffic. In 2017 there were more than 21,000 vessel transits of the Canal, of which about 7,500 were ships of more than 65 feet in length. Cargo tonnage for 2016 was about 6.9 million tons. Auto carriers, cruise ships and military vessels are among the largest ships that use the Canal today.
The two highway bridges are now 85 years old. Both bridges completed their first program of major rehabilitation in the early 1980s. As the bridges and their components continue to age, the cost of operation and maintenance and periodic rehabilitation slowly escalates. Both bridges are now scheduled to undergo their second major rehabilitation in 2025-2027 (Sagamore -
$156.3 million) and 2029-2031 (Bourne - $186.2 million). These actions are expected to have impacts on transportation on and off the Cape and the Islands. Most passenger and vehicle traffic to the Islands must cross the Canal bridges to access the ferry terminals on the south shore of the Cape. Lengthy lane closures and full bridge closures would be necessary during
Figure ES-2 Bridge Locations
Sagamore Bridge
Bourne Bridge
Federal Lands Shown in Red

Cape Cod Canal Highway Bridges, MA Executive Summary Major Rehabilitation Evaluation Report ES-3 March 2020
the 3 to 7 years of major rehabilitation efforts. Closures of the Canal to marine traffic would also be necessary during some bridge work for the superstructure and deck. These closures would result in costs due to traffic delays, congestion and re-routing, in addition to the costs for bridge rehabilitation itself. Further another major rehabilitation of both bridges would be expected in the 2065-2069 timeframe. The America’s Water Infrastructure Act of 2018, Title I – Water Resources Development, provides additional authority for USACE replacement of the Cape Cod Canal highway bridges. Section 1315 of the act, Corps of Engineers bridge repair program for New England evacuation routes, states the following:
Subject to the availability of appropriations, the Secretary may repair or replace, as necessary, any bridge owned and operated by the Secretary that is – (1) located in any of the States of Connecticut, Maine, Massachusetts, New Hampshire, Rhode Island, or Vermont; and (2) necessary for evacuation during an extreme weather event, as determined by the Secretary.
The Cape Cod Canal highway bridges are the only hurricane evacuation routes off Cape Cod and the Islands. They are the only highway bridges owned and operated by the USACE in New England and so are the only bridges to which this legislative language applies. Given the high cost of major rehabilitation, the impacts expected to result from such actions, and the fact that major rehabilitation would not address the issues with current and anticipated traffic volumes, modern day highway and bridge design standards, and the escalating costs of normal maintenance and repairs, the USACE is conducting this MRER. The MRER will examine Major Rehabilitation and alternatives for constructing new Canal crossings. Rehabilitation and the alternatives will be measured against a common Base Condition of continued maintenance and repair of the bridges without major rehabilitation to determine the most cost-effective, safe and reliable means of providing vehicular crossing of the Canal. The location of the Canal and its sea routes are shown in Figure ES-1. The Report The documents provided include this MRER, and an accompanying Environmental Assessment (EA), necessary to make a risk informed decision, and several appendices providing greater detail on certain topics. A number of additional technical supporting documents (TSD), while not a part of the report, are included in the record as reference material. All studies and reports were prepared to the level of analysis required for identifying and evaluating conceptual alternatives with the goal of determining whether major rehabilitation or bridge replacement would provide the most cost effective, safe, efficient, and reliable means of providing long-term vehicular crossings of the Canal. Sponsor and Jurisdiction There is no non-Federal sponsor for the Cape Cod Canal Federal Navigation Project as a whole or for the two highway bridges. The Canal and its appurtenant features were purchased from a private corporation by the Federal government. The modified deep draft portions of the present Canal, the bridges and appurtenant structures were constructed at full

Cape Cod Canal Highway Bridges, MA Executive Summary Major Rehabilitation Evaluation Report ES-4 March 2020
Federal expense without any non-Federal cost-sharing or partnership/cooperation agreements. Federal ownership of the two existing highway bridges covers the area between the shoreward abutments of both bridges as shown in Figure ES-3. Landward of the bridge abutments the Commonwealth (MassDOT) is the land owner and operates and maintains the highway approaches to the bridges.
Alternatives The future of the Canal highway bridges has been the subject of public debate for several decades with a variety of solutions proposed at public meetings and in the press. Beyond the Base Condition limited to continued maintenance and repair of the bridges as needs arise (see Figure ES-4), a number of alternatives were initially examined and screened to yield a final set of plans for detailed analysis. The state and many local stakeholders have sought replacement of the bridges with more modern spans designed in accordance with current highway bridge standards for several decades. With a series of major maintenance and rehabilitation actions projected as necessary in the next ten years to assure safety and performance of the bridges it was decided to examine longer term bridge performance, benefits, costs, and impacts in the context of continued rehabilitation v. replacement. USACE regulation and policy require such projects be evaluated over a 50 year period of analysis.
Figure ES-4 – Deck Section for Existing Bridges
The existing Sagamore and Bourne Bridges have four 10-foot wide vehicle lanes and one combined pedestrian/bicycle lane. There are no shoulders or medians. The left-hand lane in each direction doubles as an auxiliary lanes for entering and exiting traffic.
Figure ES-3

Cape Cod Canal Highway Bridges, MA Executive Summary Major Rehabilitation Evaluation Report ES-5 March 2020
Major rehabilitation of both bridges followed by additional maintenance, repair, and the next rehabilitation cycle was examined as an alternative. Additionally various methods for new crossings included new bridges, tunnels, causeways, low level v. high level bridges, and closure of the Canal and restoration of the pre-Canal road system. A list of these initial alternatives is provided in Table ES-1.
Table ES-1 – List of Alternatives Description Special Considerations
Base A
Continued Maintenance and Repairs (Fix as Fails) of Both Existing Bridges as Needed to Maintain Safety. All alternatives are measured against this plan.
This is the Federal Base Plan – the Without Project Condition
B A Program of Repairs and Major Rehabilitation for Both Bridges to Maintain Safety and Avoid Future Restrictions on Bridge Weight Postings
Major Rehabilitation of Each Bridge is Required about every 45 Years.
C Replacement of One or Both Highway Bridges with New Bridges Each Limited to Four Widened Lanes, with Shoulders, Medians, and Sidewalks
Each Old Bridge would Remain in Service until the New Bridge was Completed
D Replacement of One or Both Highway Bridges with New Bridges as in Plan C, but with Two Auxiliary Lanes Added
Each Old Bridge would Remain in Service until the New Bridge was Completed
E Replacement of One or Both Highway Bridges with New Bridges with Additional (More than Four) Non-Federally Funded Through Traffic Lanes, plus Two Auxiliary Lanes
Each Old Bridge would Remain in Service until the New Bridge was Completed
F Replacement of Both Highway Bridges with a Single New Bridge
Both Old Bridges would Remain in Service until the New Bridge was Completed
G Non-USACE Construction of a New Third Highway Bridge
This would be a State implemented Alternative.
H Replacement of One or Both Highway Bridges with Tunnels
Each Old Bridge would Remain in Service until the New Tunnel(s) were Completed
I Replacement of Both Bridges with a Single Tunnel
J Replacement of One or Both High Level Bridges with Low Level Draw Spans
Each Old Bridge would Remain in Service until the New Bridge was Completed
K Replacement of Both Bridges with Low Level Crossings on Causeways with Draw Spans for Shallow Draft Navigation
Both Old Bridges would Remain in Service until the New Causeway was Completed
L Deauthorization and Closure of the Cape Cod Canal, Filling the Land Cut, and Restoration of Surface Highways, Drainage and Estuarine Ecosystems
Includes Retention of the Shallow Draft Harbors at Each End of the Canal (East Boat Basin, Buttermilk Bay and Onset Bay Projects

Cape Cod Canal Highway Bridges, MA Executive Summary Major Rehabilitation Evaluation Report ES-6 March 2020
These initial alternatives were then evaluated and screened to reduce the list to only those plans which in terms of likely cost, impacts on the marine and land transportation systems, traffic and environmental impacts, and overall practicability would be implementable. Alternative A, the Base Condition for continued maintenance and repair, was carried forward so as to provide a baseline against which the other alternatives could be measured. Alternative B, major rehabilitation of each bridge was also carried forward so that the ability to avoid the cost of replacement by extending the life of the bridges could be examined. Alternatives (J, K and L) which involved closure of the Canal by filling, or construction of causeways or low-level fixed bridges or draw spans were eliminated from further consideration. Some of these plans would also constrain navigability or eliminate the Canal as a shallow draft waterway. These alternatives would degrade the efficiency and safety of coastwise navigation as some or all of the Canal’s marine traffic would be diverted to the Atlantic shipping routes to the south and east of the Cape, Islands, and Nantucket Shoals. Increased risk and cost to shipper, fishermen and boaters would all result from any of these three plans. Restricting or closing the Canal to navigation would be inconsistent with the Congressional authorization for the Canal as a deep-draft waterway and would require legislation to implement. Plans involving tunnels (Alternatives H and I) were eliminated from detailed analysis based on high costs and extensive impacts on the environment and land uses. An examination of recent tunnel projects elsewhere on the east coast indicated that tunnels as new Canal crossings, whether trenching for immersed tubes or much longer and deeper bored tubes, would carry at least twice the cost of new bridges. Construction of a new single bridge (Alternative F) or additional “third” bridge (Alternative G) were also eliminated based on cost and impact. A single bridge as replacement of the two existing bridges would require extensive relocation and realignment of the state and local road systems to change the approaches on both sides of the Canal to align with the new crossings. Extensive and costly real estate takings would be required. Impacts to natural resources including wetlands, agricultural lands, homes and businesses would occur. Overall a third or single bridge was not considered practicable. Provision of two new bridges to replace the existing bridges, but with the deck of each bridge limited to carrying two lanes in each direction (Alternative C - in other words without auxiliary lanes) was also eliminated from detailed consideration based on comments received during review of the draft report. While such a design is within the Corps existing authority to provide vehicular crossings over the Cape Cod Canal, a design that eliminates auxiliary lanes in this situation would not be consistent with modern highway design under FHWA design standards and MA DOT guidelines. Carrying this alternative forward for detailed consideration would therefore be contrary to best engineering practices. This alternative was therefore not carried forward for detailed study in the final report. Replacement of the two bridges with new bridges carrying additional through-traffic lanes (Alternative E) was also eliminated. While auxiliary lanes for acceleration/deceleration to improve safety and efficiency of entrance and access to the bridges from the local area could be included, additional through-traffic lanes would not be in accordance with the existing

Cape Cod Canal Highway Bridges, MA Executive Summary Major Rehabilitation Evaluation Report ES-7 March 2020
authority of the Federal government for the Cape Cod Canal navigation project. New Federal legislation would be required for any expansion of capacity to be implemented. Additional through traffic lanes would not generate appreciable benefits to traffic without extensive state improvements to region’s highway capacity on both side of the Canal, which would carry high costs and greater impact to the environment and the communities. Further the state has indicated it would not support state-funded additional through traffic lanes for the bridges as this would also require more extensive improvements, including adding lanes, to the regional highway network to yield any benefit. This plan was therefore eliminated from further consideration. Provision of two new bridges to replace the existing bridges with auxiliary lanes included on the bridge decks was carried forward for detailed analysis (Alternative D). Provision of two replacement bridges at Bourne and Sagamore, each with two through travel lanes and one auxiliary lane in each direction, is within the Corps existing authority to provide vehicular crossings over the Cape Cod Canal, and no additional authorizing legislation would be required. Provision of auxiliary lanes in addition to two through traffic lanes conforms to FHWA and MA DOT design guidelines and would address issues with traffic safety. Other than modifications and realignment of approach roads no more extensive state improvements to the regional highway system would be required. MassDOT’s plans for eliminating bottlenecks in the vicinity of the bridges with improvements to adjacent supporting state highway infrastructure are discussed in their 2019 Cape Cod Regional Transportation Study. Impacts from bridge and supporting state highway construction would be minimized by locating new bridges in close proximity to the existing bridges. This alternative was therefore carried forward for detailed analysis. Detailed Plans Three alternatives were carried forward for development and evaluation of detailed plans. These included Plan A – the Base Condition for continued maintenance and repair as needed; Plan B – major rehabilitation of both existing bridges followed by regular maintenance, repair and eventually another rehabilitation action with the 50-year period of analysis; and Plan D – Bridge Replacement for both bridges with 6 vehicle lanes.
Table ES-2 – List of Alternative Plans Carried Forward for Detailed Analysis Plan Description Special Considerations Base
A Continued Maintenance and Repairs to Both Existing Bridges as Needed to Maintain Safety (Fix as Fails)
This is the Federal Base Plan – the Without-Project Condition or the No Action Plan
B A Program of Repairs and Major Rehabilitation for Both Bridges to Maintain Safety and Avoid Future Restrictions on Bridge Weight Postings
Major Rehabilitation of Each Bridge is Required about every 45 Years.
D Replacement of One or Both Highway Bridges with New Bridges having Four Through-Traffic Lanes and Two Acceleration/Deceleration Lanes
Each Old Bridge would Remain in Service until the New Bridge was Completed

Cape Cod Canal Highway Bridges, MA Executive Summary Major Rehabilitation Evaluation Report ES-8 March 2020
Engineering Reliability An engineering analysis was performed to demonstrate the reliability of major components of the Bourne and Sagamore bridges. The major components of the bridges are the substructure (piers and abutments), the superstructure (largely the steel trusses supporting the deck and attaching to the substructure), and the deck itself. The results of this analysis forms the basis for the economic evaluation of the base condition versus plans for repair or replacement. A timeline of anticipated component failures was developed along with a schedule of likely repairs and costs. The history of bridge repairs and rehabilitation, condition ratings, performance/deterioration models, and fatigue and corrosion analyses are all used to establish projected reliability of the components. Reliability is defined as the probability that unsatisfactory performance will not occur. Reliability calculations were prepared for each component for each year of the 50-year analysis period. For this study, the limit state for unsatisfactory performance is defined by the physical condition of the bridge’s major components. This “limit state” is the point at which either unsatisfactory performance will occur or the engineering consequences will have some adverse economic impact. Unsatisfactory performance of one or more of these critical elements would lead to unsatisfactory performance of the entire bridge. In order to assess the engineering reliability of the bridges, a probabilistic hazard function was developed for each of the three critical elements. For each major component, a probability distribution was developed to predict deteriorating bridge element performance over a fifty-year service life. The consequences of unsatisfactory performance are presented on an event tree for each critical element under each economic alternative. Potential repair actions that would likely be necessary over the 50-year period of analysis are added to event trees, costs for each action are estimated, and statistical analysis is employed to weight those costs in terms of the likelihood of required actions to maintain bridge performance. Component failures and repair actions to address them will also have impacts on vehicular and marine traffic in terms of transportation delays. Lane and bridge closure results in transportation cost increases from delays and diversion of traffic. Total cost is the adjusted construction cost for repairs plus the transportation delay costs incurred by users of the bridges, all resulting from the reliability analysis. Analysis of Detailed Plans The Base Condition (Plan A) and the two plans carried forward for detailed analysis (Plan B – Major Rehabilitation and Plan D – Bridge Replacement) are discussed below. All costs and benefits are provided in FY20 price levels. Cost estimates prepared at this phase were developed at a conceptual level to compare rehabilitation vs. replacement and are not intended for budgeting purposes. Plan A – the Base Condition was developed using the engineering reliability analysis as described above. Regular maintenance would continue and repairs to bridge components would be made as needed. Possible repairs cover a wide range of possibilities from deck resurfacing to emergency bridge replacement due to failure of critical components. Increased transportation costs include the potential for future posting of weight restrictions on the bridges. The cost of making repairs on an as needed or emergency basis and the cost of

Cape Cod Canal Highway Bridges, MA Executive Summary Major Rehabilitation Evaluation Report ES-9 March 2020
transportation delays (traffic and marine) are summed to arrive at total costs for this plan. These costs are then evaluated using probabilistic simulations that are described below in the economic analysis. The results serve as the baseline for measuring the costs and benefits of the other detailed plans. Plan B – Major Rehabilitation of the existing bridges required a similar analysis of anticipated reliability and performance over time. Costs and schedules for the rehabilitation actions were identified along with those for post rehabilitation repairs and the next cycle of rehabilitation which would occur before the end of the 50-year period of analysis. The future costs were then reduced to their present worth. Major rehabilitation would also have impacts on transportation delays and costs. The construction cost for major rehabilitation and major repairs over the 50-year period of analysis is shown in Table ES-3. Bridge and lane closure days for the initial major rehabilitation action are shown in Table ES-4.
Table ES-3 Major Rehabilitation Costs – Bourne and Sagamore Bridges
Item/Component and FY 2020 Costs (October 2019 Price Levels)
Bourne Bridge 2029-2031
Sagamore Bridge 2025-2027
Total Major Rehabilitation Cost $186,171,000 $156,301,000 Maintenance – Complete Painting (2049/45) $26,827,000 $33,425,000 Third Major Rehabilitation Bourne 2069 – Sagamore 2065 $132,120,000 $110,940,000
Total Rehabilitation and Major Repairs $345,118,000 $300,666,000 Note: Updated March 2020 - Does not include annual maintenance and minor repairs
TABLE ES-4 Anticipated Traffic Management for Lane and Bridge Closures
With Major Rehabilitation 2025-2031 Major Rehabilitation Activity Bourne Bridge Sagamore Bridge Total Days of Lane Closures 480 380 Total Days of Full Bridge Closures 180 130
Plan D - Bridge Replacement includes higher up-front costs for construction, but has far lower costs for maintenance and repair over the 50-year period of analysis. The bridge replacements also would have far fewer impacts on transportation costs as maintenance, repair and future rehabilitation would be limited. The existing bridges would remain in service while the new bridges were built and the new bridge construction would have minimal impacts on adjacent roads. There would be some temporary impacts to marine transportation through the Canal during new bridge construction, but less impacts over time. State construction of realigned approach roads would have an impact on land transportation costs. The conceptual design chosen for evaluation of new bridges at this phase of the analysis used a cable-stay design for both replacement bridges. This conceptual design included consideration of sea level change, reduced deck grades, wider traffic lanes, shoulders,

Cape Cod Canal Highway Bridges, MA Executive Summary Major Rehabilitation Evaluation Report ES-10 March 2020
medians, and bicycle/pedestrian walkways. The location and alignment of any new bridges would be determined during the next phase of investigation and design. For this level of analysis it was assumed that the new bridges would be built adjacent to the existing bridges. The area for potential siting for the replacement bridges is shown in Figure ES-5.
Plan D also consists of replacement of the two highway bridges each with six lanes (two through travel lanes plus one auxiliary lane in each direction). The additional auxiliary lanes for exit and entrance would address traffic safety concerns by allowing for two unobstructed through travel lanes each way. Vehicles in the right-hand travel lane in each direction would not be slowed by merging and decelerating traffic on the bridges. This plan also considered sea level rise, reduced bridge deck grades, and other improved design elements including shoulders, medians, and pedestrian/bicycle lanes separated from the vehicle lanes. The estimated cost for each bridge under Plan D is shown below in Table ES-5.
Table ES-5 Project Costs – Bridge Replacement Alternatives – Plan D
Cost Category ($000s) FY 2020 Price Levels Bourne Bridge Sagamore Bridge
Construction Cost $355,478 $232,630 Contingency Cost (44%) $156,410 $102,357 Planning, Engineering & Design $40,951 $27,321 Construction Management $14,199 $9,594 Total Construction $567,038 $371,902 Cultural Resource Preservation $29,450 $19,241 Lands, Easements, ROW $7,645 $7,618 Utility Relocations $26,640 $29,520 Total Federal Project Cost $630,773 $428,281
Figure ES-5 – Concept Level Siting Areas for Replacement Bridges

Cape Cod Canal Highway Bridges, MA Executive Summary Major Rehabilitation Evaluation Report ES-11 March 2020
Table ES-5 (Continued) – Costs Bourne Bridge Sagamore Bridge Associated Non-Federal Highway/Roadway Modifications
State-Funded Bridge Approaches $90,991 $57,802 Anticipated Future Major Repair Actions for New Bridges
(Bourne/Sagamore) Major Repairs #1 (2054/2049) $7,911 $7,906 Major Repairs #2 (None/2069) - - - $7,906 Total Project Cost (50 Years) $729,675 $501,895 Note: Estimate Revised March 2020
Economic Analysis As part of this MRER, an economic evaluation was performed to analyze the costs and benefits of the Base Condition and compare it to alternatives, including major rehabilitation and bridge replacement. Costs and benefits are in FY20 price levels. The Base Condition refers to a baseline of continued regular inspections and standard maintenance construction on the bridges. The economic analysis is extended over a 50-year period using 2020 as the base year and the Federal Discount Rate currently set at 2.75 percent for Federal Fiscal Year 2020. Below is a brief summary of the findings of the economic analysis.
The economic analysis focused on the base plan and the two detailed plans described above: 1. Alternative A: Base Condition (Without-Project) 2. Alternative B: Major Rehabilitation of both Existing Bridges 3. Alternative D: Replacement with Two 4-Lane Bridges with Auxiliary on/off Lanes
Annual benefits considered for each alternative include the reduction in emergency repair spending, the decrease in traffic delays, and changes in cost to waterway navigation. The annual benefit of each alternative is then compared to its respective cost. An alternative is considered economically justified if it maximizes net annual benefits and its benefit cost ratio (annual benefit divided by annual cost) is greater than one.
The analysis is performed using a risk based approach to compare costs and benefits of each alternative to the Base Condition. Reliability functions from the engineering event trees are utilized to simulate possible component failures and associated repair costs. The three engineering components that could experience failure are the bridge deck, substructure, and superstructure. This analysis is evaluated over a 50-year period using Monte Carlo Simulation to determine the likely long-term costs of the future Base Condition without the project and the future condition with each alternative. The model was approved for single-use by the USACE Planning Center of Expertise for Inland Navigation and Risk Informed Economics Division in July 2018. The memo documenting this approval pursuant to EC 1105-2-412 is attached as an addendum to Appendix D - Economics.

Cape Cod Canal Highway Bridges, MA Executive Summary Major Rehabilitation Evaluation Report ES-12 March 2020
The overall cost of each alternative includes several elements; the cost of the repair itself, the economic cost to vessels that cannot use the canal (navigation costs), operation & maintenance costs, and the change in value of time incurred by drivers in traffic delays (travel costs) during lane and bridge closures for repairs or construction phases.
The value of time is determined using USACE regulation (ER 1105-2-100). Traffic data was modeled by TrafInfo; a transportation consulting company familiar with the Massachusetts Department of Transportation (MassDOT) data. TrafInfo provided Cape Cod traffic study data and forecasts. This traffic data was used to determine the total hours of traffic delay incurred during construction for all travelers crossing the bridges. A monetary value was attributed to these lost productive hours using the average hourly household median income of the surrounding towns as sourced from the US Census Bureau.
A comparison of mean annual costs for the base condition and two detailed plans is provided in Table ES-6 below. These costs represent the economic impacts of unscheduled component failures and unscheduled maintenance events that will occur over the 50 year period of analysis. Maintaining the bridges in the current, base condition would result in annual repair and transportation costs of $123.9 million and $65.2 million for the Sagamore and Bourne Bridges respectively. Under the Major Rehabilitation scenario, those expenses would decrease to $8.8 million for the Sagamore Bridge and $6.1 million for the Bourne Bridge. Replacing the bridges reduces the annual costs for the Sagamore Bridge even further to approximately $4.5 million. Costs for the Bourne Bridge increase slightly to $7 million.
Table ES-6
Mean Annual Costs for All Plans Results from Monte Carlo Simulations ($000)
FY2020 Price Levels
Repair Cost
Travel Cost
Navigation Cost
O&M Cost Total
Plan A – Base Condition Sagamore 2,800 120,700 1 400 123,900 Bourne 3,200 61,700 1 300 65,200 Plan B – Major Rehabilitation Sagamore 300 0.6 8,000 400 8,800 Bourne 400 0.6 5,400 300 6,100 Plan D – Bridge Replacement – 4 Lanes plus Auxiliary Lanes Sagamore 300 0.1 4,000 200 4,500 Bourne 500 0.2 6,300 200 7,000
Tables ES-7 provides summary detail of all annual costs, benefits, and benefit to cost ratios (BCRs) for the major rehabilitation and bridge replacement plans.

Cape Cod Canal Highway Bridges, MA Executive Summary Major Rehabilitation Evaluation Report ES-13 March 2020
Table ES-7 – Comparison of Rehabilitation and Replacement Plans FY 2020 Price Levels ($000s) Revised February 2020
Plan B - Major Rehabilitation
Plan D – Bridge Replacement
Sagamore Bridge Total Federal First Cost $156,300 $428,300 Future Federal OMR&R $144,400 $15,800 State-Funded Approaches - - - $57,800 Travel Delay Costs $1,281,000 $92,800 Total – Sagamore $1,581,700 $594,700 Total Cost Discounted + IDC $969,500 $469,000 Total Annual Cost – 2-3/4% $35,600 $17,400 Discounted Cost – Base Plan $123,900 $123,900 Discounted Cost – Plan B & D $8,800 $4,400 Total Annual Benefits $115,100 $119,500 Annual Net Benefits $79,200 $102,100 Benefit-Cost Ratio 3.2 6.9
Bourne Bridge Total Federal First Cost $186,200 $630,800 Future Federal OMR&R $158,900 $7,900 State-Funded Approaches - - - $91,000 Travel Delay Costs $948,300 $22,400 Total – Bourne $1,293,500 $752,100 Total Cost Discounted + IDC $731,100 $574,400 Total Annual Cost – 2-3/4% $27,100 $21,300 Discounted Cost – Base Plan $65,200 $65,200 Discounted Cost – Plan B & D $6,100 $7,000 Total Annual Benefits $59,100 $58,300 Annual Net Benefits $32,000 $37,000 Benefit-Cost Ratio 2.2 2.7
Based on Net Benefits, the rank of alternatives (with 1 being the most desirable) is:
1. Alternative D: Replacement with two 4-lane bridges with auxiliary on/off lanes 2. Alternative B: Major rehabilitation of existing bridges 3. Alternative A: Base Condition - continue to maintain the bridges with regularly
scheduled maintenance and make emergency funding available when there is a component failure to repair the failure.
The economic analysis suggests that fixing the current bridges as components deteriorate will lead to greatly increased costs, particularly costs for travelers delayed in traffic.

Cape Cod Canal Highway Bridges, MA Executive Summary Major Rehabilitation Evaluation Report ES-14 March 2020
Major rehabilitation of the existing bridges demonstrated positive net benefits and a benefit-cost-ratio (BCR) of 3.2 for the Sagamore Bridge and 2.2 for the Bourne Bridge. One advantage of the rehabilitation is a lower initial construction cost for the project when compared to replacing the bridges. The disadvantages are the impact it will have on traffic patterns during the time of construction due to lane and full bridge closures as well as the bridges not being brought up to current engineering standards and regulations.
The alternative for replacement bridges (two 4-lane bridges with auxiliary lanes) had higher net benefits and BCRs than the rehabilitation scenario. One disadvantage of the new bridges is the high initial cost of construction. On the other hand, advantages of the replacement bridges are minimal disturbances to traffic during construction and replacing the aging infrastructure with bridges at current engineering standards and regulations. Bridges with auxiliary lanes would also result in less traffic delays during minor repairs and inspections as two lanes in each direction could remain open in many circumstances.
The analysis suggests that the two replacement bridges are more economically justifiable given the lower costs. However, it is important to note that this analysis was performed under the assumption that the infrastructure and surrounding roadways to the bridges remain in their current conditions and are not upgraded by the Commonwealth of Massachusetts. If the state choses to improve the road network surrounding the bridges, particularly near the Bourne Rotary, then bridge replacement will provide additional benefits to improved travel time that could increase the net benefits and BCRs. The bridges with four through traffic lanes and two auxiliary lanes can also reduce the impact to the traveling public when performing future maintenance on the bridges. Environmental Impact Analysis Environmental conditions and impacts have been evaluated in the Environmental Assessment based on a conceptual bridge design. Resources and potential impacts will be more fully defined and analyzed when the project moves to the design phase. Considerations examined included land uses, geography and geology, climate, air quality, contaminants wetlands, water resources, water quality, terrestrial and marine wildlife, fisheries, threatened and endangered species, environmental justice, and other areas of concern. Removal of the existing bridge once any new bridges are placed in service was also considered with respect to impacts from demolition. Indirect impacts such as local traffic conditions, induced development potential, and population changes were considered. Cumulative impacts from state highway improvement and other proposed development projects were also considered. This study and preparation of the documents has followed USACE regulations and policy for MRERs and the NEPA process. Five agencies were invited to participate as cooperating agencies for the MRER: MassDOT, Federal Highway Administration (FHWA), U.S. Coast Guard, Environmental Protection Agency (EPA), and National Marine Fisheries Service (NMFS), and all agencies accepted. Representatives from Federal, state, and local agencies, and federally-recognized Tribes with interest or jurisdiction in the proposed project were invited to a scoping meeting and coordinated site visit on March 19, 2019.

Cape Cod Canal Highway Bridges, MA Executive Summary Major Rehabilitation Evaluation Report ES-15 March 2020
Early coordination was also conducted with several resource agencies including: U.S. Fish and Wildlife Service, National Marine Fisheries Services, MA Office of Coastal Zone Management, and MA Historic Preservation Office to discuss project plan formulation and consider potential impacts to specific resources and agency comments and concerns. Further consultations will continue during Phase II of the project with these and additional agencies and interests. Public involvement at this stage consists of public meetings held at the beginning and end of the study process, receipt and consideration of public input throughout the process, and public review and comment on the draft MRER and EA before reports are finalized and any decisions are made. During the next phase of investigations additional studies will be performed in a more focused effort as plans for bridge location and alignment, and associated state sponsored improvements are more fully designed and considered. Cultural Resource Concerns Section 106 of the National Historic Preservation Act (NHPA) requires that a federal agency take into account the effects of an undertaking on historic properties. In the study area, there are three historic period resources, the Bourne and Sagamore bridges, and the canal. There are no identified archaeological resources in the vicinity of the Sagamore Bridge study area. There are two archaeological sites within the vicinity of the Bourne Bridge. The Base Condition and Major Rehabilitation would have little to no impact on cultural resources. Impacts from construction of replacement bridges will depend on final locations and their proximity to any known resources or resources identified during the next phase of the project. Additional cultural resource survey will be required to determine the extent and nature of any impacts and the appropriate response. Construction of new bridges will include demolition and removal of the existing bridges. Compliance with the NHPA will require preparation and execution of a Memorandum of Agreement to avoid, minimize, or mitigate effects to historic properties. Cultural resources coordination was initiated with the State Historic Preservation Officer (SHPO), Tribal Historic Preservation Officers (THPOs) of the Mashpee Wampanoag and the Wampanoag Tribe of Gay Head (Aquinnah), and the Historic Commissions of the Towns of Bourne and Sandwich. Additional consultation with these agencies on the location of the bridges and the bridge design would be required during the next phase of the project. Real Estate Considerations
Neither the Base Condition nor Major Rehabilitation would require additional lands, easements or rights of way. Bridge Replacement would require acquisition of new lands by the Federal government for the new bridge footprints. The state may also need to acquire new lands for modified approach and connecting roads. While final location and alignment of the two new bridges would be determined during the next phase of investigation and design, for the purposes of this analysis it was assumed that the new bridges would each be located next to and inland of the existing bridges. This location would minimize land takings as existing

Cape Cod Canal Highway Bridges, MA Executive Summary Major Rehabilitation Evaluation Report ES-16 March 2020
Federal and state properties would be used for much of the footprints and local connecting and state approach roads would require minimal realignment. At this level of analysis it was estimated that replacement of the Bourne Bridge would require acquisition of about 11 acres of land and their improvements and relocation of businesses, all totaling about $7.6 million. A new Sagamore Bridge would require about 4.5 acres of new land plus improvements and relocations also totaling about $7.6 million. Major Rehabilitation and Bridge Replacement would require utility relocations including electrical power and telecommunications cables and several natural gas transmission lines, all of which are beneath the current bridge decks. Full deck replacement and some major steel repairs would require removal of these utilities. Utility cables could be moved to the new bridges once they were completed. Gas lines crossing the bridges would need to be relocated. Utility relocation costs are estimated to vary from $56.9 million for replacement to $25.5 million for rehabilitation. These utility costs were based on the number of crossings and similar replacement costs on recent projects in the region. Discussions with utility owners and operators have begun and will continue into and throughout the design phase of the project. As final bridge location, alignment, type, and need for state connecting road improvements become better defined utility needs will also refined. Specific utility costs, and the allocation of those costs between the utility owners and the Government, will be developed during the design phase in consultation with the utility owners and the state. Other Social Effects The Bourne and Sagamore bridges provide the only vehicular access to the 15 towns of Cape Cod with nearly 215,000 year-round residents and a population increase of up to 300 percent during the height of the summer tourist season between Memorial Day and Labor Day. The bridges also provide access to the eight offshore island municipalities through the ferry terminals located on the south shore of Cape Cod. Traffic volumes have increased exponentially since the 1930’s leading to significantly increased loading on the bridges with the result of increasingly frequent maintenance and repair events. Frequent lane closures, coupled with the lack of auxiliary lanes, mean that for much of the time there is only one through traffic lane in each direction on both bridges. Backups for travelers waiting to cross the bridges commonly stretch for several miles, particularly on late spring through early fall weekends when vacationers crowd the Cape and Islands. The extent of traffic delays is a source of frustration for many residents and visitors, especially as summer tourism brings significant income to area residents and businesses. Conclusions The objective of the MRER is to identify the plans that most efficiently and effectively meets the long-term requirement for the Federal Government to provide, operate, maintain, repair, rehabilitate, and replace (OMRR&R) crossings of the Cape Cod Canal for vehicles, pedestrians and other surface traffic. Engineering reliability of the structures, when analyzed together with cost and economic benefits form the basis of the analysis and determine the recommended plan.

Cape Cod Canal Highway Bridges, MA Executive Summary Major Rehabilitation Evaluation Report ES-17 March 2020
In conducting this study the following tasks were performed: (i) the deficiencies of the components of the two existing highway bridges (Sagamore and Bourne Bridges) were identified, (ii) their reliability indices were estimated, (iii) impacts to road traffic and marine traffic from component failure were estimated, (iv) the increases in reliability based on each improvement alternative were estimated, (v) economic benefits were estimated, and (vi) costs to repair deficient components or replace the bridges were estimated. All of these tasks provided inputs to the economic evaluation of alternatives. Increases in reliability, with respect to the costs to attain them, in order to continue safe and reliable navigation and highway access, was the ultimate objective of this evaluation. The cost estimates presented in this report were developed based on concept level plans and are not adequate for use in budgeting for implementation. Cost certification at this phase is conditional due to the limited scope of the analysis. The next phase of the project will include more detailed investigations, final bridge locations and designs, and more detailed and refined cost estimates. The cost of repairs or rehabilitation are only part of the analysis. The total economic impact to travelers from lane, bridge and waterway closures during the major rehabilitation of the Sagamore Bridge is estimated to be $782.6 million and $536.7 million (discounted delay cost) for the Bourne Bridge Rehabilitation project. Total transportation delay costs over the 50-year period with the major rehabilitation plan (B) would be $1,281.3 million for the Sagamore and $948.4 million for the Bourne. In contrast the 50-year costs for construction for the rehabilitation plan are $300.7 million for the Sagamore and $501.9 million for the Bourne. The bulk of the cost impact for the rehabilitation plan will fall on the travelling public, about 83% of the cost for the Sagamore and 78% of the cost for the Bourne. The bridge replacement alternative (Plan D) had higher net benefits and a higher BCR than the major rehabilitation plan. The disadvantage of the replacement bridges is the high initial cost of construction. The advantages of the replacement bridges are minimal disturbances to traffic during construction and replacing the aging infrastructure with bridges that meet modern engineering standards and regulations. The new bridges would not require the level of frequent, costly, and escalating maintenance and repairs, or entail the high level of disruption to traffic and the economy of the region. It is important to note that this analysis was performed under the assumption that the road infrastructure surrounding the bridges are in their current conditions and are not upgraded by the Commonwealth of Massachusetts. If the state choses to improve the road network surrounding the bridges as suggested in the draft Cape Cod Transportation Study, particularly near the Bourne Rotary and the improvements to Route 6, then the replacement bridges will provide additional efficiency benefits of improved travel time by allowing the left-hand travel lanes to be fully used by through traffic, since exiting and entering traffic would use the auxiliary lanes. Shifting the exiting and entering traffic out of the right-hand through traffic lanes will also have benefits to traffic safety as conflicts between fast-moving and slow moving vehicles will be minimized. New replacement bridges would have significantly higher reliability and lower probability of failure than the existing bridges would have moving forward with the rehabilitation plan. The distribution of costs for the replacement is nearly the reverse of that for the rehabilitation

Cape Cod Canal Highway Bridges, MA Executive Summary Major Rehabilitation Evaluation Report ES-18 March 2020
plans. Transportation delay costs to the public and users of the Canal with bridge replacement account for only about 16% of total costs for the Sagamore and 3% of total costs for the Bourne. This compares to 81% and 73%, respectively for each bridge under the rehabilitation plan. Moving from rehabilitation to replacement shifts the cost burden from the public (delay costs), to the Government (construction and repair costs). The calculations for cost distribution are provided in Table ES-8.
Table ES-8 – Cost Distribution Comparison Plan B Bridge Rehabilitation v. Plan D Bridge Replacement
FY20 Price Levels Revised Feb 2020 Rehabilitation Replacement
Sagamore Bridge Repair/Replace Costs $300,700 $501,900 Delay Costs $1,281,300 $92,800 Total Costs $1,582,000 $594,700 Repair as % 19.0% 84.4% Delay as % 81.0% 15.6%
Bourne Bridge Repair/Replace Costs $345,100 $729,700 Delay Costs $948,400 $22,400 Total Costs $1,293,500 $752,100 Repair as % 26.7% 97.0% Delay as % 73.3% 3.0%
The two existing bridges are now coming up on their second major rehabilitation. The rehabilitation of the Sagamore Bridge would be scheduled for 2025-2027 and cost about $156.3 million (FY20), or $188.8 fully funded (through the midpoint of construction). The rehabilitation work on the Bourne Bridge would be carried out in 2029-2031 at a cost of about $186.2 million (FY20), or a fully-funded cost of about $252.1 million. During these periods the work would require a total of about 760 days (or more than 2 years) of lane closures and 310 days (or more than 10 months) of full bridge closures, with consequences to traffic and the local economy.
A program of critical repairs may be able to delay the full rehabilitation starts by a several years, but if bridge replacement is approved any delay in implementing that work would require rehabilitation to proceed. In other words, any appreciable delay in decision-making or funding could force the Government to pursue major rehabilitation instead of bridge replacement in order to maintain reliability and safety of vehicular traffic over the Canal in the near term.
The Commonwealth of Massachusetts would be a necessary partner in any rehabilitation or replacement project. However the State’s principal role would involve redesign and relocation of connecting highways and roadways if bridge replacement is pursued. The State has made a capital investment of $10 million dollars to begin environmental coordination and early design work for adjacent infrastructure and new bridge approaches in 2020. In addition, the Commonwealth has proposed more than $350 million in future infrastructure funds in

Cape Cod Canal Highway Bridges, MA Executive Summary Major Rehabilitation Evaluation Report ES-19 March 2020
their 2019 Transportation Bond Bill for work in the coming years. The work needed includes study, design and construction of transportation infrastructure associated with the approaches to the Bourne and Sagamore Bridge as a part of the Cape Cod Bridges Improvement Program within the Act Authorizing and Accelerating Transportation Investment, Section 2A, 6121-2147. Any delays in Federal funding could put that commitment and associated work in question. There is a level of urgency in Federal and State decision making concerning the recommendation and funding to implement the design and construction of new bridges. Approval of this report and its recommendation for two replacement bridges to include auxiliary lanes (Plan D) would allow the USACE to proceed with the next phase of the process – the identification of the final replacement bridge location, alignment, size and type, complete Federal, State and local regulatory coordination, including conclusion of the NEPA process, and initiate final design. The Recommended Plan This study has determined that providing two new highway bridges would be the most cost effective means of providing safe and reliable crossings. The existing bridges are 85 years old and both are functionally obsolete. The Bourne Bridge is also classified as structurally deficient under current Federal Highway Administration guidance. Conceptual designs for two replacement bridges have been developed to facilitate this analysis and recommendation. Specific design features would be developed in the following phase of implementing this project. For purposes of this level of analysis it was assumed that a new high level fixed span bridge would be constructed immediately adjacent to each of the two existing highway bridges so as to minimize the modifications needed to the connecting roadways on both the mainland and the Cape. The new highway bridges would be designed to include access for both pedestrians and other non-vehicular traffic such as bicycles. To improve traffic safety and through traffic reliability each bridge would include one acceleration/deceleration lane and two through traffic lanes in each direction, for a total of six vehicular lanes on each bridge. The two existing bridges would remain in in operation until the new bridges are opened to traffic. The fate of the two existing bridges will be determined in the detailed design phase, but for now it is assumed that they would be closed to traffic and demolished once the new bridges are opened. The USACE would need to determine the scrap value of the existing bridges during the detailed design phase. The recommended plan moving into the next phase of design analysis is replacement of each of the two highway bridges crossing the Cape Cod Canal FNP at Bourne and Sagamore. Final design would conform to AASHTO and MassDOT design standards current at that time. Subject to additional analysis during the next phase of the project the new bridges will have two through travel lanes and one acceleration/deceleration lane in each direction. The conceptual design evaluated at this stage of study consists of the following: 1) Construction of two new highway bridges each located parallel to and immediately
inshore of the existing Bourne and Sagamore Bridges. 2) Each new bridge would include 4 through travel lanes (2 each direction 12 feet wide).

Cape Cod Canal Highway Bridges, MA Executive Summary Major Rehabilitation Evaluation Report ES-20 March 2020
3) Each new bridge would have two auxiliary lanes for entrance and exit, one in each direction, each 12 feet wide.
4) Each new bridge would have a minimum vertical clearance for navigation of 135 feet above mean high water over the width of the navigation channel, increased 7.8 feet for anticipated sea level change (high rate).
5) Each new bridge would have deck and approach grades of no steeper than 4%. 6) Each new bridge would include one non-vehicular lane for pedestrian and bicycle traffic
with separation between the non-vehicular lane and the vehicle traffic lanes. 7) Each new bridge would include a shoulder on the vehicle deck, 10 feet wide, in each
direction. 8) Each new bridge would include a median with barriers to separate northbound and
southbound vehicular traffic. 9) A conceptual cable-stay design was used for this analysis, but actual bridge type and
other design parameters will be developed in the next phase. 10) The existing bridges would remain in service (operated, maintained and repaired as
needed) until the new bridges are opened to traffic. 11) The existing bridges would be demolished upon opening of the new bridges. The steel
components would be scrapped. The method of demolition and removal would be determined during the next phase.
12) Licenses and easements for placing new electric transmission and telecommunications cables on the new bridges would need to be proposed by the utility owners and negotiated. Placement of new gas lines would not be allowed on the new bridges.
13) Detailed design features such as lighting, fire suppression, suicide prevention barriers, signage and pavement markings, traffic barriers and controls, etc., would be determined during the design phase of the project.
The concept-level cross section used in this analysis is shown in Figure ES-6.
Figure ES-6 – Deck Sections for Conceptual Replacement Bridge Design
The concept for replacement bridges used in this analysis would have two through travel lanes and one auxiliary entrance/exit lane in each direction. Shoulders would also be provided in each direction. A non-vehicle lane for pedestrians and bicycles would be included as would a median to separate directions of traffic.

Cape Cod Canal Highway Bridges, MA Executive Summary Major Rehabilitation Evaluation Report ES-21 March 2020
Recommendation
The USACE has determined that there is sufficient justification for pursuing a program of bridge replacement for both the Bourne and Sagamore highway bridges over the Cape Cod Canal, Massachusetts Federal Navigation Project. An evaluation of costs and benefits indicates that the most cost effective long-term means of providing vehicular crossing of the Canal is replacement of both bridges with new bridges that conform to modern highway design standards. This recommendation considers both safety and reliability of the bridges and the waterway they cross for both surface vehicular and marine transportation. The next phase of the investigation will determine final bridge type and other detailed design parameters, with such further modifications thereto as in the discretion of the Chief of Engineers may be advisable. The recommendations contained in this report reflect the information available at this time and current USACE Departmental policies governing formulation of individual projects. They do not reflect program and budgeting priorities inherent in the formulation of a national Civil Works construction program nor the perspective of higher review levels within the Executive Branch. Consequently, the recommendations may be modified before they are approved for implementation funding.
Figure ES-7 – Looking Northeast at the Bourne (foreground) and Sagamore Highway Bridges

Cape Cod Canal Highway Bridges, MA Executive Summary Major Rehabilitation Evaluation Report ES-22 March 2020
This Page Intentionally Left Blank

Major Rehabilitation Evaluation Report And Environmental Assessment
Cape Cod Canal Highway Bridges Bourne, Massachusetts
US ARMY CORPS OF ENGINEERS New England District
March 2020

This Page Intentionally Left Blank
Reverse of Front Cover
Front Cover Photograph: Looking Southwest through
the Bourne Bridge to the Railroad Bridge at Buzzards Bay
DEPARTMENT OF THE ARMY US ARMY CORPS OF ENGINEERS
NEW ENGLAND DISTRICT 696 VIRGINIA ROAD
CONCORD MA 01742-2751
CENAE-PP-C 12 March 2020
MEMORANDUM FOR Commander, U.S. Army Corps of Engineers, HQUSACE (CECW-EC/Dr. Christine Altendorf), 441 G Street NW, Washington DC 20314
SUBJECT: Cape Cod Canal Federal Navigation Project, Bourne, MA, Final Major Rehabilitation Evaluation Report and Final Environmental Assessment for Highway Bridges Replacement
REFERENCE (all enclosed)
a. Policy Guidance Memorandum
b. District Quality Control Certification
c. Agency Technical Review Certification and Report
d. Final Independent External Peer Review (IEPR) Report for Cape Cod Canal Highway Bridges Major Rehabilitation Evaluation Report, Cape Cod Canal Federal Navigation Project, Bourne, Massachusetts
e. Legal Certification of the Cape Cod Canal Highway Bridges Final Environmental Assessment — Phase I
f. USAGE Cost Engineering Center of Expertise (CX), Conditional Cost Certification
1. The U.S. Army Corps of Engineers (USACE), New England District, has conducted a multi-year Major Rehabilitation Evaluation Study of the Bourne and Sagamore highway bridges spanning the Cape Cod Canal. The USACE has completed the Final Major Rehabilitation Evaluation Report (MRER) and Environmental Assessment (EA) and is submitting the documents for approval. The MRER provides the basis of decision making for USACE to determine the most cost-effective, safe alternative for critical public transportation access across the Cape Cod Canal. The EA was prepared to analyze the potential environmental effects associated with the project. The report recommends replacement of the two highway bridges as the most long-term economic means of providing vehicular crossings of the waterway.
2. The major rehabilitation study analyzed alternatives to either rehabilitate or replace the existing Bourne and Sagamore highway bridges. This letter notifies you of our completion of the Final MRER and EA, including the incorporation of all District Quality Control (DQC), Agency Technical Review (ATR), and an Independent External Peer Review (IEPR) Type I, Public Review, and Vertical Team Policy & Guidance review comments.

CENAE-PP-C SUBJECT: Cape Cod Canal Federal Navigation Project, Bourne, MA, Final Major Rehabilitation Evaluation Report and Final Environmental Assessment for Highway Bridges Replacement
3. The preferred alternative for this project proposes the replacement of both highway bridges with new bridges (consisting of 4 through traffic lanes and 2 auxiliary lanes) to be constructed adjacent to the existing bridges. Design of the new highway bridges will incorporate modern federal highway safety standards such as increased travel lane widths, pedestrian and bicycle lanes with vehicle lanes separation barrier, medians between the two directions of vehicular travel, and shoulders to accommodate vehicle breakdowns, and auxiliary lanes to provide safe vehicle merging for entrance and exit to adjacent interchanges. To minimize impacts to connecting roads, other non-Federal highways, and local roadways, each new bridge would be placed along approximately the same alignment as the existing bridges. The current bridges would remain open and continue to be inspected and maintained in a safe and reliable state while construction of the new bridges is underway. The current bridges would be dismantled and removed once the new bridges have been opened to traffic. The actual type, size, and location of the proposed new bridges, including additional NEPA requirements, the designer of record and agency undertaking the construction, will be determined in the next phase of the Cape Cod Canal Highway Bridges Replacement Project.
4. A copy of the MRER / EA and its appendices is contained on this CD. Please feel free to call me with any questions or comments you may have on this project at 978-318-8220. Additional information can be obtained from the Project Manager, Mr. Craig Martin, at (978) 318-8638 or Craig.A.Martin©usace.armv.mil
Enclosures WILLIAM M. CONDE COL, EN Commanding
Copy Furnished:
U.S. Army Corps of Engineers, North Atlantic Division ATTN: Mr. Joseph Forcina (CENAD-PD-C) 302 General Lee Avenue Fort Hamilton Military Community Brooklyn, New York 11252-6700

Cape Cod Canal Federal Navigation Project
Bourne, Massachusetts
Major Rehabilitation Evaluation Report Cape Cod Canal Highway Bridges
March 2020

This Page Intentionally Left Blank
Reverse of Front Title Sheet

Cape Cod Canal Highway Bridges, MA Executive Summary Major Rehabilitation Evaluation Report ES-1 March 2020
Cape Cod Canal Highway Bridges Major Rehabilitation Evaluation Study
Executive Summary
This Major Rehabilitation Evaluation Report (MRER) presents the results of a study examining the relative merits of rehabilitating or replacing the two high-level highway bridges, the Bourne and Sagamore, which cross the Cape Cod Canal, and are part of the Cape Cod Canal Federal Navigation Project (FNP) operated and maintained by the U.S. Army Corps of Engineers (USACE), New England District (NAE). The USACE completes a MRER whenever infrastructure maintenance construction costs are expected to exceed $20 million and take more than two years of construction to complete. The MRER is a four-part evaluation: a structural engineering risk and reliability analysis of the current structures, cost engineering, economic analysis, and environmental evaluation of all feasible alternatives. The MRER is intended only as a means of determining the likely future course of action relative to rehabilitation or replacement. While conceptual plans were developed in order to facilitate the analysis no final determination has been made as to the final location or type of any new Canal crossings. Those would be determined in the next phase of the study and design effort. Project Purpose and History The Cape Cod Canal was constructed to provide coastwise shipping traffic with a more direct and safer route from northern New England ports to other areas on the U.S. eastern seaboard. The Canal allows vessels capable of navigating its 32-foot deep channel to avoid the much longer route around Cape Cod, or the even longer route around the islands and Nantucket Shoals. The Canal was originally constructed by the Boston, Cape Cod, and New York Canal Company (Canal Company) under a Charter issued by the Commonwealth of Massachusetts. The Charter required the Canal Company to build and operate two highway bridges and a railroad bridge over the Canal, which were built as low-level draw spans. Construction began in 1909 and the Canal was opened to marine traffic in 1914 and deepened to 25 feet in 1916. The Federal government took control of the Canal during World War I, along with other national transportation infrastructure, and operated the Canal through the 1920s.

Cape Cod Canal Highway Bridges, MA Executive Summary Major Rehabilitation Evaluation Report ES-2 March 2020
The Canal was acquired by the Federal Government in 1928, and the USACE immediately began a program to re-establish the 25-foot channel depth. Under the authority of the National Industrial Recovery Act of June 1933 the Public Works Administration authorized the construction of three bridges over the canal, two highway and one railroad, in keeping with the terms of the original state charter. Work began to widen the channel through the land cut, clearing seaward approaches of obstructions, and provide bank stabilization, lighting and other improvements to navigation. The original plans for Canal deepening called for construction of locks, however this was abandoned in favor of a larger sea level canal after severe icing showed that locks would be impractical. Work on the two new highway bridges and the railroad bridge began in December 1933, and the two highway bridges were completed in 1935. The Rivers and Harbors Act of August 30, 1935 authorized the USACE to assume maintenance of the three bridges. The 1935 Act also authorized further deepening and widening of the Canal to 32 feet MLW and 17.4 miles long, approach channels in Buzzards Bay 500 to 700 feet wide, with a bottom width of 540 feet in the land cut. That work was completed in 1940. Since that time the USACE has maintained the Canal, its channels, small boat basins, the railroad bridge and the two highway bridges at Federal expense. The bridge locations are shown in Figure ES-2. The Canal remains an important waterway for coastwise traffic. In 2017 there were more than 21,000 vessel transits of the Canal, of which about 7,500 were ships of more than 65 feet in length. Cargo tonnage for 2016 was about 6.9 million tons. Auto carriers, cruise ships and military vessels are among the largest ships that use the Canal today.
The two highway bridges are now 85 years old. Both bridges completed their first program of major rehabilitation in the early 1980s. As the bridges and their components continue to age, the cost of operation and maintenance and periodic rehabilitation slowly escalates. Both bridges are now scheduled to undergo their second major rehabilitation in 2025-2027 (Sagamore -
$156.3 million) and 2029-2031 (Bourne - $186.2 million). These actions are expected to have impacts on transportation on and off the Cape and the Islands. Most passenger and vehicle traffic to the Islands must cross the Canal bridges to access the ferry terminals on the south shore of the Cape. Lengthy lane closures and full bridge closures would be necessary during
Figure ES-2 Bridge Locations
Sagamore Bridge
Bourne Bridge
Federal Lands Shown in Red

Cape Cod Canal Highway Bridges, MA Executive Summary Major Rehabilitation Evaluation Report ES-3 March 2020
the 3 to 7 years of major rehabilitation efforts. Closures of the Canal to marine traffic would also be necessary during some bridge work for the superstructure and deck. These closures would result in costs due to traffic delays, congestion and re-routing, in addition to the costs for bridge rehabilitation itself. Further another major rehabilitation of both bridges would be expected in the 2065-2069 timeframe. The America’s Water Infrastructure Act of 2018, Title I – Water Resources Development, provides additional authority for USACE replacement of the Cape Cod Canal highway bridges. Section 1315 of the act, Corps of Engineers bridge repair program for New England evacuation routes, states the following:
Subject to the availability of appropriations, the Secretary may repair or replace, as necessary, any bridge owned and operated by the Secretary that is – (1) located in any of the States of Connecticut, Maine, Massachusetts, New Hampshire, Rhode Island, or Vermont; and (2) necessary for evacuation during an extreme weather event, as determined by the Secretary.
The Cape Cod Canal highway bridges are the only hurricane evacuation routes off Cape Cod and the Islands. They are the only highway bridges owned and operated by the USACE in New England and so are the only bridges to which this legislative language applies. Given the high cost of major rehabilitation, the impacts expected to result from such actions, and the fact that major rehabilitation would not address the issues with current and anticipated traffic volumes, modern day highway and bridge design standards, and the escalating costs of normal maintenance and repairs, the USACE is conducting this MRER. The MRER will examine Major Rehabilitation and alternatives for constructing new Canal crossings. Rehabilitation and the alternatives will be measured against a common Base Condition of continued maintenance and repair of the bridges without major rehabilitation to determine the most cost-effective, safe and reliable means of providing vehicular crossing of the Canal. The location of the Canal and its sea routes are shown in Figure ES-1. The Report The documents provided include this MRER, and an accompanying Environmental Assessment (EA), necessary to make a risk informed decision, and several appendices providing greater detail on certain topics. A number of additional technical supporting documents (TSD), while not a part of the report, are included in the record as reference material. All studies and reports were prepared to the level of analysis required for identifying and evaluating conceptual alternatives with the goal of determining whether major rehabilitation or bridge replacement would provide the most cost effective, safe, efficient, and reliable means of providing long-term vehicular crossings of the Canal. Sponsor and Jurisdiction There is no non-Federal sponsor for the Cape Cod Canal Federal Navigation Project as a whole or for the two highway bridges. The Canal and its appurtenant features were purchased from a private corporation by the Federal government. The modified deep draft portions of the present Canal, the bridges and appurtenant structures were constructed at full

Cape Cod Canal Highway Bridges, MA Executive Summary Major Rehabilitation Evaluation Report ES-4 March 2020
Federal expense without any non-Federal cost-sharing or partnership/cooperation agreements. Federal ownership of the two existing highway bridges covers the area between the shoreward abutments of both bridges as shown in Figure ES-3. Landward of the bridge abutments the Commonwealth (MassDOT) is the land owner and operates and maintains the highway approaches to the bridges.
Alternatives The future of the Canal highway bridges has been the subject of public debate for several decades with a variety of solutions proposed at public meetings and in the press. Beyond the Base Condition limited to continued maintenance and repair of the bridges as needs arise (see Figure ES-4), a number of alternatives were initially examined and screened to yield a final set of plans for detailed analysis. The state and many local stakeholders have sought replacement of the bridges with more modern spans designed in accordance with current highway bridge standards for several decades. With a series of major maintenance and rehabilitation actions projected as necessary in the next ten years to assure safety and performance of the bridges it was decided to examine longer term bridge performance, benefits, costs, and impacts in the context of continued rehabilitation v. replacement. USACE regulation and policy require such projects be evaluated over a 50 year period of analysis.
Figure ES-4 – Deck Section for Existing Bridges
The existing Sagamore and Bourne Bridges have four 10-foot wide vehicle lanes and one combined pedestrian/bicycle lane. There are no shoulders or medians. The left-hand lane in each direction doubles as an auxiliary lanes for entering and exiting traffic.
Figure ES-3

Cape Cod Canal Highway Bridges, MA Executive Summary Major Rehabilitation Evaluation Report ES-5 March 2020
Major rehabilitation of both bridges followed by additional maintenance, repair, and the next rehabilitation cycle was examined as an alternative. Additionally various methods for new crossings included new bridges, tunnels, causeways, low level v. high level bridges, and closure of the Canal and restoration of the pre-Canal road system. A list of these initial alternatives is provided in Table ES-1.
Table ES-1 – List of Alternatives Description Special Considerations
Base A
Continued Maintenance and Repairs (Fix as Fails) of Both Existing Bridges as Needed to Maintain Safety. All alternatives are measured against this plan.
This is the Federal Base Plan – the Without Project Condition
B A Program of Repairs and Major Rehabilitation for Both Bridges to Maintain Safety and Avoid Future Restrictions on Bridge Weight Postings
Major Rehabilitation of Each Bridge is Required about every 45 Years.
C Replacement of One or Both Highway Bridges with New Bridges Each Limited to Four Widened Lanes, with Shoulders, Medians, and Sidewalks
Each Old Bridge would Remain in Service until the New Bridge was Completed
D Replacement of One or Both Highway Bridges with New Bridges as in Plan C, but with Two Auxiliary Lanes Added
Each Old Bridge would Remain in Service until the New Bridge was Completed
E Replacement of One or Both Highway Bridges with New Bridges with Additional (More than Four) Non-Federally Funded Through Traffic Lanes, plus Two Auxiliary Lanes
Each Old Bridge would Remain in Service until the New Bridge was Completed
F Replacement of Both Highway Bridges with a Single New Bridge
Both Old Bridges would Remain in Service until the New Bridge was Completed
G Non-USACE Construction of a New Third Highway Bridge
This would be a State implemented Alternative.
H Replacement of One or Both Highway Bridges with Tunnels
Each Old Bridge would Remain in Service until the New Tunnel(s) were Completed
I Replacement of Both Bridges with a Single Tunnel
J Replacement of One or Both High Level Bridges with Low Level Draw Spans
Each Old Bridge would Remain in Service until the New Bridge was Completed
K Replacement of Both Bridges with Low Level Crossings on Causeways with Draw Spans for Shallow Draft Navigation
Both Old Bridges would Remain in Service until the New Causeway was Completed
L Deauthorization and Closure of the Cape Cod Canal, Filling the Land Cut, and Restoration of Surface Highways, Drainage and Estuarine Ecosystems
Includes Retention of the Shallow Draft Harbors at Each End of the Canal (East Boat Basin, Buttermilk Bay and Onset Bay Projects

Cape Cod Canal Highway Bridges, MA Executive Summary Major Rehabilitation Evaluation Report ES-6 March 2020
These initial alternatives were then evaluated and screened to reduce the list to only those plans which in terms of likely cost, impacts on the marine and land transportation systems, traffic and environmental impacts, and overall practicability would be implementable. Alternative A, the Base Condition for continued maintenance and repair, was carried forward so as to provide a baseline against which the other alternatives could be measured. Alternative B, major rehabilitation of each bridge was also carried forward so that the ability to avoid the cost of replacement by extending the life of the bridges could be examined. Alternatives (J, K and L) which involved closure of the Canal by filling, or construction of causeways or low-level fixed bridges or draw spans were eliminated from further consideration. Some of these plans would also constrain navigability or eliminate the Canal as a shallow draft waterway. These alternatives would degrade the efficiency and safety of coastwise navigation as some or all of the Canal’s marine traffic would be diverted to the Atlantic shipping routes to the south and east of the Cape, Islands, and Nantucket Shoals. Increased risk and cost to shipper, fishermen and boaters would all result from any of these three plans. Restricting or closing the Canal to navigation would be inconsistent with the Congressional authorization for the Canal as a deep-draft waterway and would require legislation to implement. Plans involving tunnels (Alternatives H and I) were eliminated from detailed analysis based on high costs and extensive impacts on the environment and land uses. An examination of recent tunnel projects elsewhere on the east coast indicated that tunnels as new Canal crossings, whether trenching for immersed tubes or much longer and deeper bored tubes, would carry at least twice the cost of new bridges. Construction of a new single bridge (Alternative F) or additional “third” bridge (Alternative G) were also eliminated based on cost and impact. A single bridge as replacement of the two existing bridges would require extensive relocation and realignment of the state and local road systems to change the approaches on both sides of the Canal to align with the new crossings. Extensive and costly real estate takings would be required. Impacts to natural resources including wetlands, agricultural lands, homes and businesses would occur. Overall a third or single bridge was not considered practicable. Provision of two new bridges to replace the existing bridges, but with the deck of each bridge limited to carrying two lanes in each direction (Alternative C - in other words without auxiliary lanes) was also eliminated from detailed consideration based on comments received during review of the draft report. While such a design is within the Corps existing authority to provide vehicular crossings over the Cape Cod Canal, a design that eliminates auxiliary lanes in this situation would not be consistent with modern highway design under FHWA design standards and MA DOT guidelines. Carrying this alternative forward for detailed consideration would therefore be contrary to best engineering practices. This alternative was therefore not carried forward for detailed study in the final report. Replacement of the two bridges with new bridges carrying additional through-traffic lanes (Alternative E) was also eliminated. While auxiliary lanes for acceleration/deceleration to improve safety and efficiency of entrance and access to the bridges from the local area could be included, additional through-traffic lanes would not be in accordance with the existing

Cape Cod Canal Highway Bridges, MA Executive Summary Major Rehabilitation Evaluation Report ES-7 March 2020
authority of the Federal government for the Cape Cod Canal navigation project. New Federal legislation would be required for any expansion of capacity to be implemented. Additional through traffic lanes would not generate appreciable benefits to traffic without extensive state improvements to region’s highway capacity on both side of the Canal, which would carry high costs and greater impact to the environment and the communities. Further the state has indicated it would not support state-funded additional through traffic lanes for the bridges as this would also require more extensive improvements, including adding lanes, to the regional highway network to yield any benefit. This plan was therefore eliminated from further consideration. Provision of two new bridges to replace the existing bridges with auxiliary lanes included on the bridge decks was carried forward for detailed analysis (Alternative D). Provision of two replacement bridges at Bourne and Sagamore, each with two through travel lanes and one auxiliary lane in each direction, is within the Corps existing authority to provide vehicular crossings over the Cape Cod Canal, and no additional authorizing legislation would be required. Provision of auxiliary lanes in addition to two through traffic lanes conforms to FHWA and MA DOT design guidelines and would address issues with traffic safety. Other than modifications and realignment of approach roads no more extensive state improvements to the regional highway system would be required. MassDOT’s plans for eliminating bottlenecks in the vicinity of the bridges with improvements to adjacent supporting state highway infrastructure are discussed in their 2019 Cape Cod Regional Transportation Study. Impacts from bridge and supporting state highway construction would be minimized by locating new bridges in close proximity to the existing bridges. This alternative was therefore carried forward for detailed analysis. Detailed Plans Three alternatives were carried forward for development and evaluation of detailed plans. These included Plan A – the Base Condition for continued maintenance and repair as needed; Plan B – major rehabilitation of both existing bridges followed by regular maintenance, repair and eventually another rehabilitation action with the 50-year period of analysis; and Plan D – Bridge Replacement for both bridges with 6 vehicle lanes.
Table ES-2 – List of Alternative Plans Carried Forward for Detailed Analysis Plan Description Special Considerations Base
A Continued Maintenance and Repairs to Both Existing Bridges as Needed to Maintain Safety (Fix as Fails)
This is the Federal Base Plan – the Without-Project Condition or the No Action Plan
B A Program of Repairs and Major Rehabilitation for Both Bridges to Maintain Safety and Avoid Future Restrictions on Bridge Weight Postings
Major Rehabilitation of Each Bridge is Required about every 45 Years.
D Replacement of One or Both Highway Bridges with New Bridges having Four Through-Traffic Lanes and Two Acceleration/Deceleration Lanes
Each Old Bridge would Remain in Service until the New Bridge was Completed

Cape Cod Canal Highway Bridges, MA Executive Summary Major Rehabilitation Evaluation Report ES-8 March 2020
Engineering Reliability An engineering analysis was performed to demonstrate the reliability of major components of the Bourne and Sagamore bridges. The major components of the bridges are the substructure (piers and abutments), the superstructure (largely the steel trusses supporting the deck and attaching to the substructure), and the deck itself. The results of this analysis forms the basis for the economic evaluation of the base condition versus plans for repair or replacement. A timeline of anticipated component failures was developed along with a schedule of likely repairs and costs. The history of bridge repairs and rehabilitation, condition ratings, performance/deterioration models, and fatigue and corrosion analyses are all used to establish projected reliability of the components. Reliability is defined as the probability that unsatisfactory performance will not occur. Reliability calculations were prepared for each component for each year of the 50-year analysis period. For this study, the limit state for unsatisfactory performance is defined by the physical condition of the bridge’s major components. This “limit state” is the point at which either unsatisfactory performance will occur or the engineering consequences will have some adverse economic impact. Unsatisfactory performance of one or more of these critical elements would lead to unsatisfactory performance of the entire bridge. In order to assess the engineering reliability of the bridges, a probabilistic hazard function was developed for each of the three critical elements. For each major component, a probability distribution was developed to predict deteriorating bridge element performance over a fifty-year service life. The consequences of unsatisfactory performance are presented on an event tree for each critical element under each economic alternative. Potential repair actions that would likely be necessary over the 50-year period of analysis are added to event trees, costs for each action are estimated, and statistical analysis is employed to weight those costs in terms of the likelihood of required actions to maintain bridge performance. Component failures and repair actions to address them will also have impacts on vehicular and marine traffic in terms of transportation delays. Lane and bridge closure results in transportation cost increases from delays and diversion of traffic. Total cost is the adjusted construction cost for repairs plus the transportation delay costs incurred by users of the bridges, all resulting from the reliability analysis. Analysis of Detailed Plans The Base Condition (Plan A) and the two plans carried forward for detailed analysis (Plan B – Major Rehabilitation and Plan D – Bridge Replacement) are discussed below. All costs and benefits are provided in FY20 price levels. Cost estimates prepared at this phase were developed at a conceptual level to compare rehabilitation vs. replacement and are not intended for budgeting purposes. Plan A – the Base Condition was developed using the engineering reliability analysis as described above. Regular maintenance would continue and repairs to bridge components would be made as needed. Possible repairs cover a wide range of possibilities from deck resurfacing to emergency bridge replacement due to failure of critical components. Increased transportation costs include the potential for future posting of weight restrictions on the bridges. The cost of making repairs on an as needed or emergency basis and the cost of

Cape Cod Canal Highway Bridges, MA Executive Summary Major Rehabilitation Evaluation Report ES-9 March 2020
transportation delays (traffic and marine) are summed to arrive at total costs for this plan. These costs are then evaluated using probabilistic simulations that are described below in the economic analysis. The results serve as the baseline for measuring the costs and benefits of the other detailed plans. Plan B – Major Rehabilitation of the existing bridges required a similar analysis of anticipated reliability and performance over time. Costs and schedules for the rehabilitation actions were identified along with those for post rehabilitation repairs and the next cycle of rehabilitation which would occur before the end of the 50-year period of analysis. The future costs were then reduced to their present worth. Major rehabilitation would also have impacts on transportation delays and costs. The construction cost for major rehabilitation and major repairs over the 50-year period of analysis is shown in Table ES-3. Bridge and lane closure days for the initial major rehabilitation action are shown in Table ES-4.
Table ES-3 Major Rehabilitation Costs – Bourne and Sagamore Bridges
Item/Component and FY 2020 Costs (October 2019 Price Levels)
Bourne Bridge 2029-2031
Sagamore Bridge 2025-2027
Total Major Rehabilitation Cost $186,171,000 $156,301,000 Maintenance – Complete Painting (2049/45) $26,827,000 $33,425,000 Third Major Rehabilitation Bourne 2069 – Sagamore 2065 $132,120,000 $110,940,000
Total Rehabilitation and Major Repairs $345,118,000 $300,666,000 Note: Updated March 2020 - Does not include annual maintenance and minor repairs
TABLE ES-4 Anticipated Traffic Management for Lane and Bridge Closures
With Major Rehabilitation 2025-2031 Major Rehabilitation Activity Bourne Bridge Sagamore Bridge Total Days of Lane Closures 480 380 Total Days of Full Bridge Closures 180 130
Plan D - Bridge Replacement includes higher up-front costs for construction, but has far lower costs for maintenance and repair over the 50-year period of analysis. The bridge replacements also would have far fewer impacts on transportation costs as maintenance, repair and future rehabilitation would be limited. The existing bridges would remain in service while the new bridges were built and the new bridge construction would have minimal impacts on adjacent roads. There would be some temporary impacts to marine transportation through the Canal during new bridge construction, but less impacts over time. State construction of realigned approach roads would have an impact on land transportation costs. The conceptual design chosen for evaluation of new bridges at this phase of the analysis used a cable-stay design for both replacement bridges. This conceptual design included consideration of sea level change, reduced deck grades, wider traffic lanes, shoulders,
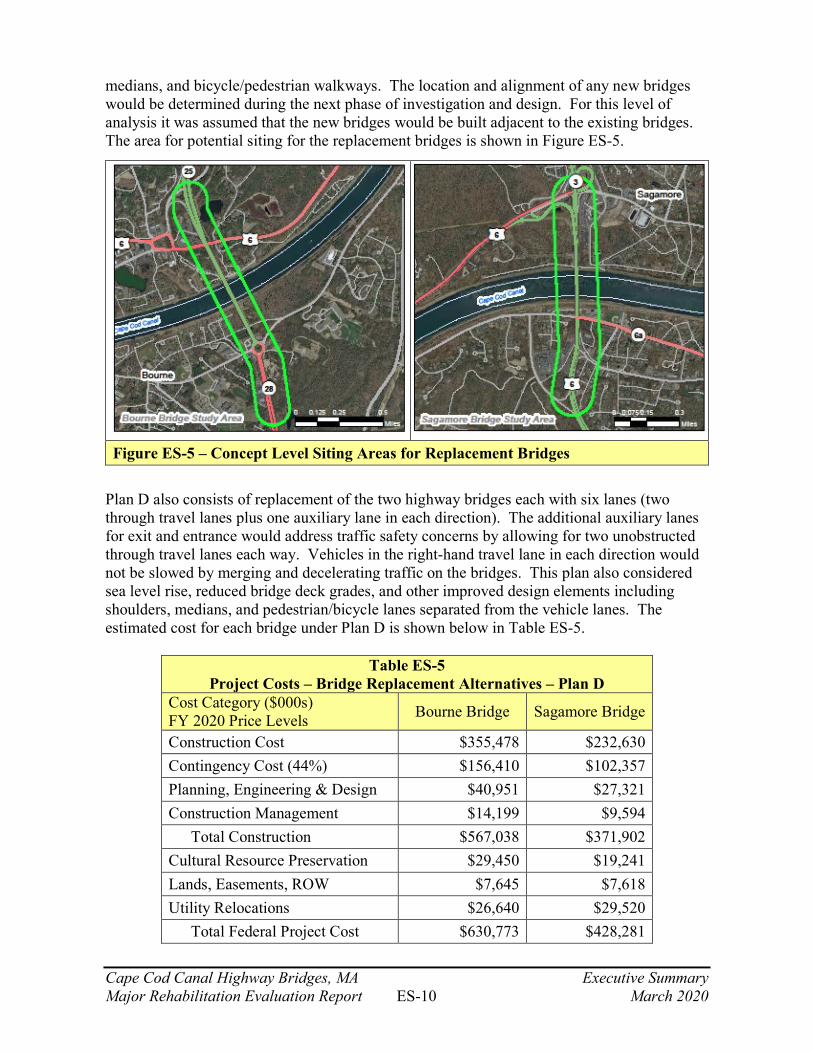
Cape Cod Canal Highway Bridges, MA Executive Summary Major Rehabilitation Evaluation Report ES-10 March 2020
medians, and bicycle/pedestrian walkways. The location and alignment of any new bridges would be determined during the next phase of investigation and design. For this level of analysis it was assumed that the new bridges would be built adjacent to the existing bridges. The area for potential siting for the replacement bridges is shown in Figure ES-5.
Plan D also consists of replacement of the two highway bridges each with six lanes (two through travel lanes plus one auxiliary lane in each direction). The additional auxiliary lanes for exit and entrance would address traffic safety concerns by allowing for two unobstructed through travel lanes each way. Vehicles in the right-hand travel lane in each direction would not be slowed by merging and decelerating traffic on the bridges. This plan also considered sea level rise, reduced bridge deck grades, and other improved design elements including shoulders, medians, and pedestrian/bicycle lanes separated from the vehicle lanes. The estimated cost for each bridge under Plan D is shown below in Table ES-5.
Table ES-5 Project Costs – Bridge Replacement Alternatives – Plan D
Cost Category ($000s) FY 2020 Price Levels Bourne Bridge Sagamore Bridge
Construction Cost $355,478 $232,630 Contingency Cost (44%) $156,410 $102,357 Planning, Engineering & Design $40,951 $27,321 Construction Management $14,199 $9,594 Total Construction $567,038 $371,902 Cultural Resource Preservation $29,450 $19,241 Lands, Easements, ROW $7,645 $7,618 Utility Relocations $26,640 $29,520 Total Federal Project Cost $630,773 $428,281
Figure ES-5 – Concept Level Siting Areas for Replacement Bridges

Cape Cod Canal Highway Bridges, MA Executive Summary Major Rehabilitation Evaluation Report ES-11 March 2020
Table ES-5 (Continued) – Costs Bourne Bridge Sagamore Bridge Associated Non-Federal Highway/Roadway Modifications
State-Funded Bridge Approaches $90,991 $57,802 Anticipated Future Major Repair Actions for New Bridges
(Bourne/Sagamore) Major Repairs #1 (2054/2049) $7,911 $7,906 Major Repairs #2 (None/2069) - - - $7,906 Total Project Cost (50 Years) $729,675 $501,895 Note: Estimate Revised March 2020
Economic Analysis As part of this MRER, an economic evaluation was performed to analyze the costs and benefits of the Base Condition and compare it to alternatives, including major rehabilitation and bridge replacement. Costs and benefits are in FY20 price levels. The Base Condition refers to a baseline of continued regular inspections and standard maintenance construction on the bridges. The economic analysis is extended over a 50-year period using 2020 as the base year and the Federal Discount Rate currently set at 2.75 percent for Federal Fiscal Year 2020. Below is a brief summary of the findings of the economic analysis.
The economic analysis focused on the base plan and the two detailed plans described above: 1. Alternative A: Base Condition (Without-Project) 2. Alternative B: Major Rehabilitation of both Existing Bridges 3. Alternative D: Replacement with Two 4-Lane Bridges with Auxiliary on/off Lanes
Annual benefits considered for each alternative include the reduction in emergency repair spending, the decrease in traffic delays, and changes in cost to waterway navigation. The annual benefit of each alternative is then compared to its respective cost. An alternative is considered economically justified if it maximizes net annual benefits and its benefit cost ratio (annual benefit divided by annual cost) is greater than one.
The analysis is performed using a risk based approach to compare costs and benefits of each alternative to the Base Condition. Reliability functions from the engineering event trees are utilized to simulate possible component failures and associated repair costs. The three engineering components that could experience failure are the bridge deck, substructure, and superstructure. This analysis is evaluated over a 50-year period using Monte Carlo Simulation to determine the likely long-term costs of the future Base Condition without the project and the future condition with each alternative. The model was approved for single-use by the USACE Planning Center of Expertise for Inland Navigation and Risk Informed Economics Division in July 2018. The memo documenting this approval pursuant to EC 1105-2-412 is attached as an addendum to Appendix D - Economics.

Cape Cod Canal Highway Bridges, MA Executive Summary Major Rehabilitation Evaluation Report ES-12 March 2020
The overall cost of each alternative includes several elements; the cost of the repair itself, the economic cost to vessels that cannot use the canal (navigation costs), operation & maintenance costs, and the change in value of time incurred by drivers in traffic delays (travel costs) during lane and bridge closures for repairs or construction phases.
The value of time is determined using USACE regulation (ER 1105-2-100). Traffic data was modeled by TrafInfo; a transportation consulting company familiar with the Massachusetts Department of Transportation (MassDOT) data. TrafInfo provided Cape Cod traffic study data and forecasts. This traffic data was used to determine the total hours of traffic delay incurred during construction for all travelers crossing the bridges. A monetary value was attributed to these lost productive hours using the average hourly household median income of the surrounding towns as sourced from the US Census Bureau.
A comparison of mean annual costs for the base condition and two detailed plans is provided in Table ES-6 below. These costs represent the economic impacts of unscheduled component failures and unscheduled maintenance events that will occur over the 50 year period of analysis. Maintaining the bridges in the current, base condition would result in annual repair and transportation costs of $123.9 million and $65.2 million for the Sagamore and Bourne Bridges respectively. Under the Major Rehabilitation scenario, those expenses would decrease to $8.8 million for the Sagamore Bridge and $6.1 million for the Bourne Bridge. Replacing the bridges reduces the annual costs for the Sagamore Bridge even further to approximately $4.5 million. Costs for the Bourne Bridge increase slightly to $7 million.
Table ES-6
Mean Annual Costs for All Plans Results from Monte Carlo Simulations ($000)
FY2020 Price Levels
Repair Cost
Travel Cost
Navigation Cost
O&M Cost Total
Plan A – Base Condition Sagamore 2,800 120,700 1 400 123,900 Bourne 3,200 61,700 1 300 65,200 Plan B – Major Rehabilitation Sagamore 300 0.6 8,000 400 8,800 Bourne 400 0.6 5,400 300 6,100 Plan D – Bridge Replacement – 4 Lanes plus Auxiliary Lanes Sagamore 300 0.1 4,000 200 4,500 Bourne 500 0.2 6,300 200 7,000
Tables ES-7 provides summary detail of all annual costs, benefits, and benefit to cost ratios (BCRs) for the major rehabilitation and bridge replacement plans.

Cape Cod Canal Highway Bridges, MA Executive Summary Major Rehabilitation Evaluation Report ES-13 March 2020
Table ES-7 – Comparison of Rehabilitation and Replacement Plans FY 2020 Price Levels ($000s) Revised February 2020
Plan B - Major Rehabilitation
Plan D – Bridge Replacement
Sagamore Bridge Total Federal First Cost $156,300 $428,300 Future Federal OMR&R $144,400 $15,800 State-Funded Approaches - - - $57,800 Travel Delay Costs $1,281,000 $92,800 Total – Sagamore $1,581,700 $594,700 Total Cost Discounted + IDC $969,500 $469,000 Total Annual Cost – 2-3/4% $35,600 $17,400 Discounted Cost – Base Plan $123,900 $123,900 Discounted Cost – Plan B & D $8,800 $4,400 Total Annual Benefits $115,100 $119,500 Annual Net Benefits $79,200 $102,100 Benefit-Cost Ratio 3.2 6.9
Bourne Bridge Total Federal First Cost $186,200 $630,800 Future Federal OMR&R $158,900 $7,900 State-Funded Approaches - - - $91,000 Travel Delay Costs $948,300 $22,400 Total – Bourne $1,293,500 $752,100 Total Cost Discounted + IDC $731,100 $574,400 Total Annual Cost – 2-3/4% $27,100 $21,300 Discounted Cost – Base Plan $65,200 $65,200 Discounted Cost – Plan B & D $6,100 $7,000 Total Annual Benefits $59,100 $58,300 Annual Net Benefits $32,000 $37,000 Benefit-Cost Ratio 2.2 2.7
Based on Net Benefits, the rank of alternatives (with 1 being the most desirable) is:
1. Alternative D: Replacement with two 4-lane bridges with auxiliary on/off lanes 2. Alternative B: Major rehabilitation of existing bridges 3. Alternative A: Base Condition - continue to maintain the bridges with regularly
scheduled maintenance and make emergency funding available when there is a component failure to repair the failure.
The economic analysis suggests that fixing the current bridges as components deteriorate will lead to greatly increased costs, particularly costs for travelers delayed in traffic.

Cape Cod Canal Highway Bridges, MA Executive Summary Major Rehabilitation Evaluation Report ES-14 March 2020
Major rehabilitation of the existing bridges demonstrated positive net benefits and a benefit-cost-ratio (BCR) of 3.2 for the Sagamore Bridge and 2.2 for the Bourne Bridge. One advantage of the rehabilitation is a lower initial construction cost for the project when compared to replacing the bridges. The disadvantages are the impact it will have on traffic patterns during the time of construction due to lane and full bridge closures as well as the bridges not being brought up to current engineering standards and regulations.
The alternative for replacement bridges (two 4-lane bridges with auxiliary lanes) had higher net benefits and BCRs than the rehabilitation scenario. One disadvantage of the new bridges is the high initial cost of construction. On the other hand, advantages of the replacement bridges are minimal disturbances to traffic during construction and replacing the aging infrastructure with bridges at current engineering standards and regulations. Bridges with auxiliary lanes would also result in less traffic delays during minor repairs and inspections as two lanes in each direction could remain open in many circumstances.
The analysis suggests that the two replacement bridges are more economically justifiable given the lower costs. However, it is important to note that this analysis was performed under the assumption that the infrastructure and surrounding roadways to the bridges remain in their current conditions and are not upgraded by the Commonwealth of Massachusetts. If the state choses to improve the road network surrounding the bridges, particularly near the Bourne Rotary, then bridge replacement will provide additional benefits to improved travel time that could increase the net benefits and BCRs. The bridges with four through traffic lanes and two auxiliary lanes can also reduce the impact to the traveling public when performing future maintenance on the bridges. Environmental Impact Analysis Environmental conditions and impacts have been evaluated in the Environmental Assessment based on a conceptual bridge design. Resources and potential impacts will be more fully defined and analyzed when the project moves to the design phase. Considerations examined included land uses, geography and geology, climate, air quality, contaminants wetlands, water resources, water quality, terrestrial and marine wildlife, fisheries, threatened and endangered species, environmental justice, and other areas of concern. Removal of the existing bridge once any new bridges are placed in service was also considered with respect to impacts from demolition. Indirect impacts such as local traffic conditions, induced development potential, and population changes were considered. Cumulative impacts from state highway improvement and other proposed development projects were also considered. This study and preparation of the documents has followed USACE regulations and policy for MRERs and the NEPA process. Five agencies were invited to participate as cooperating agencies for the MRER: MassDOT, Federal Highway Administration (FHWA), U.S. Coast Guard, Environmental Protection Agency (EPA), and National Marine Fisheries Service (NMFS), and all agencies accepted. Representatives from Federal, state, and local agencies, and federally-recognized Tribes with interest or jurisdiction in the proposed project were invited to a scoping meeting and coordinated site visit on March 19, 2019.

Cape Cod Canal Highway Bridges, MA Executive Summary Major Rehabilitation Evaluation Report ES-15 March 2020
Early coordination was also conducted with several resource agencies including: U.S. Fish and Wildlife Service, National Marine Fisheries Services, MA Office of Coastal Zone Management, and MA Historic Preservation Office to discuss project plan formulation and consider potential impacts to specific resources and agency comments and concerns. Further consultations will continue during Phase II of the project with these and additional agencies and interests. Public involvement at this stage consists of public meetings held at the beginning and end of the study process, receipt and consideration of public input throughout the process, and public review and comment on the draft MRER and EA before reports are finalized and any decisions are made. During the next phase of investigations additional studies will be performed in a more focused effort as plans for bridge location and alignment, and associated state sponsored improvements are more fully designed and considered. Cultural Resource Concerns Section 106 of the National Historic Preservation Act (NHPA) requires that a federal agency take into account the effects of an undertaking on historic properties. In the study area, there are three historic period resources, the Bourne and Sagamore bridges, and the canal. There are no identified archaeological resources in the vicinity of the Sagamore Bridge study area. There are two archaeological sites within the vicinity of the Bourne Bridge. The Base Condition and Major Rehabilitation would have little to no impact on cultural resources. Impacts from construction of replacement bridges will depend on final locations and their proximity to any known resources or resources identified during the next phase of the project. Additional cultural resource survey will be required to determine the extent and nature of any impacts and the appropriate response. Construction of new bridges will include demolition and removal of the existing bridges. Compliance with the NHPA will require preparation and execution of a Memorandum of Agreement to avoid, minimize, or mitigate effects to historic properties. Cultural resources coordination was initiated with the State Historic Preservation Officer (SHPO), Tribal Historic Preservation Officers (THPOs) of the Mashpee Wampanoag and the Wampanoag Tribe of Gay Head (Aquinnah), and the Historic Commissions of the Towns of Bourne and Sandwich. Additional consultation with these agencies on the location of the bridges and the bridge design would be required during the next phase of the project. Real Estate Considerations
Neither the Base Condition nor Major Rehabilitation would require additional lands, easements or rights of way. Bridge Replacement would require acquisition of new lands by the Federal government for the new bridge footprints. The state may also need to acquire new lands for modified approach and connecting roads. While final location and alignment of the two new bridges would be determined during the next phase of investigation and design, for the purposes of this analysis it was assumed that the new bridges would each be located next to and inland of the existing bridges. This location would minimize land takings as existing

Cape Cod Canal Highway Bridges, MA Executive Summary Major Rehabilitation Evaluation Report ES-16 March 2020
Federal and state properties would be used for much of the footprints and local connecting and state approach roads would require minimal realignment. At this level of analysis it was estimated that replacement of the Bourne Bridge would require acquisition of about 11 acres of land and their improvements and relocation of businesses, all totaling about $7.6 million. A new Sagamore Bridge would require about 4.5 acres of new land plus improvements and relocations also totaling about $7.6 million. Major Rehabilitation and Bridge Replacement would require utility relocations including electrical power and telecommunications cables and several natural gas transmission lines, all of which are beneath the current bridge decks. Full deck replacement and some major steel repairs would require removal of these utilities. Utility cables could be moved to the new bridges once they were completed. Gas lines crossing the bridges would need to be relocated. Utility relocation costs are estimated to vary from $56.9 million for replacement to $25.5 million for rehabilitation. These utility costs were based on the number of crossings and similar replacement costs on recent projects in the region. Discussions with utility owners and operators have begun and will continue into and throughout the design phase of the project. As final bridge location, alignment, type, and need for state connecting road improvements become better defined utility needs will also refined. Specific utility costs, and the allocation of those costs between the utility owners and the Government, will be developed during the design phase in consultation with the utility owners and the state. Other Social Effects The Bourne and Sagamore bridges provide the only vehicular access to the 15 towns of Cape Cod with nearly 215,000 year-round residents and a population increase of up to 300 percent during the height of the summer tourist season between Memorial Day and Labor Day. The bridges also provide access to the eight offshore island municipalities through the ferry terminals located on the south shore of Cape Cod. Traffic volumes have increased exponentially since the 1930’s leading to significantly increased loading on the bridges with the result of increasingly frequent maintenance and repair events. Frequent lane closures, coupled with the lack of auxiliary lanes, mean that for much of the time there is only one through traffic lane in each direction on both bridges. Backups for travelers waiting to cross the bridges commonly stretch for several miles, particularly on late spring through early fall weekends when vacationers crowd the Cape and Islands. The extent of traffic delays is a source of frustration for many residents and visitors, especially as summer tourism brings significant income to area residents and businesses. Conclusions The objective of the MRER is to identify the plans that most efficiently and effectively meets the long-term requirement for the Federal Government to provide, operate, maintain, repair, rehabilitate, and replace (OMRR&R) crossings of the Cape Cod Canal for vehicles, pedestrians and other surface traffic. Engineering reliability of the structures, when analyzed together with cost and economic benefits form the basis of the analysis and determine the recommended plan.

Cape Cod Canal Highway Bridges, MA Executive Summary Major Rehabilitation Evaluation Report ES-17 March 2020
In conducting this study the following tasks were performed: (i) the deficiencies of the components of the two existing highway bridges (Sagamore and Bourne Bridges) were identified, (ii) their reliability indices were estimated, (iii) impacts to road traffic and marine traffic from component failure were estimated, (iv) the increases in reliability based on each improvement alternative were estimated, (v) economic benefits were estimated, and (vi) costs to repair deficient components or replace the bridges were estimated. All of these tasks provided inputs to the economic evaluation of alternatives. Increases in reliability, with respect to the costs to attain them, in order to continue safe and reliable navigation and highway access, was the ultimate objective of this evaluation. The cost estimates presented in this report were developed based on concept level plans and are not adequate for use in budgeting for implementation. Cost certification at this phase is conditional due to the limited scope of the analysis. The next phase of the project will include more detailed investigations, final bridge locations and designs, and more detailed and refined cost estimates. The cost of repairs or rehabilitation are only part of the analysis. The total economic impact to travelers from lane, bridge and waterway closures during the major rehabilitation of the Sagamore Bridge is estimated to be $782.6 million and $536.7 million (discounted delay cost) for the Bourne Bridge Rehabilitation project. Total transportation delay costs over the 50-year period with the major rehabilitation plan (B) would be $1,281.3 million for the Sagamore and $948.4 million for the Bourne. In contrast the 50-year costs for construction for the rehabilitation plan are $300.7 million for the Sagamore and $501.9 million for the Bourne. The bulk of the cost impact for the rehabilitation plan will fall on the travelling public, about 83% of the cost for the Sagamore and 78% of the cost for the Bourne. The bridge replacement alternative (Plan D) had higher net benefits and a higher BCR than the major rehabilitation plan. The disadvantage of the replacement bridges is the high initial cost of construction. The advantages of the replacement bridges are minimal disturbances to traffic during construction and replacing the aging infrastructure with bridges that meet modern engineering standards and regulations. The new bridges would not require the level of frequent, costly, and escalating maintenance and repairs, or entail the high level of disruption to traffic and the economy of the region. It is important to note that this analysis was performed under the assumption that the road infrastructure surrounding the bridges are in their current conditions and are not upgraded by the Commonwealth of Massachusetts. If the state choses to improve the road network surrounding the bridges as suggested in the draft Cape Cod Transportation Study, particularly near the Bourne Rotary and the improvements to Route 6, then the replacement bridges will provide additional efficiency benefits of improved travel time by allowing the left-hand travel lanes to be fully used by through traffic, since exiting and entering traffic would use the auxiliary lanes. Shifting the exiting and entering traffic out of the right-hand through traffic lanes will also have benefits to traffic safety as conflicts between fast-moving and slow moving vehicles will be minimized. New replacement bridges would have significantly higher reliability and lower probability of failure than the existing bridges would have moving forward with the rehabilitation plan. The distribution of costs for the replacement is nearly the reverse of that for the rehabilitation

Cape Cod Canal Highway Bridges, MA Executive Summary Major Rehabilitation Evaluation Report ES-18 March 2020
plans. Transportation delay costs to the public and users of the Canal with bridge replacement account for only about 16% of total costs for the Sagamore and 3% of total costs for the Bourne. This compares to 81% and 73%, respectively for each bridge under the rehabilitation plan. Moving from rehabilitation to replacement shifts the cost burden from the public (delay costs), to the Government (construction and repair costs). The calculations for cost distribution are provided in Table ES-8.
Table ES-8 – Cost Distribution Comparison Plan B Bridge Rehabilitation v. Plan D Bridge Replacement
FY20 Price Levels Revised Feb 2020 Rehabilitation Replacement
Sagamore Bridge Repair/Replace Costs $300,700 $501,900 Delay Costs $1,281,300 $92,800 Total Costs $1,582,000 $594,700 Repair as % 19.0% 84.4% Delay as % 81.0% 15.6%
Bourne Bridge Repair/Replace Costs $345,100 $729,700 Delay Costs $948,400 $22,400 Total Costs $1,293,500 $752,100 Repair as % 26.7% 97.0% Delay as % 73.3% 3.0%
The two existing bridges are now coming up on their second major rehabilitation. The rehabilitation of the Sagamore Bridge would be scheduled for 2025-2027 and cost about $156.3 million (FY20), or $188.8 fully funded (through the midpoint of construction). The rehabilitation work on the Bourne Bridge would be carried out in 2029-2031 at a cost of about $186.2 million (FY20), or a fully-funded cost of about $252.1 million. During these periods the work would require a total of about 760 days (or more than 2 years) of lane closures and 310 days (or more than 10 months) of full bridge closures, with consequences to traffic and the local economy.
A program of critical repairs may be able to delay the full rehabilitation starts by a several years, but if bridge replacement is approved any delay in implementing that work would require rehabilitation to proceed. In other words, any appreciable delay in decision-making or funding could force the Government to pursue major rehabilitation instead of bridge replacement in order to maintain reliability and safety of vehicular traffic over the Canal in the near term.
The Commonwealth of Massachusetts would be a necessary partner in any rehabilitation or replacement project. However the State’s principal role would involve redesign and relocation of connecting highways and roadways if bridge replacement is pursued. The State has made a capital investment of $10 million dollars to begin environmental coordination and early design work for adjacent infrastructure and new bridge approaches in 2020. In addition, the Commonwealth has proposed more than $350 million in future infrastructure funds in

Cape Cod Canal Highway Bridges, MA Executive Summary Major Rehabilitation Evaluation Report ES-19 March 2020
their 2019 Transportation Bond Bill for work in the coming years. The work needed includes study, design and construction of transportation infrastructure associated with the approaches to the Bourne and Sagamore Bridge as a part of the Cape Cod Bridges Improvement Program within the Act Authorizing and Accelerating Transportation Investment, Section 2A, 6121-2147. Any delays in Federal funding could put that commitment and associated work in question. There is a level of urgency in Federal and State decision making concerning the recommendation and funding to implement the design and construction of new bridges. Approval of this report and its recommendation for two replacement bridges to include auxiliary lanes (Plan D) would allow the USACE to proceed with the next phase of the process – the identification of the final replacement bridge location, alignment, size and type, complete Federal, State and local regulatory coordination, including conclusion of the NEPA process, and initiate final design. The Recommended Plan This study has determined that providing two new highway bridges would be the most cost effective means of providing safe and reliable crossings. The existing bridges are 85 years old and both are functionally obsolete. The Bourne Bridge is also classified as structurally deficient under current Federal Highway Administration guidance. Conceptual designs for two replacement bridges have been developed to facilitate this analysis and recommendation. Specific design features would be developed in the following phase of implementing this project. For purposes of this level of analysis it was assumed that a new high level fixed span bridge would be constructed immediately adjacent to each of the two existing highway bridges so as to minimize the modifications needed to the connecting roadways on both the mainland and the Cape. The new highway bridges would be designed to include access for both pedestrians and other non-vehicular traffic such as bicycles. To improve traffic safety and through traffic reliability each bridge would include one acceleration/deceleration lane and two through traffic lanes in each direction, for a total of six vehicular lanes on each bridge. The two existing bridges would remain in in operation until the new bridges are opened to traffic. The fate of the two existing bridges will be determined in the detailed design phase, but for now it is assumed that they would be closed to traffic and demolished once the new bridges are opened. The USACE would need to determine the scrap value of the existing bridges during the detailed design phase. The recommended plan moving into the next phase of design analysis is replacement of each of the two highway bridges crossing the Cape Cod Canal FNP at Bourne and Sagamore. Final design would conform to AASHTO and MassDOT design standards current at that time. Subject to additional analysis during the next phase of the project the new bridges will have two through travel lanes and one acceleration/deceleration lane in each direction. The conceptual design evaluated at this stage of study consists of the following: 1) Construction of two new highway bridges each located parallel to and immediately
inshore of the existing Bourne and Sagamore Bridges. 2) Each new bridge would include 4 through travel lanes (2 each direction 12 feet wide).

Cape Cod Canal Highway Bridges, MA Executive Summary Major Rehabilitation Evaluation Report ES-20 March 2020
3) Each new bridge would have two auxiliary lanes for entrance and exit, one in each direction, each 12 feet wide.
4) Each new bridge would have a minimum vertical clearance for navigation of 135 feet above mean high water over the width of the navigation channel, increased 7.8 feet for anticipated sea level change (high rate).
5) Each new bridge would have deck and approach grades of no steeper than 4%. 6) Each new bridge would include one non-vehicular lane for pedestrian and bicycle traffic
with separation between the non-vehicular lane and the vehicle traffic lanes. 7) Each new bridge would include a shoulder on the vehicle deck, 10 feet wide, in each
direction. 8) Each new bridge would include a median with barriers to separate northbound and
southbound vehicular traffic. 9) A conceptual cable-stay design was used for this analysis, but actual bridge type and
other design parameters will be developed in the next phase. 10) The existing bridges would remain in service (operated, maintained and repaired as
needed) until the new bridges are opened to traffic. 11) The existing bridges would be demolished upon opening of the new bridges. The steel
components would be scrapped. The method of demolition and removal would be determined during the next phase.
12) Licenses and easements for placing new electric transmission and telecommunications cables on the new bridges would need to be proposed by the utility owners and negotiated. Placement of new gas lines would not be allowed on the new bridges.
13) Detailed design features such as lighting, fire suppression, suicide prevention barriers, signage and pavement markings, traffic barriers and controls, etc., would be determined during the design phase of the project.
The concept-level cross section used in this analysis is shown in Figure ES-6.
Figure ES-6 – Deck Sections for Conceptual Replacement Bridge Design
The concept for replacement bridges used in this analysis would have two through travel lanes and one auxiliary entrance/exit lane in each direction. Shoulders would also be provided in each direction. A non-vehicle lane for pedestrians and bicycles would be included as would a median to separate directions of traffic.

Cape Cod Canal Highway Bridges, MA Executive Summary Major Rehabilitation Evaluation Report ES-21 March 2020
Recommendation
The USACE has determined that there is sufficient justification for pursuing a program of bridge replacement for both the Bourne and Sagamore highway bridges over the Cape Cod Canal, Massachusetts Federal Navigation Project. An evaluation of costs and benefits indicates that the most cost effective long-term means of providing vehicular crossing of the Canal is replacement of both bridges with new bridges that conform to modern highway design standards. This recommendation considers both safety and reliability of the bridges and the waterway they cross for both surface vehicular and marine transportation. The next phase of the investigation will determine final bridge type and other detailed design parameters, with such further modifications thereto as in the discretion of the Chief of Engineers may be advisable. The recommendations contained in this report reflect the information available at this time and current USACE Departmental policies governing formulation of individual projects. They do not reflect program and budgeting priorities inherent in the formulation of a national Civil Works construction program nor the perspective of higher review levels within the Executive Branch. Consequently, the recommendations may be modified before they are approved for implementation funding.
Figure ES-7 – Looking Northeast at the Bourne (foreground) and Sagamore Highway Bridges

Cape Cod Canal Highway Bridges, MA Executive Summary Major Rehabilitation Evaluation Report ES-22 March 2020
This Page Intentionally Left Blank
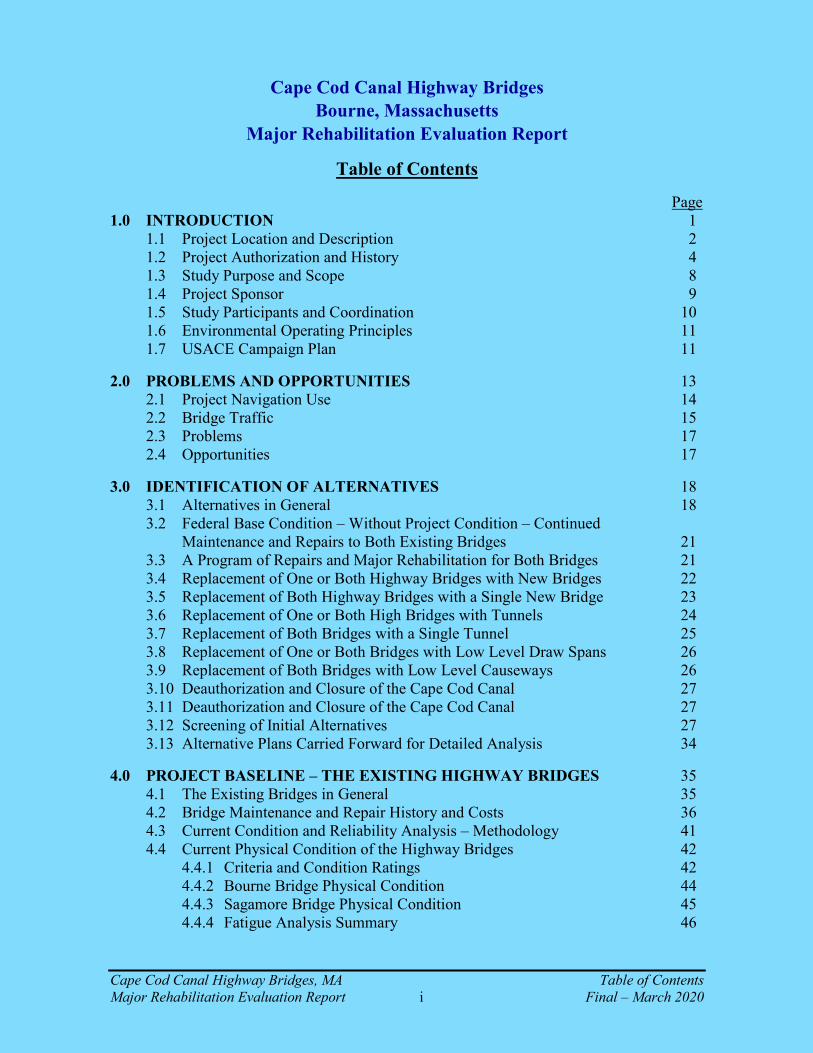
Cape Cod Canal Highway Bridges, MA Table of Contents Major Rehabilitation Evaluation Report i Final – March 2020
Cape Cod Canal Highway Bridges Bourne, Massachusetts
Major Rehabilitation Evaluation Report
Table of Contents Page 1.0 INTRODUCTION 1 1.1 Project Location and Description 2 1.2 Project Authorization and History 4 1.3 Study Purpose and Scope 8 1.4 Project Sponsor 9 1.5 Study Participants and Coordination 10 1.6 Environmental Operating Principles 11 1.7 USACE Campaign Plan 11 2.0 PROBLEMS AND OPPORTUNITIES 13 2.1 Project Navigation Use 14 2.2 Bridge Traffic 15 2.3 Problems 17 2.4 Opportunities 17 3.0 IDENTIFICATION OF ALTERNATIVES 18 3.1 Alternatives in General 18 3.2 Federal Base Condition – Without Project Condition – Continued Maintenance and Repairs to Both Existing Bridges 21 3.3 A Program of Repairs and Major Rehabilitation for Both Bridges 21 3.4 Replacement of One or Both Highway Bridges with New Bridges 22 3.5 Replacement of Both Highway Bridges with a Single New Bridge 23 3.6 Replacement of One or Both High Bridges with Tunnels 24 3.7 Replacement of Both Bridges with a Single Tunnel 25 3.8 Replacement of One or Both Bridges with Low Level Draw Spans 26 3.9 Replacement of Both Bridges with Low Level Causeways 26 3.10 Deauthorization and Closure of the Cape Cod Canal 27 3.11 Deauthorization and Closure of the Cape Cod Canal 27 3.12 Screening of Initial Alternatives 27 3.13 Alternative Plans Carried Forward for Detailed Analysis 34 4.0 PROJECT BASELINE – THE EXISTING HIGHWAY BRIDGES 35 4.1 The Existing Bridges in General 35 4.2 Bridge Maintenance and Repair History and Costs 36 4.3 Current Condition and Reliability Analysis – Methodology 41 4.4 Current Physical Condition of the Highway Bridges 42 4.4.1 Criteria and Condition Ratings 42 4.4.2 Bourne Bridge Physical Condition 44 4.4.3 Sagamore Bridge Physical Condition 45 4.4.4 Fatigue Analysis Summary 46

Cape Cod Canal Highway Bridges, MA Table of Contents Major Rehabilitation Evaluation Report ii Final – March 2020
4.4.5 Corrosion Analysis Summary 46 4.5 Base Condition Fix-as-Fails Actions and Costs 47 4.6 Base Condition Traffic Impacts 48 5.0 STRUCTURAL RELIABILITY ANALYSIS 49 5.1 Reliability Concepts 49 5.2 Deterioration Models 49 5.3 Reliability of Alternatives 50 5.4 Consequence of Unsatisfactory Performance 52 5.5 Results of Reliability Analysis 52 6.0 MAJOR REHABILITATION 54 6.1 The Major Rehabilitation Alternative in General 54 6.2 Major Rehabilitation Actions 55 6.3 Service Disruptions and Emergency Repairs 58 6.3.1 Vehicular Traffic Management during Major Rehabilitation 58 6.3.2 Navigation Traffic Management during Major Rehabilitation 59 7.0 BRIDGE REPLACEMENT ALTERNATIVES 60 7.1 Bridge Replacement in General - Concept Level Alternatives 60 7.2 Sea Level Change Impacts on New Bridge Design 62 7.2.1 Canal Water Levels and Datum 62 7.2.2 Sea Level Change 63 7.3 Bourne Bridge Replacement 66 7.4 Sagamore Bridge Replacement 66 7.5 Bridge Replacement Costs 67 7.5.1 New Highway Bridge Construction Costs 67 7.5.2 Associated State Highway Modifications 68 7.5.3 Real Estate Interests and Utility Relocation Costs 69 7.6 Traffic Management during Bridge Replacement 70 7.6.1 Vehicular Traffic Management during Bridge Replacement 70 7.6.2 Marine Traffic Management during Bridge Replacement 70 7.7 Future Operation, Maintenance and Repair Costs for Replacement Bridges 71 8.0 ECONOMIC ANALYSIS 71 8.1 Federal Interest 71 8.2 Overview of Economic Analysis Methodology 72 8.2.1 Economic Methodology 72 8.2.2 Discounting and Period of Analysis 73 8.3 Base Condition – Alternative A – Fix-as-Fails 73 8.3.1 Probability of Unsatisfactory Performance – Base Condition 74 8.3.2 Probabilistic Analysis – Base Condition 74 8.3.3 Traffic Data Collection and Analysis – Base Condition 77 8.3.4 Impacts to Navigation – Base Condition 77 8.3.5 Annual Maintenance Costs – Base Condition 78 8.3.6 Summary of Future Without-Project Condition – Base Condition 79

Cape Cod Canal Highway Bridges, MA Table of Contents Major Rehabilitation Evaluation Report iii Final – March 2020
8.4 Alternative B – Major Rehabilitation 79 8.4.1 Probability of Unsatisfactory Performance – Major Rehabilitation 80 8.4.2 Results of Monte Carlo Simulation – Plan B 81 8.4.3 Cost of Major Rehabilitation 82 8.4.4 Annual Costs of Major Rehabilitation 83 8.4.5 Major Rehabilitation – Results of Economic Analysis 84 8.4.6 Summary of the Major Rehabilitation Alternative 84 8.5 Alternative D – Replacement with 4 Lanes and 2 Auxiliary On/Off Lanes 85 8.5.1 Probability of Unsatisfactory Performance 86 8.5.2 Benefits, Unsatisfactory Performance, and Monte Carlo Simulation 87 8.5.3 Benefits of Reduced Congestion – Plan D 88 8.5.4 Cost of Bridge Replacement Plan D 89 8.5.5 Future Traffic Delay Cost with Bridge Replacement Plan D 90 8.5.6 Total Annualized Cost – Plan D Bridge Replacement 90 8.5.7 Replacement Bridge – Results of Economic Analysis 91 8.5.8 Summary of New Bridge Replacement Plan D 92 8.6 Extended Life Value of New Bridges 92 8.7 Summary of Economic Results and Conclusions 92 9.0 ENVIRONMENTAL CONSIDERATIONS AND ANALYSIS 94 9.1 Affected Environment and Environmental Consequences 94 9.1.1 Land Use 94 9.1.2 Terrain and Topography 95 9.1.3 Geology and Soils 95 9.1.4 Climate 96 9.1.5 Air Quality 96 9.1.6 Lead Paint 97 9.1.7 Surface Water and Wetlands 97 9.1.8 Water Quality 98 9.1.9 Groundwater 98 9.1.10 Floodplains 99 9.1.11 Coastal Zone 99 9.1.12 Coastal Barrier Resource System 99 9.1.13 Vegetation 100 9.1.14 Wildlife 100 9.1.15 Fisheries, Marine Wildlife and Essential Fish Habitat 101 9.1.16 Threatened and Endangered Species 102 9.1.17 Environmental Justice 103 9.2 Indirect Impacts 104 9.2.1 Induced Development 105 9.2.2 Traffic Impacts 105 9.2.3 Population Models and Forecasted Growth 105 9.3 Cumulative Impacts 106 9.4 Public Involvement 107 9.5 Environmental Coordination 108

Cape Cod Canal Highway Bridges, MA Table of Contents Major Rehabilitation Evaluation Report iv Final – March 2020
10.0 CULTURAL RESOURCE CONSIDERATIONS AND ANALYSIS 109 10.1 General Cultural Resource Concerns 109 10.2 Cultural Resource Impacts 110 10.3 Cultural Resource Coordination 110 10.4 Cultural Resource Recommendations 111 11.0 OTHER SOCIAL EFFECTS ANALYSIS 111 11.1 Background and Purpose 111 11.2 Community Characteristics 112 11.2.1 Population Size and Composition 112 11.2.2 Population Structure and Diversity 114 11.2.3 Employment and Industry 114 11.3 Alternatives: Consequences to Community Characteristics 115 11.4 Baseline OSE Factors and Conditions for Cape Cod and the Islands 116 11.4.1 Health and Public Safety 116 11.5 Economic Vitality 119 11.6 Social Connectedness 121 11.7 Identity 122 11.8 Social Vulnerability 123 11.9 Participation 123 11.10 Leisure and Recreation 124 12.0 REAL ESTATE CONSIDERATIONS AND ANALYSIS 125 12.1 Existing Federal Lands and Interests 125 12.2 Land Use and Potential Impacts 126 12.3 Lands, Easements and Rights of Way Required 126 12.4 Utility Relocations 128 12.5 LERR Costs 130 13.0 ASSESSMENT OF ALTERNATIVES 131 13.1 Risk Assumptions and Variables 132 13.2 Reliability Changes with Alternatives 132 13.3 Opportunity Costs during Repair and Rehabilitation 133 13.4 Opportunity Costs during Replacement 133 13.5 Cost of Alternatives 133 13.6 Comparison of Alternatives 134 13.7 Value Engineering 136 14.0 THE RECOMMENDED PLAN 136 14.1 Description of the Recommended Plan 136 14.2 Outputs of the Recommended Plan 139 14.3 Impacts of the Recommended Plan 140 14.4 Non-Federal Requirements for the Recommended Plan 141 14.5 Project Operations and Maintenance Manual 142 14.6 Project Management Plan 142 15.0 MAJOR REHABILITATION CLASSIFICATION 142

Cape Cod Canal Highway Bridges, MA Table of Contents Major Rehabilitation Evaluation Report v Final – March 2020
16.0 PROJECT COST SUMMARY 142 17.0 SUMMARY AND CONCLUSIONS 145 18.0 RECOMMENDATION 146 ENVIRONMENTAL ASSESSMENT FINDING OF NO SIGNIFICANT IMPACT REFERENCES APPENDICES APPENDIX A – Engineering Reliability Analysis APPENDIX B – Project Authorization and Work History APPENDIX C – Cost Engineering APPENDIX D – Economic Evaluation APPENDIX E – Agency Coordination APPENDIX F – Public Involvement APPENDIX G – Natural Resources Conservation Service - Soils APPENDIX H – Coastal Zone Management – Preliminary Consistency Determination APPENDIX I – USF&WS IPAC Species List APPENDIX J – Real Estate TECHNICAL SUPPORTING DOCUMENTS 1 MassDOT Cape Cod Canal Transportation Study – Draft Summer 2019 2 Cultural Resources Identification and Evaluation – Stantec for MassDOT – May 2017 3 MA DFW Natural Heritage & Endangered Species Program – BioMap2 – Habitat List –
Bourne - 2012

Cape Cod Canal Highway Bridges, MA Table of Contents Major Rehabilitation Evaluation Report vi Final – March 2020
List of Figures Page 1 Cape Cod Canal Project Location and Navigation Routes 3 2 Existing Federal Navigation Project 4 3 Bridge and Approach Ownership Responsibility 9 4 Cape Cod and Islands over Water Transportation Links 13 5 Deck Section for Existing Bridges 16 6 Alternatives – Single Third Bridge or Single Tunnel 24 7 Alternatives C and D – Replacement of Both Existing Bridges 29 8 Major Bridge Components – Bourne Bridge – Superstructure 37 9 Major Bridge Components – Bourne Bridge – Substructure and Deck 42 10 History of Condition Ratings – Bourne Bridge 44 11 History of Condition Ratings – Sagamore Bridge 45 12 Example Weibull CDF and Hazard Rates – Base Condition 51 13 Event Tree Examples – Sagamore Bridge – Base Condition 53 14 Concept Level Siting Areas for Replacement Bridges 61 15 Relative Sea Level Trend at Woods Hole, Massachusetts – NOAA 64 16 Relative Sea Level Change Curves – USACE 65 17 Canal Area State Proposed Highway Improvements 69 18 Probability of Failure – Base Condition – Existing Bridges 75 19 Probability of Unsatisfactory Performance Bridge Superstructures 80 20 Bridge Replacement Failure Probability – Bridge Superstructure 87 21 CEDS Stakeholder Survey 111 22 Barnstable County Summer Population 113 23 Number of Monthly Crashes within One Mile of the Bridges (2010-2014) 118 24 USACE Real Estate Holdings – Cape Cod Canal FNP 125 25 Bridge Study Area – Sagamore Bridge 127 26 Bridge Study Area – Bourne Bridge 128 27 General Locations for Bridge Replacement 138 28 Deck Sections for Conceptual Replacement Bridge Design 138
List of Tables Page 1 Canal Vessel Traffic – 2013 to 2017 14 2 Canal Cargo Vessel Traffic – 2012 to 2016 15 3 Canal Waterborne Commodities Carried – 2012-2016 15 4 List of Alternatives 20 5 Initial Screening Summary 34 6 List of Alternatives Carried Forward for Detailed Analysis 35 7 Existing Highway Bridge Design Dimensions 37 8 Bourne Bridge Maintenance and Repair History 38 9 Sagamore Bridge Maintenance and Repair History 39 10 Recent Operation and Maintenance Costs for the Two Highway Bridges 41 11 Bridge Condition Ratings 43 12 Bourne Bridge Component Condition Ratings 45 13 Sagamore Bridge Component Condition Ratings 46

Cape Cod Canal Highway Bridges, MA Table of Contents Major Rehabilitation Evaluation Report vii Final – March 2020
14 Base Condition – Potential Repair Actions and Costs 47 15 Base Condition Traffic Impacts 48 16 Base Condition – Repair and Traffic Delay Costs 52 17 Major Rehabilitation Costs – Bourne and Sagamore Bridges 57 18 Anticipated Traffic Management Requirements for Lane and Bridge Closures 59 19 Canal Tidal Datum in Feet Relative to Mean Sea Level – NOAA 63 20 USACE Relative Sea Level Change Predictions 65 21 Project Costs – Bridge Replacement Alternatives 68 22 Base Condition – Repair and Traffic Delay Costs 76 23 Annual Costs – Base Condition 79 24 Annual Cost & Benefits – Major Rehabilitation 81 25 Major Rehabilitation Design and Construction Costs 82 26 Rehabilitation Construction and Travel Costs 83 27 Major Rehabilitation – Total Annualized Costs 84 28 Annual Rehabilitation Costs and BCR 85 29 Bridge Replacement 6 Lanes – Annual Costs 88 30 Benefits of Reduced Congestion - Bridge Replacement – Plan D 88 31 Bridge Replacement 6 Lanes – Benefits 89 32 Bridge Replacement Construction Costs – Plan D 89 33 Bridge Replacement 6 Lanes – Costs 90 34 Bridge Replacement 6 Lanes Total Annualized Cost 91 35 Bridge Replacement 6 Lanes Annual Cost and BCR 91 36 Economic Summary Results – Sagamore and Bourne Bridge Replacement 93 37 Total Population – Cape Cod and Islands 112 38 Proportion of Seasonal-Use Houses 113 39 Age and Ethnicity – Cape Cod and Islands 114 40 Employment Proportion by Industry – Cape and Islands 115 41 Travel Impact – 2015 (U.S. Travel Association 2016) 119 42 Steamship Authority Ridership 2015 (Steamship Authority 2016) 121 43 Utility Licenses Over or Near Bridges 129 44 LERR Costs – Plans C and D Replacement 130 45 Cumulative Reliability Improvements for Alternatives (at Year 50) 132 46 Major Rehabilitation Lane and Bridge Closure Durations 133 47 Sagamore Bridge Summary Benefit-Cost Analysis Results 134 48 Bourne Bridge Summary Benefit-Cost Analysis Results 135 49 Comparison of Rehabilitation and Replacement Plans 139 50 Implementation Costs for the Recommended Plan – Plan D 143 51 Fully-Funded Implementation Costs for the Recommended Plan – Plan D 144
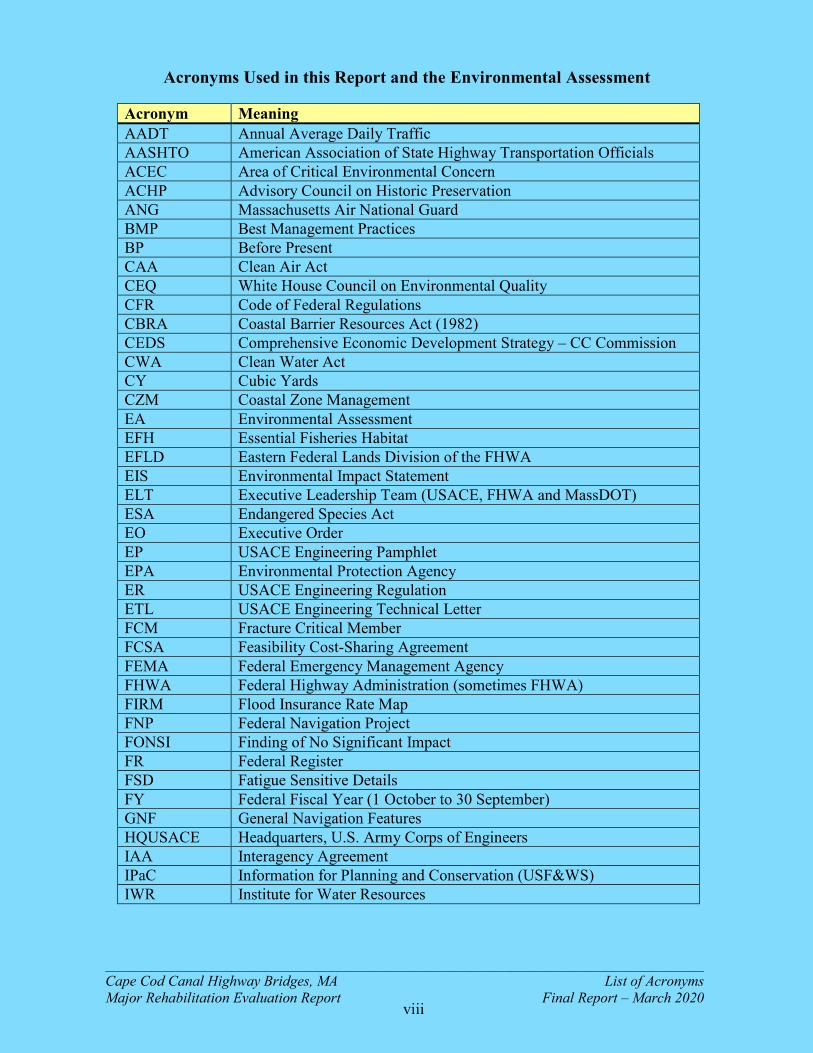
__________________________________________________________________________________________ Cape Cod Canal Highway Bridges, MA List of Acronyms Major Rehabilitation Evaluation Report Final Report – March 2020
viii
Acronyms Used in this Report and the Environmental Assessment
Acronym Meaning AADT Annual Average Daily Traffic AASHTO American Association of State Highway Transportation Officials ACEC Area of Critical Environmental Concern ACHP Advisory Council on Historic Preservation ANG Massachusetts Air National Guard BMP Best Management Practices BP Before Present CAA Clean Air Act CEQ White House Council on Environmental Quality CFR Code of Federal Regulations CBRA Coastal Barrier Resources Act (1982) CEDS Comprehensive Economic Development Strategy – CC Commission CWA Clean Water Act CY Cubic Yards CZM Coastal Zone Management EA Environmental Assessment EFH Essential Fisheries Habitat EFLD Eastern Federal Lands Division of the FHWA EIS Environmental Impact Statement ELT Executive Leadership Team (USACE, FHWA and MassDOT) ESA Endangered Species Act EO Executive Order EP USACE Engineering Pamphlet EPA Environmental Protection Agency ER USACE Engineering Regulation ETL USACE Engineering Technical Letter FCM Fracture Critical Member FCSA Feasibility Cost-Sharing Agreement FEMA Federal Emergency Management Agency FHWA Federal Highway Administration (sometimes FHWA) FIRM Flood Insurance Rate Map FNP Federal Navigation Project FONSI Finding of No Significant Impact FR Federal Register FSD Fatigue Sensitive Details FY Federal Fiscal Year (1 October to 30 September) GNF General Navigation Features HQUSACE Headquarters, U.S. Army Corps of Engineers IAA Interagency Agreement IPaC Information for Planning and Conservation (USF&WS) IWR Institute for Water Resources

__________________________________________________________________________________________ Cape Cod Canal Highway Bridges, MA List of Acronyms Major Rehabilitation Evaluation Report Final Report – March 2020
ix
Acronym Meaning JBCC Joint Base Cape Cod LERRD Lands, Easements, Rights-of-Way, Relocations and Dredged Material
Placement Areas MassDOT Massachusetts Department of Transportation MA DEP Massachusetts Department of Environmental Protection MA DFG Massachusetts Department of Fish and Game MA DFW Massachusetts Division of Fisheries and Wildlife MA DMF Massachusetts Division of Marine Fisheries MA NHESP Massachusetts Natural Heritage Endangered Species Program MBE Manual for Bridge Evaluation MBTA Migratory Bird Treaty Act MSA Magnusson-Stevens Fishery Conservation and Management Act MHW Mean High Water MLLW Mean Lower Low Water MLW Mean Low Water MOU Memorandum of Understanding (USACE and MassDOT) MPO Metropolitan Planning Organization (Cape Cod Regional) MRER Major Rehabilitation Evaluation Report NAAQS National Ambient Air Quality Standards NAD North Atlantic Division, Corps of Engineers NAE New England District, Corps of Engineers NBIS National Bridge Inspection Standards NCHRP National Cooperative Highway Research Program NEPA National Environmental Policy Act NESHAP National Emission Standards for Hazardous Air Pollutants NFIP National Flood Insurance Program NHPA National Historic Preservation Act NLEB Northern Long-Eared Bat NMFS National Marine Fisheries Service NPDES National Pollutant Discharge Elimination System NRHP National Register of Historic Places NWI National Wetlands Inventory OMRR&R Operation, Maintenance, Repair, Replacement and Rehabilitation OSE Other Social Effects PGN Planning Guidance Notebook (USACE ER 1105-2-100) PPA Project Partnership Agreement PPM/PPB/PPT Parts per Million/Billion/Trillion REPR Real Estate Planning Report SHPO State Historic Preservation Officer SLR/SLC Sea Level Rise/Sea Level Change THPO Tribal Historic Preservation Officer UMass University of Massachusetts USACE U.S. Army Corps of Engineers

__________________________________________________________________________________________ Cape Cod Canal Highway Bridges, MA List of Acronyms Major Rehabilitation Evaluation Report Final Report – March 2020
x
Acronym Meaning USCG U.S. Coast Guard USDA U.S. Department of Agriculture USEPA U.S. Environmental Protection Agency USFWS U.S. Fish and Wildlife Service USGS U.S. Geological Survey (Department of the Interior) VE Value Engineering VMT Vehicle Miles Travelled WCSC Waterborne Commerce Statistics Center (at IWR) WHG Woods Hole Group WIIN Water Infrastructure Improvements for the Nation Act (Dec 2016) WQC Water Quality Certification WRDA Water Resources Development Act WRRDA Water Resources Reform and Development Act (June 2014)

Cape Cod Canal Highway Bridges, MA Final Report Major Rehabilitation Evaluation Report 1 March 2020
CAPE COD CANAL HIGHWAY BRIDGES MASSACHUSETTS
MAJOR REHABILITATION EVALUATION REPORT
1.0 INTRODUCTION
This report examines the two high level fixed span highway bridges, the Bourne and Sagamore, that cross the Cape Cod Canal and are part of the authorized Cape Cod Canal Federal Navigation Project (FNP) operated and maintained by the U.S. Army Corps of Engineers (USACE), New England District (NAE). The USACE completes a Major Rehabilitation Evaluation Report (MRER) whenever infrastructure maintenance construction costs are expected to exceed $20 million and take more than two years of construction to complete. The MRER is based on a four-part evaluation: a structural engineering risk and reliability analysis of the current structures, cost engineering, economic analysis, and environmental evaluation of all feasible alternatives. An MRER identifies operational and potential reliability issues, as well as opportunities for efficiency improvement, over a 50-year period of analysis.
The two steel truss bridges have been in service about 85 years since their original completion in 1935 and are both nearing their second major rehabilitation. The first rehabilitation occurred in 1980 when the bridges were 45 years old, and the next is due to begin in about five years. The age of the bridges, their dimensions relative to modern highway design requirements, and increasing costs of maintenance and repairs necessitate a close examination of major rehabilitation needs and costs over the coming years compared to reasonable alternatives, including replacement of one or both bridges. This report will examine the existing bridges, their authorization, present condition, current and long-term future maintenance and repair needs, changes in traffic conditions, and alternative means of providing a safe and cost-effective vehicular connection between the Cape and Islands communities and the mainland.
This Major Rehabilitation Evaluation Report and its accompanying NEPA document are the first phase in examining the future of the Cape Cod Canal Highway Bridges. This phase will examine whether standard operation and maintenance, a program of repair and major rehabilitation, or replacement of one or both bridges, will provide the most reliable fiscally responsible solution. The report will investigate the problem, develop and evaluate potential alternatives, screen-out less practicable alternatives, and recommend the most cost-effective course of action for meeting future needs.
The alternatives developed and evaluated in this study are at a concept level. Assumptions have been made for the purposes of conducting the evaluations presented at this phase, including cost estimates, and general impact areas for new crossings. However no decisions will be made at this phase on issues such as: future limits on traffic over the existing bridges, the specific alignment of any new crossing, any specific type of new bridge, the fate of the existing bridges should new crossings be built, the extent of any real estate acquisition, and

Cape Cod Canal Highway Bridges, MA Final Report Major Rehabilitation Evaluation Report 2 March 2020
other design details such as types and extent of pedestrian and bicycle crossings, roadway grades, utility relocations, construction methods, and navigation clearances.
The two existing bridges are coming up on their second major rehabilitation. Unless alternatives are implemented, upcoming rehabilitation of the Sagamore Bridge would be scheduled for 2025-2027 and cost about $185 million, and the next work on the Bourne Bridge in 2029-2031 at a cost of about $210 million. A program of critical repairs requiring extensive lane closures may be able to delay the full rehabilitation starts by a few years, but if bridge replacement is recommended any more of a delay in implementing that work would require rehabilitation to proceed.
The Commonwealth of Massachusetts would be a necessary partner in any rehabilitation or replacement project. However the State’s principal role would involve redesign and relocation of connecting highways and roadways if bridge replacement is pursued. The State has made a capital investment of $10 million dollars to begin environmental coordination and early design work for adjacent infrastructure and new bridge approaches in 2020. Additionally, the Commonwealth has proposed more than $350 million dollars in its 2019 transportation bond bill for the planning, study, design and construction of transportation infrastructure associated with the approaches to the Bourne and Sagamore Bridge as a part of the Cape Cod Bridges Improvement program within the Act Authorizing and Accelerating Transportation Investment, Section 2A, 6121-2147. Any delays in Federal funding could put that commitment and that work in question. There is a level of urgency in Federal and State decision making concerning the recommendation and funding to implement it. This report will outline and clarify the issues involved and aid in the decision making process at all levels.
The documents include this Major Rehabilitation Evaluation Report (MRER), an accompanying Environmental Assessment (EA) necessary to make a risk informed decision, and several appendices providing greater detail on certain topics. A number of additional technical supporting documents (TSD), while not a part of the report, are included in the record as reference material.
1.1 Project Location and Description
The Cape Cod Canal, as shown in Figure 1, is located in Barnstable County, Massachusetts, about 47 miles south of Boston and about 190 miles east of New York City. The Canal provides a shortened sea route connecting Buzzards Bay in the southwest with Cape Cod Bay in the northeast, avoiding the longer route around Cape Cod, the Islands of Martha’s Vineyard and Nantucket, Nantucket Shoals and Georges Bank.
The Canal’s purpose is to provide a shorter, inshore, and more protected route between northern and eastern New England ports and those of southern New England, New York and points further south along the Atlantic coast. The distance between the deep water shipping lanes off Rhode Island Sound south of Block Island and Montauk, and the outer approaches to Boston Harbor is only 145 nautical miles (NM) by the Canal, as compared to 262 NM if travelling around the Cape, Islands, and Nantucket Shoals, a savings of about 117 NM. Even for smaller boats that can traverse the shallower waters of Nantucket Sound the difference is a

Cape Cod Canal Highway Bridges, MA Final Report Major Rehabilitation Evaluation Report 3 March 2020
savings of about 45 NM (190-145). This is a significant savings in time and cost for all classes of vessels that can use the Canal’s 32-foot deep channel.
The Cape Cod Canal Federal Navigation Project consists of the dredged approach channels from both bays, maneuvering and mooring areas at each end of the Canal, the 7.7-mile long land cut of the Canal, jetties and training dikes, revetments, railroad and highway bridges crossing the Canal, 10 recreational areas along the canal, access roads, traffic management facilities, visitor center, a small boat harbor, and other appurtenant works. Federally owned lands administered by the USACE total 1,153 acres. The project features are shown in Figure 2. The project is located in the Massachusetts 9th Congressional District.
Figure 1 Cape Cod Canal
Project Location and Navigation Routes

Cape Cod Canal Highway Bridges, MA Final Report Major Rehabilitation Evaluation Report 4 March 2020
1.2 Project History and Authorization The route of the present Cape Cod Canal between the heads of Cape Cod Bay and Buzzards Bay was a trade route in colonial times as far back as the 1620s. The Massachusetts Bay Colony and later the Commonwealth of Massachusetts repeatedly studied the idea of a canal in the 1690s, 1770s, 1790s, and through much of the 19th Century. The earliest reports of surveys for a canal route by the Corps of Engineers were published in the 1820s, 1870, and in the 1880s through 1913. Appendix B – Project History, contains a more detailed presentation of the project’s history and development.
By the mid 1800’s proposals for a canal had settled on a preferred route from the head of Buzzards Bay east to Cape Cod Bay. The Canal would follow the valley of the Monument River from the west and portions of the Scusset River from the east. While deep water in Cape Cod Bay was available less than two miles from the Canal’s eastern entrance, corresponding depths in Buzzards Bay were more than ten miles from the mouth of the Monument River requiring a lengthy western approach channel.
The Commonwealth of Massachusetts twice granted charters to private companies for construction and operation of a Canal. The first of these in 1883 began dredging a channel at the Cape Cod Bay end but quickly exhausted its funding and ceased work. In 1899 a charter was issued to the Boston, Cape Cod and New York Canal Company. Under that charter and three later legislative amendments the company began construction in 1909 and opened the
Figure 2 Existing Federal
Navigation Project
Sagamore
Bridge
Bourne Bridge

Cape Cod Canal Highway Bridges, MA Final Report Major Rehabilitation Evaluation Report 5 March 2020
canal to shallow-draft traffic drawing up to 12 feet in 1914. Further dredging gradually increased the depth to 25 feet by 1916, though final completion of all approaches and other features was not achieved until January 1918.
Under the state charter the Canal Company was required to construct and maintain bridges over the canal serving both Bourne and Sandwich (or ferries or tunnels) as determined by the state and county as necessary to replace roads cut by construction of the canal. The Company would build two highway bridges, at Buzzards Bay in Bourne at the west end of the Canal, and at Sagamore near Sandwich at the east end. A railroad bridge was also built at Buzzards Bay and a ferry crossing established at Bournedale about mid-way along the canal land cut. All three bridges were low level draw spans.
Beginning in 1913 Congress again took interest in the Cape Cod Canal and other east coast canals. In 1913 the USACE prepared a report on Federal improvement of the canal’s western approaches through Buzzards Bay. In 1915 a report was prepared examining small craft harbor improvements at Onset Bay at the canal’s western entrance.
In 1918 a more comprehensive report (see Senate Document #279, 65th Congress, 2d Session) was prepared examining Federal acquisition and improvement of three east coast canals, including the Cape Cod Canal, as World War I elevated concern over risks to coastal shipping from enemy attack on the Atlantic seaboard. That report states that on 22 July 1918 possession of the Cape Cod Canal was placed under the control of the Director General of Railroads by a Presidential Proclamation 1419, 26 December 1917 (40 Stat. 1808), and that operation of the canal was entrusted to the United States Railroad Administration (USRA). These actions were taken under authority in Section 1 of the Army Appropriations Act of 29 August 1916 (39 Stat. 645) which gave the President power, in time of war, “to take possession and assume control of any system or systems of transportation… for the transfer or transportation of troops, war material and equipment, or for such other purposes connected with the emergency …”. The USRA operated the Canal and proceeded with maintenance dredging of the Canal to return its controlling depth to the 25-foot design depth. The railroads and other seized properties and concerns were returned to private control on March 1, 1920. Congress however was concurrently examining Federal acquisition of both the Cape Cod and the Chesapeake and Delaware canals, and called for additional studies.
In 1919 Congress authorized purchase of the Cape Cod Canal, not to exceed $10 million, and the Government began condemnation proceedings. In 1921 the Secretary of War and the Canal Company agreed on a price of $11.5 million, including $6 million on the value of the Company’s outstanding bonds. The agreement was then presented to Congress for approval and action. Between 1921 and 1927 Congress repeatedly took up the issue of purchasing the Canal and a number of committee reports were published describing the course of debate.
The River and Harbor Act of 21 January 1927, Section 2 (44 Stat. 1010, P.L. 69-560) ratified the contract for purchase of the Canal. The purchase price remained $5.5 million cash, plus $6 million for principal and interest on the bonds, as specified in House Document #719, 69th Congress, 2d Session, 15 February 1927. Two Appropriations Acts for Fiscal Year 1928 provided the funds (45 Stat. 2, P.L. 70-2 and 45 Stat. 883, P.L.70-563), as specified in House

Cape Cod Canal Highway Bridges, MA Final Report Major Rehabilitation Evaluation Report 6 March 2020
Document #221, 70th Congress, 1st Session, 10 April 1928. Title to the Canal passed to the Government on 1 January 1929, although the Government had assumed control and operation of the Canal on 31 March 1928. At that time tolls ceased and the Corps began operation of the canal, bridges and ferry.
The River and Harbor Act of 3 July 1930 (46 Stat. 918, P.L. 71-520) directed another study be made of the Cape Cod Canal. The reports of the preliminary examination and survey report are printed in House Document #795, 71st Congress, 3d Session, 3 March 1931, with a recommendation for improving the Canal that included the following: channel depth of 30 feet, channel widths of 250 feet in the land cut and 400 feet in the approaches, widened to 700 feet in Buzzards Bay, a new railroad draw span to accommodate the widened channel, a single high level fixed span highway bridge to replace the two draw spans, a small craft harbor at Onset Bay, and elimination of the Bournedale ferry (it would cease operation in 1932).
The National Industrial Recovery Act of 1933 (P.L. 73-67) was enacted to “encourage national industrial recovery, foster fair competition and for construction of certain public works.” Title II authorized the President to create new agencies, specifically the Federal Emergency Administration of Public Works (the Public Works Administration). The PWA would be used to initially authorize improvements to the Cape Cod Canal, including three new bridges (two highway and one railroad) and the deepening and widening of the channel. Beginning in 1933 the USACE used PWA appropriations to construct these improvements. Construction of the two existing highway bridges at Bourne and Sagamore began in December 1933. The bridges were completed in 1935, using funding provided in the Emergency Relief Appropriations Act, 74th Congress, 1st Session, 8 April 1935.
While bridge construction and other work was ongoing Congress requested another report on improvements to the Canal. Reports printed in House Committee on Rivers and Harbors Document #15, 74th Congress, 1st Session, 26 December 1934, recommended modification to plans presented in 1931. Elimination of the tidal lock and a sea level channel with a depth of 32 feet with a land cut 540 feet wide and widened approaches and larger mooring basins were now recommended. This report also states that “the obligations imposed on the United States in acquiring the canal prevented the substitution of a single highway bridge for the two present crossing and two fixed highway bridges are therefore being constructed with a clear span of 550 feet and a vertical clearance of 135 feet above high water. A new railroad bridge with a vertical lift of 500 feet span, affording a clearance of 135 feet above high water is also being constructed”.
The improvements recommended in HCR&H Document #15 were authorized by the River & Harbor Act of 30 August 1935, 74th Congress, 1st Session (P.L. 74-409). The recommendation was for “an open canal 32 feet deep, 540 feet wide in the land cut, 500 feet wide in the new straight channel to Wings Neck, and 700 feet wide beyond Wings Neck, a 15-foot channel into Onset Bay 100 feet wide, mooring basins at each end of the canal …. with operation, care and maintenance, which shall include maintenance of the new bridges now under construction.” Construction of these improvements, some of which were already underway in 1935 using PWA funds would be completed in 1940. The final constructed mooring basin dimensions were: East Basin - 2,500 feet long by 350 feet wide by -25 feet

Cape Cod Canal Highway Bridges, MA Final Report Major Rehabilitation Evaluation Report 7 March 2020
MLW, West Basin - 3,300 feet long by 350 feet wide by -32 feet MLW. Work of removing the three old draw span bridges and their piers began in June 1935 was completed by July 1936.
Ultimately two small boat harbors would be built, one at each end of the canal. The 15-foot Onset Bay channel was initially completed in Fiscal Year 1937. The channel entrance was realigned in 1940. In 1957 the Onset Bay channel was extended to the Town Wharf with a 15-foot turning basin and 8-foot anchorage, as authorized by the River and Harbor Act of 2 March 1945 (P.L. 79-14).
Construction of the 13-foot deep outer section of the East Boat Basin at Sandwich, and the 18-foot West Boat Basin at Bourne, was accomplished in 1938 to 1939. Expansion of the East Boat Basin by adding an inner 4.3-acre by -8-foot MLW area was completed in 1963, as authorized by the River & Harbor Act of 3 July 1958.
A third small boat harbor was authorized by the River and Harbor Act of 1948 and built in 1952-1953 at Buttermilk Bay in Bourne. The project consisted of a 7-foot entrance channel from the Canal into the lower portion of Buttermilk Bay. This project was modified under the Section 107 continuing authority in 1983 to extend the channel up to the highway bridge at 6 feet and into the Town marina basin at Taylor Point. Dredging and boulder removal for the channel extension was completed in 1984.
In summary authority for the construction of the existing bridges as part of the FNP stems from the original authorization for the Government’s purchase of the Canal in the River and Harbor Act of 1927, the deed conveying the Canal and the bridges to the Government, and the expansion and deepening of the Canal with replacement of the bridges as authorized by the National Industrial Recovery Act of 1933. Maintenance of the bridges as part of the FNP was further authorized by the River and Harbor Act of 1935.
The America’s Water Infrastructure Act of 2018, Title I – Water Resources Development, provides additional authority for USACE replacement of the Cape Cod Canal highway bridges. Section 1315 of the act, Corps of Engineers bridge repair program for New England evacuation routes, states the following:
Subject to the availability of appropriations, the Secretary may repair or replace, as necessary, any bridge owned and operated by the Secretary that is – (1) located in any of the States of Connecticut, Maine, Massachusetts, New Hampshire, Rhode Island, or Vermont; and (2) necessary for evacuation during an extreme weather event, as determined by the Secretary.
The Cape Cod Canal highway bridges are the only hurricane evacuation routes off Cape Cod and the Islands. They are the only highway bridges owned and operated by the USACE in New England and so are the only bridges to which this legislative language applies.
Appendix B contains a more detailed and complete history of USACE studies, acquisition, improvement and maintenance of the Cape Cod Canal and its various project features. In summary the authority for the USACE to operate and maintain the two highway bridges as
Cape Cod Canal Highway Bridges, MA Final Report Major Rehabilitation Evaluation Report 8 March 2020
part of the Cape Cod Canal Federal Navigation Project is the River and Harbor Act of 30 August 1935, 74th Congress, 1st Session (P.L. 74-409).
1.3 Study Purpose and Scope
The purpose of this report is to present analysis and findings relative to the continued repair and maintenance of the two highway bridges, major rehabilitation of the bridges, or replacement of the bridges with new structures that will provide land access between the Cape and the mainland. The study has been conducted in accordance with the requirements of ER 1130-2-500, including EP 1130-2-500 Project Operations, Appendix B – Rehabilitation Evaluation Report.
ER 1130-2-500 (27 Dec 1996) Project Operations – 3.2 Policy – It is the policy of the Corps of Engineers that (a) A Major Rehabilitation Program shall be implemented and maintained for construction of infrequent, costly structural rehabilitation or major replacement works that are intended to improve reliability or efficiency of a Corps project or a principal feature thereof. A conceptual approach to major rehabilitation analysis can be found in "Guidance for Major Rehabilitation Evaluation Reports." Specific criteria for inclusion of projects in the Major Rehabilitation Program and guidance for justification and programming of major rehabilitation projects is provided in Chapter 3 of EP 1130-2-500. EP 1130-2-500 (27 Dec 1996) Project Operations – 3.3 Rehabilitation Categories - Major rehabilitation shall consist of either one or both of two mutually exclusive categories - Reliability or Efficiency Improvement. (a) Reliability: Rehabilitation includes actions intended to improve reliability of an existing structure with the result of deferring capital expenditures to replace the structure. Rehabilitation is an alternative to replacement when it can significantly extend the physical life of a project feature and can be economically justified by benefit-cost analysis. Rehabilitation does not include routine or deferred maintenance activities. (b) Efficiency Improvement: Efficiency improvements are actions beyond or separate from rehabilitation that will enhance the operational efficiency of major project components and will increase outputs beyond the original project design.
This report presents a study of alternatives to address current and potential future deficiencies of components of the bridges which impact their structural and operational reliability. The objective is to identify the alternative(s) which, based on engineering reliability analysis, economic analysis, and environmental studies, will best allow the USACE to meet its obligation to provide for access over the Canal and avoid bridge closures and other impacts to marine, vehicular, and other traffic. The report summarizes the analyses and recommendations. The study’s rigorous specific engineering, economic and environmental analyses are detailed in the accompanying Environmental Assessment and in the report appendices.
This report presents reviewers, reporting officers, and others with sufficient detailed information to make decisions on implementation of the recommendations, including cost-

Cape Cod Canal Highway Bridges, MA Final Report Major Rehabilitation Evaluation Report 9 March 2020
sharing and partnership opportunities and budgeting. The report determines and presents the base condition of the two highway bridges by defining the current and future (“without–project”) condition and performance. Problems with current and future reliability are identified and evaluated from this base condition. Alternatives are then formulated to address and manage these problems and risks. The alternatives are evaluated under a risk-informed tiered screening approach to carry the most likely implementable options forward for detailed analysis. Alternatives design, cost and risk analysis, economic assessment, environmental impact assessment, and other potential impacts are then investigated and detailed evaluations conducted for the most likely alternatives.
1.4 Project Sponsor
There is no non-Federal sponsor for the Cape Cod Canal Federal Navigation Project as a whole or for the two highway bridges. The Canal and its appurtenant features were purchased from a private corporation by the Federal government. The modified deep draft portions of the present Canal, the bridges and appurtenant structures were constructed at full Federal expense without any non-Federal cost-sharing or partnership/cooperation agreements. The three small boat harbors constructed along the Canal route were also initially implemented at full Federal expense. The Commonwealth of Massachusetts has been the non-Federal sponsor for modifications/improvements to those three small boat harbors; Buttermilk Bay channel extension 1983, East Boat Basin anchorage enlargement 1961, and Onset Bay channel and anchorage extension 1957.
Federal ownership of the two existing highway bridges covers the area between the shoreward abutments of both bridges. This is the extent of Federal land ownership in the area of the bridges. Landward of the abutments the Commonwealth (MassDOT) is the land owner and operates and maintains the highway approaches to the bridges. The figure below shows the extent of Federal and State responsibility for the existing bridges.
The USACE has had preliminary discussions with the MassDOT concerning state assumption of ownership of the highway bridges, however any detailed consideration of such proposals awaits the decision on the fate of the existing bridges and any replacement.
Figure 3

Cape Cod Canal Highway Bridges, MA Final Report Major Rehabilitation Evaluation Report 10 March 2020
1.5 Study Participants and Coordination
The preparation of this report required the cooperation of Federal agencies, state and local government agencies, elected officials of the state and local governments, local commercial interests, and interested individuals. Appendix E contains a record of public involvement, cooperating agencies, coordination, and project correspondence. The Massachusetts Department of Transportation (MassDOT), Highway Division, the U.S. Department of Transportation, Federal Highway Administration (FHWA), and the Towns of Bourne and Sandwich, Massachusetts were key partners in the study. The Environmental Assessment accompanying this document also provides a detailed account of public and agency involvement and coordination for this study. Strategic Partner Coordination was maintained through an executive leadership team (ELT) comprised of regional senior leaders for the USACE, MassDOT, and FHWA was formed to discuss critical project elements and potential hurdles to work being undertaken by the respective organizations in an effort to streamline processes. ELT meetings occurred generally monthly starting in December 2017 and continued through the finalization of the MRER. Working level meetings between project managers from the USACE MRER and the MassDOT Cape Cod Transportation Study started at the initiation of the MRER in early FY 2016 and have occurred bi-weekly throughout the completion of the MRER. USACE staff participated in numerous meetings regarding the Cape Cod Transportation Study working group public meetings, and the Cape Cod regional metropolitan planning organization (MPO) meetings providing status of the MRER project and early study results (when applicable) to Federal, state, and local agencies, and interested community members. MassDOT staff were in attendance and/or presented information relative to the transportation study at all 10 USACE MRER public meetings. Technical staff from FHWA Eastern Federal Lands Division (EFLD) were also in attendance at all USACE MRER public meetings. Due to the importance, complexity and scale of the this project, and Cape Cod region projects being contemplated by MassDOT, the USACE New England District and MassDOT entered into a Memorandum of Understanding (MOU), signed on June 28, 2018, to engage in a collaborative approach to cooperatively share information on: respective planning studies, maintenance construction activities, potential funding and financing options, and future project development concerning the bridges, approaches, and adjacent infrastructure to reduce impacts to the traveling public and limit expenditure of scarce public resources. MassDOT reviewed the draft MRER/EA document prior to its release in October 2019. MassDOT provided official comments on the draft document as a result of the coordination process which are included in Appendix E. FHWA is the Nation’s leader in regulation, development, design and execution of large and complex transportation related projects. As such USACE entered into an interagency agreement (IAA) with the EFLD for technical assistance related to the development/review of the MRER. EFLD provided input on guidance to transportation (specifically bridge) projects and played a critical role in reviewing the MRER/EA and all appendices prior to release of the

Cape Cod Canal Highway Bridges, MA Final Report Major Rehabilitation Evaluation Report 11 March 2020
draft documents for public review. The FHWA Massachusetts regional office reviewed the draft MRER/EA and provided comments relating to his authority through the Federal coordination process. FHWA comments are also included in Appendix E. A similar process of interagency engagement and public coordination will be carried out throughout the next phase of this project. Federal, state, regional and local agencies and officials and the public will be invited to participate in the process and provided an opportunity to review and comment on any planning and NEPA documents produced.
1.6 Environmental Operating Principles The USACE has reaffirmed its commitment to the environment in a set of "Environmental Operating Principles". These principles foster unity of purpose on environmental issues and reflect a positive tone and direction for dialogue on environmental matters. By implementing these principles within the framework of USACE regulations, the USACE continues its efforts to evaluate the effects of its projects on the environment and to seek better ways of achieving environmentally sustainable solutions in partnership with stakeholders.
The seven “Environmental Operating Principles” are as follows: 1. Foster sustainability as a way of life throughout the organization. 2. Proactively consider environmental consequences of all USACE activities and act
accordingly. 3. Create mutually supporting economic and environmentally sustainable solutions. 4. Continue to meet our corporate responsibility and accountability under the law for
activities undertaken by the USACE, which may impact human and natural environments.
5. Consider the environment in employing a risk management and systems approach throughout the life cycles of projects and programs.
6. Leverage scientific, economic and social knowledge to understand the environmental context and effects of USACE actions in a collaborative manner.
7. Employ an open, transparent process that respects views of individuals and groups interested in USACE activities.
1.7 USACE Campaign Plan The USACE Campaign Plan guides policy decisions on how we organize, train, and equip our personnel; how we plan, prioritize, and allocate resources; and how we respond to emerging requirements and challenges and meet national priorities. The Campaign Plan is regularly updated and the current version of the plan covers the period of FY2018 to FY2022.
The USACE strategic plan effort towards improvement began in August 2006 with the “12 Actions for Change” and has evolved to four goals and associated objectives. Although the effort originally developed with a focus on missions that seek to manage risk associated with flooding and storm damage, the Campaign Plan Goals and Objectives are applied to all aspects of the USACE service to the nation including its civil works mission. USACE

Cape Cod Canal Highway Bridges, MA Final Report Major Rehabilitation Evaluation Report 12 March 2020
Campaign Plan Goals and Objectives are derived, in part, from the Commander’s Intent, the Army Campaign Plan, and Office of Management and Budget guidance. The four goals are (1) Support National Security, (2) Deliver Integrated Water Resource Solutions, (3) Reduce Disaster Risk, and (4) Prepare for Tomorrow.
The goal and associated objectives most closely related to the study and recommendation for repair, rehabilitation or replacement of the Cape Cod Canal Highway Bridges is:
Goal 2: Deliver Integrated Water Resource Solutions
Objective 2a – Deliver Quality Water Resources Solutions and Services
The Recommended Plan for improvements to long term landside access across the Cape Cod Canal meets this objective by delivering project features which, within the limits of Federal participation established by Congress, meets to the extent practicable the expectations of our partners and stakeholders in maintaining safe and efficient highway access between the mainland and Cape Cod.
Objective 2c – Develop the Civil Works Program to Meet the Future Needs of the Nation
Analysis of alternatives and recommendation of a practicable solution to long term land access across the Cape Cod Canal meets this objective by delivering a project which, within the limits of Federal participation established by Congress, provides a sustainable system of access improvements and improves resilience through consideration of climate change and risk management in its design. The study and recommendation were conducted with stakeholder engagement and the public has been provided an opportunity to review and comment on the study and its recommendations through the NEPA process.
Objective 2d – Manage the Life-Cycle of Water Resources Infrastructure Systems to Consistently Deliver Reliable and Sustainable Performance
The project has been formulated with the complete life-cycle in mind, with a consideration of the costs and impacts of repair, rehabilitation, and replacement of crossings of the Cape Cod Canal, all including both initial construction and future operations and maintenance, to determine the most cost-effective alternative solution to address problems and opportunities with land access across the Canal between the mainland and Cape Cod.
In addition to Civil Works it must also be recognized that the Cape Cod Canal highway bridges, particularly the Bourne Bridge, provide the only vehicular access from the mainland to Joint Base Cape Cod, home to five military commands of the Massachusetts Army and Air National Guard (Otis ANG Base) and the Federal Government (US Air Force and US Coast Guard), and Tactical Training Base Kelly (MANG and Army Reserve). Maintaining safe and efficient vehicular access to these facilities contributes to Campaign Plan Goal 1 – Support National Security.

Cape Cod Canal Highway Bridges, MA Final Report Major Rehabilitation Evaluation Report 13 March 2020
2.0 PROBLEMS AND OPPORTUNITIES The Cape Cod Canal was constructed to provide a shortened route for navigation between the Gulf of Maine and North Atlantic waters to the south. Construction of the 17.5 mile long Canal (land cut plus sea approaches) divided the Towns of Bourne and Sandwich and left most of those two towns and all the other 13 towns in Barnstable County dependent on bridges to access the mainland. The eight municipalities in Dukes County (Nantucket, Marta’s Vineyard and the Elizabeth Islands) also depend on the bridges for access as their ferry connections run through the southern harbors on the Cape. The problem lies in identifying the most cost effective means of providing for safe and efficient vehicular traffic between the mainland and the Cape and islands over the long term without impacting projected navigational use of the Canal while minimizing environmental and socio-economic impacts.
Sandwich
Plymouth
Wareham
Bourne
Barnstable
Bridges Ferry
Figure 4 Cape Cod and Islands
Over Water Transportation Links
Seasonal Passenger only

Cape Cod Canal Highway Bridges, MA Final Report Major Rehabilitation Evaluation Report 14 March 2020
2.1 Project Navigation Use The Canal remains an important waterway for coastwise traffic. Records of navigation use of the Canal are kept by the USACE-NAE Cape Cod Canal office and by the Army Corps of Engineers Waterborne Commerce Statistics Center (WCSC). The Canal’s records cover all vessel types and sizes, while the WCSC data cover only cargo vessels. Both data sets are presented in Table 1 and Table 2 below. In total the Canal sees about 17,000 to 21,000 transits annually of all vessel types (2013-2017 data), of which about 7,500 were ships of more than 65 feet in length. Auto carriers, cruise ships and military vessels are among the largest ships that use the Canal today.
Table 1 – Canal Vessel Traffic – 2013-2017
Vessels Over 65 Feet in Length 2013 2014 2015 2016 2017 2018 Passenger, Dry Cargos 1,025 1,084 1,043 1,063 1,064 1,102 Tankers 55 34 15 39 49 68 Towboats 3,191 3,407 3,242 3,293 3,057 3,225 Dry Cargos, Scows 384 330 294 308 238 265 Tanker Barges 1,302 1,270 1,225 1,249 1,259 1,334 Fishing Vessels 780 756 811 848 877 492 Yachts 684 680 726 665 695 720 Military Vessels 147 202 169 223 156 165 Others 90 83 145 210 88 74 TOTAL 7,658 7,846 7,670 7,898 7,483 7,445 % of Total 43.8% 41.5% 39.0% 40.9% 35.6% 34.1%
Vessels Under 65 Feet in Length (Estimated) 2013 2014 2015 2016 2017 2018 Fishing Vessels 139 225 333 308 344 422 Pleasure Craft 4,205 4,458 5,580 7,304 7,380 7,911 Misc. Vessels 5,483 6,397 6,089 3,804 5,798 5,985 TOTAL 9,827 11,080 12,002 11,416 13,522 14,318
TOTAL all Sizes 17,485 18,926 19,672 19,314 21,005 21,736 Source: USACE-NAE Canal Records

Cape Cod Canal Highway Bridges, MA Final Report Major Rehabilitation Evaluation Report 15 March 2020
Table 2 – Canal Cargo Vessel Traffic – WCSC Data - 2012-2017 2012 2013 2014 2015 2016 2017 Foreign Flagged Vessels 2,665 3.432 1,441 286 270 308 Domestic Flagged Vessels 1,243 1,381 1,412 1,332 1,566 1,124 Total Vessels 3,908 4,813 2,853 1,618 1,836 1,432 Source: Waterborne Commerce Statistics Center
The WCSC also publishes annual statistics showing commodity volumes and commercial cargo vessel trips through major U.S. ports and waterways including the Cape Cod Canal. Those data show an average of 8,043,000 tons of cargo were shipped through the Canal annually between 2012 and 2017, the most recent year for which WCSC data is available. Commodity shipments through the Canal have been dominated primarily by petroleum and petroleum products, which accounted for 79.0% of all freight tonnage over those five years. Chemicals were the next largest category at 11.4%, followed by primary manufactured goods at 7.1%. Together, these top three categories accounted for 97.5% of total freight tonnages over those six years. Cargo volumes through the canal for the past six years are shown in the table below.
Table 3 – Canal Waterborne Commodities – 2012-2017 Cargo Carried – Thousands of Short Tons
Commodity 2012 2013 2014 2015 2016 2017 Total % Petroleum & Petroleum Products 7,113 8,657 6,484 5,365 5,409 5,097 38,125 79.0
Chemicals 812 743 1,015 1,119 1,126 703 5,518 11.4 Crude Materials 286 55 66 49 15 39 510 1.1 Primary Manufactured Goods 365 394 391 355 246 1678 3,429 7.1
Food & Farm Products 2 13 6 0 0 4 25 0.1 Manufactured Equipment & Machinery 174 141 73 63 36 63 550 1.1
Coal 10 45 0 0 43 0 98 0.2 TOTAL 8,762 10,148 8,035 6,951 6,875 7,584 48,255 100.0 Average (6 Years) 8,043 Source: Waterborne Commerce Statistics Center
2.2 Bridge Traffic During design for new highway crossings of the then soon to be expanded Canal in the early 1930s, estimates of vehicle traffic volumes ranged from average daily low winter numbers of 1,200 to peak summer Sunday numbers of 4,700. These were stated as monthly totals for both bridges as 36,000 vehicles/month in winter and 142,000 vehicles/ month in summer (House Document #795, 71st Congress, 1931).

Cape Cod Canal Highway Bridges, MA Final Report Major Rehabilitation Evaluation Report 16 March 2020
Today the bridges are used by the 215,000 year-round residents of Barnstable County and the five million visitors to the Cape each year. The existing 85-year old bridges no longer meet current highway safety standards or adequately reflect modern-day traffic conditions. Traffic volumes have increased since the bridges were originally constructed, leading to significant increased loading and demands on bridge infrastructure. Routine maintenance will not be able to keep pace with current traffic and loading demands. Bridge traffic will continue to contend with narrow vehicular lanes, lack of shoulders, lack of separation medians, and narrow sidewalks (see Figure 5).
Figure 5 – Deck Section for Existing Bridges
The existing Sagamore and Bourne Bridges have four 10-foot wide vehicle lanes and one combined pedestrian/bicycle lane. There are no shoulders or medians. The left-hand lane in each direction doubles as an auxiliary lanes for entering and exiting traffic.
The latest Annual Average Daily Traffic (AADT) was obtained from Massachusetts Department of Transportation’s (MassDOT) permanent traffic counting stations nearest the bridges. The most recent 10-year average was chosen for the engineering analysis at both bridges. The 10-year AADT for the Bourne Bridge was 44,447, and for the Sagamore Bridge was 51,756. For 2018 the AADT was 45,853 for the Bourne Bridge and 55,035 for the Sagamore Bridge. This level is about thirty times the volume of traffic projected in the 1930s studies on which the design of the existing bridges was based. Initial numbers for 2019 show an increase over the 2018 volumes. The Economic Appendix (D) provides detailed information on traffic modelling and MassDOT’s regional transportation study. Traffic data used in the Economic analysis distinguished between winter and summer months and used the lower winter data to estimate impacts of lane and bridge closures as those activities would not normally occur during summer.

Cape Cod Canal Highway Bridges, MA Final Report Major Rehabilitation Evaluation Report 17 March 2020
2.3 Problems
From their completion of construction in 1935 both highway bridges have undergone a typical history of operation, maintenance, repair and rehabilitation. Each bridge underwent a major rehabilitation program in the early 1980s, about 45 years after initial construction. Since that last major rehabilitation each bridge has averaged about $1 million annually in maintenance and repair costs, with the Bourne Bridge costing slightly more than the Sagamore Bridge. Both bridges are due for another major rehabilitation effort in the mid-2020s.
As the two bridges continue to age the cost and need for maintenance and repairs is expected to increase. The bridges major system components, the substructure (the piers and abutments and their foundations), the deck (the steel and concrete deck and its paved surface), and steel superstructure (trusses, floor beams, stringers, hangers, etc.) are all expected to require increased attention and work to keep ahead of deterioration. Maintaining reliability and safety of the bridges will require an increased investment over time and may ultimately prove insufficient to avoid limiting vehicle loads on the bridges.
The problem presented is to identify the most cost-effective means for providing long-term safe and reliable vehicular access across the Cape Cod Canal between the mainland and the Cape, and by extension (Cape Cod based ferry services) to the islands of Nantucket and Martha’s Vineyard. Besides being arteries of transportation and commerce, the bridges are hurricane evacuation routes and provide access to government (including military) facilities. Reliable safe access across the Canal is critical to the region and its economy.
2.4 Opportunities The opportunity presented is for the USACE to determine the most cost-effective long-term means of fulfilling its obligation to provide for two safe and reliable vehicle crossings over the Cape Cod Canal while ensuring continued marine traffic through the Canal. This study will examine whether and to what extent this opportunity can be met for each bridge by either a comprehensive program of major rehabilitation and repairs, or by replacement of each bridge with a new vehicle crossing.
A Major Rehabilitation effort would provide the opportunity to correct known deficiencies in each bridge, replace aged components, and to clean and repair other components of the bridge systems. Reliability for each bridge can only be ensured when all bridge components are maintained in a condition that avoids failure. Opportunities may also exist to improve performance of repairs and maintenance while reducing impact. For example, use of more modern paints to cover and protect steel members and prevent accelerated corrosion could also have a lesser impact on the environment than paints used in the past. Coordinating sequential schedules for rehabilitation of both bridges may allow for contract savings while also reducing impacts to vehicular traffic from lane and bridge closures.
The study of providing new vehicle crossings will also present the opportunity to upgrade the crossings to modern highway design standards which should improve safety and reliability. Adequate provisions for non-vehicle crossing of pedestrians and bicycles would also be investigated.

Cape Cod Canal Highway Bridges, MA Final Report Major Rehabilitation Evaluation Report 18 March 2020
3.0 IDENTIFICATION OF ALTERNATIVES
A Major Rehabilitation Evaluation Report typically focuses first on the condition; i.e. the engineering reliability, of the existing structure with emphasis on the cost to operate, maintain, repair and rehabilitate that structure in a manner consistent with its authorized purpose and public safety. With respect to the Cape Cod Canal and the future of its highway bridges public debate has been underway for several decades, escalating as the bridges continue to age and as maintenance and repairs result in ever more frequent and lengthy impacts on vehicular traffic. This section presents a brief overview of the different alternatives for the future of the Canal and its crossings, the number of crossings, the methods of crossings, and even the continued utility of the Canal itself as a navigation project.
3.1 Alternatives in General Consideration of land access across the Cape Cod Canal first involves a discussion of the number of access points, and the method of crossing. Whether to have a single high-capacity crossing, or two or more lower-capacity crossings has been discussed since the first state charters for building a canal were issued in the late 1800s. The 1899 state charter and its amendments required the Canal Company to construct and maintain two bridges over the Canal, one near each end of the land cut, to reconnect the mainland and Cape side areas of the two municipalities bisected by the Canal (Bourne and Sandwich). The original low-level bascule leaf draw spans were built to satisfy this state requirement. The reports published in 1931 in House Document #795 recommended to Congress that a single fixed-span high-level highway bridge be built at the center of the land cut to replace the two low-level bridges.
The Public Works Administration ultimately approved and funded the plan for constructing the two existing high-level fixed-span highway bridges at Bourne and Sagamore. In his report of December 26, 1934 to Congress (House Committee on Rivers and Harbors Document #15, 74th Congress, 1st Session, 1935) the Chief of Engineers stated the rationale for this decision as follows “The obligations imposed on the United States in acquiring the canal prevented the substitution of a single highway bridge for the two present crossings and two fixed highway bridges are therefore being constructed.” Any determination on the merits of one crossing versus two crossings today would require an examination of the relative costs, benefits, and impacts of the alternatives.
The existing state highway system, including state Routes 3, 25, and 28, U.S. Route 6, and the nearby terminus of Interstates 195 and 495 have all been constructed to align with the two existing bridge crossings. Local roadways have also been constructed to connect with the system or avoid the current bridge footprints. Any plan to replace the two existing crossings with a single centrally located crossing would also involve relocation/extension of the landside bridge approaches and connecting roads and highways on both the mainland and Cape sides of the Canal.
The method of crossing the Canal in also a consideration. The decision in the 1930s to replace the low-level draw spans with high-level fixed spans was made at a time when the Canal’s 32-foot design depth could accommodate all but the largest commercial ships, and all

Cape Cod Canal Highway Bridges, MA Final Report Major Rehabilitation Evaluation Report 19 March 2020
U.S. Naval vessels then in service. Today the majority of large commercial carriers, and the largest naval surface combatants cannot navigate the Canal’s limited depth and turns. The question of crossing method must be examined in the context of the Canal’s continued ability to accommodate deep-draft vessel traffic and appropriate design vessels to consider when examining issues such as bridge clearances. Fleet distribution and transit frequency by vessel size, vessel air draft, use of tidal assistance relative to vessel draft, consideration of sea level change, and other factors will need to be examined with respect to bridge elevations and type.
Alternative crossing measures to high-level bridges include tunnels. Those too must be examined with respect to the future carrying capacity and navigation utility of the Canal. Any crossing solution requiring new structures, whether bridge or tunnel, would likely have a life of up to 100 years. Their design must be examined with respect to the likely future of the Canal. Would any future effort to improve the Canal for deeper vessels (depth, widths and alignment) be justifiable and otherwise feasible during the next century?
The deepening of the Canal for larger vessel drafts would also require major modifications to accommodate the increase in vessel length and beam that come with greater draft. Realignment of the approach channels and straightening the bends in the land cut would likely be required. Widening of the land cut and the eastern entrance between the jetties would also be required. Accommodating these changes would require relocating roads, utilities, recreation areas, power plant intakes/discharge sluiceways, and removing and resetting bank stabilization measures, modifying or relocating fish-ways and marsh tide gates, to name just a few. While changes to the vertical clearance of any new bridges might allow for greater vessel air draft, the constraint then would be the recently rehabilitated railroad bridge, which also has a 135-foot MHW clearance. Such wholesale modifications to the navigation features of the Canal are beyond the scope of this MRER for the Canal’s highway bridges. As Congress has not requested a study of potential deep draft improvements to the Canal detailed consideration of a future condition where larger vessels can be accommodate by a deeper and wider canal is not practicable.
Tunnels like other critical utilities located beneath waterways must account in their design elevation for dredging activities and vessel groundings above them. Dredge depths, allowable pay overdepth, non-pay overdepth, advanced maintenance dredging increments, safe clearance and cover needs, and armor layer thickness above the tunnel tubes all are considerations in tunnel design elevations beneath waterways. The type of tunnel and method of construction will also have different requirements for depth beneath the channel.
Public discussion of the future of the Cape Cod Canal Highway Bridges has escalated since the 1980s major rehabilitation actions, as the year-round and seasonal population of the Cape and Islands continues to grow. In the past several years public perception of the bridges performance and safety has waned as lane closures more frequently interrupt traffic on and off the Cape. Public debate and discussions between state and Federal agencies has yielded a wide range of potential futures for the Canal and its crossings. Many of these alternatives were raised during the public information sessions on the bridges study held on the Cape and Islands in early December 2018. A list of these alternatives is provided below, and each will be outlined conceptually. Detailed analysis of the existing condition and the various
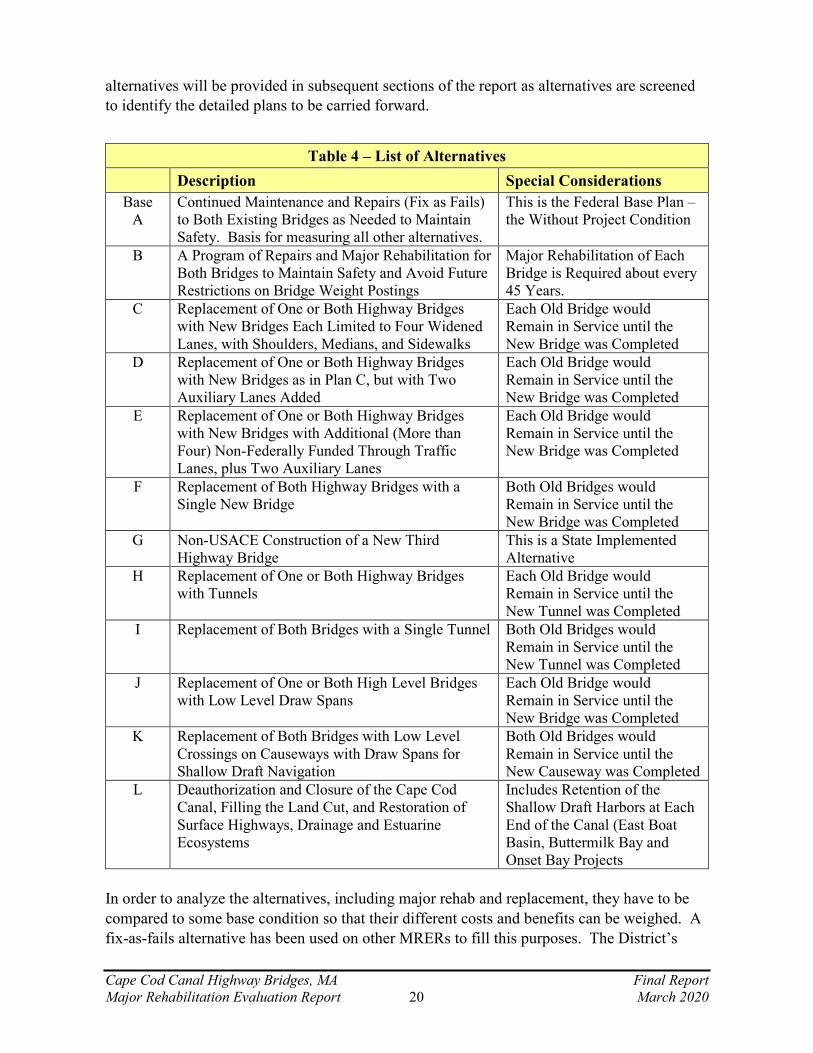
Cape Cod Canal Highway Bridges, MA Final Report Major Rehabilitation Evaluation Report 20 March 2020
alternatives will be provided in subsequent sections of the report as alternatives are screened to identify the detailed plans to be carried forward.
Table 4 – List of Alternatives Description Special Considerations
Base A
Continued Maintenance and Repairs (Fix as Fails) to Both Existing Bridges as Needed to Maintain Safety. Basis for measuring all other alternatives.
This is the Federal Base Plan – the Without Project Condition
B A Program of Repairs and Major Rehabilitation for Both Bridges to Maintain Safety and Avoid Future Restrictions on Bridge Weight Postings
Major Rehabilitation of Each Bridge is Required about every 45 Years.
C Replacement of One or Both Highway Bridges with New Bridges Each Limited to Four Widened Lanes, with Shoulders, Medians, and Sidewalks
Each Old Bridge would Remain in Service until the New Bridge was Completed
D Replacement of One or Both Highway Bridges with New Bridges as in Plan C, but with Two Auxiliary Lanes Added
Each Old Bridge would Remain in Service until the New Bridge was Completed
E Replacement of One or Both Highway Bridges with New Bridges with Additional (More than Four) Non-Federally Funded Through Traffic Lanes, plus Two Auxiliary Lanes
Each Old Bridge would Remain in Service until the New Bridge was Completed
F Replacement of Both Highway Bridges with a Single New Bridge
Both Old Bridges would Remain in Service until the New Bridge was Completed
G Non-USACE Construction of a New Third Highway Bridge
This is a State Implemented Alternative
H Replacement of One or Both Highway Bridges with Tunnels
Each Old Bridge would Remain in Service until the New Tunnel was Completed
I Replacement of Both Bridges with a Single Tunnel Both Old Bridges would Remain in Service until the New Tunnel was Completed
J Replacement of One or Both High Level Bridges with Low Level Draw Spans
Each Old Bridge would Remain in Service until the New Bridge was Completed
K Replacement of Both Bridges with Low Level Crossings on Causeways with Draw Spans for Shallow Draft Navigation
Both Old Bridges would Remain in Service until the New Causeway was Completed
L Deauthorization and Closure of the Cape Cod Canal, Filling the Land Cut, and Restoration of Surface Highways, Drainage and Estuarine Ecosystems
Includes Retention of the Shallow Draft Harbors at Each End of the Canal (East Boat Basin, Buttermilk Bay and Onset Bay Projects
In order to analyze the alternatives, including major rehab and replacement, they have to be compared to some base condition so that their different costs and benefits can be weighed. A fix-as-fails alternative has been used on other MRERs to fill this purposes. The District’s

Cape Cod Canal Highway Bridges, MA Final Report Major Rehabilitation Evaluation Report 21 March 2020
project delivery team (PDT) determined that this same approach would provide a sound basis for decision-making given the nature of this project. The existing bridges are high-use structures. The travelling public requires a level of safety and reliability which must be maintained. Current public law mandates a 24-month inspection cycle for public highway bridges. The “fix-as-fails” alternative is the most likely scenario for a base plan as the USACE cannot abandon the bridges or leave them in-place with no ongoing inspection or operations and maintenance actions.
3.2 Federal Base Condition – Without Project Condition – Continued Maintenance and Repairs to Both Existing Bridges – Alternative A
Under the Base Plan the USACE would continue to repair and maintain the two highway bridges as needed to maintain safety. Major rehabilitation efforts would not be conducted and components of the structures would be repaired and critical elements replaced as they deteriorate and before they fail. Under this option, without major rehabilitation, each bridge would ultimately reach a point where routine maintenance and minor component replacement would no longer yield acceptable design performance. At such a point the bridges would need to be posted to limit the loaded weight of heavy vehicles in order to assure continued bridge safety. Lower vehicle load and speed limits would be posted in the future as the bridges continue to age.
Over time this alternative would have escalating impacts on vehicle traffic and the economy of the Cape and Islands as large trucks transporting critical goods and services were replaced by ever smaller trucks. The cost of transporting goods onto and off the Cape would rise over time. More trucks and lesser speeds would result in more frequent and lengthier traffic delays. Vehicle emissions would increase and tourism would be discouraged by these conditions.
3.3 A Program of Repairs and Major Rehabilitation for Both Bridges – Alternative B
To maintain bridge safety and performance, and to avoid the need for future restrictions through vehicle weight postings and other safety measures, the bridges would each need to undergo a major rehabilitation cycle within the next six years, and at least every 45 years thereafter. The ongoing program of continual inspection, maintenance and repairs would also continue throughout the remaining life of the bridges. Major rehabilitation involves extensive repairs and replacement of major bridge components such as the connections between the spans and the piers/abutments, the hangers that help connect the deck and the truss sections, the gusset plates that tie the truss members together, and the substructure members of the decks themselves. Each of these are major actions that would require partial or full closure of the bridges to traffic during the work.
Major rehabilitation programs were undertaken for both highway bridges in the early 1980s, and involved extensive repair and replacement of major bridge components such as cables,

Cape Cod Canal Highway Bridges, MA Final Report Major Rehabilitation Evaluation Report 22 March 2020
plates, and decking. These actions required partial closures of each bridge for extensive periods resulting in traffic congestion and delays.
3.4 Replacement of One or Both Highway Bridges with New Bridges – Alternatives C, D and E
Should it prove a more fiscally sound option, and better meet the need for public safety and reliability, one or both bridges could be replaced with new high-level highway bridges under a plan that retains the current two-crossing system. In order to minimize impacts on connecting roads and other non-Federal highway and local roadway modifications, each bridge would be replaced along approximately the same alignment as the existing bridges, parallel to them and offset by the width of the new bridge and the needs for construction access. This would minimize the real estate takings needed for the new bridges and connecting road modifications. The actual location, type, and design of any new bridge(s) would be evaluated and determined by further design studies (Phase II).
A new bridge would need to account for changes in highway and bridge engineering design standards since the original bridges were designed in the early 1930s. For example standard safe travel lane widths today are generally 12 feet compared to the 10 feet on the existing bridge decks. Pedestrian and bicycle lanes require a separation barrier from the vehicle lanes. A median should exist between the two directions of vehicular travel. Shoulders to accommodate breakdowns would be needed, and entrance and exit (auxiliary) lanes may be required on the bridge decks due to the proximity of access and exit from the connecting surface roads.
Any new high-level bridge must also take into account the requirements for navigation of the Canal beneath the bridges. Currently the 1930s bridges have a vertical clearance of 135 feet above mean high water (MHW), the same as that of many bridges of their era still in operation today in the northeast, including the Tobin Bridge over the Mystic River in Boston Harbor. The largest ships using the Canal today are auto carriers and cruise ships, many of which have designs that take this 135-foot clearance into account. However sea level has risen slightly since the 1930s and is projected to rise at an accelerated rate due to climate change. Projections of sea level rise would require several additional feet be added to the vertical clearance if the 135 feet were to remain as a goal for navigable transit of the Canal for these vessels. New bridge vertical clearances would need to be based on the current tidal epoch, account for updated tidal elevations, and account for anticipated sea level change during the bridge’s design life.
Horizontal clearance for navigation must also be considered. The existing bridges have piers located within the Canal cut, seaward of the slope protection but outside of the channel limits. The channel has a bottom cut width of 480 feet within the land cut reaches, including between the bridges. Locating any new piers on land outside of the Canal cut would require moving the pier locations landward by about 50 feet on each shore. This would open up horizontal clearance, improve navigational safety, and make access to the piers for inspection and maintenance easier. It would also require lengthening of the spans over the waterway which

Cape Cod Canal Highway Bridges, MA Final Report Major Rehabilitation Evaluation Report 23 March 2020
would extend the distance out to the tie-ins to the connecting roads by at least the distance the piers are moved.
Replacement bridges would need to conform to other aspects of modern highway design and safety standards. Currently the bridges transition to connecting surface roads abruptly, since the surface roads are aligned very close to the Canal. The existing outer lanes of both bridges in both directions must double as acceleration/deceleration lanes to facilitate entering and exiting the bridge onto adjoining roadways. At the Cape side of the Bourne Bridge where the bridge ties into the rotary a similar situation occurs with Cape-bound local traffic entering and exiting the rotary, and cross-traffic mixing with bridge-bound and bridge-exiting traffic. Including acceleration/deceleration lanes on the bridge deck would allow for two through lanes of traffic in each direction while improving safety for exiting and merging vehicles, and avoiding the back-up of exiting vehicles onto the through travel portions of the bridge deck.
The State has indicated that it might be willing to fund the cost of additional through-travel lanes on one or both bridges. The current Federal authorization is for the maintenance of bridges with two through-travel lanes in each direction. Either any costs associated with the study, design and construction of bridges and connecting spans with additional through-travel lanes would need to be borne by the State, or new legislation would be required.
These considerations lead to three different scenarios for bridge replacement with each of the two bridges: (1) replacement in-kind with only four lanes on each bridge deck, two for each direction of travel, (2) replacement that retains the original four through traffic lanes (two in each direction) with two additional lanes for acceleration/deceleration, or (3) a non-Federal alternative to add additional through-traffic lanes in one or both directions.
3.5 Replacement of Both Highway Bridges with a Single New Bridge – Alternative F
The preliminary examination and survey report prepared by the USACE in response to the River and Harbor Act of 3 July 1930 and printed in House Document #795, 71st Congress, 3d Session, 3 March 1931, included a recommendation for a single high level fixed span highway bridge in the Bournedale vicinity to replace the two original draw spans. Before any such project could be implemented by the USACE, the Public Works Administration funded the design and construction of two bridges beginning in 1933. After construction was underway House Committee on Rivers and Harbors Document #15, 74th Congress, 1st Session, 1935, published the conclusion that the obligations imposed on the original private canal owner through its state charter required that two highway bridges be provided and maintained by the Federal government. It is possible that decision could be revisited by Congress in favor of constructing a single new crossing as originally intended.
Single crossing proposals have been debated for several decades with various locations more centrally located along the Canal’s land cut being considered. Any new single crossing would require an extensive redesign of the local surface roads and regional highway connections on both the Cape and mainland sides of the Canal (see Figure 6). On the Cape side state routes 28, 6 and 6A, and other local surface roads would require major realignments to route around

Cape Cod Canal Highway Bridges, MA Final Report Major Rehabilitation Evaluation Report 24 March 2020
or connect to a new single crossing. This would likely entail extensive real estate takings, including lands from the Massachusetts Military Reservation, as well as wetlands alterations, rerouting of local roadways and utility corridors, and other impacts. On the mainland side state Routes 3 and 25 from the east and west, respectively, would need to be realigned and extended to connect to a new single crossing. Changes in bridge approach grades and elevation for navigation clearance would compound those challenges.
The Commonwealth also briefly considered construction of a new third highway bridge adjacent to the existing Sagamore Bridge, with the premise that each bridge would then only carry traffic in one direction. That proposal would require a reconfiguration of adjacent and connecting surface roads to match the tandem-bridges. This plan would also have little impact on the need to continue with repairs and ultimately rehabilitation or replacement of the existing Sagamore Bridge as that structure continued to age. Though the decreased traffic load on the existing bridge might allow for some deferral of future repair frequency, the new bridge would carry half the traffic volume at Sagamore.
3.6 Construction of a New Third Highway Bridge by Others – Alternative G
The USACE has no current authority to construct a third highway bridge over the Cape Cod Canal in addition to rehabilitation or replacement of one or both of the two existing highway bridges. The Commonwealth has however considered the possibility of constructing a third bridge on its own or in partnership with private interests. While construction of a third bridge is not a part of this USACE Major Rehabilitation Evaluation Study the State’s past
Figure 6 Alternatives
Single Third Bridge or Single Tunnel
Sagamore Bridge
Bourne Bridge
Third Bridge or Tunnel

Cape Cod Canal Highway Bridges, MA Final Report Major Rehabilitation Evaluation Report 25 March 2020
consideration, and public comment on the possibility, require it’s mention since any third bridge would reduce demand and load on the two existing bridges or any replacement of them, and would require modifications to existing approaches and connecting roads. Construction of a third bridge would not alleviate the need to repair, rehabilitate or even replace the two existing bridges as those would remain in service, and so this alternative does not address the need for Federal action.
3.7 Replacement of One or Both Highway Bridges with Tunnels – Alternative H
There have been discussions at the local level, and in the press, for several decades on replacing or augmenting the existing bridges with a tunnel or tunnels. The principal issue with tunnels is cost as driven by the tunnel design parameters. The ability of existing natural foundation conditions to support a tunnel, and what engineered foundation features might be required would need to be investigated. The number of traffic lanes to be carried by any tunnels, and the appropriate tunnel top elevation with respect to the dredged navigation channel above would need to be determined. Given the tunnel depth, grade and surrounding topography, the location where the tunnel(s) portals would daylight and how they would connect with surface roads would also need to be evaluated.
Replacing either bridge with a tunnel would require the tunnel to carry at least as many lanes as a replacement bridge would carry, or four lanes per bridge. Pedestrian and bicycle traffic is generally not permitted in tunnels of any length due to issues with air quality. Auxiliary lanes to ease acceleration for entrance and deceleration for exit could be included in the tunnel design either within the tube or as part of the portals. The existing bridges would remain in service until a tunnel(s) were completed and opened for use.
The method of tunnel construction will have impacts. Use of a tunnel boring machine would enable a deeper tunnel to be built that would not interfere with the dredging of the Canal or any future deepening of the waterway. However due to its greater depth a bored tunnel would likely be longer and have its portals farther from the Canal, requiring more extensive connecting road relocation.
Placing an immersed tube tunnel in sections beneath the Canal in the manner that the Ted Williams I-90 tunnel was built beneath Boston Harbor would have different impacts. An immersed tube would have a higher profile than a bored tunnel and could restrict future use and modification of the Canal depth and width. Dredging a trench across the Canal cut, positioning, sinking and connecting the tube sections, armoring and backfilling activities would all restrict use of the Canal during tunnel construction whereas the tunnel boring method would not.
A key aspect to designing any Cape Cod Canal tunnel would involve consideration of the Canal’s future as a deep draft waterway. The present authorized and maintained depth of the Canal’s main channel is -32 feet at mean lower low water (MLLW). Maintenance dredging of channels at that depth typically includes a two-foot allowable pay overdepth (to -34 feet MLLW) to account for dredging tolerance and variation between tidal extremes. Below the dredge pay template a safety clearance is typically provided for tunnels and utilities to

Cape Cod Canal Highway Bridges, MA Final Report Major Rehabilitation Evaluation Report 26 March 2020
account for a degree of non-pay overdepth dredging and the remote potential for vessel groundings on the channel bottom above the tunnel. Tunnel designs for immersed tubes also typically include several feet of rock or concrete mattress cover atop the tunnel tube sections. So with an immersed tube design a 32-foot channel with a two-foot overdepth, six feet of safe clearance, and five feet of rock cover, would have a top elevation no shallower than -45 feet MLLW, or 13 feet below the authorized channel depth.
If at some point during the life of the tunnels it was determined justifiable to deepen the navigation channel depth in the Canal, including any widening or realignment of the channel cut, then any tunnels could pose a constraint if not a prohibiting factor to improving the Canal as a commercial waterway. Mitigating this potential impact on the waterway’s future would require incorporating a further increment of depth into the tunnel design. This would increase the cost of any tunnel(s) as a greater tunnel depth would require longer tunnels and potentially greater modifications of surface roads to connect with the tunnel(s).
3.8 Replacement of Both Bridges with a Single Tunnel – Alternative I
Replacement of both highway bridges with a single tunnel would combine the challenges of replacing the two-crossing system with a single crossing, and those of building a tunnel beneath the Canal instead of bridges. A single tunnel would need to meet the traffic demands of the two existing crossings, including carrying at least four lanes in each direction. This would likely require more than one tunnel tube. As with the single bridge alternative a single tunnel would be located mid-Canal to best connect with the highway system that now connect to the two bridges (see Figure 3 above). Pedestrian and bicycle traffic would need to be accommodated by alternative means.
3.9 Replacement of One or Both Bridges with Low Level Draw Spans – Alternative J
During the initial public information sessions for this study in December 2018 members of the public suggested that present-day use of the Canal for navigation might allow for a return to the low-level bridge crossings that pre-dated the 1930’s high-level bridge designs. Alternatives mentioned for such crossings included draw spans, or low level fixed spans that would only allow for small craft traffic that could pass beneath the bridge(s) at limited tidal stages. Crossings of both these types would eliminate the Canal as a deep draft commercial waterway. Most if not all cargo and military vessels would be required to return to the ocean route around the Cape, Islands and shoals and banks when transiting between northern New England and ports to the west and south. The remaining small craft traffic would be required to wait for bridge openings to transit the Canal. Given the volume of small craft traffic using the Canal this would require the construction or expansion of mooring and anchorage areas in the vicinity of the bridges where vessels could queue-up for openings. Bridge openings could also be expected to impact vehicular traffic, and likely to a more frequent extent than bridge maintenance activities do today.

Cape Cod Canal Highway Bridges, MA Final Report Major Rehabilitation Evaluation Report 27 March 2020
3.10 Replacement of Both Bridges with Low Level Causeways – Alternative K
Public comment in the initial information meetings also included suggestions that new crossings could be constructed by replacing the bridges with causeways. This differs from Plans J in that there would be no bridges, and from Plan L in that the Canal would not be filled-in. Tidal flow in the Canal would be preserved by including large culverts that would permit tidal exchange, effectively converting the Canal to an estuary. Alternatively the low level fixed bridge openings that would permit limited navigation access for small craft at certain stages of the tide could be used instead of large box culverts. Such measures would eliminate the Canal as a navigable waterway for all but the smallest recreational craft. All commercial and military vessels and larger recreational, fishing and other craft would be required to return to the ocean routes around the Cape, Islands, and shoals and banks when transiting between northern New England and ports to the west and south.
3.11 Deauthorization and Closure of the Cape Cod Canal – Alternative L
Attendees at the December 2018 public meetings also suggested that in view of the vehicular traffic issues, and what is viewed as limited deep-draft navigation utility, that the Canal has outlived its purpose and can be deauthorized and abandoned. These commenters believe that filling the Canal land cut and restoration of the surface highways, natural drainage and estuarine ecosystems would be appropriate and would result in a major savings in public funds in the long term. This would eliminate the Canal as a navigable waterway entirely. All navigation between northern New England and ports to the west and south would be required to return to the ocean route around the Cape and Islands, and the shoals and banks to the east of Nantucket. While this route is more hazardous for all vessels it is particularly dangerous for small craft, so that eliminating the Canal as a waterway would have extensive life and safety issues. Deauthorizing the Canal project would also end Federal involvement in operations and maintenance of the roadways, water courses, and recreational features that are now part of that FNP.
3.12 Screening of Initial Alternatives
The several initial alternatives were screened to determine which would be carried forward for detailed analysis. Screening addressed a number of factors as listed below consistent with the objectives of an MRER to evaluate major rehabilitation and reasonable alternatives which, based on engineering reliability analysis, economic analysis, and environmental studies, will best allow the USACE to meet its obligation to provide for access over the Canal and avoid impacts to marine, vehicular, and other traffic over the 50-year period of analysis.
• Functionality – Does the alternative serve the needs for the public and other users in providing safe, reliable, long-term vehicular access connecting Cape Cod with the mainland?
• Cost – Is the alternative implementable at a reasonable cost, measured over the 50-year period of analysis?

Cape Cod Canal Highway Bridges, MA Final Report Major Rehabilitation Evaluation Report 28 March 2020
• Impacts – Can the alternative be implemented without significant environmental, social and cultural resource impacts?
• Maintaining Navigability – Does the alternative allow for continued maritime use of the Canal as a safe passage for deep-draft and shallow-draft vessels consistent with Congressional purpose and authorization for the Cape Cod Canal FNP?
• Authority – Is the alternative implementable within the existing Federal authority for the Cape Cod Canal FNP, or would new Congressional authority be needed?
3.12.1 Alternative A – The Federal Base Plan (Fix as Fails) is the No-Action Plan, otherwise known as the Without Project Condition. The USACE would continue operation and maintenance of each bridge, and would make any repairs needed to maintain public safety as the need arose. No major rehabilitation would be carried out under this plan. As the bridges continued to age and repairs begin to no longer entirely address the efficiency, safety, and effectiveness of each bridge, some restrictions on traffic volumes and weight limits would likely be required. As NEPA requires consideration of a No Action Plan this plan will be carried forward into detailed analysis as the base condition against which all other alternatives would be compared and evaluated.
3.12.2 Alternative B – This plan would continue USACE operation and maintenance and repairs for each highway bridge as in Alternative A, plus a program of Major Rehabilitation for each bridge. The USACE has current authority to continue its operation, maintenance, repair, and rehabilitation of the FNP including the highway bridges. Since major rehabilitation of each bridge is needed about every 40 to 45 years, a major rehabilitation action would occur twice within the 50-year project economic period of evaluation for each bridge. Major Rehabilitation would be carried out to the extent needed to delay bridge replacement for as long as practicable. Each instance of repair or rehabilitation could be expected to be more costly, and perhaps more frequent, than before as the bridges continue to age and deteriorate. This plan will be carried forward into detailed analysis.
3.12.3 Alternative C – This plan would involve replacement of one or both existing highway bridges in kind. The USACE has the authority to replace features of the FNP as necessary to serve authorized project purposes including the existing highway bridges. New bridges would have the same number of lanes (4) for vehicular traffic and the same provisions for pedestrian and bicycle traffic. Each old bridge would remain in service until the new bridge was placed in service. For the purpose of this Phase I concept level of the analysis it is assumed that the new bridges would be located adjacent to and inshore of the existing bridges, as shown in Figure 7. This location would minimize changes needed for the adjacent and connecting surface roads. The new bridges would be designed and built to modern highway and bridge standards. Traffic lanes are assumed to be 12 feet wide. The new bridge grades are expected not to exceed four percent, compared to the existing maximum of six percent for both bridges. Entrance and exit ramps to connecting roads would have eased turn radii. There would be a median barrier for traffic separation and breakdown lanes each direction. Vertical clearances for navigation would be a minimum of 135 feet above mean high water (the clearance provided by the existing railroad bridge), with adjustment for historic and estimated future rates of sea level rise. The new channel piers would be located onshore.

Cape Cod Canal Highway Bridges, MA Final Report Major Rehabilitation Evaluation Report 29 March 2020
The two existing bridges with their four through traffic lanes were designed and built in the 1930s to serve far lower traffic volumes than those served by the bridges today. Modern highway design guidance, including AASHTO highway and bridge design specifications and MassDOT design guidance require that entrance and exit ramps include auxiliary lanes for entering and exiting traffic to transition into or out of through traffic safely. Today’s higher traffic volumes and vehicle speeds require greater distances for traffic to transition. Distance between the on and off ramps, grades, and ramp turn diameters are all typical factors.
The FHWA stated the following in their comment letter:
Based on the close proximity of the interchanges and intersections at the end of each bridge, current standards for this type of facility include acceleration and deceleration lanes (also known as auxiliary lanes) going onto the bridges in most, if not all, four ends of the bridges. In final design, analysis will need to be done to determine if the auxiliary lanes should be continuous across each bridge for operational weaving and structural efficiency needs pending on the structure type, long span bridges such as these may gain cost efficiency with a uniform width.
MassDOT states the following with respect to the need for auxiliary lanes:
The design requirements used for the roadways, intersections, and interchanges shall be in accordance with and the 2006 MassDOT Project Development and Design Guide as well as 2018 American Association of State Highway and Transportation Officials (AASHTO) Policy on Geometric Design of Highway and Streets (“the Green Book”). See Chapter 10 of The Green Book which includes Tables 10-4 Minimum Acceleration Lane Lengths for Entrance Terminals…, Table 10-5 Speed Change Lane adjustment factors as a function of grade…, and Table 10-6 Minimum deceleration lane lengths for exit terminals…; these dictate the required lengths for this type of facility include acceleration and deceleration lanes (also known as auxiliary lanes).
Figure 7 Alternatives C & D
Replacement of Both Existing Bridges
Existing Bridge Location New Bridge Location

Cape Cod Canal Highway Bridges, MA Final Report Major Rehabilitation Evaluation Report 30 March 2020
Providing a replacement for the existing spans in-kind with respect to the number of through traffic lanes would not conform to current design guidance for bridges and highways. For this reason, providing new bridges without auxiliary lanes would not be consistent with best practices for traffic safety, and Plan C will not be carried forward into detailed analysis.
3.12.4 Alternative D – This plan would involve replacement of one or both existing highway bridges, but with four though traffic lanes plus an additional lane added to the bridge deck in each direction for acceleration and deceleration to connect with local roads. The USACE has the authority to replace features of the FNP as necessary to serve authorized project purposes including the existing highway bridges, and that authority extends to designing new bridges to meet modern highway and bridge safety and efficiency standards. Presently the right-hand travel lane in each direction doubles as the acceleration/deceleration lane which limits unrestricted through traffic flow to one lane in each direction. Adding dedicated auxiliary lanes to the bridge decks for acceleration/ deceleration should further ease both through and entering/exiting traffic. All other aspects of this plan would be the same as for Plan C above. As the bridge spans proximity to the connecting roads impacts through traffic flow and traffic safety, designing new bridges consistent with modern highway and bridge safety standards will require adding the dedicated acceleration/deceleration lanes to the bridge decks. Each existing bridge would remain in service until the new bridges were completed and opened to traffic. Final determination of additional deck elevation for sea level rise and navigation clearance, and resulting roadway grades and approach span lengths would all be investigated further and determined during the detailed design phase. This plan will be carried forward into detailed analysis.
3.12.5 Alternative E – This plan would replace one or both existing highway bridges with new bridges that would include additional through traffic lanes in addition to the four traffic lanes and two acceleration/deceleration lanes provided in Plan D. Each existing bridge would remain in service until the new bridges were completed and opened to traffic. Bringing the new bridge designs up to modern standards by increasing traffic lanes widths and adding shoulders and acceleration/deceleration lanes is within USACE existing authority for operation, maintenance, repair and replacement of the FNP features. Adding additional traffic capacity by increasing the number of through traffic lanes is not. Non-Federal interests would need to request such betterments and agree to fully fund the additional costs for design, construction and future operation, maintenance, repair and rehabilitation of those added capacity. The existing Federal authority for the bridges does not include increasing capacity by construction of additional through traffic lanes.
There has been no request from any non-Federal partner to include additional lanes or commitment to fund the additional costs associated with such a proposal. Coordination with MassDOT indicates that the state is not interested in funding addition of through traffic lanes to either bridge at this time. This plan will therefore not be carried forward to detailed analysis. If during the next project phase the state decides that they would be willing to fully fund additional through traffic lanes then any additional studies or design efforts needed to evaluate or support that addition will also need to be funded by the state.

Cape Cod Canal Highway Bridges, MA Final Report Major Rehabilitation Evaluation Report 31 March 2020
3.12.6 Alternative F –While a single bridge was the original USACE plan for modernizing the Canal in 1930, the decision by Congress in 1934 that the project needed to include two bridges, as further authorized in the 1935 R&H Act, remains the current authorization. The existing surface road system and the regional highways accessing the Cape have all been designed and built to connect with the two existing bridges. Replacement of those bridges with a single bridge at a central location along the Canal would require extensive relocation of existing highways, local roads, and utilities. Highway relocation would have a number of impacts. New lands would need to be acquired by the Federal and State governments for the bridges and connecting roads. Portions of the Massachusetts Military Reservation, significant wetlands areas including those used for agriculture (cranberry bogs), recreational facilities, and existing residential and commercial developments would all be impacted and or displaced.
Overall, construction of a single, centrally located, highway bridge of eight lanes or more to replace the two 4-lane highway bridges at Bourne and Sagamore, would be far more expensive than constructing two smaller bridges at the existing crossing locations. This is principally due to the cost and impacts of relocating state highways, local roadways, and utilities to connect with the new crossing. The existing bridges are more than 3-1/4 miles apart and connect to major highways from different directions on the mainland and on different sides of the Cape. More than 13 miles of new highway would be required to connect the existing highways systems to a new single bridge. Largely through lands already developed for other purposes or set aside as protected resources.
Having two bridges also introduces an important level of redundancy given the need for evacuation routes, access to national defense facilities, and emergency response. If a single bridge were fully or partly closed for repairs or otherwise unavailable there would be no other options for vehicle or pedestrian access across the Canal, and there would be no means of evacuation. Proposals for constructing a new single bridge to replace the two existing bridges will not be carried forward into detailed analysis.
3.12.7 Alternative G –The State’s consideration of a third bridge either adjacent to the existing Sagamore Bridge or located elsewhere along the Canal would not relieve the USACE from its need to operate, maintain, repair, rehabilitate or replace each of the two existing bridges as features of the FNP, as required by the R&H Act of 1935. The State and Federal government could agree that any new State bridge would fully replace one or both of the USACE bridges so that the USACE was no longer required to provide vehicular crossings of the Canal and could close and remove either or both the two existing bridges. Or a third bridge located next to an existing bridge could be operated in concert so that each bridge would only carry one direction of traffic, minimizing the need for connecting road alterations. However the State has deferred further consideration of such plans for a new third bridge on its own, and such a plan and agreement would require legislative action by Congress. Proposals by other interests to build a new third highway bridge to supplement the existing bridges are beyond the existing USACE authority. Plan E as discussed above addresses the potential for the State to fully fund additional through traffic lanes on replacement bridges constructed by the Federal government or seek expanded Federal authority to participate in

Cape Cod Canal Highway Bridges, MA Final Report Major Rehabilitation Evaluation Report 32 March 2020
such improvements. Due to the lack of authority and the lack of non-Federal initiative this alternative was not carried forward for detailed analysis.
3.12.8 Alternative H – Proposals to replace one or both of the existing highway bridges with one or more tunnels beneath the Canal will not be carried forward for detailed analysis. Building individual tunnels to replace each bridge carries greater costs than new bridges at each site. Immersed tube tunnels will impact the ability to safely deepen the Canal in the future, and require closure of the Canal for extended periods during construction. If an immersed tube (the least expensive tunnel design to construct) was used, with an assumed change in tunnel bottom elevation of about 100 feet from beneath the Canal to either portal, with a 4 percent roadway grade shoreward of the Canal cut, then at the Bourne crossing the tunnel would be about 5,800 feet long (800 feet under the Canal and 2,500 feet under the either shore). Costs for recent tunnel projects in Norfolk, Virginia were used to develop conceptual costs for tunnels beneath the Canal (see Appendix C – Cost Engineering). An estimated cost for a single 4-lane tunnel with this length would be about $1.2 billion, more than twice the likely cost of a replacement bridge at the same location. Bored tunnels with their greater depth will be even longer and more expensive than the immersed tube design. Significant real estate would need to be acquired for the route of the tunnels and their portals. With an immersed tube design portions of the Canal would need to be closed to navigation during placement of the tube sections. Due to the significant costs and real estate requirements this alternative was not carried forward for detailed analysis.
3.12.9 Alternative I – Replacing both existing highway bridges with a single tunnel beneath the Canal will not be carried forward for detailed analysis. In addition to the reasons discussed in Plan H above for building individual tunnels at each bridge site, building a single tunnel entails other considerations. Building a single tunnel to replace both bridges carries the same impacts and inefficiencies as building a single replacement bridge, but at an even higher cost to construct and maintain. Extensive state and local highways and roads would need to be relocated. Extensive real estate acquisition and relocation would be required to accomplish this. Existing agricultural land, recreation areas, residential and light commercial properties, portions of JBCC, wetlands and other natural areas would also be impacted. Due to these impacts and high costs tunnels, either as a single crossing or individual crossings at the present sites, were not considered further.
Whether or not replacement of the existing bridges with one or more tunnels is within the USACE existing authority is unknown, but most likely additional legislation would be required. The original State charter to the Canal Company gave that company the option to use bridges, ferries or tunnels to provide crossings for the canal. The company elected to build drawspan bridges and operate a small ferry in between to restore the connections between the towns and villages in the Canal’s vicinity. During and after the Federal acquisition of the canal navigation improvements that would require new crossings were studied and authorized, but focused on building new bridges and retaining some ferry service for pedestrian traffic. Tunnels were not discussed in those studies. The deed conveying the Canal to the government includes references to the bridges, but not the state charter. By 1933-1935 funds for building two bridges had been provided through the Public Works,

Cape Cod Canal Highway Bridges, MA Final Report Major Rehabilitation Evaluation Report 33 March 2020
National Industrial Recovery, and Emergency Relief Appropriations Acts, and their construction was completed in 1935. Both the Permanent Appropriations Repeal Act of 1934 and the River and Harbor Act of 1935 authorize USACE maintenance of the Canal. The 1935 R&H Act cites House Committee on Rivers and Harbors Document #15 (1934) which includes “maintenance of the new bridges now under construction” in its recommendation. Tunnels were not mentioned then or since in any authorizing document or appropriation.
If tunnels had been shown to likely be a less expensive alternative than replacement bridges for providing and maintaining crossing of the Canal then a more in-depth examination of the breadth of the existing authorization or need for new authority would be in order. However with rough concept-level estimates for tunnels at more than twice the cost of bridges the question of legislative authority for tunnels does not warrant further discussion or explanation. Plans involving construction of one or more tunnels to replace either or both bridges will not be carried forward for detailed analysis.
3.12.10 Alternative J – Constructing new low-level draw spans to replace one or both of the existing high-level fixed spans will not be carried forward for detailed analysis. Congress authorized the purchase and improvement of the Cape Cod Canal to ensure that the Nation had the advantage of its benefits to maritime commerce and later also recreation. Low level draw spans (either bascule or vertical lift spans) in place of high level fixed bridges would place restrictions on marine transit of the Canal, particularly for larger commercial and military vessels. Ships would need to wait for bridge openings, and dredged areas would need to be provided for their queue. Vehicular traffic would back-up significantly while awaiting the passage of marine traffic and closure of the bridges. Draw spans will also require closure to either marine or roadway traffic for maintenance and repairs to the lift leafs or spans. These are all issues that the high level fixed spans were intended to avoid, and will avoid with proper rehabilitation or replacement. Due to the high cost to both land and marine transportation this alternative was not carried forward.
3.12.11 Alternative K – Constructing new low-level causeways, with or without new low-level fixed span bridges to replace one or both of the existing high-level fixed spans will not be carried forward for detailed analysis. As with Plan J above, Congress authorized the purchase and improvement of the Cape Cod Canal to ensure that the Nation had the advantage of its benefits to maritime commerce and later also recreation. Should the Canal’s navigable width be restricted by causeways only the smallest craft would still be able to transit the waterway, if it remained open to navigation at all. Due to the high cost to land and marine transportation this alternative was not carried forward.
3.12.12 Alternative L – Deauthorization and filling-in the Cape Cod Canal land cut, and restoring surface highways and roads, restoring natural drainage and estuarine and coastal ecosystems, will not be carried forward for detailed analysis. All vessel traffic between northern New England and the rest of the U.S. eastern seaboard which now uses the Canal would then need to use the more hazardous open ocean routes around the Cape, shoals and banks of the North Atlantic. Longer sea routes would mean great cost of transporting cargo. Even if the three small boat harbors built along the Canal could be retained as part of such a

Cape Cod Canal Highway Bridges, MA Final Report Major Rehabilitation Evaluation Report 34 March 2020
plan, this would represent the loss of an important regional commercial and recreational navigation resource.
From the Federal government’s purchase of the Canal to the completion of the 32-foot improvement project in 1941 about 40.5 million cubic yards of material were excavated and dredged from the Canal land cut and sea approaches. While records do not indicate how much of that total volume was from the land cut, if only half of that amount were required to fill the land cut back in the cost would be substantial. While some of the material removed to dredge the Canal was used as fill on the adjacent wetlands and areas that have now been developed for commercial and residential uses, most of those materials were placed in open water disposal sites in Cape Cod and Buzzards Bay. So restoration of wetlands would only provide a portion of the material need to fill the Canal. Acquiring the remaining material would require purchase from upland sources or offshore borrow. The material would need to be transported, placed and spread, graded and the areas reclaimed. Today’s cost for such an action would likely be several hundred million dollars. Re-establishing roadways and appurtenant works would be an additional cost. Permanent closure and elimination of the Cape Cod Canal would be contrary to the current Congressional authorization for this waterway. The USACE has no present authority to abandon the Canal and undertake such work. Due to the lack of authority and high cost to land and marine transportation from closing the Canal this alternative was not carried forward.
3.13 Alternative Plans Carried Forward for Detailed Analysis
In summary the several alternatives produce a variety of results when evaluated according to the screening measures, as shown in Table 5. Those that were beyond the USACE authority or otherwise failed more than one of the screening measures were eliminated from further consideration and were not carried forward for detailed analysis.
Table 5 – Initial Screening Summary
Alternative Retains Functionality
Excessive Cost
Significant Impact
Maintains Navigation
Existing Authority
A – Fix as Fails This is the Base Plan / No Action Plan B – Major Rehab Yes No Yes Yes Yes C – Replace In-Kind No No Yes Yes Yes D – Replace - 6-Lane Yes No No Yes Yes E – More Thru Lanes Yes Yes No Yes No F – Single Bridge Yes Yes Yes Yes No G – Third Bridge Yes No No Yes No H – Two Tunnels Yes Yes No Yes No I – Single Tunnel Yes Yes No Yes No J – Low Draw Spans No No Yes No Yes K – Causeways No No Yes No No L – Fill-in - Abandon No Yes Yes No No

Cape Cod Canal Highway Bridges, MA Final Report Major Rehabilitation Evaluation Report 35 March 2020
Four of the alternatives identified and discussed above were developed into detailed plans and will be carried forward for further analysis. Each of these plans is within the USACE existing authority for operation, maintenance, repair, rehabilitation and replacement of the Cape Cod Canal FNP project features. No new legislation would be required for implementation. Table 6 lists and describes the detailed plans. These detailed plans are: (A) No Action – Maintenance and repair of both bridges continues without any major
rehabilitation. Bridge components are repaired or replaced when inspections yield unsatisfactory reliability ratings.
(B) Major Rehabilitation - All known structural, mechanical, and electrical deficiencies will be addressed and obsolete components replaced for both bridges.
(D) Bridge Replacement including auxiliary acceleration/deceleration lanes for one or both bridges. A full replacement bridge will be built parallel to one or both existing bridges. Each new bridge will include four vehicle through-travel lanes and two auxiliary lanes to facilitate safe exit and entrance from the connecting surface roads. A pedestrian/bicycle lane would also be included on each bridge. The existing bridge(s) will remain in service until the new bridge(s) are completed.
Table 6 – List of Alternative Plans Carried Forward for Detailed Analysis Plan Description Special Considerations Base
A Continued Maintenance and Repairs to Both Existing Bridges as Needed to Maintain Safety (Fix as Fails)
This is the Federal Base Plan – the Without-Project Condition or the No Action Plan
B A Program of Repairs and Major Rehabilitation for Both Bridges to Maintain Safety and Avoid Future Restrictions on Bridge Weight Postings
Major Rehabilitation of Each Bridge is Required about every 45 Years.
D Replacement of One or Both Highway Bridges with New Bridges having Four Through-Traffic Lanes and Two Acceleration/Deceleration Lanes
Each Old Bridge would Remain in Service until the New Bridge was Completed
4.0 PROJECT BASELINE – THE EXISTING HIGHWAY BRIDGES 4.1 The Existing Bridges in General The Base Condition is conceptually equivalent to the "without project" condition for new project evaluations in the sense that the benefits, costs, and impacts of all alternatives are measured by comparison to the Base Condition. For NEPA purposes, the Base Condition is the No Action condition. Both highway bridges are in deteriorated condition, well beyond the state in which actions and funding from the Operations and Maintenance Program could correct the deficiencies and restore and sustain reliability. In an operational sense, the underlying assumption of the Base Condition is that the bridges will continue to be operated and maintained without the proposed rehabilitation to any of their components. In the event of unsatisfactory performance of a bridge component, it is further assumed that emergency funding will be made available to make repairs and correct problems as they may arise.

Cape Cod Canal Highway Bridges, MA Final Report Major Rehabilitation Evaluation Report 36 March 2020
Under the Base Condition, the reliability of the bridge is allowed to fall below the current level, however the bridge does remain functional. Both of the existing highway bridges were built in 1933 to 1935 and are now nearing 85 years of service. The existing bridges undergo a regular cycle of inspection, the results of which guide maintenance and repair actions. While the bridges remain in fair condition, operations, maintenance and repair costs continue to escalate as the structures age. Lane closures for maintenance and repairs and other restrictions on vehicular passage will also increase with adverse impacts to traffic and access by emergency responders. Ultimately within the 50-year economic period of this study the two bridges will each separately reach the point where escalating repair needs force weight limit posting of the bridges. The fix-as-fails base condition is meant to address health and public safety issues by capturing the items necessary to prevent a potential bridge failure. Even with continuing inspection and repair there is uncertainty regarding bridge failure, where a bridge is completely closed for a prolonged period. However, with a proper comprehensive program of inspection, repair and maintenance as needed the risk of failure of either bridge is low.
4.2 Bridge Maintenance and Repair History and Costs Both highway bridges are of similar steel truss design, consisting of a center span over the waterway supported by concrete piers on each side of the channel, two main side spans to the north and south of the center span, and concrete abutments on shore. Additionally the Bourne Bridge includes four approach spans, two on each shore, between the main side spans and the concrete abutments. This gives the Sagamore Bridge a total of three spans, and the Bourne Bridge a total of seven spans. Both bridge center spans have a minimum vertical navigation clearance of 135 feet above mean high water over the width of the channel. Figure 7 shows the major components of the Bourne Bridge. The center spans are through arch truss suspended spans with cables suspending the roadway deck from the arch. The main side spans are deck trusses. The abutments are reinforced concrete multi-chambers that connect with the roadways. A series of ladders, platforms and catwalks provide access for inspection and maintenance for the abutments, pier caps, floor system and truss arches. The decks are steel grids filled with five inches of concrete and topped with a 2 inch bituminous concrete surface. Channel piers are located within the Canal and are atop pedestals which are on footings. Each pier is a pair of hollow concrete columns set on individual pedestals and joined at the top by a concrete strut. For both bridges each channel pier column is 24 feet square at the bottom tapering to 15 feet square at the top. For the Bourne Bridge the four piers between the approach spans are solid concrete columns 20 feet square at the base tapered to 14 feet square at the top joined by a tapered concrete strut. Design statistics for the existing highway bridges are shown in Table 7. The bridge superstructure and substructure are shown in Figure 8.

Cape Cod Canal Highway Bridges, MA Final Report Major Rehabilitation Evaluation Report 37 March 2020
Table 7 – Existing Highway Bridge Design Dimensions Bourne Bridge Sagamore Bridge Bridge Length (Feet) Center Span 616 Feet 616 Feet Two Main Side Spans 396 Feet Each 396 Feet Each Approach Spans 208 to 270 Feet Long (4) None North Concrete Abutment 150 Feet 200 Feet South Concrete Abutment 150 Feet 225 Feet Total Bridge Length 2,684 Feet 1,833 Feet Decks Travel Lanes Four 10-Foot Lanes Four 10-Foot Lanes Sidewalks One 6-Foot 8-Inch Walk One 6-Foot 8-Inch Walk Brush Curb One 2-Foot Curb One 2-Foot Curb Total Width between Curbs and Sidewalk 48 Feet 8 Inches 48 Feet 8 Inches
Both highway bridges have had a typical maintenance, repair and rehabilitation history since completion of initial construction in 1935. Painting of the steel superstructure is required every five to ten years. The maintenance and repair history for the Bourne Bridge is presented in Table 8, and for the Sagamore Bridge in Table 9. Maintenance and repair of the two highway bridges represent a large portion of the Canal’s annual operation and
Figure 8 Major Bridge Components
Bourne Bridge
Channel Piers
Looking Northeast South Abutment Not Shown
Center Span North
Abutment

Cape Cod Canal Highway Bridges, MA Final Report Major Rehabilitation Evaluation Report 38 March 2020
maintenance costs. Costs are contract costs only as taken from the Annual Reports of the Assistant Secretary of the Army for Civil Works for the years since the last major rehabilitation of both bridges beginning in 1981.
Table 8 Bourne Bridge Maintenance and Repair History
Year Work Performed Cost ($1000s)
1938 Painted superstructure 1938 Sealed coated wearing surface - sheet asphalt 1947 Painted superstructure 1949 Replaced bituminous pavement 1952 Painted superstructure 1958 Painted superstructure 1959 Replaced 4 anchor bolts (Piers 3 and 5) 1963 Resurfaced roadway and sidewalk; new curbing; new scuppers; replaced 5-
foot strip of deck concrete adjacent to the sidewalk and the brush curb; electrical work; concrete repairs; access ladders; platforms and downspouts
1967 Painted superstructure 1969 Pressure grouting of cracks in concrete abutments and piers 1971 Painted railings 1973 Painted superstructure
1976 Repaired two stringers, Span 4; replaced sidewalk bracket, Span 1, removed bird droppings from abutments; removed two pairs of hanger cables for testing and replaced with new cables
1979-1981
Removed existing deck and replaced with lightweight concrete filled steel grid deck; installed new waterproofing membrane and bituminous wearing surface; strengthened upper and lower bracing in Spans 4 to 7; repaired over 250 members; repaired or replaced over 200 gusset/stay plates; replaced approximately 3000 deteriorated rivets with high strength bolts; installed new roadway joints; and painted superstructure
$12,958
1984-85 Placed new waterproofing membrane on sidewalk and curb $151 1985 Repair of Suicide Deterring Fencing $44 1985 Emergency Repairs to Bourne Bridge Paving Surface $7
1986-1987
New hanger cables installed; new drainage pipes installed; new waterproofing on curb; patched spalls and injected cracks on abutments, piers, and parapets; electrical work; painted superstructure
$2,775
1988-1989
Removed existing bituminous waterproofing membrane and top 1-1/2 inch of deck concrete on abutments; placed new 1-1/2 inch micro-silica overlay; new waterproofing membrane and bituminous concrete wearing surface. (Joint contract both bridges)
$428
1992 Painted superstructure. $2,239 1997 Repaired/replaced deck joints at South Abutment, Pier 3 & North Abutment. $25 1999 Replaced deck joint at Pier 4; major concrete repairs to abutments and piers.

Cape Cod Canal Highway Bridges, MA Final Report Major Rehabilitation Evaluation Report 39 March 2020
Table 8 - Bourne Bridge Maintenance and Repair History (Continued)
1999- 2000
Replaced concrete parapets; repaired sidewalk and curbs; replaced waterproofing membrane and bituminous wearing surface on deck and abutments; miscellaneous electrical work. (Joint contract both bridges)
$1,585
2001 Major substructure rehabilitation including: concrete spall repairs to piers, abutment seats, abutment chamber walls and bents and concrete stringer repairs within chambers.
$2,229
2004-06 Painted superstructure with work completed in 2006. $8,476
2009-2010
Deck rehabilitation contract performed. Removed the existing asphalt pavement and waterproofing membrane on both abutments and the steel superstructure deck; repaired concrete substrate on abutments; repaved entire length of bridge with Rosphalt. (Joint contract both bridges)
$1,822
2010-2014
Steel repairs throughout the entire length of the bridge including gusset plate patch plates, replacement of sway bracing, replacement of missing rivets with bolts at member connections and lacing bar connection, removal of fatigue sensitive weld details on truss members, floorbeams and stringers and replacement of deck drainage support brackets with new drainage downspouts. $6.8 million (Joint contract combined with Sagamore Bridge Steel Repairs – Total $9.7 million).
$6,800
2019 Replace modular joint at Piers #3 & #4 $1,600 Total Maintenance and Repair Cost 1979-2017 $41,139 Annual Average 1979-2017 – 38 Years $1,055
Table 9 Sagamore Bridge Maintenance and Repair History
Year Work Performed Cost ($1000s)
1938 Paint superstructure 1938 Seal coated the wearing surface - sheet asphalt 1942 Paint railings 1947 Paint superstructure 1952 Paint superstructure 1955 Replace bituminous pavement 1959 Replace roller nest at north abutment
1962
Resurface roadway and sidewalk; new curbing; repair expansion joints; replace 5- foot strips of deck concrete adjacent to curbs; concrete repairs; new scuppers; electrical work
1963 Paint superstructure. Additional access ladders and platforms, downspouts added to scuppers, repairs to catwalk under deck, replace railing bolts
1964 10" Welded steel gas main installed beneath deck from abutment to abutment
1969 Rehabilitate sidewalk and curb; repair substructure cracks 1970 Door Repair 1970 Paint Superstructure 1974 Repair structural members, concrete, expansion joints, railings; misc. work 1975 Hanger Cable Replacement
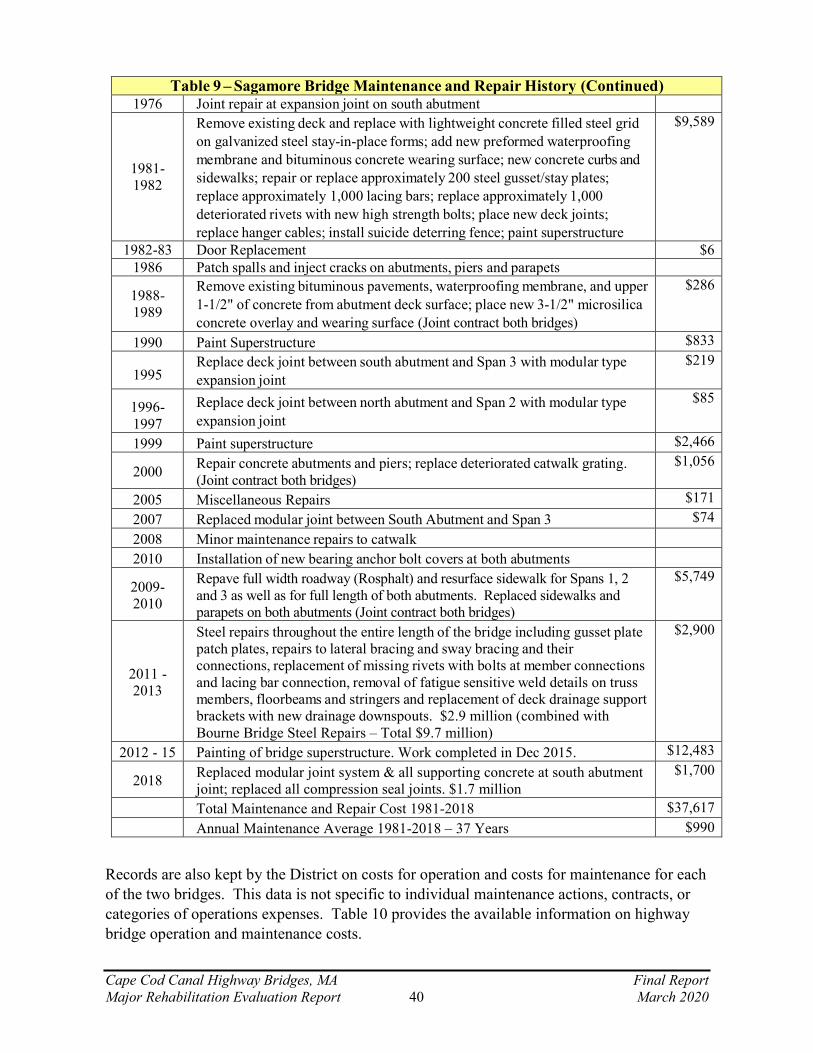
Cape Cod Canal Highway Bridges, MA Final Report Major Rehabilitation Evaluation Report 40 March 2020
Table 9 – Sagamore Bridge Maintenance and Repair History (Continued) 1976 Joint repair at expansion joint on south abutment
1981-1982
Remove existing deck and replace with lightweight concrete filled steel grid on galvanized steel stay-in-place forms; add new preformed waterproofing membrane and bituminous concrete wearing surface; new concrete curbs and sidewalks; repair or replace approximately 200 steel gusset/stay plates; replace approximately 1,000 lacing bars; replace approximately 1,000 deteriorated rivets with new high strength bolts; place new deck joints; replace hanger cables; install suicide deterring fence; paint superstructure
$9,589
1982-83 Door Replacement $6 1986 Patch spalls and inject cracks on abutments, piers and parapets
1988-1989
Remove existing bituminous pavements, waterproofing membrane, and upper 1-1/2" of concrete from abutment deck surface; place new 3-1/2" microsilica concrete overlay and wearing surface (Joint contract both bridges)
$286
1990 Paint Superstructure $833
1995 Replace deck joint between south abutment and Span 3 with modular type expansion joint
$219
1996-1997
Replace deck joint between north abutment and Span 2 with modular type expansion joint
$85
1999 Paint superstructure $2,466
2000 Repair concrete abutments and piers; replace deteriorated catwalk grating. (Joint contract both bridges)
$1,056
2005 Miscellaneous Repairs $171 2007 Replaced modular joint between South Abutment and Span 3 $74 2008 Minor maintenance repairs to catwalk 2010 Installation of new bearing anchor bolt covers at both abutments
2009-2010
Repave full width roadway (Rosphalt) and resurface sidewalk for Spans 1, 2 and 3 as well as for full length of both abutments. Replaced sidewalks and parapets on both abutments (Joint contract both bridges)
$5,749
2011 - 2013
Steel repairs throughout the entire length of the bridge including gusset plate patch plates, repairs to lateral bracing and sway bracing and their connections, replacement of missing rivets with bolts at member connections and lacing bar connection, removal of fatigue sensitive weld details on truss members, floorbeams and stringers and replacement of deck drainage support brackets with new drainage downspouts. $2.9 million (combined with Bourne Bridge Steel Repairs – Total $9.7 million)
$2,900
2012 - 15 Painting of bridge superstructure. Work completed in Dec 2015. $12,483
2018 Replaced modular joint system & all supporting concrete at south abutment joint; replaced all compression seal joints. $1.7 million
$1,700
Total Maintenance and Repair Cost 1981-2018 $37,617 Annual Maintenance Average 1981-2018 – 37 Years $990
Records are also kept by the District on costs for operation and costs for maintenance for each of the two bridges. This data is not specific to individual maintenance actions, contracts, or categories of operations expenses. Table 10 provides the available information on highway bridge operation and maintenance costs.

Cape Cod Canal Highway Bridges, MA Final Report Major Rehabilitation Evaluation Report 41 March 2020
Table 10
Recent Operation and Maintenance Costs for the Two Highway Bridges
Year Bourne Bridge Sagamore Bridge Maintenance Operation Maintenance Operation
2010 $12,000 $231,000 $2,542,100 $58,600 2011 95,400 86,800 2,037,000 102,700 2012 117,300 33,900 207,800 2013 38,200 369,700 8,186,000 161,600 2014 150,600 1,400 4,174,100 127,800 2015 319,200 709,200 2016 8,400 252,300 2017 339,300 24,000 2018 103,200 251,800 249,400 Total $516,900 $1,381,200 18,026,400 $976,400
Annual Average over 9 Years $57,400 $153,500 $2,002,900 $108,500
Note: Years with no value stated represent years for which data is not available. 4.3 Current Condition and Reliability Analysis - Methodology The process for engineering and economic analysis of the existing highway bridges, their rehabilitation, and alternatives to major rehabilitation follows a phased process. The existing bridge conditions are determined through various evaluations. The requirements for a program of major rehabilitation are developed and an estimate of the cost of implementing that program is determined. Requirements and costs for the various alternatives to major rehabilitation are then investigated and determined using the risk assessment principals of structural reliability analysis. The first three steps are discussed in this section.
1) Determine the current physical condition of the two highway bridges. Current and historical component condition ratings are identified for major structural components (deck, superstructure and substructure) using National Bridge Inspection Standards. A poor rating would lead to a determination of “structurally deficient”. Where the roadway no longer meets today’s minimum design standards it is determined “functionally obsolete”.
2) Determine likely future changes in physical condition using fatigue analysis and corrosion analysis. A load-induced fatigue analysis was conducted in accordance with current AASHTO standards and criteria. A corrosion analysis was conducted to aid in determining the overall long-term impact of corrosion on various bridge members, including the trusses, floorbeams, stringers and gusset plates, in relation to load rating factors over the 50-year study period.
3) Determine the requirements for a major rehabilitation program for each bridge. Develop a rough order of magnitude cost estimate for a program of major rehabilitation for each of the two bridges.

Cape Cod Canal Highway Bridges, MA Final Report Major Rehabilitation Evaluation Report 42 March 2020
4.4 Current Physical Condition of the Highway Bridges 4.4.1 Criteria and Condition Rankings
The overall condition of both the Bourne and Sagamore highway bridges continues to worsen as the bridges age and major maintenance projects becomes more frequent. As the condition deteriorates, this leads to the bridges becoming structurally deficient. Both bridges are functionally obsolete and structurally deficient and are routinely unable to accommodate an efficient flow of traffic within the current State and local roadway network leading to the bridge approaches.
A functionally obsolete bridge is one that was built to standards that are not used today. Functionally obsolete bridges are those that do not have adequate lane widths, shoulder widths, or vertical clearances to serve current traffic demand, or those that may be occasionally flooded. A structurally deficient bridge is one where significant load bearing elements such as the deck, substructure or superstructure are found to be in poor or worse condition. Deficient bridges require repair or rehabilitation to address deficiencies and are often posted with reduced weight limits on vehicles. The bridge components are shown in Figure 9.
The Bourne and Sagamore Bridges are each inspected every 24 months according to the current National Bridge Inspection Standards (NBIS). The NBIS sets the national standards for the proper safety inspection and evaluation of all highway bridges in accordance with 23 U.S.C. 151 in order to ensure the safety of the traveling public. Inspections apply condition
Figure 9 Major Bridge Components
Bourne Bridge
Channel Pier Substructure
North Abutment
Substructure
Arch Truss Superstructure
Deck
Piers Substructure
Deck Trusses Superstructure
Looking North

Cape Cod Canal Highway Bridges, MA Final Report Major Rehabilitation Evaluation Report 43 March 2020
ratings to the various bridge components using the Federal Highway Administration (FHWA) Recording and Coding Guide for the Structure Inventory and Appraisal of the Nation’s Bridges. Individual bridge components (see Figures 7 and 8) are assigned condition ratings on a scale of 0 (Failed Condition) to 9 (Excellent Condition), as shown in Table 11. Condition ratings are used to describe the existing, in-place bridge as compared to the as-built condition and to determine structural deficiency. Evaluation is for the materials and physical condition of the deck, superstructure, and substructure components of a bridge.
Table 11 Bridge Component Condition Ratings
Code Description Commonly Employed
Feasible Actions
9 EXCELLENT CONDITION Preventive
Maintenance 8 VERY GOOD CONDITION No problems noted.
7 GOOD CONDITION Some minor problems.
6 SATISFACTORY CONDITION Structural elements show some minor deterioration. Preventive
M aintenance; and/or Repairs
5
FAIR CONDITION All primary structural elements are sound but may have some minor section loss, cracking, spalling or scour.
4 POOR CONDITION Advanced section loss, deterioration, spalling or scour.
Rehabilitation or Replacement
3
SERIOUS CONDITION Loss of section, deterioration, spalling or scour have seriously affected primary structural components. Local failures are possible. Fatigue cracks in steel or shear cracks in concrete may be present.
2
CRITICAL CONDITION Advanced deterioration of primary structural elements. Fatigue cracks in steel or shear cracks in concrete may be present or scour may have removed substructure support. Unless closely monitored the bridge may have to be closed until corrective action is taken.
1
IMMINENT FAILURE CONDITION Major deterioration or section loss present in critical structural components or obvious vertical or horizontal movement affecting structure stability. Bridge is closed to traffic but corrective action may put back in light service.
0 FAILED CONDITION Out of service, beyond corrective action. Appendix A contains a detailed description of both bridges, the results of the biennial bridge inspections, and a history of bridge condition ratings over time. A summary of these inspection results is provided below.

Cape Cod Canal Highway Bridges, MA Final Report Major Rehabilitation Evaluation Report 44 March 2020
4.4.2 Bourne Bridge Physical Condition The Bourne Bridge (as of the 2016 inspection) is both structurally deficient and functionally obsolete. The deck is in fair condition with a rating of 5 due to continuing deterioration of the deck in the abutment spans. The superstructure is in poor condition with a rating of 4 despite recent steel repairs and the removal of fatigue sensitive detail welds, due to continuing deterioration of truss joint gusset plates. The substructure remains in good condition with a rating of 7. Figure 10 shows the history of condition ratings for the Bourne Bridge since 1971, including the last major rehabilitation cycle in 1981. Table 12 provides a summary of the condition rating of these major components.
Figure 10 – History of Condition Ratings – Bourne Bridge
The bridge traffic safety features, including the bridge railing, transitions, approach guardrails and approach guardrail ends, do not conform to current AASHTO or MassDOT Specifications. These elements are thus rated as not meeting currently accepted standards.
The railings and anti-missile fence are composed of a nonstandard configuration and do not conform to current MassDOT standards. Additionally, there are areas with no positive connections at the transitions between the approach guardrails and the concrete end posts, and some of the w-beam approach guardrails do not conform to current MassDOT standards.
7 76 6 6 6
8 8 87 7
8
6 6 6 67 7 7 7 7 7
5 5
7 76 6 6 6 6 6 6 6 6
8
6 65 5 5 5 5
3 34 4 4
7 7 7 7 7 7 7 7 7 7 78
6 6 6 67 7 7 7 7 7 7 7
BOURNE BRIDGE CONDITION RATINGS
DECK (ITEM 58) SUPERSTRUCTURE (ITEM 59) SUBSTRUCTURE (ITEM 60)

Cape Cod Canal Highway Bridges, MA Final Report Major Rehabilitation Evaluation Report 45 March 2020
Table 12 – Bourne Bridge Component Condition Ratings
Component Rating Example Conditions
Deck 5 Deteriorated deck area over the abutments. Deteriorated deck joints.
Superstructure 4
Gusset plates with significant section loss and deformation (five spans of the west truss and 3 spans of the east truss). Fatigue details on critical members and stringers. Pack rust, warping and section loss to truss members, stringers, and floor beams. Suspender cables and pain are in overall fair condition. The bridge seat is undermined at some of the concrete beams and there is scaling, spalling, and delamination of concrete beams in both abutments.
Substructure 7 Overall good condition. However there are some specific areas of deterioration including spalling, cracking, and delamination on abutment walls and struts
See Appendix A for complete report on Engineering Reliability 4.4.3 Sagamore Bridge Physical Condition The Sagamore Bridge (as of the 2017 inspection) is functionally obsolete and has been found structurally deficient as recently as 2011. The deck is in fair condition with an overall rating of 5. The superstructure and substructure are also in fair condition with overall ratings of 5. However individual bridge components warrant overall ratings of poor, such as the gusset plates and other connection plates. Figure 11 shows the history of condition ratings for the Sagamore Bridge since 1969, including the last major rehabilitation cycle in 1981. Table 13 provides a summary of the condition rating of these major components.
Figure 11 – History of Condition Ratings – Sagamore Bridge
7 7
6
5
4 4
8 8 8
7 7
8
6 6 6 6
5
6 6
5
4 4
5 5 5
7 7 7 7 7 7 7 7 7 7 7
8
6 6 6 6 6 6 6
5 5 5 5 5 5
7 7 7 7 7 7 7 7 7 7 7 7
6 6
4 4
6 6 6 6 6 6
5 5 5
SAGAMORE CONDITION RATINGS
DECK (ITEM 58) SUPERSTRUCTURE (ITEM 59) SUBSTRUCTURE (ITEM 60)

Cape Cod Canal Highway Bridges, MA Final Report Major Rehabilitation Evaluation Report 46 March 2020
4.4.4 Fatigue Analysis Summary
As part of this Engineering Reliability Analysis, a load-induced fatigue analysis was conducted in accordance with current AASHTO standards and criteria (LRFD Bridge Design Specifications (LRFD) and the Manual for Bridge Evaluation (MBE)). The fatigue analysis was conducted for truss members, floorbeams, and stringers. The fatigue analysis results indicated that all primary load carrying members of the truss or flooring system (floorbeams, stringers, etc.) have an infinite fatigue life. All of the fatigue sensitive details (FSDs); the trusses, floorbeams, and stringers are routinely monitored for cracks, and some do have a finite fatigue life. Section 5 of the Engineering Reliability Analysis Appendix presents a detailed discussion of the methodology and results of the fatigue analysis including load stresses, fracture toughness, and fatigue life.
Table 13 – Sagamore Bridge Component Condition Ratings
Component Rating Example Conditions
Deck 5
Deteriorated deck along the deck joint headers (spalling, exposed rebar, delamination). Deteriorated truss span deck along exterior stringers. Deck cracking on abutment spans. Vertical misalignment of the roadway at the south abutment span (Span 3 northbound). Spalling of reinforced concrete.
Superstructure 5
Gusset plates with significant section loss and deformation due to pack rust (three spans of the west truss and 2 spans of the east truss). South abutment bearings at end of expansion range. Bent anchor bolts. Fatigue details on critical members and stringer flanges. Pack rust, warping and section loss to truss members, stringers, and floor beams. Suspender cables and pain are in overall fair condition. Scaling, spalling, and delamination of concrete beams is seen in both abutments.
Substructure 5 Spalling, cracks, and delamination on south abutment walls.
See Appendix A for complete report on Engineering Reliability
4.4.5 Corrosion Analysis Summary A corrosion analysis was conducted to aid in determining the overall long-term impact of corrosion on various critical bridge members, including the trusses, floorbeams, stringers and gusset plates, in relation to load rating factors over the 50-year study period. Corrosion rates for this study were determined from measurements taken on fascia stringers of the Sagamore Bridge and on truss members and gusset plates of both the Sagamore and Bourne Bridges. The analysis determined an average corrosion rate of 0.0027 inches/year, which falls within the expected range of 0.002 to 0.003 inches for coastal areas with moderate salinity (See Appendix A – Engineering). This corrosion analysis found that various main truss gusset plates will likely have rating factors less than 1.0 in ten to twenty years. Substantial costs will need to be incurred to

Cape Cod Canal Highway Bridges, MA Final Report Major Rehabilitation Evaluation Report 47 March 2020
replace or rehabilitate the gusset plates within the 50-year study period in order to prevent the bridges from being posted for weight restrictions. Further, both the stringers and the floorbeams will have reduced capacity that may result in the need to initiate weight restrictions on both bridges in 20 to 30 years, or less. It is also likely that overweight permits will also need to be restricted when the bridge is load posted.
Section 5 of the Engineering Reliability Analysis Appendix (Appendix A) presents a detailed discussion of the methodology and results of the corrosion analysis including rates of corrosion, application of those rates to critical members, and the impact of posting the bridges for weight restrictions within the 50-year period of analysis should no replacement and or rehabilitation of those critical bridge members take place.
4.5 Base Condition Fix-as-Fails Actions and Costs Below in Table 14 are some of the types of repairs and the associated repair costs to various components and elements of the bridges which could possibly comprise this scenario of “fix-as-fails”. It is not an all-inclusive list of potential issues, but these items should effectively cover the major components that would be expected to fail or at least need repairs under this scenario. These repairs could happened at any time in the project life cycle as various components fail.
Table 14 – Base Condition – Potential Repair Actions and Costs ($000s)
Bridge Component Sagamore Bridge
Bourne Bridge
Superstructure: 1. Advanced deterioration of secondary member, non-critical gusset plate, stringer, floor beam, or hanger cable
$6,600 $6,200
2. Advanced deterioration of main truss member or critical gusset plate
$15,300 $20,200
3. Catastrophic damage to main truss member or critical gusset plate $310,300 $547,700
Bridge Deck: 1. Localized deterioration of roadway joint(s), granite curbs, concrete-filled steel grid over bridge spans, or reinforced concrete deck at the abutments
$5,100 $5,800
2. Widespread deterioration of concrete-filled steel grid deck over bridge spans and reinforced concrete deck at abutments
$5,900 $7,600
Substructure: 1. Localized concrete defects such as cracks or spalls on vertical surfaces of piers or degradation of concrete under bearings on piers
$400 $500
2. Widespread concrete defects such as cracks or spalls on vertical surfaces of piers or degradation of concrete under bearings on piers
$700 $1,100
Note: Potential component failures listed above are from the Engineering Reliability Analysis Appendix (A), page A-34. Also in Table D-6 in the Economics Appendix (D).

Cape Cod Canal Highway Bridges, MA Final Report Major Rehabilitation Evaluation Report 48 March 2020
4.6 Base Condition Traffic Impacts The emergency repairs under the Base Condition will have unscheduled impacts to surface and marine traffic. Though best efforts would be made to complete repairs outside of major holiday weekends and the tourist season this cannot be guaranteed and some impacts to those times are likely over the longer term. Table 15 below shows the potential component failures from Table 13 with the anticipated traffic impacts and costs of those failures should they arise.
Table 15 Base Condition Traffic Impacts and Costs (FY2020 - $000s)
Component and Failure Description Traffic Impact Sagamore
Bridge Costs Bourne
Bridge Costs
Superstructure 1 9 Months Lane Closures $32,700 $21,100 2 18 Months Lane Closures $321,200 $186,200 3 60 Months Bridge Closure $10,343,400 $4,584,000 Bridge Deck
1 6 Months of Temporary Lane Closures $21,800 $14,100
2 15 Months of Temporary Lane Closures $54,400 $35,200
Substructure 1 6 Months of Lane Closures $18,300 $13,400 2 12 Months of Lane Closures $36,600 $26,700 * According to MassDOT trucks account for roughly 6% of traffic traveling over the bridges. Therefore 6% of traffic was rerouted as if full bridge closure for 12 months.
Traffic back-ups due to lane restrictions affect the connecting surface roads on both sides of the Canal. Higher summer and weekend traffic volumes compound the impacts. Average daily traffic volumes in 2014 (total for both bridges) fluctuate from a low of about 15,000 on winter weekend days to about 28,000 on summer weekend days. The Base Condition assumes a fix-as-fails scenario where repairs are made as needed to keep the bridges functioning. Under that existing or Base Condition the annual travel costs for vehicle delays in terms of time lost and increased fuel consumption due to traffic delays from unscheduled repairs total about $118.9 million for the Sagamore Bridge and $60.7 million for the Bourne Bridge (see Economic Appendix (D), Tables 21 and 22). These traffic delay costs results from running the Monte Carlo simulations on the component failure costs on the results of the table above.

Cape Cod Canal Highway Bridges, MA Final Report Major Rehabilitation Evaluation Report 49 March 2020
5.0 STRUCTURAL RELIABILITY ANALYSIS This structural reliability analysis serves as the probabilistic basis for an economic analysis that drives the decision making process by demonstrating the best economic alternative for addressing the deteriorating performance of the ageing Bourne and Sagamore Bridges. Reliability calculations are prepared for years 2016 to 2065, consistent with the prescribed 50-year service life for economic analysis. The highway bridges are features of the Cape Cod Canal Federal Navigation Project, and the period of analysis for navigation projects is 50 years. The three alternatives evaluated for reliability are: Plan A – the Base Condition, Plan B – Major Rehabilitation, and Plans C and D – Bridge Replacement.
5.1 Reliability Concepts Reliability is defined as the probability that unsatisfactory performance will not occur. A “Limit State” is defined as the point at which unsatisfactory performance will occur or the engineering consequence will have some adverse economic impact. For this study, the limit state for unsatisfactory performance is defined as the physical condition where any of the bridges’ critical elements is assigned a Condition Rating of 4 (Poor Condition) or less in accordance with protocols of the National Bridge Inspection Standard (NBIS). Defining unsatisfactory performance based on the physical condition of the bridges using NBIS Condition Rating codes provides a viable way of determining a set of data points necessary for the regression analysis. USACE has historic data pertaining to the condition rating codes and this data can also be extrapolated for further analysis. In addition, this type of data is consistent with information in the national bridge inventory where data from similar types of bridges of similar age and environment can also be used for comparison purposes. Detailed analysis is provided in Appendix A – Engineering Reliability.
5.2 Deterioration Models The overall reliability of the bridges is governed by three critical elements: superstructure, bridge deck, and substructure. Unsatisfactory performance of one or more of these critical elements would lead to unsatisfactory performance of the entire bridge. In order to assess the engineering reliability of the bridges, a probabilistic hazard function was developed for each of the three critical elements. The hazard function describes the probability of failure during a very small time increment, assuming that no failures have occurred prior to that time. For each critical element, a two-parameter (defined by a shape parameter and a scale parameter) Weibull Probability Distribution was developed to predict deteriorating bridge element performance over a fifty-year service life. The two parameter Weibull is often used in failure analysis, because no failure can happen before time zero. The Weibull Probability Distribution is well accepted in academia and engineering literature as a methodology for assessing reliability and failure rates.

Cape Cod Canal Highway Bridges, MA Final Report Major Rehabilitation Evaluation Report 50 March 2020
For the superstructure and bridge deck, the NBI database was queried for bridges of similar construction and age to that of the Bourne and Sagamore Bridges located in New England, New York, and over the Chesapeake-Delaware Canal, which are geographic areas with similar environmental exposures. Since data for substructure elements are not easily searchable in the NBI database, standard data points adopted by the U.S Army Corps of Engineers’ Risk Management Center were used for the substructure deterioration model. These data points represent conglomerate data points for reinforced concrete locks, walls, and bridge piers. The Weibull Distribution parameters used for each of the three critical elements, are the shape parameter, β (which is equal to the slope of the line in a probability plot) and the scale parameter, η, is greater than 1, this indicates that the failure rate increases with time. This happens if there is an "aging" process, or parts that are more likely to fail as time goes on. Weibull Cumulative Distribution Function (CDF) and hazard rates developed for superstructure, decks, and substructure are presented in Appendix A - Engineering Reliability Analysis and an example for the Base Condition is shown in Figure 12 below. Weibull CDF is the probability of an event occurring within the time “t”. The hazard rate is a conditional failure rate in relation to the reliability of a system or component.
5.3 Reliability of Alternatives
Base Condition: Major Rehabilitation of both the Bourne and Sagamore Bridges was completed circa 1981. For development of the deterioration model, it is assumed that the rehabilitation of the superstructure extended the service life by twenty years. Since the bridge deck was replaced completely as part of the major rehabilitation, the time variable is reset to zero in year 1981. No adjustment of the time variable for the substructure was made since only routine maintenance consisting of crack sealing and spall repairs has been performed over the life of the bridges.
Major Rehabilitation: For the Major Rehabilitation alternative, a postulated major rehabilitation of the two bridges in the years 2025-2031 is assumed to extend the service life of the superstructure and substructure by an additional twenty years and reset the time variable for the bridge deck to zero at the beginning of those rehabilitation efforts.
Bridge Replacement: For the Bridge Replacement alternative, the time variables for computing the reliability of the superstructure, bridge deck, and substructure are all reset to zero at the beginning of the replacement work.

Cape Cod Canal Highway Bridges, MA Final Report Major Rehabilitation Evaluation Report 51 March 2020
Figure 12 – Example Weibull CDF and Hazard Rates – Base Condition
0.0000.1000.2000.3000.4000.5000.6000.7000.8000.9001.000
0 20 40 60 80 100 120
Prob
abilit
y
Time, yrs
Superstructure - Weibull CDF and Hazard Rate
CDF
Hazard Rate
Reliability
0.0000.1000.2000.3000.4000.5000.6000.7000.8000.9001.000
-10 10 30 50 70 90 110
Prob
abilit
y
Time, yrs
Bridge Decks - Weibull CDF and Hazard Rate
CDF
Hazard Rate
Reliability
0.000
0.200
0.400
0.600
0.800
1.000
0 50 100 150
Prob
abilit
y
Year
Substructure - Weibull CDF and Hazard Rate
CDF
Hazard Rate
Reliability
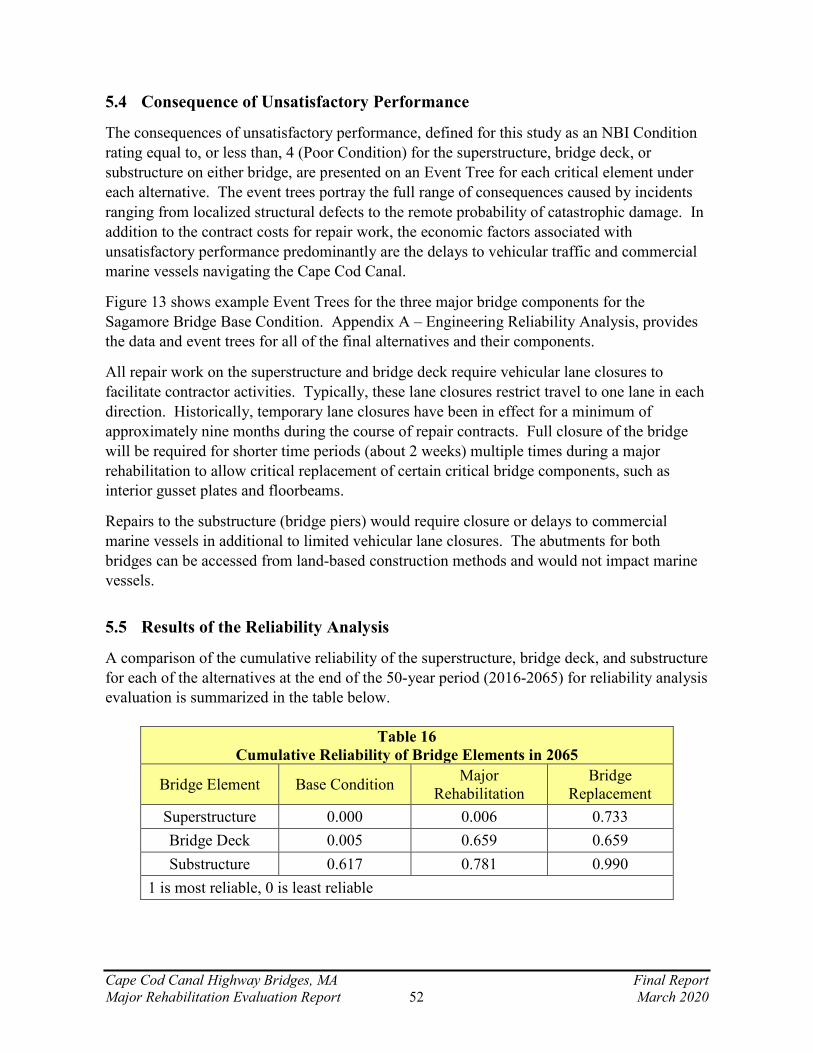
Cape Cod Canal Highway Bridges, MA Final Report Major Rehabilitation Evaluation Report 52 March 2020
5.4 Consequence of Unsatisfactory Performance
The consequences of unsatisfactory performance, defined for this study as an NBI Condition rating equal to, or less than, 4 (Poor Condition) for the superstructure, bridge deck, or substructure on either bridge, are presented on an Event Tree for each critical element under each alternative. The event trees portray the full range of consequences caused by incidents ranging from localized structural defects to the remote probability of catastrophic damage. In addition to the contract costs for repair work, the economic factors associated with unsatisfactory performance predominantly are the delays to vehicular traffic and commercial marine vessels navigating the Cape Cod Canal.
Figure 13 shows example Event Trees for the three major bridge components for the Sagamore Bridge Base Condition. Appendix A – Engineering Reliability Analysis, provides the data and event trees for all of the final alternatives and their components.
All repair work on the superstructure and bridge deck require vehicular lane closures to facilitate contractor activities. Typically, these lane closures restrict travel to one lane in each direction. Historically, temporary lane closures have been in effect for a minimum of approximately nine months during the course of repair contracts. Full closure of the bridge will be required for shorter time periods (about 2 weeks) multiple times during a major rehabilitation to allow critical replacement of certain critical bridge components, such as interior gusset plates and floorbeams.
Repairs to the substructure (bridge piers) would require closure or delays to commercial marine vessels in additional to limited vehicular lane closures. The abutments for both bridges can be accessed from land-based construction methods and would not impact marine vessels.
5.5 Results of the Reliability Analysis
A comparison of the cumulative reliability of the superstructure, bridge deck, and substructure for each of the alternatives at the end of the 50-year period (2016-2065) for reliability analysis evaluation is summarized in the table below.
Table 16 Cumulative Reliability of Bridge Elements in 2065
Bridge Element Base Condition Major Rehabilitation
Bridge Replacement
Superstructure 0.000 0.006 0.733 Bridge Deck 0.005 0.659 0.659 Substructure 0.617 0.781 0.990
1 is most reliable, 0 is least reliable

Cape Cod Canal Highway Bridges, MA Final Report Major Rehabilitation Evaluation Report 53 March 2020
Figure 13 – Event Tree Examples – Sagamore Bridge – Base Condition
A review of the predicted reliabilities in this table indicate that the Base Condition alternative yields the lowest reliability for all three of the critical elements. The deterioration model predicts with near certainty that both superstructure and bridge deck will be performing unsatisfactorily at the end of the 50-year period of evaluation.
Sagamore Bridge Deck Deterioration Event Tree
Sagamore Bridge Substructure Deterioration
Event Tree
Sagamore Superstructure Deterioration Event Tree

Cape Cod Canal Highway Bridges, MA Final Report Major Rehabilitation Evaluation Report 54 March 2020
The 85 year old steel bridges are beyond their functional service life. Both of the highway bridges can be maintained to prolong their overall structural integrity, but both are functionally obsolete. The Base Condition would create troublesome situations during the 50-year study period. For example, at some point the bridges will need to have weight restrictions, and likely undergo emergency structural repairs, which may or may not have an impact on load postings. Emergency maintenance is costly and could lead to major traffic issues at uncertain times of the year. Delays, closures, and load postings associated with the Base Condition would have adverse economic impacts on the region’s businesses. A Major Rehabilitation project will have socio-economic impacts on the surrounding region due to long-term ongoing traffic delays and disruptions. Even with major rehabilitation the Bourne and Sagamore bridges are not suitable in the long term as primary links in the highway system of southeastern Massachusetts and Cape Cod. The engineering reliability analysis shows that the Bridge Replacement alternative offers the highest reliability of the three alternatives. Bridge replacement yields a higher reliability for the superstructure and substructure than major rehabilitation. The superstructure reliability of 0.006 for major rehabilitation makes this alternative a poor investment option. 6.0 MAJOR REHABILITATION
6.1 The Major Rehabilitation Alternative in General This section will present and evaluate Plan B - major rehabilitation of each of the two highway bridges over the Cape Cod Canal. The expected performance, reliability and engineering risk of the major rehabilitation alternative will be considered and compared to the base plan to determine relative effectiveness, cost and impacts towards meeting the planning goals to provide safe and reliable long-term vehicular access across the Cape Cod Canal. Plan B consists of implementing a program of repairs and major rehabilitation for both highway bridges to maintain safety and reliability over the 50-year planning horizon and avoid future restrictions on bridge weight postings. All known structural, mechanical, and electrical deficiencies will be addressed and obsolete components replaced for both bridges. More than one major rehabilitation program would be required; one at the beginning and one near the end of the planning horizon.
As with the Base Condition, the three major highway bridge systems that were analyzed for engineering reliability of each bridge are the substructure, superstructure and deck.

Cape Cod Canal Highway Bridges, MA Final Report Major Rehabilitation Evaluation Report 55 March 2020
6.2 Major Rehabilitation Actions Major rehabilitation projects are large scale structural improvements that are performed less frequently, outside of the purview of normal maintenance, and are aimed at prolonging the service life of the bridge, maintaining an acceptable load carrying capacity, and preserving overall public safety on the structure. This scenario assumes that all known structural deficiencies on both bridges will be addressed under a major rehabilitation contract. It is estimated that a full rehabilitation project would take 3 to 4 years for each bridge. Due to the need to divert traffic between two bridges during rehabilitation, to maintain sufficient traffic capacity, and lessen adverse impacts to traffic throughout the rehabilitation duration, only one bridge would be worked on at a time. This would result in an overall six to eight-year construction period for the rehabilitation of both bridges. Managing traffic impacts will be a considerable effort especially as some aspects of a major rehabilitation, such as replacement of interior gusset plates, will likely require complete bridge closure. The scope of a major rehabilitation project is projected to include the following actions for each highway bridge:
1) Truss Span Deck Replacement: The lightweight concrete filled steel grid deck was replaced in 1979 on the Bourne Bridge and 1981 on the Sagamore Bridge. A typical service life for this type of deck is 40+ years. Replacement of the deck would require frequent and lengthy lane closures and would run concurrent with major steel repairs below the deck. 2) Stringer Replacement/Repair: The current stringers are in overall fair condition for both bridges, except for the fascia stringers, some of which exhibit significant pitting and section loss to the bottom flanges. Numerous original stringers were replaced during the deck replacement projects for both bridges in 1979 and 1981. Fascia stringer replacement would take place in conjunction with a deck replacement project. 3) Floorbeam Repair: The floorbeams are in fair condition on both bridges, though floorbeams under the joints are vulnerable to corrosion due to leaking of failed bridge joints. No floorbeams have been replaced on either bridge, but the recent steel repair project in 2012 included repairs to some floorbeams, and the extent of required floorbeam repairs will increase as the bridges continue to age. Repairs would likely include the addition or replacement of cover plates and the removal of any fatigue sensitive details. 4) Suspender Cable Replacement: The suspender, or hanger, cables were replaced in 1981 on the Sagamore Bridge and in 1986 on the Bourne Bridge. There at 13 pairs of cables per side of each bridge. Temporary jacking beams are required to remove cable pairs. This work can be done with the deck replacement project. Cables such as this typically have a service life about 50 years, but the service life varies based on the environment and loading experienced by the cables. Over time, degradation and elongation of the bridge cables will determine the need for replacement. 5) Replace Abutment Spans: The concrete T-beams are in poor condition at the Bourne Bridge, and in fair condition at the Sagamore Bridge. The T-beams were repaired in 1999-2001 at both bridges, but these repairs were localized. Rehabilitation will require

Cape Cod Canal Highway Bridges, MA Final Report Major Rehabilitation Evaluation Report 56 March 2020
extensive concrete repairs to the beams to maintain their overall structural integrity. Complete replacement is required in order to significantly increase the service life of these elements. Beyond the T-beams, one-third of the area of the concrete deck of the abutments at the Sagamore Bridge is in poor condition. The Bourne Bridge abutment concrete deck is in overall good condition. The concrete deck on the abutments has been repaired numerous times since original construction of the bridges and currently much of the deck is deteriorated, which results in premature failure of any pavement overlay. The decks require replacement to regain the overall integrity of the abutment spans which should be undertaken at the same time as a truss span deck replacement project. 6) Bearing Repairs: The bearings are in overall poor condition at both bridges. There are 24 bearings at the Bourne and 8 at the Sagamore. Repairs would include any necessary seismic retrofits as well as installing new anchor bolts. 7) Joint Replacement: At the Sagamore Bridge, the modular joint system at the south abutment installed in 1995 was in serious condition due to spalling of the concrete supports, deterioration of the support bars, and vertical misalignment. This joint and supporting concrete was replaced in 2018 along with all of the compression seal joints. At the Bourne Bridge, the Pier 3 deck joint exhibits significant deflection under live loads and general deterioration throughout. This joint was partially repaired in 2010. The modular joint at Pier 4, repaired in 2005, is now deteriorated, misaligned, and has broken splice keys. Both Pier 3, Pier 4, and all the compression joint seals were replaced in the spring of 2019. The compression strip seals were all replaced in 2010 and on both bridges are now dislodged, missing, torn, or generally damaged and deteriorated. 8) Minor Steel Truss Repairs: Minor steel repairs would include additional work similar to the steel repair project completed in 2011-2013 for both bridges. This would include further exterior gusset plate retrofits on the main truss members, as well as repairs to some of the main truss members, secondary bracing, floorbeams, and stringers 9) Major Steel Truss Repairs: Major steel repairs would include the replacement of various members, as needed. This would include complete replacement of floorbeams and interior gusset plates. Replacement of major supporting elements such as floorbeams would require complete bridge closure during the replacement process. Replacement of interior gusset plates would require an extensive temporary support system during which each bridge would be closed to all traffic, although not concurrently. Other work would require periods of extensive lane closures. Only one bridge would be worked on at any one time. 10) Paving (Overlay): While paving in itself is not a major rehabilitation item, it would be included as part of an overall Major rehabilitation project. Paving was last accomplished in 2010 for both bridges. Paving would be done in conjunction with the deck replacement project. 11) Painting of Structural Steel: Both bridges have undergone complete paint removal (de-leading); the Bourne in 2006 and the Sagamore in 2014. While painting in itself is not a major rehabilitation item, it would be included as part of an overall major rehabilitation project. Active corrosion results in section loss and decreased load capacity of the members. Painting of the bridges is the single best method for preserving the current condition of the structural steel. Maintenance painting is required about once every seven years.
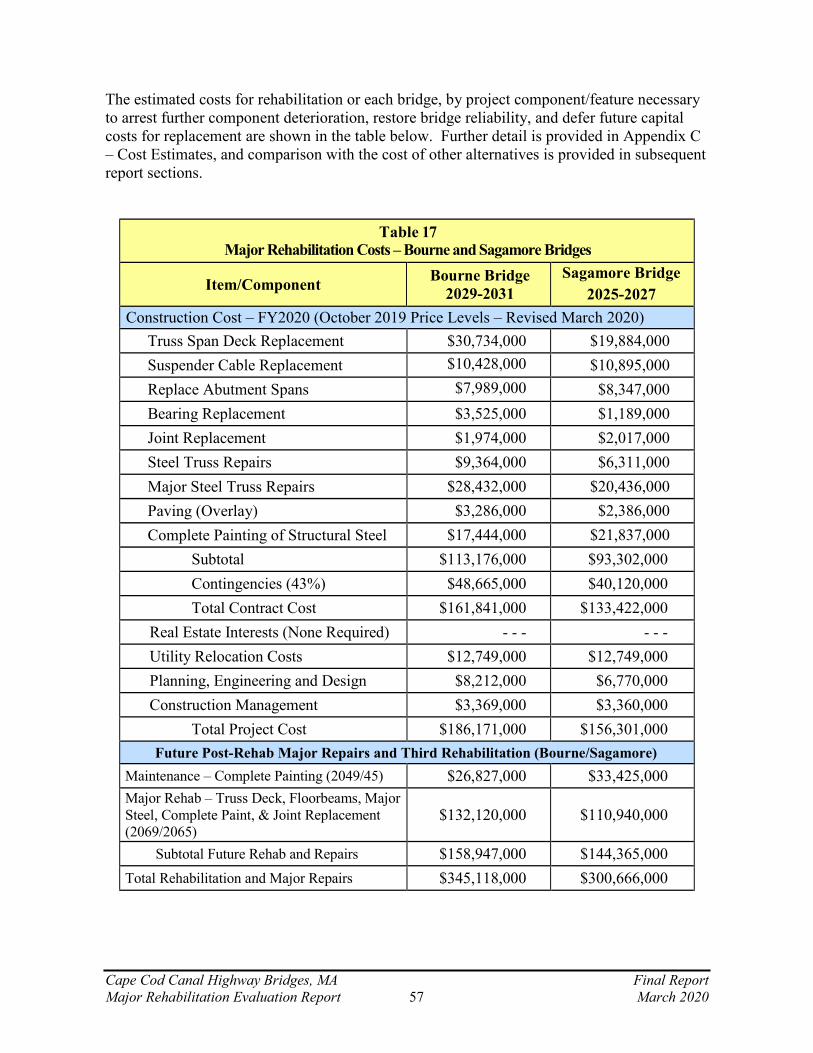
Cape Cod Canal Highway Bridges, MA Final Report Major Rehabilitation Evaluation Report 57 March 2020
The estimated costs for rehabilitation or each bridge, by project component/feature necessary to arrest further component deterioration, restore bridge reliability, and defer future capital costs for replacement are shown in the table below. Further detail is provided in Appendix C – Cost Estimates, and comparison with the cost of other alternatives is provided in subsequent report sections.
Table 17 Major Rehabilitation Costs – Bourne and Sagamore Bridges
Item/Component Bourne Bridge 2029-2031
Sagamore Bridge 2025-2027
Construction Cost – FY2020 (October 2019 Price Levels – Revised March 2020) Truss Span Deck Replacement $30,734,000 $19,884,000 Suspender Cable Replacement $10,428,000 $10,895,000 Replace Abutment Spans $7,989,000 $8,347,000 Bearing Replacement $3,525,000 $1,189,000 Joint Replacement $1,974,000 $2,017,000 Steel Truss Repairs $9,364,000 $6,311,000 Major Steel Truss Repairs $28,432,000 $20,436,000 Paving (Overlay) $3,286,000 $2,386,000 Complete Painting of Structural Steel $17,444,000 $21,837,000 Subtotal $113,176,000 $93,302,000 Contingencies (43%) $48,665,000 $40,120,000 Total Contract Cost $161,841,000 $133,422,000 Real Estate Interests (None Required) - - - - - - Utility Relocation Costs $12,749,000 $12,749,000 Planning, Engineering and Design $8,212,000 $6,770,000 Construction Management $3,369,000 $3,360,000 Total Project Cost $186,171,000 $156,301,000
Future Post-Rehab Major Repairs and Third Rehabilitation (Bourne/Sagamore) Maintenance – Complete Painting (2049/45) $26,827,000 $33,425,000 Major Rehab – Truss Deck, Floorbeams, Major Steel, Complete Paint, & Joint Replacement (2069/2065)
$132,120,000 $110,940,000
Subtotal Future Rehab and Repairs $158,947,000 $144,365,000 Total Rehabilitation and Major Repairs $345,118,000 $300,666,000

Cape Cod Canal Highway Bridges, MA Final Report Major Rehabilitation Evaluation Report 58 March 2020
Table 17 – Major Rehabilitation Costs – Bourne and Sagamore Bridges (Continued) Future Post-Rehab Maintenance and Minor Repairs (O&M) (Bourne/Sagamore)
Maintenance – Painting (2036/2032) $9,036,000 $11,213,000 Maintenance – Joint Replacement (2037/2033) $3,807,000 $3,877,000 Maintenance – Painting (2043/2039) $9,036,000 $11,213,000 Paving and Joint Replacement (2044/2040) $9,179,000 $7,832,000 Maintenance – Joint Replacement (2051/47) $3,807,000 $3,877,000 Maintenance – Painting (2056/2052) $9,036,000 $11,213,000 Paving and Joint Replacement (2059/2055) $9,179,000 $7,832,000 Maintenance – Painting (2063/2059) $9,036,000 $11,213,000 Total MR&R over 50 Years $62,116,000 $68,270,000 Total Project Cost – Rehabilitation and Future Maintenance, Repair and Rehabilitation
Total Project Cost $407,233,000 $368,936,000 See Appendix C for detailed cost estimates
For the purpose of allocating post-rehab costs to major repairs and rehabilitation versus maintenance and minor repairs, the two most expensive and technically involved actions were assigned to the former category and the remaining eight actions to the latter category. These categories will be separately discounted and averaged for the economic analysis.
6.3 Service Disruptions and Emergency Repairs The Bourne and Sagamore highway bridges provide the only access to Cape Cod for vehicular, pedestrian and other non-marine traffic. There are no ferries from the mainland to the Cape other than the passenger ferries from Boston to Provincetown which mainly carry summer day tourists. The Cape bridges also provide the only access to the ferry terminals at Woods Hole and Hyannis which serve the islands of Martha’s Vineyard and Nantucket, with the exception of a seasonal cargo ferry from New Bedford to Martha’s Vineyard. Bridge maintenance, repair and rehabilitation actions which require lanes closures would have adverse impacts on the flow of traffic, cost of transporting passengers and goods, air quality and other impacts. 6.3.1 Vehicular Traffic Management during Major Rehabilitation Traffic management will be a major task during a major rehabilitation project. It would likely include multiple and lengthy lane closures throughout the duration of the project and extended times where complete bridge closure would be required. This study did not analyze specific traffic control requirements or timeframes, so a generalized approach was used to provide an overall concept of what traffic management may be required for such a project. Table 18 summarizes lane closure and full bridge closure timeframes for a major rehabilitation of the

Cape Cod Canal Highway Bridges, MA Final Report Major Rehabilitation Evaluation Report 59 March 2020
Bourne and Sagamore Bridges. These are strictly gross estimates based on engineering judgment and similar previous work done at the bridges.
TABLE 18 Anticipated Traffic Management Requirements for Lane and Bridge Closures
Major Rehabilitation Activity Bourne Bridge Sagamore Bridge Lane Closure Duration (Days)
Bridge Superstructure Deck Replacement (Including Stringer Replacement) Abutment Span Replacement (Concrete T-Beams) Miscellaneous Steel Repairs, etc. Exterior Gusset Plate Retrofits Interior Gusset Plate Repairs Miscellaneous Concrete Repairs, etc.
165 135
Suspender Cable Replacement 65 70 Paving 30 25 Painting 220 150 Total Days of Lane Closures 480 380
Major Rehabilitation Activity Full Bridge Closure Duration (Days) Interior Gusset Plate Replacement 70 95 Floorbeam Replacement 110 35 Total Days of Full Bridge Closure 180 130
The impacts of lengthy lane closures will be most extensive for bridge superstructure and deck replacement and replacement of the abutment spans (T-Beams and concrete deck). Timeframes for items requiring full bridge closure will have enormous impacts on the local traffic pattern and likely the local economy, even if for just short lengths of time. Of course, weather delays, particularly during the winter months, would extend the duration of any project. It is assumed that weather delays could account for 15-30 days during the winter months, based on past efforts. 6.3.2 Navigation Traffic Management during Major Rehabilitation The Cape Cod Canal has significant value to navigation in the northern Atlantic seaboard. The Canal shortens the transit distance and time between points northerly and southerly of Cape Cod and increases the safety of navigation. Trips between New York and Boston, Providence and Boston, and New Haven and Boston benefit the most, but all traffic that can be accommodated in the canal’s 32-foot channel depth benefits significantly. Each year the canal is used by more than 3,000 cargo vessels, at least 750 fishing vessels, 150 – 200 military vessels, and more than 4,000 recreational vessels, all of which benefit substantially from the shorter and safer travel route. The largest commercial vessels which transit the US east coast, such as large oil tankers and containerships, typically have drafts too deep to use the canal and are not affected. But other large commercial vessels with drafts of 30 feet or less such as cruise ships and auto carriers use the Canal on a regular basis.

Cape Cod Canal Highway Bridges, MA Final Report Major Rehabilitation Evaluation Report 60 March 2020
Without the Canal in place, or with the waterway closed to traffic or its use restricted due to bridge work, vessels would have to travel the longer distance around the arm of Cape Cod, incurring increased transportation costs and increased risk of adverse weather conditions. Elements of the navigation value provided by the canal include benefits to cargo shipping, benefits to recreational vessel operators, and benefits to other types of vessels including cruise ships and military vessels. In all cases, the navigation benefits of the canal include reduced transportation costs and enhanced safety. Safety benefits can include damages prevented to vessels as well as the potential for prevention of loss of life. There would be minimal delays to marine navigation throughout the duration of a major rehabilitation project. Barge mounted cranes would likely not be necessary and were not used during the last major rehabilitation of both the Bourne and Sagamore Bridges in 1979 to 1981. That work consisted of replacement of the bridge decks, replacement and repairs to deteriorated stringers, replacement of hanger cables, repair of secondary members, replacement of corroded rivets and lacing bars, and painting of the superstructure. While the actions contemplated for this next major rehabilitation will be more extensive, no additional impact on vessel navigation through the Canal is anticipated. 7.0 BRIDGE REPLACEMENT ALTERNATIVES This section presents and evaluates the alternatives to major rehabilitation of the two highway bridges. The expected performance, reliability and engineering risk of each alternative will be considered and compared to the base plan to determine relative effectiveness, cost and impacts towards meeting the planning goals to provide safe and reliable long-term vehicular access across the Cape Cod Canal.
7.1 Bridge Replacement in General - Concept Level Alternatives
A new bridge type and design have not been accomplished for this study. Bridge replacement has been developed and evaluated at a concept level to weigh the costs, benefits, reliability, safety and risk relative to the Base Condition and the Major Rehabilitation Alternative for each bridge. The bridge replacement scenario postulates that new vehicular bridges will be constructed to replace each of the two existing highway bridges. One new bridge would be constructed parallel to the existing Bourne Bridge and the other parallel to the existing Sagamore Bridge. The existing Bourne and Sagamore Bridges would remain in service until the new bridges are constructed. For purposes of this Phase I study, a cable-stay bridge alternative concept was investigated and bridge location was assumed to be immediately next to and inshore of each existing bridge. The study area assumed for bridge replacement at each site is shown in Figure 14. Any bridge replacement would require further investigation to ascertain the most economical and favorable bridge type. The final bridge alignments, heights, grades, and overall configurations will likely be different from what is evaluated in this study.

Cape Cod Canal Highway Bridges, MA Final Report Major Rehabilitation Evaluation Report 61 March 2020
Figure 14 – Concept Level Siting Areas for Replacement Bridges The conceptual cable-stay bridge alternative presented here was based on the SR-1 Bridge over the Chesapeake and Delaware Canal at St. Georges, Delaware (Senator William V. Roth Jr. Bridge) constructed in 1992-1995. This bridge type was chosen for this study, in part, because it is a USACE owned bridge over a marine navigation canal (the Chesapeake and Delaware Canal) of similar proportions to the Cape Cod Canal. It provides an alternative similar to what would be required for a new bridge to cross the Canal. The Roth Bridge is 4,650 feet long and carries a total of 6 traffic lanes.
There is one replacement alternative for each bridge after initial screening. This alternative, Plan D would provide four through traffic lanes plus two auxiliary (acceleration/deceleration) lanes for access and exit to the adjacent surface roads. This plan is described as follows: Plan D – Replacement with Safety Modifications – Replacement of one or both highway bridges with new bridges each having four through-traffic lanes and two auxiliary acceleration/deceleration lanes, plus a pedestrian/bicycle lanes in accordance with modern highway standards. A full replacement bridge would be built parallel to one or both existing bridges which would remain in service until the new bridge is completed. The new bridges would be designed to modern highway standards in terms of lanes widths, medians, shoulders, grades, pedestrian and bicycle lanes and lane separation. The ramps to/from these roads are located immediately shoreward of the bridge abutments. The addition of auxiliary lanes in each direction of travel would facilitate safer exit and entrance from the connecting surface roads and would comply with FHWA and MassDOT highway and bridge design standards as noted earlier. This design would provide two unimpeded through-traffic lanes in each direction. Traffic safety would be improved by easing the effects of merging of entering and exiting traffic on through traffic.

Cape Cod Canal Highway Bridges, MA Final Report Major Rehabilitation Evaluation Report 62 March 2020
7.2 Sea Level Change Impacts on New Bridge Design The potential for future sea level change over the next 50 and 100 years must be examined to ensure adequate air gap clearance for navigation is maintained. The Canal, including its approaches, extends from Cleveland Ledge Light in Buzzards Bay to approximately 1.4 NM seaward of the canal’s eastern end breakwater light in Cape Cod Bay, a distance of approximately 15.5 NM. The land cut portion of the canal, between the Cape Cod Canal Traffic Control Center in Buzzards Bay and the East Mooring Basin in Sandwich, is approximately 5.9 NM in length, or 7.7 miles from the eastern jetties to the western dikes. Tidal regimes in Cape Cod Bay and Buzzards Bay are different with the former being tied to the Gulf of Maine and the latter directly to the North Atlantic.
The Bourne and Sagamore Highway Bridges, are fixed spans and have a minimum vertical clearance of 135 feet relative to Mean High Water (MHW). The railroad bridge at Buzzards Bay is a lift bridge, normally kept in the open (raised) position, and also has a minimum vertical clearance of 135 feet MHW. Two overhead power cables also span the Canal land cut with a minimum authorized clearance of 160 feet MHW.
7.2.1 Canal Water Levels and Datum
Before examining future sea states, it is important to understand the present day hydrodynamics of the Cape Cod Canal. The timing and amplitude of high and low water levels in Cape Cod Bay differ from those in Buzzards Bay. High and low tides in Buzzards Bay precede those in Cape Cod Bay by 2.5 to 3 hours. The tidal range in Buzzards Bay averages 3 to 4 feet whereas the tidal range in Cape Cod Bay averages 7 to 8 feet. These differences drive the strong currents which flow through the canal. The tidal datum for each of the Canal crossings are shown in Table 19 relative to Mean Sea Level. As Mean High Water is nearly 1.5 feet greater at the Sagamore Bridge than the Bourne Bridge, the Sagamore Bridge will need to be at a higher elevation relative to NAVD88 than the Bourne Bridge to maintain the same vertical clearance relative to Mean High Water.

Cape Cod Canal Highway Bridges, MA Final Report Major Rehabilitation Evaluation Report 63 March 2020
Table 19 – Canal Tidal Datum in Feet Relative to Mean Sea Level – NOAA
Water Level Railroad Bridge
Bourne Bridge
Sagamore Bridge
Mean Higher High Water (MHHW) 2.18 2.52 3.93 Mean High Water (MHW) 1.81 2.14 3.56 North American Vertical Datum of 1988 (NAVD88) 0.57 0.57 0.56
Mean Sea Level (MSL) 0.00 0.00 0.00 Mean Tide Level (MTL) 0.10 -0.10 -0.17 Mean Low Water (MLW) -1.60 -2.34 -3.89 Mean Lower Low Water (MLLW) -1.85 -2.62 -4.20
Mean Range 3.41 4.48 7.45 Great Diurnal Range 4.03 5.14 8.13 Note: Water level datums obtained from NOAA’s vDatum
7.2.2 Sea Level Change
Based on ER 1100-2-8162 and ETL 1100-2-1 (now EP 1100-2-1, 20 June 2019)1, USACE studies must consider future rates of sea level change that are higher than the historical rates to account for the potential impacts of climate change. Due to the uncertainty associated with future sea level change the USACE policy is to look at three scenarios of sea level change and investigate the impact to project feasibility. These rates are the historic rate at the project site, an intermediate rate and a high rate of sea level rise. The intermediate and high rates are modified from the National Research Council (NRC) curves I and III, respectively. All three local sea level change curves include the global (eustatic) sea level rise rate (approximately 1.7 mm/year according to IPCC 2007) as well as vertical land movement. USACE guidance allows for the consideration of additional curves.
In order to calculate these various rates for a project site, USACE developed an online calculator tool, the Sea-Level Change Curve Calculator (Version 2017.55) (http://corpsmapu. usace.army.mil/rccinfo/slc/slcc_calc.html). The tool uses the nearest NOAA tide station with an adequately long water level record to determine the historical trend. The tool then uses this historical trend along with a formulation provided in the ETL to determine the intermediate and high rates of change. The online calculator can also provide the NOAA sea level change curves.
For the historic mean sea level trend, the Woods Hole, MA NOAA station (NOAA 8447930) was used. The station is 18 miles south of the approximate midpoint between the Canal highway bridges. The Boston, MA NOAA station, located 48 miles northwest of the project 1 The ETL was replaced by the EP without any change in the guidance. This change occurred while the Canal bridge analysis was underway.

Cape Cod Canal Highway Bridges, MA Final Report Major Rehabilitation Evaluation Report 64 March 2020
area, was also evaluated and only minor differences (0.02 feet over 50 years; 0.03 feet over 100 years) in sea level rise projections were noted between the two stations. Based on this comparison, use of the Woods Hole station alone was considered adequate. The Sea-Level Change Curve Calculator, as a default, uses the historic mean sea level rate published in 2006. However, the user may also select the regional rate (NOAA, 2013) or enter a user-specified rate. The 2006 mean sea level trend at Woods Hole is 0.00856 feet/year or 0.856 feet/century. The regional trend is 0.00876 feet/year or 0.876 feet/century. The NOAA Sea Level Trends web page contains the historic mean sea level rate through 2018. At Woods Hole, this mean sea level trend is 0.00945 feet/year (2.8 mm/year) or 0.945 feet/century based on regionally-corrected mean sea level data from the station’s establishment through 2018, 86 years. This long-term linear trend was selected for this analysis and is shown in Figure 15 (https:// tidesandcurrents.noaa.gov/sltrends/sltrends_station.shtml?id=8447930). Also shown is the monthly mean sea level without the regular seasonal fluctuations due to coastal ocean temperatures, salinities, winds, atmospheric pressures, and ocean currents. The short term sea level change rate varies due to yearly and decadal cycles.
Figure 15 - Relative Sea Level Trend at Woods Hole, Massachusetts – NOAA
(https://tidesandcurrents.noaa.gov/sltrends/sltrends_station.shtml?id=8447930) The sea level change rates required by USACE for scenario-based sensitivity analysis for future conditions through 2125 are shown in Figure 16 and Table 20. Considering a project start in 2025, the projected sea level changes after 50 and 100 years are highlighted in green in Table 20. Sea level change values are in feet relative to Mean Sea Level established for the present tidal epoch (1983-2001), centered about 1992. As shown the historic rate results in 0.78 feet increase through 2075 while the intermediate and high rates would cause increases of 1.40 feet and 3.34 feet, respectively, within that same period. Looking out 100 years, a rise of 1.26 feet can be anticipated using the historic rate. The intermediate and high rates of sea level change estimate rises of 2.83 feet and 7.82 feet, respectively.

Cape Cod Canal Highway Bridges, MA Final Report Major Rehabilitation Evaluation Report 65 March 2020
Figure 16 – Relative Sea Level Change Curves - USACE
For reference, the USACE sea level change curves computed using NOAA’s 2006 historic sea level change rate and the regional rate are provided at the end of this document, as are the NOAA 2012 and 2017 sea level change curves.
Table 20 – USACE Relative Sea Level Change Predictions
Year USACE Low
USACE Intermed
USACE High Year USACE
Low USACE
Intermed USACE
High 1992 0 0 0 2060 0.64 1.05 2.36 1995 0.03 0.03 0.03 2065 0.69 1.16 2.67 2000 0.08 0.08 0.10 2070 0.74 1.28 2.99 2005 0.12 0.14 0.19 2075 0.78 1.40 3.34 2010 0.17 0.20 0.29 2080 0.83 1.52 3.70 2015 0.22 0.26 0.41 2085 0.88 1.65 4.09 2020 0.27 0.33 0.56 2090 0.93 1.78 4.49 2025 0.31 0.41 0.72 2095 0.97 1.92 4.91 2030 0.36 0.49 0.89 2100 1.02 2.06 5.35 2035 0.41 0.57 1.09 2105 1.07 2.20 5.80 2040 0.45 0.66 1.31 2110 1.12 2.35 6.28 2045 0.50 0.75 1.54 2115 1.16 2.51 6.77 2050 0.55 0.85 1.80 2120 1.21 2.67 7.28 2055 0.60 0.95 2.07 2125 1.26 2.83 7.82
NOAA Gage: 8447930 – Woods Hole, MA – User Defined Rate: 0.00945 Feet/Year All Values are Expressed in Feet Relative to LMSL
This study was conducted to determine whether major rehabilitation or bridge replacement would be the most cost effective, safe and reliable solution to providing vehicular crossings

Cape Cod Canal Highway Bridges, MA Final Report Major Rehabilitation Evaluation Report 66 March 2020
over the Cape Cod Canal. A conservative approach was taken developing a conceptual design for new crossings. This included the bridge type selected, lane widths, approach grades, and sea level rise. The replacement bridge conceptual designs presented therefore include an increased bridge clearance (7.8 feet) to accommodate current vessel traffic at the high rate of sea level rise. Final elevations of the bridges and corresponding air draft clearance will take approach work and adjacent infrastructure into consideration during design phase (Phase II) of the project. This will include a further evaluation of the most appropriate scenario of sea level rise to include in the final design elevation.
Tides in Buzzards Bay and Cape Cod Bay occur on slightly different cycles with different elevations. During the design phase sea level rise and its effect on tidal range and elevations in the Canal with respect to the two tidal regimes will be examined in more detail. If necessary additional bridge height may be required, which would increase the length of the bridges in order to maintain design grades. For the conceptual analysis in this report the sea level change projections used are conservative and significant cost contingencies were used, so a slight increase in deck elevation would not impact that analysis.
7.3 Bourne Bridge Replacement For the purposes of this concept level design it was assumed that a replacement for the Bourne Bridge would be constructed immediately inshore (east) of the existing bridge. It is believed that this location would minimize alterations needed on connecting roads and other roads in the bridge’s vicinity. For NEPA purposes an area of immediate impact extending about 500 feet out in each direction (east and west) from the centerline of the bridge and 1000 feet inland (north and south) from the shore end of each existing abutment was used. A replacement bridge with six vehicle lanes (Plan D) would have a wider deck and impact a larger footprint than the existing bridge with four vehicle lanes.
A new Bourne Bridge of the cable stay type would likely be 19 to 23 spans with a total length of between about 3,500 to 4,000 feet. The estimated length is based on the local topography, required elevation of the superstructure, accounting for sea level rise, and assuming a 4% roadway grade. It is also based on an arbitrary location of the bridge abutments. The bridge would be comprised of precast segmental girders, cables for the cable-stay spans, and three spans of steel multi-girders. There would be two reinforced concrete abutments, 16 to 20 reinforced concrete piers, and two reinforced concrete pylons for the cable-stay span.
7.4 Sagamore Bridge Replacement For the purposes of this concept level design it was assumed that a replacement for the Sagamore Bridge would be constructed immediately inshore (west) of the existing bridge. It is believe that this location would minimize alterations needed on connecting roads and other roads in the bridge’s vicinity. For NEPA purposes an area of immediate impact extending about 500 feet out in each direction (east and west) from the centerline of the bridge and 1000 feet inland (north and south) from the shore end of each existing abutment was used. A

Cape Cod Canal Highway Bridges, MA Final Report Major Rehabilitation Evaluation Report 67 March 2020
replacement bridge with six vehicle lanes (Plan D) would have a wider deck and impact a larger footprint than the existing bridge with its four vehicle lanes. A new Sagamore Bridge of the cable stay type would likely be approximately 12 to 14 spans with a total length between about 2,400 to 2,900 feet. The length is based on the local topography, required elevation of the superstructure, accounting for sea level rise, and assuming a 4% roadway grade. It is also based on an arbitrary location of the bridge abutments. The bridge would be comprised of precast segmental girders, cables for the cable-stay spans, and three spans of steel multi-girders. There would be two reinforced concrete abutments, nine to eleven reinforced concrete piers, and two reinforced concrete pylons for the cable-stay span. 7.5 Bridge Replacement Costs The construction cost estimates were developed using Micro-Computer Aided Cost Estimating System (MCACES), Second Generation (MII) using the appropriate Work Breakdown Structure (WBS). The replacement construction cost is based on historical bridge construction estimates for smaller projects scaled up to match the scope of this project. Specific features of work relative the proposed cable-stay bridge type were then added to the estimate. Contingencies were developed using a cost and schedule risk analysis conducted by members of the District’s project delivery team. The Risk Analysis utilized the “high risk” category as both the rehabilitation and replacement alternatives represent complex projects involving construction with life safety issues. Assumptions were made to the likelihood and impact of each risk item, as well as the probability of occurrence and magnitude of the impact if it were to occur. Adjustments were made to the analysis upon review by the PDT and the final contingencies were established. Details on the cost estimates and the cost and schedule risk analysis (CSRA) Report are included in the Cost Engineering Appendix. 7.5.1 New Bridge Construction Costs Table 21 presents the costs for initial construction of replacements for the Bourne and Sagamore Highway Bridges. A new bridge would be built adjacent to and inshore of each existing bridge. The conceptual design used in this phase of analysis was for cable-stay bridges with four through travel lanes plus two auxiliary (acceleration/deceleration) lanes. The new bridges could be built concurrently or over different time periods. Costs for non-Federal improvements to other roadways necessary to tie into the new bridge locations are discussed and presented later.

Cape Cod Canal Highway Bridges, MA Final Report Major Rehabilitation Evaluation Report 68 March 2020
Table 21 Project Costs – Bridge Replacement Alternatives – Plan D
Cost Category FY 2020 Price Levels ($000s) Revised Feb 2020
Bourne Bridge Sagamore Bridge 4 Lanes plus 2
Auxiliary Lanes 4 Lanes plus 2
Auxiliary Lanes Construction Cost $355,478 $232,630 Contingency % 44% 44% Contingency Cost $156,410 $102,357 PED $40,951 $27,321 Construction Management $14,199 $9,594 Total Construction $567,038 $371,902 Cultural Resource Preservation $29,450 $19,241 Lands, Easements, ROW $7,645 $7,618 Utility Relocations $26,640 $29,520 Total Federal Project Cost $630,773 $428,281
Associated Non-Federal Highway/Roadway Modifications State-Funded Bridge Approaches $90,991 $57,802 Anticipated Future Major Repair Actions for New Bridges (Bourne/Sagamore)
Major Repairs #1 (2054/2049) $7,911 $7,906 Major Repairs #2 (None/2069) - - - $7,906 Total Project Cost (50 Years) $729,675 $501,895
7.5.2 Associated State Highway Modifications Construction of new replacement bridges, no matter how close to the existing bridges, will require modifications to existing surface roads and highways, including those connecting to the bridges on either side of the Canal. The extent and cost of these modifications will depend in part on the final location of the new bridges, the bridge type, and their alignment. Some of the final design factors that will need to be considered include: • Bridge height over the waterway as a function of navigation clearance required for vessel
traffic at high water, the high water datum chosen, and allowance made for future sea level rise will need to be further examined.
• The type of bridge chosen will impact bridge deck elevation (and by extension the landward extent of the abutments), since some bridge types have a greater distance (height) between the deck surface (top of the pavement) and the bottom of the supporting superstructure that ships must be able to pass beneath.
• The approach span grades of the bridge decks on the existing bridges exceed those used in modern highway design. Easing the approach span grades will require moving the new abutments further inshore than the existing abutments. Connections to other roadways would need to be moved inland to accommodate those changes. Federal property boundaries may need to change to accommodate these changes.
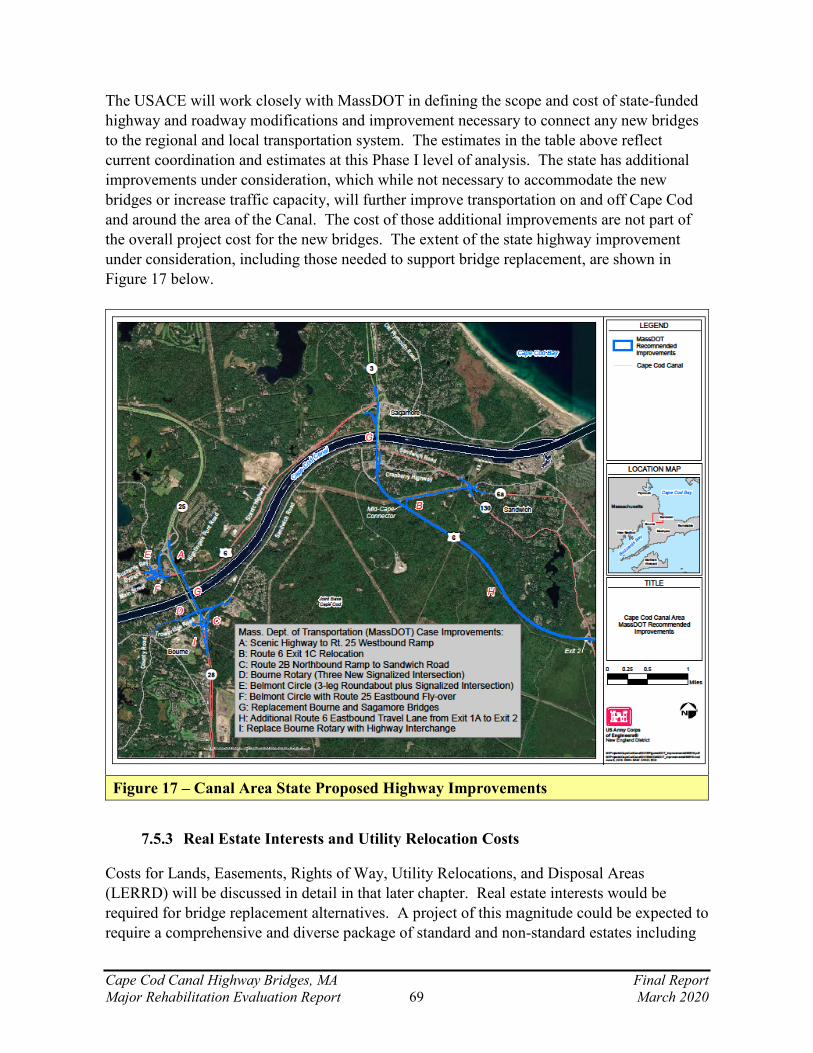
Cape Cod Canal Highway Bridges, MA Final Report Major Rehabilitation Evaluation Report 69 March 2020
The USACE will work closely with MassDOT in defining the scope and cost of state-funded highway and roadway modifications and improvement necessary to connect any new bridges to the regional and local transportation system. The estimates in the table above reflect current coordination and estimates at this Phase I level of analysis. The state has additional improvements under consideration, which while not necessary to accommodate the new bridges or increase traffic capacity, will further improve transportation on and off Cape Cod and around the area of the Canal. The cost of those additional improvements are not part of the overall project cost for the new bridges. The extent of the state highway improvement under consideration, including those needed to support bridge replacement, are shown in Figure 17 below.
Figure 17 – Canal Area State Proposed Highway Improvements 7.5.3 Real Estate Interests and Utility Relocation Costs Costs for Lands, Easements, Rights of Way, Utility Relocations, and Disposal Areas (LERRD) will be discussed in detail in that later chapter. Real estate interests would be required for bridge replacement alternatives. A project of this magnitude could be expected to require a comprehensive and diverse package of standard and non-standard estates including

Cape Cod Canal Highway Bridges, MA Final Report Major Rehabilitation Evaluation Report 70 March 2020
fee acquisitions, permanent easements, construction access agreements, relocation costs, and other real property interests. Both major rehabilitation and bridge replacement would require utility relocations as well as new and amended easements and licenses for utilities to cross Federal lands. The detailed design phase of this effort would determine the extent and nature of the required interests. 7.6 Traffic Management during Bridge Replacement Traffic management, both vehicular and marine would be required during any bridge replacement project. Both bridges would have similar impacts. 7.6.1 Vehicular Traffic Management during Bridge Replacement Some level of land-side vehicular traffic management would be required during bridge replacement, but would not be as extensive or disruptive as a major rehabilitation project. These impacts have not been quantified as design details await the next phase of the project. With the existing bridges remaining open to traffic during construction of the new bridges, traffic across the Canal would be mostly similar to the existing condition. Closures of the existing bridges during this period would only be for emergency repairs. Deliveries of equipment and materials, especially delivery of large pre-fabricated sections of the new bridges, may disrupt traffic and cause delays for limited periods. This could be mitigated in part by scheduling such deliveries for non-peak traffic times. The reconfiguration of connecting highways and approach roads would have a greater impact on vehicular traffic during the later stages of each replacement. As surface roads are relocated or otherwise modified, traffic patterns will need to be periodically adjusted to facilitate construction. Specific analysis of traffic patterns and control requirements would be evaluated during detailed design phase as final bridge types, construction methods, and timelines are determined. 7.6.2 Marine Traffic Management during Bridge Replacement Impacts to marine traffic management during bridge replacement will depend largely on the type of bridge being built, which would determine what level of construction activities would occur from the land versus the water. Large precast or preassembled sections of the bridge center spans may need to be assembled, positioned, lifted and placed from barges in the Canal channel and could pose a hazard to navigation of the Canal or require closures of the Canal to marine traffic for periods of time. Similarly, demolition of the existing bridges (center span superstructure and in-water piers) would likely be accomplished at least in part using waterborne equipment (barges and cranes) that may conflict with marine traffic and require closure of the Canal for periods of time. It was assumed for this study that there would be at least 30 days where marine traffic through the Canal would be delayed or prohibited due to construction of each new bridge and

Cape Cod Canal Highway Bridges, MA Final Report Major Rehabilitation Evaluation Report 71 March 2020
demolition of the existing bridge. A more specific number of delay days would be determined during the detailed design phase.
7.7 Future Operation, Maintenance and Repair Costs for Replacement Bridges The costs for new bridges must also account for costs over the 50-year economic life. The new bridges will have annual costs for operation, maintenance. They will also have costs for repairs, including major repair actions during that period. At this time estimates of cost and timelines for even major repairs are highly speculative given the conceptual level of the replacement design. However a major repair action near the end of the new bridges’ economic life period has been estimated and is included in Table 21 above, and two such repair actions were included for the Sagamore Bridge due to its heavier traffic load. 8.0 ECONOMIC ANALYSIS As part of the MRER, an economic evaluation was preformed to analyze the costs and benefits of the “without project” condition and compare it to alternatives. The “without project” condition refers to a baseline of continued regular inspections and standard maintenance on the bridges as the need arises; a fix-as-fails scenario. Below is a brief summary of the findings of the economic analysis. For further information please refer to Appendix D: Economics.
The economic study area consists of the regions occupied by the two bridges, their approaches, and nearby sections of the connecting highways within which traffic is impacted by the deterioration of the two ageing 85-year old bridges. For the Sagamore Bridge that area extends between Route 3 Exit 2 (Herring Pond Road) in Plymouth, south to Route 6 Exit 2 (Route 130, Forestdale Road) in Sandwich. For the Bourne Bridge that area extends between Route 25 Exit 2 (Glen Charlie Road) in Wareham and Route 151 in Mashpee.
8.1 Federal Interest The authority for the Cape Cod Canal FNP includes the authority to operate and maintain two highways bridges connecting the areas of the two communities bisected by the Canal. The language in Section 1315 of the America’s Water Infrastructure Act of 2018 provides further authority for replacement of the highway bridges. The purpose of the MRER is to determine the most economical means of providing safe, efficient, and reliable access over the Canal by vehicular traffic. The purpose of this analysis is to evaluate and compare the costs and benefits of the various alternative measures and recommend the most economically justifiable solution, consistent with protecting the nation’s environment. Improving safety and reliability also requires an examination of alternatives to the base condition of continued maintenance and repair, and the major rehabilitation of the two bridges.
Cape Cod Canal Highway Bridges, MA Final Report Major Rehabilitation Evaluation Report 72 March 2020
8.2 Overview of Economic Analysis Methodology The basic criteria for an economically viable project are that the present value of the benefits exceeds the present value of the costs, and/or that the rate of return on the investment exceeds the cost of capital. The benefits represent the incremental economic payoff of the project. The costs are opportunity costs. That is, the value of the foregone alternative investment. The Federal Discount Rate, based on the rate of return on risk-free Treasury securities and currently set at 2.75 percent for Fiscal Year 2020, is used to discount the scenarios. For this analysis the federal government’s expenditures to operate, maintain, repair, and rehabilitate the existing bridges, or to build replacement bridges represents the cost. The costs of project design, real estate interests, utility relocations, environmental mitigation, and work by others to modify state and local roads as needed to facilitate the USACE work are also included in total project costs. The benefits of the project refer to the quantifiable, incremental gains that accrue to the society as a result of the project (the “with-project” condition), as compared to the base condition of maintaining the bridges as needed (the “without-project” condition).
8.2.1 Economic Methodology Economic analysis is performed using a risk based approach to compare costs and benefits of each alternative to the without project (base) condition. Reliability functions from engineering event trees are utilized to simulate the life cycle of components, possible component failures and associated repair costs. The three engineering components that could experience failure are the bridge deck, substructure, and superstructure. This analysis is evaluated over a 50-year period using a Monte Carlo Simulation to determine long-term costs of the future base condition without-project and the future with alternatives. The model has been approved for single-use by the USACE Planning Center of Expertise for Inland Navigation and Risk Informed Economics Division.
The cost of each alternative includes the cost of the repair itself, the economic cost to vessels that cannot use the canal (navigation costs), operation & maintenance costs, and the change in value of time incurred by drivers in traffic delays (travel costs) during lane closures for repairs or construction. This traffic data and forecasts were used to determine the total hours of traffic delay incurred during construction for all travelers crossing the bridges. A monetary value was attributed to these lost productive hours using the average hourly household median income of the surrounding towns as sourced from the US Census Bureau.
Traffic disruptions associated with construction activities may cause some visitors to choose an alternate travel destination away from Cape Cod. There would be a substitution effect as these vacationers may decide to travel to other areas such as Maine or New Hampshire. This impact is expected to be minimal as construction activities for the proposed alternatives will scheduled to avoid peak visitor travel times in the summer and on holidays. Travelers driving to the Cape for work or non-vacation reasons will still need to commute over the bridges because they provide the only access on and off Cape Cod. The economic analysis does not reflect the possible substitution effect of visitor volume. The current analysis provides a more

Cape Cod Canal Highway Bridges, MA Final Report Major Rehabilitation Evaluation Report 73 March 2020
conservative estimate in the case of the alternatives. If visitor traffic were to decline as a result of project construction, traffic flows would actually improve for the non-visitors and in turn reduce the value of time cost of the project. Therefore, the final decision will not change due to this assumption. For the bridges the additional costs due to component failures are discounted in the year of failure. For each iteration of the model these costs are summed over the project life. The model is iterated 100,000 times each year over the fifty years and the average annual costs are obtained by summing the costs over the fifty years and annualizing using the capital recovery factor of 0.03704 based on the 2-3/4% Fiscal Year 2020 discount rate.
Benefits are reductions in repair and maintenance costs and travel delay costs between the proposed alternatives and the base condition. Each alternative is evaluated against the base case. Each alternative and the base case have separate sets of hazard indices for each system component. The hazard rates increase over time reflecting the increased probability of failure due to deteriorating conditions.
8.2.2 Discounting and Period of Analysis
For most transportation investments, costs are incurred in the initial years, while the benefits from the investment accrue over many years into the future. When assessing the costs and benefits of a project, it is necessary to take into account the time value of money by converting the costs and benefits that take place in different years into a common year. This discounting converts future costs and benefits that occur in different years into a value for a common year (present value). The base year of the analysis is 2020. The USACE requires a 50-year period of analysis for evaluating Federal navigation project investments. The analysis will cover the 50-year period from 2020 – 2069. This period is different from that used for the structural engineering reliability analysis which was completed in 2016 and was based on specific temporal data points for the condition ratings of the bridges.
The year 2020 was selected as the base year because the decision on the recommended plan contained within the MRER is expected to be made in 2020. Base year dollars are valued in dollars that are directly comparable to the current dollars for a given year. The base year can be adjusted by multiplying costs and benefits by the respective rate. Ultimately, how the alternatives compare will not change and therefore, adjusting the base year does not impact the final decision made within the report.
8.3 Base Condition – Alternative A – Fix-as-Fails Under the without-project (base) condition no improvements are made and the bridges will be operated, maintained and repaired as the need arises. Bridge components will be fixed as failure occurs. It is anticipated that service disruptions will continue and bridge use will eventually be weight limited. This is the base condition that will be compared to the proposed alternatives of rehabilitation and construction of new replacement bridges. The net benefits are calculated by taking the difference between the without- and with-project conditions. A benefit-cost ratio greater than one indicates that the project’s net benefits outweigh the costs.

Cape Cod Canal Highway Bridges, MA Final Report Major Rehabilitation Evaluation Report 74 March 2020
The overall condition of both the Bourne and Sagamore Bridges is becoming worse as the bridges age and major maintenance projects becomes more frequent. As conditions deteriorate the bridges become structurally deficient. Both bridges are functionally obsolete and are routinely unable to provide an efficient flow of traffic in conjunction with the State and local roadway network leading to the bridge approaches. As discussed in Appendix A – Engineering Reliability Analysis, the Bourne Bridge is structurally deficient and both bridges are functionally obsolete.
The future without-project condition outlines the condition in which there is no major rehabilitation or replacement of the existing bridges. It is assumed that continual, regularly-scheduled maintenance will be performed on the existing structures and emergency funds will be provided in the event of performance failure. Travel delays due to lane or bridge closures are expected during necessary maintenance and repair projects. The cost of these repairs, plus the cost of traffic delays, together represent the cost of this alternative.
8.3.1 Probability of Unsatisfactory Performance – Base Condition
Probability of unsatisfactory performance (PUP) functions exhibit instantaneous probabilities of major bridge components, the superstructure, substructure, and deck, not performing as designed. PUP functions as applied to the bridges are related to age, and must also have measurable consequences. The PUP functions are determined during engineering reliability analysis through expert elicitation. Unsatisfactory performance in this study is defined as the physical condition of the bridges’ critical elements being assigned a Condition Rating of 4 (Poor) or less (see the FHWA NBIS ratings discussion in Chapter 4). For a more detailed description of the consequences of unsatisfactory performance please refer to Appendix A – Engineering Reliability Analysis. In the figure below are example charts depicting probability of unsatisfactory or failure curves of the three bridge components for the base condition.
8.3.2 Probabilistic Analysis – Base Condition
Engineering reliability must be integrated with economic costs to ensure that impacts related to all possible consequences are accurate for final cost-benefit analysis. Event trees are the primary tool used to identify and estimate risk and were designed to predict individual component performance. Event trees were created for each bridge, as well as for each engineering component, and were modeled using Palisade PrecisionTree software. A progression of events begins with an initiating event and continues through a set of outcomes with probabilities and consequences assigned to each possible outcome. The three bridge components were further evaluated for failures that could trigger major or catastrophic rehabilitation or replacement costs. The failures are defined as deterioration of the bridge deck, substructure, and superstructure resulting in a condition rating of 4 or lower. Probabilities of localized or widespread deterioration of each were created through engineering reliability analysis. Actions to restore performance from each scenario are also evaluated. Costs of these repair or replacement scenarios (from Table 14) are included in the event tree.

Cape Cod Canal Highway Bridges, MA Final Report Major Rehabilitation Evaluation Report 75 March 2020
Figure 18 – Probability of Failure – Base Condition – Existing Bridges
0%5%
10%15%20%25%30%35%40%45%
2020
2022
2024
2026
2028
2030
2032
2034
2036
2038
2040
2042
2044
2046
2048
2050
2052
2054
2056
2058
2060
2062
2064
2066
2068
2070
Probability of a Bridge Deck Failure
0.0%0.2%0.4%0.6%0.8%1.0%1.2%1.4%1.6%1.8%
2020
2022
2024
2026
2028
2030
2032
2034
2036
2038
2040
2042
2044
2046
2048
2050
2052
2054
2056
2058
2060
2062
2064
2066
2068
2070
Probability of Substructure Failure
0%
10%
20%
30%
40%
50%
60%
70%
80%
2020
2022
2024
2026
2028
2030
2032
2034
2036
2038
2040
2042
2044
2046
2048
2050
2052
2054
2056
2058
2060
2062
2064
2066
2068
2070
Probability of Superstructure Failure

Cape Cod Canal Highway Bridges, MA Final Report Major Rehabilitation Evaluation Report 76 March 2020
For each construction scenario there are traffic delays due to lane or bridge closures. Costs for closures were calculated and incorporated into the event tree. The resulting total cost of each event includes the rehabilitation cost and travel delay costs, as shown in Table 22. Please see Appendix D - Economics for further discussion of event trees.
Table 22 – Base Condition – Repair and Traffic Delay Costs ($000)
Component and Failure Description
Cost to Repair Traffic Impact
Traffic Cost in 2020
Sagamore Bridge
Bourne Bridge
Sagamore Bridge
Bourne Bridge
Superstructure Advanced deterioration of secondary member, non-critical Gusset Plate, Stringer, Floorbeam, or Hanger Cable
$6,600 $6,200
9 months lane closure - no closures Memorial Day to Columbus Day
$32,700 $21,100
Advanced deterioration of Main Truss Member or Critical Gusset Plate $15,300 $20,200
18 months lane closures, divert trucks over 16 ton to sister bridge for 12 months
$321,200 $186,200
Catastrophic Damage to Main Truss Member or Critical Gusset Plate
$310,300 $547,700
60 months bridge Closure
$10,343,400 $4,584,000
Bridge Deck Localized deterioration of Roadway Joint(s), Granite Curbs, Concrete-filled Steel Grid over Bridge Spans, or Reinforced Concrete Deck at Abutments
$5,100 $5,800
6 months of temporary lane closures, no closures Memorial Day to Columbus Day
$21,800 $14,100
Widespread Deterioration of Concrete-filled Steel Grid Deck over Bridge Spans and Reinforced Concrete Deck at the Abutments
$5,900 $7,600
15 months of temporary lane closures, no closures Memorial Day to Columbus Day
$54,400 $35,200

Cape Cod Canal Highway Bridges, MA Final Report Major Rehabilitation Evaluation Report 77 March 2020
Table 22 – Base Condition (Continued) – Repair and Traffic Delay Costs ($000) Substructure Localized Concrete Defects such as Cracks or Spalls on Vertical Surfaces of Piers or Degradation of Concrete under Bearings on the Piers
$400 $500
6 months of lane closures, no closures Memorial Day to Columbus Day, lane closures limited to non-peak hours, weekdays
$18,300 $13,400
Widespread Concrete Defects such as Cracks or Spalls on Vertical Surfaces of Piers or Degradation on Concrete under Bearings on the Piers
$700 $1,100
12 months of lane closures, no closures Memorial Day to Columbus Day, Lane Closures limited to non-peak hours, weekdays
$36,600 $26,700
Source: Economics Appendix D – Table D-7
8.3.3 Traffic Data Collection and Analysis – Base Condition The Sagamore and Bourne Bridges provide the only vehicular access to Cape Cod. Therefore traffic restrictions during construction projects will likely disrupt the local economy. Lane or total bridge closures are required in the event of emergency maintenance after a component failure. Commuters and travelers over the bridges will experience a loss of time due to traffic delays.
MassDOT is conducting a transportation study to examine current traffic conditions in the area surrounding the Sagamore and Bourne Bridges. The USACE worked with a contractor, TrafInfo, to collect this data for existing traffic conditions (2014) and future conditions (2040), and design a regional travel demand model. The model simulates traffic volumes at various times of the day in the existing and future conditions with partial lane closures and full bridge closures. Please see Appendix D - Economics for further discussion of traffic analysis.
8.3.4 Impacts to Navigation – Base Condition The Canal is a key transportation link for vessel traffic transiting the US east coast, between southern New England, New York, or points south, and Boston, northern New England, and points north. Without the Canal, vessels would have to transit around the arm of Cape Cod. Deeper draft vessels would also need to travel around Martha’s Vineyard, Nantucket and the shallow banks farther east. This would increase vessel travel distances by at least 60 nautical

Cape Cod Canal Highway Bridges, MA Final Report Major Rehabilitation Evaluation Report 78 March 2020
miles, an 18 percent increase for vessels traveling between New York and Boston. Each year the Canal is used by more than 3,000 cargo vessels, at least 750 fishing vessels, 150 – 200 military vessels, and more than 4,000 recreational vessels, all of which benefit greatly from the shorter and safer travel route. Since its completion in 1914, the Canal has increased the efficiency of waterborne commerce shipments in the Northeast, contributing greatly to the national economy. The Canal also increases navigation safety. Prior to construction of the Canal, many shipwrecks occurred along the route around the Cape, since fog, shoals and exposure to bad weather are significantly worse in the areas off Cape Cod compared to the interior. The navigation benefits provided by the Canal are extremely important to the economies of Massachusetts, New Hampshire, and Maine, with critical shipments of petroleum products making up the majority of cargo traffic through the Canal, and with vessels of all types benefiting from the shorter and safer transit route.
Temporary closure of the Canal would occur under certain bridge component failure scenarios, forcing navigation traffic to use the longer outer route through the North Atlantic. There are three instances when a component failure will require closure of the canal for navigation – a catastrophic bridge failure (30 day closure); localized concrete defects such as cracks or spalls on vertical surfaces of piers or degradation of concrete under bearings on piers (2 weeks); and widespread concrete defects such as cracks or spalls on vertical surfaces of piers or degradation of concrete under bearings on piers (4 weeks). These instances are only likely to occur a few times over the 50-year period of analysis. The total annual cost is the mean sum over that period then annualized. This cost to navigation is comparatively low as estimated in Table 23 below.
8.3.5 Annual Maintenance Costs – Base Condition In addition to the costs associated with emergency repairs, there are annual maintenance costs to upkeep the bridges each year. Currently, average annual maintenance costs are $411,000 (in 2020 dollars) for the Sagamore Bridge and $295,000 for the Bourne Bridge. In the event tree scenario in which there is catastrophic failure in the superstructure, the result is immediate closure of the bridge with the design and construction of a replacement bridge. Annual maintenance for replacement bridges will cost $38,000 each (Appendix D, Sec 4.5).
The repair and maintenance costs as well as the value of time due to traffic and navigation costs were used as inputs for the Monte Carlo Simulation. The Monte Carlo Simulation was run with 100,000 iterations. In the Base Condition, continual maintenance is performed on the existing structures and emergency funds are provided in the event of performance failure. As the bridges continue to age over time their condition will deteriorate and emergency funds will be needed more frequently. Table 22 below summarize the annual cost results for the Base Condition for each bridge.
The travel costs are substantially higher for the Sagamore Bridge when compared to the Bourne Bridge. This is due to the fact that a lane or bridge closure on the Sagamore would strain the infrastructure around the Bourne Bridge, particularly at the Bourne Rotary, causing extensive time delays for travelers waiting in traffic.

Cape Cod Canal Highway Bridges, MA Final Report Major Rehabilitation Evaluation Report 79 March 2020
Table 23 – Annual Costs – Base Condition ($000s) Updated Feb-March 2020 – See Appendix D, Table D-66
FY2020 Price Level
Repair Cost
Travel Cost
Navigation Cost
O&M Cost Total
Sagamore Bridge Mean 2,800 120,700 1 400 123,900
Bourne Bridge Mean 3,200 61,700 1 300 65,200
8.3.6 Summary of Future Without-Project Condition – Base Condition
The base case condition stipulates that the bridges be maintained but their aging condition will continue to deteriorate over the 50-year study. The bridges will become increasingly unreliable resulting in higher occurrences of expensive emergency repairs. Impacts to travelers will be associated with the repairs. The total annual cost of operating the Sagamore and Bourne Bridges over 50 years is an estimated $189.1 million ($123.9 + 65.2 million) of which $6.0 million ($2.8 + $3.2 million) are annual direct emergency repair costs for component failures. Navigation costs are $0.7 million per bridge.
8.4 Alternative B – Major Rehabilitation Major rehabilitation of both the Sagamore and Bourne bridges would avoid most of the emergency repair costs of a potential failure because the rehabilitated bridges will have improved reliability functions, meaning that the probability of component failure will decrease. As described earlier in Chapter 5 the rehabilitation alternative (Plan B) would include the following work:
• Truss Span Deck Replacement • Bearing Repairs • Stringer Replacement/Repair • Joint Replacement • Floorbeam Replacement/Repair • Steel Truss Repairs • Suspender Cable Replacement • Paving (Overlay) • Abutment Span T-Beam Rehabilitation • Painting of Structural Steel • Abutment Span Deck Rehabilitation
The recommended timeline for the major rehabilitation is 2025 through 2027 for the Sagamore Bridge and 2029 to 2031 for the Bourne Bridge. For more details on the major rehabilitation project see Appendix A – Engineering Reliability Analysis.
The Major Rehabilitation project will improve the reliability of bridge components and therefore decrease the probability of unsatisfactory performance. Benefits represent a reduction in emergency repair costs following a component failure and associated time value costs from lane closures related to these repairs. Modeling these phenomena provided a method to quantify the net benefits for current and future users.

Cape Cod Canal Highway Bridges, MA Final Report Major Rehabilitation Evaluation Report 80 March 2020
8.4.1 Probability of Unsatisfactory Performance – Major Rehabilitation The Major Rehabilitation project would result in more reliable bridges with significantly smaller probabilities of future component failures. The analysis is similar to that conducted for the Base Condition as described in Section 8.3 above. Provided in Figure 19 below as an example are probability of unsatisfactory performance charts for the superstructures of both bridges, exemplifying improved reliability functions under Major Rehabilitation.
As depicted in the figure above, the probability of a failure for any type of superstructure will be reduced to 0.3% following the major rehabilitation to be in line with the failure rate in 1981, the historical last major rehabilitation project. The probability of failure will rise throughout the forecast horizon before being adjusted back to 0.3% in the second scheduled major repair project. Failure rates will remain below 8% following the major rehabilitation in both the Sagamore and Bourne Bridges, compared to 64.9% in the final year of the base condition. The probability failure chart for the bridge decks is similar to that of the superstructure. The chart for the substructure rises in a more uniform curve from 0.4% in 2020 to almost 1.7% in 2070.
Following the major rehabilitation, the event trees used to predict the severity of a component failure will be different than in the base condition. The major rehabilitation will hinder the occurrence of more severe component failures. Please see the Appendix D – Economics, for the full detailed analysis of all three bridge components.
Figure 19 - Probability of Unsatisfactory Performance
Sagamore and Bourne Bridges - Superstructure
0%
2%
4%
6%
8%
10%
12%
2020
2022
2024
2026
2028
2030
2032
2034
2036
2038
2040
2042
2044
2046
2048
2050
2052
2054
2056
2058
2060
2062
2064
2066
2068
2070
Probability of a Superstructure FailureSagamore Rehabilitation

Cape Cod Canal Highway Bridges, MA Final Report Major Rehabilitation Evaluation Report 81 March 2020
Figure 19 (Continued) - Probability of Unsatisfactory Performance
8.4.2 Results of Monte Carlo Simulation – Major Rehabilitation
The repair, navigation, and travel costs are determined using Monte Carlo Simulation. After each unscheduled failure, there is an associated emergency repair cost, possible navigation cost, and travel delay costs. These costs are consistent with those for the Base Condition because the bridges are structurally the same and repairs will be the same before and after Major Rehabilitation. Failure frequency will decline, and the severity of the failures will also decrease after rehabilitation. The O&M costs will remain the same for the rehabilitation alternative.
The Monte Carlo Simulation was done over the 50-year period for the Major Rehabilitation alternative with 100,000 iterations. Please see Appendix D – Economics for further discussion of the Monte Carlo Simulation. The benefit of Major Rehabilitation is a total cost savings of $115.1 million annually for the Sagamore Bridge and $59.1 million annually for the Bourne Bridge, as shown in the table below.
Table 24 – Annual Cost & Benefits – Major Rehabilitation Annual Costs ($000) FY2020 Price Levels (Updated March 2020)
Discounted Cost (2020) Annual Benefit Base
Condition Major
Rehabilitation Sagamore Bridge - Benefits
Mean 123,900 8,800 115,100 Bourne Bridge - Benefits
Mean 65,200 6,100 59,100 Note: Data from Economics Appendix D – Table D-68
0%
2%
4%
6%
8%
10%
12%
14%
16%
2020
2022
2024
2026
2028
2030
2032
2034
2036
2038
2040
2042
2044
2046
2048
2050
2052
2054
2056
2058
2060
2062
2064
2066
2068
2070
Probability of a Superstructure FailureBourne Rehabilitation

Cape Cod Canal Highway Bridges, MA Final Report Major Rehabilitation Evaluation Report 82 March 2020
8.4.3 Cost of Major Rehabilitation
The cost of the major rehabilitation comprises the total construction cost of the major rehabilitation and the time-value cost of the lane and bridge closures associated with the major rehabilitation construction. The components of Major Rehabilitation were described in detail in Chapter 5 and Appendix A. The recommended timeline for the major rehabilitation is 2025 through 2027 for the Sagamore Bridge and 2029 to 2031 for the Bourne Bridge.
The majority of costs for the Major Rehabilitation alternative would be incurred at the beginning of the construction timeline. The construction cost (FY2020) for Major Rehabilitation for the Sagamore Bridge is $300.7 million, and $345.1 million for the Bourne Bridge. Over the 50 years following Rehabilitation the bridges will again begin to deteriorate resulting in necessary future action to prevent component failures. That work would be in two categories (1) major repairs and the third rehabilitation action, and (2) maintenance and minor repairs (see Table 17). In the first category each bridge will need to undergo two major repair projects that are fairly extensive and not considered to be regular annual maintenance repairs. The first would be a major cleaning, repair, and repainting of the structural steel components. The second would be the bridges’ third major rehabilitation action in their project life cycle. Table 25 summarizes the costs for the major rehabilitation, subsequent major repairs, and the years in which they would occur. There are additional scheduled repairs referenced in Appendix C: Cost Engineering that include maintenance painting, joint replacement, and paving. Those out-year projects are considered part of annual operation and maintenance (O&M) for the purpose of the economic analysis.
Table 25 – Major Rehabilitation Design and Construction Costs Project Costs in $000s FY2020 Price Levels (Updated Feb 2020)
Sagamore Bridge Construction Cost
Bourne Bridge Construction Cost
Years Cost Years Cost Major Rehab 2025-2027 $156,301 2029-2031 $186,171 Complete Painting 2045 $33.425 2049 $26,827 Truss Deck Replacement, Floor Beam Repair, Complete Painting
2065 $110,940 2069 $132,120
Total Rehab Cost $300,666 $345,118 The expected lane closure requirements for the Major Rehabilitation alternative were discussed in Section 5.3. Lane and bridge closures will not occur Memorial Day through Columbus Day to avoid impacting the busy tourist travel seasons as well as Patriots Day and Thanksgiving weekends. For logistical purposes, construction will also be limited during the winter months as construction is made far more difficult under cold winter weather conditions. Lane closures with Major Rehabilitation were estimated to be a total of 480 days

Cape Cod Canal Highway Bridges, MA Final Report Major Rehabilitation Evaluation Report 83 March 2020
for the Bourne Bridge and 380 days for the Sagamore Bridge. Full bridge closures were estimated at 180 days for the Bourne and 130 days for the Sagamore. Lane and bridge closures will negatively impact commuters and vacationers traveling over the bridges. Table 26 displays the actions and associated travel costs for Major Rehabilitation during the 50-year study period for each bridge.
Table 26 – Rehabilitation Construction and Travel Costs ($000s) (Updated Feb-March 2020)
Years Construction Cost Travel Cost Total Cost Sagamore Bridge Rehabilitation Construction and Travel Costs
2025-2027 $156,300 $661,800 $818,100 2045 33,400 124,000 157,400 2065 110,900 495,200 606,100 Total $300,700 $1,281,000 $1,581,700
Bourne Bridge Rehabilitation Construction and Travel Costs 2029-2031 $186,200 $530,100 $716,300 2049 26,800 87,000 113,800 2069 132,100 331,200 463,300 Total $345,100 $948,400 $1,293,500 Note: Costs are FY2020 Price Levels and are discounted in final analysis
8.4.4 Annual Cost of Major Rehabilitation
Traffic delays on the Sagamore Bridge amounted to 510 days of disrupted traffic at an additional economic cost of $1.3 billion. Traffic delays on the Bourne Bridge amounted to 660 days of disrupted traffic for an additional cost of $948 million. The total cost of the rehabilitation will be $35.9 million annually for the Sagamore Bridge and $27.1 million annually for the Bourne Bridge. The impact of traffic delays is a major component in adding costs, highlighting the importance of these structures in traffic flows. Annualized costs for the Major rehabilitation of each bridge are shown in the table below.

Cape Cod Canal Highway Bridges, MA Final Report Major Rehabilitation Evaluation Report 84 March 2020
Table 27 – Major Rehabilitation – Total Annualized Costs FY2020 Cost ($000) – March 2020 Bourne Bridge Sagamore Bridge Construction Cost of Rehabilitation – 2025 through 2031 $186,200 $156,300
Construction Cost of Additional Rehab Work –2045 through 2069 158,900 144,400
Travel Delay Costs 948,400 1,281,300 Total Costs (FY 2020 Dollars) $1,293,500 $1,582,000 Discount Factor 2.75% 2.75% Capital Recovery Factor 0.03704 0.03704 Discounted Cost of Rehabilitation $142,000 $132,900 Discounted Additional Rehab Work 47,200 49,700 Discounted Travel Delay Cost 536,700 782,600 Interest During Construction (IDC) 5,200 4,300 Total Discounted Cost $731,100 $969,500 Annualized Cost $27,100 $35,900
Interest during construction (IDC) is the interest cost incurred while the disbursement of payments is distributed over the course of the project construction, as costs do not hit in one year but rather is assumed over the duration of the construction period. The time period for the IDC calculation was 3 years for Major Rehabilitation
8.4.5 Major Rehabilitation – Results of Economic Analysis
The benefits of Major Rehabilitation are the quantifiable, incremental gains that will accrue to the society as a result of rehabilitation (“with-project” condition), as compared to the current Base Condition (“without-project” condition). The total benefits from decreased emergency repairs following component failures in the Base Condition are compared to the total cost of the major rehabilitation which includes both construction costs and value of time costs from traffic delays. A benefit-cost ratio (BCR) greater than one indicates that the project’s benefits outweigh the costs. As shown in the table below, both bridge rehabilitation projects result in net benefits and benefit-cost-ratios greater than 1. Please see Appendix D, Economics, for further discussion of analysis of each bridge.
8.4.6 Summary of the Major Rehabilitation Alternative
The economic analysis supports the Major Rehabilitation projects for both bridges over maintaining the bridges in the “fix-as-fails” Base Condition. As shown in the table below both rehabilitation projects result in net benefits and benefit-cost-ratios greater than 1. The impact of traffic delays is a major cost component highlighting the importance of these structures in traffic flows.

Cape Cod Canal Highway Bridges, MA Final Report Major Rehabilitation Evaluation Report 85 March 2020
Table 28 – Annual Major Rehabilitation Costs and BCR
FY 2020 ($000)
Discounted Cost Annual Benefit
(Difference)
Annual Cost
Net Annual Benefit
Benefit Cost Ratio
Base Condition
Major Rehabilitation
Sagamore Bridge Rehabilitation Costs and BCR Mean 123,900 8,800 115,100 35,900 79,200 3.2
Bourne Bridge Rehabilitation Costs and BCR Mean 65,200 6,100 59,100 27,100 32,000 2.2 Source: Base Case (Emergency Repairs) and Major Rehabilitation discounted (2020) costs come from the Economic Appendix D, March 2020 Update, Tables D-68 through D-70. Annual Benefits are the difference between the Base Case and Major Rehabilitation costs. BCRs are from Appendix D, Table D-71.
8.5 Alternative D – Replacement with 4 Lanes and 2 Auxiliary On/Off Lanes The Bridge Replacement alternative, Plan D, involves construction of new bridges adjacent to each of the two existing bridges, with two auxiliary acceleration/ deceleration lanes (one in each direction), in addition to the 4 through travel lanes. This is an alternative to the Base Condition and Major Rehabilitation. This scenario has a greater upfront cost but also allows for a more reliable bridge structure that meets current FHWA and MassDOT standards and guidelines for highway and bridge design. The proposed bridge(s) would include one auxiliary lane on both sides (6 lanes total) to meet the needs of traffic safety and alleviate traffic congestion by separating entering and exiting traffic from through traffic. The new bridges would also include a wider sidewalk for pedestrian and bicycle traffic. The existing bridges will remain in service until the new bridges are opened to traffic. The new bridges would not require lane and bridge closures during their construction. There would be minor traffic impacts and travel delays during construction of the approach modifications by the state. The new bridges would not require extended lane and bridge closures and would have a lower maintenance cost when compared to the current bridges, however construction costs are higher than the costs of rehabilitation. The recommended timeline for the construction of the new bridges is 2025 through 2029 for the Sagamore Bridge and 2030 to 2034 for the Bourne Bridge.
Replacement of the bridges will improve the reliability of bridge components and therefore significantly decrease the probability of failure. In this situation, failure is defined as unsatisfactory conditions that would require limiting the weight (load-posting) allowed to be carried over the bridges. Benefits represent a reduction in emergency repair costs following a component failure and associated time value costs from lane closures related to these repairs. In addition, the new bridges will also have lower annual maintenance costs throughout the 50-year forecast. Modeling these phenomena provided a method to quantify the net benefits for current and future users.

Cape Cod Canal Highway Bridges, MA Final Report Major Rehabilitation Evaluation Report 86 March 2020
8.5.1 Probability of Unsatisfactory Performance – Bridge Replacement – 4 Lane The replacement bridge project will result in more reliable bridges with much smaller probabilities of component failures over the life of the bridges. As an example, below are probability of unsatisfactory performance charts for the bridge superstructures for each bridge exemplifying improved reliability functions. Failure probabilities were assumed to be similar for both replacement alternatives (bridges with or without auxiliary lanes).
The probability of a superstructure failure would be reset to 0 when the replacement project is complete. The probability of failure (see Figure 20) will slowly rise throughout the forecast horizon and will again be reset after scheduled major repairs. The probability of failure in the superstructure will slowly rise throughout the forecast horizon, reaching 0.05% in 2069 for the Sagamore Bridge and 0.03% for the Bourne Bridge compared to 1.7% in the base condition. By comparison, the base condition probability of failure raises to 64.9% by 2069. The probability of a bridge deck and substructure failures would each be reset to 0% when the replacement project is complete. The probability of failure of these components will slowly rise throughout the forecast horizon and would be reset to 0% again during scheduled major repairs. The probability of deck failure will be near nil for the remainder of the forecast (below 0.2%) following the replacement project. By comparison, the Base Condition reached 37.4% for the decks in the final year of the evaluation. The probability of substructure failure will slowly rise throughout the forecast horizon, reaching 0.05% in 2069 for the Sagamore Bridge and 0.03% for the Bourne Bridge compared to 1.7% in the Base Condition.
Following the Bridge Replacement project, the event trees used to predict the severity of a component failure will be different for the new bridges. The replacement project will hinder the occurrence of more severe component failures. Please see Appendix D – Economics, for further discussion of event trees for the three bridge components.

Cape Cod Canal Highway Bridges, MA Final Report Major Rehabilitation Evaluation Report 87 March 2020
Figure 20 – Bridge Replacement Failure Probability – Bridge Superstructure
8.5.2 Benefits, Unsatisfactory Performance, and Monte Carlo Simulation
The repair, navigation, and travel costs are determined as described in the same process as the Base Condition and Major Rehabilitation using Monte Carlo Simulation. The results for the replacement bridges are presented in the table below and detailed in Appendix D – Economics (Table D-72).
0%
2%
4%
6%
8%
10%
12%
14%20
2020
2220
2420
2620
2820
3020
3220
3420
3620
3820
4020
4220
4420
4620
4820
5020
5220
5420
5620
5820
6020
6220
6420
6620
6820
70
Probability of a SuperstructureSagamore Replacement
0%2%4%6%8%
10%12%14%16%18%
2020
2022
2024
2026
2028
2030
2032
2034
2036
2038
2040
2042
2044
2046
2048
2050
2052
2054
2056
2058
2060
2062
2064
2066
2068
2070
Probability of a SuperstructureBourne Replacement

Cape Cod Canal Highway Bridges, MA Final Report Major Rehabilitation Evaluation Report 88 March 2020
Table 29 – Bridge Replacement Plan D - 6 Lanes - Annual Costs ($000s)
FY 2020 ($000) Repair Cost
Navigation Cost
Travel Cost O&M Total
Sagamore Bridge Replacement 6 Lanes Annual Costs Mean 300 0.1 4,000 200 4,500
Bourne Bridge Replacement 6 Lanes Annual Costs Mean 500 0.2 6,300 200 7,000
8.5.3 Benefits of Reduced Congestion – Bridge Replacement Plan D
One additional benefit of the 6-lane replacement bridge is the improved traffic patterns with the addition of acceleration/deceleration lanes on the bridge decks and approaches. The method described earlier using analysis of vehicle hours traveled, was used to compare the value of time in traffic with the 6-lane bridge and compared it to the Base Condition. The annual total time savings is displayed in the table below (Appendix D, Table D-51).
Table 30 – Benefits of Reduced Congestion Bridge Replacement with Through Travel and Auxiliary Lanes
Cost ($000) FY2020 Prices
Sagamore Bridge
Bourne Bridge
Replacement of Both Bridges
Total Benefit 3,500 800 4,200 Annual Benefit 100 30 200
The benefits are fairly minimal due mainly from the fact that the approach infrastructure, owned by the State of Massachusetts, is not assumed to be improved. The current infrastructure, especially around the Bourne Rotary, is limited. This limits the benefits to avoiding traffic conflicts due to slower traffic entering and exiting the bridges from and to the connecting surface roads immediately inshore of the abutments. On the existing bridges and the In-Kind 4-Lane Replacement Bridges this traffic is merged with the right-hand travel lane, limiting through traffic to one lane in each direction on each bridge.
To determine the benefit of the Bridge Replacement alternative, the cost savings are determined by subtracting the costs for in the Bridge Replacement from Base Condition total costs. The benefits are detailed in the table below.

Cape Cod Canal Highway Bridges, MA Final Report Major Rehabilitation Evaluation Report 89 March 2020
Table 31 – Bridge Replacement 6 Lanes – Benefits Costs/Benefits ($000) FY2020 Prices
Base Case Total Cost
New Bridges Total Cost Benefit
Sagamore Bridge Replacement 6 Lanes Benefits Mean $123,900 $4,500 $119,400
Bourne Bridge Replacement 6 Lanes Benefits Mean $65,200 $7,000 $58,200
The occurrence of a component failure would decline over the study period after the replacement bridges are constructed. Therefore travel delay costs typically associated with these failures similarly are reduced. In addition, annual O&M costs for the new bridges are reduced. The measurable benefit of replacing the bridges is the total cost savings of $119.4 million annually for the Sagamore Bridge and $58.2 million annually for the Bourne Bridge.
8.5.4 Cost of Bridge Replacement Plan D The costs of Bridge Replacement Plan D construction is comprised of the total construction cost of the bridges, impacts to navigation during construction, future operations and maintenance, and future repairs to the new bridges during the 50-year project economic life. There will be only limited impact to traffic as the new bridges will be constructed adjacent to the existing bridges. There will be some disruption to vessel traffic during the initial construction and travel delays will be incurred during regular maintenance repairs over the life of the new bridges.
The majority of costs for this alternative will be incurred at the beginning of the construction timeline. As shown in the table below, the total cost of the construction for the new Sagamore Bridge is $501.9 million, and $729.7 million for the Bourne Bridge. A major rehabilitation of the new bridges will not be necessary during the 50 year period, though there will be scheduled repairs.
Table 32 – Bridge Replacement Construction Costs – 6 Lanes Plan D Project Costs in $000s FY2020 Price Levels (Updated March 2020)
Sagamore Bridge Construction Cost
Bourne Bridge Construction Cost
Years Cost Years Cost New Bridges 2025-2029 $428,281 2030-2034 $630,773 State Approaches 2025-2029 $57,802 2030-2034 $90,991 Major Repairs 2048 $7,906 2054 $7,911 Major Repairs 2069 $7,906 - - - - - -
Total Cost $501,895 $729,675

Cape Cod Canal Highway Bridges, MA Final Report Major Rehabilitation Evaluation Report 90 March 2020
8.5.5 Future Traffic Delay Cost with Bridge Replacement Plan D There are no expected lane or bridge closures during construction of the new bridges as they will be constructed adjacent to the existing bridges. Though some impacts to traffic could be expected during state modification to the approach roads. The existing bridges will continue to operate until the construction is completed and then traffic will be redirected with minimal impact on traffic delays. However, during the scheduled repairs that are expected to occur later in the 50-year timeframe, there will be impacts to traffic. Table 38 below shows the construction costs, navigation costs, and associated travel costs for Bridge Replacement.
Table 33 - Bridge Replacement Plan D – 6 Lanes Costs (Updated March 2020) Year of New Bridge Construction or Major Repairs
Cost of Construction
($000)
Navigation Cost ($000)
Travel Cost ($000)
Total Cost by Year Incurred
Sagamore Bridge Replacement - 6 Lanes Costs 2025-2029 $486,100 $200 $0 $486,300 2048 7,900 0 46,300 54,200 2069 7,900 0 46,300 54,200 Total $501,900 $200 $92,600 $594,700
Bourne Bridge Replacement - 6 Lanes Costs 2030-2034 $721,800 $200 $0 $722,000 2054 7,900 0 22,200 30,100 Total $729,700 $200 $22,200 $752,100 Note: Costs are discounted in final analysis
8.5.6 Total Annualized Cost – Plan D Bridge Replacement The total costs are annualized to determine the annual cost over the 50 year study as shown in the table below. The construction time duration used for the interest during construction (IDC) is five years.

Cape Cod Canal Highway Bridges, MA Final Report Major Rehabilitation Evaluation Report 91 March 2020
Table 34 – Bridge Replacement 6 Lanes - Total Annualized Cost ($000)
(Costs and Benefits Updated February-March 2020) FY2020 Price Levels Bourne Bridge Sagamore Bridge Construction Cost of Replacement $721,800 $486,100 Construction Cost of Additional Repair Work 7,900 15,800 Travel and Navigation Delay Costs 22,400 92,800 Total Project Costs $718,600 $561,400 Discount Factor 2.75% 2.75% Capital Recovery Factor 0.03704 0.03704 Discounted Cost of Replacement Cost $521,600 $402,300 Discounted Additional Repair Work 3,100 5,700 Discounted Travel and Navigation Delay Cost 8,900 33,500 Interest During Construction (IDC) 40,800 27,500 Total Cost $574,400 $469,000 Annualized Cost $21,300 $17,400 See Appendix D, Economics, Tables D-74 and D-75.
8.5.7 Plan D Bridge Replacement – Results of Economic Analysis The total net benefits of Bridge Replacement are determined by comparing total project costs of replacement with total project cost of the Base Condition. Decreased emergency repairs following component failures on the existing bridges under the Base Condition is compared to the total cost of the Replacement Bridges, including design and construction costs, navigation and traffic costs, and scheduled repairs. Table 35 shows the economic analysis for Bridge Replacement with 4 through-traffic lanes plus 2 auxiliary lanes, including total benefits, costs, net benefits, and benefit-cost ratios. Please see Appendix D – Economics (Table D-76), for further discussion of the BCRs.
Table 35 – Bridge Replacement 6 Lanes Annual Cost and BCR
FY2020 ($000) Benefit Cost Net Benefit BCR Sagamore Bridge Replacement – 6 Lanes – Annual Cost and BCR
Mean 119,500 17,400 102,100 6.9 Bourne Bridge Replacement – 6 Lanes – Annual Cost and BCR
Mean 58,300 21,300 37,000 2.7

Cape Cod Canal Highway Bridges, MA Final Report Major Rehabilitation Evaluation Report 92 March 2020
8.5.8 Summary of New Bridge Replacement Plan D The results indicate that Bridge Replacement with construction of two new 6-lane bridges has a higher benefit to cost ratio than maintaining the bridges in a “fix-as-fails” Base Condition. In addition, the cost-benefit ratios are also higher than for Major Rehabilitation of the existing bridges. This study showed that replacement of both bridges results in positive net annual benefits and benefit-cost-ratios greater than 1. The impact of traffic delays is a major component in adding economic costs, highlighting the importance of these structures in traffic flows. The Bridge Replacement alternative limits the impact on traffic which economically outweighs the higher upfront cost.
8.6 Extended Life Value of New Bridges The fifty year study period (2020-2069) is used to compare alternatives with the Base Condition. Fifty years captures the economic environment expected during that standardized time and does not measure the life of each alternative. At the end of the fifty-year study period in 2069, the bridges will not be in equal condition across all alternatives. According to the American Association of State Highway and Transportation Officials (AASHTO) the design life of bridges constructed today is seventy-five years. Therefore, the Bridge Replacement alternatives have an expected life significantly beyond 2069. Given that construction on the replacement Sagamore Bridge is expected to be completed in 2029, the 75-year design life of the bridge will extend to 2103. Similarly, the Bourne Bridge is expected to be completed in 2034 and therefore the life of the bridge will extend to 2108. In addition, over the fifty year study period there will be two scheduled major repairs that will help to further extend the lives of the new bridges.
In contrast, the current bridges have already exceeded eighty-five years. Major rehabilitation projects can extend the life of the bridges but will be required more frequently as time progresses. In addition, the size of the continual rehabilitation projects are expected to escalate as time passes. These future costs for rehabilitated bridges will be more expensive than the scheduled repairs to extend the life of the new replacement bridges.
8.7 Summary of Economic Results and Conclusions
The results of the economic analysis of the four alternatives is shown below in Table 41 for the Sagamore and Bourne Bridges. Based solely on Net Annual Benefits from the economic analysis, the rank of alternatives is as follows. The results are the same for each bridge individually.
2. Alternative D: Bridge Replacement with two 4-lane bridges with auxiliary on/off lanes 3. Alternative B: Major Rehabilitation of the two existing bridges 4. Alternative A: Base condition - continue to maintain the bridges with regularly
scheduled maintenance and make emergency funding available when there is a component failure.

Cape Cod Canal Highway Bridges, MA Final Report Major Rehabilitation Evaluation Report 93 March 2020
The economic analysis suggests that the Base Condition – Plan A, fixing the current bridges as components deteriorate, will lead to escalating costs, particularly costs for travelers delayed in traffic.
Table 36 – Economic Summary Scenario Simulation Comparison Costs ($000) (Updated March 2020)
Repair Cost
Rehab or Construction
Cost Benefits Net
Benefits BCR
Sagamore Bridge Summary Results Base Condition (Alternative A) Mean 123,900 - - - - Median 119,000 - - - - Major Rehabilitation (Alternative B) Mean 8,800 35,900 115,100 79,200 3.2 Median 6,600 35,900 112,400 76,500 3.1 Replacement Bridge 4 Lanes with 2 Auxiliary Lanes (Alternative D) Mean 4,400 17,400 119,500 102,100 6.9 Median 2,900 17,400 116,100 98,700 6.7 Bourne Bridge Summary Results Base Condition (Alternative A) Mean 65,200 - - - - Median 62,700 - - - - Major Rehabilitation (Alternative B) Mean 6,100 27,100 59,100 32,000 2.2 Median 4,800 27,100 57,900 30,800 2.1 Replacement Bridge 4 Lanes with 2 Auxiliary Lanes (Alternative D) Mean 6,900 21,300 58,300 37,000 2.7 Median 4,200 21,300 58,500 37,200 2.7 Note: From Appendix D – Economics – Tables D-77 and D-78
Plan B – Major Rehabilitation of both existing bridges demonstrated positive net benefits and a benefit-cost-ratio of 3.2 for the Sagamore Bridge and 2.2 for the Bourne Bridge. One advantage of the Major Rehabilitation is a lower initial construction cost for the project when compared to replacing the bridges. The disadvantages are the impact it will have on traffic patterns during the time of construction due to lane and full bridge closures as well as the bridges not being brought up to current engineering standards and regulations. Continued deterioration over time and escalating frequency of future repairs and additional rehabilitation are also concerns.

Cape Cod Canal Highway Bridges, MA Final Report Major Rehabilitation Evaluation Report 94 March 2020
Alternatives for replacement bridges were also evaluated for two 4-lane bridges with auxiliary on/off lanes (Plan D). These alternatives had higher net benefits and BCRs than the Major Rehabilitation alternative. One disadvantage of the new bridges is the high initial construction cost. On the other hand, advantages of the Bridge Replacements are minimal disturbances to traffic during construction and replacing the aging infrastructure with bridges that meet current engineering standards and regulations. The new bridges will also have far less future repair costs and traffic delays over the project life cycle.
It is important to note that this analysis was performed under the assumption that the infrastructure and surrounding roadways to the bridges remain in their current conditions and are not upgraded by the state of Massachusetts. If the state chose to improve the road network surrounding the bridges, particularly near the Bourne Rotary, then the replacement bridges with auxiliary on/off lanes added would provide benefits of improved travel time that could increase the net annual benefits and BCR. The 6-lane replacement bridges could also reduce the impact to the traveling public when performing future maintenance on the bridges as additional lanes would be available. Please see Appendix D – Economics for a detailed economic analysis of the alternatives. 9.0 ENVIRONMENTAL CONSIDERATIONS AND ANALYSIS This MRER and the accompanying Phase I EA document the analysis and decision process for determining the best solution for ensuring long-term safe, reliable, and cost effective vehicular access across the Cape Cod Canal. This chapter summarizes the information and analyses contained in the Phase I EA including discussion of the resources within the project area and consideration of potential impacts based on a conceptual bridge design and a preliminary estimated project area. Resources and potential impacts will be more fully defined and analyzed when the project moves to the design and construction phase (Phase II).
9.1 Affected Environment and Environmental Consequences 9.1.1 Land Use The affected area is covered by transportation infrastructure, residential and commercial properties, and forested land. Property owned by the U.S. Government and administered by the USACE at the Cape Cod Canal includes a total of 1,153 acres; of which 982 acres of land is situated along the 7.7 mile land cut of the Canal. Approximately 20% of the government-owned property is developed. Within the developed areas are 10 USACE-operated recreation areas. The Canal has riprap embankments along the shoreline with service roads running along both sides of the canal. This USACE property is used for Canal maintenance access as well as public recreational access.
Plan A – Base Condition – No Action: No changes would occur to existing land uses because with routine and emergency maintenance bridge alignments would remain the same, and no other changes to the bridges footprint would occur. There are no other foreseeable changes to

Cape Cod Canal Highway Bridges, MA Final Report Major Rehabilitation Evaluation Report 95 March 2020
land use or land cover related to the bridges remaining in their current position with no major changes to their configuration and function.
Plan B – Major Rehabilitation: Major rehabilitation of the bridges would cause temporary localized impacts from construction and maintenance activities, but the permanent bridge structures would all continue to occupy the same footprint. Past maintenance and rehabilitation efforts were completed without adverse effects to land use and physical resources. Any disturbed sites would be returned to pre-project conditions following the completion of major rehabilitation.
Plan D – Bridge Replacement: Localized, permanent impacts adjacent to the existing highway bridges would occur where the replacement bridge would be constructed. The bridge piers, abutments, and landings would be in slightly different locations and thus result in permanent land use impacts. Under Alternative D, the footprints would be slightly larger because of the two auxiliary lanes on each bridge. The affected land uses by the new bridges under both alternatives are commercial, transportation, forested, and residential. The construction staging areas would be returned to pre-project conditions where possible.
9.1.2 Terrain and Topography The terrain around the bridges varies in elevation, generally rising with distance away from the Canal in the project area. Elevations in the study areas range from sea level to approximately 100 feet above MSL around the Sagamore Bridge, with an increase in elevation around the Bourne Bridge of 50 to 100 feet above MSL. Under both the Base Condition (Plan A) and Major Rehabilitation (Plan B) there would be no impacts to terrain and topography with routine bridge maintenance or major rehabilitation because no changes to existing grades are anticipated. With bridge replacement (Plan D) re-grading of some surrounding areas to accommodate the new bridge approaches and abutments will be required for new bridges. Until specific bridge designs are available, the exact extent of these modifications is unclear and will be fully defined in Phase II of the project. 9.1.3 Geology and Soils Cape Cod is composed of glacial end moraines, which mark the approximate locations of the ice front and outwash plains formed by sediments deposited by streams of melt water from the glaciers. The result is a series of connected, broad, sandy plains and hilly terrain. Sediments at the east end of the Canal were deposited in a lake that formed in Cape Cod Bay between the retreating ice front and the Sandwich moraine. A significant amount of soils around the Canal are Udipsamments, i.e. the original soil was excavated or filled during construction. The bedrock surface elevations in the vicinity of the Canal range from roughly -125 to -175 feet MSL. Under the Base Condition (Plan A) and Major Rehabilitation (Plan B) there are no impacts because the existing bridge structures would remain in place and only activities related to routine maintenance or rehabilitation of the existing structures would occur. Bridge replacement (Plan D) would have no long term effect on geology and soils. Surface soils in

Cape Cod Canal Highway Bridges, MA Final Report Major Rehabilitation Evaluation Report 96 March 2020
currently managed areas may be disturbed by construction activities during the course of work on the bridge approaches and abutments and the creation of temporary laydown areas, and also for altering the configuration of approaches 9.1.4 Climate Barnstable County experiences average high temperatures ranging from 80 degrees Fahrenheit (°F) in July to 38°F in January and average low temperatures ranging from 63°F in July to 20°F in January. Average annual precipitation is 47.63 inches, with the month of March generally receiving the most precipitation and the month of July receiving the least (NOAA, 2016). Extreme weather varies in Barnstable County from drought conditions to hurricane events. None of the alternatives would have direct or indirect impacts to the climate of the region. Routine operation and maintenance, replacing or rehabilitating existing bridges, or replacement of the two bridges will not have any appreciable effects on climate in the region because of the limited potential of these activities to influence long term temperature and weather trends. 9.1.5 Air Quality The Clean Air Act (40 CFR Part 50) requires the U.S. EPA to set, and states to adopt, National Ambient Air Quality Standards (NAAQS). EPA has set NAAQS for six pollutants: Carbon Monoxide (CO), Lead (Pb), Nitrogen Dioxide (NO2), Particulate Matter with a diameter less than or equal to ten micrometers (PM10) and less than 2.5 micrometers (PM2.5), Ozone (O3), and Sulfur Dioxide (SO2). Both bridge replacement projects are located within Barnstable County which is currently designated as an Attainment Area for all NAAQS. The project area is in attainment of all of the applicable NAAQS; therefore, transportation conformity rule requirements do not apply for this region. None of the Alternatives will result in permanent air emissions or long-term impacts to air quality providing Best Management Practices (BMPs) are incorporated at the time of scheduled construction activities. No impact to local or regional air quality should occur as the result of the proposed project. Bridge routine and emergency maintenance (Plan A), as well as major rehabilitation (Plan B) activities, have the potential to cause a temporary increase in air emissions due to traffic backups and delays associated with this work. Bridge replacement (Plan D) will not significantly affect regional air quality levels because existing bridges will remain open until new bridge construction is completed, thereby reducing traffic and associated air emissions. Short-term/temporary impacts to air quality may occur during the construction period for any bridge replacement. Emissions from fuel-burning internal combustion engines (e.g., heavy equipment and earthmoving machinery) could temporarily increase the levels of some of the criteria pollutants. Short term impacts resulting from dust, construction vehicles, and related equipment are expected to be minor and should not have an extensive impact on local air quality.

Cape Cod Canal Highway Bridges, MA Final Report Major Rehabilitation Evaluation Report 97 March 2020
MassDOTs air quality study was used to assess the potential for increased or decreased air quality impacts within the study area utilizing EPA and FHWA guidelines. The evaluation determined that regardless of the option chosen, vehicle emissions would likely be lower than present levels because of the EPA’s national air quality control programs mandated under the federal Clean Air Act. The MassDOT preliminary air quality evaluation can be viewed in Appendix E. MassDOT plans on conducting additional air quality analyses in the next phase of the project to evaluate existing and future air quality impacts. 9.1.6 Lead Paint Though they have been repainted many times, the existing paint system on both bridges still contains lead paint. Even areas that have been repainted contain residual amounts of lead. Routine maintenance (Plan A) and major rehabilitation (Plan B) will require removal of lead containing paint from both bridges. During the design and construction phase, a Total Suspended Particulate (TSP) Monitoring Plan will be developed and TSP-lead monitoring will be conducted. Replacement of the existing bridges (Plans D) would also include demolishing the old bridges and may produce lead contaminated blast debris. All work will be performed in accordance with applicable environmental regulations, BMPs as well as worker health and safety standards, including containment, emissions monitoring, collection, and disposal of all contaminated blast debris and as such, there will be no significant impacts to air quality. 9.1.7 Surface Water and Wetlands The Cape Cod Canal FNP connects Buzzards Bay and Cape Cod Bay, and has significant tidal exchange with those water bodies. The project area has several man-made ponds and freshwater wetlands. The location and description of these ponds can be found in the Environmental Assessment. All of these ponds are less than a half-acre in size, and are surrounded by the roadways of the Sagamore Bridge approach. The slope and topography of this area indicate these ponds drain the land within the approach, which are at a higher elevation than the surrounding natural landscape. The USFWS National Wetlands Inventory (NWI) shows forested wetlands in the Bourne Bridge area. Finally, there is an area of estuarine marsh between the bridge and Old Bridge Road on the northern shore of the Canal. A USACE field inspection conducted on April 15, 2019 confirmed the location of wetlands found in the Federal and State online databases. An additional area of forested wetland approximately 50 by 100 feet in size (0.5 acres), is located roughly 500 feet east of the Bourne Bridge on the northern shore of the Canal. The Herring River Watershed is located west of the Sagamore Bridge study area on the mainland side of the Canal. This watershed is designated by the state as an Area of Critical Environmental Concern (ACEC) for its importance to anadromous fish and other wildlife. With both Plan A – Base Condition and Plan B – Major Rehabilitation, there would be no impacts to surface water and wetland resources because activities would take place only
Cape Cod Canal Highway Bridges, MA Final Report Major Rehabilitation Evaluation Report 98 March 2020
around existing structures where no wetlands are identified. Thus, only the area of the Canal where the piers are currently situated would continue to have impacts from routine maintenance or major rehabilitation, as well as by the presence of construction support barges in the event they might be required. Routine maintenance or major rehabilitation in the future would not involve any wetland impacts outside of the Canal. Under Plan D for Bridge Replacement nearby wetlands and ponds may be temporarily affected by construction activities. The man-made ponds in the Sagamore Bridge approach would be affected as the abutments would have to be moved further back, and Nightingale Pond in the Bourne Bridge area would be avoided. No adverse impacts are expected for the ACEC and Nightingale Pond. The Canal shoreline would also receive new proposed bridge piers, as they would be relocated out of the water. The shoreline in this area is rock/riprap, and is located on USACE property. The forested wetland 500 feet east of the Bourne Bridge on the northern side of the Canal touches the easternmost boundary of the area affected by the new alignment. This half-acre wetland would be most impacted by Plan D because of the extra width imposed by the auxiliary lanes. Mitigation measures would need to be developed during the design phase for any impacts to this wetland from bridge replacement. 9.1.8 Water Quality Water quality was considered for both fresh and salt water resources in the project area. The saltwater environment in the Canal is subject to the diurnal tidal cycle in connection with Cape Cod Bay and Buzzards Bay, creating a swift current that can reach 5.2 mph during the ebb tide. Water quality in the Canal is affected by the large volume of maritime traffic that passes through on a daily basis. The Massachusetts Department of Environmental Protection designates the Canal as “Class SB,” meaning that the waters of the Canal are designated for fish, other aquatic life and wildlife, and for primary and secondary contact and recreation.
Surface water on land is affected by runoff from the urban landscape and high volume of road traffic that passes over the Canal bridges. Nitrogen pollution from residential septic systems is a major concern on Cape Cod, as it can travel quickly through groundwater into ponds and coastal waters, causing algal blooms that negatively affect marine life (Dunn, 2018).
For the Base Condition – Plan A, there would be no impacts to water quality because there would be no change to existing conditions around the bridges. Routine maintenance operations would require construction activity on-site, but these operations have occurred for decades with no adverse water quality impacts. Major Rehabilitation (Plan B) would have no impacts on water quality.
Bridge Replacement (Plan D) is not anticipated to have any substantial effect on water quality because impacts to regulated water resources would be minimized through avoidance and minimization during the design and construction phase.
9.1.9 Groundwater Regional groundwater occurs in alluvial and bedrock aquifers. The Cape Cod Aquifer is a bedrock aquifer and is designated as the principal source of drinking water for residents of

Cape Cod Canal Highway Bridges, MA Final Report Major Rehabilitation Evaluation Report 99 March 2020
Cape Cod designated by EPA as a Sole Source Aquifer. This designation means that the Aquifer supplies at least 50 percent of the drinking water consumed in the area above it. The regional water bearing units of the Cape Cod Aquifer are further described in detail in the Environmental Assessment.
Under the Base Condition – Plan A, there would be no impacts to groundwater because no actions would occur that could affect regional or local groundwater patterns. There would be no impact to groundwater under Plans B or D. These actions would not affect the Cape’s high rates of surface water infiltration, and the effects of construction activities would not change the underlying hydrogeology of the area either directly or indirectly by rehabilitating or replacing the bridges. 9.1.10 Floodplains
Executive Order (EO) 11988 (Floodplain Management) requires Federal agencies to avoid direct or indirect support of development within the 100-year floodplain whenever there is a practicable alternative. The Federal Emergency Management Agency (FEMA) National Flood Insurance Program (NFIP) publishes maps identifying areas at risk from potential flooding. Flood maps were examined during the preparation of this MRER and EA. The bridges cross a major waterway and are located in two zones: X - 0.2% Annual Chance of Flooding or Area of Minimal Flood Hazard (500 year floodplain), and AE - 1% Annual Chance of Flooding, with Base Flood Elevations (100 year floodplain). There will be no significant impact to, or alteration of, floodplains or flood levels associated with any of the alternatives as both bridges are located over an existing federal navigation channel and adjacent to developed land.
9.1.11 Coastal Zone
The Coastal Zone Management Act (CZMA) enables coastal States, including Massachusetts, to designate State coastal zone boundaries and develop coastal management programs to improve protection of sensitive shoreline resources and guide sustainable use of coastal areas. All of Cape Cod and the islands of Nantucket and Martha’s Vineyard are included in the Massachusetts coastal zone boundary. Both the Sagamore and Bourne bridge project areas are located within these coastal boundaries. Under both the Base Condition – Plan A and Major Rehabilitation (Plan B) no new construction would occur within the coastal zone and activities associated with repair or rehabilitation of the existing bridges would not result in any short or long-term impacts to coastal resources within the project area. The Bridge Replacement (Plan D) will have no significant impact on the coastal environment. The project will preserve all coastal resources including the immediate waterfront and waterway for both recreational and vessel-related activities. 9.1.12 Coastal Barrier Resource System
Coastal barriers are unique landforms that protect coastal mainland areas from severe coastal storm damage and erosion and are important wildlife habitat and recreational areas. The
Cape Cod Canal Highway Bridges, MA Final Report Major Rehabilitation Evaluation Report 100 March 2020
Coastal Barrier Resources Act (CBRA) of 1982 established the Coastal Resources System which includes undeveloped coastal barriers along nation’s coastlines. The Bourne and Sagamore Bridges project areas are located outside of CBRA System Units and Otherwise Protected Areas.
9.1.13 Vegetation Cape Cod is situated in the Atlantic Coastal Pine Barrens ecoregion, a globally rare habitat type that only exists on the Cape and Islands, Long Island, and New Jersey. The 2017 Environmental Assessment and Finding of No Significant Impact for the Cape Cod Canal Photovoltaic Installation documented land cover and vegetation for areas adjacent to the Sagamore Bridge and the nearby Midway Recreation Area, providing an overview of vegetation and land cover within the canal bridges study area and the surrounding landscape. There are patches of forested land in the study area, composed of oak-pine and scrub-oak communities. Forested areas occur within 1000 feet of both bridges, and these are interspersed among roads and development. The shorelines of the Cape Cod Canal are primarily rip rap, and above that hard shoreline is a grassy area with occasional tree cover on the transition zone between the water and Canal Service Roads for both bridges. This is a man-made, heavily managed shoreline used for recreation and navigation purposes.
With the Base Condition (Plan A) there would be no impacts to vegetation as no changes to existing conditions would occur with this Alternative. Under the Major Rehabilitation (Plan B) there would be some disturbance of roadside vegetation, but the impacts would be minimal because the scope of work is largely confined to the existing rights-of-ways. With Bridge Replacement (Plan D) there would be localized permanent impacts on vegetation where the bridge approaches, piers and abutments are relocated. A new bridge would be constructed immediately to the east of the Bourne Bridge, and another bridge immediately to the west of the Sagamore Bridge. Forested areas adjacent to the bridges would undergo permanent changes as outlined in the Land Use section of this document.
9.1.14 Wildlife Mammals: There are a variety of mammals on Cape Cod inhabiting the diverse landscape, from the coastal pine barren forests to seashore environments. Mammals on Cape Cod were affected by habitat conversion in the early 19th century from woodland to farmland, and there was some recovery when agriculture moved westward. Several small terrestrial mammals potentially use the habitat areas surrounding the Bridges and these species are described in Environmental Assessment. Birds: The Canal is an important corridor for birds traveling between Massachusetts Bay and Buzzards Bay. The Corps has implemented programs to increase use of the Canal by birds such as ospreys (Pandion haliaetus) and screech owls (Megascops asio). Under the Base Condition (Plan A) there would be no impacts to wildlife under the no action alternative because existing conditions would continue. Routine maintenance activities have not negatively impacted bird and other mammal populations around the bridges in the past

Cape Cod Canal Highway Bridges, MA Final Report Major Rehabilitation Evaluation Report 101 March 2020
and are not expected to do so in the future. With Major Rehabilitation (Plan B) there may be minimal, temporary effects on wildlife because of the noise and duration of construction activities associated with major rehabilitation. However, these impacts are not expected to be significant because the noise from construction vehicles will likely deter animals from the construction site.
With Bridge Replacement (Plan D) impacts to wildlife are possible because of the changing footprint of new bridges, including the movement of the piers from within the Canal to an upland setting, as well as extending the approaches. These changes would take place in the regularly-dredged Canal and existing network of transportation infrastructure around the bridges. The piers would be moved to an upland setting that is already mowed and maintained by USACE. Wooded upland habitat used by wildlife would be affected, as well as marine epifauna living on the bridge piers and species that feed on them, but these impacts will be confined to the project area and further articulated in Phase II. If new bridges are built, the decision to leave the old bridge piers in place or remove them will be determined during the next phase of the project (Design Phase) and will depend on factors such as new bridge type, alignment and configuration. The old piers would most likely be in the way of new bridge construction and would therefore need to be removed. Also, the piers were constructed to support a significant portion of the weight of bridges. Removing that weight could have detrimental effects on the overall stability of the piers. They were not built to be free standing structures. At this preliminary phase, there is currently no engineering justification to leave the piers in place. Also, if left in place they could pose a navigation safety hazard and would require ongoing inspections and maintenance. Discussions with the Resource Agencies related to any potential impacts to marine epifauna associated with either the removal of existing piers or leaving them in place, will also be conducted during the next phase of the project (Design Phase). Both U.S. Fish and Wildlife Service and National Marine Fisheries Service have concurred with this approach. Agency Concurrence letters will be added to Appendix E.
9.1.15 Fisheries, Marine Wildlife and Essential Fish Habitat The Canal is an important recreational fishery because of its swift currents and connectivity between Buzzards and Cape Cod bays. The Bournedale Herring Run entrance is located about one mile west of the Sagamore Bridge, and provides access for Alewife and Blueback Herring to spawn in Great Herring Pond. A March 1991 USACE survey of benthic habitat on the western edge of the Canal found no macrofauna, but did locate other sporadic marine ecological communities. There are recorded spawning sites within Buttermilk Bay to the west, but none within the Canal land cut. There is no eelgrass in the Canal’s Federal navigation channel, but it is found outside of the channel near Hog’s island on the western end of the Canal approaches. Essential Fish Habitat: The 1996 amendments to the Magnuson-Stevens Fishery Conservation Management Act (MSA) strengthen the ability of the National Marine Fisheries Service (NMFS) and the New England Fishery Management Council to protect and conserve the

Cape Cod Canal Highway Bridges, MA Final Report Major Rehabilitation Evaluation Report 102 March 2020
habitat of marine, estuarine, and anadromous finfish, mollusks, and crustaceans. This habitat is termed "Essential Fish Habitat," (EFH) and is broadly defined to include, "those waters and substrate necessary to fish for spawning, breeding, feeding, or growth to maturity." The Cape Cod Canal falls into this category for multiple fish species, which are described further in the Environmental Assessment. With the Base Condition (Plan A) there would be no effects on EFH species because routine and emergency maintenance would not require in-water work. Under Major Rehabilitation (Plan B) in-water work or elevated noise levels in the water due to major rehabilitation construction may have minimal temporary impacts on EFH species, and coordination would need to be undertaken with NMFS pursuant to the MSA during Phase II. With Bridge Replacement (Plan D) underwater work related to the removal of existing bridge piers may affect EFH or fish species. Construction or placement of new bridge components from the water and demolition of the existing bridges may also have impacts on fisheries. Further, the USACE proposes to move the bridge piers from the water to the Canal shoreline, thus removing those structures as habitat. Further coordination would be required in Phase II. 9.1.16 Threatened and Endangered Species Federal Threatened and Endangered Species: The Corps conducted an initial screening of the proposed project site utilizing the US Fish and Wildlife Service (USFWS) Information for Planning and Consultation (IPaC) webpage and as well as requesting an official species list from USFWS. These records indicate that the federally-threatened northern long-eared bat (NLEB; Myotis septentrionalis), endangered northern (Plymouth) red-bellied cooter (Pseudemys rubriventris), endangered American chaffseed (Schwalbea americana), roseate tern (Sterna dougalli dougallii), piping plover (Chadrius melodus), and red knot (Calidris canutus) may occur in the project area. The EA provides a map of federally-listed species and critical habitat occurring in or near the study area. The northern long eared bat may occur in the study area but has a widespread distribution. American chaffseed is not found in the study area, and the several bird species are present in a transient or migratory nature. Further discussion of the Threatened and Endangered Species can be found in the Environmental Assessment.
Under the Base Condition there would be no effect on federally listed species because there would be no change in existing conditions for routine maintenance of the bridges. Under the other three plans the project would likely have no effect on federally listed species, except for Northern Long Eared Bat (NLEB) which may roost under the bridges. USACE will conduct surveys and will consult with USFWS pursuant to Section 7 of the Endangered Species Act (ESA) to determine if NLEB are present and identify measures necessary to minimize potential impact. USACE will also consult with NMFS in Phase II of the project to protect federally listed species.
Both U.S. Fish and Wildlife Service and National Marine Fisheries Service have reviewed the Draft EA and concurred with this approach. Agency Concurrence letters will be added to

Cape Cod Canal Highway Bridges, MA Final Report Major Rehabilitation Evaluation Report 103 March 2020
Appendix E. Based on our conversations with the resource agencies the risk of a jeopardy determination is extremely low.
State Listed Threatened and Endangered Species: Forty-six species are listed by the Massachusetts Natural Heritage Endangered Species Program (MA NHESP) as occurring in Bourne, Massachusetts (see EA). According to the MassGIS, Estimated Habitats of Rare Wildlife and Priority Habitats of Rare Species are not mapped within either bridge site (2019).
The Midway Recreation Area, a USACE parcel adjacent to the Canal is within NHESP Priority Habitat of Rare Species but will not be affected by the proposed project. Coordination with the MA NHESP during the scoping process for the 2017 EA indicated that Eastern Box Turtles (Terrapene carolina), a Species of Concern, is known to inhabit the Midway site. Eastern Box Turtles are small, terrestrial tortoises that range from southeastern Maine to northern Florida and as far west as Michigan, Illinois, and Tennessee. Under the Base Condition (Plan A) and the Major Rehabilitation (Plan B) there will be no impacts to state-listed species because activities will not take place in areas designated as priority habitats of rare species or areas of critical environmental concern. Bridge maintenance or rehabilitation work will take place within the existing bridge footprints and rights of way. With Bridge Replacement (Plan D) there are no estimated habitats of rare wildlife or priority habitats of rare species within the study area, so no impacts to state-listed wildlife are expected. 9.1.17 Environmental Justice
It is important that any construction project under consideration by the federal government ensures that it does not negatively impact socially vulnerable populations. The EPA defines Environmental Justice as the “the fair treatment and meaningful involvement of all people regardless of race, color, national origin, or income, with respect to the development, implementation, and enforcement of environmental laws, regulations, and policies”. Impacts to vulnerable populations as pertaining to Environmental Justice were evaluated in accordance with Executive Order 12898 – Federal Actions to Address Environmental Justice in Minority Populations and Low-Income Populations signed February 16, 1994 which directs Federal agencies to identify and address the disproportionately high and adverse human health or environmental effects of their actions on minority and low-income populations, to the greatest extent practicable and permitted by law. The EA includes a detailed evaluation of environmental justice issues. Minority Populations: An examination of census blocks for the Cape and Islands shows that the population is majority white, with only a few pockets of the population with a percentile greater than 50 on Martha’s Vineyard, Nantucket, Falmouth, and Barnstable, none of which are in the vicinity of the Canal and its bridges. The data for the five census blocks in the immediate area of the two highway bridges were examined. None of the census study block groups in the project area exceed the percent minority in the state or national average. Therefore, the population in the study area is not considered socially vulnerable as pertaining to minority population.

Cape Cod Canal Highway Bridges, MA Final Report Major Rehabilitation Evaluation Report 104 March 2020
Low Income Populations: Low-income population is defined by the EPA as the “percent of individuals whose ratio of household income to poverty level in the past 12 months was less than 2” and is calculated using data from the Census Bureau’s American Community Survey. Census block data was examined for Cape Cod and the Islands for income. Low-income populations are more prevalent in the region as compared to minority populations. The highest concentration on low-income population is in the town of Barnstable. The center of the Town of Barnstable is 15 miles from the nearest of the Canal bridges. All five census blocks in the vicinity of the two bridges had median household incomes higher than the state average. Also all block groups in the study area are well above the Department of Health and Human Services Poverty Guideline threshold. Therefore, the project will not negatively impact populations that are socially vulnerable due to low-income. Given that the population surrounding the two Canal highway bridges is not considered socially or environmentally vulnerable, none of the four alternatives is expected to have a negative impact on low-income or minority populations. 9.2 Indirect Impacts CEQ’s NEPA implementing regulations require Federal agencies to consider the potential for indirect effects and cumulative impacts from a proposed project (40 CFR §1508.7, 1508.8). The MRER and accompanying EA evaluates the direct, indirect, and cumulative effects of major rehabilitation or replacement of the Bourne and Sagamore bridges over the Canal and to analyze alternatives to either repair or replace the existing bridges. Indirect effects are defined as those which are caused by an action, and are later in time or farther removed in distance, but are still reasonably foreseeable. These effects can include inducing changes in patterns of land use, population density or growth rate as well as other related effects on air, water, and other natural ecosystems. The National Cooperative Highway Research program identifies the following types of transportation projects which might result in indirect effects to a project area: construction of a new highway, highway extensions, or bridges to currently undeveloped areas; new highway bypasses around congested downtowns; new or expanded airports and harbors; new rail transit, new interstate highways, or new interchanges in undeveloped or rural locations (NCHRP, 2002). CEQ defines “cumulative impact” as “the impact on the environment which results from the incremental impact of the action when added to other past, present, and reasonably foreseeable future actions regardless of what agency (federal or non-federal) or person undertakes such other actions.” (40 C.F.R. § 1508.7). The assessment of cumulative effects in this EA addresses the potential impacts from the project and other projects proposed within, or in the vicinity of the Cape Cod Canal bridges study area.
Cape Cod Canal Highway Bridges, MA Final Report Major Rehabilitation Evaluation Report 105 March 2020
The Cape Cod Canal bridges have been in place since the 1930s. Past and present activities at the Cape Cod Canal include maintenance of the Federal navigation channel and routine maintenance of the Bourne and Sagamore Bridges. Reasonably foreseeable future actions include the continuation of current maintenance and navigation activities as well as connected bridge approach road work required by MassDOT to connect new replacement bridges to existing roadways. MassDOT’s conceptual projects and their potential for cumulative impacts to area resources were described in Section 6.5 and in greater detail in Chapter 7 of the EA. Categories of indirect and cumulative impacts are discussed below.
9.2.1 Induced Development Concerns with additional development on Cape Cod tend to focus on congestion, water supply, sewage treatment and other strains on public infrastructure. In 2012 the Cape Cod Commission estimated that there was capacity for about 28,000 additional residential units and 32 million square feet of commercial space on the Cape. A UMass 2017 study estimated housing demand at about 26,000 units. Near capacity housing, with its impact on resources and infrastructure, is expected to occur regardless of any bridge improvements. 9.2.2 Traffic Impacts The traffic model only shows a difference in average travel time over the new versus existing bridges during the weekend summer mid-day time period. An increase in speed of 2 miles per hour decreases the average travel time over the average route length by less than 20 seconds. This change in accessibility would translate to no or weak potential for land use change. The Sagamore and Bourne Bridges are not the only source of bottleneck traffic as other Cape roadways also limit flow. Bridge replacement will have only minimal benefitsto traffic problems without improvements of roadways throughout the Cape. Therefore, bridge replacement will not substantially improve access to the Cape or increase the number of visitors and associated development. MassDOT is planning a number of state highway improvements even without changes in the Canal bridge crossings. These are discussed below under cumulative impacts. Each of these will have some level of traffic impact during construction. State projects for relocating bridge approach roads resulting from bridge replacement will also have impacts on traffic during construction. One additional benefit of the 6-lane replacement bridge is the improved traffic patterns with the additional acceleration/deceleration lanes. The benefits would be fairly minimal due mainly to the fact that the approach infrastructure, owned by the State of Massachusetts, is not assumed to be improved, only realigned. The current state and local infrastructure, especially around the Bourne Rotary, is limited. 9.2.3 Population Models and Forecasted Growth Since 2000, population growth slightly decreased in Barnstable County. Population dynamics are largely attributed to a large influx of baby boomers retiring to the region, the subsequent

Cape Cod Canal Highway Bridges, MA Final Report Major Rehabilitation Evaluation Report 106 March 2020
increase in death rates due to an ageing population, and younger populations leaving the region to pursue employment and educational opportunities. While some projections estimate an overall reduction in population on Cape Cod, others estimate an increase in population, though the rates of growth would have little to no potential for land use change in the study area. Bridge rehabilitation or replacement projects are not expected to lead to significant induced development and will not result in localized or regional indirect effects. 9.3 Cumulative Impacts 9.3.1 State Highway Improvements The bulk of the cumulative impacts associated with the Canal highway bridges rehabilitation or replacement involve projects to be undertaken by the MassDOT. Some of these are intended to occur in support of bridge replacement. A complete discussion of these projects can be found in the EA, Chapter 7. These state highway projects include:
(1) Bourne Rotary – Route 28 Northbound Ramp to Sandwich Road (2) Bourne Rotary – Three New Signalized Intersections (3) Bourne Rotary with Highway Interchange (4) Belmont Circle – 3 Leg Roundabout plus Signalized Intersection (5) Belmont Circle with Route 25 Eastbound Fly-over (6) Belmont Circle – Cape Cod Scenic Highway to Route 25 Westbound On-Ramp (7) Route 6 – Exit 1C Relocation (8) Route 6 – Additional Eastbound Travel Lane from Exit 1A to Exit 2 (3 total lanes)
The MassDOT Alternatives are based on the assumption that the USACE will replace both the Bourne and Sagamore bridges. The discussion examines only those conceptual MassDOT projects that could potentially be linked to the replacement of the Bourne and Sagamore bridges. MassDOT alternatives descriptions are taken from that agency’s Cape Cod Canal Transportation Study (2019).
Bourne Rotary Alternatives: The first three improvements listed above concern the Bourne Rotary at the Cape Code side of the Bourne Bridge and its connection to local roads. These include intersection improvements, signalization, and ramp and connecting road improvements. None of the three alternatives evaluated for the reconstruction of the Bourne Rotary would impact wetland resources or the 100-year floodplain. A small area of rare species habitat would be impacted by replacing the rotary with a highway interchange. Minor real estate areas would need to be acquired from the town for the State’s work. Belmont Circle Alternatives: Belmont Circle is the intersection of Route 25, Main Street, Scenic Highway, and the Buzzards Bay Bypass. Several alternatives were evaluated to improve traffic operations at Belmont Circle, including signalization, roundabout changes, and a flyover ramp. All include the new Entrance Ramp, Scenic Highway Westbound to Route 25 Westbound project. Only the roundabout alternatives would impact wetlands and

Cape Cod Canal Highway Bridges, MA Final Report Major Rehabilitation Evaluation Report 107 March 2020
the 100-year floodplain. Utility relocations would be required. Some property may need to be acquired. Route 6 Alternatives: U.S. Route 6 projects include relocation of Exit 1C and addition of a third lane eastbound from the Sagamore Bridge to Exit 2. Exit 1C connects westbound traffic with the local roads, including Route 6A, just before the Sagamore Bridge. There would be no wetland, floodplain, or other regulated water resources impact from the Route 6 Exit 1C relocation. Some rare species habitat could be impacted. There are no wetlands, floodplains, or other regulated wetland resources within 100 feet of the Route 6 corridor, and there would be no impacts to these resources by the highway widening. About 3.9 acres of land designated as rare species habitat by the state would be impacted, all forested land within JBCC and the Shawme-Crowell State Forest. 9.3.2 Total Cumulative Impact and Significance If all of the State’s large alternatives for each of the improvements listed above were implemented there would be minor impacts to the wetlands, the 100-year floodplain and rare species habitat, mostly due to the Belmont Circle reconstruction and the additional Route 6 eastbound travel lane. All MassDOT plans are conceptual at this phase and none have been authorized or identified for funding. Future MassDOT Cape Cod transportation improvement projects are uncertain at this phase and if identified in the future further analysis will be conducted during Phase II. 9.3.3 Other Development Projects The USACE contacted the local Conservation Commissions and Planning Boards in the towns of Bourne and Sandwich, MA to identify any current or planned future projects in each community as well as their proximity to the bridges study area. Fifteen projects were identified. Although three of those projects fall within the study area: redevelopment of Cumberland Farms, a proposed new wastewater system, a gas station and an extended stay hotel, all are located in previously developed areas and present no cumulative environmental impacts. All potential projects will be further evaluated during Phase II of the project. At this time it is believed that there will be no significant cumulative environmental impacts from major rehabilitation or replacement of the Bourne and Sagamore Bridges in association with any of the other proposed development projects identified.
9.4 Public Involvement USACE regulations (Planning Guidance Notebook – ER 1105-1-100) and the National Environmental Policy Act (NEPA) require that all efforts be made to involve the public in preparing and implementing NEPA procedures and to hold public meetings whenever appropriate. The USACE encourages stakeholder engagement, collaboration, and coordination for all projects and decision-making processes. Agencies, organizations, federally recognized

Cape Cod Canal Highway Bridges, MA Final Report Major Rehabilitation Evaluation Report 108 March 2020
Tribes, and members of the public with a potential interest in a proposed project were kept informed and invited to participate in the decision-making process for this project. Appendix E provides a record of agency and Tribal coordination associated with the MRER and EA. The USACE involved the public early in the bridges study planning process to provide open communication and enable better federal decision-making. A series of five public informational meetings were held during the first two weeks of December 2018 in Bourne, Plymouth, Hyannis, Martha’s Vineyard, and Nantucket, MA. These meetings introduced the MRER, environmental assessment process, and project timelines. A project website (www.CapeCodCanalBridgesStudy.com) was developed to keep the public informed through presentations, fact sheets, and documents, and provided an additional option for submitting public comments. One hundred four public comment letters or e-mails were received to date and were compiled into a summary matrix for consideration (Appendix F). Another series of public meetings will be held to allow the opportunity for comments on this phase of the project and the draft MRER and EA. The Corps will notify the public of the availability of the draft MRER and draft EA through publication of a public notice which will begin a 30-day public comment period. Additional public informational meetings will be scheduled during Phase II of the project to discuss the status of the project, design and construction details, and other key project considerations.
9.5 Environmental Coordination NEPA requires lead Federal agencies to cooperate with other governmental agencies early in a project and throughout the NEPA process. CEQ regulations state that a lead agency can invite other Federal agencies, Tribes, or State or local agencies which have jurisdiction by law or special expertise to participate as a cooperating agency in the NEPA process. The benefits of cooperating agency participation include disclosure of relevant information early in the process; receipt of technical expertise and staff support; avoidance of duplicative reviews by Tribal, State, and local entities; and establishment of a mechanism for addressing inter- and intra-governmental issues and enhancing inter- and intra-agency and governmental trust. While cooperating agencies are more commonly utilized during the preparation of an EIS, they can be invited to be involved in an EA as well. For the Bourne and Sagamore Bridges MRER Phase I project, five agencies were invited to participate as cooperating agencies: MassDOT, FHWA, U.S. Coast Guard, EPA, and National Marine Fisheries Service, and all agencies accepted. Representatives from the following Federal, state, and local agencies, and federally-recognized tribes with interest or jurisdiction in the proposed project were invited to a scoping meeting and coordinated site visit on March 19, 2019. Fifteen members attended (sign in sheets are included in Appendix E).
Cape Cod Canal Highway Bridges, MA Final Report Major Rehabilitation Evaluation Report 109 March 2020
Federal U.S. Fish and Wildlife Service U.S. Environmental Protection Agency U.S. National Marine Fisheries Service (NOAA Fisheries) U.S. Coast Guard Federal Highway Administration
State Massachusetts Department of Transportation Massachusetts Office of Coastal Zone Management Massachusetts Department of Environmental Protection Massachusetts Department of Fish and Game
o Massachusetts Division of Marine Fisheries o Massachusetts Division of Fisheries and Wildlife
- Massachusetts Natural Heritage and Endangered Species Program Massachusetts Historic Preservation Office
Tribal Wampanoag Tribe of Gay Head (Aquinnah) Wampanoag Tribe of Mashpee
Regional Cape Cod Commission
Local Bourne Conservation Commission Sandwich Conservation Commission Sandwich Historic Commission Early coordination was also conducted with several resource agencies including: U.S. Fish and Wildlife Service, National Marine Fisheries Services, MA Office of Coastal Zone Management, and MA Historic Preservation Office to discuss project plan formulation and consider potential impacts to specific resources and agency comments and concerns. Further consultations will continue during Phase II of the project with these and additional agencies and interests. A complete list on compliance with environmental Federal Statues and Executive Orders is included in the EA. 10.0 CULTURAL RESOURCE CONSIDERATIONS AND ANALYSIS In the study area, there are three historic period resources, the Bourne and Sagamore bridges, and the canal. There are no identified archaeological resources in the vicinity of the Sagamore Bridge study area. There are two archaeological sites within the vicinity of the Bourne Bridge, pre-contact site 19 BN-224, and post-contact archaeological site, BOU.1. The study area could have archaeological sensitivity. Many pre-contact and post-contact sites have been identified in the study area, and more are likely still unidentified. 10.1 General Cultural Resource Concerns
The National Historic Preservation Act (NHPA) (1966) defines a historic property as any prehistoric or historic districts, sites, buildings, structures, or objects that are eligible for, or

Cape Cod Canal Highway Bridges, MA Final Report Major Rehabilitation Evaluation Report 110 March 2020
listed on the National Register of Historic Places. Section 106 of the NHPA requires that a federal agency take into account the effects of an undertaking on historic properties. The earliest pre-contact sites from the PaleoIndian Period (12,000 – 10,000 B.P.) have not been positively identified on Cape Cod. Evidence of in situ Early Archaic Period (10,000 – 7,500 B.P.) sites are also relatively rare as the environmental landscapes continued to change and the sea levels continued to rise. Sites from the Middle Archaic Period (7,500 – 5,000 B.P.) to the Contact Period (1500 – 1650 A.D.) are much more apparent in the pre-contact record. Cape Cod was one of the first areas to be explored and settled by Europeans and as a result contemporary accounts record Native American settlements as well as interactions with European traders, explorers and settlers. The importance of trade prompted the building of the Aptuxcet Trading Post in Bourne in 1627.
10.2 Cultural Resource Impacts Under the Base Condition (Plan A) there will be no effect on historic properties. The bridges would continue to be maintained and repaired and there would be no effect on local historic districts, individual buildings, or known and unknown archaeological sites, since there would be no change in bridge appearance or location.
With Major Rehabilitation (Plan B) the rehabilitation of the Bourne and Sagamore bridges should have no adverse effect to the bridges and no effect on local historic districts, individual buildings or known and unknown archaeological sites. There would be no changes in bridge appearance or location. Under Bridge Replacement (Plan D) there would be an adverse effect on the existing bridges (they would be removed) and on at least two identified archaeological sites, possible unidentified archaeological resources, and several historic districts. The effects would be indirect (visual and/or viewshed) as well as direct (possible archaeological sites). 10.3 Cultural Resource Coordination Cultural resources coordination was initiated on the Canal highway bridges with the State Historic Preservation Officer (SHPO), Tribal Historic Preservation Officers (THPOs) of the Mashpee Wampanoag and the Wampanoag Tribe of Gay Head (Aquinnah), and the Historic Commissions of the Towns of Bourne and Sandwich. Each of these were invited to the December 2018 public information meetings. Coordination letters were sent to the State and Tribes on July 17, 2019. Additional consultation with the SHPO, THPOs of the Mashpee Wampanoag and the Wampanoag Tribe of Gay Head (Aquinnah), and local historical commissions on the location of the bridges and the bridge design would be required during Phase II of the project.

Cape Cod Canal Highway Bridges, MA Final Report Major Rehabilitation Evaluation Report 111 March 2020
10.4 Cultural Resource Recommendations Additional surveys of known and potential archaeological sites, as well as the impact area in general, would be required during Phase II. This work should be scoped with input from State, Tribal and local historic preservation officials and commissions. The fate of the existing bridges is expected to be a matter of some concern. The bridges have served their purpose for 85 years and have become somewhat of an icon for residents of Southeastern Massachusetts and visitors to the Cape and Islands. Demolition of the bridges, and potentially design of new bridges of a different type, may generate some level of opposition, despite their reliability problems. 11.0 OTHER SOCIAL EFFECTS CONSIDERATIONS AND ANALYSIS This chapter identifies potential other social effects from the four plans under detailed analysis
11.1 Background and Purpose
The Bourne and Sagamore Bridges were opened in 1935. Given their age and exposure to the elements, they frequently require major repairs. Issues surrounding the bridges are important to residents of the area. Results from the 2014 Comprehensive Economic Development Strategy (CEDS) Stakeholder Survey of 397 Cape Cod residents demonstrate that more than 83% of respondents find existing bridge and road capacity, and frequent interruptions from bridge maintenance to be a problem (see Figure 21).
Figure 21 - CEDS Stakeholder Survey (Cape Cod Commission 2014)
How much of a problem do you feel the following challenges are to the long-term economic success of the region?

Cape Cod Canal Highway Bridges, MA Final Report Major Rehabilitation Evaluation Report 112 March 2020
The USACE “Other Social Effects Handbook” outlines the following social factors that should be considered in OSE analysis: health and safety, economic vitality, social connectedness, identity, social vulnerability and resiliency, participation, and leisure and recreation. Including OSE information in the planning process is essential to gain a deeper understanding of the issues and population affected by a proposed project, and to improve communication among all affected parties21.
11.2 Community Characteristics
11.2.1 Population Size and Composition
The current year-round populations of the Cape and Islands (Barnstable, Dukes and Nantucket Counties), and the town of Bourne are displayed in Table 37. The population of the Cape and Islands grew over 130% between 1970 and 2000. Since 2000, population growth tapered in Dukes and Nantucket Counties, and slightly decreased in Barnstable County. According to the Cape Cod Commission these population dynamics are largely attributed to a large influx of baby boomers retiring to the region, the subsequent increase in death rates due to an ageing population, and younger populations leaving the region to pursue employment and educational opportunities. Various studies in recent years have predicted both declines and increases in Barnstable County’s population over the next one to two decades.
Table 37 - Total Population – Cape Cod and Islands
Total Population
2000 Census
Total Population
2010 Census
Total Population 2015 ACS
Bourne 18,721 19,754 19,729 Barnstable County 222,230 215,888 214,766 Dukes County 14,987 16,535 17,048 Nantucket County 9,520 10,172 10,556 Massachusetts 6,349,097 6,547,629 6,705,586 Source: 2010 United States Census, 2015 American Community Survey
Seasonal Population: The populations of Cape Cod and the Islands experience dramatic seasonal shifts. Many individuals have second homes on the Cape or Islands, and many are used as vacation rental properties during the summer season. The Cape Cod Commission estimated monthly populations in Barnstable County based on second home ownership, and show that the summer population can be ten times the winter population (Figure 22). Similar estimates by the Martha’s Vineyard Commission report the Dukes County summer population to be five times the year-round population. Because these estimates of monthly population only consider visitors who own or rent a property, and does not take into account individuals doing day trips, they likely underestimate the actual population on a summer day. The

Cape Cod Canal Highway Bridges, MA Final Report Major Rehabilitation Evaluation Report 113 March 2020
proportion of houses that are used for seasonal, recreational, or occasional use is at least eight times the state average across the three counties (Table 38).
Future Population: Approximately eight percent of survey respondents indicated they plan to convert their second home into their primary home in the next five years; an additional 14% plan to convert their home in the next 15 years. Moody’s analytics projects that economic growth in the area will stimulate in-migration resulting in an increase of 9,612 people to Barnstable County between 2015 and 2025; Crane Associates similarly projects a more conservative increase in population of 6,199 people. Increases in the year-round population will consequently increase demands on local services and infrastructure, including the bridges.
Figure 22 – Barnstable County Summer Population
Source: Daley 2015. Second home population estimates are based on UMass Donahue Institute's Second Home Owner Survey 2008 and the 2010 U.S. Census
Table 38 - Proportion of Seasonal-Use Houses
Percentage of houses for seasonal, recreational, or occasional use
Bourne 20.6% Barnstable County 35.5% Dukes County 53.8% Nantucket County 57.9% Massachusetts 4.1% Source: 2010 U.S. Census

Cape Cod Canal Highway Bridges, MA Final Report Major Rehabilitation Evaluation Report 114 March 2020
11.2.2 Population Structure and Diversity Age Distribution: The population increase between 1970 and 2000 was driven by people retiring to the Cape and Islands8. As a result, the median age in Barnstable and Dukes Counties is 30 and 17% higher than the state-wide median age (Table 39). Likewise, the percent of the population 65 and older is substantially higher, and the proportion of individuals 15 and under substantially lower, in Barnstable and Dukes Counties compared with Massachusetts as a whole.
Table 39 – Age and Ethnicity – Cape Cod and Islands
Racial Composition: With a population that is more than 90 percent Caucasian, the racial makeup of Barnstable and Dukes Counties is homogenous compared with the rest of the state (74.3% Caucasian) (Table 38). Nantucket County’s non-white population is similar to that found across the state of Massachusetts.
11.2.3 Employment and Industry The Cape and Islands’ economies rely heavily on summer tourism, and are thus seasonal. The number of employed individuals increases by nearly 20% during the summer months in Barnstable County, 50% in Dukes County and 70% in Nantucket County. In addition, because there are relatively fewer employment opportunities on the Cape and Islands compared with areas closer to the Boston metropolitan area, MassDOT estimates that at least 13,000 Cape Cod residents commute over the Bourne and Sagamore Bridges daily to work on the mainland36.
Barnstable County’s labor participation rate is 7% lower than Massachusetts overall, and the percent of households with retirement income in Barnstable county is more than 50% higher than Massachusetts overall. Barnstable County’s lower labor force participation and greater proportion of households with retirement income is not surprising given many individuals relocate to Cape Cod in their retirement. Labor force participation in Nantucket County is greater than state-wide estimates. Dukes County’s labor force participation is similar to that of the whole state (Table 40).
Median agePercent 65 and older
Percent 15 and under
Percent foreign born population
Percent white, non-
hispanicBourne 46.25 21.2% 14.8% 3.8% 91.3%Barnstable County 51.3 27.1% 14.1% 6.8% 91.1%Dukes County 45.9 19.0% 16.6% 9.7% 92.1%Nantucket County 39.5 13.4% 19.4% 16.3% 76.6%Massachusetts 39.3 14.7% 18.3% 15.5% 74.3%

Cape Cod Canal Highway Bridges, MA Final Report Major Rehabilitation Evaluation Report 115 March 2020
Table 40 – Employment Proportions by Industry – Cape and Islands
Industry Town of Bourne
Barnstable County
Dukes County
Nantucket County Massachusetts
Agriculture, Forestry, Fishing, Hunting, and Mining 0.3% 0.9% 2.4% 2.3% 0.4%
Construction 9.5% 9.4% 15.2% 17.4% 5.4% Manufacturing 4.7% 3.7% 4.1% 3.4% 9.2% Wholesale Trade 2.6% 2.0% 1.6% 1.7% 2.4% Retail Trade 13.1% 14.0% 9.8% 14.0% 10.8% Transportation, Warehousing, & Utilities 5.1% 4.1% 2.2% 4.6% 3.6% Information 2.5% 1.9% 2.0% 2.3% 2.3% Finance and Insurance, Real Estate, Rental and Leasing 7.0% 6.5% 9.1% 7.2% 7.6%
Educational, Health Care, and Social Services 25.2% 24.1% 18.6% 16.3% 27.9%
Arts, Entertainment, Recreation, Accommodation, and Food Services 9.9% 11.7% 12.8% 10.7% 8.8%
Other Services Except Public Administration 3.4% 4.9% 5.2% 5.0% 4.4%
Public Administration 6.3% 4.8% 4.8% 4.3% 4.0% Professional, Scientific and Management Services 10.4% 11.9% 12.2% 10.6% 13.2%
11.3 Alternatives: Consequences to Community Characteristics Plan A – Base Condition (Fix-as-Fails): While there may be no immediate impact on community characteristics, the bridges will continue to deteriorate requiring frequent closures resulting in long delays and disruption to normal activities. This may result in slower population growth, less educational and employment opportunities.
Plan B – Major Rehabilitation: Because the bridges do not comply with current highway standards, each maintenance/repair event requires lane and entire bridge closures causing restriction of each bridge’s carrying capacity during each maintenance/repair event.
As described in Section 5.3.1 construction activities will require 376 days of lane closures, and 132 days of full bridge closure on Sagamore Bridge from 2025 to 2027. Similar construction activities will require 481 days of lane closures and 180 days of full bridge closures on the Bourne Bridge between 2029 and 2031. These land and bridge closures will only occur during restricted periods of the year, when there is no seasonal and holiday traffic.
A substantial number of Cape Cod residents commute over the Bourne and Sagamore Bridges daily to work on the mainland, the lane restrictions due to construction and resulting traffic congestion may impact wages and job potential for those commuting residents. Tourism also may suffer due to the congestion. When the rehabilitation is not taking place, conditions will return to normal.
Plans D – Bridge Replacement: During construction of new bridges, it is not expected to have a significant adverse impact on community characteristics. However, at the completion of the new bridges, improved traffic and road conditions will likely attract more visitors, expand educational and employment opportunities, and potentially bring new residents to the Cape and the Islands. Overall, this will positively benefit the community characteristics.

Cape Cod Canal Highway Bridges, MA Final Report Major Rehabilitation Evaluation Report 116 March 2020
11.4 Baseline OSE Factors and Conditions for Cape Cod and the Islands 11.4.1 Health and Public Safety This section describes project conditions that change the actual or perceived risk of health and safety. For instance transportation restrictions on the bridges would increase daily commuting time, decreased the ease of travelling between the Cape and mainland, and decrease the ability of residents to evacuate in a hurricane, all with potential impacts to health and safety.
Disaster Response: Bridge rehabilitation will influence disaster response on Cape Cod (the Islands to a lesser extent). Cape Cod is subject to a number of natural hazards. In the 2013 Massachusetts State Hazard Mitigation Plan, Barnstable County received high hazard rankings for flood and coastal hazards, and medium hazard ratings for high wind, hurricane/tropical storms, thunderstorms, and nor’easters. Disaster response to hurricanes (and other hazards) requires rapid and efficient egress from areas of the Cape. Emergency evacuation of Cape Cod is an important issue due to the high probability of hazardous events, and the high traffic volume and low capacity road conditions that are exacerbated by the bottleneck created by the bridges. As of the 2010 census 40% of Barnstable County’s total population was living within the County’s Hurricane Evacuation Zone. The Cape Cod Emergency Traffic Plan outlines the travel restrictions that may be imposed during evacuation of the Cape. Such restrictions may include exit closures, detours, and one-way travel on roads and bridges. The bridges may be closed if weather and traffic conditions make it unsafe to cross them, in which case motorists would be directed to Joint Base Cape Cod for shelter.
Emergency Response: The town of Bourne is divided by the Cape Cod Canal with the two sides of town accessed via the bridges. The Bourne police department has one station which is located north of the bridges. The town’s fire stations are located on either side of the bridges. The Town of Sandwich has a small portion of its area located on the mainland side of the Sagamore Bridge along the shore of Cape Cod Bay, with most of the town located on the Cape Cod side. The Bourne Police and Fire Departments were consulted on the difficulties presented by the existing bridges and the potential impacts of bridge maintenance and rehabilitation. The two Departments offered the following information:
• Even without construction, increased congestion on the bridges during the summer results in delayed emergency response.
• Inspection and training schedules need to be adapted to accommodate the traffic delays. • The Departments are often forced to hire additional staff on overtime to account for delays. • During summer months, high traffic congestion greatly influences to which hospitals
emergency responders are able to transport patients. • Any lane closure on either bridge, for any amount of time, drastically impacts Emergency
response time. Long term closures would have a very negative impact on our ability to operate and respond to calls safely and efficiently.

Cape Cod Canal Highway Bridges, MA Final Report Major Rehabilitation Evaluation Report 117 March 2020
• Further restricting bridge access through lane or bridge closures will have extreme, adverse effects on emergency services any time of the year.
From the traffic model data used in this study, the increase in summer traffic volume leads to a >75% increase in travel time from the Bourne police station to the south side of the bridges.
Military Installations: Joint Base Cape Cod (JBCC), located in Bourne, Sandwich, Falmouth and Mashpee, is a military installation housing five military commands including the National Guard and Air Force. The two existing highway bridges are the main access points for all JBCC goods and services, however some supplies are transported to the Cape via the rail system. In addition many JBCC personnel live off-Cape and commute to JBCC via the bridges.
Health Services: Barnstable County’s population is ageing, with a greater need for health services, however the availability of health services is less than that of Massachusetts overall. The number of primary care physicians per 10,000 people is nearly 30% lower in Barnstable County compared with Massachusetts. Retirees will often travel off-Cape to see their mainland doctors. There are no VA hospitals in the area, so veterans must travel to Providence or Boston to use VA services.
There are currently no Level I or II trauma centers on Cape Cod, so most trauma patients are transported to Boston hospitals for care. According to Cape Cod Healthcare, about 1500-1600 trauma cases each year are transported off of Cape Cod for treatment, about twice the number treated at local Cape Cod hospitals. Much of this transport occurs via ground transportation over the bridges.
Traffic Incidents: Because the bridges create bottlenecks, traffic incidents are common at the bridges’ entrances. The south entrance of the Bourne Bridge and the north entrance of the Sagamore Bridge are among the Cape Cod Commission’s Cape-Wide top 10 crash locations list. According to MassDOT, between 2010 and 2014, there were 1380 total crashes within one mile of the two bridges; 333 resulted in non-fatal injuries and seven resulted in fatalities. Unsurprisingly, with a greater number of vehicles on the road, there are more crashes during the summer months (Figure 23). The sidewalks on the bridges do not meet federal standards because of their narrow width and proximity to moving traffic. Pedestrians must also share the narrow sidewalks with bicycles. Guardrails and other features are not up to current standards. However the narrow lane widths are the greatest safety concern on the bridges.

Cape Cod Canal Highway Bridges, MA Final Report Major Rehabilitation Evaluation Report 118 March 2020
Figure 23 – Number of Monthly Crashes within One Mile of the Bridges (2010-2014)
http://services.massdot.state.ma.us/crashportal/DataRequest.aspx).
Plan A: There will be little immediate impact to health and public safety from continuing repairs as needed to the two existing bridges. However, as the bridges continue to deteriorate, more frequent and costly repairs will be required to keep them safe and reliable, with adverse impacts to traffic and access by emergency responders. The fix-as-fails alternative is meant to address health and public safety issues by capturing the items necessary to prevent a potential bridge failure. Even with continuing inspection and repair there is uncertainty regarding bridge failure. There is no absolute guarantee that failure will not occur, with the inherent risk to life and public safety. However, with a proper comprehensive program of inspection, repair and maintenance as needed the risk of failure of either bridge is low.
Plan B: The Bourne and Sagamore bridges will undergo lane closures and complete bridge closures during the rehabilitation process, influencing emergency officials’ ability to evacuate residents from the Cape during hazardous events. Cited increases in travel time pertain only to the bridge segments, and do not include increased travel time on road segments leading up to the bridges. Travel delays associated with lane and bridge closures would make evacuation of Cape visitors and residents prior to a major storm landfall difficult.
Also, since the bridges are primary access points for JBCC, bridge rehabilitation may have substantial impact on the ability of the units to carry out their training mission. When the rehabilitation is not taking place, conditions will return to normal.
Plans D: Construction of new bridges is not expected to have a significant impact on Health and Public Safety. New bridges would improve road conditions resulting in positive impacts to health and public safety. The improvements which include wider lanes and pedestrian access will allow safer travel. New bridges would not require repair for some time, so the need for lane closures and construction related delays would not occur.
0
10
20
30
40
50
60
Jan Feb Mar Apr May Jun Jul Aug Sep Oct Nov Dec
Number of Crashes
2010 2011 2012 2013 2014

Cape Cod Canal Highway Bridges, MA Final Report Major Rehabilitation Evaluation Report 119 March 2020
11.5 Economic Vitality The economic vitality of Cape Cod concerns factors such as employment, educational opportunity, income inequality, and access to markets, all of which influence quality of life. The U.S. Travel Association produced a report estimating the economic impact of travel in Massachusetts in 2015, based on travel more than 50 miles away from home on day or overnight trips (not commuting). Barnstable County is among the top five counties generating the most travel-dollars in Massachusetts. The estimated contribution of domestic and international travel to local, state and federal economies is shown by county in Table 41.
Table 41 – Travel Impact – 2015 (U.S. Travel Association 2016)
State estimates are provided in the U.S. Travel Association’s report (2016). The ratio of domestic county-level and state-level travel impacts were used to estimate international travel impact at the County-level.
Cost in $ Millions
Travel Expenditures
Travel- Generated
Payroll
Employment (Thousands)
Federal Tax*
State Tax
Local Tax
Domestic Travel Impacts – 2015 Barnstable County 1,006 260 9 92 44 61
Dukes County 141 35 1.3 12 5.5 8.2 Nantucket County 168 36 1.1 11 5.3 6
Massachusetts 17,485 3,805 116 1464 700 439 International Travel Impacts – 2015
Barnstable County 158 42 1.5 16.7 7.0 8.1
Dukes County 22 5.6 0.2 2.1 0.9 1.1 Nantucket County 26 5.8 0.2 2.0 0.8 0.8
Massachusetts 2,749 609 19 265 112 58 *County-level Federal Tax is estimated as a proportion of state tax
Tourist dollars are important for the local economy on the Cape and Islands. There were over one billion dollars in direct expenditures from visitors to the area in 2015. Tourism on the Cape and Islands generated over 100 million federal tax dollars, and over 100 million state and local tax dollars. In addition, more than 10,000 jobs were supported by the tourism industry, generating over 300 million dollars in wages.
Small businesses are prevalent on the Cape and Islands. Cape business owners face an issue with employee recruitment and retention. Because housing is more expensive on Cape Cod, individuals choose to live off-Cape in adjacent communities, and commute to the Cape for work. However, increasing traffic congestion and commute times, coupled with relatively low wage rates on the Cape, is resulting in employees seeking opportunities off of the Cape.

Cape Cod Canal Highway Bridges, MA Final Report Major Rehabilitation Evaluation Report 120 March 2020
Barnstable County’s Gross Regional Product in 2015 was $9.8 billion, with retail and construction among the top industries. Nearly 100% of construction materials and goods sold are transported to the Cape and Islands from the mainland. In addition, goods produced on the Cape and Islands, such as seafood, are generally shipped to or beyond the mainland. Increasing traffic congestion due to increased population and visitors makes it more difficult to deliver goods to and from the Cape and Islands. Nearly all goods, including groceries, medical supplies, and construction materials are transported to the Cape and Islands via trucks. MassDOT estimates 6,600 trucks traverse the bridges each day. Trucks traveling to and from the Islands via the Woods Hole, Martha’s Vineyard and Nantucket Steamship Authority (a state-chartered authority) traverse the Canal bridges to transport goods via ferry access from Hyannis or Woods Hole. The Steamship Authority reports that in 2015 more than 62,000 trucks traveled round-trip between Woods Hole and Martha’s Vineyard, and over 23,000 trucks traveled round-trip between Hyannis and Nantucket. The Cape Cod Commission reports that the canal bridges are the primary bottleneck for truck freight in the region and that many freight companies will not locate on Cape Cod because of traffic delays at the bridges.
Passenger bus services regularly cross the bridges to bring residents and visitors to/from the Cape and Islands. Weekday summer ridership of the Plymouth & Brockton Bus Line, for instance, exceeds 1,200 daily riders over the bridges. During May and October, nearly 1000 riders cross the bridges by bus. Weekday ridership, particularly during the off-peak season, is presumably residents traveling to/from work off on the mainland.
Plan A: While there may be no immediate impact on economic vitality, the bridges will continue to deteriorate requiring frequent closures resulting in long delays and disruption to normal activities. This may result in less tourism to the area, impacting small business and the economics.
Plan B: The lane and bridge restrictions due to rehabilition construction and resulting traffic congestion will impact tourism and the important economic benefits. The annual $1 billion in tourist dollars is critical to the local economy on the Cape and Islands. The large volume of truck traffic (>6,600 trucks anually) supplying the Cape with goods (including groceries, medical supplies and construction materials) would be severely impacted by lane and bridge closures. When the rehabilitation is not taking place, conditions will return to normal.
Plan D: Construction of new bridges is not expected to have a significant impact on economic vitality except for increased construction work near the bridges. The completion of the new bridges will improve traffic and road conditions will likely attract more visitors and allow more commerce to traverse the bridges. This will potentially expand the economy, bringing more prosperity to the region.

Cape Cod Canal Highway Bridges, MA Final Report Major Rehabilitation Evaluation Report 121 March 2020
11.6 Social Connectedness The current state of the bridges has a negative impact on social connectedness of Cape and Islands communities. Communication and relations within and among groups provide a sense of social connectedness and trust. For residents who live near the bridges, the bottleneck effect creates so much traffic in the summer that local residents feel trapped in their houses. The narrow bridge sidewalks do not meet Federal Standards, and are difficult for pedestrians to use because of bicycle use and their proximity to moving vehicular traffic.
The main access points to Martha’s Vineyard and Nantucket are on Cape Cod, therefore residents and visitors to the Islands must cross the bridges to travel to and from the Islands. In 2015, approximately 240,000 automobiles and nearly 1,200,000 passengers traveled round-trip between Woods Hole and Martha’s Vineyard. Approximately 42,000 automobiles and over 320,000 passengers traveled round-trip between Hyannis and Nantucket (Table 42). MassDOT’s traffic data suggest that travel to and from the Islands generates 2,700 vehicle trips daily over the bridges during the summer.
Table 42 – Steamship Authority Ridership 2015 (Steamship Authority 2016)
Between Woods Hole and Martha's
Vineyard
Between Hyannis and Nantucket
Total
Passengers 2,378,303 644,787 3,023,090 Vehicles under 20 Feet in length 475,286 84,215 559,501 Vehicles over 20 Feet in length 49,069 29,588 78,657
Plan A: The current state of the bridges has a negative impact on social connectedness of Cape and Islands communities. Traffic delays and lane closures back up traffic on the approach highways and local roadways. Residents living near the bridges feel “trapped” in their houses in the summer. Bridge sidewalks are difficult to use. Continued maintenance and repair of the existing bridges will not ease any of these situations.
Plan B: Rehabilitation of the bridges will require frequent lane and bridge closures resulting in substantial and prolonged disruption to social connectedness. The current bottleneck at the bridges isolates the surrounding neighborhoods and would worsen with the traffic delays caused by rehabilitation actions. Pedestrian and bicycle traffic will continue to be constrained. When the rehabilitation is not taking place, conditions will return to the current level of delay and congestion.
Plans D: Construction of new bridges is not expected to have a significant impact on social connectedness. The completion of the new bridges will improve traffic and road conditions resulting in more social connectedness among the residents. The improvements which include wider lanes and better pedestrian access will allow safer and less stressed travel. The new bridges would not require near term repairs, so the need for lane closures and construction related delays would be far less than with the other alternatives.
Cape Cod Canal Highway Bridges, MA Final Report Major Rehabilitation Evaluation Report 122 March 2020
11.7 Identity It is important to consider how project activities may influence individuals’ and groups’ language, tradition and values, thereby influencing their sense of identity. While the Cape and Islands are a tourist destination, the area is dominated by the second home market, rather than hotels and motels. Many of these second homes have been passed down through several generations, and either rented to tourists and/or used as a family vacation home during the summer season. The historic villages, with their small, quaint shops, also contribute to the unique character of the Cape and Islands.
While current levels of traffic are a concern for Cape residents, many fear that improving transportation infrastructure would encourage more commercial development, threatening the Cape’s environmental quality and historic charm. Traffic throughout the Cape is difficult in the summer as visitors tax the road system’s capacity.
Plan A: While there may be no immediate impact on the unique character of the Cape and Islands, the bridges will continue to deteriorate requiring frequent closures resulting in long delays and disruption to tourism and normal activities.
Plan B: Rehabilitation of the bridges will require frequent lane and bridge closures resulting in substantial and prolonged disruption to traffic heading to the Cape and Islands. Major rehabilitation of both bridges would extend the life of the structures and reduce maintenance and repair for a period of time until deterioration of the bridges began to once again require frequent repairs with its consequences to travelers and the local population. Disruptions to the communities and their impacts on the identity within the community would then resume.
Plans D: Construction of new bridges is not expected to have a significant impact on identity. The completion of the new bridges will improve traffic and road conditions allowing residents and tourists to travel more easily to the quaint villages of Cape Cod and the Islands. The improvements which include wider lanes and pedestrian access will allow safer and less stressed travel. The new bridges would not require repair for some time, so the need for lane closures and construction related delays would not occur. It should be noted the existing internal Cape road system may not be able to handle additional traffic capacity.
The reduced closures, wider lanes, and provision of auxiliary lanes would make traffic safer and move traffic faster over the new bridges. With the new bridges the two through traffic lanes would equal the two through lanes provided by state highway approaches on either side of each bridge. Expansion of state highway capacity would be needed to appreciably increase traffic volume over the bridges. While the state plans improvements to modify the approaches to match the new bridges, and ease traffic entering and existing the highways in the vicinity of the bridges, no increases in highway capacity are planned.

Cape Cod Canal Highway Bridges, MA Final Report Major Rehabilitation Evaluation Report 123 March 2020
11.8 Social Vulnerability and Resiliency Some groups are more socially vulnerable and less resilient than others. For instance, elderly individuals may be disproportionately affected by transportation interruptions because they may need to seek more specialized services off of the Cape and Islands, and may face more mobility issues than younger populations.
The factors contributing most to variation in socially vulnerability across the state are race/ethnicity, wealth, and age. Barnstable County substantially differs from the state due to the age of its population, and also has lower-than-average income levels.
Plan A: While there may be no immediate impact on the social vulnerability and resiliency of the population, the bridges will continue to deteriorate requiring frequent closures resulting in long delays and disruption travel across the bridges.
Plan B: Rehabilitation of the bridges will require frequent lane and bridge closures resulting in substantial and prolonged disruption to traffic heading to the Cape and Islands. Some groups are more vulnerable and less resilient than others, including elderly residents that may be negatively impacted by the challenges of rehabilitation and subsequent delays on the bridges. When the rehabilitation is not taking place, conditions will return to the existing condition.
Plans D: Construction of the new bridges is not expected to have a significant impact on social vulnerability and resiliency. The completion of the new bridges will improve traffic and road conditions allowing residents and tourists to travel more easily across the bridges. This will result in more resilient populations and improvement of lifestyle and lessen the vulnerability that stems from traffic disruptions.
11.9 Participation Participation is an individuals’ engagement with their community and the decision-making that affects their community. There are several community groups on the Cape and Islands that play an important role in Cape and Islands’ policies and programs. Each of the counties has its own Chamber of Commerce, and countless organizations dedicated to special interests such as health care and conservation. The Cape Cod Commission is the leading community group in Barnstable County. It is part of the Barnstable County regional government and responsible for regulation, land use planning, and economic development across the county.
Because the bridges are in poor condition, they require frequent maintenance. The USACE has historically provided the public with ample notice of closures so that travelers can accommodate travel delays associated with lane closures. Engaging them in associated public processes is essential for continued public trust. When possible, maintenance is conducted outside of peak season, daytime lane reductions are avoided and construction is limited to one bridge at a time.

Cape Cod Canal Highway Bridges, MA Final Report Major Rehabilitation Evaluation Report 124 March 2020
Plan A: While there may be no immediate impact on the participation of the population, the bridges will continue to deteriorate requiring frequent closures resulting in long delays and disruption travel across the bridges. The requirement for frequent notices of closures will continue.
Plan B: Rehabilitation would result in excessive delays to traffic from bridge and lane closures. Communities of the Cape and Islands and the mainland areas would be notified of upcoming maintenance in a timely manner. When the rehabilitation is not taking place, conditions will return to normal.
A potential concern is that communities that are more distant from the bridges are still affected by bridge maintenance, but are often not adequately represented. Public meetings surrounding bridge work could be better advertised to residents from Down Cape (towards Provincetown), or residents of Martha’s Vineyard and Nantucket. These residents would be subject to effects of bridge rehabilitation and should have the opportunity to participate in the public process.
Plans D: Construction of the new bridges is not expected to have a significant impact on participation of the population. The completion of the new bridges will not impact the existing condition, and at completion will provide safer and better access. There will be less requirements for public notice of construction lane and bridge closures. This will result in more positive participation not just with the surrounding towns, but with the communities that are more distant from the bridges.
11.10 Leisure and Recreation Leisure time and recreational opportunities influence individuals’ well-being. Project activities and outcomes that influence the availability or accessibility of leisure time and recreational opportunities thus need to be considered.
Being a major tourist destination, recreational activities abound on the Cape and Islands. The area hosts some of the country’s finest beaches, walking and biking trails including Cape Cod National Seashore, which had more than 4.72 million visitors in 2016. Shopping, water sports, fishing, boating and golf are major leisure activities, as are dining out and live entertainment. Retail; arts, entertainment and recreation; and accommodation and food services are among the most important industries in Barnstable, Dukes and Nantucket Counties.
Plan A: While there may be no immediate impact on the leisure and recreation activities of the population, the bridges will continue to deteriorate requiring frequent closures resulting in long delays and disruption travel across the bridges.
Plan B: Because the bridges are in poor condition, they require frequent maintenance. A program of major rehabilitation would require frequent lane closures and occasional protracted bridge closures. The resulting construction delays will negatively impact leisure and recreation. When rehabilitation is completed the bridges would return to a regular cycle

Cape Cod Canal Highway Bridges, MA Final Report Major Rehabilitation Evaluation Report 125 March 2020
of maintenance and repair. The frequency and duration of repair related impacts would lessen for a period post-rehabilitation and become more frequent as the bridges begin to deteriorate once again.
Plans D: Construction of the new bridges is not expected to have a significant impact on leisure and recreation. The completion of the new bridges will provide safer and better access resulting in more enjoyable leisure and recreational activities on and off the bridges, the surrounding communities and further into the Cape and the Islands. 12.0 REAL ESTATE CONSIDERATIONS AND ANALYSIS 12.1 Existing Federal Lands and Interests The Cape Cod Canal FNP includes the waterway, lands adjacent to the Canal, its approach channels and dikes, lands used for operations and maintenance facilities, roadways, recreation areas, lands surrounding the East Boat Basin small boat harbor, and the areas occupied by the bridges between and including their abutments. Figure 24 shows the extent of Federal lands for the Cape Cod Canal FNP.
Figure 24
Cape Cod Canal Highway Bridges, MA Final Report Major Rehabilitation Evaluation Report 126 March 2020
12.2 Land Use and Potential Impacts Lands abutting the Federal lands around the Canal include a wide mix of zoning and uses. Residential, commercial and public lands surround the Canal. Municipal and State highways cross Canal Federal lands and connect to the bridges. A railroad crosses the west end of the Canal land cut at Bourne, with the line extending along the Cape side of the Canal to Sandwich and then east to Hyannis and Yarmouth. Most of the non-Federal property in the vicinity of the highway bridges is commercial or institutional use. The commercial properties are mainly retail.
12.3 Lands, Easements and Rights of Way Required For the Base Condition (Fix-as-Fails – Plan A) and the major rehabilitation alternative for each bridge (Plan B) all Federal work would occur on existing Federal lands. Past major rehabilitation efforts for the highway and railroad bridges have used existing Canal property for construction staging, temporary construction facilities, equipment, and other requirements. No additional LERR would be needed for these two plans. The bridge replacement alternative (Plan D) would require acquisition of new lands to be occupied by the new bridges. Any new bridges would most likely be built close to the existing bridges to minimize the work needed to align them with connecting roadways and reduce the extent of property needed. For the purposes of this report a conceptual plan involving new bridges located adjacent to and immediately inshore of the existing bridges was developed. With both of these bridge alignments the lands needed on the mainland side are currently unimproved and mainly in public hands. The area of impact used for this Phase I evaluation for the two bridges, and the extent of FNP lands in their vicinity, is shown in Figures 25 and 26. On the Cape side of each bridge acquisition in fee of commercial properties would be needed with regardless of which conceptual alignments were ultimately adopted. For the inshore alignments portions of the Market Basket retail plaza at the Sagamore Bridge, and portions of the Dunkin Donuts property at the Bourne Bridge would need to be acquired, and portions of those uses relocated. If the new bridges were located on the opposite sides of the existing bridges, other commercial and some residential properties would need to be acquired.

Cape Cod Canal Highway Bridges, MA Final Report Major Rehabilitation Evaluation Report 127 March 2020
There is a very low risk that the new bridges would be located other than immediately adjacent to the existing bridges. The cost of state connecting road modifications and the extent of real estate acquisition increase with alignment distances further away from the existing bridges. The increasing land area required for ever more distantly spaced structures would have other adverse consequences; impacts to wetlands and other natural resources, sociological impacts from displacement of homes and businesses, and needing different construction areas for old bridge demolition.
Figure 25

Cape Cod Canal Highway Bridges, MA Final Report Major Rehabilitation Evaluation Report 128 March 2020
12.4 Utility Relocations A number of utilities cross the Canal over the bridges under license agreements between the utility owner and the USACE. These include electric power lines, telecommunications lines, and natural gas lines. Utility relocations would be required for both the major rehabilitation and replacement alternatives. A list of the utilities requiring relocation is provided in Table 43. Some of these utilities do not cross the Canal itself but cross Federal property along the Canal. During the next phase a detailed survey of all utilities that may be impacted by the recommended alternative will be made. The extent of impacts and estimates for specific relocation of utilities by the owners will be made during the next phase. Under the major rehabilitation alternative for each bridge the deck and floor beam replacements will require removal and temporary relocation of the power and telecommunications lines which would be reset following the rehabilitation of those bridge components. The natural gas lines would be removed and relocated off the rehabilitated bridges and would likely require directional drill crossings beneath the Canal.
Figure 26

Cape Cod Canal Highway Bridges, MA Final Report Major Rehabilitation Evaluation Report 129 March 2020
Table 43 - Utility Licenses Over or Near Bridges Owner Utility Type Description
Bourne Bridge Canal Sportsman Club Water Supply Line in New Footprint Colonial Gas Gas Pipeline on Bridge Comcast Telecommunications Fiber-Optic Cables on Bridge Verizon Telecommunications Cables on Bridge Algonquin Gas Gas Gas Metering Station Town of Bourne Water Supply Line on Bridge NSTAR Electricity Transmission Line on Bridge Mass DOT Drainage Pipeline in Footprint
Sagamore Bridge Open Cape Telecommunications
Sub-license from Verizon
Innerduct for fiber optic cable on Sagamore Bridge.
Verizon Telecommunications Cables on Bridge Mass DOT Drainage Pipeline in Footprint Algonquin Gas Gas 2 Pipelines on Bridge Algonquin Gas Gas Rectifier & Anode Bed Colonial Gas Gas Pipeline on Bridge Colonial Gas Electricity Subsurface Transmission Lines Comcast Telecommunications Fiber-Optic Cables on Bridge North Sagamore Water District Water Pipeline on Bridge
Note: Further outreach with utility owners will be conducted both for lines crossing the bridges and for utility relocation within the bridge footprints
Under the replacement alternatives for each bridge the power and telecommunications lines would most likely be relocated to the new bridges as new lines, with the existing lines removed as part of the demolition of the old bridges. Gas lines would not likely be permitted to cross the new bridges and would need to be replaced with alternative crossings. The gas lines that cross the Canal would likely be replaced with one or more new directional drill lines beneath the Canal. Utility costs were generated from a number of sources based on the information available. The gas line on each bridge that would be relocated via directional drilling under the canal in both the replacement and rehabilitation scenarios was estimated parametrically with the assistance of two directional drilling companies who have performed this work in the greater Boston and Cape Cod Canal areas. Under the replacement scenario the gas metering station adjacent to the Bourne Bridge and the rectifier & anode bed adjacent to the Sagamore Bridge would have to be replaced. The construction of these two facilities was estimated parametrically with the assistance of three construction companies who have performed

Cape Cod Canal Highway Bridges, MA Final Report Major Rehabilitation Evaluation Report 130 March 2020
similar work in the greater Boston and Cape Cod Canal areas. It was also assumed some length of gas, water, and draining pipeline on the mainland and Cape sides of both the Bourne and Sagamore Bridges would require relocation due to the construction of replacement bridges. Under the rehabilitation scenario it was assumed all utilities, besides the relocated gas lines, would be temporarily located outside the limits of work on the bridges. The pipeline relocation costs and the temporary relocation costs were estimated parametrically using an assumed total length of pipeline. The same contingency percentage generated for the replacement and rehabilitation alternatives was applied to the utility relocation costs to mitigate the lack of detailed information on all utilities and their exact existing and proposed locations.
12.5 Lands, Easement, Rights-of-Way and Relocation Costs Acquisition estimates were based on recent sales of similar commercial and institutional properties in the Bourne and surrounding communities. Acquisition includes lands in fee, some with improvements, plus relocation of portions of business use. Relocations include the costs of moving and relocating utilities. LERR cost estimates for the major rehabilitation (Plan B) and bridge replacement (Plan D) alternatives are shown in the table below.
Table 44 – LERR Costs for Plan D Updated March 2020 Bourne Bridge Sagamore Bridge
Real Estate Interests Required for New bridges Lands Acquired 11 Acres 4.5 Acres Cost of Lands $4,950,000 $2,025,000 Improvements $1,000,000 $4,500,000 Business Relocations $1,000,000 $400,000 Subtotal Real Estate $6,950,000 $6,925,000 Contingency – 10% $695,000 $693,000
Total Real Estate $7,645,000 $7,618,000 Utility Relocation Costs for Rehabilitation and Replacement – FY2020
Utility Relocation Costs for Major Rehabilitation $12,749,000 $12,749,000
Utility Relocation Costs for Bridge Replacement $26,640,000 $29,250,000

Cape Cod Canal Highway Bridges, MA Final Report Major Rehabilitation Evaluation Report 131 March 2020
13.0 ASSESSMENT OF ALTERNATIVES The objective of the major rehabilitation evaluation study is to demonstrate that, among the alternatives analyzed, the USACE recommended plan most efficiently and effectively meets the long-term requirement for the Federal Government to provide, operate, maintain, repair, rehabilitate, and replace (OMRR&R) crossings of the Cape Cod Canal for vehicles, pedestrians and other surface traffic. Engineering reliability of the structures, when analyzed together with cost and economic benefits will form the basis of the analysis and determine the recommended plan. The alternatives carried forward into detailed analysis at this stage, as defined in Table 5 earlier include: Plan A – The Base Plan or No Action Plan – This plan consists of continued maintenance and repairs to both existing bridges as needed to maintain safety (fix-as-fails). Maintenance and repair of both bridges continues without any major rehabilitation. Bridge components are repaired or replaced when inspections yield unsatisfactory reliability ratings. This alternative is synonymous with a “no action plan” or the “without-project condition”, and assumes that the two highway bridges will continue to be operated efficiently and with due diligence for vehicular and marine safety. In the event of unsatisfactory performance of a bridge component, it is assumed that emergency funding will be made available to address the deficiency. This scenario portrays a condition where the reliability of the bridges is allowed to fall below the current condition, but that the bridge remains functional. While components would be repaired or replaced as they fail to meet the condition rating for reliability, the bridges will continue to age and repairs can be expected to be more frequent.
Plan B – Major Rehabilitation – This plan was presented in detail in prior sections. This plan consists of implementing a program of repairs and major rehabilitation for both highway bridges to maintain safety and reliability over the 50-year planning horizon and avoid future restrictions on bridge weight postings. All known structural, mechanical, and electrical deficiencies will be addressed and obsolete components replaced for both bridges. More than one major rehabilitation program would be required; one at the beginning and one near the end of the planning horizon.
Plan D – Replacement with Safety Modifications – Replacement of one or both highway bridges with new bridges each having four through-traffic lanes and two auxiliary acceleration/ deceleration lanes, plus a pedestrian/bicycle lanes in accordance with modern highway standards. A full replacement bridge would be built parallel to one or both existing bridges. The addition of auxiliary lanes in each direction of travel. In conformance with current FHWA and MassDOT standards and guidelines for highway and bridge design, would facilitate safe exit and entrance from the connecting surface roads nearest the Canal. The bridge replacement plan includes retaining the existing bridges in service until the new bridges are opened to traffic with the old bridges then being removed. Implementation of any plan is subject to future appropriations.

Cape Cod Canal Highway Bridges, MA Final Report Major Rehabilitation Evaluation Report 132 March 2020
13.1 Risk Assumptions and Variables The most critical assumption made in this major rehabilitation study is that the Federal Government will continue to honor its obligation to continue to provide safe and reliable access over the Cape Cod Canal and safe and reliable navigation passage through the canal. Congress has authorized this through acts to acquire and improve the Canal, and to maintain the bridges as part of the FNP. In conducting this study the following tasks were performed: (i) the deficiencies of the components of the two existing highway bridges (Sagamore and Bourne Bridges) were identified, (ii) their reliability indices were estimated, (iii) impacts to road traffic and marine traffic from component failure were estimated, (iv) the increases in reliability based on each improvement alternative were estimated, (v) economic benefits were estimated, and (vi) costs to repair deficient components or replace the bridges were estimated. All of these tasks provided inputs to the economic evaluation of alternatives. Increases in reliability, with respect to the costs to attain them, in order to continue safe and reliable navigation and highway access, was the ultimate objective of evaluation.
13.2 Reliability Changes with Alternatives Table 45 below displays improvements in reliability for the major rehabilitation and replacement bridge alternatives in comparison to the base condition. Under Plan B, a second rehabilitation project in years 2065 (Sagamore) and 2069 (Bourne) will improve the reliability of the superstructure and bridge deck, the substructure will continue to deteriorate. Under Plan D, scheduled repairs to maintain the bridges will be performed in 2049 and 2069 on the Sagamore Bridge, and in 2054 and 2074 (the latter not included in the study period) on the Bourne Bridge.
Table 45
Cumulative Reliability Improvements for Detailed Plans (at 50 Years – Year 2069)
Plan A Base
Condition
Plan B Major
Rehabilitation
Plan D Replacement
4 Lanes with 2 Auxiliary Lanes
Sagamore Bridge Superstructure 0.0000 0.9730 1.0000 Bridge Deck 0.0012 1.0000 1.0000 Substructure 0.5802 0.5802 0.9952 Bourne Bridge Superstructure 0.0000 0.9862 0.9986 Bridge Deck 0.0012 1.0000 0.9984 Substructure 0.5802 0.5802 0.9972

Cape Cod Canal Highway Bridges, MA Final Report Major Rehabilitation Evaluation Report 133 March 2020
13.3 Opportunity Costs during Repair and Rehabilitation As stated in Section 8 – Economic Analysis, during the rehabilitation there will be substantial impacts to traffic flows as construction will require lane or bridge closures. Table 46 below summarizes the estimated closures for each major rehabilitation project. Lane and bridge closures will not occur Memorial Day through Columbus Day to avoid impacting the busy tourist travel seasons as well as Patriots Day and Thanksgiving weekends. For logistical purposes, construction will be limited during the winter months as construction is made more difficult under cold winter weather conditions.
The Sagamore and Bourne Bridges are the only means of vehicular transportation on and off Cape Cod, therefore any road closures incur an economic cost to commuters and local businesses that rely heavily on tourism to the region. Value of time costs were associated with each of these closures as described in Appendix D - Economics and summarized in Section 8 of this report. The total economic impact to travelers during the major rehabilitation of the Sagamore Bridge is estimated to be $661 million and $530 million for the Bourne Bridge Rehabilitation project.
Table 46 – Major Rehabilitation Lane and Bridge Closure Durations
Major Rehabilitation Activity Bourne Bridge
Sagamore Bridge
Lane Closure Durations (Days) 480 380 Superstructure, Abutment, Deck and Cable Repairs 230 205 Paving and Painting 250 175 Full Bridge Closure Durations (Days) 180 130 Interior Gusset Plate Replacement 70 95 Floorbeam Replacement 110 35
13.4 Opportunity Costs during Replacement The replacement bridges will be built next to the existing bridges. Traffic will continue as usual on the existing bridges during the construction and then relocate to the new bridges when construction is complete. Therefore vehicle traffic is not expected to be disrupted under Plan D. Building new bridges will require closing vessel traffic through the Cape Cod Canal for roughly thirty days for each bridge. Vessels will be required to travel around Cape Cod forfeiting the safety and economic gain of canal passage. The cost for the thirty day closure is roughly $168,000 for each bridge (Appendix D, Section 3.1.1).
13.5 Cost of Detailed Plans
Federal costs cited below include design and construction costs, including PED, construction management, real estate interests, and contingencies.

Cape Cod Canal Highway Bridges, MA Final Report Major Rehabilitation Evaluation Report 134 March 2020
13.5.1 Plan B – Major Rehabilitation
The cost of the major rehabilitation for the Sagamore Bridge is $156,301,000 for the initial construction cost, $33,425,000 for complete painting in 2045 and $110,940,000 for major repairs including the truss deck replacement, floor beam repair, and complete painting in 2065. Operation and maintenance (O&M) costs are expected to be about $411,000 per year. The cost of the major rehabilitation for the Bourne Bridge is $186,171,000 for the initial construction cost, $26,827,000 for complete painting in 2049, and $132,120,000 for major repairs in 2069. The O&M costs are expected to be roughly $295,000 annually. The total 50-year life-cycle cost for rehabilitation of the Sagamore Bridge would be $368,936,000 and for the Bourne Bridge $407,233,000 (Table 17).
13.5.2 Plan D – Replacement Bridges 4 Lanes Plus Auxiliary on/off Lanes
The cost of a replacement Sagamore Bridge with 4 through lanes plus 2 auxiliary on/off lanes is $486,083,000 ($428,281,000 for the bridge and $57,802,000 for the approaches). In addition there are scheduled major repairs in 2049 and 2069 costing $7,906,000 each. Total cost for the Sagamore Bridge replacement is $501,895,000 (Table 21).
The cost of a replacement Bourne Bridge with 4 through lanes plus auxiliary on/off lanes is $721,764,000 ($630,773,000 for the bridge and $90,991,000 for the approaches). Major repairs are scheduled for 2054 for $7,911,000. Total cost for the Sagamore Bridge replacement is $729,675,000 (Table 21). O&M costs are expected to be about $38,000 annually for each replacement bridge (Appendix D, Section 3.1.14).
13.6 Comparison of Alternatives A cost-benefit analysis was used to compare the alternatives. This analysis is described in further detail in Appendix D – Economics. Tables 47 and 48 below summarize the results.
Table 47 – Sagamore Bridge Summary Benefit-Cost Analysis Results Scenario Simulation Comparison
FY 2020 Price Levels ($000) Mean Results (Updated March 2020)
Annual Life Cycle
Cost
Annual Cost of Rehab or
Construction
Annual Benefits
Annual Net
Benefits BCR
Plan A - Base Condition 123,900 - - - - Plan B - Major Rehabilitation 8,800 35,900 115,100 79,200 3.2
Plan D - Replacement Bridge 4 Lanes with Auxiliary Lanes
4,400 17,400 119,500 102,100 6.9
Note: Costs shown above are the results of the Monte Carlo simulations and may not round or add precisely. See Appendix D – Economics, Table D-77.

Cape Cod Canal Highway Bridges, MA Final Report Major Rehabilitation Evaluation Report 135 March 2020
Table 48 – Bourne Bridge Summary Benefit-Cost Analysis Results Scenario Simulation Comparison
FY 2020 Price Levels ($000) Mean Results
Annual Life Cycle
Cost
Annual Cost of Rehab or
Construction
Annual Benefits
Annual Net
Benefits BCR
Plan A - Base Condition 65,200 - - - - Plan B - Major Rehabilitation 6,100 27,100 59,100 32,000 2.2
Plan D - Replacement Bridge 4 Lanes with Auxiliary Lanes
6,900 21,300 58,300 37,000 2.7
Note: Costs shown above are the results of the Monte Carlo simulations and may not round or add precisely. See Appendix D – Economics, Table D-78.
Based on BCRs and Net Annual Benefits only, the rank of alternatives (with 1 being the most desirable) is:
1. Replacement of Both Bridges –(Plan D) 2. Rehabilitation of Bridges (Plan B) 3. Base Condition Fix-as-Fails (Plan A)
The economic analysis suggests that fixing the current bridges as components deteriorate (Plan A – the Base Condition) will lead to excessive costs, particularly costs for travelers delayed in traffic.
The second alternative evaluated (Plan B) was major rehabilitation of the existing bridges. This scenario was supported by positive net benefits and a benefit-cost-ratio of 3.2 for the Sagamore Bridge and 2.2 for the Bourne Bridge. The advantage of the rehabilitation is a lower initial construction cost for the project when compared to replacing the bridges. The disadvantages are the high impact it will have on traffic patterns during the time of construction due to lane and full bridge closures. In addition, the bridges will not be brought up to current engineering standards and regulations. The major rehabilitation alternative is a higher risk option due to the faster rate of deterioration in the future. Deterioration of these structures can increase exponentially as these bridges age and may warrant the need for replacement in the future.
The alternative for replacement bridges (Plan D) was evaluated for 6-lane bridges including auxiliary on/off lanes. The bridge replacement alternative had higher net benefits and a higher BCR than the rehabilitation scenario (6.9 for the Sagamore Bridge and 2.7 for the Bourne Bridge). The disadvantage of the replacement bridges is the high initial cost of construction. The advantages of the replacement bridges are minimal disturbances to traffic during construction and replacing the aging infrastructure with bridges that meet modern engineering standards and regulations. The new bridges would not require the level of frequent, costly, and escalating maintenance and repairs, or entail the high level of disruption to traffic and the economy of the region.

Cape Cod Canal Highway Bridges, MA Final Report Major Rehabilitation Evaluation Report 136 March 2020
It is important to note that this analysis was performed under the assumption that the road infrastructure surrounding the bridges are in their current conditions and are not upgraded by the state of Massachusetts. If the state choses to improve the road network surrounding the bridges as planned, particularly near the Bourne Rotary and the improvements to Route 6, then the 6-lane replacement bridges will provide additional efficiency benefits of improved travel time by allowing the left-hand travel lanes to be fully used by through traffic, since exiting and entering traffic will use the acceleration/deceleration lanes. Shifting the exiting and entering traffic out of the right-hand through traffic lanes will also have benefits to traffic safety as conflicts between fast-moving and slow moving vehicles will be minimized.
The state is planning to make major highway safety and efficiency improvements in the connecting roads to both bridges should they be replaced. The state has committed to accessing available bonding authority to make these improvements. The recommended plan at this phase of the project is for the replacement of both the Bourne and Sagamore highway bridges with decks having 6 lanes, including 4 through traffic lanes plus 2 auxiliary (acceleration/deceleration) lanes, plus separate non-vehicular pedestrian and bicycle lanes on each bridge. The state improvements will be designed to accommodate the new bridge dimensions. Final bridge capacity and design will be determined during Phase II.
13.7 Value Engineering A Value Engineering study was not performed at this phase of the analysis. In the next phase as the process for determining bridge type, location, and alignment is developed and the needs for additional investigations and analyses are determined, a Value Engineering study would be initiated. Insufficient information exists at this phase to scope and undertake a meaningful value engineering study. 14.0 THE RECOMMENDED PLAN 14.1 Description of the Recommended Plan The recommended plan moving into the next phase of design analysis is replacement of each of the two highway bridges crossing the Cape Cod Canal FNP at Bourne and Sagamore. Final design would conform to AASHTO and MassDOT design standards current at that time. Subject to additional analysis during Phase II the new bridges will have two through travel lanes and one auxiliary (acceleration/deceleration) lane in each direction, for a total of 6 lanes on each new bridge. The conceptual design evaluated at this stage of study consists of the following: 1) Construction of two new highway bridges each located parallel to and immediately
inshore of the existing Bourne and Sagamore Bridges. A new Sagamore Bridge would be located southwest of the existing bridge. A new Bourne Bridge would be located northeast of the existing bridge.
2) Each new bridge would include 4 through travel lanes (2 in each direction) each 12 feet wide.

Cape Cod Canal Highway Bridges, MA Final Report Major Rehabilitation Evaluation Report 137 March 2020
3) Each new bridge would have two auxiliary lanes for acceleration/deceleration (entrance and exit), one in each direction, each 12 feet wide.
4) Each new bridge would have a minimum vertical clearance for navigation of 135 feet above mean high water over the width of the navigation channel, increased 7.8 feet for anticipated sea level change (high rate).
5) Each new bridge would have deck and approach grades of no steeper than 4%. 6) Each new bridge would include one non-vehicular lane for pedestrian and bicycle traffic
with separation between the non-vehicular lane and the vehicle traffic lanes. 7) Each new bridge would include a shoulder on the vehicle deck, 10 feet wide, in each
direction. 8) Each new bridge would include a median with barriers to separate northbound and
southbound vehicular traffic. 9) A conceptual cable-stay design was used for this analysis, but actual bridge type and
other design parameters will be developed in the next phase. 10) The existing bridges would remain in service (operated, maintained and repaired as
needed) until the new bridges are opened to traffic. 11) The existing bridges would be demolished upon opening of the new bridges. The steel
components would be scrapped. The method of demolition and removal would be determined during the next phase.
12) Licenses and easements for placing new electric transmission and telecommunications cables on the new bridges would need to be proposed by the utility owners and negotiated. Placement of new gas lines would not be allowed on the new bridges.
13) Detailed design features such as lighting, fire suppression, suicide prevention barriers, signage and pavement markings, traffic barriers and controls, etc., would be determined during the design phase of the project.
This study was conducted to determine whether major rehabilitation or bridge replacement would be the most cost effective, safe and reliable solution to providing vehicular crossings over the Cape Cod Canal. A conservative approach was taken developing a conceptual design for new crossings. This included the bridge type selected, lane widths, approach grades, and sea level rise. The replacement bridge designs presented therefore include an increased bridge clearance to accommodate current vessel traffic at the high rate of sea level rise. Final elevations of the bridges and corresponding air draft clearance will take approach work and adjacent infrastructure into consideration during design phase (Phase II) of the project. This will include a further evaluation of the most appropriate scenario of sea level rise to include in the final design elevation. Locations and cross sections of the new bridges are shown in Figures 27 and 28.

Cape Cod Canal Highway Bridges, MA Final Report Major Rehabilitation Evaluation Report 138 March 2020
Figure 27 – General Locations for Bridge Replacement
Replacement bridges would likely be located close to the existing bridges so as to minimize the approach road modification necessary to connect them, and to minimize impacts to area residents and businesses.
Figure 28 – Deck Sections for Conceptual Replacement Bridge Design
The concept for replacement bridges used in this analysis would have two through travel lanes and one auxiliary entrance/exit lane in each direction. Shoulders would also be provided in each direction. A non-vehicle lane for pedestrians and bicycles would be included as would a median to separate directions of traffic.
Sagamore Bridge Area
Bourne Bridge Area

Cape Cod Canal Highway Bridges, MA Final Report Major Rehabilitation Evaluation Report 139 March 2020
14.2 Outputs of the Recommended Plan Compared to Major Rehabilitation The rehabilitation and replacement alternatives were each measured against the Base Condition. The costs and benefits of these plans are shown in the table below. For this analysis project costs included the cost of design and implementation for the new bridges, the cost of future OMR&R for the new bridges, the cost of associated state modifications and improvements necessary to connect the new bridges to the regional highway system and local roadways, and costs for lands, easement, rights of way and utility relocations. Travel delays for vehicle and navigational traffic were treated as costs for the purposes of economic analysis. A comparison of the costs and benefits of the rehabilitation and replacement plans is shown in Table 49. Cost estimates developed at this phase were developed at a conceptual level to compare rehabilitation vs. replacement and are not intended for budgeting purposes. The results indicate that Bridge Replacement with construction of two new 6-lane bridges has a higher benefit to cost ratio than maintaining the bridges in a “fix-as-fails” Base Condition. In addition, the cost-benefit ratios are also higher than for Major Rehabilitation of the existing bridges. This study showed that replacement of each of the two highway bridges results in positive net annual benefits and benefit-cost-ratios greater than 1. Additional benefits would accrue due to improved traffic and highway safety, and reliability of the new bridges as part of the larger highway system over their expected life cycle of 75 years or more. These additional benefits would be investigated and quantified during Phase II.
The existing highway bridges would be demolished once the new bridges have been placed in service. Demolition activities would likely occur on land and from the water. Demolition would open up the former bridge footprint for other uses such as recreation. The steel in the existing bridges is a valuable commodity and part of the cost of demolition could be recovered by the government from its sale as scrap.
Table 49 – Comparison of Rehabilitation and Replacement Plans
FY 2020 Prices ($000s – March 2020) Major Rehabilitation
Replacement Bridges
Sagamore Bridge Total Federal First Cost $156,300 $428,300 Future Federal OMR&R $144,400 $15,800 State-Funded Approaches - - - $57,800 Total First Cost $300,700 $501,900 Travel Delay Costs $1,281,300 $92,800 Total – Sagamore $1,582,000 $594,700 Total Cost Discounted + IDC $969,500 $469,000 Total Annual Cost – 2-3/4% (0.03704) $35,900 $17,400 Total Annual Benefits $115,100 $119,500 Annual Net Benefits $79,200 $102,100 Benefit-Cost Ratio 3.2 6.9

Cape Cod Canal Highway Bridges, MA Final Report Major Rehabilitation Evaluation Report 140 March 2020
Table 49 (Continued) – Comparison of Rehabilitation and Replacement FY2020 Costs Rehabilitation Replacement
Bourne Bridge Total Federal First Cost $186,200 $630,800 Future Federal OMR&R $158,900 $7,900 State-Funded Approaches - - - $91,000 Total First Cost $345,100 $729,700 Travel Delay Costs $948,400 $22,400 Total – Bourne $1,293,500 $752,100 Total Cost Discounted + IDC $731,100 $574,400 Total Annual Cost – 2-3/4% $27,100 $21,300 Total Annual Benefits $59,100 $58,300 Annual Net Benefits $32,000 $37,000 Benefit-Cost Ratio 2.2 2.7
14.3 Impacts of the Recommended Plan The cost and economic impacts of the recommend bridge replacements are described above. The new bridges would require realignment of state highway approaches and some local roadways. The new bridge footprints would likely require some amount of real estate acquisition, estimates for which are included in the project costs. Replacement would have a far lesser impact on vehicular traffic, but a greater impact on marine traffic, than the other alternatives. There would be impacts to the environment from construction of new bridges. A minor amount of wetlands habitat would be lost. The Northern Long Eared Bat is known to roost in the area. A survey will be conducted during Phase II to determine if there would be any impact to this and other listed species from the project. There is also a potential for impacts to cultural resources. Visually, depending on the final bridge design chosen, the view of the Canal would change for the first time in more than 80 years. There is a potential that some level of cultural resource mitigation would be required for replacement of the bridges, since the existing bridges are historic structures and would be removed as part of any replacement project. At a minimum this would involve document of the 1935 bridges, their design and construction, history and place in the cultural setting of Cape Cod and the communities around the Canal. Detailed cultural resource surveys have not been done at this first phase of the project. There are some know cultural resources in the vicinity of the bridges and the potential areas for the new bridges. Surveys for potential and known cultural resources in the final bridge footprint would be conducted in Phase II.

Cape Cod Canal Highway Bridges, MA Final Report Major Rehabilitation Evaluation Report 141 March 2020
With an easing in traffic congestion, quality of life should improve for the residents and visitors to the Cape and Islands. Modern bridges with adequate dimensions should reduce traffic delays and vehicle accidents and make daily life less stressful to motorists. Due to other limits on housing and commercial development on the Cape, the new bridges should not induce even further development of the region. 14.4 Non-Federal Requirements for the Recommended Plan Initial construction as well as operation, maintenance, repair and rehabilitation of the Canal and its bridges since original acquisition by the Federal Government have not required any non-Federal cooperation. Modifications made to some of the small boat harbors appurtenant to the Canal have required Sponsor agreements. Replacement of the two highway bridges is within the existing authority for the Federal Navigation Project for the Cape Cod Canal and will not require any non-Federal participation or additional legislative authority. However non-Federal interests will need to perform a number of costly modifications to State and local roadways and other works for bridge replacement to succeed. Constructing two new bridges, even immediately adjacent to the existing bridges, will require realignment and relocation of connecting state highways and local roadways. New state and local highway and roadway modifications, including realigned connecting roads, approach ramps, signaling, lighting, and signage will all be required. State acquisition of real estate may be required to effect this work. The costs of performing this work, including all design and permitting, will be a non-Federal cost. Estimates have been made of these costs for state highways and local roadways based on the concept level bridge design and included in the total project costs for the bridge replacement alternatives. The state has plans for major transportation improvements in the area of the Canal in the coming years, beyond what is required to accommodate Federal construction of bridge replacement. State plans for highway modifications, both in support of new bridge construction and other improvements, will be examined again during Phase II design efforts so as to minimize impacts to the natural and human environment, and assure implementation of a safe and efficient transportation system. The concept level design includes relocation of the two highway bridges, changes to the bridge deck elevations, and easing of grades on the bridges and their approach spans. Federal acquisition of additional state and municipal lands, some private lands, and easements and rights of way will be required. These costs will be Federal costs, though some assistance from state and local governments will be required for acquisitions. Costs for utility relocations are included in the total project cost. Some utilities will be relocated to the new bridges, while others (natural gas lines) will be moved off the bridges and will need other means of crossing the Canal and connecting to their land-side facilities. These costs will need to be borne by the utility owners. Tolls are not permitted on Federal bridges or on Federal bridges that are transferred to state or local control under the provisions of the River and Harbor Act of 1950. If the state wishes to

Cape Cod Canal Highway Bridges, MA Final Report Major Rehabilitation Evaluation Report 142 March 2020
recover some of its costs for the project through tolls it must do so on its own roads, and not on the bridges, even if it ultimately assumes ownership of the bridges. 14.5 Project Operations and Maintenance Manual A Project Operations and Maintenance (O&M) Manual will be prepared for each new bridge as it nears completion of initial construction. The O&M Manual will document the details of project design, describe the construction process and timeline, document the as-built condition (including providing as-built drawings), and set forth the requirements and anticipated schedule for long-terms programs for OMRR&R for each new bridge. 14.6 Project Management Plan A Project Management Plan was developed for this first phase of the investigation of the Cape Cod Canal Highway Bridges. An updated Project Management Plan will be developed for the Phase II once approval to proceed with that effort has been received. That updated PMP will cover all aspects of the remaining investigations and analyses needed to determine the final bridge type, location, alignment, LERRDs, environmental and social impacts, final NEPA document, and schedule and budget for all remaining detailed design studies and implementation. 15.0 MAJOR REHABILITATION CLASSIFICATION The proposed replacement of the Cape Cod Canal Bourne & Sagamore Bridges falls within the guidelines established in ER 1130-2-500, 27 December 1996, last updated 1 June 2006, Chapter 3 - Major Rehabilitation. The replacement of the two highway bridges would provide a safe and reliable means for both commercial and non-commercial vehicular traffic to cross the Cape Cod Canal, a Corps operated Federal Navigation Project. The work is intended to improve the reliability physical life which will result in a deferral of capital expenditures to rehabilitate the bridges and will preclude significant future emergency repairs. The replacement will cost more than the threshold amount of $5,300,000 for reliability improvements and will not consist of routine or deferred maintenance. Replacement is more cost effective than major rehabilitation of the bridges for the purpose of restoring reliability. 16.0 PROJECT COST SUMMARY The estimated cost of the Recommended Plan at this conceptual level of analysis is shown in the table below. Project design and construction costs for Federal and State improvements are presented in base program year price levels of Fiscal Year 2020 in Table 50. These program year costs were used for comparison of detailed plans and selection of the recommended plan as shown in Table 49 above. The cost of major repairs for the 50-year analysis period are also shown. These estimates were developed based on concept level plans and are not adequate

Cape Cod Canal Highway Bridges, MA Final Report Major Rehabilitation Evaluation Report 143 March 2020
for use in budgeting for implementation. Cost certification at this phase is conditional due to the limited scope of the analysis. The next phase of the project will include more detailed investigations, final bridge locations and designs, and more detailed and refined cost estimates.
Table 50 Implementation Costs for the Recommended Plan – Plan D (Updated March 2020)
Initial Program Year Cost (FY20) of Project Design and Construction
Bourne Bridge
Sagamore Bridge
Total for Both Bridges
Federal Bridge Replacement Construction Cost $355,478,000 $232,630,000 $588,108,000 Contingency Cost (44%) $156,410,000 $102,357,000 $258,767,000 Planning, Engineering & Design $40,951,000 $27,321,000 $68,272,000 Construction Management $14,199,000 $9,594,000 $23,793,000 Total Construction $567,038,000 $371,902,000 $938,940,000 Cultural Resource Preservation $29,450,000 $19,241,000 $48,691,000 Lands, Easements, Rights of Way $7,645,000 $7,618,000 $15,263,000 Utility Relocations (Non-Fed Cost) $26,640,000 $29,520,000 $56,160,000 Total Federal Project Cost $630,773,000 $428,281,000 $1,059,054,000 Associated Non-Federal Highway/Roadway Modifications State Funded Bridge Approaches $90,991,000 $57,802,000 $148,793,000 Total Federal + State Initial $721,764,000 $486,083,000 $1,207,847,000 Anticipated Future Major Repair Actions for New Bridges Years for Major Repairs 2054 2049 & 2069 Major Repairs #1 (2054/2049) $7,911,000 $7,906,000 $15,817,000 Major Repairs #2 (None/2069) $7,906,000 $7,906,000 Total Cost of Future Repairs $7,911,000 $15,812,000 $23,723,000 Total Project Cost – Federal 50 Years + State Total Project Cost (50 Years) $729,675,000 $501,895,000 $1,231,570,000
Fully funded costs are provided in Appendix C - Cost Engineering, and escalate the costs to the mid-point of construction for each action. A cost summary for implementation of the recommended plan at the fully funded level is shown below in Table 51.

Cape Cod Canal Highway Bridges, MA Final Report Major Rehabilitation Evaluation Report 144 March 2020
Table 51
Fully-Funded Implementation Costs for the Recommended Plan – Plan D Project Design and Construction FY20 – Updated March 2020
Bourne Bridge
Sagamore Bridge
Total for Both Bridges
Federal Bridge Replacement Construction Cost $514,867,000 $290,645,000 $805,512,000 Contingency Cost (44%) $226,541,000 $127,884,000 $354,425,000 Total Contracts $741,408,000 $418,529,000 $1,159,937,000 Planning, Engineering & Design $46,277,000 $30,875,000 $77,152,000 Construction Management $22,868,000 $12,721,000 $35,589,000 Total Construction $810,553,000 $462,125,000 $1,272,678,000 Cultural Resource Preservation $42,655,000 $24,039,000 $66,694,000 Lands, Easements, Rights of Way $8,423,000 $8,393,000 $16,816,000 Utility Relocations (Non-Fed Cost) $36,370,000 $34,765,000 $71,135,000 Total Federal Project Cost $898,002,000 $529,322,000 $1,427,324,000 Associated Non-Federal Highway/Roadway Modifications State Funded Bridge Approaches $130,335,000 $72,046,000 $202,381,000 Total Federal + State Initial $1,028,337,000 $601,368,000 $1,629,705,000 Anticipated Future Major Repair Actions for New Bridges Years for Major Repairs 2054 2049 & 2069 Major Repairs #1 (2054/2049) $24,000,000 $20,343,000 $44,343,000 Major Repairs #2 (None/2069) $39,464,000 $39,464,000 Total Cost of Future Repairs $24,000,000 $59,807,000 $83,807,000 Total Project Cost – Federal 50 Years + State Total Project Cost (50 Years) $1,052,337,000 $661,174,000 $1,713,511,000

Cape Cod Canal Highway Bridges, MA Final Report Major Rehabilitation Evaluation Report 145 March 2020
17.0 SUMMARY AND CONCLUSIONS This study was initiated for the purpose of determining whether a program of major rehabilitation and repair or a project for replacement of one or both highway bridges over the Cape Cod Canal was the most cost-effective long-term means of meeting the USACE obligation to provide vehicular crossings over the Canal. This study has determined that providing two new highway bridges would be the most cost effective means of providing safe and reliable crossings. The existing bridges are 85 years old and are functionally obsolete. A new high level fixed span bridge would be constructed immediately adjacent to each of the two existing highway bridges so as to minimize the modifications needed to the connecting roadways on both the mainland and the Cape. The new highway bridges would be designed to include access for both pedestrians and other non-vehicular traffic such as bicycles. To improve traffic safety and through traffic reliability each bridge would include one acceleration/deceleration lane and two through traffic lanes in each direction, for a total of six vehicular lanes on each bridge. The two existing bridges would remain in in operation until the new bridges are opened to traffic. The fate of the two existing bridges will be determined in the detailed design phase, but for now it is assumed that they would be closed to traffic and demolished once the new bridges are opened. The USACE would need to determine the scrap value of the existing bridges during the detailed design phase. The two existing bridges are now coming up on their second major rehabilitation. The first rehabilitation of the Sagamore Bridge was carried out in 1981 to 1983. The first rehabilitation of the Sagamore Bridge was carried out in 1979 to 1981. The second rehabilitation of the Sagamore Bridge would be scheduled for 2025-2027 and cost about $185 million fully funded. The rehabilitation work on the Bourne Bridge would be carried out in 2029-2031 at a cost of about $210 million. During these periods the work would require a total of about 760 days of lane closures and 310 days of full bridge closures, with consequences to traffic and the local economy.
A program of critical repairs may be able to delay the full rehabilitation starts by a few years, but if bridge replacement is approved any more delay in implementing that work would require rehabilitation to proceed. In other words, any appreciable delay in decision-making or funding could force the Government to pursue major rehabilitation instead of bridge replacement in order to maintain reliability and safety of vehicular traffic over the Canal in the near term.
The Commonwealth of Massachusetts would be a necessary partner in any rehabilitation or replacement project. However, the State’s principal role would involve redesign and relocation of connecting highways and roadways if bridge replacement is pursued. The State has proposed more than $350 million in future infrastructure funds in the 2019 Transportation Bond Bill for work in the coming years. About $120 million of this would be required for the state-funded bridge approaches as part of the bridge replacement, including pre-design

regulatory coordination. This also would include additional road improvements in the area around and the highways leading to the Canal. Any delays in Federal funding could put much of that State commitment for the Canal area work in question.
There is a level of urgency in Federal and State decision making concerning the recommended bridge replacement project and the funding to implement it. This report provides a detailed discussion of the issues involved to aid in that decision making process. Approval of this report and its recommendation would allow the USACE to proceed with Phase II of the process — the identification of the final replacement bridge location, alignment, size and type, complete Federal, State and local regulatory coordination, including conclusion of the NEPA process, and initiate final design.
18.0 RECOMMENDATION
The USACE has determined that there is sufficient justification for pursuing a program of bridge replacement for both the Bourne and Sagamore highway bridges over the Cape Cod Canal, Massachusetts Federal Navigation Project. An evaluation of costs and benefits indicates that the most cost effective long-term means of providing vehicular crossing of the Canal is replacement of both bridges with new bridges that conform to modern highway design standards. This recommendation considers both safety and reliability of the bridges and the waterway they cross for both surface vehicular and marine transportation. The next phase of the investigation will determine final bridge type and other detailed design parameters, with such further modifications thereto as in the discretion of the Chief of Engineers may be advisable.
The recommendations contained in this report reflect the information available at this time and current USACE Departmental policies governing formulation of individual projects. They do not reflect program and budgeting priorities inherent in the formulation of a national Civil Works construction program nor the perspective of higher review levels within the Executive Branch. Consequently, the recommendations may be modified before they are approved for implementation funding.
,/,#4&% Date William M. Conde
Colonel, Corps of Engineers District Engineer
Cape Cod Canal Highway Bridges, MA Final Report Major Rehabilitation Evaluation Report 146 March 2020