capacity, workload and mental contents · company. tero ja riikka, terhi (tepsu) ja jani, joona ja...
TRANSCRIPT
113
Tuomo Kujala
J Y V Ä S K Y L Ä S T U D I E S I N C O M P U T I N G
Capacity, Workload and Mental Contents
Exploring the Foundations of Driver Distraction

JYVÄSKYLÄ STUDIES IN COMPUTING 113
Tuomo Kujala
UNIVERSITY OF
JYVÄSKYLÄ 2010
Esitetään Jyväskylän yliopiston informaatioteknologian tiedekunnan suostumuksellajulkisesti tarkastettavaksi yliopiston Agora-rakennuksen auditoriossa 2
heinäkuun 2. päivänä 2010 kello 12.
Academic dissertation to be publicly discussed, by permission ofthe Faculty of Information Technology of the University of Jyväskylä,in the building Agora, auditorium 2, on July 2, 2010 at 12 o'clock noon.
JYVÄSKYLÄ
Capacity, Workload and Mental ContentsExploring the Foundations of Driver Distraction

Capacity, Workload and Mental ContentsExploring the Foundations of Driver Distraction

JYVÄSKYLÄ STUDIES IN COMPUTING 113
JYVÄSKYLÄ 2010
Capacity, Workload and Mental ContentsExploring the Foundations of Driver Distraction
UNIVERSITY OF JYVÄSKYLÄ
Tuomo Kujala

Copyright © , by University of Jyväskylä
URN:ISBN:978-951-39-3947-2ISBN 978-951-39-3947-2 (PDF)
ISBN 978-951-39-3817-8 (nid.)ISSN 1456-5390
2010
Jyväskylä University Printing House, Jyväskylä 2010
Editor Seppo Puuronen Department of Computer Science and Information Systems, University of Jyväskylä Pekka Olsbo, Sini Rainivaara Publishing Unit, University Library of Jyväskylä
ABSTRACT Kujala, Tuomo Capacity, Workload and Mental Contents – Exploring the Foundations of Driver Distraction Jyväskylä: University of Jyväskylä, 2010, 147 p. (Jyväskylä Studies in Computing ISSN 1456-5390; 113) ISBN 978-951-39-3947-2 (PDF), 978-951-39-3817-8 (nid.)Finnish summary Diss. Based on a review of relevant literature, it is argued, that the capacity-based model of human dual-task performance forms the foundation for the traditional experimental approaches to assess the mechanisms of driver distraction by in-vehicle tasks. According to this psychologically well-grounded view, human dual-task performance is limited by the reserve capacity of operator’s information processing resources, which can be overloaded by overlapping demands of tasks. However, it is further claimed that there are additional levels of control available for the driver in realistic dual-tasking situations above this level of operational control, in particular the levels of tactical and strategic control. The objective of this research is to explicate the limitations and scope of the capacity-based paradigm in experimental driver distraction research and to develop a novel, content-based approach in order to address the found deficiencies. The primary tool of research used here is the foundational analysis, a metascientific method for improving the validity of scientific argumentation. A series of eight experiments were conducted in a driving simulation environment in order to test the applicability of the proposed approach.
The research indicates the scope of the dominant capacity-based paradigm and illustrates the demands for more holistic approaches for assessing driver distraction in order to improve the validity and utility of experimental results. The empirical results suggest that the metrics of time-sharing efficiency, i.e., metrics of variance in in-vehicle glance duration distributions, can be used in an efficient manner for evaluating driver’s tactical dual-tasking models and capabilities with visual in-vehicle tasks. In addition, the time-sharing metrics can be utilized for assessing visual-manual user interfaces’ support for task predictability and interruptability. The significance of these types of metrics is argued to increase the more information is provided for the driver by the systems under testing. Experiments with the novel metrics indicated distraction effects of three user interface features on drivers’ tactical allocation of visual attention between the driving task and the in-vehicle tasks. Consistency, and thus, predictability of task steps with the user interface was attributed as a major factor determining drivers’ possibilities to utilize tactical control for overcoming their capacity limitations. At a general level, the empirical research indicates that the analysis of the information contents of drivers’ mental representations related to situation awareness and tactical as well as strategic thinking can be used to explain drivers’ dual-task behaviors with in-vehicle information systems. Keywords: driver distraction; in-vehicle information system; dual-tasking; attention; capacity; workload; resource; time-sharing; situation awareness; mental contents

Author’s address Tuomo Kujala Agora Human Technology Center University of Jyväskylä P.O.Box 35 (Agora)
40014 University of Jyväskylä [email protected] Supervisors Professor, Ph.D., Pertti Saariluoma Dept. Of Computer Science and Information Systems University of Jyväskylä, Finland Professor, Ph.D., Mikael Sallinen Agora Human Technology Center University of Jyväskylä, Finland Professor, Ph.D., Heikki Lyytinen Dept. of Psychology University of Jyväskylä, Finland Reviewers Professor, Ph.D., Heikki Summala Traffic Research Unit University of Helsinki
Professor, Ph.D., Esko Keskinen Dept. of Psychology University of Turku
Opponent Professor, Ph.D., Geoffrey Underwood
School of Psychology University of Nottingham

ACKNOWLEDGMENTS Reflecting back on the almost six years I have spent on this research effort, it seems that my own multitasking capacity is rather limited. Apparently, I really need to focus if I want to get something done at a satisfactory level. During this time-period, there have been several parallel research projects that have distracted my doctoral research. On the other hand, I have to say that probably these projects have also expanded my perspectives on the research field of human-technology interaction. However, the research at hand would not have been possible without the contributions of several people whose support may largely vary in quantity and quality, but which has been in any case highly valuable to me.
Foremost, I want to express my gratitude to Professor Pertti Saariluoma, who has strived to expand the horizons of my thinking and whose genuinely original ideas have been a source of inspiration. Working with you has been at times extremely challenging, but nevertheless and maybe just because of this, a rewarding task. Professors Mikael Sallinen and Heikki Lyytinen have given me quantitatively somewhat less, but qualitatively highly valuable guidance during the last phases of this effort.
Hannu Karvonen has been an important support especially in the early phases of my research career when we were taking together the first, unstable, but eager steps of experimental research in driving simulators. My other colleagues in research, in particular Tero Heiskanen, Juha Lamminen, and Minna Pärttö have all leant a hand (or a whole body for piloting) whenever it was needed. Many people have assisted me in the hands-on “dirty work”, including Elina Ruohonen, Kaisa Kiljunen, Katriina Pajanti, Sakari Manninen, Risto Heikkinen, Ari-Matti Saari, and of course, all the 200 or more volunteer participants who were willing to get their driving behaviors analyzed.
Without the valuable contacts in industry and their healthy interest towards the subject, the empirical studies would not have had such concrete and timely topics. I am deeply grateful for the collaboration with Timo Tokkonen at Nokia and folks at Nokia Gate 5 GmbH in Berlin, especially to Mikko Nirhamo and Suvi Kuulasmaa. Thank you for the great times in Berlin! I wish this research can have a positive effect on traffic safety through some confounding, unpredictable causal processes. Besides Nokia, Patria Vehicles and the Henry Ford Foundation have supported this research financially. I have to mention also the fruitful discussions along the years with Pekka Kuikka, which have given me new ideas and perspectives especially related to the challenges in the evaluation of driving abilities. Behind the scenes, the support of the AC coordination unit, in particular of Päivi Fadjukoff, Virva Nissinen, Susan Immonen, Mikko Pitkänen, and Anu Penttilä has been indispensable.
The people who had the greatest impact on the quality of this thesis at the final stages were the reviewers, Professors Heikki Summala and Esko Keskinen, for whom expertise in traffic psychology I am deeply grateful and humbled by.

A special merit goes to the Professor Geoffrey Underwood, whose volunteering to act as an opponent I highly appreciate. Steve Legrand, Rebekah Rousi, Barbara Crawford, and Seppo Puuronen have all helped me improve the quality and clarity of my language and reporting.
Last, but definitely not least, I have to sincerely commend the most important people in my life. From time to time, I have really needed the time out-of-focus. Special thanks to my “posse” around the firetruck. I am grateful for the quantity of so many good friends, but foremost for the rich quality of the company. Tero ja Riikka, Terhi (Tepsu) ja Jani, Joona ja Hymy, I have always enjoyed time spent with you. Niina, thank you for being there, sharing also the hard times. Finally, I would like to take this opportunity to thank my great parents, who have always been there for me and tried to teach me the value of work well-done. At these times of information overload and continuous interruptions, when it seems that quantity is too often preferred over quality, I hope this thesis can be counted as work well-done. Berlin, May 2010 Tuomo Kujala

FIGURES FIGURE 1 Capacity-based model of human dual-task performance .......... 28 FIGURE 2 Capacity-based model of driver distraction ................................. 71 FIGURE 3 Multiple level model of driver distraction ................................... 84 FIGURE 4 Content-based model of situation awareness in a dual-task
situation while driving..................................................................... 92 FIGURE 5 In-vehicle glance duration distributions by text type ................. 99 FIGURE 6 In-vehicle glance duration distributions by menu structure and touch screen scrolling method .............................................. 104 FIGURE 7 Illustration of the effects of task predictability on glance
duration distributions .................................................................... 106 FIGURE 8 Illustration of the effects of task interruptability on glance
duration distributions .................................................................... 107 FIGURE 9 Illustration of the effects of different qualitative user interface
design features on task predictability .......................................... 110 FIGURE 10 The driving simulation environment .......................................... 113
TABLES TABLE 1 Popular metrics of workload and performance in driver
distraction research .......................................................................... 63 TABLE 2 Comparison between the capacity- and content-based
approaches for experimental research on human-technology interaction ........................................................................................ 113

CONTENTS ABSTRACT ACKNOWLEDGMENTS FIGURES AND TABLES CONTENTS LIST OF INCLUDED ARTICLES
1 INTRODUCTION ............................................................................................... 15 1.1 Interaction between driver and in-vehicle information systems ........ 15
1.1.1 Significance and purpose of the research – driver distraction ... 16 1.1.2 About the traditions of the research .............................................. 18
1.2 Approach ..................................................................................................... 20 1.2.1 Research questions ........................................................................... 21 1.2.2 Foundational analysis ...................................................................... 22 1.2.3 Scope of the thesis ............................................................................. 23 1.2.4 Capacity- and content-based approaches to interaction analysis ........................................................................... 25
1.3 Structure of the thesis ................................................................................ 25
2 COGNITIVE CAPACITY, WORKLOAD, AND COMPLEXITY .................. 27 2.1 Capacity-based research tradition in cognitive psychology ............... 27
2.1.1 Mechanisms of cognitive multitasking interference .................... 28 2.1.2 Evaluation of the significance of the interference mechanisms in the driving task ...................................................... 33
2.2 Capacity-based paradigm in driver distraction research .................... 35 2.2.1 Common denominators in the capacity-based metrics of ............. driver distraction .............................................................................. 63 2.2.2 Distraction as a breakdown of operational control ..................... 70
3 FROM CAPACITY TO MENTAL CONTENTS .............................................. 74 3.1 Mental contents and apperception .......................................................... 74
3.1.1 Relevance, inclusiveness and correctness of mental contents .... 76 3.1.2 Why mental contents? ...................................................................... 78 3.1.3 Distraction at the levels of tactical and strategic control ............ 83 3.1.4 Situation awareness .......................................................................... 89
3.2 Empirical support for the content-based approach to IVIS interaction analysis .................................................................................... 95
3.2.1 Research questions and hypotheses ............................................... 95 3.2.2 Article I ............................................................................................... 96 3.2.3 Article II ............................................................................................. 97 3.2.4 Article III ............................................................................................ 98 3.2.5 Article IV .......................................................................................... 100 3.2.6 Article V ........................................................................................... 102

3.2.7 Article VI. .......................................................................................... 103 3.2.8 Discussion of the empirical evidence .......................................... 105 3.2.9 Author’s contribution to collaborative research ........................ 113
4 GENERAL DISCUSSION ................................................................................. 115 4.1 Summary ................................................................................................... 115 4.2 Capacity- vs. content-based analysis of human-technology
interaction ................................................................................................. 118 4.3 Contributions ............................................................................................ 121
REFERENCES ........................................................................................................... 123
YHTEENVETO (FINNISH SUMMARY) ................................................................. 146 ORIGINAL ARTICLES

LIST OF INCLUDED ARTICLES
I Karvonen, H., Kujala, T., & Saariluoma, P. (2006). In-car ubiquitous
computing: driver tutoring messages presented on a head-up display. In Proceedings of the 9th International IEEE Conference on Intelligent Transportation Systems (pp. 560-565). Toronto, CA: IEEE.
II Karvonen, H., Kujala, T., & Saariluoma, P. (2008). Ubiquitous co-
driver system and its effects on the situation awareness of the driver. In Proceedings of the 2008 IEEE Intelligent Vehicles Symposium (pp. 337-342). Eindhoven, NL: IEEE.
III Kujala, T. & Saariluoma, P. (submitted). Measuring distraction at the
levels of tactical and strategic control – The limits of capacity-based measures for revealing unsafe time-sharing models. Submitted to Transportation Research Part F: Traffic Psychology and Behaviour.
IV Kujala T. (2009). Occlusion technique – Valid metrics for testing
visual distraction? In L. Norros, H. Koskinen, L. Salo and P. Savioja (Eds.), Proceedings of the European Conference on Cognitive Ergonomics 2009 (VTT Symposium series 258, pp. 341-348). Helsinki, FI: VTT Technical Research Centre of Finland.
V Kujala, T. (2009). Efficiency of visual time-sharing behavior – The
effects of menu structure on POI search tasks while driving. In A. Schmidt, A. Dey, T. Seder, O. Juhlin and D. Kern (Eds.), Proceedings of the 1st International Conference on Automotive User Interfaces and Interactive Vehicular Applications (pp. 63-70). New York, NY: ACM Press.
VI Kujala, T. & Saariluoma, P. (submitted). Task predictability in
interaction with in-vehicle technologies – Measurement and support. Submitted to Ergonomics.
GLOSSARY FOR ABBREVIATIONS ACC = Automatic Cruise Control ADAS = Automatic Driver Assistant System AR = Attention Ratio CEC = Commission of the European Communities DLE = Duration of Lane Excursions DSS = Driver Support System fMRI = functional Magnetic Resonance Imaging FOV = Field Of View HR = Heart Rate HRV = Heart Rate Variability HUD = Head-Up Display ISO = International Organization for Standardization IVIS = In-Vehicle Information System LCT = Lane-Change Test LTWM = Long-Term Working Memory NASA-TLX = NASA Task Load indeX NLE = Number of Lane Excursions OED = Object and Event Detection PDT = Peripheral Detection Task PEP = Pre-Ejection Period POI = Point-Of-Interest PRC = Percent Road Center PRT = Perception Response Time QUIS = Questionnaire for User Interface Satisfaction RSA = Respiratory Sinus Arrhythmia RSME = Rating Scale Mental Effort SA = Situation Awareness SAE = Society of Automotive Engineers SAGAT = Situation Awareness Global Assessment Technique SART = Situation Awareness Rating Technique SDLP = Standard Deviation of Lateral (Lane) Position SDSWA = Standard Deviation of Steering Wheel Angle SPAM = Situation Present Assessment Measure SWAT = Subjective Workload Assessment Test TDT = Tactile Detection Task TGT = Total Glance Time TLC = Time-to-Line-Crossing TSOT = Total Shutter Open Time TTC = Time-To-Collision TTTUnoccl = Total Task Time Unoccluded UFOV = Useful Field Of View VDT = Visual Detection Task WM = Working Memory WSGD = Weighted Summed Glance Durations

“Peoples’ ability to develop skills in specialized situations is so great that it may never be possible to define general limits on cognitive capacity.”
(Spelke, Hirst, & Neisser, 1976)
“Creating a new theory is not like destroying an old barn and erecting a skyscraper in its place. It is rather like climbing a mountain, gaining new and wider views, discovering unexpected connections between our starting points and its rich environment. But the point from which we started out still exists and can be seen, although it appears smaller and forms a tiny part of our broad view gained by the mastery of the obstacles on our adventurous way up.”
Albert Einstein (Einstein & Infeld, 1938/1966)

1 INTRODUCTION
1.1 Interaction between driver and in-vehicle information systems
“Text messages were sent and received on a 17-year-old driver's cell phone moments before the sport utility vehicle slammed head-on into a truck, killing her and four other recent high school graduates...” (FoxNews.com, 2007). Text messaging as a factor for this fatal crash was in headlines at FoxNews.com on July 15th, 2007. The example illustrates, in a tragic way, the current and challenging problems related to in-vehicle information systems (IVISs) such as embedded in-car systems and mobile devices, from the ethical, legislative, educational, and product developers’ points of view.
In this thesis, the problems are approached from the perspectives of research and product development. Although there are important ethical and legislative issues to consider, such as whether interaction with in-vehicle technologies while driving should be enabled and allowed, versatile commercial Internet-based services are already implemented and made available for drivers in their mobile devices. Because of the fast development of mobile and in-car technologies and services, legislation is necessarily lagging far behind. These issues underline the product developers’ responsibility to find valid ways to test and develop the controls and displays of these systems in order to find safer means of interaction for those who drive.
The validity and reliability of test measures should reach a level that would ensure a minimal level of negative safety effects in the real context of use. The task is not an easy one. The theoretical understanding of drivers’ behaviors, or the metrics of the research field are not yet at the required level (Tijerina, 2001; Brookhuis, de Waard, & Fairclough, 2003; Chittaro & DeMarco, 2004; Carsten & Brookhuis, 2005a; 2005b; Young, Regan, & Lee, 2008a). The question is, as always in the evaluation of human-technology interaction (see Saariluoma, 2004; Hornbæk, 2006): what should be measured in tests in order to improve interactions, and thus, in this case, in order to minimize the negative impact of system use on traffic safety? Due to the potential of driver distraction, these
16
issues are important to consider in the development of new in-vehicle technologies and services.
1.1.1 Significance and purpose of the research – driver distraction
Driver distraction is a difficult concept to define in a comprehensive way. Lee, Young, and Regan (2008, p. 38) put effort to come up with a broad definition and define driver distraction as “diversion of attention away from activities critical for safe driving toward a competing activity”. There can be a lot of sources of distraction in the environment where the driving takes place, including eye-striking billboard ads, conversations with passengers, or even daydreaming (see extensive listings in Regan, Young, Lee, & Gordon, 2008). In this thesis, the focus will be on driver distraction caused by simultaneous activities with in-vehicle devices or information systems. These types of situations comprise a dual-task condition, in which the driver must share attention between two tasks, the driving task and a secondary task, either serially or simultaneously, in order to keep the driving at a safe level.
The results of the 100-car naturalistic field study conducted in 2005/2006 in the United States indicated that nearly 80 percent of the 82 crashes in the 42 300 hours of recorded driving, and 65 percent of the 761 near-crash situations involved driver inattention prior to the mishap (Klauer, Dingus, Neale, Sudweeks, & Ramsey, 2006). Visual inattention was attributed as a contributing factor in 93 percent of the recorded rear-end-collisions. Hand-held technologies, such as mobile phones, were associated with the highest frequency of distraction-related events for near-crashes, defined as “a conflict situation requiring a rapid, severe, evasive maneuver to avoid a crash”, and for the total of 8 295 incidents, defined as “a conflict requiring an evasive maneuver, but of lesser magnitude than a near-crash” (Klauer et al., 2006, p. 2). The analysis of statistical risks of inattention while driving revealed that engaging in secondary tasks that require multiple steps (i.e., require many glances away from the forward driving scene) increase crash risk by two to three times (Klauer et al., 2006).
On the basis of the field study data, one could argue that drivers should always keep their full concentration on driving, and that secondary activities that are not related to driving should be banned by law. The focus of driver distraction research should be on revealing any secondary activities that can possess potential for distraction. One should remember, however, that there are many kinds of mobile services available in these days, the access to which can be very beneficial for drivers on road. These services and information assistants include navigation aids, point-of-interest (gas stations, motels, restaurants etc.) directions, weather broadcasts, traffic information, minimization of fuel consumption, addresses, phone number entries, entertainment, e-mail, text messages, verbal communications, and so on (Bayly, Young, & Regan, 2008). The problem in research, if we are focusing merely on revealing and classifying potential distraction effects of certain activities (e.g., Bayly et al., 2008), is, that we cannot necessarily infer about the results how the interaction between the driver and the IVIS should be redesigned to enable safer interactions while

17
driving. Neither can we get an insight to the detailed mechanisms behind the observed distraction effects with this approach. For this line of descriptive research, it is enough if we observe distraction effects by the in-vehicle activities under investigation.
It should also be noted that even if an activity, e.g. watching a movie, is observed by researchers to be highly dangerous while driving, and is banned by a law, there will very probably still be people who will not comply with the legislation. Even more difficult is the case with activities such as mobile phone conversations that have been quite reliably been proven to have negative effects on detection performance and reaction times in experiments (Horrey & Wickens, 2006), but cannot be proven to be absolutely dangerous while driving, whatever the definition for this could be. Social pressure can also be applied to, for example, business people, expecting them to show productivity and handle relationships while on the road (Jamson, Westerman, Hockey, & Carsten, 2004). The temptation to engage in work-related activities with the available mobile technology while driving can be great, especially if commuting takes long and there is a lot of work pressure. In heavy transportation and e.g. taxi services, there are clear requirements for the professional drivers to interact with logistic systems while driving to enable efficient and cost-effective transportation of people and goods. So far we have often merely sought to identify activities that should be banned while driving, e.g. visual tasks that take on average over 15 seconds to complete (see Green, 1999b). Perhaps we should put more effort in experimentation with novel and safer interaction solutions, as well as examine distraction mitigation systems, in order to enable the desired activities while on the road (see Burnett, Summerskill, Porter, 2004).
A great number of guidelines, principles, standards and checklists have been published in several countries since the 1990s for the designers of in-vehicle information systems (e.g., Brookhuis, van Winsum, Heijer, & Duynstee, 1999; Society of Automotive Engineers, 2004; Kakihara & Asoh, 2005; Carsten, Merat, Janssen, Johansson, Fowkes, Brookhuis, 2005; Angell, Auflick, Austria, Kochhar, Tijerina, Biever, et al., 2006; Commission of the European Communities, 2006; International Organization for Standardization, 2007). The purpose of these public guidelines is to aid designers in designing safe user interfaces for in-vehicle devices and systems. However, on the first pages of the European statement of principles on human machine interface it is already stated that the development group ”…do not believe that the current state of scientific development is sufficient to robustly link compliance criteria with safety for all the principles” (CEC, 2006, p. 4). Carsten and Brookhuis (2005) noted that the guidelines, usually in the form of checklists, provide tools for designers and testing authorities to identify possible problems in IVIS designs, but these tools do not enable the quantification of these safety problems. Along the same lines, Barry Kantowitz, a human factors expert, stated his concerns already in 2000 (p. 359), namely that “We need a more theoretical understanding of how driving, IVIS, and the human driver are related.” Kantowitz (2000) states that the efforts for acquiring a theoretical understanding of how the driver functions had been

18
replaced in around 2000 by design guidelines and engineering approximations urgently needed for industrial purposes. Kantowitz (p. 364) continues that a “global understanding of the hidden mental processes drivers use to be effective in an IVIS driving environment” is required for a high level IVIS research. Young et al. (2008b) argue in their recent review that the factors moderating the impact of distraction on driving performance and safety, as well as the mechanisms related to these, are not yet sufficiently investigated or understood.
At the moment, human-technology interaction design in general is still largely based on designers’ intuitive thinking (Saariluoma, 2004). Especially in the case of IVIS, this can be a risky way to design in-vehicle user interfaces. What we need are scientifically justified design solutions. This means that our design decisions should be based on psychologically grounded and tested methods with which we could evaluate the proposed interaction designs (Saariluoma, 2004). From the industrial point of view, there are additional requirements for fast and cost-effective testing methods (Carsten & Brookhuis, 2005b), which, nevertheless, should be reliable and provide valid results. Cost-effectiveness of test measures can mean, besides the costs of research equipment etc., that the used metrics of distraction are sensitive to the effects of small but significant changes in user interface designs and reveal the differences in distraction potentials reliably with even small sample sizes.
Unfortunately, the usability paradox in the case of IVIS is that if we make the systems safer for use while driving, the frequency of use may rise (Tijerina, 2001). The resultant popularity of the system can undermine the positive effects of the development work. This is why it is highly important to simultaneously develop distraction warning systems, vehicle automation, driver support systems such as lane keeping assistants, and human-machine co-operation in driving tasks in general. The improved theoretical understanding of the mechanisms of driver distraction could be a source of knowledge also for this line of work.
1.1.2 About the traditions of the research
As cited above, the scientific understanding, metrics, or design practices to minimize the negative effects of driver distraction are not yet at the level that should be reached. Maybe if we examine the history, we can better understand the background of the trends that are currently popular in this field of research and get a glimpse about where the current deficiencies could reside.
Contemporary experimental driver distraction research has its roots in the human factors (HF) research and HF engineering born in the United States and Great Britain soon after the World War II (Sanders & McCormick, 1987). Sanders & McCormick (1987, p. 5) define human factors research (or ergonomics in Europe) in the following manner; “Human factors discovers and applies information about human behavior, abilities, limitations, and other characteristics to the design of tools, machines, systems, tasks, jobs, and environments for productive, safe, comfortable, and effective human use.”

19
According to HF research, there are several factors that can have an influence on human performance. Physical factors involve e.g., anthropometrics, noise, motion, reach, strength, temperature, etc.; sensory factors relate to detection and discrimination of objects; and finally, cognitive factors relate to perception (e.g., Gestalt theory (King & Wertheimer, 2005)), attention, memory, decision making, and mental workload (Kantowitz & Sorkin, 1983; Sanders & McCormick, 1987). Thus, at a higher level of abstraction, the key concepts in HF research relate to human information input and processing, output and control, work spaces, work arrangement, and environment (Sanders & McCormick, 1987).
An overview of HF literature shows that the higher, inner elements of human information processing, such as construction processes of mental representations or tactical and strategic thinking, are rarely handled in the HF handbooks and literature (Kantowitz & Sorkin, 1983; Sanders & McCormick, 1987; Salvendy, 2006). A possible explanation for this could be that, during the development of information theory at the late 1940s and early 1950s (Shannon & Weaver, 1949; Sanders & McCormick, 1987), many expectations were placed on the information theoretical approach to explain human information processing. The concept of information was adopted to human factors and cognitive psychology from the information theory (Sanders & McCormick, 1987). Information theory, information being defined as the reduction of uncertainty (Shannon & Weaver, 1949), came to concern quantity of information, not its quality. This is probably why early cognitive psychologists as well as HF professionals who came after Shannon and Weaver (1949), have focused mainly on the quantitative dimension of information or on investigating the underlying structures of human information processing system, such as short-term memory (e.g., Miller, 1956) or working memory (e.g., Baddeley, 1986). The basic question to such early cognitive psychologists as Miller (1956) and Broadbent (1958) was how much information the human mind can process and when its limits are surpassed. They abstracted, to a great extent, the qualitative aspect of the information contents in the messages and other stimuli that they utilized in their experiments.
In this thesis, I refer to this historical stance on human information processing as the capacity-based research tradition (after Saariluoma, 1997). The large-scale experimental driver distraction research since the 1980s, focusing particularly on mobile phone (see Horrey & Wickens, 2006) and navigation system interaction (see Green, 1999a) while driving, has definitely been built on this tradition. The basic explanatory frameworks in the research have been based on the concepts of workload and driver’s capacity-limited resources. The approach has been successful, but one can question whether the capacity-based theory language, based originally on the quantitative view of information provided by the information theory, is alone sufficient for understanding all the relevant psychological mechanisms of human information processing in real-life dual-task situations.

20
HF research is a highly applied field of science. According to Kantowitz (2000), HF engineering based on this research differs from other engineering disciplines in that the other fields utilize theories and models extensively. This could be because models of human behavior that are sufficient are often enough for solving applied problems. This observation of Kantowitz (2000) could partly explain why there still is not yet a comprehensive theory of driver-IVIS-interaction.
1.2 Approach
When developing a psychological analysis for any kind of human-technology interaction, a number of important challenges must be met. One of these challenges is to find explanatory concepts, which can best explicate different aspects of the underlying mental processes (Saariluoma, 1997; 2004). With a common sense, it is often tempting to think that empirical observations can automatically open us all the dimensions of human behavior. This conception misses an important metascientific finding about the theory-laden character of our observations (Sellars, Rorty, & Brandom, 1997). This means that the conceptual systems of researchers, when observing psychological phenomena, limit their attention to certain aspects of reality and filter out some other aspects, which might nevertheless be vital for understanding the phenomena under investigation. These often implicit theoretical positions guide researchers in the way they design experiments, in what data they collect, in what are the targets of analysis, and even in inferring what are the conclusions from the data. The differences and effects of scientific paradigms in the history of science effectively illustrate the importance of the theory-laden character of scientific observations (Hanson, 1958; Kuhn, 1962/1970). The following quotation has been attributed to Albert Einstein; “It is the theory that decides what can be observed” (Wikiquote).
Thomas Kuhn (1962/1970) popularized the terms paradigm and normal science in his well-known analysis of the history of science. With a paradigm Kuhn (1962/1970) refers to a set of practices within a scientific community that define the scientific discipline during a particular period of time. The prevailing scientific paradigm dictates what is to be observed and scrutinized, the kind of questions that are supposed to be asked and probed for answers in relation to the subject of the research, how the questions are to be formulated, and how the results of investigations should be interpreted (Kuhn, 1962/1970). Kuhn’s (1962/1970) concept of normal science refers to typical “puzzle-solving“ activity; the routine experimental work of scientists within a paradigm, seeking and accumulating details along the lines of the established broad theory, while there is no challenging or testing of its underlying assumptions. Within normal science, the paradigm is manifested as a set of exemplary experiments that are likely to be copied and emulated, but also in the language that is used within the scientific community.

21
However, exploring new perspectives to phenomena under scientific inquiry seems to be a significant prerequisite for scientific progress (Kuhn, 1962/1970; Saariluoma, 1997; Smolin, 2006). For example, to analyze and to explain human behavior in a particular context, such as human-technology interaction, requires capability to reach all relevant aspects of human mentality and an ability to define accurately the types of phenomena that can be explained under different scientific languages and paradigms. If a person cannot correctly perceive traffic situations, we often look for neural damage as a possible explanation (Racette & Casson, 2005). If a person cannot understand the rules of traffic correctly, we usually attempt to teach the unfamiliar rules to that person. The explanations for these two types of deficiencies have different origins, and respectively, we handle the problems arising from them in different manners.
From the meta-scientific point of view, it is interesting to see that the current lack of major progress in the contemporary theoretical physics has been attributed by an insider physicist Lee Smolin (2006) to the scientific community’s stubborn will to hold on to the normal science that is based on the paradigm of the string theory, and by making the life of alternative, more philosophically oriented thinkers as difficult as possible. This seems to be the case, even though there hasn't been any single successful experimentation confirming the predictions of the string theory since the 1970s. Smolin (2006) attributes the core problem to the nature of the string theory, namely that falsifiable hypotheses cannot be derived from the theory, and, thus, anything goes. However, grants and other types of funding possibilities seem to be difficult to get in this field if you are interested in exploring alternatives for the string theory. This example from a very different field of science, and, in particular, because it is perhaps the most highly regarded field of exact natural sciences, leads to a question; could there be similar type of thinking inside a box in other fields of science (see also Saariluoma, 1997)?
1.2.1 Research questions
Despite the capacity-based theories’ and experimentations’ unquestionable success there may be highly relevant problems related to driver distraction which do not open in a natural manner with the capacity-based theory languages. The conceptual distinctions typical to this way of investigating human behavior do not necessarily enable the researcher to ask some very important kinds of questions. Empirical research can test only hypotheses which can be formulated with its existing theory languages (Saariluoma, 1997). Radical behaviorists, for example, did not have anything to say about attention or memory because their stimulus-response language did not allow them to formulate hypotheses concerning the hypothetical concepts of attention or memory (Mills, 1998). In this thesis, a foundational question is addressed: does capacity-based theory language, which is grounded on the empirically proven idea that human information processing capacity is limited, offer solid conceptual grounds to investigate all the relevant types of problems in drivers’

22
dual-task behavior? If this proves not to be the case, then what types of theories could provide an alternative, or better still, given the success of the paradigm, a complementary paradigm? How these novel models of dual-task behavior could be efficiently operationalized?
1.2.2 Foundational analysis
The methodology of the presented research is based on foundational analysis (Saariluoma, 1997). Foundational analysis refers to a metascientific method to improve the validity of scientific argumentation and to search and locate faults in argumentation (Saariluoma, 1997). Conceptual and operationalization analysis (Saariluoma, 1997) will be utilized in this research. The concepts of workload, capacity, driver distraction, and situation awareness, and in particular, the related operationalizations in experimental research will be analyzed. The found faults or limitations of the capacity-based theory language can open up new theoretical perspectives and, in this way, help in the exploration of new essential concepts, operationalizations, and levels of experimental driver distraction research.
Conceptual analysis as a method of foundational analysis refers to the investigation of the contents of concepts through recomposition and reconstitution (Saariluoma, 1997). Recomposition of a concept means the process of explicating tacit attributes, of finding new attributes, and of formulating more accurately the familiar attributes of the concept (Saariluoma, 1997). This process also involves the analysis of a concept’s proper formulation, i.e., whether there are faults or missing, essential attributes in the concept’s definition. In this thesis, the process of recomposition will be applied, e.g., to the concepts of workload, resources, cognitive capacity, and driver distraction. The process of reconstitution refers to the creation of new concepts or reformulation of old concepts in a substantially different manner (Saariluoma, 1997). The aim in this thesis is to reconstitute e.g., the concepts of driver distraction, situation awareness, and task predictability in terms of the content-based psychology (Saariluoma, 1997; Saariluoma, 2003; Saariluoma, Kaario, Miettinen, & Mäkelä, 2008).
Operationalization analysis is a method for uncovering unfounded theoretical and intuitive elements in the structure of research procedures (Saariluoma, 1997). Here I will analyze the validity and scope of the results of test procedures and experiments, and especially of their interpretations. Operationalization analysis focuses on the rationality of the presuppositions behind experiments, instrumentation of ideas, and the scope and validity of the results (Saariluoma, 1997). The basic questions include: “How can we justify what has been argued on the ground of data?”, “What justifies the argumentation behind the experimentation?”, and “What vindicates the ways the experiments operationalize theoretical ideas?” (Saariluoma, 1997, p. 38). It should be noted, that the operationalization analysis is not about analyzing the use of proper scientific procedures and methods, e.g., analyzing sample sizes or measurement errors; it

23
is about analyzing the validity of the logics of experimental designs and operationalizations of concepts.
The conceptual and operationalization analyses are based on a review of the central literature on dual-task experimentation in cognitive psychology and driver distraction research. The empirical results presented in this thesis form an additional, important part of the operationalization analysis. The empirical evidence is provided in order to indicate the scope and limitations of the conclusions we can derive from measurements and experimental designs based on the capacity-based explanatory framework, and in particular, to indicate the utility of the novel approaches.
1.2.3 Scope of the thesis
In this thesis, the foundational analysis is focused on experimental approaches on human dual-task behavior and driver-IVIS interaction. In particular, the focus of research is on driver distraction caused by the related activities. The effects of fatigue (Brookhuis & de Waard, 1993), aging (Wikman & Summala, 2005), chemical substances, and suboptimal health conditions are left out of the scope of the research. In addition, the effects of limited driving experience (e.g. Wikman, Nieminen, & Summala, 1998) are considered only to some extent in the included empirical evidence. It is easy to imagine that all these factors can have an additional deleterious effect on drivers’ behaviors..
On the other hand, practice can make perfect also in dual-tasking (see Allport, Antonis, & Reynolds, 1972). Nevertheless, the effects of longer scale practice are left outside the scope of the analysis, because like Marcus (2004) points out, most drivers start using vehicle interfaces while still inexperienced but to ensure safety, they should be able to integrate their use with the driving task in a proper way almost immediately. The dual-task situation places also additional demands for the device use, and mere experience on device use or on driving alone does not necessarily mean that the interaction while driving will be fluent (see Oulasvirta & Ericsson, 2009).
Besides the experimental approach to the investigation of driver distraction, there are also other approaches such as statistical analysis of crash records (e.g., Wierwille & Tijerina, 1996; Green, 1999a; 2000; McEvoy & Stevenson, 2008). The problem with crash statistics is related to the typically large number of confounding factors in the reported accidents (Haigney & Westerman, 2001). A crash cannot typically be taken as caused by a single factor, such as the use of a mobile device. For a traffic situation to develop into a crash, several things have to go wrong. The reliability of self-reported behaviors prior to crash can also often be questioned (Haigney & Westerman, 2001). These are among the reasons why a statistical analysis of crash statistics is probably not the best tool for evaluating the impact of in-vehicle technologies to crash risk. The naturalistic 100-car study (Klauer et al., 2006) is a rare exception in that also the near-crash situations and minor incidents could be reliably taken into the analysis via the installed video cameras and data collection systems in the cars.

24
However, although highly valuable, these types of studies require a lot of resources and effort, and the scoring process can be unreliable.
Crash statistics can also be used for making inaccurate conclusions on causal relationships through observed correlations between variables or through the absence of them (Haigney & Westerman, 2001). For example, Bhargava and Pathania (2007) studied the link between cell phone use and crash risk, and concluded that none of their statistical analyses of crash statistics produced evidence for a positive link between mobile phone use and crashes. They argue that they found no evidence for a rise in vehicle crashes from 2002-2005 in the United States after 9 pm on weekdays when there is a clear peak in call statistics due to lower pricing of calls at that time. However, their study was based on several incorrect assumptions and imperfect considerations. Among other things, the study can be criticized on the grounds that they did not consider, at a sufficient level, the other confounding factors besides the cell phone use that could be necessary for a crash to happen (see Summala, 1996). These factors could involve the time of day, the amount of traffic on the roads, and the nature of the traffic (stop-and-go traffic at rush hours vs. fluent traffic flows in the evenings) among other significant factors. Crash statistics can naturally be utilized also in indicating that secondary tasks do elevate crash risks. For example, Wierwille (1995) and Wierwille and Tijerina (1998) showed that task times of visual secondary tasks correlate fairly well with crash risk. This is not surprising, considering that driving is a highly visual task. However, statistic analyses of crashes leave open the causal relationships and exact mechanisms of driver distraction that could possibly be revealed with experimental techniques.
In the empirical, applied part of this work, the emphasis is on the analysis and testing of driver interaction with visual-manual controls and in-vehicle displays. The multiple resources theory of Wickens (1984; 2000) applied to the driving context suggests that the interaction with IVIS should be designed in a way that does not place heavy demands on the same information processing resources as the primary task of driving. This means that auditory and verbal means of interacting with IVIS could provide a safer alternative to the visual displays and controls. However, the visual modality enables in many cases more efficient and errorless interaction and information search than does the auditory or haptic (Burnett, 2000; Ranney, Harbluk, & Noy, 2005; Sodnik, Dicke, Tomazic, & Billinghurst, 2008). As an example of the advantages of visual user interface solutions, visual menus are often significantly faster to scroll than auditory or haptic menus (e.g., Sodnik et al., 2008). In addition, auditory interfaces can cause an implicit kind of cognitive distraction (e.g., Jamson et al., 2004), in other words, the driver can be better aware of being distracted while glancing at in-vehicle devices. With the visual-manual interaction, the driver has also better possibilities to pace the interaction with the devices (Burnett, 2000). Furthermore, multimodal information can be more efficient than unimodal. For example, a turning instruction of a navigation system can be retrieved with a very short glance towards the display if the driver was

25
distracted when the verbal instructions were issued. For these reasons, we cannot just set aside the development of IVIS visual display designs. One basic applied question of the research is how to display information in a way that the driver can acquire the necessary and relevant information with short, predictable, and safely timed glances to the display.
1.2.4 Capacity- and content-based approaches to interaction analysis
The main aim of the research is to reveal implicit limitations and to clarify the scopes and roles of existing capacity-based approaches and methodologies for addressing the research question of what are the IVISs’ potential effects on driver distraction. An approach based on the content-based psychology (e.g., Saariluoma, 1997; 2003; Saariluoma et al., 2008) is suggested for complementing the deficiencies of these mainstream approaches.
The content-based approach presented was partly motivated by a series of unreported experiments, after which the author was convinced that the capacity-based experimental designs and measures, especially those of driving performance, subjective measures of workload, task durations, mean or total glance times and the number of glances off the road cannot provide us very useful information on how the user interface designs under evaluation should be developed for enabling safer and more efficient interaction while driving. One of the main reasons for these failures seemed to be that the experimental designs did not take into account the active roles, the learning capabilities, and the individual, intentional mindsets of the participants. Performance in the experiments very often seemed to depend on the tactical and strategic choices of the participants instead of the cognitive demands of the interaction. In addition, the capacity-based measures did rarely tell anything about the exact causes behind participants’ failures in performance. The tactical and strategic thinking of the participants could have been eliminated with careful experimental design involving speeded rather than self-paced tasks, but how the results of this kind would relate to their behaviors in more realistically motivated environments?
1.3 Structure of the thesis
After the introduction of the research field, approach, and research problems, the following section will provide a review and foundational analysis of the capacity-based approaches to dual-task research in cognitive psychology and driver distraction research. The purpose of the review is not to criticize the work done and the valuable results achieved, but to indicate the scope of the questions to which we can get answers with the capacity-based thinking and to point out where there are room for improvements in the chains of argumentation. After the review, the complementary content-based approach to driver distraction research is presented. A multiple level model of driver distraction, as well as a content-based model of situation awareness, are introduced along with a review of the relevant literature. The purpose is not to

26
propose that the new approach is superior or better than the traditional one, but to find new types of important questions to which the content-based approach can answer where the capacity-based cannot. The approaches are not incompatible and do not exclude each other, but instead, they complement each other.
In the empirical part of the work, evidence supporting the proposed approach and further indicating the limitations of the capacity-based approaches is provided in the form of six original peer-reviewed articles dealing with a series of eight experiments. Based on the empirical research, new types of metrics for measuring drivers' situation awareness and control of time-sharing behavior at the tactical and strategic levels of control, are suggested. The novel metrics include also measures for assessing in-vehicle task predictability and interruptability for testing purposes in IVIS design practices.
Finally, in the last section, a summary of the main findings is provided and discussed briefly in the larger frameworks of human-technology interaction and the progress of science. The thesis ends with the explication of the contributions of the research.

2 COGNITIVE CAPACITY, WORKLOAD, AND COMPLEXITY
In the first part of the following section, the basic capacity-based theories of human dual-task performance and the research tradition of dual-task experimentation in cognitive psychology will be very briefly reviewed in order to get an overview of the basic theoretical concepts and the difficulties related to them. The review does not do justice to these elegant and vast theories, but will serve merely to outline the concepts and rationale that can be inferred from the basic theories. In the second part of the section, the capacity-based paradigm in experimental driver distraction research built on this tradition will be presented and analyzed with the methods of foundational analysis.
2.1 Capacity-based research tradition in cognitive psychology
Human dual-task performance has been a subject of interest in psychological research since the 19th century (James, 1890/1950). In this thesis, I will refer to dual-tasking as a type of multitasking, i.e., conducting multiple activities together, either simultaneously or serially (time-sharing). Dual-tasking refers to two tasks, but very often it is difficult to divide human activities merely to two tasks, considering that for example the driving task can actually be divided into multiple subtasks, such as steering, observing, speed control etc.
The basic psychological background for the theories of human dual-task performance can be seen for example in the experimental research on the limits of attention (e.g., Cowan, 2000), on bottlenecks in central processing (e.g., Pashler, 2000), on the structure of working memory (e.g., Baddeley, 2007), or on the more specific resource models (e.g., Wickens, 2002). The model of explanation typically proceeds in these types of dual-task studies as follows: situational workload exceeds the limited capacity of the human operator and the resulting consequence is errors or slowed performance (see FIGURE 1). Basically, the reason for performance decrements is that the demands for operator’s resources required for maintaining a sufficient level of performance exceed the maximum limit of the reserve capacity of these resources. This leads to decrements in primary, secondary, or in overall task performance due to the
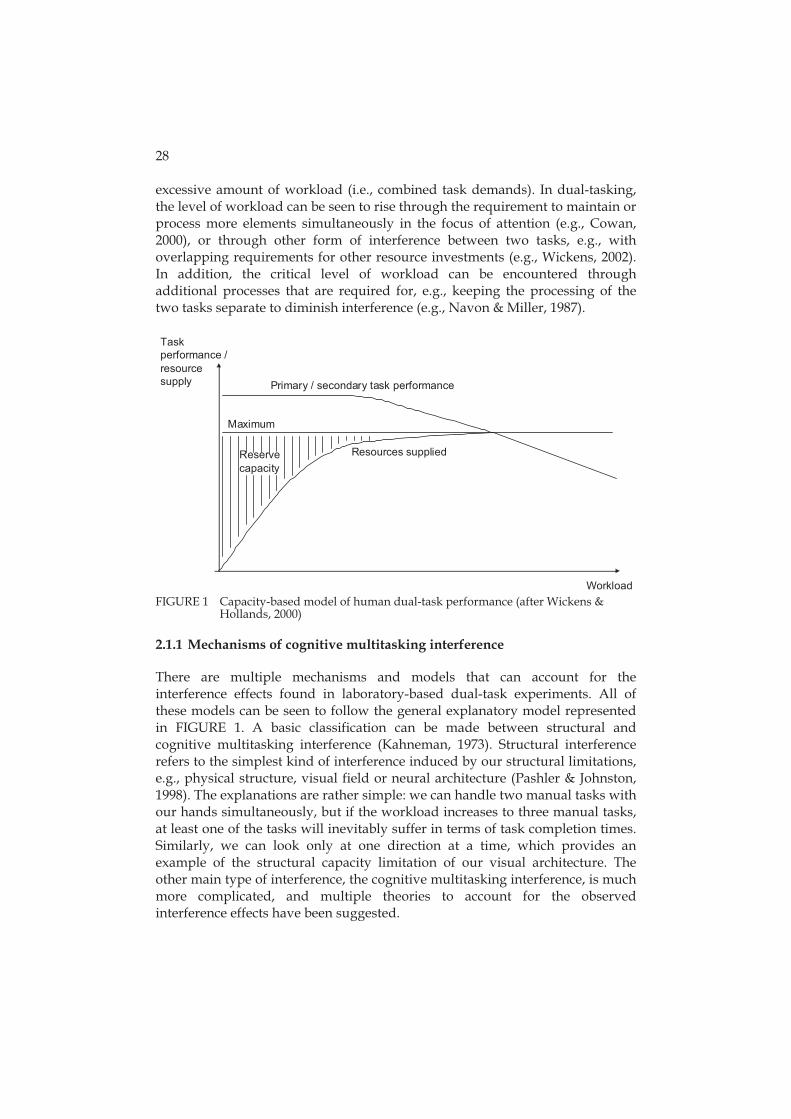
28
excessive amount of workload (i.e., combined task demands). In dual-tasking, the level of workload can be seen to rise through the requirement to maintain or process more elements simultaneously in the focus of attention (e.g., Cowan, 2000), or through other form of interference between two tasks, e.g., with overlapping requirements for other resource investments (e.g., Wickens, 2002). In addition, the critical level of workload can be encountered through additional processes that are required for, e.g., keeping the processing of the two tasks separate to diminish interference (e.g., Navon & Miller, 1987).
Taskperformance /resourcesupply
Maximum
Workload
Primary / secondary task performance
Reservecapacity
Resources supplied
FIGURE 1 Capacity-based model of human dual-task performance (after Wickens &
Hollands, 2000)
2.1.1 Mechanisms of cognitive multitasking interference
There are multiple mechanisms and models that can account for the interference effects found in laboratory-based dual-task experiments. All of these models can be seen to follow the general explanatory model represented in FIGURE 1. A basic classification can be made between structural and cognitive multitasking interference (Kahneman, 1973). Structural interference refers to the simplest kind of interference induced by our structural limitations, e.g., physical structure, visual field or neural architecture (Pashler & Johnston, 1998). The explanations are rather simple: we can handle two manual tasks with our hands simultaneously, but if the workload increases to three manual tasks, at least one of the tasks will inevitably suffer in terms of task completion times. Similarly, we can look only at one direction at a time, which provides an example of the structural capacity limitation of our visual architecture. The other main type of interference, the cognitive multitasking interference, is much more complicated, and multiple theories to account for the observed interference effects have been suggested.

29
By cognitive multitasking interference I refer to interference between at least two tasks including cognitive components (i.e., subtasks requiring processing of information). Starting from the investigations of Miller (1956) and Broadbent (1958), there have been a considerable amount of evidence that the human information processing system is limited in its capacity. However, disagreement exists about the limits of our mental machinery and about the factors contributing to the multitasking interference. Is there a task-independent general limit of processing capacity or are the limits modular, and the interference would therefore depend on the particular overlapping demands of the tasks at hand?
Evidence and theoretical frameworks for the general limits of central processing have been presented, for example, by Baddeley (1986; 2007), Cowan (1995; 2000; 2005), and Pashler (2000; Pashler & Johnston, 1998). Baddeley (1986) presented an alternative to the working memory model of Atkinson and Shiffrin (1968). This new model consisted of passive buffers for auditory and visual information, and of a capacity-limited central executive mechanism. Cowan (1995; 2000; 2005) equalizes working or short-term memory capacity to the limited capacity of attention, or more exactly to the capacity of the focus of attention. Pashler (2000), instead, is more interested in the structures of cognitive processes instead of short-term storages. He has found evidence for bottleneck in response selection – existence of serial processing in cognitive processes at the levels of 250 ms reaction time declines (the so-called psychological refractory period) (Pashler & Johnston, 1998). In Pashler’s (2000) model, the central processing stages (e.g., response selection), which are involved in the other task, comprise the workload in a dual-task situation. That workload interferes with the central processing stages of the other task.
However, all types of dual-task interference cannot presumably be explained by some task-independent general limit of human attention or the related central cognitive processes. A great number of dual-task studies suggest that dual-task performance is poorer in cases where the two tasks require the same “resources” (visual, spatial, focal, central etc.) than in cases where they require different resources (Allport et al., 1972; Navon & Gopher, 1979; Sanders, 1979; Navon & Gopher, 1980; Wickens, 1980; 1984; 2002). The central attentional resource would be just one of multiple resources (Navon & Gopher, 1979). Attention can also be argued to be an ambiguous concept, because there seems to be multiple systems and processes working behind what we understand in our everyday lives as attention (Allport, 1993; Pashler & Johnston, 1998). According to Allport (1993), for example, visual-spatial attentional control mechanisms are not necessarily “central executive processes”. If we take a closer look at these mechanisms, we will see that they can refer, on a neurological level, to qualitatively very different mechanisms of “spatially selective enhancement of neuronal response, in predominantly spatiotopic (“where”) systems…”, “raised thresholds of motor responsiveness with respect to stimuli outside the spatial focus of attention…”, or “in the figural or object-vision system, enhanced

30
selectivity of tuning (i.e., narrower tuning bandwidth) and increased local competition…” (Allport, 1993, p. 202-203).
According to the multiple resources theory, there would be performance trade-offs only if the two tasks had the same “demand compositions” (Navon & Gopher, 1979), or, according to Wickens (1984), stages of processing (e.g., perception, central, response), codes (e.g., spatial, verbal), or modalities (e.g. visual, auditory). However, there are also problems in the resource models of human multitasking performance (Allport, 1980; Navon, 1984; Neumann, 1987). According to the main critics, the resource concept lacks explanatory value, because the observed patterns of dual-task interference cannot be explained by a reasonably small number of basic resources (Neumann, 1996). Cowan (1997) also wonders whether there is a specialized attentional pool related to every resource or if the central capacity can be shared between the resources, the observed resource-similarity related trade-offs having their origins in structural interference in the neural architecture (Kahneman, 1973). However, the multiple resource theories see the level of workload to essentially rise when two tasks in a dual-task condition require the use of the same resources.
Cross-talk is another explanation for the task-similarity based dual-task interference (Navon & Miller, 1987). Interestingly, from our perspective, the cause for dual-task interference in this view is due to the contents of the information being processed in the two tasks, i.e., the similarities of the contents. Still, the explanation for deficits resides in the capacity paradigm, because it is assumed that the interference is caused by the workload generated by keeping the two processing streams separate. Coordination of tasks and avoidance of interference can be seen as an additional form of workload in a dual-task situation.
Attention-sharing refers to sharing of a single central pool of attentional capacity across different resources, a concept coined by Navon (1984; 1985). Attention-sharing relates to cross-talk in that it is assumed that there is a possibility for a kind of “structural” interference to occur also between similar types of information, e.g., of the same semantic categories (see e.g., Hirst & Kalmar, 1987). Hirst and Kalmar (1987) defined “structure” differently to Kahneman (1973) to refer to any aspect of the cognitive system that defines the state of the system. These “states” could represent, e.g., memories or any other kind of information. The explanation for dual-task interference from the attention-sharing point of view is, thus, that there is a central pool of attentional capacity, and there are limitations in the extent to which the capacity can be focused on similar items in the cognitive system simultaneously. This view could possibly unite the multiple resources theories with the central capacity theories.
Task-set switch costs or concurrence costs refer to the costs associated to serial switches between tasks (Jersild, 1927; Gopher & Navon, 1980; Rogers & Monsell, 1995; Sakai, 2008). These can simply mean the time required to switch or errors that will follow the switching process. The observed consequences typically consist of decreased reaction times to stimuli (e.g., Hsieh & Yu, 2003; Sakai,

31
2008). Transition costs can occur between task switching if the task-sets are very different, simply because time is needed for refocusing attention, i.e., reconfiguring our stimulus-response mappings by active top-down processes (Allport, Styles, & Hsieh, 1994; Meiran, 1996). There is also evidence that overlapping stimulus sets (i.e., cross-talk) and complex tasks with several possible responses and concurrent working memory load can increase these switch costs (Pashler, Johnston, & Ruthruff, 2001). All of these explanations are capacity-based, and refer to the costs of neural reconfiguration of our mental machinery. It seems that our machinery is rarely quite as efficient after task switches as when allowed to repeat a single task (Pashler et al., 2001). Task-set switch costs are an additional form of workload in dual-task situations with serial tasks when compared to a single-task situation.
Memory decay or time-based account can be another explanation for dual-task costs of switching between unrelated tasks or of keeping several task components active in the working memory. Baddeley, Thomson, and Buchanan (1975) were among the first who found the word-length effect that seemed to be in contradiction with the predictions of Miller’s (1956) capacity model of working (i.e., short-term) memory. They suggested that the working memory is limited by the rate that the operator is able to rehearse the contents in a repeating loop. This view assumes that representations in the working memory decay in a few seconds unless they are refreshed in time (e.g., Baddeley, 1986; Cowan, 1997). Indeed, memory tasks involving the working memory has been observed to be very vulnerable to interruptions by other tasks (e.g., Brown, 1958; Oulasvirta & Saariluoma, 2004). Over the years, there have been debates among cognitive psychologists about whether the reason for the observed capacity limitations of the working memory resides in the amount of items or in the requirements of time to refresh the items (e.g., Baddeley, 1986; Cowan, 2000). However, these views do not have to be contradictory, because it is assumed that the refreshing or keeping representations in the short-term storage places demands on the attentional mechanism (Cowan, 2005). In this way, the demands to refresh task-relevant information in working memory form the additional workload for the conscious information processing.
The theory of multimodal spatial attention is a relative newcomer as a model for explaining interference especially between tasks with spatial elements (Driver & Spence, 1998; Spence & Driver, 2004). It has been noticed that shifts of spatial attention in one sensory modality tend to be accompanied by corresponding covert shifts in other modalities as well (Spence & Driver, 2004). This means that the interference between two spatial tasks could be at least partly explained by preattentive orientation of sensory modalities to a single source of interest in space; the other sources could be processed at that time only to a lesser degree. These costs have been found in dual-task experiments on multimodal spatial attention (e.g., Driver & Spence, 1998; Spence & Driver, 2004).
Speed-accuracy trade-off (Fitts, 1954; 1966) is not a mechanism of interference itself, but instead a typical consequence of interference.

32
Nevertheless, it can explain why in certain dual-task situations speed of performance suffers while in others accuracy is impaired. If the other task performance is speeded up by the other task’s demands, then the error rate in the speeded task will rise with a high probability. Other way round, if the completion times of a task rise, then the error rate will probably decrease. It has been suggested that a successful trade-off is highly dependent on operators’ capabilities to minimize its impact on the overall task performance (e.g., Knight & Kantowitz, 1974).
Despite all these interference mechanisms, we have to acknowledge that there are also many possibilities for human operator to overcome the limitations of one’s information processing system in dual-task situations. According to Cowan (1997), utilization of sensory memory for efficient attention switching between two tasks is a possible option for explaining perfect multitasking and absence of observable general limits of attention that participants can achieve in seemingly complex experimental settings. An example of these seemingly complex dual-task situations comes from the experiments of Allport et al. (1972), in which the participants learned to sight-read music and engage in auditory shadowing task simultaneously. This experiment indicates that sensory buffers, such as the iconic or echoic memory, can be utilized (to an extent) to enable later access to information that cannot be processed at one time due to the processing demands of another task (Cowan, 1997).
In addition, after sufficient practice, task completion can move from the limited-capacity conscious control to so-called automatic control (Schneider & Shiffrin, 1977; Shiffrin & Schneider, 1977; Norman & Shallice, 1986). Although difficult to define accurately, automatization could mean that the operation of a task can proceed reflexively according to given stimuli (Pashler et al., 2001). Thus, the conscious control processes are available and can be directed simultaneously at new targets while completing automatic routines. Based on these observations, Rasmussen (1987) developed a popular model of skill-, rule-, and knowledge-based information processing, mainly in order to explain different types of human error (see also Reason, 1990). In short, knowledge-based refers to almost completely conscious processing of information, rule-based involves the use of conscious rules, and finally, skill-based refers to automated routines requiring little or no conscious attention. Despite the high value of automatization for relieving attentional resources, automatic information processing can also lead to errors that are of different type than those of conscious processing. These include inappropriate responses in a slightly changed situation due to strong habits (Reason, 1990). However, it should be noted that cognitive processes cannot be easily divided into conscious processes and automatic processes, but instead of this dichotomy, the processes are assumed to proceed in a continuum between the extremes (Schneider & Shiffrin, 1977; Shiffrin & Schneider, 1977).
Long-term working memory (LTWM, Ericsson & Kintsch, 1995) is a proposed system joining together the capacity-limited working memory and

33
the unlimited long-term memory. LTWM links these two memory systems together through retrieval structures. The theory of LTWM can explain why we are so efficient in our everyday tasks such as reading, although our working memory can hold only a very limited number of items available for the consciousness at a time and is highly vulnerable to interruptions (Oulasvirta & Saariluoma, 2004). According to the theory, meaningful information, in accord with a vast body of prior knowledge on the subject, is encoded to the LTWM, and the information is encoded into organized systems called retrieval structures (Ericsson & Kintsch, 1995; Oulasvirta & Saariluoma, 2004). These retrieval structures enable fast processing and retrieval of task-relevant information and we need to hold in our working memory only a few elements, which are linked to these retrieval structures. However, it seems that long periods of practice on a task are required for the formation of a vast task-specific LTWM and the related memory skills (Oulasvirta & Saariluoma, 2004).
Our limited information processing capacity has also been suggested to be dynamically changing instead of being of a fixed size. Kahneman (1973) was among the first to suggest that attentional capacity correlates positively with physiological arousal. This means that our information processing capacity can increase if we are motivated to put more effort to the tasks on our focus.
All the above considerations place a substantial challenge for experimental efforts to reveal the presumed general limits of our cognitive capacity (Cowan, 1997; 2005). Cowan (1997) argues that there had not been a single experiment until 1997 showing a successful dual-task performance in which the possibilities of automatization of some task parts or rapid attention-switching between two tasks can be ruled out, indicating the absolute capacity limits of our information processing system. Cowan (2001; 2005) has later presented convincing evidence for the existence of general limits on the working memory system, but still, the same problems of interpretation in dual-task experimentation remain to be addressed.
2.1.2 Evaluation of the significance of the interference mechanisms in the driving task
Perhaps the most significant possibilities of interference with secondary activities while driving can be found between physical, visual, cognitive, and spatial tasks (Wierwille, Tijerina, Kiger, Rockwell, Lauber, & Bittner, 1996; Groeger, 2000). The physical activities of steering, shifting, controlling pedals etc. in the driving task can be interfered with simultaneous secondary manual tasks, such as reaching of a mobile phone or tuning of a radio. However, manual tasks that do not require substantial visual or cognitive effort are often possible to be completed effectively and simultaneously with the driving duties, within the limits of our structural capacity limitations (compare to the use of manual gears, turn signals etc.).
It has been estimated that nearly 90 percent of the driving task related information is acquired through the visual modality (Rockwell, 1972), although perhaps without convincing empirical evidence. However, no one can argue

34
that the visual modality is not important for driving. This is why drivers have to typically time-share visual attention between the driving task and the visual secondary tasks to overcome their visual capacity limitations. This time-sharing means that there is less time to observe the environment. Visual secondary tasks have been systematically noticed to have an effect especially on drivers’ lane-keeping performance (Wierwille & Tijerina, 1998; Carsten & Brookhuis, 2005a). However, secondary displays located visually near the driving scene allow experienced drivers to maintain lane with their peripheral vision while their visual focus is on the secondary display, presumably because the lane maintenance task, or at least parts of it, can become automatized through sufficient practice (Summala, Nieminen, & Punto, 1996).
Cognitive (~mental) secondary tasks, instead, do not seem to affect significantly drivers’ lane-keeping performance, because this nearly automatic behavior seems to be buffered from the cognitive dual-task interference (Carsten & Brookhuis, 2005a; Horrey & Wickens, 2006). There is, however, evidence suggesting that the tasks of vehicle’s longitudinal control (Carsten & Brookhuis, 2005a), hazard perception (Recarte & Nunes, 2003), and reacting to sudden events (Horrey & Wickens, 2006) can suffer under a cognitive load due to secondary tasks. It has been suggested that longitudinal control suffers easily, because active efforts to comply with speed regulations require cognitive capacity (Recarte & Nunes, 2002). Otherwise drivers tend to accelerate towards an optimal speed relative to traffic conditions (Recarte & Nunes, 2002), possibly to sustain a task difficulty homeostasis (Fuller, 2005) while retaining their subjectively sufficient safety margins (Summala, 1988). Cognitive spatial tasks, such as attending spatial locations different from the driving task related locations, could have an interfering effect on the spatial subtasks of the driving task (Spence & Read, 2003; Spence & Driver, 2004; Spence & Ho, 2008).
The capacity-based models of cognitive multitasking interference of cognitive psychology can explain a part of the significant driving related types of interference described above. However, their relevance can also be questioned. For example, what is the relevance of 50-300 ms level phenomena in a discrete dual-task performance, such as the psychological refractory period (Pashler, 2000), for everyday continuous activities such as driving? Although a vehicle traveling at 120 km/h moves 10 meters in 300 milliseconds, this time is very short at lower speeds, which are typical to contexts other than motorways. Safety margins in the driving environment are typically the larger the higher the accepted speed limit in the area. However, these levels of decrease in reaction times are typically under focus in capacity-based laboratory studies on dual-tasking. The value of these types of studies is presumably more in revealing the neural architecture of the human mind (Pashler & Johnston, 1998). In real interaction environments, performance in longer continuous tasks may be better explained by, for example, time-sharing skills and strategies (see Gopher, 1993). Especially in the case of visual tasks the strategic or tactical control of visual attention could be a more powerful explanatory factor than the

35
vague concept of the capacity of visual resources (see Allport, 1993; Gopher, 1993).
One can also question whether the prevailing assumption of the general limit of cognitive capacity is valid. This may be the case with the “pure” focus of attention or working memory (Cowan, 2005), but not when we are talking about skills (Rasmussen, 1987) and task-relevant contents of the related long-term working memory (Ericsson & Kintsch, 1995; Oulasvirta & Saariluoma, 2004). Cowan (2005) points out that the general limits of attention are visible and fairly static across participants if the task is novel for the participants and any memory aids or grouping of elements cannot be used. However, this is rarely the case in real-life dual-task situations. We can ask whether the levels of complexity or workload of a dual-task situation are the same for all the drivers with different backgrounds and, e.g., states of arousal. How to define cognitive workload in a dual-task situation in a comprehensive way and how to define an upper limit for it? How to measure the level of workload in realistic and dynamic driving scenarios? What is the nature of “resources” that drivers can use to handle the workload while driving and dual-tasking?
2.2 Capacity-based paradigm in driver distraction research
In the field of driver distraction research there have been large-scale experimental studies, particularly on mobile phone (for review: Horrey & Wickens, 2006) and navigation system (for review: Green, 1999a) interaction while driving since the 1980s. One general problem in this research is that the effects of secondary tasks on traffic safety cannot be measured directly in experiments or statistically (Tijerina, 2001). Driver distraction is challenging to evaluate, as it cannot be measured the way that, for example, impairment of driving due to alcohol intoxication is measured, i.e., with a single simple measure of blood alcohol concentration (Brookhuis et al., 2003). Brookhuis et al. (2003) note that the multidimensional character of driver impairment (also distraction) renders the concept susceptible to an undesirable level of indeterminacy and ambiguity, which leads to problems in measurement and interpretation. However, the general assumption behind the widely used indirect measures is that the dependent variable(s) can reveal the level of distraction. Let’s take a look at what are the most popular measures, what the basic explanatory concepts are, what kind of results have been achieved in studies, and what kinds of assumptions and possible faults are incorporated in the logic and conclusions of experimental research on driver distraction.
Measures of driving performance
Perhaps the most widely used measures intended for revealing distraction effects of secondary activities are the measures related directly to driving performance either in laboratory, simulator, test track, or on-road studies. These measures also provide an example of the most straightforward way of thinking in a risk analysis related to secondary tasks. The measures of driving
36
performance are often considered as particularly relevant to safety (e.g., Chittaro & De Marco, 2004). The main targets of the analyses relate to secondary task’s effects on drivers’ lateral (e.g, Chiang, Brooks, & Weir, 2004; Horrey & Wickens, 2004; Just, Keller, & Cynkar, 2008), longitudinal (e.g, Chiang et al., 2004; Cnossen, Mejman, & Rothengatter, 2004; Jamson & Merat, 2005), or headway control (e.g, Brookhuis et al., 1999; Blanco, Biever, Gallagher, & Dingus, 2006). From a crash probability point of view, the measures of estimating time-to-collision (TTC) (e.g, Jamson et al., 2004; Jamson & Merat, 2005) or time-to-line-crossing (TLC) (e.g, Brookhuis et al., 2003) are additional options. Naturally the actual frequency of incidents or collisions can also be measured, but these events are typically rare in experimental settings, and, thus, typically unsuitable for parametric statistical testing (e.g, Horrey & Wickens, 2004, Hunton & Rose, 2005).
Lateral control
Variability in lane position or in other driving performance measure is often supposed to indicate decreased control of the driving task, and, thus, reveal unintended behaviors, i.e., lapses of control. Measures of lateral control can involve e.g., the standard deviation of lane (lateral) position (SDLP) (e.g., Noy, 1989; Cnossen et al., 2004; Noy, Lemoine, Klachan, & Burns, 2004; Tsimhoni, Smith, & Green, 2004). Earliest applications involve the study of Zwahlen, Adams, and DeBald (1988) on the effects of CRT (cathode ray tube) touch-screen tasks on vehicle’s lateral path deviation from the centerline of the road. Zwahlen et al. (1988) used dripping dye for indicating the path of the vehicle on an airport runway. The authors concluded that the touch screen tasks placed considerable attentional demands for the driver, and that the development of in-vehicle CRT touch panel controls should be reconsidered and delayed. Since then, measurement techniques have significantly improved. Noy et al. (2004) used SDLP successfully in a driving simulator study to indicate decreased driving performance in three dual-task conditions compared to baseline driving. However, the SDLP did not indicate sensitivity for the secondary task types: no differences were found between a scrolling visual search task using a dash-mounted display, a static visual search task, and a radio tuning task. In another driving simulator study, Cnossen et al. (2004) showed a significant difference in SDLP between driving with a visual map reading task and driving with auditory route guidance messages. As suggested by the multiple resources theory of Wickens (2002), the auditory task affected the lateral control of the vehicle less than the visual map reading task. In this study, SDLP indicated no sensitivity for traffic conditions, namely traffic density that was varied between quiet and busy.
Tsimhoni et al. (2004) compared the distraction effects of speech recognition to those of touch-screen keyboards, with SDLP measures among other metrics in their simulator study. They concluded that SDLP along with other measures of lateral control indicate that address entry with a keyboard has a significantly greater negative effect on vehicle control compared to

37
baseline or speech recognition conditions, but there was no difference in performance between the baseline and speech recognition conditions. Salvucci (2001) utilized the measure of mean lateral deviation for validating the predictions of his computational model of a dialing task’s effects on driving performance on a straight road with a constant speed. Salvucci found that the collected empirical data in a simulator study corresponded fairly well to the model’s predictions and that the model was capable of differentiating between the effects of not dialing, manual dialing (greatest effect), and voice dialing (no significant effects compared to not dialing). These results were similar to those of Tsimhoni et al. (2004).
Horrey, Simons, Buschmann, and Zinter (2006) studied the variability in lane-keeping while conducting mentally demanding tasks in a vehicle overtaking scenario. There was less variability observed in lane-keeping performance in the dual-task condition compared to the baseline driving, possibly suggesting that the drivers were more focused on lane-keeping when completing the mental secondary task. Jamson and Merat (2005, p. 91) defined lane position “as the distance between the offside edge of the front or rear right wheels to the left hand edge of the lane boundary”, and they measured the variation in the lane position for analyzing the effects of two secondary tasks, an auditory mental memory task, and a visual reaction task, on driving performance. The authors observed that for the auditory task, lane position variation decreased with an increase in mental demand, similarly to the study of Horrey et al. (2006), whereas, for the visual task, lane variation increased with an increase in the difficulty of the secondary task. Similar effects on lateral lane position were found by Liu (2001) in a study comparing the effects of auditory, visual, and multimodal displays on driving performance. The author inferred that the visual display used led to less safe driving compared to auditory or especially, multimodal displays. This effect was found for both young and elderly drivers, although the younger drivers performed better as a whole.
Mean lateral lane position as well as lateral acceleration variation (ft/s²) was used by Liu and Wen (2004) in their study of Head-Up-Display’s (HUD) versus dashboard display’s effects on different driving workload conditions. The mean lateral lane position measures indicated no differences between the display types, but the driving performance was observed to deteriorate when the driving workload increased. The workload of the driving situation was controlled by the lane width, road curvature, density of oncoming traffic, number of intersections, and by the density and location (near/far) of roadside buildings. Similar results of the effects of driving task demands on lateral acceleration had been found already by Liu (2003) in studies on HUD displays. The author suggests that HUD will increase driver’s mental load to some extent because of the information provided, even if there were no notable negative effects on driving performance found due to the added load of HUD under high load driving. This could be explained by the observations of Horrey et al. (2006) on mental load’s effects on lateral control. The measure of lateral acceleration used in both of the studies (Liu, 2003; Liu & Wen, 2004) refers to

38
the acceleration created by the centrifugal force that pushes a vehicle sideways, and can, thus, reveal instability of driving (e.g., fast abrupt steering). This measure, among other measures of driving performance, has been used also by Dingus, Hulse, Mollenhauer, Fleischman, McGehee, and Manakkal (1997) for studying the distraction effects of complex visual route guidance system. In addition, the measure of peak lateral acceleration by Blanco et al. (2006) was used to indicate that tasks with multiple decision-making elements are significantly more demanding for the drivers than more conventional in-vehicle tasks, such as activation of the turn signal or adjustment of power mirrors.
Steering wheel movements
Unstable lateral movements of a vehicle can be caused also by other factors than abrupt lateral control of the vehicle by the distracted driver. Thus, control of steering wheel movements is possibly a more sensitive option to evaluate secondary activities’ effects on the lateral control of the vehicle. For example, steering wheel angle variation (in degrees; Liu, 2003; Liu & Wen, 2004), other measures of variance in steering wheel position (McDonald & Hoffmann, 1980), steering wheel angle high-frequency component (Östlund, Carsten, Merat, Jamson, Janssen, & Brouwer, 2004), steering entropy (Östlund et al., 2004), or steering frequency (Brookhuis et al., 1999), are possible metrics of steering control. Steering reversal rate (the number of steering reversals per time unit) was introduced by McLean and Hoffmann (1975) originally as a measure of driving performance and steering task difficulty. Jamson and Merat (2005, p. 92) took the measure straight-forwardly to indicate the level of driver workload; the higher the reversal rate, the higher the workload. It is assumed that besides the increase in driving task demands, the reversal rate can also increase because of diminished level of attention allocated to the steering task due to secondary activities.
Santos, Merat, Mouta, Brookhuis, and de Waard (2005) utilized the steering reversal rate among other measures for studying the differences in results obtained in simulator and low-fidelity laboratory studies. Although the measure was sensitive for the visual secondary task condition in both environments, there were significant differences between the simulator and laboratory study in that in laboratory settings the measure was not as sensitive to the level of visual demands of the secondary task. The same was observed also with other measures of driving performance.
Dukic, Hanson, Holmqvist, and Wartenberg (2005) and Dukic, Hanson, and Falkmer (2006) utilized the measure of variance in steering wheel position in degrees for assessing the effects of push button locations on the dashboard and auditory feedback on button use (Dukic et al., 2005) with an instrumented vehicle in an on-road study. They analyzed the difference between steering wheel angle from the start of the push button task to the end of the task (Dukic et al., 2005), and the difference between maximum and minimum steering wheel rotation angle during the secondary task (Dukic et al., 2006). Dukic et al. (2005) found that the push button location or auditory feedback had no

39
significant effect on these measures, whereas the experiment of Dukic et al. (2006) with slightly modified measure and experimental settings indicated that the greater the eccentricity between the normal line of sight to the driving scene and the button locations, the larger the steering wheel deviations. In addition, older drivers were observed to have a larger total of steering wheel deviations than the younger ones.
Jamson et al. (2004) evaluated the distraction effects of processing speech-based e-mail messages while driving, using the measure of standard deviation of steering wheel angle (SDSWA) to indicate decreases in lateral control. On straight roadways, SDSWA can indicate the periods without steering wheel movement. These periods are often associated with either very low attentional demands of the driving task or with lack of attention to the driving task due to secondary task demands. Jamson et al. (2004) found no effect due to interface type, but significant effects due to driving scenario and secondary task condition on SDSWA. The steering wheel maximum position in degrees, and the steering wheel velocity could be other options for assessing driver’s steering task (e.g., Blanco et al. 2006).
The basic model of explanation behind the steering wheel measures is that drivers make small corrections in normal driving to maintain their lateral position, but when distracted, especially by visual-manual secondary tasks, drivers tend to make larger and more abrupt steering wheel movements to correct their lane position (Young et al., 2008a) or no steering wheel movements at all (Jamson et al., 2004).
Lane excursions
Root mean square deviation from an ideal path (e.g., Just, et al., 2008) is another option for assessing lateral control. However, what is the ideal path, and do all drivers’ try to typically follow it in their everyday driving? From the viewpoint of safe driving, the ideal path could be the center-point of the driver’s lane (e.g., Horrey, Alexander, & Wickens, 2003; Just et al., 2008), or, from an economical/ecological point of view, the inner curve in one's own lane while driving through winding roads. It can be argued that in real circumstances drivers rarely put much effort to the task of keeping optimal driving lines, even though that is often instructed or demanded in experimental settings. Instead, they try to keep their individual level of task difficulty on a comfortable level when driving (see e.g., Fuller, 2005). This issue relates to a more general problem in measures intended to reveal diminished lateral control due to distraction among the driver population. This is the inter-individual differences affecting driving stability. Derivation of instability (Bloomfield & Carroll, 1996; Young & Stanton, 2007) is a measure that is intended to reflect the drivers’ consistency in relation to their own performance, rather than deviation from an absolute measure, and, thus, it is suggested to be a better measure of driving performance than the average level standard deviation. This measure of standard error can naturally be used also for assessing drivers’ ability to

40
maintain stability in other measures of driving performance, such as speed or headway distance (to the front vehicle).
On the other hand, Young and Stanton (2002; 2007) also argued that given the different modern driving techniques, number and duration of lane excursions would be a fairer measure of lateral control in relation to safety effects than instability of e.g., lateral position. Lane excursions (frequency or number, NLE, and duration, DLE) as a measure of lateral vehicle control has been utilized, for example, by Chiang et al. (2004), Noy et al. (2004), Wittmann, Kiss, Gugg, Steffen, Fink, Pöppel, and Kamiya (2006), and Just et al. (2008), among others. Noy et al. (2004) observed that lane keeping was impaired when drivers performed any of the secondary tasks: a radio tuning task, a static visual search task, or a scrolling visual search task. However, as with the measure of SDLP, the task type did not have a significant effect on the duration of lane departures, but there were significantly fewer lane excursions during the static task compared with the scrolling task.
Wittmann et al. (2006) studied the effects of display position while conducting visual tasks and driving. In four of the seven display locations the higher secondary task workload condition led to a significant increase in lane departures compared to baseline. Display position C near the wind shield at the right-hand side of the driver on the dashboard had the shortest DLE. It was significantly shorter compared to the positions B (near steering wheel close to the typical speedometer location), E (low on the dashboard), and G (near the rear-view mirror). The distances between these three locations and the location C were the longest among the seven locations.
Just et al. (2008) studied participants’ lane keeping performance in a low-fidelity driving task while engaged in a concurrent auditory language comprehension task. They concluded that the secondary task had a significant impairing effect on lane keeping performance, measured as the frequency of hitting the berm of the road.
In a field study with an instrumented vehicle, Chiang et al. (2004) evaluated the effects of a touch-screen navigation device use mainly on driver’s visual behavior, but looked also at the participants’ lane-keeping performance. They observed that only 5 lane excursions occurred during the total 3.1 hours of experiments, giving an average of 1.6 excursions / hour.
Santos et al. (2005) utilized also the percentage of lane crossings in relation to the total length or duration of the driven journey for indicating driving performance. The results with this measure were similar to those already referred to above; in laboratory settings the measure was not as sensitive to the visual demands of the secondary task as in a driving simulator. Also Summala et al. (1996) utilized the measure of average distance driven without crossing the lane border as a percentage of the whole track in their comparative study on novice versus experienced drivers’ abilities to maintain lane with peripheral vision while focusing on an in-car task.
An excursion from the right lane can often be classified as severe or minor. Liu (2001) defined a major lane deviation as having occured when the vehicle’s
41
center line crossed either the road central line or the road boundary. However, lane excursions, and especially the major ones, are rare incidents, especially in on-road studies, as illustrated by Chiang et al. (2004). Thus, time-to-line crossing (TLC, where line refers to a line delimiting the lane) (Young & Stanton, 2007), minimum time-to-line-crossing (Jamson et al., 2004), as well as 15th percentile time-to-line crossing (Noy et al., 2004) have been used for assessing the time (i.e., safety) margins the driver is able to keep while dual-tasking.
Combined measures of lateral control
A combination of measures is also often utilized for getting a more accurate picture of lateral control. For example, Santos et al. (2005) used the combination of percentage of lane crossing, mean lateral position, and lateral position variation. In order to observe inappropriate lane keeping behavior due to the effects of visual and cognitive secondary task load, Anttila and Luoma (2005) in their urban field study assessed the lateral movement of the vehicle, lane cuts, driving on a wrong lane, and rapid corrections of direction. They found that the visual secondary task resulted in more inappropriate lane behaviors (65%) than the baseline (87%). Driving with a cognitive task (89%) improved lane behaviors slightly, a finding similar to that of Jamson and Merat (2005) and that of Horrey, Simons et al. (2006).
Longitudinal control
Vehicle’s longitudinal control (i.e., speed control) is another important part of the driving task to ensure safe driving and to comply with the typical regulations of speed on roadways. The metrics related to this type of operational control of the vehicle could reveal impaired driving due to distraction (e.g., Verwey & Veltman, 1996; Horrey, Simons et al., 2006). Anttila and Luoma (2005) assessed drivers’ longitudinal control with the measures of mean, maximum and minimum speed, and variation of speed. Recarte and Nunes (2000) studied the effects of verbal and spatial imagery tasks on drivers’ visual search behavior and speed maintenance among other measures. They found that the participants drove significantly faster in both of the dual-task conditions compared to the baseline, and significantly slower on roads with more traffic and curves compared to roads with less traffic and curvature. They conclude that the results indicate the existence of an optimal speed in relation to the driving task demands that corresponds to minimum use of driver’s resources. The capacity-based explanation for the secondary task’s effects on speed control, according to Recarte and Nunes (2000), is that deliberate (conscious) variation of this speed requires attention to control it, which means that the driver’s longitudinal control diminishes if attention is directed toward other goals, such as mental secondary tasks.
Liu and Wen (2004) noticed that the control of speed was more consistent (fewer speed variations) with HUD than with a dashboard display while performing secondary visual tasks in high-load driving environments.

42
However, the measure of average speed did not indicate significant differences between the use of the HUD and dashboard display on speed maintenance. The authors attributed this finding to the skills of the professional drivers, the sole participants in the study.
Using a low-fidelity simulator, Li and Milgram (2008) measured the maximum velocity difference (defined as the velocity of the vehicle behind minus the velocity of the vehicle ahead) for evaluating a dynamic brake light system designed to reduce rear-end collisions. This type of improved warning system could be helpful in mitigating the negative effects of driver distraction by IVISs. The authors found that the concept shows some promise in making drivers brake sooner in emergency braking situations.
Blanco et al. (2006) used the combination of maximum speed, speed variance, and longitudinal deceleration, for evaluating participants’ longitudinal control. An interesting additional measure of driver’s longitudinal control, indicating the intentions of the driver more accurately than the resultant vehicle accelerations (with a lag), could be the standard deviation of accelerator pedal movement (i.e., throttle control, e.g., Tsimhoni, Yoo, & Green, 1999; Liu, 2003; Wilson, Smith, Chattington, Ford, & Marple-Horvat, 2006; Young et al., 2008a).
Jamson and Merat (2005) found that the drivers in their study compensated for both types of in-vehicle tasks, visual and mental, by reducing their speed. The findings of Haigney, Taylor, and Westerman (2000) and Alm and Nilsson (1994) indicate that when drivers are taking a call, speed reductions often observed with this action cannot be solely attributed to the limited capacities of drivers, but may also indicate the active role of drivers in increasing their safety margins due to the awareness of higher workload (see also Cnossen et al., 2004). However, this decrease of speed can straight-forwardly be utilized as a measure indicating elevated levels of demand by secondary tasks. Liu (2001), Recarte and Nunes (2002), Horrey et al. (2003), Horrey and Wickens (2004), and Liu and Wen (2004) all used the measures of mean speed or variance in speed for indicating the costs of secondary task demands on speed control.
Headway control and safety margins
Santos et al. (2005) included to the longitudinal control measures mean distance headway, and distance headway variation, in addition to the measures of mean speed, speed variation, and standard deviation of speed. Measures of headway control can also be understood as measures of drivers’ safety margins. Other typical measures of safety margins are, for example, those of time-to-collision and following distance (to a front vehicle, e.g., Brookhuis et al. 1999; Strayer & Drews, 2004; Li & Milgram, 2008). Li and Milgram (2008) also used the measure of maximum braking force together with minimum time-to-collision and minimum following distance for indicating impairments in participants’ headway control. Minimum time-to-collision and mean headway to the car

43
ahead in seconds were utilized by Jamson et al. (2004) in their study on the distraction effects of processing speech-based e-mail messages while driving.
Horrey, Simons et al. (2006) used measures of safety margins in order to assess whether drivers increase safety margins tactically when overtaking cars while engaged in a mentally demanding secondary task.. These measures included headway distance, tailway distance, and the number of times that brakes were pressed. The authors concluded that drivers engaged in a mentally demanding concurrent task did not increase their safety margins when overtaking cars. This contrasts with studies that examine steady-state car-tailing (e.g., Strayer, Drews, & Johnston, 2003), and might actually suggest reduced margins of safety (i.e., headway distances) in tactical maneuvering situations. However, one can question whether the driving task was actually “a naturalistic simulated driving task” in the dual-task condition, as the authors claim. In the scenario, the drivers were forced to overtake the front vehicles while engaged in a mentally demanding secondary task. Is it possible, and would it be even more natural tactical behavior, that drivers would postpone overtaking until they had completed the demanding secondary task? The measures of safety margins could be utilized for assessing drivers’ abilities to tactically overcome their capacity limits instead of using them to assess task demands or the limitations of drivers’ attentional resources. However, this study is one of the still rare ones designed to address these questions (for overviews of related studies see: Cnossen et al., 2004; Young, Regan, & Lee, 2008b).
Crashes and incidents
Of course, the number of crashes, near-crashes, and incidents (however defined) can be analyzed to assess elevated crash risks due to secondary activities. However, these types of events are usually rare or even absent in experimental studies that typically last for short times (e.g., Horrey & Wickens, 2004). Hunton and Rose (2005) summed the number of incidents (e.g., speeding, running a stop sign, failing to yield, and following too close) and number of crashes (hits on a person, automobile, or other object) for studying the relative crash risks in conditions of no conversation, passenger conversation, and cell phone conversation while driving in a driving simulator. The authors found that phone conversations demanded more attention and interfered more with driving than conversations with a passenger. Chisholm, Caird, Lockhart, Fern, and Teteris (2007) calculated the frequency of collisions in a driving simulation study in order to determine if iPod use has negative effects on driving performance, and if the possible effects would diminish with practice. They found an increased frequency of collisions during difficult iPod tasks (finding and playing specific songs from 900 titles in the menu) compared to the baseline. Participants’ performance improved significantly with practice, but decrements still remained in the difficult iPod-task condition compared to the baseline.

44
Lane-change-test
Lane-change-test (LCT) is intended as a screening tool for eliminating extremely demanding secondary in-vehicle tasks (ISO 2008; Mattes & Hallén, 2008). The test consists of driving on a simulated straight road with three lanes and system-controlled speed of 60 km/h, while signs at the road bend indicate which lane should be chosen by the driver (ISO, 2008). The participants are instructed to change to the instructed lane as quickly as possible before the sign has passed. The procedure combines reaction time measurements with driving performance measurements. Participants’ performance is assessed by comparing the mean deviation of their path to a normative path (see the discussion above on ideal paths).
Harbluk, Mitroi, and Burns (2009) suggested that the results obtained with the LCT on three typical navigation tasks with three different navigation systems provided some support for the LCT as a test for differentiating between poor and good designs. However, the authors concluded that LCT was insensitive to task demands related to excessive task durations. The authors recommended that a measure of task duration should be included in the LCT procedure. Mattes and Hallén (2008, p. 109) state that the test is not even intended for allowing precise questions asked about the details of system design, but is merely an objective tool filtering out “black from white instead of all shades of gray”. The authors conclude that according to another recent study “the LCT can distinguish among secondary tasks of different complexity” (Mattes & Hallén, 2008, p. 121).
Other measures of driving performance
More contingent and ambiguous measures of driving performance include, for example, the penalty points of Sodnik et al. (2008) and the unsafe driving score of Takayama and Nass (2008). Sodnik et al. (2008) defined the penalty points from unsafe driving such as slight (1 point) or extreme (2 points) winding on the road, slowing down unexpectedly and unnecessarily (1 point), driving on the road shoulders (2 points), or from causing an accident and crashing the car (5 points). The unsafe driving score of Takayama and Nass (2008) consisted of median splits on four measures: speeding incidents, traffic light tickets, center line crossings and road edge excursions. Takayama and Nass (2008, p. 177-178) used also a measure of fast driving that “was measured by how fast the participant completed a standard length, 50 000 foot-long, driving course”.
Another arbitrary, but perhaps more specific way to measure inappropriate driving behaviors was that of Anttila and Luoma (2005). In addition to the recorded behavior, the observer in the vehicle coded the driver’s performance and the traffic situations with respect to several defined dimensions, such as inappropriate yielding behavior and behavior towards vulnerable road users. The authors concluded that proper interaction with other road users, in particular with the more vulnerable road users, such as bicyclists and pedestrians, was impaired while the driver of the car was engaged in a

45
secondary task, visual or cognitive. However, the exact criteria for these behaviors are not explicated in the article of Anttila and Luoma (2005).
Strayer and Drews (2004) assessed participants’ half-recovery time in seconds (the time required to recover 50% of the speed that was lost during braking) for evaluating distraction effects of phone conversation in a driving simulation. The authors concluded that compared to baseline driving, cell phone use slowed participants' reactions by 18%, increased following distances by 12%, and increased the time to recover the speed that was lost after braking by 17%. Younger drivers conversing on a cell phone had their average reactions equivalent to the baseline of the older drivers.
Measures of gap acceptance indicate that drivers accept shorter gaps for joining the traffic in turning situations while engaged in secondary tasks than while focusing on driving (Young et al., 2008a). Situational conditions, such as weather or wet road surface (less friction), seem to be processed to a lesser degree in these situations while using phone (Cooper & Zheng, 2002).
General problems in the measurement of driving performance
As already suggested above, some general problems exist behind the conclusions that are derived from the decreases in the driving performance measures referred to above. Lenneman and Backs (2009) note that the absence of an observed performance decrement does not mean that there are no attentional costs due to dual-tasking. Driving performance measures cannot distinguish between the two alternative explanations for the absence of performance decrements (according to the capacity-based view): i.e., that resources were not shared between tasks, or that the shared resources were not overloaded. Lenneman and Backs (2009) suggest that additional measures may be needed in addition to those assessing driving performance to better assess the attentional costs of IVISs. The measures of driving performance can only provide indirect information on cognitive and visual distractions (Chittaro & De Marco, 2004). In other words, they measure driver behavior indirectly via vehicle parameters, and, thus, do not provide direct information of other aspects of drivers’ behavior, e.g., of allocation of visual attention.
The problem, however, does not necessarily reside in the utilized metrics alone, but in how they are used. There are many examples of studies with speeded secondary tasks which are not self-paced that reveal decreased driving performance and, thus, capacity limitations of the participants. The external validity of the conclusions arrived at in these cases can often be questioned (e.g., Just et al., 2008; Sodnik et al., 2008). The design of Just et al. (2008) included a short tone to signal the participant to respond to a secondary task. A failure to respond prior to the onset of the next sentence was treated as an error in the secondary task. The participants were told in the dual-task condition, that they should attend equally to both tasks, and to respond to the secondary task as quickly as possible without sacrificing accuracy. The driving task was system-paced and imitated by a low-fidelity PC software. Still, the authors concluded (p. 70) that “The findings show that language comprehension performed concurrently
46
with driving draws mental resources away from the driving and produces deterioration in driving performance.” Interestingly, they call their secondary task as merely “listening to someone speak”, and speculate if mere listening to radio can affect driving performance, although their secondary task was actually a comprehension task with speeded manual responses.
Sodnik et al. (2008) compared the effects of auditory versus visual user interfaces on driving performance and on subjective opinions in a low-fidelity driving simulation. The participants were instructed to complete secondary tasks as fast as possible, even when there were curves in the road, and their task completion times were gathered. Unsurprisingly, the authors found that “…both the driving performance was significantly better and the perceived workload was lower when using the auditory interfaces” (Sodnik et al., 2008, p. 318). The participants reported the visual tasks very difficult, dangerous and unpleasant. There are also many other examples in which the participants are required to engage in secondary tasks while driving in demanding driving situations, e.g., in sharp curves or while overtaking (e.g., Tsimhoni et al., 2004; Hunton & Rose, 2005; Horrey, Simons et al., 2006; Törnros & Bolling, 2006). Going even further, Dressel and Atchley (2008) have even recommended that the secondary task should be prioritized over the primary task or instructed to be as important as the driving task in order to reveal the “absolute” possible distraction effects of the secondary tasks by performance operating characteristic (POC) curves. In some testing procedures the participants are left themselves to decide on prioritization of the tasks, but they are instructed to perform them to the best of their ability (e.g., LCT (Mattes & Hallén, 2008)).
In their review, Young et al. (2008a) point out that the sensitivity of the driving performance metrics to secondary task interference typically decreases from simulator studies to on-road studies, possibly because the participants put more priority to the driving task in more realistic environments, where the risk of injury is real. Jamson et al. (2004) compared the effects of two conditions, driver-controlled and system-controlled representation of e-mail messages, on dependent variables. The authors concluded that reading and sorting e-mail while driving can have a negative impact on safety, but these effects may be ameliorated at least to some extent with driver-controlled interface designs. The observed delays of secondary task engagement with the increased complexity of the driving scenario indicated that the participants were sensitive to the manipulation of the driving task demands.
The studies that are not self-paced are important for indicating the capacity limitations of our information processing, but they do not necessarily tell us much about drivers’ real-world abilities to combine a secondary task with driving. Thus, in order to reveal these abilities, experimental designs and conclusions should receive careful consideration regarding what are the possibilities of the participants to utilize their own thinking and pace the interaction with the secondary tasks. These considerations apply especially to simulation studies, in which the danger is not present as in on-road studies, and studies on visual secondary tasks, in which time-sharing of visual attention

47
could provide drivers with an important tactical opportunity to overcome their visual capacity limitations. The driving task should always be the priority number one, if we want to achieve results that could apply also to real circumstances. There is evidence suggesting that drivers are actually quite efficient in prioritizing the driving over secondary activities if they are given the chance (Rockwell 1988; Wierwille, Antin, Dingus, & Hulse, 1988; Wierwille, 1993; Cnossen, Rothengatter, & Meijman, 2000; Rauch, Gradenegger, & Krüger, 2008).
Other significant problems relate to the possible manipulation of driving task difficulty and other confounding factors. The performance decrements in any context are typically a sum of a number of situational and human variabilities that should be taken into account when making conclusions about the external validity of the research results (Dekker, 2002).
What are the circumstances or the difficulty level of the driving task that should be used in these types of experiments? If we increase the demands of the driving task, the total workload of the experimental condition will rise, and the probability for decreases in driving performance will rise as well. However, it has been observed that people typically give up or put less effort to secondary task execution in highly demanding real-world traffic situations and focus more on driving when the demands of the driving task increase (e.g., Wierwille, 1993; Hockey, 1997; Cnossen et al., 2004; Anttila & Luoma, 2005). In addition, if the participants are allowed to control the speed, they can reduce it in situations they interpret as high workload situations. Assuming differences between individuals in the related skills, the interpretation of, e.g., lateral control data can be difficult, because changes in lateral performance should be assessed differently between drivers (Mattes & Hallén, 2008). Horrey et al. (2006) argue that to study drivers’ behaviors (especially those which are tactical) a more representative way than studies testing steady-state behaviors (e.g., car-following) would be examining traffic situations in which drivers’ goals and intentions are constantly changing due to dynamic external factors.
Another important related notion with these measures is how we could define the critical limits of performance decrements observed in experiments (Brookhuis, & de Waard, 2004; Carsten & Brookhuis, 2005a). How dangerous is, for example, a slight variation in lane position in a driving simulation experiment? What should be the reference in-vehicle tasks to which compare the decreases in performance (see Young et al., 2008a)? What is the relationship between the observed decrease in a measure of driving performance in an experiment and the real-world crash risk (Carsten & Brookhuis, 2005a)? In addition, these thresholds should always provide some space for tactical control of the vehicle (Young & Stanton, 2002; Horrey, Simons et al., 2006). For example, the number and duration of lane excursions is a fairer measure for lateral control than lateral instability or time-to-line-crossing. This is due not only to modern driving techniques (Young & Stanton, 2002; 2007), but also to inter-individual differences in motor control and in these techniques. A related question is whether the measures of driving performance should take into

48
account inter-individual, and also situational, differences; i.e., should we have absolute or relative criteria for distracted driving (Brookhuis et al., 2003)?
Measures of reaction time
Reaction time measures are also widely utilized, especially in experiments studying the effects of mental tasks’ interference with the primary task of driving (e.g., Liu, 2003; Horrey & Wickens, 2004; Jamson et al., 2004; Wittmann, Kiss, Gugg, Steffen, Fink, Pöppel, & Kamiya, 2006). The spare capacity to react to sudden events in time is undeniably an important prerequisite for ensuring safe driving (Groeger, 2000). Studies have shown, e.g., that compared to driving only conditions, cell phone conversations increased participants’ reaction times in case of a sudden braking by the car ahead with 18% (Strayer & Drews, 2004).
Object and event detection (OED) experiments involve situations in which the participants have to respond to stimuli occurring either in the form of natural events or objects (e.g., deers) or as artificial signals (Victor, Engström, & Harbluk, 2008). A common challenge for the design of experimental settings is that the reaction tasks should be repeated for a participant in order to get enough statistical data, but in this way the participant may learn to expect the “unexpected” events (Victor et al., 2008). Despite this, OED experiments can give an idea about the driver’s model of the surrounding traffic situation beyond the measures of vehicle control, according to Victor et al. (2008). This information on the driver’s “situation awareness” is arguably quite limited, restricted as it is to a time-window of few seconds at the situations requiring responses.
Both artificial and more ecologically valid reaction tasks have been used in distraction experiments. An example of an artificial detection task is that of Liu’s (2003), in which the participants had to respond to red diamond shaped figures at the left or right side of the road by signaling left or right, respectively.
Another example is the peripheral detection task (PDT) (Jahn, Oehme, Krems, & Gelau, 2005; Patten, Kircher, Östlund, Nilsson, & Svensson, 2006; Victor et al., 2008). In this method, developed originally by van Winsum, Martens, and Herland (1999), a tertiary detection task requiring manual responses for artificial signals appearing in periphery is added to the experimental design alongside the driving task and the secondary task under evaluation (Victor et al., 2008). The rationale behind the method is that the workload of the secondary task, or the level of spare resources, can be assessed by visual tunneling or functional visual field narrowing revealed by reaction times to peripheral stimuli (Jahn et al., 2005; Victor et al., 2008). The current evidence seems to indicate that the decreased detection performance due to higher levels of workload is related to general interference in the processing of all visual stimuli independent of the eccentricity and not on visual tunneling, but the theoretical basis of the method is yet unclear (Recarte & Nunes, 2003; Victor et al., 2008). Recently, following PDT (Victor et al., 2008), tactile (TDT) and visual detection tasks (VDT) have been developed.

49
Although PDT has shown to be sensitive especially to the changing demands of the driving task and secondary tasks (see Jahn et al., 2005; Victor et al., 2008), the ecological validity of the PDT tasks can be questioned. For example, is it necessary for the driver to detect all objects near the road, in particular, if these are not relevant for the driving task? In addition to the nature of the objects, the detection of objects or events at the periphery may also be irrelevant for ensuring safe driving depending, e.g., on the speed of the traveling vehicle, in other words, is there enough time for the obstacle to travel in front of the vehicle. These types of artificial detection tasks are not a natural part, and thus, practiced elements of the driving task (Victor et al., 2008). The study of Jahn et al. (2005) showed no effects by two different display designs on participants’ performance on PDT. All tasks, PDT, TDT, and VDT, have high levels of expectancy. In addition, the tertiary task can be intrusive, i.e., interfere with the driving or the secondary tasks in an unexpected manner.
Lane-change-test (ISO, 2008) is a combination of driving performance and reaction time experiments. The participant is required to react on signs by changing lane to the one indicated in the sign. Response times are not measured directly, but these affect the outcome of the test due to variance from the optimal path. However, the ecological validity of the task can be questioned. In addition, the reaction task has a very high level of expectancy.
More ecologically valid reaction tasks involve, e.g., hazard reaction tasks, such as sudden braking of a vehicle in front or pedestrian crossing (e.g., Summala, Lamble, & Laakso, 1998; Chisholm et al., 2007), speed limit sign response tasks (decelerating or accelerating) (Liu, 2003; Liu & Wen, 2004), or steering response tasks for events such as obstacles on the lane or oncoming lane drifts of an upcoming vehicle (Horrey et al., 2003).
A typical reaction task in driver distraction studies consists of reacting, by braking, to a lead vehicle’s deceleration or braking (Strayer et al., 2003; Jamson et al., 2004; Jamson & Merat, 2005; Zhang, Smith, & Witt, 2006; Victor et al., 2008). A typical dependent variable is the mean brake reaction time from signal onset (e.g, Wittmann et al., 2006). The brake reaction time can be calculated for, e.g., the time of (first) brake pedal pressing or the time of maximum braking force (e.g., Li & Milgram, 2008), or as the time of braking prior to car ahead as a measure of driver anticipation (Jamson et al., 2004). Caird et al. (2008) defined perception as the time from signal onset to accelerator release, and perception response time (PRT) as the time from signal onset to foot contacting the brake. Wiese and Lee (2004) assessed braking performance with the decomposed reaction time measure, which is a combination of accelerator release reaction time, accelerator to brake transition time, and brake to maximum brake transition time. Victor et al. (2008) defined the total brake response time to comprise accelerator release time, movement time (of the foot), and response completion time (pushing the brakes). The earliest indicator of object/event detection can, thus, be the accelerator release time.
Despite the fact that the reaction time measures can provide some indirect indications about the targets of the driver’s attention that require responses

50
(Victor et al., 2008), there is a general problem with these types of measures when we consider the external validity of the observed results. In realistically motivated conditions participants may be able to hold safety margins that allow slight increases to reaction times but still ensure safety. Also the relationship between reaction time measures and real-life crash causation is unclear. The other significant factor to consider, while making conclusions based on reaction time data while dual-tasking, is the expectancy of the targets requiring response in the experimental design (Victor et al., 2008). Design of unexpected but natural events can be challenging. It is important to consider the ecological validity of the artificial reaction time tasks, i.e., should the drivers, from the safety point of view, have the available resources to react to artificial signals at the periphery in the dual-task situations, if these are not natural parts of the driving task while focusing purely on driving.
Measures of visual load (i.e., visual demands)
Driving is, above all, a visual task (Rockwell, 1972). This is why the visual demands of secondary activities can have severe effects on drivers’ abilities to maintain safe driving. Indeed, Wierwille and Tijerina (1998) have shown high correlations between eyes-off-road measures and real-life crash frequency. Also the 100-car naturalistic driving study indicated an association between visual inattention and crashes/near-crash situations (Klauer at el., 2006).
Summala et al. (1996) and Lamble et al. (1999) observed that secondary displays located near the driving scene can help experienced drivers to maintain lane with peripheral vision while focusing on the display. However, the studies also indicated reduced levels of lane maintenance and increases in reaction times to deceleration of the vehicle ahead, as the visual eccentricity of the display from the driving scene and the attentional demands of the secondary task increased. These findings indicate that a glance to an in-vehicle display is rarely without costs for driver’s awareness.
There have been numerous efforts to model drivers’ visual sampling behaviors. The earliest visual sampling models of Wierwille (1993; Wierwille, Antin, Dingus, & Hulse, 1988) are based on a great amount of empirical data and suggest that drivers’ individual glance durations at in-vehicle displays or other peripheral objects vary typically between 0.6 and 1.6 seconds, and show a positively skewed distribution towards short glances. In general, visual sampling models suggest, first of all, that an average, healthy, and experienced driver is capable of dividing visual attention efficiently between the driving task and a visual secondary task, according to the demands of the driving situation (see Rockwell, 1988; Wierwille, 1993; Wikman et al., 1998; Wikman, Haikonen, Summala, Kalska, Hietanen, & Vilkki, 2004). Secondly, the qualities of a secondary task user interface, excluding conspicuity, are generally considered as non-significant minor factors that could influence this time-sharing behavior (Wierwille, 1993; Horrey, Wickens, & Consalus, 2006). Third, visual sampling models predict that drivers are generally aware of their attentional limitations and increase the number of glances to the secondary task

51
display, instead of lengthening glance durations, when the visual demands of the secondary task increase (see Rockwell 1988; Wierwille, Antin, Dingus, & Hulse, 1988; Wierwille, 1993). Based on the data obtained in two experiments, Horrey, Wickens, and Consalus (2006) have built a computational model for predicting drivers’ visual attention allocation while interacting with in-vehicle technologies (the SEEV model, see also Wickens & Horrey, 2008). What is typically missing in general visual sampling models is the detailed relationship between well-defined situational (environmental and in-vehicle task related) factors and the preferred durations of individual glances inside the vehicle. Resulting from this, the models do not describe the detailed properties of the tactical visual sampling models that drivers generally utilize.
Driver’s visual behavior could be quantified by a large number of metrics (see Victor et al., 2008), but the typical measures of secondary task’s visual demands include mean and total glance time (TGT, also total fixation time) off road and the frequency of the glances at the secondary task display or controls (e.g., Chiang, Brooks, & Weir, 2004; Tsimhoni et al., 2004; Dukic et al., 2005; 2006). Victor et al. (2008, p. 142) define glance as “the transition of the eye to a given area, such as a display, and one or more consecutive fixations on the display (or on the area) until the eyes are moved to new locations”. The movement of gaze from the driving scene to the IVIS and back should be scored into the in-vehicle glance duration, according to the SAE definition (SAE, 2000).
Chiang et al. (2004) analyzed the visual demands of address entry to a navigation system by means of a touch screen display in an on-road study. The authors argued that the participants were able to complete the destination entry tasks with acceptably short average glance durations. In a driving simulator study, Tsimhoni et al. (2004) compared the effects of road curvature on TGTs, average glance durations, and number of glances at a touch-screen display. They found that the average glance durations decreased significantly with increasing road curvature, and the total number of glances per address entry on sharp curves increased significantly compared to straight roads. Dukic et al. (2005; 2006) examined the effects of button locations and auditory feedback on driver’s visual behavior in on-road studies with button selection tasks. Auditory feedback did not show a significant effect on TGTs, but the TGT increased significantly as the eccentricity of a button location from the normal line of sight increased. Interestingly, the button located close to the gear stick with the highest eccentricity, produced comparatively short TGTs. In addition to other possible explanations, the authors speculate that this unexpected phenomenon could be a result from the high level of experienced risk associated with the use of controls located so far away from the driving scene (see also Kujala & Karvonen, 2010).
In addition to the analysis of glance durations at in-vehicle displays and controls, e.g, the percentage of task time glancing at the road (Chisholm et al., 2007), and the mean time between glances at the in-vehicle display (e.g., Tsimhoni, Yoo, & Green, 1999; Tsimhoni et al., 2004) can also be analyzed. This information can reveal how much time or visual attention the driver is
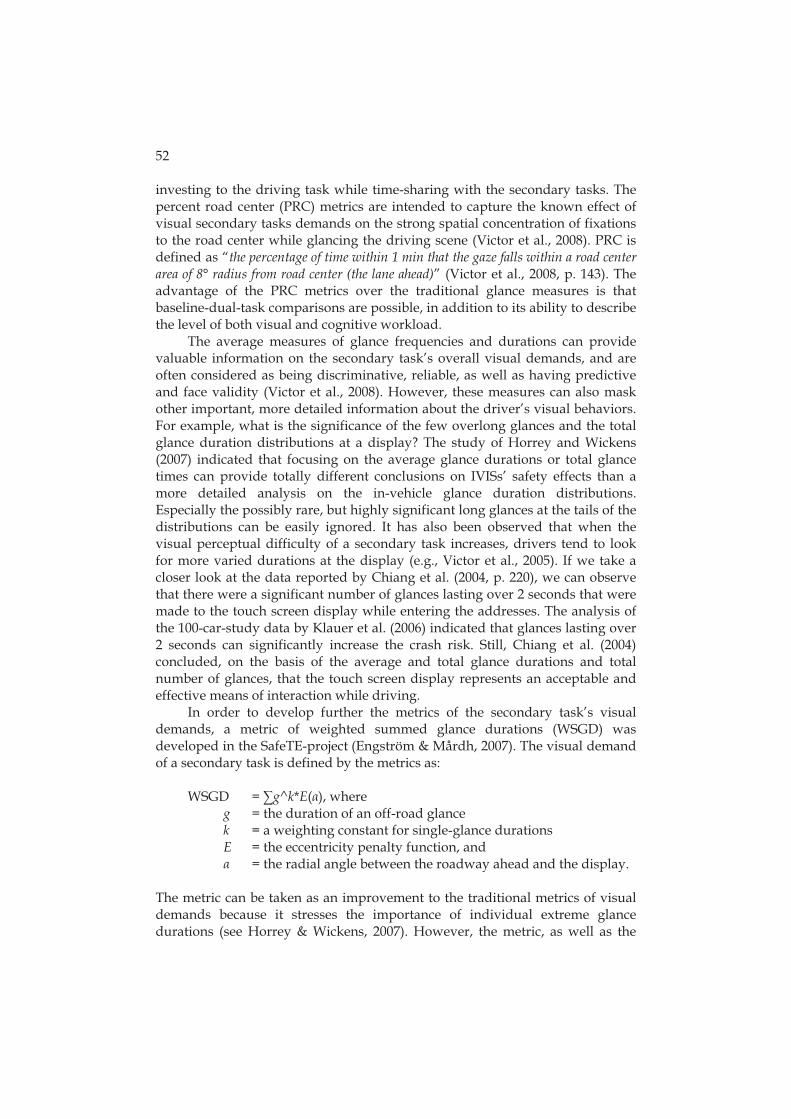
52
investing to the driving task while time-sharing with the secondary tasks. The percent road center (PRC) metrics are intended to capture the known effect of visual secondary tasks demands on the strong spatial concentration of fixations to the road center while glancing the driving scene (Victor et al., 2008). PRC is defined as “the percentage of time within 1 min that the gaze falls within a road center area of 8° radius from road center (the lane ahead)” (Victor et al., 2008, p. 143). The advantage of the PRC metrics over the traditional glance measures is that baseline-dual-task comparisons are possible, in addition to its ability to describe the level of both visual and cognitive workload.
The average measures of glance frequencies and durations can provide valuable information on the secondary task’s overall visual demands, and are often considered as being discriminative, reliable, as well as having predictive and face validity (Victor et al., 2008). However, these measures can also mask other important, more detailed information about the driver’s visual behaviors. For example, what is the significance of the few overlong glances and the total glance duration distributions at a display? The study of Horrey and Wickens (2007) indicated that focusing on the average glance durations or total glance times can provide totally different conclusions on IVISs’ safety effects than a more detailed analysis on the in-vehicle glance duration distributions. Especially the possibly rare, but highly significant long glances at the tails of the distributions can be easily ignored. It has also been observed that when the visual perceptual difficulty of a secondary task increases, drivers tend to look for more varied durations at the display (e.g., Victor et al., 2005). If we take a closer look at the data reported by Chiang et al. (2004, p. 220), we can observe that there were a significant number of glances lasting over 2 seconds that were made to the touch screen display while entering the addresses. The analysis of the 100-car-study data by Klauer et al. (2006) indicated that glances lasting over 2 seconds can significantly increase the crash risk. Still, Chiang et al. (2004) concluded, on the basis of the average and total glance durations and total number of glances, that the touch screen display represents an acceptable and effective means of interaction while driving.
In order to develop further the metrics of the secondary task’s visual demands, a metric of weighted summed glance durations (WSGD) was developed in the SafeTE-project (Engström & Mårdh, 2007). The visual demand of a secondary task is defined by the metrics as:
WSGD = �g^k*E(�), where
g = the duration of an off-road glance k = a weighting constant for single-glance durations E = the eccentricity penalty function, and � = the radial angle between the roadway ahead and the display.
The metric can be taken as an improvement to the traditional metrics of visual demands because it stresses the importance of individual extreme glance durations (see Horrey & Wickens, 2007). However, the metric, as well as the

53
typical metrics of visual load, is not a context-sensitive measure, because it gives the same value for a two-second glance made on an empty, straight road as it does for a two-second glance made in a rush hour on a curved road. Overall, it is possible that the metric provides the same value for a task that requires a large number of short glances and for a task that requires a small number of very long glances. Which one is safer? In addition, the formula gives almost an equal weight for the sum of glance durations, individual glance durations, and the eccentricity of the display from the driving scene, although the significance of very long glances can be emphasized by increasing the constant k. However, there is no general value defined for the constant k. What should this value be? In addition, should the sum of glance durations (i.e., TGT) and individual glance duration distributions be analyzed separately?
Measures of task duration
Task duration without the driving task (i.e., static task time) has been suggested for a measure to evaluate secondary task demands (Green, 1999b; 2004). There is some evidence that static task times correlate well with the total glance times at displays and manual controls while driving (Green, 1999b). However, despite the advantage of being simple measurements, the total task times for completing a secondary task without driving do not necessarily tell us anything about the drivers’ possibilities to effectively combine the driving task with the secondary task. Actually it can often be safer and more efficient to complete a secondary task with a slow pace while driving than trying to complete it as fast as possible (i.e., speed-accuracy trade-off).
The study of Noy et al. (2004) indicated that although two visual in-vehicle tasks did not differ in terms of total task time, there were significant differences in the visual demands found with the occlusion paradigm (see the next subsection) and subjective workload ratings. The authors concluded that task interruptability, besides task durations, should also be considered when assessing the suitability of in-vehicle tasks for time-sharing with driving.
Sodnik et al. (2008) demonstrated that in-vehicle tasks with auditory means can take significantly more time to complete than they would with visual user interfaces, but still, the participants performed better in the driving task during the auditory tasks and rated these as causing less workload while driving than did the visual tasks. Burnett et al. (2004) criticize the measure of static task times on the basis that the link between static task times and the length of single glances while driving seems to be relatively weak. According to the authors, some system designs can support short static task times, but still may encourage casting a few very long glances away from the road, for example in the cases in which dynamically changing information is presented.
Besides the static task times, another option is to measure total task times while driving. The 15-second-rule (Green, 1999b; SAE, 2004) specifies that the maximum allowable task time is 15 seconds for navigation system tasks while driving and using systems with visual displays and manual controls. However, entering a destination to a navigation system, for example, has been observed to

54
take about 30 seconds on average in an on-road study, without significant negative effects on driving behavior, according to Chiang et al. (2004).
The basic assumption behind these types of measures is that task completion times correlate with task complexity, or in this case, the visual demands of the in-vehicle task. They do not provide any information on drivers’ capabilities of sharing visual attention between driving and secondary tasks in time and, thus, on how the IVIS should be redesigned to enable safer interaction strategies and tactical task timing. In addition, it is also highly possible that visual tasks completed in less than 15 seconds can still be very distracting (Tijerina, Johnston, Parmer, Winterbottom, & Goodman, 2000; Burnett et al., 2004; Noy et al., 2004; Foley, 2008). The recommendation for the maximum allowable visual-manual task time may be better than nothing in the sense of guiding to more efficient and safer in-vehicle interactions, but the rationale behind it seems fairly weak.
Occlusion measures and other part-task studies
The occlusion technique (SAE, 2004; ISO, 2007; Foley, 2008) is widely used and provides candidate metrics for assessing any secondary task’s visual demand, and in particular, task interruptability. However, task interruptability is not a well-defined concept. Its approximate meaning is that the secondary task can be easily disengaged and resumed after interruptions that are common while driving and necessary for enabling updates of relevant information in the driving scene (Lee, Regan, & Young, 2008). Following the original technique of Senders, Kristofferson, Levison, Dietrich, and Ward (1967) in determining the visual demands of driving, the standardized occlusion procedure uses goggles or a screen to occlude participants’ visual view to the visual IVIS under evaluation in periods of 1.5 seconds (ISO, 2007). Task completion times are measured as Total Shutter Open Time (TSOT), i.e., occluded intervals excluded. The metrics include a measure for task interruptability, the Resumability (R)-ratio metric, which is calculated as TSOT/total task time unoccluded. R-ratios over 1 are assumed to indicate a cost of interrupting a secondary task while driving. Ratios over 1 should indicate that the task or device may not be well-suited for use while driving because the task cannot be easily interrupted or resumed after the interruption (Foley, 2008).
Despite the merits of the occlusion technique being fast, simple and cost-effective, the technique has been criticized due to its lack of dual-task condition and its insufficient metrics (e.g., Noy et al., 2004; Monk & Kidd, 2007). In particular, the occlusion technique may be limited because it does not involve simulation of the cognitive demand associated with visual sampling of the driving scene during occlusion periods (e.g., Monk & Kidd, 2007). Absence of task-set switch costs (Pashler et al. 2001; Sakai, 2008) and memory effects of interruptions (Oulasvirta & Saariluoma, 2006), as well as participants’ abilities to utilize their iconic and short-term memory while occluded (see Sperling, 1960) are plausible candidates for explaining the absent dual-task costs in the occlusion-based experimental settings. One can also question whether the

55
mental representations, and for example, search strategies of the participants are the same in occlusion experiments as while interrupted at intervals by the driving task.
Further, the validity of the R-ratio for revealing differences in interruptability of different tasks has been questioned (Harbluk, Burns, Go, & Morton, 2006; Tijerina & Kochhar, 2007). Even though the reliability of the occlusion technique, i.e., the repeatability and consistency of the method, has been shown in a recent study to be at a satisfactory level (Gelau et al., 2009), the external validity of the metrics can still be questioned (Lansdown, Burns, & Parkes, 2004; Monk & Kidd, 2007). It seems, for example, that there are visual tasks for which the technique suits poorly (Harbluk et al., 2006; Foley, 2008).
The occlusion technique is intended to simulate visual glances at the road to test the visual demands, interruptability, and resumability of a task. The occlusion technique is a poor method for studying time-sharing of visual attention considering that glance times on each task are fixed and not controlled by the participant, which eliminates any strategic or tactical component. Thus, the value of an IVIS task interruptability test method that does not tell us much about drivers’ abilities to efficiently interrupt and resume (i.e., time-share) the task under testing when coupled with driving can be questioned. Thus, designers should be critical when applying these types of “quick and dirty” metrics when assessing the distraction potential of IVIS prototypes. The actual mechanisms of interaction with IVIS are often very different in the driving context than in a bench test.
Related general problems exist behind all the part-task studies (e.g., Atchley & Dressel, 2004; McPhee, Scialfa, Dennis, Ho, & Caird, 2004; Monk, Boehm-Davis, & Trafton, 2004) that take merely a part of the dual-task situation under scrutiny, as in the occlusion technique or LCT, and try to generalize the results into actual dual-task situations. Part-task studies can provide important information on some limited phenomena in drivers’ behavior, but the findings should be studied also in more natural and holistic dual-task settings, before it can be concluded that the phenomena will work in similar ways in real dual-task situations while driving. For example, the general cognitive capacities (if these exist) are most likely the same, both in part-task situations as well as in more realistic situations, and, thus, are important to reveal, e.g., in part-task studies. However, adaptive utilizations of these capacities may be significantly different in realistic driving situations from those in reduced laboratory settings.
Measures of mental workload
Definition, as well as operationalization and quantification, of mental workload (i.e., cognitive load) can be an extremely challenging task (Gopher & Donchin, 1985; Schlegel, 1993; Wierwille & Eggemeier, 1993; Xie & Salvendy, 2000). According to Kantowitz (2000), driver workload cannot be directly observed but a theory is required in order to infer it by interpreting changes in driver’s behavior. However, the measurement of mental workload (and workload in general) is typically conducted with techniques that can be classified to three

56
categories; performance-based techniques, subjective procedures, and physiological techniques (Wierwille & Eggemeier, 1993). This section will give a brief overview of the performance-based techniques, and the following sections will focus on the physiological techniques and subjective assessments.
The driving performance measures reviewed above provide examples of performance measures that can be taken as indicators of the mental workload generated by the task. The problem in this type of measurement is that it can be difficult to assess how the demands of the task affect the mental workload of the driver beyond externally observable behaviors (e.g., Lenneman & Backs, 2009). Human operator can adapt to increased task demands by investing more effort and resources to a task. Thus, the level of performance does not need to indicate deterioration, although the level of workload or effort gets higher (Schlegel, 1993; Wierwille & Eggemeier, 1993). However, adaptive behaviors can be, in some cases, observed, and, thus, trade-offs in task performance, such as decreases in vehicle speed, have been interpreted as indicators of high levels of workload.
Another option for assessing mental workload generated by a task through performance is to utilize secondary tasks (Schlegel, 1993; Wierwille & Eggemeier, 1993). The rationale is that the level of performance in secondary tasks should indicate the level of workload in the primary task under investigation. A considerable decrease in secondary task performance should indicate that the primary task of a higher priority is requiring a high proportion of the drivers’ resources, and, thus, shows a high level of mental workload (Schlegel, 1993). These kinds of results have been observed typically in tasks that place overlapping demands on driver’s resources, in line with the Wickens’ (2002) multiple resources theory (Wierwille & Eggemeier, 1993).
In driver distraction research, in which we are interested in measuring the combined workload of the dual-task situation while driving, we need to have tertiary tasks, such as PDT (Victor et al, 2008), for this type of analysis (Schlegel, 1993). In the secondary task analysis, and in particular in the tertiary task analysis, the level of intrusion of the additional tasks should be carefully considered (Wierwille & Eggemeier, 1993). The combination of all the tasks should not place such attentional demands for the operator that the dual-task situation would become different from what was intended to be assessed. In addition, drivers’ task prioritization and the resultant trade-offs in performance (e.g., Fitts, 1954) should be controlled or analyzed.
However, it is important to notice that there is no single method that could accurately define the absolute level of the driver’s mental workload in all tasks (Schlegel, 1993). Neither can any single method define the absolute level of the driver’s mental workload in a particular task at all circumstances.
Visual measures of mental workload
Besides the measurement of visual load, the metrics of visual behavior can also be utilized for assessing the driver’s cognitive load (Victor et al., 2008). Functional field of view (FOV) and peripheral detection task (PDT) measures

57
provide examples of metrics that are intended to measure the effects of mental workload on visual behavior (e.g., Nunes & Recarte, 2002; Atchley & Dressel, 2004; Jahn et al., 2005).
The basic idea behind the measures of FOV (e.g., Nunes & Recarte, 2002; Atchley & Dressel, 2004) is that mental tasks lead to a reduction in the size of the spatial region drivers inspect during driving, and the size is related to the level of mental workload. The original idea behind this phenomenon, as well as the idea behind the PDT measures, was that there is a so-called tunnel vision effect of mental workload (Victor et al., 2008). This effect means that the reduction of visual sensitivity and detection due to workload is greater when the stimulus is presented in the periphery than when in the central areas of the visual field. However, there is no evidence suggesting that there is a tunnel vision effect of mental workload (Victor et al., 2008). Recarte & Nunes (2003) studied the effects of mental workload on visual search, discrimination, and decision making while driving, and concluded that there were no tunnel vision effect observable, but the observed reduction of FOV could be a strategic choice to invest more resources to the task of lane-keeping. Indeed, there is a natural tendency to strong spatial concentration of fixations to the road center while engaged in cognitively demanding secondary tasks (Victor et al., 2008). This observation is behind the metrics of spatial gaze variation (PRC) that is intended to measure, in particular, the cognitive load of visual secondary tasks (Victor et al., 2008). However, the reasons for this spatial concentration of fixations to the road centre, improving lane tracking, are yet unclear (Carsten & Brookhuis, 2005a). The effect could be due to strategic choices or simply to that gaze concentration is automatic and unconscious.
Possible metrics of FOV include, e.g., useful field of view (UFOV) measures (reaction times to peripheral stimuli; Atchley & Dressel, 2004), size of visual inspection windows (Recarte & Nunes, 2000), spatial gaze distributions (Nunes & Recarte, 2002), vertical and horizontal gaze direction in degrees (Recarte & Nunes, 2000; Nunes & Recarte, 2002), and gaze variability as the standard deviation in participant’s vertical and horizontal eye positions (degrees) (Recarte & Nunes, 2000; Nunes & Recarte, 2002; Recarte & Nunes, 2003; Caird et al., 2008). Recarte and Nunes (2000; 2003; Nunes & Recarte, 2002) have also used the percentage of fixations on objects (e.g., external/internal mirror, speedometer), and percentage of detected targets in detection and discrimination tasks, as indicators of FOV. In the study of Recarte and Nunes (2002), frequency of speedometer inspection was taken as an indicator of the attentional effort dedicated to speed control.
In addition to the metrics of FOV, PDT, and PRC, pupillary dilation in pixels or in millimeters have been used as an indicator of mental effort or workload (e.g., Kahneman, 1973; Beatty, 1982; Beatty & Lucero-Wagoner, 2000; Recarte & Nunes, 2000; 2003; Nunes & Recarte, 2002). Literature provides substantial evidence on the relation between pupillary dilation and attentional effort, although the measure can also be sensitive for such factors as daylight variations and, thus, not necessarily suitable for on-road testing. Nevertheless,

58
for single-dual-task comparisons in driving simulation studies with controlled lighting conditions, the measure could be valuable for measuring increases in the level of mental workload due to in-vehicle tasks.
Other visual measures of mental workload include, e.g., fixation duration at a target in milliseconds, assumed to increase with the amount of information to be extracted from the target (Recarte & Nunes, 2000; Nunes & Recarte, 2002), and saccadic size reduction in degrees, reflecting the concentration of fixations to a smaller area (Recarte & Nunes, 2000). Besides eye tracking and the reaction time metrics described here there are also other possibilities to assess mental workload in tasks related to visual detection. For example, Strayer et al. (2003) utilized assessments for explicit recognition memory for roadside billboards, and implicit recognition memory for items presented at fixation, in order to evaluate the effects of cell phone conversations on drivers' mental workload, and, thus, on the level of processing of visual stimuli. The authors concluded that the impairment of driving performance produced by cell phone conversations is at least partly due to reduced attention to visual inputs.
Subjective measures of workload
Subjective workload metrics, such as NASA-TLX (Hart & Staveland, 1988) or RSME (Zijlstra, 1993), are intended to give a measure of participant’s experienced level of workload. NASA-Task Load Index (Hart & Staveland, 1988) is probably the most popular subjective metric of workload in driver distraction research (e.g., Horrey et al., 2003; Liu & Wen, 2004; Noy et al., 2004; Wiese & Lee, 2004; Jahn et al., 2005; Sodnik et al., 2008). It comprises six scales related to factors identified as associated to variations in subjective workload: experienced mental demand, physical demand, temporal demand, performance, effort, and frustration (Hart & Staveland, 1988). The original procedure includes weighting of the relative importance of the scales, and gives a weighted score for the experienced average workload for a task (Hart & Staveland, 1988). Reduced versions (no weighting) of NASA-TLX have been shown to give results comparable to the original version (e.g., Byers, Bittner, & Hill, 1989).
Other possibilities to evaluate participants’ subjective experiences on mental effort, workload, or secondary task user interfaces are Rating Scale Mental Effort (RSME, Zijlstra, 1993; e.g., Cnossen et al., 2004), Subjective Workload Assessment Test (SWAT, e.g., Liu, 2001; Wittman et al., 2006), and Questionnaire for User Interface Satisfaction (QUIS, Sodnik et al., 2008). In addition, several non-standardized questionnaires have been utilized. These include a 10-point scale of subjective effort (Nunes & Recarte, 2002), questionnaire of perceived task difficulty and safety (Tsimhoni et al., 2004), and subjective ratings on the ease of device use (Chiang et al., 2004). Liu (2003) used a Likert 5-point scale questionnaire, with 1 indicating ‘very low/dislike it very much’, and 5, ‘very high/like it very much’, in a study evaluating a HUD display. The questionnaire measured the perception of visual effort (amount of visual scanning required), time pressure (amount of time available for completion of driving and the related tasks), and psychological stress (feelings

59
of frustration, confusion, conflict, and anxiety, as well as preferences during and upon completion of each scenario).
The psychometric assumptions behind the subjective assessments of workload have been questioned (e.g., Nygren, 1991). According to Kantowitz (2000, p. 373); “It is easy to ask a driver to give you a number representing subjective workload; there are numerous pitfalls when that number must be understood and used to guide system design and evaluation.” There are also examples of distraction studies, in which the self-reported assessments have not been sensitive measures for differentiating between task demands (e.g., Anttila & Luoma, 2005; Patten et al., 2006). One possible explanation behind the failures of subjective assessments could be that drivers are not aware of their automated, unconscious processes and might also have a low level of awareness of their own performance (e.g., Lesch & Hancock, 2004; Horrey, Lesch, Garabet, 2009). In driving ability evaluations, it has been observed that self-reported information is often not sufficient for determining the person’s ability to drive (e.g., Reimer, D’Ambrosio, Gilbert, Coughlin, Biederman, Surman, Fried, & Aleard, 2005). For example, it is possible that people overestimate their driving skills and abilities in evaluations (see Lajunen & Summala 2003).
Measures of underload
An optimal level of workload in a task resides somewhere between low and high levels of workload (Wickens & Hollands, 2000). In the context of driving, also a low workload level can be very harmful. Systems taking a part of the driving task away from the driver, in order to make driving less effortful or more pleasant, can paradoxically have negative consequences on safety. This can happen if, e.g., the driver’s vigilance on the driving task decreases or the drivers’ attention is turned away from driving due to these systems. In this sense, the driver support systems can distract the driver. These possible negative effects of Automatic Driver Assistant Systems (ADAS) or Driver Support Systems (DSS), as well as other vehicle automation issues are discussed, for example, by Stanton and Young (1998; 2000; 2005) and Young and Stanton (2002; 2007).
Young and Stanton (2002; 2007) have introduced evidence that different levels of driving task automation by the assistance systems affect drivers’ mental workload differently by reducing it. This “underload” has been linked to a decreased level of situation awareness, and, thus, to negative safety effects on driving (Young & Stanton, 2005). The malleable attentional resources theory (Young & Stanton, 2002) suggests that attentional capacity is capable of changing in size in response to changes in task demands, in line with Kahneman (1973). The participants’ attentional effort invested in the driving task and therefore their situational awareness of the driving task demands may decrease due to the low levels of task workload.
Young and Stanton (2002) utilized the measure of Attention Ratio (AR) for assessing drivers’ level of mental workload. AR was calculated from the performance in a secondary task while driving as:

60
AR = STcr /STt, where
ST = secondary task cr = correct responses, and t = time in seconds.
In the formula, the number of correct responses on the secondary task is divided by the total duration of glances directed at that task. A low AR score was taken by Young and Stanton (2007) to imply smaller attentional resource capacity for the driving task. The explanatory logic behind the AR is that the better the performance in the secondary task, the more spare attentional capacity is available due to lower demands of the driving task, and, thus, the lower the mental workload in the driving task. If this model of explanation is accepted, one has to assume, of course, that the drivers are not capable of simultaneously succeeding well in both the secondary task and the driving task of high demands.
Stanton and Young (2005) studied the effects of workload (amount of traffic) and feedback (degree of information from an Automatic Cruise Control (ACC) system) on drivers’ situation awareness among other variables in a driving simulator. The authors measured participants’ situation awareness with the situation awareness rating technique (SART) of Taylor, Selcon, and Swinden (1995). The metrics is simply based on subjective ratings of the participants’ feelings about the state of their situation awareness. It includes three main subscales of demands on attentional resources, a supply of attentional resources and the level of understanding of the situation. The authors concluded that while the ACC system could relieve drivers’ stress and reduce workload, also the drivers’ level of situation awareness was reduced. However, the results also suggested that the drivers’ level of situation awareness in low workload situations due to driver assistance systems can be improved by providing the driver with medium-level feedback of the system’s functioning. Medium-level feedback meant auditory feedback with standard messages on the ACC display in the instrument panel, whereas low-level feedback included mere auditory feedback. The ACC messages on HUD did not significantly improve the ratings of situation awareness.
Brookhuis et al. (1999) provide a list of other means for the measurement of underload, especially for conditions of low vigilance. These are the same as for the measurement of overload, e.g., lateral control, longitudinal control, steering wheel handling, and headway control. In addition, the authors suggest that several physiological measures could indicate low levels of workload (or vigilance) in a more objective manner.
Physiological measures
Kahneman (1973) provided evidence that attentional capacity correlates positively with physiological arousal. In driver distraction research, this is also the assumption behind the physiological measures of workload and effort such

61
as heart rate (HR) and heart rate variability (HRV) (e.g., Brookhuis et al., 1999; Jahn et al., 2005). HR and HRV have been shown to be sensitive to the effort invested to a task (e.g., Mulder & Mulder, 1987; Wilson, 1992). Heart rate can be taken as a global measure of general arousal, whereas HRV is often taken as a more specific measure of mental effort relating to information processing tasks in working memory (e.g., Wilson & Eggemeier 1991; Mulder, Mulder, Meijman, Veldman, & Van Roon, 2000). The general assumption is that when mental effort (i.e., workload) increases, heart rate increases and heart rate variability decreases (Cnossen et al., 2004).
Jahn et al. (2005) compared the sensitivity of physiological measures (HR and HRV), peripheral task detection measures, and NASA-TLX, to task demands in an on-road study with route guidance systems. The results indicated that the HR and HRV measures were less sensitive to workload than PDT or subjective workload ratings and indicated also emotional strain that can be difficult to separate from the data if aiming to assess the level of workload with these measures. In addition, the measures can also be sensitive to physical activity.
Cnossen et al. (2004) found, in a driving simulation study, that HR was not significantly affected by the manipulation of traffic density. However, a route finding task including driving with a traditional paper map resulted in significantly higher heart rates than baseline driving. A working memory (WM) task of calculating verbally presented lengths of traffic queues did not produce significant increases in heart rate, although this WM task significantly increased subjective ratings of workload (RSME). The WM task also increased reported effort more than driving with a map did (measured with the RSME). None of the conditions had significant effects on HRV values.
Besides the HR, more detailed cardiac measures of autonomic control, i.e., pre-ejection period (PEP), and respiratory sinus arrhythmia (RSA), were used by Backs, Lenneman, Wetzel, and Green (2003) in their comparative simulator study assessing the sensitivity of these cardiac, driving performance, and visual occlusion measures, for task workload. The authors suggested that the cardiac measures used in their experiment could potentially be diagnostic of the information-processing demands of driving by providing more detailed information about the mode of control, i.e., isolating the perceptual processing demands from the central and motor processing demands of driving. In addition, they conclude that their results illustrate that no single measure will suffice for the assessment of the driver's mental workload. However, the combined application of physiological and visual occlusion methods could be a powerful research tool to assess the effects of using alternative modalities of information presentation in IVIS on driver workload, according to the authors.
More recently, Lenneman and Backs (2009) analyzed the differences in sensitivity between cardiac measures and measures of driving performance in a driving simulator. According to them, especially physiological measures could be diagnostic of the source of the attentional demands, as suggested also by Becks et al. (2003). Lenneman and Backs (2009) utilized a simulated driving task

62
and a verbal working memory task with two levels of difficulty. The authors concluded that changes in cardiac measures without changes in driving performance measures due to dual-tasking provide evidence that cardiac measures can be sensitive to hidden costs of attentional resource investments that do not manifest in more coarse measures of driving performance (here: lane-keeping and steering wheel angle). The absence of observable impairments in driving performance does not have to mean that the drivers do not have to invest more effort to the total task due to secondary tasks (i.e., higher workload with potential costs for other forms of performance, e.g., reaction times to sudden events).
Brain activation
Conclusions typically derived from brain imaging studies (e.g., functional Magnetic Resonance Imaging, fMRI) while driving provide an example of a modern way of capacity-based thinking (e.g., Just et al., 2008). From decreased activation levels in certain brain areas it is assumed that the processes related to activities associated with these areas are processed to a lesser degree. However, the experiment of Just et al. (2008) provides an illustrative example of the possible faults in this type of explanatory logic.
Just et al. (2008) used fMRI in a low-fidelity laboratory study in order to investigate the effects of concurrent auditory language comprehension tasks on the brain activity on areas associated with the driving task in previous studies (e.g., Walter, Vetter, Grothe, Wunderlich, Hahn, & Spitzer, 2001; Calhoun, Pekar, McGinty, Adali, Watson, & Pearlson, 2002). In addition to the absence of ecological validity of the experimental design already discussed above, the external validity of the conclusions made based on the observed decreases in brain activation can also be highly questioned. Just et al. (2008, p. 75) concluded that “the new findings clearly establish the striking result that the addition of a sentence listening task decreases the brain activation associated with performing a driving task…”. The key word here is association. Even though several human functions have been observed in neuroimaging studies to be associated with activity in certain brain areas, the inner workings of the brain are still poorly understood (see Uttal, 2001). In addition, it would be hard to accept that the “driving task”, although a visual tracking task, of Just et al. (2008) with mouse or a trackball device for keeping a red dot between curving lanes in a narrow computer display with a system-paced static speed, would be anything close to realistic driving, which involves, e.g., tactical maneuvering and control of speed among other well-practiced routines.
Still, this line of research is highly promising, and perhaps in the future will reveal the detailed information processing mechanisms of the brain. However, until that, we should be careful about inferring straightforward causal relationships between decreased levels of brain activation and decreased levels of performance.

63
2.2.1 Common denominators in the capacity-based metrics of driver distraction
The reviewed approaches for analyzing, with experimental techniques, driver distraction by in-vehicle information systems are evidently based on the psychological capacity-based models of human performance in dual-task situations. The general logic behind the experimental designs in this capacity-based paradigm is rather simple. The assumption and aim of the experiments is that the selected dependent variable(s) of performance and/or workload will reveal the level of distraction caused by the secondary tasks and, thus, the level of distraction potential in real circumstances. We can categorize the above reviewed metrics to those measuring performance, either in the primary task of driving, in a driving-related surrogate task, or in a secondary task, and to those measuring workload (demands), in total or of the secondary task (see TABLE 1). Some of the metrics, such as task duration measures, are intended to measure both the level of workload and the related performance in the secondary tasks. However, this classification illustrates that all the metrics are capacity-based in the sense that the experimental logic behind the use of them is based on the capacity-based model of human dual-task performance (see FIGURE 1).
The measures of performance are intended to reveal if the secondary task is so complex or its overlapping resource demands with the driving task are so high that it causes such a high level of workload that there is not sufficient capacity to keep the performance in the measured task at the preferred level (see FIGURE 1). The metrics of performance can be inadequate to reveal elevated levels of workload, and, thus, distracted driving, until a threshold level is reached (de Waard, 2002). Below this level, the measures of workload can be used to describe the level of secondary task induced workload. In this way, the measures can at best discriminate between potentially dangerous interaction models and the less dangerous ones, i.e., the level of potential distraction that can be explained by excessive workload due to high demands on overlapping resources.
The studies have been able to show, for example, that an increase in secondary task or driving task difficulty (i.e., complexity) can increase the observed level of workload (e.g., Nunes & Recarte, 2002; Backs et al., 2003; Lenneman & Backs, 2009) or decrease the level of driving performance (e.g., Recarte & Nunes, 2000; Blanco et al., 2006; Chisholm et al., 2007). However, the capacity-based measures of distraction seem to be more sensitive for the dual-task condition than for the different types or qualities of secondary task interaction (e.g., Cnossen et al, 2004; Jamson et al., 2004; Liu & Wen, 2004; Noy et al., 2004; Dukic et al., 2005; Jahn et al., 2005; Horrey & Wickens, 2007; Lenneman & Backs, 2009). Significant differences have been typically found only between in-vehicle tasks that utilize different sensory modalities or processing stages (e.g., Salvucci, 2001; Tsimhoni et al., 2004; Anttila & Luoma, 2005; Cnossen et al., 2005), as predicted by the multiple resources theory of Wickens (2002), or between such physical factors as display or control positions (e.g., Dukic et al., 2006; Wittmann et al., 2006). The sensitivity of the measures to
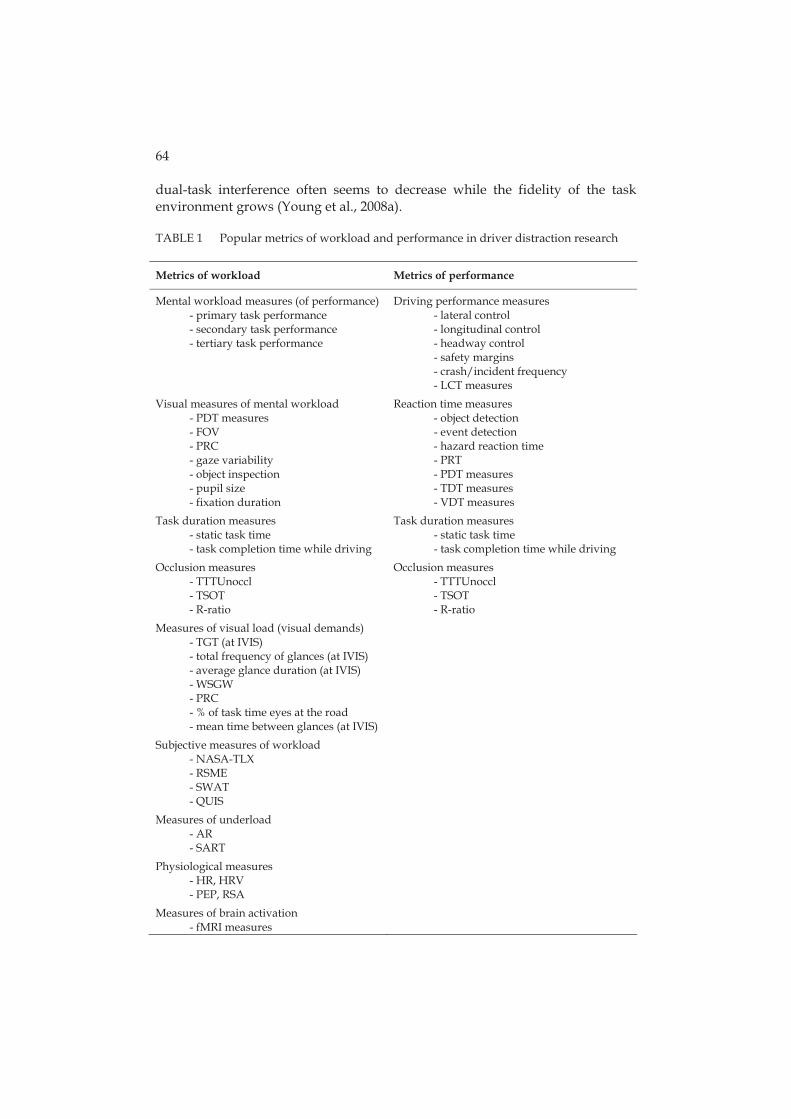
64
dual-task interference often seems to decrease while the fidelity of the task environment grows (Young et al., 2008a).
TABLE 1 Popular metrics of workload and performance in driver distraction research
Metrics of workload Metrics of performance
Mental workload measures (of performance) - primary task performance - secondary task performance - tertiary task performance
Driving performance measures - lateral control - longitudinal control - headway control - safety margins - crash/incident frequency - LCT measures
Visual measures of mental workload - PDT measures - FOV - PRC - gaze variability - object inspection - pupil size - fixation duration
Reaction time measures - object detection - event detection - hazard reaction time - PRT - PDT measures - TDT measures - VDT measures
Task duration measures - static task time - task completion time while driving
Task duration measures - static task time - task completion time while driving
Occlusion measures - TTTUnoccl - TSOT - R-ratio
Occlusion measures - TTTUnoccl - TSOT - R-ratio
Measures of visual load (visual demands) - TGT (at IVIS) - total frequency of glances (at IVIS) - average glance duration (at IVIS) - WSGW - PRC - % of task time eyes at the road - mean time between glances (at IVIS)
Subjective measures of workload - NASA-TLX - RSME - SWAT - QUIS
Measures of underload - AR - SART
Physiological measures - HR, HRV - PEP, RSA
Measures of brain activation - fMRI measures

65
FIGURE 1 describes the capacity-based model of human dual-task performance. Implicitly, it also presents the limits of the approach. With the capacity-based measures of performance, we can differentiate between two types of secondary task interaction of which one exceeds the threshold of critical workload while the other one doesn't (e.g., Tsimhoni et al., 2004; Sodnik et al., 2008). We can also observe an adaptive trade-off in the performance level of one or both tasks, while the limits of available resources are closing in. The measures of workload can describe, with the limitations reviewed above, the position of the interaction on the workload-axis. Workload measures can, thus, at best, differentiate between two types of interactions at the level of workload involved, but their explanatory power is limited to this. Thus, the two types of capacity-based metrics are insufficient for differentiating types of interactions according to their other qualities. In capacity-based experiments, we are trying to quantify the level of workload, or to quantify the related performance decrements. These measures, while utilized in capacity-based experimental designs, cannot describe the rich qualities of the interaction. This qualitative information might, nevertheless, provide additional, more detailed understanding of the distraction potentials of system use while driving. Apart from the mere workload (i.e., demands) of the interaction there are certainly other safety-related aspects of interaction between the driver and IVIS. IVIS’s support for tactical timing of tasks provides one crucial example (Lee et al., 2008).
This limitation of explanatory power is involved also in the measures of underload, and its effects on situation awareness, although the logic of explanation is somewhat different there. The attention ratio of Young and Stanton (2002) refers to low level of workload as a cause for the decreased level of attentional effort put to the primary task of driving. This decreased level of effort means that less processing capacity is used for the driving task, which can cause, among other impairments, a decrease in the level of situation awareness. This can be observed e.g., as increased reaction times to events or in subjective ratings as regards the quantity of objects in the environment the drivers are aware of.
The effects of behavioral adaptation, such as voluntary headway increases and speed decreases while dual-tasking, or negative consequences of decreasing safety margins due to new safety systems, are generally acknowledged among the researchers in the field (e.g., Brookhuis et al., 1999; Cnossen et al., 2000; Haigney et al., 2000; Cnossen et al., 2004; Santos et al., 2005). By behavioral adaptation, I do not refer merely to the effects of learning, but to the almost instinctive ways people adapt their behaviors under stress or high levels of workload (Hockey, 1997). This phenomenon further undermines the explanatory power of the capacity-based measures. The results of Cnossen et al. (2000) indicate that drivers are able to achieve a high level of driving task performance while involved in secondary activities by means of behavioral adaptation involving strategic choices if they are allowed to utilize them in the experimental settings. From a larger perspective, Tijerina (2001) points out that

66
we should also look at the frequency of device use that can increase due to behavioral adaptation to apparently safer interactions (see also Summala, 1996).
Behavioral adaptation is still quite poorly understood and investigated phenomenon especially in dual-task experimental research (Young et al., 2008b). Often there are speculations about the presence of adaptive strategies (e.g., Liu, 2001; Horrey et al., 2003; Hoffman, Lee, McGehee, Macias, & Gellatly, 2005), but the participants are rarely, for example, interviewed to find out if they are aware of their adaptive strategies. Neither are experimental designs typically designed in a way that questions on this aspect of drivers’ behaviors could be addressed. The results of the existing research seem to be somewhat controversial, suggesting that drivers are able to efficiently recognize their capacity limitations and adjust their behaviors accordingly (e.g., Cnossen et al., 2000; Drews, Pasupathi, & Strayer, 2008) or not (e.g., Cnossen, et al., 2004; Horrey, Simons et al., 2006; Horrey & Simons, 2007). Among others, Carsten and Brookhuis (2005a) report a greater concentration of glances on the road ahead while mental load of the secondary task increases. They speculate that there are two possible explanations for this phenomenon observed in several studies (e.g., Brookhuis et al., 1999; Horrey, Simons et al., 2006; Jamson & Merat, 2005). One possible explanation is a conscious adaptation for task demands to maintain stable lateral control, the other is that the gaze concentration is automatic and unconscious, i.e., drivers are simply aiming at the point they are gazing. There is no significant evidence at the moment for either explanation.
Another issue relates to the effects of the research environment on the sensitivity of performance measures, e.g., of driving performance (Young et al., 2008a). It has been observed in several studies that the higher the fidelity of the driving environment and task (from low-fidelity simulator to on-road studies), the less sensitive the driving performance measures are for secondary task distraction. The external validity of the results, however, is improved as the fidelity grows. Young et al. (2008a) suggest, first of all, that this reduced sensitivity is due to absence of the risk of injury or property damage in simulated settings, and the resultant greater effort and prioritization of the driving task in more realistic settings. Other explanations could include, e.g., the greater measurement noise (uncontrolled variables) of on-road studies, or the lack of certain forms of feedback in low-fidelity environments, such as vestibular information on vehicle movements (Young et al., 2008a). Another possible explanation might be related to the difference between interactions that are often paced by the system or by the experimenter in simulators compared to the self-paced tasks in on-road studies. However, to answer these questions and to reveal the mechanisms of behavioral adaptation in more realistic dual-task conditions, we require new types of experimental designs applying new types of theories and measures.
Because of the reasons reviewed above among other things, Carsten and Brookhuis (2005a; 2005b) as well as Tijerina (2001) point out that it is a great challenge to develop a test regime for assessing distraction potential of IVIS. Observed improvement in steering related measures during secondary

67
activities may suggest either that the activity is safe or perhaps that the mental workload of the task is so great that the driver is concentrating on the lane-keeping with the cost of decreased time for observations of the surrounding scene. Obviously, a single measure, such as variance in lane maintenance (see Lenneman & Backs, 2009), or task time occluded (see Noy et al., 2004), is not alone sufficient to reveal an increased crash risk while being engaged in a secondary task involving manual, visual, and cognitive elements in realistic environments (Tijerina, 2001; Carsten & Brookhuis, 2005a). There have been numerous efforts to develop methods comprising multiple measures of performance that could be used for grading the distraction effects of IVIS (e.g., Brookhuis et al., 1999; Brookhuis et al., 2003; Green, 2004). An additional challenge with these types of metrics is that if the grades are based on average scores in a group (e.g., Hoedemaeker & Janssen, 2000; Green, 2004), some very bad scores of a few participants could be ignored. However, to ensure safety it is important that the whole population of drivers is able to use the systems in all circumstances without significantly elevated crash risks.
It is also a challenging task to develop a standardized test environment and driving/interaction scenarios in order to enable reliable comparison of a secondary task induced workload and performance decrements observed with different IVISs (Young et al., 2008a). A single scenario would be necessary for reliable comparison between designs, but the immense variability of different driving scenarios and the related demands (i.e., workload) in the real world would require a vast number of different scenarios to enable a high level of external validity for the results (see Santos et al., 2005). Self-paced interaction and driving, which would enable still greater external validity, would provide even more degrees of freedom to the experimental designs and scenarios. The observed distraction effects should be compared to some reference secondary tasks, of which safety effects in the real world are known, to get more reliable information about the potential risk of engaging in the secondary task under evaluation (Young et al., 2008a). Young et al. (2008a) note that these tasks should place demands, which are similar to the demands placed by the evaluated secondary task, to the driver to enable valid comparisons. This is to say: a mental reference task for mental tasks, and a visual-manual reference task for visual-manual tasks. However, it is hard to find “similar” reference tasks, because the “resource” demands, or more precisely the qualities, of the interaction can be different for any two tasks.
In addition, the typical capacity-based operationalizations of driver distraction are not situation-dependent, i.e., metrics do not vary as a function of task characteristics, and, thus, do not take into account the variability of the driving context. In particular, the measures of visual load (i.e., visual demand) do not take into account the constantly changing visual demands of the driving situation (e.g., Chiang et al., 2004). The measures of visual workload typically include mean glance duration, total glance duration and the number of glances at the in-vehicle display (Chittaro & De Marco, 2004; Victor et al., 2008). However, even one prolonged glance to an in-vehicle display can be dangerous,

68
in a wrong situation and when coupled with other confounding factors (Klauer et al., 2006; Horrey & Wickens, 2007). The study of Horrey and Wickens (2007) points out that the traditional statistical procedures focusing on expected mean values and other measures of central tendency of in-vehicle glance durations can be insufficient for analyzing safety effects of visual IVISs. This is because the safety-relevant tails of glance duration distributions can be left unanalyzed.
Generally, the capacity-based research paradigm is searching for general limits of drivers’ capacity to handle dual-task situations or capacity-based explanations for dual-task performance, for legislative or testing purposes (see e.g., Brookhuis et al., 1999), or for developing distraction mitigation systems such as workload managers (e.g., Zhang, Smith, & Witt, 2008). Multiple measures are often applied, but these are still typically lacking power of expression. The capacity-based measures, such as the measures of driving performance, are insufficient for providing us detailed qualitative information on what particular features of IVIS interaction can induce potential risk of distraction, in what circumstances, and why, and for example differentiating between distraction effects of different in-vehicle display properties (e.g., Horrey & Wickens, 2007). None of the presented metrics are in direct relation to drivers’ thinking and mental representations guiding their attention and, thus, cannot provide reliable information on these important aspects of human behavior. This is why the particular effects of different IVIS designs on these aspects of human mentality are difficult to analyze with these metrics. In addition, the capacity-based experimentation does not give guidance on how the development of dual-tasking skills and positive behavioral adaptation could be supported through interaction design.
One reason for the insufficient power of expression of the capacity-based metrics and theories could be that the concepts of cognitive capacity, workload, resources, and task complexity are difficult to define and quantify accurately in experimentation even by the theorists working in the field of cognitive psychology (see Section 2.1.). Workload can be described as an operator’s response to the demands or the complexity of a task (e.g., Huey & Wickens, 1993). The general assumptions are that workload is related to the difficulty, number, rate, or complexity of the demands imposed on an operator, or to the number of errors or to the level of control precision in a task (Huey & Wickens, 1993). Typical examples of general assumptions behind the experimental logic in the capacity-based research are that task complexity correlates with task completion time, and that the level of distraction correlates with secondary task complexity. However, the level of demands, complexity or difficulty of a task is not the same for all the drivers (Huey & Wickens, 1993). In what circumstances and for what kinds of operators task complexity should be measured? What does task complexity exactly mean in this context?
If it would be enough to decrease the complexity of the interaction with IVIS, standard usability tests and heuristic analyses (e.g., Nielsen, 1993; Burns, Trbovich, Harbluk, McCurdie, 2005) on IVIS could suffice to reveal the level of complexity (e.g., task times and frequency of errors) and indicate when the

69
workload of the secondary task could somehow be reduced. However, the dynamic context of use, the driving task and the resultant dual-task condition bring additional requirements for the interaction and for the driver. As discussed in Section 2.1., there can be multiple factors contributing to the “workload” or “complexity” of a dual-task situation. There are several possible sources of dual-task interference, of which several depend on particular mechanisms, such as the similarity of stimulus contents of the information being processed in the two tasks (e.g., Hirst & Kalmar, 1987). In many experimental case-studies, a detailed analysis and more specific theories of the sources of interference with particular pairs of tasks could be more informative than the mere observation of dual-task costs and the superficial explanation that drivers’ information processing capacity was overloaded due to excessive amount of workload on the same resources.
In addition, the problems reside not necessarily in what we are trying to measure, but often in the experimental designs in which the metrics are used. As reviewed above, the metrics of driving performance may well reveal performance decrements in speeded task settings that are not self-paced, but the ecological validity of these types of experimental conditions is usually poor. These types of studies may reveal the capacity limits of drivers in dual-tasking, but in more realistic circumstances the drivers may well be (or can easily learn to be) aware of these limitations and able to overcome these with e.g., efficient time-sharing strategies and behavioral adaptation (e.g., Cnossen et al., 2000).
The same problems related to the lack of ecological validity concern the experimental settings of part-task studies, in which especially visual in-vehicle displays and manual controls are often tested. The industry seems to have an obsession for “quick and dirty” metrics of driver distraction, such as the 15-second-rule (SAE, 2004), the occlusion technique (ISO, 2007), and the lane-change-test (ISO, 2008). These test methods can be cost-effective and fast compared to larger scale studies including driving simulation or actual driving with more laborious methods, but the value of the results of these more effortful experiments for the product development can be at a totally different and more useful level via the increased understanding of causal real-world relationships. The part-task methods can be used as screening tools for eliminating real bad designs, and are, thus, valuable for the practice. However, the results do not tell us much about what the causes are for the observed low or sufficient scores, or how the designs could be improved to enable better scores. In addition, the absence of a realistic driving task in these methods can lead to significantly different conclusions about the suitability of a visual design that is to be combined with driving when compared with conclusions inferred from studies involving dual-tasking with actual or simulated driving (e.g., Monk & Kidd, 2007). Neither can heuristic evaluations (e.g., Burns et al., 2005), general guidelines (e.g., CEC, 2006), or computational models (e.g., Kushleyeva, Salvucci, & Lee, 2005; Salvucci, Zuber, Beregovaia, & Markley, 2005; Horrey, Wickens, & Consalus, 2006) for the IVIS designers be effective until we have a more theoretical and detailed understanding of what particular qualitative

70
design features can have negative effects on drivers’ behavior, what kinds of negative effects are they and, most importantly, why. Before this detailed understanding has been achieved, the development of computational dual-task models of the driver will be necessarily curve fitting versus mathematical modeling, with conceptual integrity and identifiable parameters (see Kantowitz, 2000).
Interestingly, Carsten and Brookhuis (2005a; 2005b) discuss in their overviews of the European Union’s HASTE project, aimed for developing the guidelines, metrics and methods for assessing IVISs’ safety effects, the importance of the work from a point of view of “information overload”. The two main questions (2005a, p. 191) addressed in the project are: “Does greater secondary task load from an In-Vehicle Information System (IVIS) lead to an identifiably worse performance in the primary task of driving?”, and “How much distraction is too much?”. They see the problems from almost purely quantitative point of view, i.e., the core problem resides in that the drivers will get too much information at one moment, and, thus, there is too much workload. The answer to this problem, according to Carsten and Brookhuis (2005b), is that the amount of information has to be adapted to the traffic situations and road-user requirements. In other words, only the required “dose” of information should be given to the driver at any given situation. But is the problem solely due to the amount of information? What about the qualities of the information and its presentation? Couldn't the qualitative aspects of information presentation in dual-task situations be as important as the amount of the presented information? Let me specify: there is nothing wrong with quantitative metrics, after all, they can assure the objectivity of the evaluations better than subjective metrics. But if we are measuring the level of workload (demand) or its effects on driving performance, are we measuring the only relevant targets in this context? Could there be additional quantitative measures for the evaluation of the qualitative aspects of the interaction with IVIS? A particular style for displaying song title data for the driver by a car audio system can provide an illustrative example of these issues. Which is a better way to represent the information to the driver: the song title visible as long as the song lasts or a once scrolling text at the beginning of the song? The latter provides the driver less information, but on the other hand, it forces the driver to look at the display at a certain moment in order to get the desired information.
2.2.2 Distraction as a breakdown of operational control
One explanation for the insufficient explanatory power of the capacity-based theories and measures relating to interaction design could be that the measures are not indented to provide advice on how to redesign particular qualitative interaction features. The metrics can help in the deciding of which kind of devices or in general, types of interactions, should be banned while driving. This is if there is a severe reduction in driving performance or high levels of workload observed in the dual-task experiments compared to some reference task. The measures and experimental designs are intended to reveal critical

71
levels of workload or performance decrements that can be associated with reduced traffic safety. As such, these measures can reveal the potential of distraction as a breakdown of operational control of the driving task (after Lee et al., 2008). The basic idea of the capacity-based approach to driver distraction is, thus, to see the distraction as competition over driver’s limited resources (see Figure 2).
Driver distractionOverlapping and
overloadingresource investments
OperationalizationMetrics of Model
Task performance
Workload
Capacity overload of information processing
resources(breakdown at the levelof operational control)
FIGURE 2 Capacity-based model of driver distraction
If one exaggerates, this view on driver distraction can be seen in a sense as a behaviorist model of explanation. Radical behaviorism, which is a philosophical theory of psychology, assumes that human behavior can some day be completely explained with stimulus-response laws or laws of learned behavior that connect circumstances and actions (Mills, 1998). Although there are mental components inside the “black box” included in the capacity-based explanations, such as attention and the multiple processing resources by Wickens (2002), the driver is typically handled as a passive black box possessing the resource pools with limited capacity (see Young et al., 2008b). In experimental conditions, a capacity-oriented experimenter will try to overload these pools with additional tasks. If interference is found, the pools will overflow with the consequence of decreased performance in the task(s) or high level of observed workload. It is assumed that from the level of deterioration or workload it is possible to evaluate the potential distraction effects and, thus, risks of system usage while driving. However, as discussed in more detail above, this approach neglects some important aspects of human behavior. The explanation at this level is that the driver’s attention was elsewhere and not where it should have been at the critical moment, because there was not enough capacity or spare resources to deal with the right target(s). This model of explanation cannot provide information on where driver’s attention was at the moment and, in particular, why.
In the field of traffic psychology it has been recognized for long that there are additional levels of control available for the driver in real traffic situations besides the operational one (e.g., Michon, 1985; Keskinen, Hatakka, & Katila, 1992; Ranney, 1994; Summala, 1996; 1997; Keskinen, Hatakka, Laapotti, Katila, & Peräaho, 2004). According to the hierarchical models of driving (e.g., Michon, 1985; Keskinen et al., 2004), control of the vehicle is just one subtask of driving. Driver’s tasks are typically divided to strategic level tasks (e.g., route planning),

72
tactical level tasks (e.g., maneuvering through traffic situations, choices on speed), and operational level tasks (e.g., lateral and longitudinal control of the vehicle). An important aspect of these models is that the levels of control can interact with each other (e.g., Michon, 1985). For example, tactical maneuvers of overtaking are influenced by the strategic decisions on general goals of, e.g., safe driving. Michon (1985) and Lee et al. (2008) connect the different levels of control also to different timescales. Operational control occurs at a timescale of milliseconds to seconds, tactical control occurs at a timescale of seconds to minutes, and finally, strategic control of the driving task occurs at a timescale of minutes to weeks.
A novel complementary approach for evaluating driver distraction at several levels of dual-task control has recently been suggested by Lee et al. (2008). That approach is based on Michon’s three-level cognitive control model (1985). According to Lee et al.’s (2008; see also Lee & Strayer, 2004) framework, at the level of tactical control, which is above the operational level of lapses in vehicle control, distraction can be defined as a failure of secondary task timing in relation to the driving situation. At the level of strategic control, distraction is defined as inappropriate priority calibration between driving and secondary tasks, i.e., inappropriate willingness to engage in secondary activities.
This theoretical framework of control theory applied to dual-task situations while driving induces new types of questions related to the measurement of in-vehicle information systems’ effects on driver distraction. We might ask, for example, how to measure driver distraction at the levels of tactical and strategic control in experimental settings? Breakdowns at the tactical or strategic level of control are not necessarily in direct relation to breakdowns at the operational level of control (Lee et al., 2008). However, better tactical and strategic decisions could reduce breakdowns at the level of operational control. Drivers’ situation awareness, awareness of task demands and their capabilities are factors that can presumably have a great effect on drivers’ strategic and tactical abilities. If the driver is aware of one’s own capacity limitations and task demands, is that driver able to overcome the limitations with strategic and tactical thinking? How to measure or support the awareness of task demands through IVIS interaction design? How to measure drivers’ situation awareness and tactical behaviors particularly in dynamic situations? While the level of situation awareness cannot be explained exhaustively by the sufficient or insufficient level of resources or capacity of awareness, the contents of awareness, i.e., of what the driver is aware of, is an additional explanatory factor to be kept in mind (Jones & Endsley, 1996).
User interface designs for in-vehicle information systems can potentially have a great impact on drivers’ abilities to maintain a high level of situation awareness and to utilize tactical thinking to overcome their information processing capacity limits (Lee et al., 2008; Young et al., 2008b). This leads to additional, yet unsolved questions related to in-vehicle user interface design and testing. What are the in-vehicle system designs like that could support drivers’ skills to prioritize driving over secondary tasks and to time-share

73
attention efficiently between the two tasks? For example, secondary task predictability, interruptability, resumability, and ignorability, can all have an influence on drivers’ time-sharing efficiency and tactical as well as strategic abilities (Lee et al., 2008; Young et al., 2008b). The importance of these aspects for traffic safety has been acknowledged (SAE, 2004; CEC, 2006; ISO, 2007), but the existing guidelines do not explicate how to measure these in a satisfactory manner and what kinds of particular design features or task attributes can contribute to these and how.
The review above indicates that the capacity-based metrics lack sensitivity to adequately reveal the effects of user interface design features on drivers’ thinking and on related behaviors, such as situation awareness, task strategies or allocation of visual attention. Neither can these measures give sufficient insights to secondary task attributes, such as task predictability, interruptability, resumability, or ignorability, which can affect tactical timing of activities. The capacity-based measures and experiments can reveal lapses or adaptive changes in the operational control of the vehicle, attributing them to excessive amounts of workload. However, these aspects of dual-task performance do not necessarily indicate drivers’ tactical and strategic abilities, which are extremely vital in real traffic situations. It is important to see, that a failure at the tactical or strategic level processes does not necessarily manifest as a breakdown of the vehicle's operational control or as an elevated level of mental workload. Still, these failures cannot be regarded as non-relevant among factors contributing to crash risk (Lee et al., 2008; Young et al., 2008b).
3 FROM CAPACITY TO MENTAL CONTENTS
As illustrated above, there are multiple phenomena in human behavior that cannot be reached by the capacity-based analyses of performance or workload. In addition, there are very relevant questions, which cannot be discussed in a capacity-based theory language. The concepts of cognitive capacity, mental workload, and resources themselves seem to be difficult to define, operationalize, and measure. The main question arising from the analysis presented in the previous chapter is: could there be alternative, complementary theoretical languages for describing, assessing and measuring driver-IVIS interaction on a more detailed level than the capacity-based measures do? These new perspectives should significantly increment our knowledge about the mechanisms of driver-IVIS interaction. Of special importance would be the knowledge about new types of operationalizations for addressing the question of how to find ways to design safer driver-IVIS interactions. In this section, a candidate approach for satisfying these needs is introduced and discussed. Six original articles are presented in order to provide empirical support for the novel approach and to further indicate the limitations of the capacity-based paradigm. New types of metrics are inferred from empirical studies and introduced as tools for the novel experimental paradigm in the context of evaluating in-vehicle tasks involving visual elements.
3.1 Mental contents and apperception
Content-based psychology is in essence the study of mental contents, i.e., the elements and construction of the information contents of mental representations from the viewpoint of intentionality and functionality (Saariluoma, 1997). The construction of mental representations is referred to as the process of apperception, and it is based on the fact that something is always added to our perceptions by our mental machinery (Kant, 1781/1998; Saariluoma, 1990; 1992; 1997).
The basic assumption of the content-based analysis of human action is that mental representations control human behavior. This is, of course, also one of the basic assumptions of modern cognitive psychology. The functions of mental representations have been a theme in discussions of human behavior from the

75
very beginning of cognitive psychology (see e.g., Newell & Simon, 1972; Allport, 1980). A number of important concepts have been introduced to theoretically capture what mental representations are. Typical conceptualizations include schemas (Neisser, 1976), productions (Newell & Simon, 1972; Anderson, 1976; 1983a; 1983b; 1993), frames (Minsky, 1975), mental models (Gentner & Gentner, 1983; Johnson-Laird, 1983; Moray, 1996), and semantic memory and semantic networks (Collins & Quillian, 1969; Anderson & Bower, 1973). Some of these conceptualizations have been applied to the analysis of driver behavior in various forms by different authors as follows: schemas (e.g., Wikman, Nieminen, & Summala, 1998), productions (e.g., Salvucci, 2005), mental models (e.g, Kantowitz, Lee, Becker, Bittner, Kantowitz, Hanowski, et al., 1996; Stanton & Young, 2005), and the theory of inner models (Mikkonen & Keskinen, 1980).
Content-based psychology makes some additional assumptions. First of all, the information contents of mental representations, or mental contents in short, can be used to explain human behavior. For example, mental contents can be used to explain why drivers in certain situations behave as they do. Of course, this does not mean that all the problems of human-technology interaction could be explained by mental contents. Instead, it means that there are many questions, which can be best analyzed in terms of mental contents. Content-based psychology offers a theoretical framework for asking new types of questions concerning human behavior in human-technology interaction. By analysing, on a more detailed level than the traditional research has done, the contents and construction of drivers’ dual-tasking models we could be able to create better design guidelines for safer in-vehicle interaction to support the development of proper models.
The concept of apperception in its current sense was coined by Immanuel Kant (1781/1998) in his famous analysis on the limits of pure reason. Kant’s Copernican revolution in epistemology and metaphysics consisted of the idea that the human mind is not a passive receiver merely reflecting the world, but an active operator in constituting the world. The process of apperception actively shapes and categorizes our experience, dividing the sensory data into a world of objects in space and time, where those objects stand in causal relations to each other. In psychology, apperception can be defined as “the process by which new experience is assimilated to and transformed by the residuum of past experience of an individual to form a new whole” (Runes, 1972, p. 15).
The first significant property of apperception is the reliance to previously learned thought models and mental representations, which is one of the central ideas in expertise research (de Groot, 1965; Simon & Chase, 1973; Saariluoma, 1990; Ericsson, 2006). The novelty from the content-based point of view is that subjects do not just recognize familiar models but they also organize the situation-specific information contents into internally consistent mental representations (Saariluoma, 1990; 1992; 1995; 1997). Research on apperception has shown that the information contents of mental representations have a very selective and purposeful organization, although any non-trivial object provides much more information to be encoded into a mental representation of the object

76
than can be found in the representation (Saariluoma, 1990; 1995; 1997; Saariluoma & Maarttola, 2003, Saariluoma, Nevala, & Karvinen, 2006). The elements of mental representations are linked to each other by combinations of content elements that ”make sense” (e.g., Saariluoma, Nevala, & Karvinen, 2006). This means that the presence of a piece of information in a mental representation must have a reason which makes the elements of the representation functional (Saariluoma, 1997). Although a chess computer can make millions of calculations on moves in a particular situation to find the best move, a capacity-limited human chess player can play as efficiently because a limited number of content-specific principles enable the compaction of the relevant search space (Saariluoma, 1997). From the viewpoint of evolutionary psychology (Buss, 1995) and the development of brain, this kind of functional organization of the information contents seems natural in order to enable efficient and economical information processing. Considering human-technology interaction, questions related to “sense-making” may emerge when analyzing why people employ certain patterns of behavior and why they incorporate some specific contents in their mental representations.
As already implied, apperception is not limited to the process of seeing something that our perceptional system provides us as something corresponding to our existing mental representations. Research in the different fields of theoretical and applied psychology indicates that there is a difference between perceptual and non-perceptual mental contents (Saariluoma, 1990; 1995; 1997; 2001; 2003; Saariluoma et al. 2008). As long as we relegate human mind to the role of a “telephone cable” in our investigations (e.g., Miller, 1956; Broadbent, 1958), this difference does not show up, because the basic conceptualization is fixed with the presently flowing information. However, if we turn our attention to the information contents of the mental representations, we immediately observe that much of the contents is about something that is not present at the moment (Saariluoma, 1995). Drivers have route models, but they do not see but a fraction of a long route at a time. Thus, the contents of presently active mental representations need not be about this moment in time. This observation has made it necessary to make a conceptual distinction between perception and apperception. While perceptions are stimulus-bound processes and their contents refer to physically present energetic states in the nervous system, apperception constructs representations with no spatio-temporal limitations (Saariluoma, 1990; 1995; 1997; 2003). From this point of view, it can be fruitful to investigate, in human-technology interaction research, how current behaviors are influenced especially by those parts in our mental representations that refer to future, e.g., expectations.
3.1.1 Relevance, inclusiveness and correctness of mental contents
It is well-known in expertise research that all the errors of experts cannot be explained in terms of limited information processing capacity and excessive workload (e.g., Saariluoma, 1992). Some of the errors seem to be connected, instead, to mental contents (Saariluoma, 1992; 1995). People might misrepresent

77
the situation they find themselves in and consequently, they may err. In this way the nature of their mental contents can be used to explain why things have proceeded in a suboptimal manner. This is why it is logical to apply content-based psychology also when investigating human-technology interaction problems.
For the functionality of mental representations, it is important whether the representation of a situation involves components that are relevant or irrelevant for achieving the particular goals of the interaction (Saariluoma, 1990; 1995; Saariluoma & Maarttola, 2003). The inclusiveness of the contents refers to whether the representation of the situation involves all the relevant aspects that are critical to achieve the goals of the interaction. Finally, the correctness of the representations refers to whether the representations of a situation equal the real state of things (Saariluoma, 1992; Saariluoma & Maarttola, 2003). The specific questions that can help us to define these attributes for the information contents of mental representations are:
1) relevance. Is the information purposeful, including only meaningful elements, and, thus, enabling efficient focusing on the relevant targets in the situation?
2) inclusiveness. Does the information include all the relevant information of
the situation, including upcoming events, required for achieving the goals of the interaction? Inclusiveness refers also to the level of accuracy of the information.
3) correctness. Is the information correct, i.e., does it relate to the real state of
things and does it constitute an internally consistent representation?
From the capacity-based point of view, it is irrelevant whether the information in the limited processing system of the human operator is inclusive, correct, relevant or making sense. The only critical aspect of that information is its complexity (Hollnagel, 2007) relative to the agent’s capacity to perceive, attend to or remember it in normal situations or in situations where that agent's capacity has decreased, for example, in the cases of low vigilance (Brookhuis & de Waard, 1993) or mental underload (Stanton & Young, 2002). Nevertheless, there are many questions concerning human performance in which the inclusiveness, correctness, and relevance of the information in the mental contents of the human operator are necessary targets for psychological analysis. It is evident that these kinds of issues are important when we discuss human action in general and drivers’ dual-task behavior in particular.
The idea that capacity could explain false or irrelevant mental contents is incorrect, because the limited information processing capacity of a human can be filled with correct as well as incorrect mental contents (Saariluoma, 1992). Therefore, the problems of functional organization, relevance, correctness, or inclusiveness simply cannot be discussed in terms of the capacity-based theory

78
languages. The power of the capacity-based theory languages is insufficient for this, and therefore it is essential to develop a suitable theory language for the questions related to mental contents (Saariluoma, 2003). As there is not yet much empirical research focusing on mental contents, the problems and perspectives to establish solid foundations for systematical empirical research can only be outlined here. The notions of mental contents can be applied to the analysis of drivers’ dual-task behaviors, and, in a larger perspective, to the analysis of human-technology interaction.
3.1.2 Why mental contents?
In the following, some examples are provided that explicate how the aspects of content-based psychology can be applied to real problems and provide justification for the approach, particularly in the context of driver distraction research. For example, the analysis of the information contents of drivers’ situational mental representations would be relevant in a number of important issues regarding driver’s dual-task behavior. The following topical themes in traffic psychological research provide examples of these issues.
Anticipatory processes and expectations
Unexpected events are probably a highly significant contributor in most traffic accidents (Klauer et al., 2006). Victor et al. (2008) defined expectancy as a cognitive factor controlling goal-directed top-down attention. To expect is to anticipate the occurrence of an event and is, thus, highly related to drivers’ readiness to respond to this event. The concept of anticipation has been central for a long time, for example, in road design (e.g., Alexander & Lunenfeld, 1986) and in the theoretical models of driver behavior (e.g., Näätänen & Summala, 1974). Victor et al. (2008) see expectations as relating to the driver’s experience, i.e., past experiences are projected to all levels of the driving task. Furthermore, the authors point out that at the moment there are no objective measures for the degree of expectancy of an event. Eissfeldt and Wagner (2003) approached the problem of anticipatory processes in terms of how people estimate the velocities of the vehicles ahead of them and adapt their driving on the basis of this information. Content-based analyses of drivers’ expectations about how the upcoming events will turn out could help us, for example, understand their risky dual-task behavior, e.g., overlong glances to secondary displays in relation to the dynamic driving situation.
Task timing, visual sampling and time-sharing strategies
A common problem in driver distraction research is related to where people look at and for how long when they share time between driving and visual secondary tasks (e.g., Wierwille, 1993). Research on this aspect is still very much descriptive in nature. One reason for this is that very little attention has been paid to the mental contents of the underlying mental representations directing

79
visual attention. Only the knowledge of what drivers momentarily regard as important and what they think can provide logical explanations for their eye movements as well as their attentional movements. From the content-based point of view, it is essential to describe the contents of the underlying mental representations, time-sharing tactics and strategies, as well as their connections to the observed time-sharing patterns.
Task prioritization
In certain demanding dual-task conditions, drivers cannot perform two tasks simultaneously with a satisfying level of performance. Drivers seem to be often aware of this limitation, and this is why they try to decrease the level of task workload by some compensatory action. Compensatory actions can include, e.g., decreasing the speed of the vehicle, or even postponing the execution of the secondary task in favor of the driving task (e.g., Cnossen et al., 2000). Cnossen et al. (2004) reported an interesting finding related to driving-related versus non-related secondary task. They found that the participants had more difficulties in prioritizing the driving task over the driving-relevant secondary tasks, i.e., navigation-related tasks, than over the secondary tasks not directly relevant for driving, i.e., a working memory task. The content-based approach could be valuable in studying drivers’ task priority management and the related strategic thinking in dual-task situations.
Behavioral adaptation, learning, and driver education
Learning and adaptive behaviors in general open a new perspective to mental representations. Although much of the mental contents acquired in learning, in particular procedural information, can be unconscious and difficult to report (Helfenstein & Saariluoma, 2006), from a content-based point of view, the crucial question would be what the new mental contents are that learning has brought to the minds of the drivers.
Capacity-based experimentation in driver distraction research typically focuses on revealing the assumed static limits of drivers’ information processing systems. The content-based approach could open up new longitudinal perspectives on studying drivers’ learning and automatization processes in dual-task situations. The focus of this type of research would be on the differences of participants’ mental contents before and after practice, and during the resultant learning processes, development of skills, and adaptations to task demands. This information could be utilized, e.g., in educating drivers for more efficient time-sharing, or prioritization of the driving in accordance with the driving task demands (e.g., Horrey et al., 2009). Among others, e.g., Kahneman et al. (1973) and Gopher (1993) argue that practice can improve strategies of allocating, switching, and time-sharing attention appropriately according to task demands.
80
Task predictability, interruptability, resumability, and ignorability
Lee et al. (2008) as well as Young et al. (2008b) recognize in-vehicle task predictability, interruptability, resumability, and ignorability, as important attributes for enabling safe task timing of the driving task and secondary tasks. However, there are no widely-accepted definitions for these task attributes. These are all difficult to define accurately, but at a general level, task predictability refers to the predictability of the duration and demands of task sequences. Generally, task interruptability and resumability refer to task sequences that can be easily disengaged from and resumed after interruptions, and task ignorability refers to task qualities that are not so compelling or demanding that the driver cannot resist engaging in the task without delays (CEC, 2006; Lee et al., 2008; Young et al., 2008b). The guidelines for designers (e.g., CEC, 2006) are not precise in definitions for these attributes, and in particular, do not provide guidance on how to measure these in an objective and satisfactory manner. Neither do these guidelines provide detailed advice on what kind of in-vehicle user interface features, e.g., display designs, can affect these, how, and why. Content-based analysis of different IVIS design features’ effects on the tactical task timing and strategic task prioritization abilities of the drivers could reveal the mechanisms behind these effects, and in this way, aid in creating the definitions and metrics for assessing these in-vehicle task attributes.
Navigation and cognitive maps
An essential part of the driving task is to move successfully from point A to point B. Modern navigation systems provide an example of driver assistance systems (DAS) that can be highly valuable for the driver to succeed in this task. However, it has been recognized that the information provided for the driver by the navigation system can distract the driver if it is not presented in a simple, clear and adequately timed manner (e.g., CEC, 2006). This point can be stressed with the argument that the need for the navigation aids exists typically in unfamiliar environments, which can place higher demands for the driver than the familiar ones (e.g., Verwey, 2000). The analysis of the contents of drivers’ route models, cognitive maps, and expectations could reveal what types of information are the most relevant in different situations, and, thus, should be highlighted. These kinds of adaptive user interfaces for navigation systems could enable effortless and more efficient route finding. In addition, the content-based analysis of cognitive maps could enable route optimization for finding the simplest instructions, i.e., easy-to-describe routes for the driver (Richter & Duckham, 2008).
81
Emotional aspects and cognitive bias: experience of risk, trust, attitudes, and values
The traffic environment and the driving task seem to be contexts that easily arouse emotions. It has been shown that various emotional phenomena may have significant effects on drivers’ behaviors (e.g., Mesken, Hagenzieker, Rothengater, & de Waard, 2005). A study by Mesken et al. (2005), for example, indicates that there is a connection between drivers’ emotions, cognitive bias, and the resultant behaviors.
Risk perception, i.e., the representations, experience, and feelings of situational risks, have been suggested to be even the major force behind drivers’ behaviors in traffic (e.g., Wilde, 1982). Näätänen and Summala (1974) advocated the avoidance of collision with subjectively sufficient safety margins as a major determinant of driver behavior in their zero-risk theory (also Summala, 1985; 1988). The theory suggests that the cognitive appraisal of risk in a situation can be significantly biased. Drivers adapt to the risks on the road through experience if they do not perceive or have feelings of these risks. Thus, their subjective assessments of risk can be distorted compared to the objective risk levels. White, Eiser and Harris (2004) analyzed how people perceive risks when they use mobile phones while driving. They found substantial differences in the ways people see and also represent the risks between hand-held and hands-free use of mobile phone. Whereas the use of hand-held sets was seen as one of the riskiest activities to perform while driving, the risks of using a hands-free kit were rated to be relatively small, although there is convincing evidence that the hands-free functionality does not significantly lower the crash risk (Horrey & Wickens, 2006).
Level of trust is a factor related to the experience of risk, and has been studied especially in the context of warning systems, driver assistance systems and automation of the driving task (e.g., Lee & Moray, 1992; Lee & See, 2004; Rajaonah et al., 2008). All of these could be used to mitigate the effects of driver distraction. Trust towards automated system’s behavior seems to be an important precondition for system acceptance (Kinghorn, Bittner, & Kantowitz, 1994; Muir & Moray, 1996). Trust can also be a key component when a driver decides to direct visual attention elsewhere from the driving scene; trust is placed towards the safety margins and the expected continuum of events in the driving environment.
In a larger perspective, emotions relate to driver’s attitudes and values. We evaluate things as desirable and valuable or repulsive and worthless based on our emotions and attitudes (Eagly & Chaiken, 1993). Our emotions can guide us in our monitoring of risk, processing of information, decision-making, and building trust. From the content-based point of view, it may be asked whether the type of cognitive bias is related to the type of emotional state in a situation. The content-based analysis of emotions’ relations to mental contents could provide a tool for explicating these relationships. For example, the investigation of why people do not experience the risks of hands-free practices the same as
82
the risks of hand-held phones, presupposes understanding of the contents of the underlying shared representations.
Individual differences
Capacity-based research often tries to control or mitigate the effects of individual differences on dual-task performance. The ideal would be to find the general limits of human information processing system in dual-tasking while driving. However, we cannot neglect the fact that the individual differences are real and can have major effects on drivers’ performance. From the content-based point of view, it would be interesting to turn our focus of interest from the general to the individual level and try to reveal what types of individual differences, in particular in mental contents and apperception processes, could explain the variances in dual-tasking behaviors.
Apperception and the general theory of driver behavior
Well-known examples of driver modeling have been presented, e.g., in Wilde’s (1982) theory of risk homeostasis, the zero-risk theory of Näätänen and Summala (1974, also Summala, 1985; 1988), and in Fuller’s threat-avoidance model (1984) as well as in the task–capability interface model (2005). Fuller (2005) suggests that the most important driving forces behind driver’s behavior are the driver’s perceptions of task difficulty and of one’s own capabilities. From the content-based point of view, we can ask what the origins and the nature of these mental representations controlling drivers’ behavior during dual-tasking are. In particular, the concept of perception could be replaced by the notion of apperception, i.e., driver’s apperceptions of task difficulty and one’s own capabilities. This would stress the importance of the internal issues affecting an individual driver’s experience of task demands and risks that seem to deviate significantly from the estimates of statistical risks (Näätänen & Summala, 1974. Fuller, 2005). How these internal issues could be modeled at a more general level is another question of importance.
This very brief overview was intended to further demonstrate that the capacity-based approach for explaining driver behavior is insufficient for analyzing these issues. The content-based approach could open up new perspectives for the research. One possible explanation for why these issues have remained insufficiently investigated and understood in the context of driver distraction might be the successes and dominance of the capacity-based thinking in experimental research on driver distraction. In addition, these issues can be quite challenging to approach in experimental research as well as with other methods. The capacity-based research typically tries to ignore or control these factors in experimental designs. This it does in order to mitigate the effects of the associated large individual variances that these phenomena can bring to the capacity-based causal relationships under investigation.
In the following sections, related phenomena that are of high significance for the driver distraction research but which can be challenging to explore and

83
analyze with the capacity-based theory languages, will be discussed in more detail. These phenomena are tactical and strategic thinking as well as situation awareness. A more detailed glimpse at these can further illustrate the potential of the novel content-based approach.
3.1.3 Distraction at the levels of tactical and strategic control
There have been several attempts to apply control models to the driving task itself, i.e., models for lane keeping, speed maintenance, and car-tailing (e.g., Levison, 1998; Allen, Rosenthal, & Christos, 1998; Anderson & Lebiere, 1998; Peters & Nilsson, 2007). Sheridan (2004) introduced a control-theoretical model of distracted driving. Sheridan’s model considered driver distraction merely as a disturbance imposed within the loop of a lateral or longitudinal vehicle control. Lee et al. (2008) built on this model and extended it significantly by incorporating the levels of tactical and strategic control into it.
As already mentioned in Subsection 2.2.2, the driving task can be divided into (at least) three levels of control. According to Michon (1985), car driving is a hierarchical task and arriving safely at the planned destination is the main task goal. A general view is that this hierarchical task comprises a three-level cognitive control hierarchy (Michon, 1985). At the top is the strategic level, referring to the goal-directed general planning of a trip, and the related decision making on trip goals and route choice. These decisions can be affected, e.g., by evaluations of the risks and costs involved and factors such as aesthetic satisfaction and comfort (Michon, 1985). This general planning can take from minutes to weeks. Next, there is the tactical level that is typically seen as the maneuvering level. At this level, the driver actively controls the vehicle by maneuvering it through the prevailing conditions. A maneuver refers to an action pattern, such as obstacle avoidance, gap acceptance, turning, and overtaking (Michon, 1985), requiring conscious control. The time-scale of tactical control is in order of seconds. At the bottom, there is the level of operational control, referring to the typically automated action patterns, such as basic vehicle control by steering, accelerating, and braking. Control at this level is fast and the automatized responses can happen in milliseconds.
Also by using the Rasmussen’s (1987) model of the levels of information processing, the driving task can be divided into three levels of behaviors; skill-based, rule-based, and knowledge-based behaviors. Rasmussen’s model is intended to describe the nature of control errors that, for different reasons, are possible at the different levels. The levels of behavior differ from each other in the level of automation. At the knowledge-based level, the behavior is consciously regulated, at the rule-based level rules are consciously applied, and at the skill-based level, behavior is based on automated routines requiring little or no conscious attention. Rasmussen’s (1987) levels of behavior (also information processing) can be seen as related to the Michon’s (1985) levels of control (Ranney, 1994).
The definition and differentiation of the different levels of control or behaviors in driving can be an ambiguous task. For example, Rockwell (1972)

84
discussed decision-making in driving, and defined operational decisions to include decisions on headway selection, speed selection, passing, and merging. Other authors have considered these forms of control as typical examples of tactical level control (e.g., Michon, 1985; Ranney et al., 2005; Drews et al., 2008). The division between the operational and tactical level tasks often seems to be difficult. Hacker’s (1978) suggestion, related to the discrimination problem between the operational and the other levels, is that at the operational level there are no independent psychological goals. There can also be challenges in classifying drivers' behaviors between tactical and strategic levels, as both require conscious decision making. Furthermore, choice of speed can be considered as a strategic or tactical decision, but also an automated action at the operational level. All human behaviors are results of complex combinations of controlled and automatic processes (Schneider & Shiffrin, 1977; Shiffrin & Schneider, 1977). In addition, it is evident that the levels of control can interact with each other (Michon, 1985). Keskinen et al. (2004) has suggested even a fourth level to the three-level theory of inner models of driving behavior by Mikkonen and Keskinen (1980). The level above the strategic level refers to the ‘goals for life and skills for living’. This level consists of the highest level of the inner models, interacting with the lower level models of goals and context of driving, mastering traffic situations, and vehicle maneuvering. In the revised theory of inner models of driving behavior, factors such as motives, attitudes, and values are better taken into account via the level of ‘goals for life and skills for living’. Here, I will follow the division and definitions of driver distraction at multiple levels of control by Lee et al. (2008, see FIGURE 3).
Driver distraction
Overlapping and overloading
resource investments
Self-exposure to potentially
demanding situations
Inefficient task timing
OperationalizationMetrics of Model
Time-sharing efficiency
Taskperformance
Workload
Situation awareness
Breakdown at the levelof strategic control
Breakdown at the levelof tactical control
Breakdown at the levelof operational control
Task prioritization
FIGURE 3 Multiple level model of driver distraction (reformulated after Lee et al., 2008,
and Young et al., 2008b) At the operational level, driver distraction can be defined as competition over drivers’ limited resources (see Subsection 2.2.2). Breakdown of control at the

85
operational level means that the capacity of driver’s information processing resources is exceeded due to the overlapping demands of the driving and the secondary tasks that together overload the driver’s capacity. Timewise, the control of resource investments refers to efficient sharing of the resources, simultaneously or in millisecond intervals between two tasks.
Above the operational level of control, the driver has (or should have) the possibility to divide the secondary task into shorter steps. The driver can tactically time the engagement and execution of the task steps in a self-paced manner by interrupting and resuming the task in accordance with the demands of the driving task. Driver distraction as a breakdown at this tactical level of control refers to failures and inefficiency in this task timing (Lee et al., 2008). As an example of a tactical failure, the driver’s gaze can be directed away from the driving scene into an in-vehicle device for too long considering the upcoming visual demands of the driving situation: for example, as the vehicle in front suddenly makes a left turn at the intersection ahead. Tactical control refers essentially to the control of the execution of driving task and secondary activities serially in time in the order of seconds.
At the highest level driver distraction as a breakdown of strategic control refers to inappropriate priority calibration (Lee et al., 2008). Control at this level deals with the strategic decisions of delaying engagement or even refusing to perform in-vehicle tasks while driving. Breakdown of control means that the driver exposes him/herself to a potentially over-demanding dual-task situation given the driver’s abilities, task demands, and driver’s subjective as well as societal standards for safe driving. The driver is, thus, not able to prioritize the driving task over the secondary activities on a sufficient level. A number of factors, including emotional, motivational, social, and legislative, can affect the strategic control of dual-tasking (Näätänen & Summala, 1974; Lee et al., 2008). For example, the driver can postpone a phone conversation due to an assessment of the driving task demands in relation to one’s own capabilities, but also in order to comply with societal norms. Similarly, social pressure can make the driver answer the phone call while driving, even if it would go against the driver’s typical behaviors. Also such IVIS design factors as task ignorability (Lee et al., 2008), can have an effect on drivers’ situational task prioritization. Strategic control in the form of route planning can also affect the possibilities to be distracted, e.g., when the driver selects a low-traffic environment in order to be able to make phone calls more safely while driving.
The levels of control can interact with each other (Lee et al., 2008). Breakdown at any level can lead to breakdowns at the other levels, but not necessarily. It is easy to see how a strategic decision to engage in a secondary activity in a demanding traffic environment can lead to a failure in task timing, especially if the driver is not aware of all the task demands. Further, the inefficient task timing can lead to overlapping demands for drivers’ resources, finally resulting, e.g., in loss of vehicle control with possibly dramatic consequences. The causal interaction can work also to the other direction. A breakdown at the operational level, i.e., capacity overload, can lead to

86
inefficient tactical decisions, and, thus, failures in task timing (Horrey et al., 2009). Furthermore, inefficient task timing can lead to an insufficient level of awareness of the task demands, which can lead to poor strategic decisions about when it is appropriate to engage in the secondary task.
There can also be trade-offs between the levels. For example, glancing for route or traffic data on an IVIS can result momentarily in swerving on the lane, and, thus, indicate driver distraction at the operational level. However, at the level of strategic control, the decision to get the information can help the driver to select an alternative route that is less demanding than the original route. This selection lowers the possibility to be distracted at the operational and tactical levels in that new route.
The breakdowns of control at the different levels can be observed with different metrics. Section 2.2 reviews quite thoroughly the metrics that can be and have been used for assessing driver distraction at the operational level of control. Drews et al. (2008) among others, regard especially the measures of vehicle’s longitudinal control, such as changes in speed, changes in acceleration, and delayed reaction times, as indicators of tactical control. Here it is suggested, however, that inefficient task timing can be more directly observed with the measures of situation awareness and time-sharing efficiency.
Time-sharing efficiency refers to the efficiency of sharing attention in time (serially) between two tasks. It can be challenging to measure where the focus of one’s attention resides at any particular moment, especially in the case where attention is directed towards internal processes, such as memory recollection or day-dreaming. However, in the context of visual tasks, the direction of gaze can be taken as an indicator of the task towards which one’s attention, at least visual attention, is directed. In addition, the information contents of drivers’ time-sharing tactics and interaction strategies are necessary targets of investigation when assessing drivers' tactical abilities.
Situation awareness is a highly relevant concept related to drivers’ tactical, as well as strategic abilities. Situation awareness is, in short, about knowing what is going on (Endsley, 1995b). It can be argued that if the driver is not aware of the demands of a dual-task situation, it is improbable that the driver will be able to share time between the two tasks in an efficient manner or to make an appropriate decision on when to engage in the secondary task (e.g., Ma & Kaber, 2005; Drews et al., 2008). As such, situation awareness is more of a prerequisite than an indicator of efficient tactical and strategic control. However, the metrics of situation awareness are important in order to take into account the dynamic situational aspects in the evaluation of task prioritization and time-sharing efficiency. This is the case, for example, when assessing the efficiency of secondary task timing in relation to the dynamic demands of the driving situation. Thus, the metrics of situation awareness can be utilized for assessing whether the driver is aware and capable of taking into account the situational variables in task timing, or whether the time-sharing is based on other factors, such as automated action patterns. Time-sharing efficiency can be at a good

87
level in both cases, at least by chance, but in the latter case time-sharing is based on operational control, not on tactical thinking.
At the strategic level, task prioritization can be a challenging variable to measure. However, in experimental settings this could be realized by comparing drivers’ behavior in a particular situation to the demands of the situation, by taking into consideration their individual abilities and subjective, as well as objective, standards for safety margins. For example, the demands of the driving situation at the moment of secondary task engagement in time can be assessed, and the observed level of demands at this point can be compared to the capabilities of the driver. This ratio can then be compared to the driver’s subjective ratings and objective estimations about acceptable levels of safety. A more straightforward way to assess the effects of strategic decision making on situational task prioritization is to simply analyze the level of demands in situations where drivers choose to engage in dual-tasking.
In the current framework, mental contents relate in particular to the higher levels of control, i.e., tactical and strategic levels, whereas the capacity-based explanatory models apply typically to the level of operational control. These different levels provide complementary views on driver distraction. Focusing on one level is clearly not enough in order to understand driver behavior in a more holistic and realistic way. This would be comparable to evaluating driving capabilities of the elderly or patients with brain damage solely on the basis of deviations from lateral control in simulated driving or performance in neurological bench-tests. This type of testing neglects the compensatory tactical and strategic processes that drivers with decreased cognitive abilities can develop for overcoming their deficiencies in motor and perceptual skills (Lundqvist & Rönnberg, 2001; Lundqvist & Alinder, 2007). In driving evaluations, as well as in experiments, it is important to make a distinction between drivers’ performance and how well drivers apply their skills in more realistically motivated task environments. In other words, there is a difference between the person’s best capability and the person’s actual behavior on the road (Evans, 1991).
Distraction research, in particular experimental research, focusing on the higher levels of control, is still quite rare (Regan, Young, & Lee, 2008). Related research has been focusing on issues such as whether the drivers are aware of their capacity limitations in dual-task situations (i.e., metacognition), whether they are capable of adjusting their safety margins appropriately, and in what ways (e.g., Cnossen et al., 2000; 2004; Reyes & Lee, 2004; Horrey, Simons et al., 2006; Horrey & Simons, 2007; Drews et al., 2008). Typically these studies have focused on measuring tactical control of the driving task, i.e., the drivers’ abilities to lower the demands of the driving task in order to avoid deterioration of driving performance while dual-tasking. Also Zwahlen’s (1988) and Wierwille’s (1993) popular work on modeling drivers’ general glancing behavior inside the vehicle has focused on tactical time-sharing of visual attention between tasks. Unfortunately, analyses of the contents of drivers’ tactical thinking and the related situation awareness have been missing. The

88
framework proposed here is intended to address, on a more detailed level, the qualities and mechanisms of drivers’ interactions with IVIS, thinking at the tactical and strategic levels of control, and above all, the related mental contents.
A few studies have come close also to these issues..Monk et al. (2004) studied interrupted task performance using a video recorder programming task as the primary task. Although this was a part-task study in which no driving task was involved, the results were intended to and could, with caution, be possibly generalized to drivers’ dual-tasking while driving. The authors found that the timing of interruptions had a significant impact on primary task resumption times. For mid-subtask interruption points the resumption lags were longer than they were for those interruption points where the participants started new subtasks or scrolled. Furthermore, the interruption tasks that prevented strategic rehearsal of goals for the primary task resulted in longer resumption times than interruptions that allowed rehearsal.
Brumby et al. (2007; 2009) introduced a novel computational approach for exploring the interaction strategy space of drivers in dual-task situations. The authors utilized cognitive modeling in order to assess what kind of cognitive constraints might affect the drivers' dual-tasking strategies. In particular, they assessed drivers’ willingness to incur the costs of disrupting the secondary task chunk structure in order to achieve only modest improvements in lane keeping by redirecting their attention to the driving task. According to Brumby et al. (2009), the cognitive modeling approach was useful in this case for exploring the space of plausible human behaviors in order to better understand why people behave the way they do in dual-tasking while driving. Furthermore, the study seems to indicate that interaction strategy adaptations of drivers can be severely constrained by the ‘representational structures’ of the secondary tasks.
Horrey and Lesch (2009) as well as Pöysti, Rajalin, and Summala (2005) have studied drivers’ behaviors at the strategic level of control regarding drivers’ willingness to engage in secondary activities while driving. Horrey and Lesch (2009) concluded that although drivers were aware of the demands of the driving situation, they did not tend to strategically postpone the presented secondary tasks when given the chance in their experiment. Based on these results, the authors suggest that driver training on strategic decisions and planning of dual-tasking could be worth considering. The effects of this type of training of strategic skills was later tested by Horrey et al. (2009), giving somewhat promising results. Besides the experimental research, Bonnard and Brusque (2008) have suggested naturalistic driving observations, such as the 100-car-study (Klauer et al., 2006), for providing information on natural IVIS interactions and use at tactical and strategic levels in real traffic environments. In their interview study with 834 participants, Pöysti, Rajalin, and Summala (2005) found several background factors, such as age, gender, driving experience, occupation, and high safety motivation, that seem to affect drivers’ willingness to use mobile phone while driving.

89
3.1.4 Situation awareness
Situation awareness (SA) is a highly relevant concept when discussing driver distraction as a breakdown at the tactical and strategic levels of control. The awareness of situational task demands and own capabilities can have a significant effect on task prioritization and task timing (Drews et al., 2008; Lee et al., 2008). Situation awareness is an important concept also for the content-based psychology as it relates closely to mental contents. Smith and Hancock (1995, p. 138) define situation awareness as “adaptive, externally directed consciousness”. Endsley (1995b) gave a more comprehensive definition for SA. According to Endsley (1995b), situation awareness is simply about knowing what is going on. More formally, SA is “the perception of the elements in the environment within a volume of time and space, the comprehension of their meaning and the projection of their status in the near future” (Endsley, 1995b, p. 36). Thus, Endsley (1995b) considers SA to be a result of processes acting on three levels:
• Level 1: perception of elements in the environment, • Level 2: comprehension of the meaning of the current elements, and • Level 3: projection of their status in the near future.
Apperception relates in particular to Levels 2 and 3, although it can have an effect also on which elements are attended, and, thus, perceived in the environment.
In line with Endsley (1995b), Stanton and Young (2000) define situation awareness in driving in terms of the driver's awareness of the present and the future state of the vehicle and the driving environment. This situational information enables effective decisions to be made in real-time and the driver to be “tightly coupled to the dynamics of [their] environment” (Moray, 2004, p. 4; Walker et al., 2008).
Ward (2000), as well as Matthews, Bryant, Webb, and Harbluk (2001), have addressed the relationship of SA and the levels of control in driving (Michon, 1985). According to Matthews et al. (2001), at the operational level Level 1 SA is the most important for the automatic control processes as it ensures that the operations are performed according to the perceived situation. At the tactical level, both Level 1 and Level 2 SA are required in order to efficiently maneuver the vehicle through the prevailing traffic situations. Tactical control requires also projection of the future status of the driving environment (Level 3 SA), but in a relatively short time span. At the strategic level, Level 3 SA is needed for formulating the route plans. When executing the plans, the strategic control can additionally involve Level 2 SA in relation to Level 3 SA. However, according to Matthews et al. (2001), Level 1 SA forms the basis for the other levels. In his doctoral research, Sukthankar (1997) tried to implement a form of tactical level reasoning for intelligent, independent vehicles. The author states that the primary challenge in creating an intelligent vehicle is making the vehicle aware of the relevant parts of the rapidly changing

90
and often unpredictable traffic situations. The information that can be provided for the machine brains is necessarily always incomplete. According to the author (p. iii), human expertise in tactical driving can be attributed to situation awareness, “a task-specific understanding of the dynamic entities in the environment, and their projected impact on the agent’s actions”.
Walker, Stanton, and Young (2006; 2008) discuss briefly the possible measurement techniques for assessing drivers’ situation awareness. The main approaches are based on concurrent verbal protocol during tasks, on probe recall by freezing the task and on questions about the situation, or on self-reports after the tasks. All of these techniques are based on subjective reporting. Walker et al. (2006) quantified the data by two sets of rating scales completed during the total of 36 pauses in a driving simulation study. The study was based on the probed recall paradigm in order to achieve higher objectivity of the results on the effect of non-visual vehicle feedback on driver’s situation awareness. The first set of rating scales probed the participant’s confidence level as to the presence or absence of discrete units of information in the environment (1=very confident that the information was present in the environment just prior to the pause, through to 7=very confident that the probed information was not present), the other one required participants to simply rate their feelings about the state of their own SA along a single 20-point scale from 0 (a poor grasp of the situation) through to 20 (a complete picture of the situation). In another study, Walker et al. (2008) utilized the concurrent verbal protocol, probe recall and self-reports for assessing drivers’ situation awareness in a study addressing among other issues, driver’s self-awareness of their level of situation awareness.
The logic behind the measurement of situation awareness in both studies was that that “a significant part of SA is the information that driver’s are able to extract from their environment” (Walker et al., 2008, p. 284). The quantitative number of objects the drivers are aware of should tell about the level of situation awareness. Similarly, the SART technique (Taylor et al., 1995) measures subjective ratings of the participants’ feelings about the current state of their situation awareness. The SART scales consist of demands on attentional resources, supply of attentional resources and the level of understanding of the situation.
However, other highly important aspects of the situation-specific information that form drivers’ SA, such as the relevance of the information picked out from the environment (Endsley, 1995b: Level 2 SA) and the projection of the future status of the situation (Level 3 SA), are left unanalyzed this way. This notion applies to all the current metrics of situation awareness, which seem to be insufficient in this sense (Walker et al., 2006; 2008).
There are also additional problems. One of the standard instruments for assessing SA is SAGAT (Situation Awareness Global Assessment Technique), in which the participant fills out a query on various state parameters during an intermittent interruption of the task, with the task display blanked off (Endsley, 1995a; Wickens, 2008). The technique has been criticized for its memory decay

91
effects and interference due to disrupted task performance (Wickens, 2008). In contrary how Ma and Kaber (2005) describe SAGAT, it does not seem to form objective, or at least direct measures of SA. SPAM (Situation Present Assessment Measure) is a similar technique, but assesses the speed of accessing information real-time on non-blanked task display (Wickens, 2008). The aforesaid criticism applies to SAGAT and SPAM as well. In addition, these techniques can interfere on drivers’ performance in the primary task. For this reason, SA can also be inferred implicitly from other measures (Wickens, 2008). Implicit measures of decreased SA can be inferred, e.g., from reaction time measurements (e.g., Victor et al., 2008), or from driving behaviors, such as cutting in front of a vehicle into another lane. The obvious challenge with the implicit metrics is that they are indirect measures of SA.
From the content-based point of view, it would be highly important to analyze the mental contents involved in the representational control of behavior based on SA, because situation awareness is always about something, i.e., it has mental contents. Accordingly, the major source of SA errors appears to reside on the informational ‘content’ based level (e.g., Jones & Endsley, 1996). The content-based approach to situation awareness can provide new tools for assessing drivers’ situation awareness. The basic model of explanation for human error according to the content-based view of situation awareness proceeds as follows: “People misrepresent the situation they find themselves in and consequently, they err.”
If the relevant information types (see Saariluoma et al., 2008) comprising the mental contents that form situation awareness are analyzed, several types of mental contents that can be insufficient or incorrect in a particular situation can be found. By defining all these information types, a content-based model of situation awareness in a dual-task situation while driving can be formed. Although it can be difficult to define in detail the kinds of general elements situation awareness is constructed of, we can try to specify the most relevant and, thus, important information contents of SA in a limited task area. It can be extremely difficult to develop a comprehensive theory of human behavior, but like Kantowitz (2000) states, applied researchers do not have to take into account all the abstract human capabilities. Applied research can, and should, focus on human behaviors in limited domains. The constraints of the limited task area can help in building relevant and successful theoretical models of human behavior in this area.
FIGURE 4 represents, from the functional point of view, the content-based model of situation awareness in a dual-task situation while driving. The model highlights the relevant information for achieving the main general task goal of successful (i.e., crash-free) driving while dual-tasking.

92
Situation awareness
* Including upcoming demands
Awareness ofrisks
Awareness ofdriving task demands*
Awareness ofcombined demands*
Awareness ofsecondary task demands*
Awareness ofown capabilities
FIGURE 4 Content-based model of situation awareness in a dual-task situation while
driving First of all, awareness of driving task demands, referring to any information necessary and relevant for performing the driving task successfully, is an important element of the driver’s SA while dual-tasking. This awareness refers, in particular, to the awareness of safety margins (i.e., time margins) in a situation (Summala, 1985). Typically, in the context of dual-tasking while driving, situation awareness has been merely considered and assessed as awareness of these elements related to driving (e.g., Gugerty, Rando, Rakauskas, Brooks, & Olson, 2003; Ma & Kaber, 2005). This relates, e.g., to knowing the vehicle’s current position in relation to its destination, the relative positions and behavior of other vehicles and possible hazards, and also knowing how these variables will probably change in the near future (Sukthankar, 1997).
Here, equal emphasis is given to the awareness of the secondary task demands and the awareness of the combined demands of the driving and the secondary task. If the driver is not sufficiently aware of the situational demands of the secondary task, it can be demanding to time the interactions in a safe manner (Lee et al., 2008). Relevant information related to the secondary task includes, e.g., durations of task sequences, the workload related to the task, and information on how to conduct the task. The outcome of time-sharing of visual attention is rarely safe unless the driver can anticipate correctly the visual demands of the driving task as well as the visual demands of interaction with the device.
The combined demands of driving and simultaneous interaction with IVIS can also often be more than the sum of them. For example, it is often not sufficient to be aware of the visual demands of the driving situation and the visual demands of the interaction with IVIS. The driver also has to be aware of
93
what are the combined visual demands, e.g., the switch costs in the form of gaze transition and focusing time, in order to avoid distraction. The driver has to be aware of when the driving demands allow the completion of the secondary tasks, e.g., to know whether there is enough time to complete the next task step with an in-vehicle device in the prevailing driving situation. More implicit examples of combined demands include task-set switch costs (e.g., Pashler et al., 2001), and memory costs of task interruptions (e.g., Monk et al., 2004; Oulasvirta & Saariluoma, 2006). In the context of simultaneous multitasking, e.g., phone conversations while driving, one should be aware of the effects of intense conversation on one’s ability to react in time to sudden events, although the lane keeping and vehicle tailing tasks would seem to progress smoothly under the appropriate control (Horrey & Wickens, 2006). Most importantly, the driver has to be aware about how to combine the two tasks in an efficient and safe manner.
It is important to notice that it is not sufficient to be aware of all the prevailing demands in the dual-task situation. The driver should also be aware of how the situation will evolve and what the upcoming demands of the situation are (Endsley, 1995b: Level 3 SA). Thus, drivers’ expectations in relation to all the aforesaid contents of SA are an important target of analysis. For example, predictability of the upcoming demands of a visual secondary task can affect the driver’s awareness about when there is enough time to glance at an in-vehicle device and when it is the proper moment to do so.
Awareness of situational risks is an important part of the driver’s situation awareness, because it has been linked to drivers’ assessment of their own capabilities and driving task demands through the perceived safety margins (Summala, 1985; 1988; Fuller, 2005). Awareness of risks seems to be tightly related to emotional factors and the experience of task difficulty (Fuller, 2005). We can experience or feel a risk in a situation, although it is nothing directly observable. “Feeling of risk” in a situation is typically something to be avoided (Summala, 1985; 1988; Fuller, 2005). The zero-risk theory of Näätänen and Summala (1974) suggests that driver’s adaptive behaviors are directly related to the level of perceived risk. In normal driving that level is at zero, i.e., the drivers do not feel risks at all. Only when the driver starts to feel risk, compensation will begin. However, it seems that drivers adapt to the risks in driving through experiences of situations in which risky behaviors are left unpunished, which can lead to distortions in their subjective experiences of risks (Summala, 1985; 1988). Presumably, this will be the case also when continuously left unpunished of engagements to secondary activities (Hancock, Mouloua, & Senders, 2008). Thus, the subjectively sufficient safety margins for achieving the subjective strategic goals of a dual-task situation can deviate significantly from the objectively assessed levels of acceptable safety margins. Naturally unsafe motives can also lead to unsafe behaviors, even if the driver is correctly aware of the situational risks.
Finally, awareness of own situational capabilities and limitations affects all the above mentioned. Forms of demands and situational risks are individually

94
weighted through the awareness of one’s own capabilities in a situation, possibly based on previous experiences in similar situations. The exactly same situation can place totally different demands (e.g., workload) to different individuals depending on the individual capabilities (Huey & Wickens, 1993). If the picture of one’s own capabilities is distorted, the awareness of risks, the demands of the driving task, the secondary tasks, and the combined demands can also be incorrect or insufficient (e.g., Horrey, Lesch, & Garabet, 2008). There is evidence suggesting that on a general level, drivers are not fully aware of the level of their performance and the associated risks while dual-tasking (Lesch & Hancock, 2004; Garabet et al., 2007; Horrey et al., 2008; 2009). From the capacity-based point of view, some authors have suggested that high levels of cognitive workload in dual-task situations can have a negative effect on driver’s SA (e.g., Baumann et al., 2008), which could at least partially explain these findings. On the other hand, such situational factors as alcohol abuse or fatigue, or on a more general level, personal factors, such as poor self-evaluation skills, can explain the incorrect picture of driver’s own capabilities.
The practical challenge for the related content-based analyses and experimentation resides in how to reveal objectively aspects of these situational and, thus, dynamic, mental contents of participants in experimental settings. Mental contents and their construction processes can have unconscious automated as well as conscious components (Helfenstein & Saariluoma, 2006). One could try to capture, for example with verbal protocols, the conscious thoughts implying the contents of the corresponding time-sharing strategies drivers are aware of (Ericsson & Simon, 1984). However, the analysis of the related unconscious components requires theoretical understanding of these components followed by observations and objective measurements.
As the concept of situation awareness itself already implies, when studying the phenomenon, we are focusing on mental contents that reach one’s awareness in a particular situation (see Endsley, 1995b). This does not have to mean that the processing of the mental contents is conscious, i.e., that these contents are used as conscious knowledge (Rasmussen, 1987). Instead, we are interested in revealing what kind of task-relevant information (e.g., relevant objects in the surrounding scene or upcoming secondary task sequences) the subjects are aware of in any particular situation, and in what way (how inclusive/accurate/correct the information is). The content-based model of SA does not need to take into account the deeper structure of mental representations, i.e., to know whether they can be reduced to neural activity, or what are the origins of the consciousness in which the mental representations are represented. Here, the relatively easily acceptable unitary stance of Cowan (1988; 1997; 2000) on conscious awareness can be assumed, namely that awareness is a unified entity. The unitary stance means here that there cannot simultaneously be two separate conscious awarenesses in a single, neurologically normal human brain. This means that the perceived contents of different channels of information that are attended are somehow integrated or combined into a coherent awareness of the situation. This process can be called
95
apperception. Baars (1988) discusses this conscious awareness as a “global workspace”. Cowan (1988; 1997; 2000) goes further, identifying conscious awareness as the unitary focus of attention.
Although undeniably fruitful, here we can bypass these challenging questions related to the foundations and existence of conscious awareness. The content-based approach on situation awareness is simply based on the idea that the properties of the information contents of mental representations (mental contents), can be used to explain human behavior. In order to avoid the problems of techniques related to self-reported SA (e.g., memory decay in SAGAT), more objective methods, such as eye-tracking techniques in the case of visual tasks, can be developed for assessing the particular elements of SA as shown in FIGURE 4. This was also one of the goals in the following empirical research.
3.2 Empirical support for the content-based approach to IVIS interaction analysis
In this section, six original publications are introduced and discussed in order to further explicate the limitations of the capacity-based approach and to provide empirical support for the content-based approach to IVIS interaction analysis. The expectation for this empirical research was to reveal and find explanations for such phenomena and distraction effects of IVIS designs that the capacity-based research can not reveal or explain.
3.2.1 Research questions and hypotheses
The general research question behind the empirical research was: can the analysis of mental contents related to drivers’ situation awareness and tactical as well as strategic thinking, be used to explain drivers’ dual-task behaviors with IVIS and in what ways (Articles I-VI)? In addition, the research was aimed at providing evidence for the limitations of the capacity-based analyses of drivers’ dual-task performance, workload, and IVIS (Articles I-VI). Furthermore, through the individual case studies, the research aimed at finding efficient metrics of tactical task timing, task interruptability, task predictability, task prioritization, and situation awareness in the context of visual-manual secondary tasks, in order to guide the development of IVIS user interfaces (Articles III-VI). The research hypotheses per article were:
Article I: Enhancement of the awareness of driving task demands has a
significant positive effect on driving performance. Article II: While enhancement of the awareness of driving task demands has a
significant positive effect on driving performance, incorrect information on driving task demands has a significant negative effect

96
on driving performance. Analyses of cognitive capacity are not alone sufficient for understanding drivers’ situation awareness and the related behaviors, i.e., the level of workload cannot explain all the driving errors made by the drivers in the incorrect information condition.
Article III: Experience in the driving task is not alone a sufficient precondition for efficient time-sharing between the driving task and any secondary activity. Individual time-sharing and search strategies, as well as user interface features’ support for them, affect significantly drivers’ time-sharing efficiency and awareness of secondary task demands and consequently, overall situation awareness.
Article IV: IVIS testing methods of visual distraction that do not involve actual dual-tasking, and, thus, do not evaluate drivers’ time-sharing efficiency and situation awareness while driving, do not produce valid results, at least with all visual in-vehicle tasks.
Article V: Efficiency of visual time-sharing behavior, i.e., variances in glance duration distributions of glances directed at an in-vehicle device, can be used for assessing driver distraction on the tactical and strategic levels, as well as for assessing user interface features’ effects on tactical task timing.
Article VI: Metrics of time-sharing efficiency, in particular skewness of glance duration distributions of glances directed at an in-vehicle device, are related to and can be used as metrics of predictability and interruptability of visual in-vehicle tasks. Task predictability can be improved by increasing the consistency of task steps. In-vehicle task’s predictability affects drivers’ awareness of secondary task demands and, thus, situation awareness.
3.2.2 Article I
Karvonen, H., Kujala, T., & Saariluoma, P. (2006). In-car ubiquitous computing: driver tutoring messages presented on a head-up display. In Proceedings of the 9th International IEEE Conference on Intelligent Transportation Systems (pp. 560-565). Toronto, CA: IEEE.
Hypothesis: Enhancement of the awareness of driving task demands has a significant positive effect on driving performance.
In this experiment, we studied the effects of a Head-Up-Display (HUD) driver tutoring system on the situation awareness and driving performance of 24 participants. We tried to manipulate the situation awareness of the participants through the information provided with tutoring messages on the HUD. The messages contained information on the upcoming demands on the driving environment and related recommendations for a safer and more economical driving style. The study was conducted in a low-fidelity driving simulator and both qualitative and quantitative data was collected. The order of the trials (with – without tutoring system) was counter-balanced. The research methods used included thinking-aloud, lane excursion analysis, interviews, and

97
reduced NASA-TLX with two additional questions on system usefulness and obtrusiveness. Differences between novices and experienced drivers, as well as between male and female drivers were analyzed.
Main findings: The information on the upcoming demands of the driving task significantly decreased the number of lane excursions when compared to the trial without the system. This supports the hypothesis. It is suggested that the information facilitated anticipatory attention to upcoming situations and helped participants in their adaptation to problematic points on the road, such as roundabouts and sharp curves. There were no significant interaction effects of gender or level of driving experience and the system, although the experienced drivers made significantly less lane excursions in the trial with the system than the novices. The NASA-TLX questionnaire did not show any significant differences when comparing the ratings between the trials driven with the tutoring system and without the system. This suggests that the information provided did not increase or decrease participants’ level of workload.
3.2.3 Article II
Karvonen, H., Kujala, T., & Saariluoma, P. (2008). Ubiquitous co-driver system and its effects on the situation awareness of the driver. In Proceedings of the 2008 IEEE Intelligent Vehicles Symposium (pp. 337-342). Eindhoven, NL: IEEE.
Hypotheses: While enhancement of the awareness of driving task demands has a significant positive effect on driving performance, incorrect information on driving task demands has a significant negative effect on driving performance. Analyses of cognitive capacity are not alone sufficient for understanding drivers’ situation awareness and the related behaviors, i.e., the level of workload cannot explain all the driving errors made by the drivers in the incorrect information condition.
The general aim of this study was to explore how to analyze the effects of a co-driver system on the behaviors of drivers. In a driving simulation environment with 24 participants using a co-driver system, we investigated how they took and recovered from misinformation provided by the system. We tried to manipulate the situation awareness of the participants through the information provided with the co-driver messages on the Head-Up-Display. Some of the driving instructions included incorrect information on the upcoming curves. The effects of this incorrect information on participants’ situation awareness and driving performance were investigated. The research methods included thinking-aloud, lane excursion analysis, interviews, and NASA-TLX.
Main findings: The results support the hypotheses. While the driving performance was significantly improved with the correct guidance messages, the participants became confused with the first incorrect guidance messages, and several lane excursions occurred in these situations. The difference between the mean numbers of lane excursions as a whole was statistically significant when comparing the curve-taking with correct and incorrect information. The
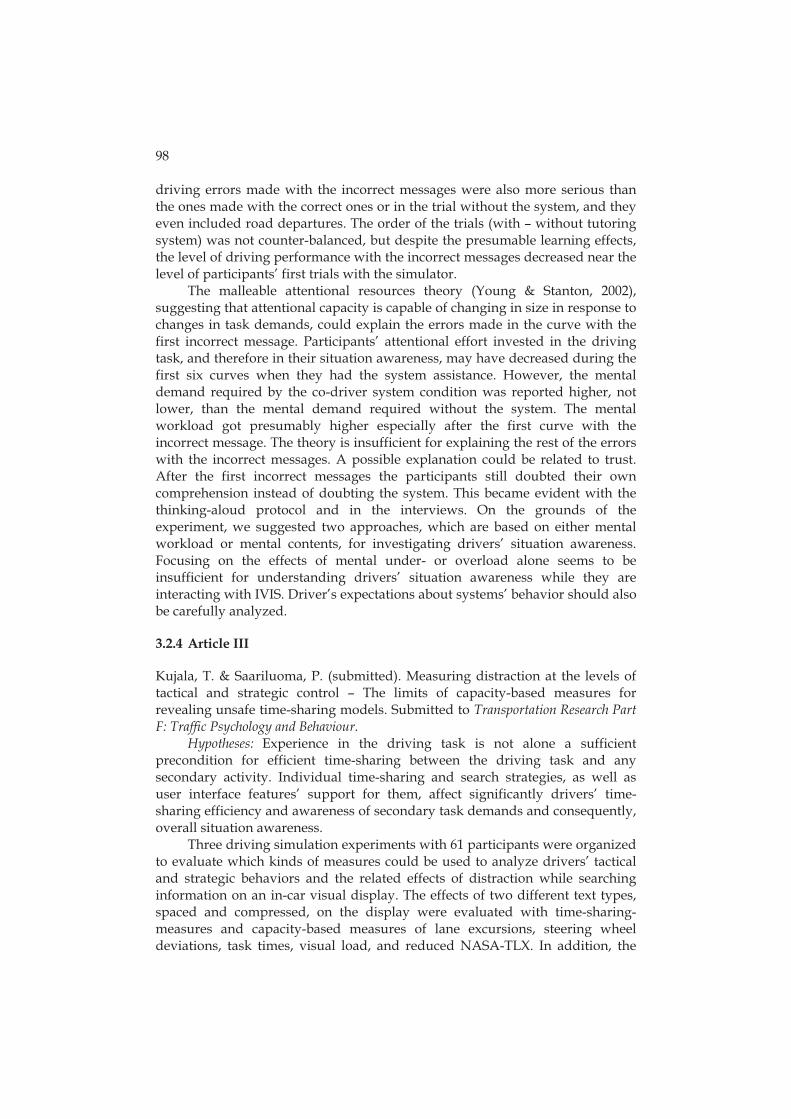
98
driving errors made with the incorrect messages were also more serious than the ones made with the correct ones or in the trial without the system, and they even included road departures. The order of the trials (with – without tutoring system) was not counter-balanced, but despite the presumable learning effects, the level of driving performance with the incorrect messages decreased near the level of participants’ first trials with the simulator.
The malleable attentional resources theory (Young & Stanton, 2002), suggesting that attentional capacity is capable of changing in size in response to changes in task demands, could explain the errors made in the curve with the first incorrect message. Participants’ attentional effort invested in the driving task, and therefore in their situation awareness, may have decreased during the first six curves when they had the system assistance. However, the mental demand required by the co-driver system condition was reported higher, not lower, than the mental demand required without the system. The mental workload got presumably higher especially after the first curve with the incorrect message. The theory is insufficient for explaining the rest of the errors with the incorrect messages. A possible explanation could be related to trust. After the first incorrect messages the participants still doubted their own comprehension instead of doubting the system. This became evident with the thinking-aloud protocol and in the interviews. On the grounds of the experiment, we suggested two approaches, which are based on either mental workload or mental contents, for investigating drivers’ situation awareness. Focusing on the effects of mental under- or overload alone seems to be insufficient for understanding drivers’ situation awareness while they are interacting with IVIS. Driver’s expectations about systems’ behavior should also be carefully analyzed.
3.2.4 Article III
Kujala, T. & Saariluoma, P. (submitted). Measuring distraction at the levels of tactical and strategic control – The limits of capacity-based measures for revealing unsafe time-sharing models. Submitted to Transportation Research Part F: Traffic Psychology and Behaviour.
Hypotheses: Experience in the driving task is not alone a sufficient precondition for efficient time-sharing between the driving task and any secondary activity. Individual time-sharing and search strategies, as well as user interface features’ support for them, affect significantly drivers’ time-sharing efficiency and awareness of secondary task demands and consequently, overall situation awareness.
Three driving simulation experiments with 61 participants were organized to evaluate which kinds of measures could be used to analyze drivers’ tactical and strategic behaviors and the related effects of distraction while searching information on an in-car visual display. The effects of two different text types, spaced and compressed, on the display were evaluated with time-sharing-measures and capacity-based measures of lane excursions, steering wheel deviations, task times, visual load, and reduced NASA-TLX. In addition, the
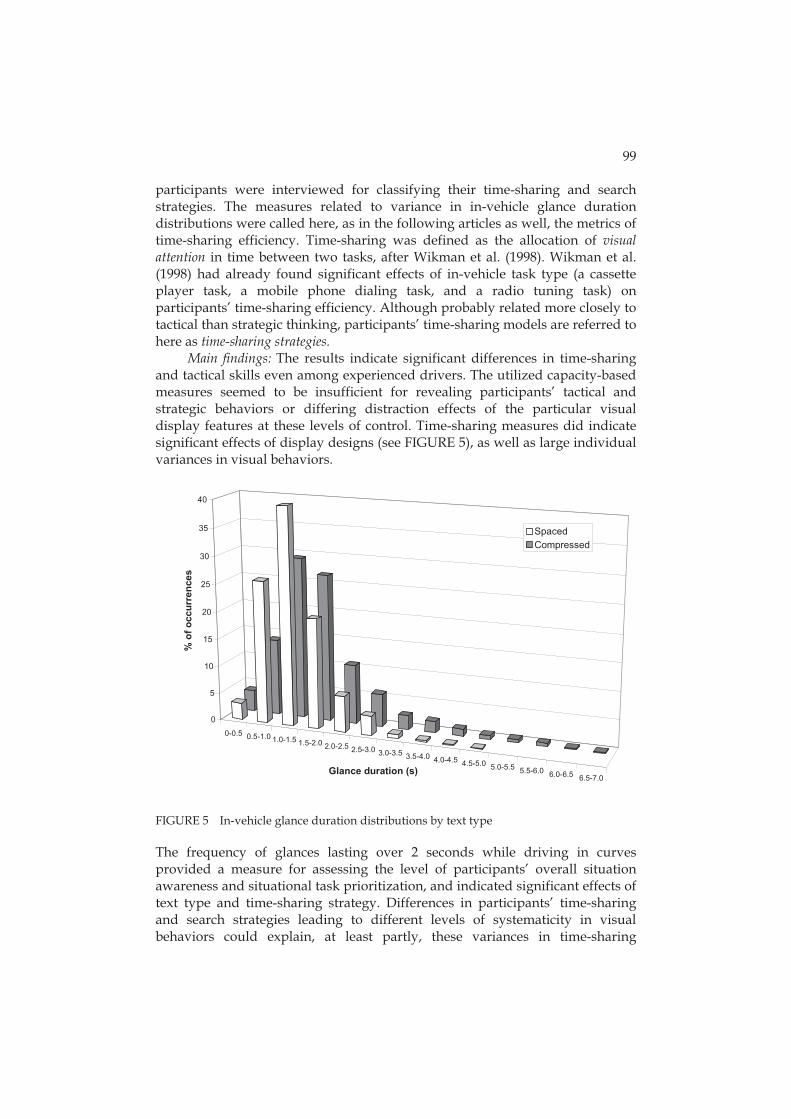
99
participants were interviewed for classifying their time-sharing and search strategies. The measures related to variance in in-vehicle glance duration distributions were called here, as in the following articles as well, the metrics of time-sharing efficiency. Time-sharing was defined as the allocation of visual attention in time between two tasks, after Wikman et al. (1998). Wikman et al. (1998) had already found significant effects of in-vehicle task type (a cassette player task, a mobile phone dialing task, and a radio tuning task) on participants’ time-sharing efficiency. Although probably related more closely to tactical than strategic thinking, participants’ time-sharing models are referred to here as time-sharing strategies.
Main findings: The results indicate significant differences in time-sharing and tactical skills even among experienced drivers. The utilized capacity-based measures seemed to be insufficient for revealing participants’ tactical and strategic behaviors or differing distraction effects of the particular visual display features at these levels of control. Time-sharing measures did indicate significant effects of display designs (see FIGURE 5), as well as large individual variances in visual behaviors.
0-0.5 0.5-1.0 1.0-1.5 1.5-2.0 2.0-2.5 2.5-3.0 3.0-3.5 3.5-4.0 4.0-4.5 4.5-5.0 5.0-5.5 5.5-6.0 6.0-6.5 6.5-7.0
0
5
10
15
20
25
30
35
40
% o
f occ
urre
nces
Glance duration (s)
SpacedCompressed
FIGURE 5 In-vehicle glance duration distributions by text type
The frequency of glances lasting over 2 seconds while driving in curves provided a measure for assessing the level of participants’ overall situation awareness and situational task prioritization, and indicated significant effects of text type and time-sharing strategy. Differences in participants’ time-sharing and search strategies leading to different levels of systematicity in visual behaviors could explain, at least partly, these variances in time-sharing
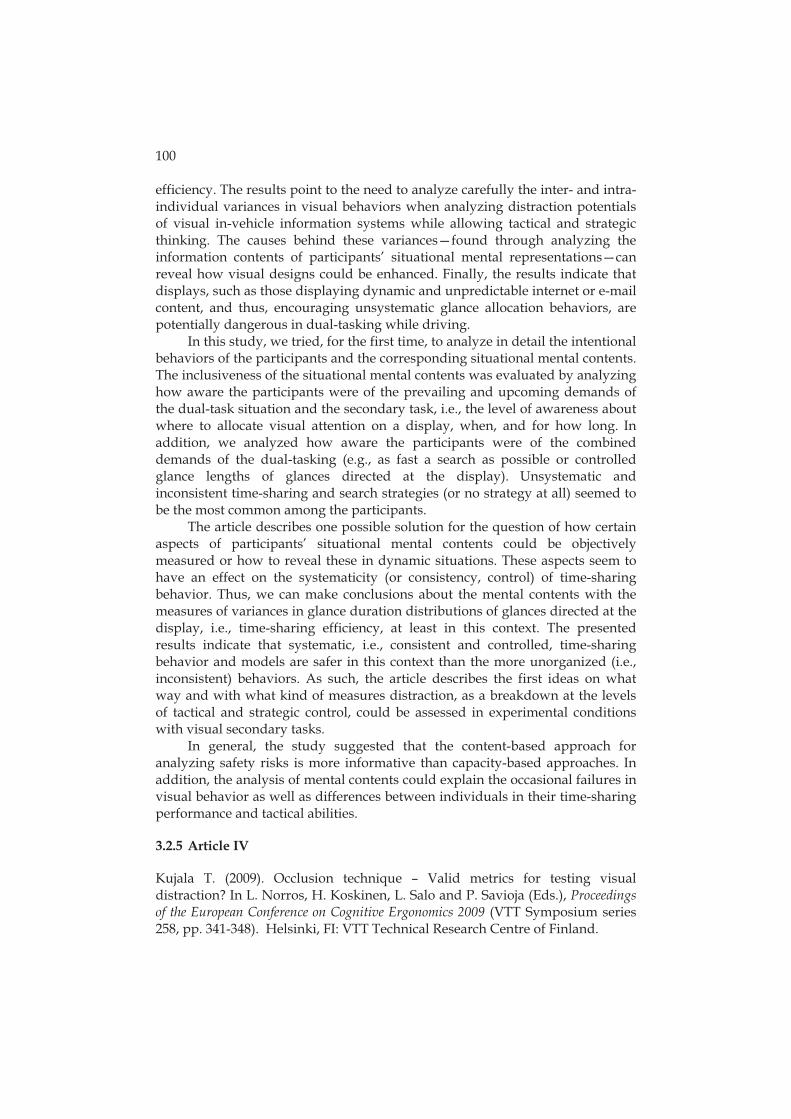
100
efficiency. The results point to the need to analyze carefully the inter- and intra-individual variances in visual behaviors when analyzing distraction potentials of visual in-vehicle information systems while allowing tactical and strategic thinking. The causes behind these variances—found through analyzing the information contents of participants’ situational mental representations—can reveal how visual designs could be enhanced. Finally, the results indicate that displays, such as those displaying dynamic and unpredictable internet or e-mail content, and thus, encouraging unsystematic glance allocation behaviors, are potentially dangerous in dual-tasking while driving.
In this study, we tried, for the first time, to analyze in detail the intentional behaviors of the participants and the corresponding situational mental contents. The inclusiveness of the situational mental contents was evaluated by analyzing how aware the participants were of the prevailing and upcoming demands of the dual-task situation and the secondary task, i.e., the level of awareness about where to allocate visual attention on a display, when, and for how long. In addition, we analyzed how aware the participants were of the combined demands of the dual-tasking (e.g., as fast a search as possible or controlled glance lengths of glances directed at the display). Unsystematic and inconsistent time-sharing and search strategies (or no strategy at all) seemed to be the most common among the participants.
The article describes one possible solution for the question of how certain aspects of participants’ situational mental contents could be objectively measured or how to reveal these in dynamic situations. These aspects seem to have an effect on the systematicity (or consistency, control) of time-sharing behavior. Thus, we can make conclusions about the mental contents with the measures of variances in glance duration distributions of glances directed at the display, i.e., time-sharing efficiency, at least in this context. The presented results indicate that systematic, i.e., consistent and controlled, time-sharing behavior and models are safer in this context than the more unorganized (i.e., inconsistent) behaviors. As such, the article describes the first ideas on what way and with what kind of measures distraction, as a breakdown at the levels of tactical and strategic control, could be assessed in experimental conditions with visual secondary tasks.
In general, the study suggested that the content-based approach for analyzing safety risks is more informative than capacity-based approaches. In addition, the analysis of mental contents could explain the occasional failures in visual behavior as well as differences between individuals in their time-sharing performance and tactical abilities.
3.2.5 Article IV
Kujala T. (2009). Occlusion technique – Valid metrics for testing visual distraction? In L. Norros, H. Koskinen, L. Salo and P. Savioja (Eds.), Proceedings of the European Conference on Cognitive Ergonomics 2009 (VTT Symposium series 258, pp. 341-348). Helsinki, FI: VTT Technical Research Centre of Finland.

101
Hypothesis: IVIS testing methods of visual distraction that do not involve actual dual-tasking, and, thus, do not evaluate drivers’ time-sharing efficiency and situation awareness while driving, do not produce valid results, at least with all visual in-vehicle tasks.
The occlusion technique provides popular metrics for assessing tasks’ visual demands and interruptability. In order to test the external validity of the occlusion technique for revealing distraction effects of visual in-vehicle information systems, the results of two driving simulation experiments were compared to those obtained with the occlusion technique. The effects of two different text types on time-sharing and driving performance metrics in simulated driving (see Article III) were compared to the results of the occlusion tests on the same visual secondary tasks. There were 34 participants in the two driving simulation experiments (Experiment 1: 16, Experiment 2: 18) and 20 participants in the occlusion experiment. The participants were interviewed after the experiments.
Main findings: Besides the long task completion times, the occlusion data underestimated the distraction effects of the visual tasks found in simulated driving. The selected tasks easily passed the qualitative criteria of successful task completion under occlusion although they were found as being potentially dangerous while driving in a simulated environment. Considering sensitivity for the potential distraction effects of display properties, task completion times, occluded or unoccluded, could not discriminate reliably between the two different text types. Time-sharing metrics could do this in the driving simulation even with a small number of participants. The R-ratio provided contradictory data on task interruptability compared to time-sharing data in simulated driving with these types of tasks. The results suggest that the external validity and sensitivity of the occlusion metrics might be questioned. There are visual tasks that do not suit being tested with the occlusion technique as defined in the ISO standard. These tasks involve information-filled displays that provide drivers with more freedom in interaction styles than simpler manual and visual controls. The underestimations of visual distraction indicate that additional evaluations with time-sharing metrics, involving actual or simulated driving, are highly recommended when assessing in-vehicle display prototypes with the occlusion technique.
The observed low R-ratios and the fact that the mean TSOTs were shorter than task times unoccluded with both text types in the occlusion experiment deserve an explanation. Foley (2008) speculates that participants probably feel time pressure with the occlusion procedure and therefore invest more effort in the task in the occluded condition than while unoccluded. Another explanation could be that the participant can process the task while occluded. A related question relates to what makes these types of visual tasks unsuitable for testing with the occlusion technique. An appealing explanation is that the task settings are not the same while driving, i.e., the ecological validity of the experimental conditions is low. Monk and Kidd (2007) argue that the occlusion period does not impose any additional cognitive demand on the participant in contrast to

102
the actual driving situation. Indeed, e.g., Pashler et al. (2001) provide evidence that human performance is rarely quite as efficient after task switches as when the operator is allowed to concentrate on a single task. Absence of task-set switch costs (Pashler et al., 2001; Sakai, 2008), memory effects of interruptions (Oulasvirta & Saariluoma, 2006), and participants’ abilities to utilize their iconic and short-term memory while occluded (see Sperling, 1960) could explain the absent dual-task costs in the occlusion-based experimental settings. In addition, the interviews indicated that there is more variation in time-sharing strategies and also in individual time-sharing skills in the driving context.
3.2.6 Article V
Kujala, T. (2009). Efficiency of visual time-sharing behavior – The effects of menu structure on POI search tasks while driving. In A. Schmidt, A. Dey, T. Seder, O. Juhlin and D. Kern (Eds.), Proceedings of the 1st International Conference on Automotive User Interfaces and Interactive Vehicular Applications (pp. 63-70). New York, NY: ACM Press.
Hypothesis: Efficiency of visual time-sharing behavior, i.e., variances in glance duration distributions of glances directed at an in-vehicle device, can be used for assessing driver distraction on the tactical and strategic levels, as well as for assessing user interface features’ effects on tactical task timing.
Building on the findings of Article III, the effects of two user interface menu structures, list and grid, on a mobile device display were compared in a driving simulation with the measures of visual time-sharing efficiency, visual load, lane excursions, and secondary task performance. Eighteen participants conducted a set of eight Point-of-Interest (POI) search tasks with the grid- or list-style menus on navigation software during simulated driving. After the trials, the participants were interviewed for their time-sharing strategies and task prioritization.
Main findings: Between-subject analysis revealed that the list-style menu structure supported more efficient and systematic, and, thus, safer interaction while driving than the grid-style menu, in terms of time-sharing and total glance time. However, significant effects of the menu structures were not found in the secondary task performance, in the driving performance measured as lane excursions, or in the measures of average duration of, or total number of, glances towards the display. The results also suggest that the fewer the items on a display, the more efficient and safer the interaction is in terms of time-sharing. The sensitivity of the time-sharing metrics in revealing tactical level driver distraction in a driving simulation can be argued to be higher than the sensitivity of metrics related to lane maintenance, visual load or secondary task performance. The results suggest that task complexity, measured as task times and errors, or visual load, in particular average in-vehicle glance durations, do not have to be in a direct relation to time-sharing efficiency. In addition, it seems that lapses at the tactical and strategic levels of control do not have to lead directly to lapses at the operational level of vehicle control.

103
3.2.7 Article VI
Kujala, T. & Saariluoma, P. (submitted). Task predictability in interaction with in-vehicle technologies – Measurement and support. Submitted to Ergonomics.
Hypotheses: Metrics of time-sharing efficiency, in particular skewness of glance duration distributions of glances directed at an in-vehicle device, are related to and can be used as metrics of predictability and interruptability of visual in-vehicle tasks. Task predictability can be improved by increasing the consistency of task steps. In-vehicle task's predictability affects drivers’ awareness of secondary task demands and, thus, situation awareness.
Continuing the analysis started in Article V, the purpose of this study was to analyze the effects of different design features of a mobile device on drivers’ time-sharing efficiency while driving and searching for Points-of-Interest with a mobile navigation software. Based on the results of Articles III and V, it was expected that the user interface features supporting more consistent, and, thus, more predictable interaction steps, would lead to more efficient time-sharing between driving and visual search tasks. The effects of the features were studied in two driving simulation experiments with 40 participants. The features included menu structures, touch screen scrolling methods, and touch screen functionality versus physical controls. In addition, the effects of the number of items on a display were analyzed. Participants’ time-sharing efficiency, search task performance, visual load, and driving performance (lane excursions and speed maintenance errors) were analyzed. Again, the participants were finally interviewed for their time-sharing strategies and task prioritization.
Main findings: As hypothesized, interaction with the list-style menu while driving led to smaller variance in durations of glances directed at the device than with a grid-style menu (see FIGURE 6), which was observed in particular with displays featuring nine items. In addition, touch screen scrolling with buttons supported less variance in in-vehicle glance durations than kinetic scrolling, in particular when comparing the numbers of very short (<400 ms) glances. The touch screen functionality did not significantly diminish the negative effects of the grid-menu on time-sharing when compared to the physical controls with the list-menu. However, the more inconsistent movements required for the cursor with the physical multifunction controller in the grid-menu seemed to increase these negative effects.
During the dual-tasking with the physical multifunction controller, the participants learned to find and select the often repeated functions of the software (e.g., Options and Search) without visual attention at the device. A related tactical finding could partly explain participants’ more efficient time-sharing efficiency with the List-menu, compared with the Grid-menu, via higher task predictability. With the List-menu, the participants were often able, after locating the target item, to quickly estimate the required steps to the item, and perform the required movement of the cursor without visual attention. The
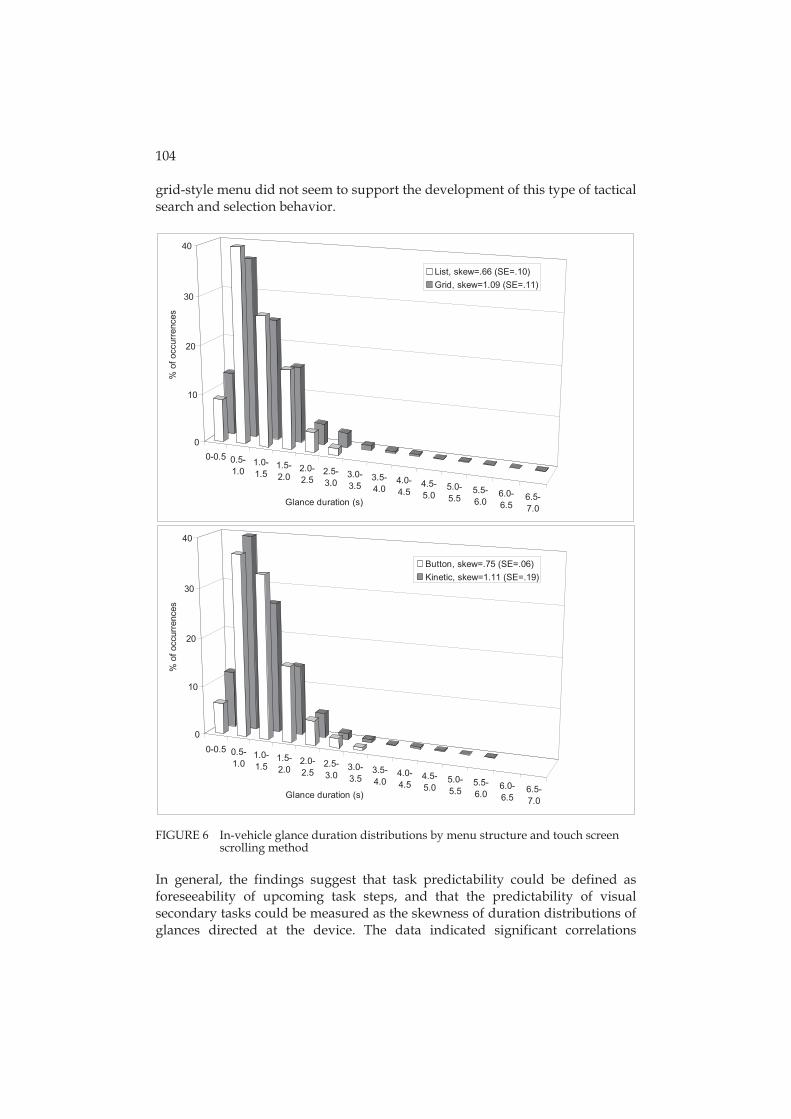
104
grid-style menu did not seem to support the development of this type of tactical search and selection behavior.
0-0.5 0.5-1.0
1.0-1.5
1.5-2.0
2.0-2.5
2.5-3.0
3.0-3.5
3.5-4.0
4.0-4.5
4.5-5.0
5.0-5.5
5.5-6.0
6.0-6.5
6.5-7.0
0
10
20
30
40
% o
f occ
urre
nces
Glance duration (s)
List, skew=.66 (SE=.10)Grid, skew=1.09 (SE=.11)
0-0.5 0.5-1.0
1.0-1.5
1.5-2.0
2.0-2.5
2.5-3.0
3.0-3.5
3.5-4.0
4.0-4.5
4.5-5.0
5.0-5.5
5.5-6.0
6.0-6.5
6.5-7.0
0
10
20
30
40
% o
f occ
urre
nces
Glance duration (s)
Button, skew=.75 (SE=.06)Kinetic, skew=1.11 (SE=.19)
FIGURE 6 In-vehicle glance duration distributions by menu structure and touch screen
scrolling method In general, the findings suggest that task predictability could be defined as foreseeability of upcoming task steps, and that the predictability of visual secondary tasks could be measured as the skewness of duration distributions of glances directed at the device. The data indicated significant correlations
105
between the skewness of the in-vehicle glance duration distributions and the following variables: maximum glance durations, standard deviation of glance durations, and the frequency of glances shorter than 400 ms. It also seemed that the measure of skewness is more sensitive than standard deviation and the most safety-relevant variable for assessing the variance of the log-normally distributed in-vehicle glance duration distributions. This is due to its relation to the extent of the right-hand tail of the distribution. Overall, the results seem to give support for the hypothesis that in-vehicle task predictability can be improved by increasing the consistency of task steps.
3.2.8 Discussion of the empirical evidence
In general, the empirical research gave support for the research hypotheses. The experiments indicated that the analysis of mental contents related to drivers’ situation awareness and tactical as well as strategic thinking can be used to explain drivers’ dual-task behaviors with IVIS. In addition, the research provided further evidence for the limitations of the capacity-based analyses of drivers’ dual-task performance, workload, and IVIS. Furthermore, novel and efficient content-based metrics applicable for measuring tactical task timing, task predictability, task interruptability, situational task prioritization, and situation awareness in the context of visual search tasks were found and tested successfully.
Articles I-II
Experiments presented in Articles I and II indicated that the manipulation of drivers’ situation awareness through providing information of the upcoming driving task demands had significant effects on their driving performance. Article I indicated that the enhancement of situation awareness related to the awareness of driving task demands had a significant positive effect on driving performance. This finding is in line with previous research (e.g., Endsley, 1995; Kass, Cole, & Stanny, 2007). Interestingly, the information provided did not affect participants’ self-reports on subjective workload.
In addition, Article II provided evidence that while the enhancement of drivers’ situation awareness related to the awareness of driving task demands had a significant positive effect on their driving performance, incorrect information had a significant negative effect on driving performance. The experiment also revealed that the analyses of cognitive capacity alone are insufficient for understanding drivers’ situation awareness and the related behaviors. The level of workload (i.e., underload) could not explain all the driving errors made by the drivers in the incorrect information condition. Instead, at least some of the errors can be attributed to the incorrect information on the demands of the driving task, and to the participants’ trust and expectations towards the system’s behavior.
In these two articles, the analyses of participants’ situation awareness were still on a subjective level through thinking-aloud and post-experiment

106
interviews. In addition, the level of SA was inferred indirectly from the measures of driving performance.
Articles III-VI
Articles III-VI gave further support for the research hypotheses presented. The driving simulation experiments presented in Articles III-VI indicated that the manipulation of drivers’ situation awareness had significant effects on their time-sharing efficiency and situational task prioritization, as well as to certain degree, on driving performance and visual load. This manipulation took place through user interface designs supporting different levels of task predictability, and, thus, awareness of upcoming secondary task demands.
The results presented in Article III indicated that experience in the driving task does not mean that a driver is capable to efficient time-sharing between the driving task and any secondary activity. In addition, the results indicated that individual time-sharing strategies, as well as user interface features’ support for them, affect significantly drivers’ time-sharing efficiency and awareness of secondary task demands, and consequently, overall situation awareness.
Research in Article IV indicated, as hypothesized, that a capacity-based IVIS testing method, the visual occlusion technique, did not produce valid results compared to driving simulation studies. This finding was suggested to apply at least to tasks that involve information-filled displays, providing drivers with more freedom in interaction styles than simpler manual and visual controls. The occlusion technique does not involve actual dual-tasking, and thus, do not evaluate drivers’ time-sharing efficiency and situation awareness while driving.
The central contribution of the research presented in Articles III-VI was the novel metrics for assessing drivers’ time-sharing efficiency, situational task prioritization, situation awareness, as well as visual in-vehicle task’s interruptability and predictability. FIGURES 7 and 8 illustrate the associations of task predictability and task interruptability to participants’ glance duration distributions of glances directed at IVIS.
Higher predictability Lower predictability
Glance duration (s) Glance duration (s)
% o
f occ
urre
nces
% o
f occ
urre
nces
FIGURE 7 Illustration of the effects of task predictability on glance duration distributions
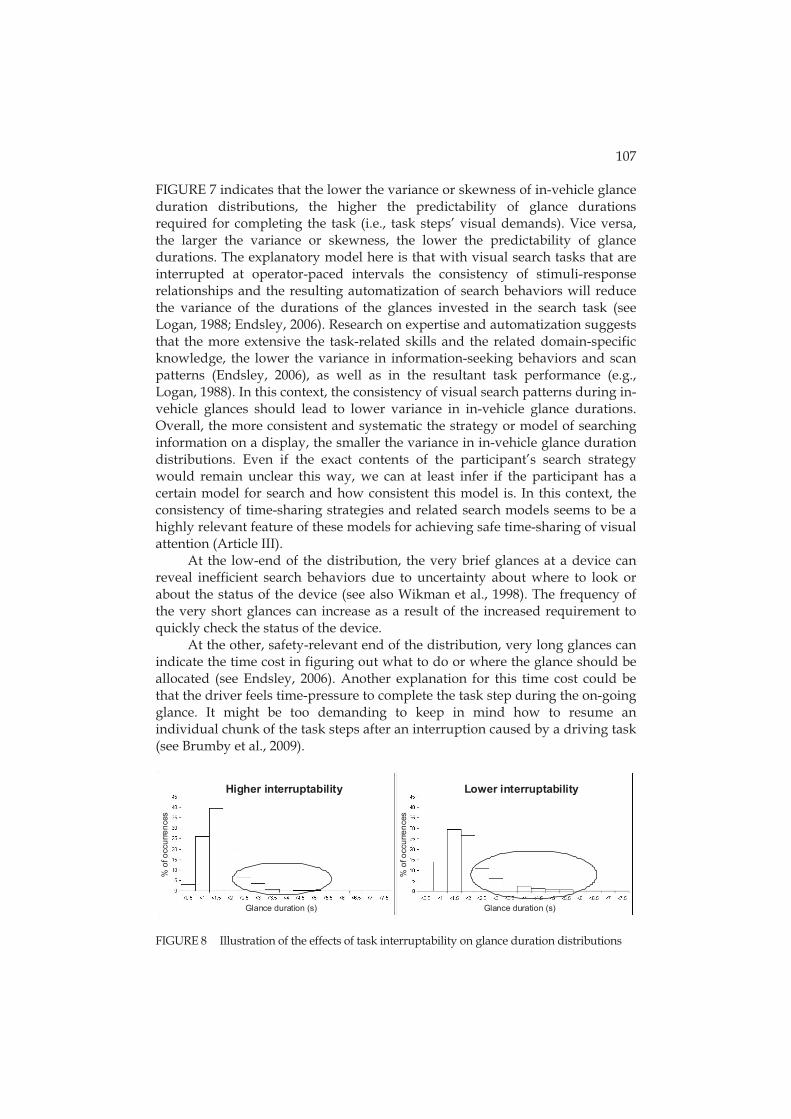
107
FIGURE 7 indicates that the lower the variance or skewness of in-vehicle glance duration distributions, the higher the predictability of glance durations required for completing the task (i.e., task steps’ visual demands). Vice versa, the larger the variance or skewness, the lower the predictability of glance durations. The explanatory model here is that with visual search tasks that are interrupted at operator-paced intervals the consistency of stimuli-response relationships and the resulting automatization of search behaviors will reduce the variance of the durations of the glances invested in the search task (see Logan, 1988; Endsley, 2006). Research on expertise and automatization suggests that the more extensive the task-related skills and the related domain-specific knowledge, the lower the variance in information-seeking behaviors and scan patterns (Endsley, 2006), as well as in the resultant task performance (e.g., Logan, 1988). In this context, the consistency of visual search patterns during in-vehicle glances should lead to lower variance in in-vehicle glance durations. Overall, the more consistent and systematic the strategy or model of searching information on a display, the smaller the variance in in-vehicle glance duration distributions. Even if the exact contents of the participant’s search strategy would remain unclear this way, we can at least infer if the participant has a certain model for search and how consistent this model is. In this context, the consistency of time-sharing strategies and related search models seems to be a highly relevant feature of these models for achieving safe time-sharing of visual attention (Article III).
At the low-end of the distribution, the very brief glances at a device can reveal inefficient search behaviors due to uncertainty about where to look or about the status of the device (see also Wikman et al., 1998). The frequency of the very short glances can increase as a result of the increased requirement to quickly check the status of the device.
At the other, safety-relevant end of the distribution, very long glances can indicate the time cost in figuring out what to do or where the glance should be allocated (see Endsley, 2006). Another explanation for this time cost could be that the driver feels time-pressure to complete the task step during the on-going glance. It might be too demanding to keep in mind how to resume an individual chunk of the task steps after an interruption caused by a driving task (see Brumby et al., 2009).
Higher interruptability Lower interruptability
Glance duration (s) Glance duration (s)
% o
f occ
urre
nces
% o
f occ
urre
nces
FIGURE 8 Illustration of the effects of task interruptability on glance duration distributions

108
FIGURE 8 shows that the shorter and slimmer the tail of the in-vehicle glance duration distributions, the higher the interruptability of the visual task. Accordingly, the longer and fatter the tail of the glance durations, the lower the interruptability of the visual task. In this model, the level of visual task’s interruptability is an outcome of task predictability. Possible measures of task interruptability could include, e.g., maximum glance durations and the frequency or proportion of over-[adjustable limit]-second glances at the in-vehicle device. The empirical results (Articles III-VI) also suggest that the awareness of secondary task demands in relation to the driving task demands can affect driver’s awareness of the combined demands of the dual-task situation and, thus, task timing and task prioritization. Drivers’ situation awareness and situational task prioritization were measured by the frequency of over-1.6-second and over-2-second glances at the in-vehicle device while driving in curves. An important feature of the developed metrics of task predictability, interruptability, and SA, is that they can be used for comparison between particular design features in any type of experimental design with self-paced in-vehicle tasks involving visual elements and priority in driving task. The empirical studies indicated that the metrics are very sensitive to small but safety-relevant differences in visual display properties affecting drivers’ visual behaviors.
In Article VI, we suggested a definition for in-vehicle task predictability: task predictability = foreseeability of the upcoming task steps. In the case of visual tasks, task steps are the task sequences between interruptions by the driving task. The two experiments in Article VI, in addition to Article III, indicated that interaction design can possibly improve task predictability by increasing the consistency of task sequences via:
• well-defined task steps, • task steps of equal length, • decreasing the possibilities for different interaction styles, and • providing discriminative cues (assumed here to affect awareness of
where to resume search after an interruption).
All of these factors can improve the consistency of task steps (see Schneider & Shiffrin, 1977; Shiffrin & Schneider, 1977), and, thus, lower the level of uncertainty regarding the consequent task steps after interruptions. Accordingly, the model of explanation for the observed user interface feature’s effects on task predictability was that the lower the level of support for foreseeable interaction steps in an in-vehicle user interface, the lower the task predictability and consequently, task interruptability while driving. The relative importance of the aforesaid factors remains yet unclear.
In Article VI, a candidate metric for task predictability of visual in-vehicle tasks was introduced:

109
TP = 1 - skew(gd), where TP = task predictability, skew(gd) = skewness of in-vehicle glance duration distribution, and
gd = lognormal glance duration distribution of glances at an in- vehicle device.
Skewness of the glance duration distributions seemed to be more sensitive than the measures of variance (standard deviation) for indicating changes in the form of the log-normally distributed in-vehicle glance duration distributions (Articles III, V, and VI). This measure takes into account the inter-individual differences in visual behaviors, because the average glance durations do not have to be at the same level across participants. In addition, there is potential that the metric may be used for comparisons of task predictability between time-sharing data obtained in various self-paced task settings during driving tasks with randomized and varying visual demands. These types of cross-experiment comparisons with the metrics of driving performance or visual load due to differences in particular task difficulty settings (see Young et al., 2008a, and Section 2.2) are typically challenging. The obvious limitation of this operationalization of task predictability is that it applies only for tasks involving visual interaction.
The metrics of task predictability can be used in particular for assessing intuitiveness and consistency of interaction in first-time contact with an IVIS during driving. It can be used for assessing how easily the visual demands of the interaction can be learned and automaticity in search behaviors developed. In particular learning curves on these metrics should be analyzed, in a fashion similar to that in Jahn, Krems, and Gelau (2009). Individual learning through practicing a task should increase the level of task predictability (e.g., Endsley, 2006; Logan, 1988).
Case studies III-VI gave empirical support for our model of task predictability by comparing three different user interface features that differed not in the amount of information provided, but on qualitative aspects assumed to affect the foreseeability of task steps (see FIGURE 9):
• Spaced vs. Compressed text (step definition, discriminative cues,
possibilities for different interaction styles) • List vs. Grid menu structure with physical multifunction controller
(discriminative cues, possibilities for different interaction styles) • Button vs. Kinetic scrolling on touch screen (step definition, step length,
possibilities for different interaction styles) [Notice. Kinetic is not the same as sweeping with well-defined regular movement of the menu by a single sweep.]
It is important to notice here that task predictability due to an interaction style with a device or the qualitative design features of the device certainly does not relate directly to task complexity, workload, or cognitive capacity, although it

110
can interact with these factors (see e.g., Brumby et al., 2007; 2009). The user interface features studied in Experiments III-VI are in fact such that it is improbable that these would have been taken under capacity-based comparative testing in the first case. The amount of information on the displays was kept at a fixed level between the display designs under comparison. However, it seems that the qualitative aspects of display designs, i.e., how the information is presented, comes more and more important as the amount of information to be displayed increases (Articles IV-VI). This should be acknowledged, because the current trend is to increase the amount of information made available for the driver. In addition, people seem to be willing to use and also demand more information while driving (see the interview results in Articles V & VI). Articles IV-VI indicate that the significance of these types of metrics will increase, as more information is provided for the driver in the IVIS under testing.
Text Menu structure
(multifunction controller)Scroll method(touch screen)
Sdsdsd sds sds dssds dssddsssdsd Sdsdsdsds dssdsdsdss sdSd sdsdsdsd ssdsdsds dsdsdsssdsdsds dsdsdsd Sddsd sdsdsdsdsdsdsd Sdsdsdsdssd sds
x
Taskpredictability
LowH
igh
x
Sdsdsd sds sds dssds dssddssd
Sdsd sdsdsds dsdssd
Sd sdsdsdsd ssdsds dsdsds
Sdsdsd sdsdsd sddsd sdsdsd
Sdsdsdsd sdsdsdsdssd
FIGURE 9 Illustration of the effects of different qualitative user interface design features
on task predictability The capacity-based metrics utilized in the experiments provided only indirect, and typically non-significant, clues of the negative effects of display design features on drivers’ visual behaviors. The metrics were those of reduced NASA-TLX, secondary task performance, visual load, occlusion, lane excursions, steering wheel deviations, and speed maintenance. With the help of additional or different performance or workload metrics, the effects could have been more

111
readily visible. However, these findings supported our general research hypothesis of the limited explanatory power of the capacity-based metrics (see in particular Articles III and IV).
The empirical research presented suggests that the metrics of time-sharing efficiency, task predictability, task interruptability, task prioritization, and situation awareness could also be further developed. These metrics seem also to be worth of developing. Analysis of detailed gaze paths at the display (e.g., Goldberg & Kotval, 1999; Baccino & Colombi, 2000), could be in addition utilized for revealing inconsistency and inefficiency in visual search patterns and, thus, indicating low levels of task predictability.
Furthermore, the experimental designs could be improved in order to assess participants’ learning curves and automatization processes of search behaviors. So far, the dual-task experiments were focused on first-time experience in a rather limited time-frame, and the longitudinal effects of learning were not analyzed on a detailed level. However, the research implies that the IVIS design can have significant effects on the rate of the automatization processes on dual-tasking (e.g., Article VI). Longitudinal metrics for assessing the speed of automatization in information search to evaluate the effects of different user interface designs should be developed.
The metrics of situation awareness and situational task prioritization utilized in Articles III-VI, i.e., frequency of very long glance durations in relation to the curvature of the road, were still at a very low level. There are plenty of different other factors that can affect the level of visual demands of the driving task. Although proven sensitive to the effects of task predictability, these measures could be further developed to enable a more detailed analysis about the acceptability of drivers’ time-sharing and task prioritization behaviors in relation to the demands of a particular situation. It could be much easier to quantify the level of a particular driving situation’s visual demands than to quantify the hypothetical level of driver workload in the situation (see Horrey & Wickens, 2007). The visual demands of any driving situation could be quantified for example with a maximum threshold for acceptable in-vehicle glance duration at the situation.
Besides the dynamic maximum glance limits for assessing the driver’s situational tactical abilities, these calculations could be utilized for defining situations in which it is not rational to glance off the road in the first place, i.e., in which the driving task should be prioritized. This would be the case in situations where taking eyes off the road would be risky because of the high visual demands of the driving task and because there is too little time to acquire any meaningful information from the display, given some task-set switch costs and gaze transition time. In this way, drivers’ strategic level decisions on task prioritization, i.e., on what types of situations they choose to engage in the visual secondary tasks, could be analyzed in more detail. It may well be that this task prioritization can be affected by IVIS design factors contributing to the secondary task’s ignorability (Lee et al., 2008). The information could also be

112
utilized in the development of distraction warning systems (e.g., Engström & Victor, 2008).
About the driving simulation environment
Finally, to be fair, the same criticism that was presented in Section 2.2 for the capacity-based research on driver distraction has to be considered for the research discussed here. The external validity of the results can be argued to be higher than the validity of results obtained in the capacity-based experimentation. This is due to the self-paced secondary tasks and priority in the driving task, as well as to the encouragement of participants to utilize their own means to handle the dual-task situations. In addition, the focus of measurements was, above all, on participants’ visual behaviors and situation awareness rather than on the levels of driving performance or workload. However, the use of driving simulation instead of on-road studies can be the subject of major criticism.
Besides illustrating the development of the level of research, the articles also bring out the improvements in the research tools used. Eye-tracking techniques, measurements, and the related scripts for automating data analysis have been constantly improved. The driving simulation environment at the Agora User Psychology Laboratory used in the experiments was developed during the research process with a grant from the Henry Ford Foundation. The fidelity of the simulation was gradually improved from low-fidelity to a mid-level setup (after classification by Young et al., 2008a). The latest version included parts of a real passenger car’s cockpit and side views for providing a greater sense of movement and immersion (see FIGURE 10). According to Young et al. (2008a), the validity of the results obtained in driving simulators can be affected by the level of simulator fidelity. Driving and visual detection in simulators of lower fidelity can be more sensitive to the effects of distraction, which can affect participants’ visual behaviors. In addition, simulated driving is rarely identical to real driving, and thus, practice is always required, also in case of experienced drivers. One could say that there were actually two new tasks presented for the participants. This was taken into account in the experiments reported in Articles II-VI (Article III, Experiments 1 and 3 excluded). In addition to a typical driving practice of about 5 minutes, the participant was provided with additional practice of driving with the baseline trial before the dual-task trial took place. Also the gradually increased fidelity of the driving simulation might have helped the participants to get acquainted faster with the simulated driving task.
The use of driving simulation instead of on-road studies can be justified in this case with the nature of the secondary tasks. In the simulation environment the hazardous situations plausible in real environment could be avoided. Further justification for the use of driving simulator can be found in the research by Lee, Lee, Cameron, and Li-Tsang (2003). They investigated the possibility of using simple PC-based equipment for identifying problematic or unsafe older drivers. Their research indicates that it is possible to measure
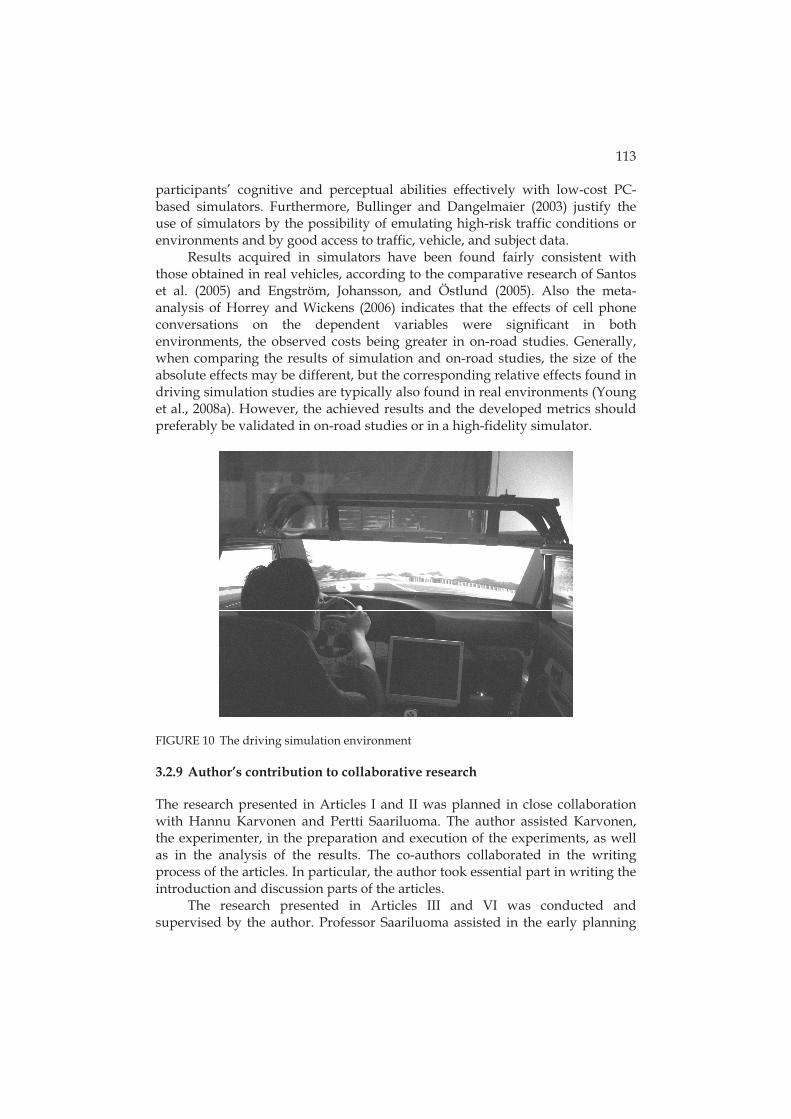
113
participants’ cognitive and perceptual abilities effectively with low-cost PC-based simulators. Furthermore, Bullinger and Dangelmaier (2003) justify the use of simulators by the possibility of emulating high-risk traffic conditions or environments and by good access to traffic, vehicle, and subject data.
Results acquired in simulators have been found fairly consistent with those obtained in real vehicles, according to the comparative research of Santos et al. (2005) and Engström, Johansson, and Östlund (2005). Also the meta-analysis of Horrey and Wickens (2006) indicates that the effects of cell phone conversations on the dependent variables were significant in both environments, the observed costs being greater in on-road studies. Generally, when comparing the results of simulation and on-road studies, the size of the absolute effects may be different, but the corresponding relative effects found in driving simulation studies are typically also found in real environments (Young et al., 2008a). However, the achieved results and the developed metrics should preferably be validated in on-road studies or in a high-fidelity simulator.
FIGURE 10 The driving simulation environment
3.2.9 Author’s contribution to collaborative research
The research presented in Articles I and II was planned in close collaboration with Hannu Karvonen and Pertti Saariluoma. The author assisted Karvonen, the experimenter, in the preparation and execution of the experiments, as well as in the analysis of the results. The co-authors collaborated in the writing process of the articles. In particular, the author took essential part in writing the introduction and discussion parts of the articles.
The research presented in Articles III and VI was conducted and supervised by the author. Professor Saariluoma assisted in the early planning

114
phase of the experiments presented in the articles, and took part in writing parts of the introductions and discussions.
The content-based psychology and foundational analysis has been founded by Saariluoma as an outcome of his prior research (e.g., Saariluoma, 1990; 1992; 1995; 1997; 2001; 2003; Saariluoma et al., 2008). The presented content-based approach for analyzing driver distraction would not have been generated without this tradition and the fruitful discussions with Saariluoma on the topic.

4 GENERAL DISCUSSION
In this chapter, the key findings are summarized and discussed briefly in the larger framework of scientific progress. After this, the approaches for analyzing distraction effects of IVIS discussed in the thesis and the approaches for the experimental analysis of human-technology interaction in general, are explicated. Finally, the thesis ends with a discussion on the contributions of the research.
4.1 Summary
Firstly, the empirical results indicated that the manipulation of drivers’ situation awareness through providing information, either correct or incorrect, of the upcoming driving task demands had significant effects on their driving performance. Secondly, awareness of secondary task demands while dual-tasking, i.e., awareness about the current and upcoming steps of the interaction, was found to affect drivers’ time-sharing efficiency, situational task prioritization, and overall situation awareness. At a general level, the experiments indicated that the analysis of mental contents related to drivers’ situation awareness and tactical as well as strategic thinking can be used to explain drivers’ dual-task behaviors with IVIS. In addition, the research provided evidence for the limitations of the capacity-based analyses of drivers’ dual-task performance, workload, and IVIS. Furthermore, novel, efficient, and sensitive content-based metrics for measuring driver’s tactical task timing, situation awareness, situational task prioritization, task predictability, and task interruptability were discovered and successfully tested. All the metrics were based on the psychologically grounded idea that variance in behaviors is decreased through automatization and learning, i.e., the more consistent the behaviors, the more aware the driver is about what to do. The metrics can be utilized, in particular, for assessing driver distraction at the tactical and strategic levels of control, as well as for evaluating IVIS designs’ effects on the drivers’ tactical abilities. This concerns especially the effects of user interfaces including visual and manual controls. The results indicate that the significance of these types of metrics increases the more information is provided for the driver in the IVIS under testing.

116
The (at least partially) answered questions related to driver distraction include:
• What is the scope and what are the limitations of capacity-based thinking, measures and experimental settings in driver distraction research?
• How to assess drivers’ tactical task timing and strategic task prioritization abilities in dual-task situations?
• How to analyze drivers’ tactical and strategic thinking and the related situational interaction models with IVIS?
• How to measure drivers’ situation awareness and situational task prioritization in dynamic self-paced driving scenarios?
• How to measure task predictability and task interruptability of visual secondary tasks?
• What kind of IVIS user interface design solutions can support the formation of systematic, consistent, and safe time-sharing models of visual attention while driving?
Still (at least partially) unanswered remain the following questions:
• Is the increased variability in durations of glances directed at certain IVIS designs due to more inconsistent gaze paths at the IVIS display (as assumed) or due to some other factor? Although a small mobile device requires great accuracy to enable eye-tracking for this type of analysis, this could possibly be technically achieved by expanding the mobile software display designs to a larger display.
• What exact mechanisms and particular types of user interface features contribute to secondary task predictability, interruptability, resumability, and ignorability?
• What is the relative importance of these user interface features? • What could the optimal reference tasks be for comparisons between IVIS
user interface designs (see Young et al., 2008a)? • How do the current findings relate to the general visual sampling
models and how could they be implemented in them (e.g., Wierwille, 1993; Wickens & Horrey, 2008)?
• How do the achieved results and the developed metrics relate to real-world dual-tasking behaviors? The results and the metrics should be preferably validated in on-road studies or in a high-fidelity simulator.
• What set of measures should be utilized in what types of experimental designs in order to test IVIS distraction effects on multiple levels of control in a holistic and valid way?
This is just the beginning. While the developed metrics seem to be highly promising already, there is still work to do in further developing the metrics and the experimental settings in order to provide more reliable and more valid results. In particular, what applies especially for the capacity-based experimental research applies also to the most of my experimental research so far: that is, the distraction experiments are typically cross-sectional, and the

117
effects of learning are often neglected. In future research, metrics for a more longitudinal approach could be developed in order to assess how fast the automatization of secondary tasks and dual-tasking can be. The current research, in particular that in Article VI, implies that user interface design can have significant effects on the rate of these processes. Also the content-based approach needs to be further developed in order to better analyze the situational information contents of drivers’ tactical and strategic thinking in dual-task conditions. The task seems to be extremely difficult but not impossible. Naturally, the type of foundational analysis that was done for the foundations of the central concepts of the capacity-based thinking should be also conducted for the content-based concepts.
At the general level, it is evident, from the literature review and the empirical research, that there are multiple mechanisms of multitasking interference and driver distraction working at multiple levels of control while we are occupied with driving and with other ongoing activities. In addition, the levels of control are interacting with each other in realistic traffic environments (Lee et al., 2008). This research illustrates that the capacity-based paradigms have limits in their power of expression in relation to these mechanisms. Reference to excess workload as an explanation for human error in dual-task situations stays on a surface level and prevents us from asking important questions about what the exact mechanisms behind these failures of control are. There are important additional levels of analysis which should not be left aside when we investigate driver-IVIS interaction. According to this research, perhaps the most important complementary explanatory framework is the information content of drivers’ mental representations (mental contents). However, this level of analysis seems to be typically neglected in a tacit manner in experimental driver distraction research. We often pay attention to behavioral adaptation, mental models, and strategies, but the analysis of the related information contents has stayed on a minimal level.
From the content-based point of view, the mental contents are decisive for understanding human behavior. To explain the differences in drivers’ behavioral patterns and in their respective mental representations, tactical and strategic thinking, and situation awareness, we need to extend the analysis to mental contents. This approach can aid in revealing all the relevant mechanisms of driver distraction that are required for making conclusions on what should be banned and what is safe while driving, but also for enabling well-grounded, safer interaction design decisions and counter-measures for unsafe behaviors. The explication of the exact mechanisms of distraction and their implications is potentially more fruitful than seeking a hypothetical and straightforward relationship between device use and driving performance effects, either in experiments or in crash statistics (Tijerina, 2001).
According to a famous historian of science, Thomas Kuhn (1962/1970), different paradigms of a particular research discipline are incommensurable. Indeed, there seems to be a radical change in the central concepts and in the presuppositions of the capacity- and content-based approaches to driver

118
distraction. They also define in very different manners the relevant problems and research targets of the scientific discipline in question. However, they can be seen as complementary rather than incommensurable points of view. Theoretically, the main point here is that mental contents may provide us with an important conceptualization equal to that provided by mental capacity or workload in explaining human-technology interaction phenomena. These are not contradictory but complementary foundational concepts (Saariluoma, 1997). This means that we can use content-based psychological analysis in solving problems that are different from those handled by the capacity-based analysis.
While the science makes progress, we don’t necessarily have to abandon all the assumptions of the previous or competing paradigm. Instead, we will have to find ways to match them with research problems to which they can provide answers. For example, more efficient communication between disciplines (e.g., neurobiology and cognitive psychology) could perhaps reveal the phenomenon under research better as a whole than before. This progress would require that the varying contents of the same concepts used in different ways in the different disciplines would become clarified. This type of scientific progress is rational even though we should, from time to time, abandon some of our basic beliefs and find new, larger perspectives to our research. Combining several perspectives together can clearly add more precision to the explanations behind the observed phenomena.
4.2 Capacity- vs. content-based analysis of human-technology interaction
The capacity- and content-based approaches are not contradictory in the sense that they would necessarily lead to conflicting predictions. Instead, they can be seen as complementary frameworks, and they can provide answers to different types of questions (Saariluoma, 2004). These two approaches study the same phenomena on different levels of detail. In TABLE 2 we can see a comparison between the two approaches, dealing with different aspects of operationalization and experimentation.
While the target of capacity-based analysis lies in the workload of the interaction and in the related performance of the operator, the target in the content-based research is in the information contents of the involved mental representations. This means focusing on the functional organization, relevance, inclusiveness and correctness of the elements of situational representations in relation to operators’ intentions. The level of phenomena under investigation resides, thus, in the processes of apperception and formation of situation awareness as well as in strategic and tactical thinking. Capacity-based analysis focuses typically on the phenomena at the lower level of basic information processing: e.g., perception, memory and attention, and even brain functions. The critical aspects of information contents in the capacity-based paradigm are, thus, quantity, complexity and in some cases also format or code (Wickens, 2002).

119
TABLE 2 Comparison between the capacity- and content-based approaches for experimental research on human-technology interaction
Capacity-based analysis Content-based analysis
Target Workload, performance, complexity
Information contents of mental representations
Level of phenomena
Basic information processing; perception, attention, memory, brain functions
Apperception, situation awareness, strategic and tactical thinking
Critical aspects of information contents
Quantity, complexity, code, format
Functional organization, relevance, inclusiveness, correctness
Explanations Causal Causal, representational Typical research methods
Observation, questionnaires Interviews, verbal protocol (thinking-aloud), observation, questionnaires
Data Quantitative measures of performance or workload
Quantitative and qualitative measures of behavioral patterns and respective mental representations
Time-scale of measurements
100 ms to seconds Seconds to days
Nature of phenomena under investigation
Static, cross-sectional effects Dynamic, longitudinal effects
Role of the participant
Passive Active intentional individual
Provides explanations for
Average performance Variances in and between individual behaviors
Implications for design
How to avoid human error by resource overload
How to design the interaction to support the formation of highly relevant, inclusive and correct mental representations of situations
Representational explanation of behavior or explaining it on the ground of mental contents can be different from the classic causal explanations in an essential sense (Saariluoma, 1997). Because the capacity-based explanatory models typically explain human behavior on the ground of simple causal processes, they are always bound to the present situation. The analysis of the mental contents of operators enables researchers to pay attention also for such issues as the effects of the representations of possible future events, and particularly the effects of operator’s intentions, goals, and expectations on current behavior. The content-based explanatory models can, when needed, include also the classical intentional analysis of behavior (von Wright, 1971/2004; Saariluoma, 1997). The information contents of intentions and expectations can be analyzed. The capacity-based explanatory models are

120
insufficient in relation to these, which may in part explain why, for example, the problems related to task predictability have remained unsettled so far in driver distraction research.
The research methods that are mostly used in capacity-based experiments are focused on the observation of the participants and subjective assessments with questionnaires. A content-based research is in addition interested in the thinking processes of the participants, and tries to find out about them with methods such as verbal protocols (Ericsson & Simon, 1984) and interviews. In measurements, there can also be a difference in time-scales. Capacity-based research is interested in observing capacity overflow taking place within the range of 100 ms to seconds, while content-based research is interested in longer continuous phenomena taking place within the range of seconds to days. In addition, while capacity-based research is typically cross-sectional, assuming fairly static information processing capacities across participants, content-based approach is interested also in the dynamic learning processes and the related developments in mental contents.
In capacity-based experimental settings the role of the participant is often passive, while in content-based experiments all the participants are treated as active intentional individuals. This means, among other things, that the dual-task condition is self-paced and that the participants are instructed towards goal-oriented intentional behavior using their own natural ways and means. Motivating participants to put effort to reach the desired goals is, thus, important. In dual-task studies of distraction on the levels of tactical and strategic control, it is vital for the validity of the results to reach the actual time-sharing strategies of the participants.
Content-based analysis can provide explanations for variances between individuals as well as in individual behaviors (Helfenstein & Saariluoma, 2007). However, this does not mean that the content-based research would not follow the scientific principles of generalization. Instead, new objective and quantitative measures are actively searched for with qualitative techniques for explaining the differences between the participants. In driver distraction research, the capacity-based approaches seek general thresholds for distraction effects and in this way try to find ways to test IVIS for eliminating those designs that potentially overload the driver. From another perspective, the content-based analysis can provide information on how the interaction should be redesigned to ensure safer use while driving. Perhaps the greatest value of the content-based analysis compared to the capacity-based in this context is that it provides information on the qualities of the interaction in the way the drivers comprehend these.
Considering driver distraction research, capacity-based research is highly important in providing us with information on the limits of our information-processing capabilities. However, there are additional important issues that should be addressed with experimental techniques. If we move our experimental focus to mental contents, a kind of paradigm shift can be observed; instead of asking: “Does the secondary task overload the driver?”, we ask:

121
“What features of secondary task display designs can support driver’s situation awareness, as well as tactical and strategic abilities?”
4.3 Contributions
The research presented and the metrics of task predictability, interruptability, situation awareness, and time-sharing efficiency, can have significant methodological value for driver distraction research, as well as practical value for the testing and design of safer in-vehicle information systems. The results can have importance also for other fields of human-technology interaction research. In particular, the proposed content-based approach can have implications for experimental research in human-computer interaction research and experimental industrial evaluations of usability and user experience of products and services. As an example, in usability testing the presented approach means transition from the measurement of task complexity, i.e., task completion times and errors, to the measurement of the more precise qualities of the interaction. Especially the ideas of measuring the development of individual and group variances in behaviors to assess the intuitiveness and learnability of user interfaces could prove valuable for human-technology interaction research. The same applies to the analysis of the mental contents related to these variances. I hope that the research presented will encourage the development of novel objective measures to assess user interaction with technology.
The results at hand can have potential importance also for other areas of traffic psychological research. The developed and proposed metrics can be used, in addition to the evaluation of driver distraction, in the evaluation of drivers’ individual differences in tactical and strategic time-sharing skills and situation awareness in dual-task situations. The research could involve driving ability studies, e.g., assessment of time-sharing abilities of older drivers (e.g., Wikman & Summala, 2005), or development of testing procedures for the selection process of new professionals for heavy transportation duties. Other possible areas of application could include, e.g., the design of traffic environments.
Many questions related particularly to different user interface features’ effects on driver distraction accumulated during the research process and collaboration with industry. These topics of interest should be examined with the developed measures. This work could, ultimately, lead to a creation of a database consisting of IVIS user interface designs’ effects on distraction and reference tasks for comparisons between designs (see Young et al., 2008a). With the accumulating data we could get a still more detailed insight to what mechanisms and particular user interface features contribute to secondary task predictability, interruptability, resumability, and ignorability.
Because of the ever-increasing significance of driver distraction to traffic safety due to increasing availability of mobile services and in-vehicle technologies while driving, a number of driver distraction warning systems are currently under development (overviews: Engström & Victor, 2008; Smith et al.,

122
2008; Zhang et al., 2008). However, the basic concepts in the development and research of these systems are related to the operational level of control. Often these systems are intended merely as preventive workload management systems, or as distraction mitigation systems, reacting to observed distraction by counter-measures (Engström & Victor, 2008). The ideas about drivers themselves as workload managers and the long-term importance of providing feedback of time-sharing behaviors for developing their tactical time-sharing and prioritization skills through a distraction warning system are relatively new (Donmez et al., 2008).
Further, it can be argued, that the current existing and proposed distraction-warning systems do not utilize context and driver data to the extent that could be possible with modern technology. This kind of information would be beneficial for eliminating false alarms and for making the warning system more reliable. Progress in this area would increase user acceptance of the systems (see Kinghorn, Bittner, & Kantowitz, 1994; Smith et al., 2008). For example, static limits for acceptable glance durations at the in-vehicle displays can induce frustration through false alarms because the safe limits, even if they exist, are always dependent on the prevailing traffic situation (e.g., Horrey & Wickens, 2007) and also on the individual skills of the drivers. The warning systems could also examine the context data and the input data of the device in order to evaluate whether the intended use is rational in the particular environment and traffic situation. These arguments point to the necessity of further development of the metrics for such a warning system. The system should be able to tell, in a reliable and valid way, when there really is an elevated risk of distraction. The contribution of the current research for this line of work is in that it can help in identifying driver distraction on the tactical and strategic levels reliably, e.g., through eye-tracking, input data, and context data, before the distraction has negative consequences on the operational control of the vehicle.

123
REFERENCES
Alexander, G.J. & Lunenfeld, H. (1986). Driver Expectancy in Highway Design and Traffic Operations (Publication No. FHWA-TO-86-1). Washington, D.C.: Federal Highway Administration.
Allen, R.W., Rosenthal, T.J., & Christos, J.P. (1998). Applying vehicle dynamics analysis and visualization to roadway and roadside studies (Report FHWA-RD-98-030). Washington, DC: U.S. Dept of Transportation.
Allport, D.A. (1980). Attention and performance. In G.L. Claxton (Ed.), New directions in cognitive psychology (pp. 112-153). London: Routledge.
Allport, A. (1993). Attention and control: Have we been asking the wrong questions? A critical review of twenty-five years. In D.E. Meyer & S. Kornblum (Eds.), Attention and Performance XIV (pp. 183-218). Cambridge, MA: MIT Press.
Allport, D.A., Antonis, B., & Reynolds, P. (1972). On the division of attention: A disproof of the single capacity hypothesis. Quarterly Journal of Experimental Psychology, 24, 225-235.
Allport, A., Styles, E.A., & Hsieh, S. (1994). Shifting intentional set: exploring the dynamic control of tasks. In C. Umilta & M. Moscovitch (Eds.), Attention and Performance XV: Conscious and Nonconscious Information Processing (pp. 421-452). Cambridge, MA: MIT Press.
Alm, H. & Nilsson, L. (1994). Changes in driver behaviour as a function of handsfree mobile phones – a simulator study. Accident Analysis and Prevention, 26 (4), 441-451.
Anderson, J.R. (1976). Language, Memory and Thought. Hillsdale, NJ: Lawrence Erlbaum Associates.
Anderson, J. R. (1983a). A spreading activation theory of memory. Journal of Verbal Learning and Verbal Behavior, 22, 261-295.
Anderson, J.R. (1983b). The Architecture of Cognition. Cambridge, MA: Harvard University Press.
Anderson, J.R. (1993). Rules of the Mind. Hillsdale, NJ: Lawrence Erlbaum Associates.
Anderson, J.R. & Bower, G.H. (1973). Human Associative Memory. Washington, DC: Winston & Sons.
Anderson, J. R. & Lebiere, C. (1998). The Atomic Components of Thought. Mahwah, NJ: Erlbaum.
Angell, L., Auflick, J., Austria, P. A., Kochhar, D. S., Tijerina, L., Biever, W. J., Diptiman, J., Hogsett, J., & Kiger, S. (2006). Driver Workload Metrics Project: Task 2 Final Report (Report No. DOT HS 810 635). Washington, D.C.: National Highway Traffic Safety Administration.
Anttila, V. & Luoma, J. (2005). Surrogate in-vehicle information systems and driver behaviour in an urban environment: a field study on the effects of visual and cognitive load. Transportation Research Part F: Traffic Psychology and Behaviour, 8, 121-133.

124
Atchley, P. & Dressel, J. (2004). Conversation limits the functional field of view. Human Factors, 46 (4), 664-673.
Atkinson, R.C. & Schiffrin, R.M. (1968). Human memory: A proposed system and its control processes. In K.W. Spence & J.T. Spence (Eds.), The Psychology of Learning and Motivation Volume 2 (pp. 89-195). New York, NY: Academic Press.
Baars, B.J. (1988). A Cognitive Theory of Consciousness. Cambridge, UK: Cambridge University Press.
Baccino, T. & Colombi, T. (2000). L’analyse des mouvements des yeux sur le Web. Revue d’Intelligence Artificielle, 14 (1-2), 127-148.
Backs, R.W., Lenneman, J.K., Wetzel, J.M., & Green, P. (2003). Cardiac measures of diver workload during simulated driving with and without visual occlusion. Human Factors, 45, 525-538.
Baddeley, A.D. (1986). Working Memory. Oxford, UK: Oxford University Press. Baddeley, A.D. (2007). Working Memory, Thought and Action. Oxford, UK: Oxford
University Press. Baddeley, A.D., Thomson, N., & Buchanan, M. (1975). Word length and the
structure of short-term memory. Journal of Verbal Learning and Verbal Behavior, 14, 575-589.
Baumann, M.R.K., Petzoldt, T., Groenewoud, C., Hogema, J., & Krems, J.F. (2008). The effects of cognitive tasks on predicting events in traffic. In C. Brusque (Ed.), Proceedings of the European Conference on Human Centred Design for Intelligent Transport Systems 2008 (pp. 3-11). Lyon, FR: HUMANIST Publications.
Bayly, M., Young, K.L., & Regan, M.A. (2008). Sources of distraction inside the vehicle and their effects on driving performance. In M.A. Regan, J.D. Lee, and K.L. Young (Eds.), Driver Distraction: Theory, Effects, and Mitigation (pp. 191-214). Boca Raton, FL: CRC Press.
Beatty, J. (1982). Task-evoked pupillary responses, processing load, and the structure of processing resources. Psychological Bulletin, 91,276-292.
Beatty, J. & Lucero-Wagoner, B. (2000). The pupillary system. In J.T. Cacioppo, L.G. Tassinary and G.G. Berntson (Eds.), Handbook of Psychophysiology (2nd edition, pp. 142–162). New York, NY: Cambridge University Press.
Bhargava, S. & Pathania, V. (2007). Driving Under the (Cellular) Influence: The Link Between Cell Phone Use and Vehicle Crashes (Working Paper 07-15, preliminary version). (available online at http://papers.ssrn.com/sol3/papers.cfm?abstract_id=1089081).
Blanco, M., Biever, W.J., Gallagher, J.P., & Dingus, T.A. (2006). The impact of secondary task cognitive processing demand on driving performance. Accident Analysis and Prevention, 38, 895-906.
Bloomfield, J.R. & Carroll, S.A. (1996). New measures of driving performance. In S.A. Robertson (Ed.), Contemporary Ergonomics (pp. 335-340). London, UK: Taylor and Francis.
Bonnard, A. & Brusque, C. (2008). Naturalistic driving observations to investigate distraction exposure and IVIS patterns of use: interests and

125
constraints of the approach. In C. Brusque (Ed.), Proceedings of the European Conference on Human Centred Design for Intelligent Transport Systems 2008 (pp. 43-52). Lyon, FR: HUMANIST Publications.
Broadbent, D.E. (1958). Perception and Communication. London, UK: Pergamon. Brookhuis, K.A. & de Waard, D. (1993). The use of psychophysiology to assess
driver status. Ergonomics, 36 (9), 1099-1110. Brookhuis, K.A. & de Waard, D. (2004). Why is driver impairment difficult to
assess? In T. Rothengatter & R.D. Huguenin (Eds.), Traffic and Transport Psychology: Theory and Application: Proceedings of the ICTTP 2000 (pp. 231-244). NL: Elsevier.
Brookhuis, K.A., de Waard, D., & Fairclough, S.H. (2003). Criteria for driver impairment. Ergonomics, 46 (5), 433-445.
Brookhuis, K., van Winsum, W., Heijer, T., & Duynstee, L. (1999). Assessing behavioral effects of in-vehicle information systems. Transportation Human Factors, 1 (3), 261-272.
Brown, J. (1958). Some tests of the decay theory of immediate memory. Quarterly Journal of Experimental Psychology, 10, 12-21.
Brumby, D. P., Howes, A., & Salvucci, D. D. (2007). A cognitive constraint model of dualtask trade-offs in a highly dynamic driving task. In B. Begole, S. Payne, E. Churchill, R. St. Amant, D. Gilmore and M.B. Rosson (Eds.), Proceedings of the SIGCHI Conference on Human Factors in Computing Systems, CHI’07 (pp. 233-242). New York, NY: ACM.
Brumby, D.P., Salvucci, D.D., & Howes, A. (2009). Focus on driving: How cognitive constraints shape the adaptation of strategy when dialing while driving. In S. Greenberg, S.E. Hudson, K. Hinckley, M.R. Morris and D.R. Olsen Jr. (Eds.), Proceedings of the SIGCHI Conference on Human Factors in Computing Systems, CHI’09 (pp. 1629-1638). New York, NY: ACM Press.
Bullinger, H.-J. & Dangelmaier, M. (2003). Virtual prototyping and testing of in-vehicle interfaces. Ergonomics, 46, 41-51.
Burnett, G.E. (2000). Usable navigation systems: Are we there yet? In Proceedings of the Vehicle Electronic Systems 2000 - European Conference and Exhibition (pp. 3.1.1-3.1.12). Stratford-upon-Avon, UK: ERA Technology Ltd.
Burnett, G.E., Summerskill, S.J. & Porter, J.M. (2004) On-the–move destination entry for vehicle navigation systems: Unsafe by any means? Behaviour and information Technology, 23 (4), 265-272.
Burns, P.C., Trbovich, P.L., Harbluk, J.L., McCurdie, T. (2005). Assessing multifunction interfaces in vehicles: Usability as a requisite for safety. Transportation Research Record: Journal of the Transportation Research Board, 1937, 66-72.
Buss, D.M. (1995). Evolutionary psychology: A new paradigm for psychological science. Psychological Inquiry, 6, 1-30.
Byers, J.C., Bittner, A.C., & Hill, S.G. (1989). Traditional and raw task load index (TLX) correlations: Are paired comparisons necessary? In A. Mital (Ed.),

126
Advances in Industrial Ergonomics and Safety (pp. 481-485). London, UK: Taylor & Francis.
Caird, J.K., Chisholm, S.L., & Lockhart, J. (2008). Do in-vehicle advanced signs enhance older and younger drivers’ intersection performance? Driving simulation and eye movement results. International Journal of Human Computer Studies, 66, 132-144.
Calhoun, V.D., Pekar, J.J., McGinty, V.B., Adali, T., Watson, T.D., & Pearlson, G.D. (2002). Different activation dynamics in multiple neural systems during simulated driving. Human Brain Mapping, 16, 158–167.
Carsten, O. & Brookhuis, K. (2005a). Issues arising from the HASTE experiments. Transportation Research Part F, 8, 191-196.
Carsten, O. & Brookhuis, K. (2005b). The relationship between distraction and driving performance: towards a test regime for in-vehicle information systems. Transportation Research Part F, 8, 75-77.
Carsten, O., Merat, N., Janssen, W., Johansson, E., Fowkes, M., & Brookhuis, K. (2005). HASTE Final Report, Contract No. GRD1/2000/25361 S12.319626, Human Machine Interface and the Safety of Traffic in Europe (HASTE) Project. Brussels, BE: European Community.
Chiang, D.P., Brooks, A.M., & Weir, D.H. (2004). On the highway measures of driver glance behavior with an example automobile navigation system. Applied Ergonomics, 35, 215-223.
Chisholm, S.L., Caird, J.F., Lockhart, J., Fern, L., & Teteris, E. (2007). Driving performance while engaged in MP-3 player interaction: Effects of practice and task difficulty on PRT and eye movements. In Proceedings of the Fourth International Driving Symposium on Human Factors in Driver Assessment, Training and Vehicle Design (pp. 238-245). Iowa City, IA: University of Iowa Public Policy Center.
Chittaro, L. & L. De Marco (2004). Driver Distraction Caused by Mobile Devices: Studying and Reducing Safety Risks. In Proceedings of the 1st International Workshop on Mobile Technologies and Health: Benefits and Risks (pp. 1-19). Udine, IT: University of Udine.
Cnossen, F., Mejman, T., & Rothengatter, T. (2004). Adaptive strategy changes as a function of task demands: a study of car drivers. Ergonomics, 47,218-236.
Cnossen, F., Rothengatter, T., & Meijman, T. (2000). Strategic changes in task performance in simulated car driving as an adaptive response to task demands. Transportation Research Part F, 3, 123-140.
Collins, A.M., & Quillian, M.R. (1969). Retrieval time from semantic memory. Journal of Verbal Learning and Verbal Behavior, 8, 240-248.
Commission of the European Communities (2006). Recommendation on safe and efficient in-vehicle information and communication systems: Update of the European statement of principles on human machine interface (Report C(2006) 7125 final). Brussels, BEL: Commission of the European Communities.
Cooper, P.J. & Zheng, Y. (2002). Turning gap acceptance decision-making: the impact of driver distraction. Journal of Safety Research, 33, 321-335.

127
Cowan, N. (1988). Evolving conceptions of memory storage, selective attention, and their mutual constraints within the human information-processing system. Psychological Bulletin, 104 (2), 163-191.
Cowan, N. (1997). Attention and Memory: An Integrated Framework. Oxford, UK: Oxford University Press.
Cowan, N. (2000). The magical number 4 in short-term memory: A reconsideration of mental storage capacity. Behavioral and Brain Sciences, 24 (1), 87-185.
Cowan, N. (2005). Working Memory Capacity. New York, NY: Psychology Press. de Groot, A.D. (1965). Thought and Choice in Chess. Hague, NL: Mouton. de Waard, D. (2002). Mental workload. In R. Fuller & J. A. Santos (Eds.), Human
Factors for Highway Engineers (pp. 161-176). Oxford: Pergamon. Dekker, S.W.A. (2002). Reconstructing human contributions to accidents: The
new view on error and performance. Journal of Safety Research, 33, 371-385. Dingus, T.A., Hulse, M.C., Mollenhauer, M.A., Fleischman, R.N., McGehee,
D.V, & Manakkal, N. (1997). Effects of age, system experience, and navigation technique on driving with an Advanced Traveller Information Systems, Human Factors, 39, 177-199.
Donmez, B., Boyle, L., & Lee, J.D. (2008). Designing feedback to mitigate distraction. In M.A. Regan, J.D. Lee, and K.L. Young (Eds.), Driver Distraction: Theory, Effects, and Mitigation (pp. 519-532). Boca Raton, FL: CRC Press.
Dressel, J. & Atchley, P. (2008). Cellular phone use while driving: A methodological checklist for investigating dual-task costs. Transportation Research Part F, 11, 347-361.
Drews, F.A., Pasupathi, M., & Strayer, D.L. (2008). Passenger and cell phone conversations in simulated driving. Journal of Experimental Psychology: Applied, 14, 392-400.
Driver, J. & Spence, C. (1998). Attention and the crossmodal construction of space. Trends in Cognitive Science, 2 (7), 254-262.
Dukic, T., Hanson, L. & Falkmer, T. (2006). Effect of driver’s age and push button locations on visual time off road, steering wheel deviation and safety perception. Ergonomics, 49, 78-92.
Dukic, T., Hanson, L., Holmqvist, K., & Wartenberg, C. (2005). Effect of button location on driver’s visual behaviour and safety perception. Ergonomics, 48 (4), 399-410.
Eagly, A.H. & Chaiken, S. (1993). Psychology of Attitudes. Orlando, FL: Harcourt Brace Jovanovich.
Einstein, A. & Infeld, L. (1938/1966). The Evolution of Physics from Early Concepts to Relativity and Quanta. New York, NY: Simon and Schuster.
Eissfeldt, N. & Wagner, P. (2003). Effects of anticipatory driving in a traffic flow model. European Physical Journal B, 33, 121-129.
Endsley, M.R. (1995a). Measurement of situation awareness in dynamic systems. Human Factors, 37, 65-84.

128
Endsley, M.R. (1995b). Toward a theory of situation awareness in dynamic systems. Human Factors, 37, 32-64.
Endsley, M.R. (2006). Expertise and situation awareness. In K. A. Ericsson, Charness, N., Feltovich, P. J., & Hoffman, R. R. (Eds.), The Cambridge Handbook of Expertise and Expert Performance (pp. 633-651). New York, NY: Cambridge University Press.
Engström, J. & Mårdh, S. (2007). SafeTE Final Report (Report 2007:36). Borlänge: SE: Swedish Road Administration (SRA).
Engström, J. & Victor, T.W. (2008). Real-time distraction countermeasures. In M.A. Regan, J.D. Lee, and K.L. Young (Eds.), Driver Distraction: Theory, Effects, and Mitigation (pp. 465-484). Boca Raton, FL: CRC Press.
Engström, J., Johansson, E., & Östlund, J. (2005). Effects of visual and cognitive load in real and simulated motorway driving. Transportation Research Part F: Traffic Psychology and Behaviour, 8, 97-120.
Ericsson, K.A. (2006). The Cambridge Handbook of Expertise and Expert Performance. Cambridge, MA: Cambridge University Press.
Ericsson, K.A. & Kintsch, W. (1995). Long-term working memory. Psychological Review, 102, 211-245.
Ericsson, K.A. & Simon, H.A. (1984). Protocol Analysis: Verbal Reports as Data. Cambridge, MA: MIT Press.
Evans, L. (1991). Traffic Safety and the Driver. New York: Van Nostrand Reinhold.
Fitts, P.M. (1954). The information capacity of the human motor system in controlling the amplitude of movement. Journal of Experimental Psychology, 47, 381-391.
Fitts, P.M. (1966). Cognitive aspects of information processing: III. Set for speed versus accuracy. Journal of Experimental Psychology, 71, 849-857.
Foley, J.P. (2008). Now you see it, now you don't: Visual occlusion as a surrogate distraction measurement technique. In M.A. Regan, J.D. Lee, and K.L. Young (Eds.), Driver Distraction: Theory, Effects, and Mitigation (pp. 123-134). Boca Raton, FL: CRC Press.
FoxNews.com. (2007). Text Messaging May Be Factor in Fatal Teen Car Crash. Retrieved 1 December 2009 from
http://www.foxnews.com/story/0,2933,289365,00.html . Fuller, R. (1984). A conceptualization of driver behaviour as threat avoidance.
Ergonomics, 27, 1139-1155. Fuller, R. (2005). Towards a general theory of driver behaviour. Accident
Analysis and Prevention, 37, 461-472. Garabet, A., Horrey, W., & Lesch, M.F. (2007). Does exposure to distraction in
an experimental setting impact driver perception of cell phone ease of use and safety? In Proceedings of the Fourth International Driving Symposium on Human Factors in Driver Assessment, Training and Vehicle Design (pp. 387-393). Iowa City, IA: University of Iowa Public Policy Center.
129
Gelau, C., Henning, M.J., & Krems, J.F. (2009). On the reliability of the occlusion technique as a tool for the assessment of the HMI of in-vehicle information and communication systems. Applied Ergonomics, 40, 181-184.
Gentner, D., & Gentner, D.R. (1983). Flowing waters or teeming crowds: Mental models of electricity. In D. Gentner & A.L. Stevens (Eds.), Mental models (pp. 99-129). Hillsdale, NJ: Lawrence Erlbaum Associates.
Goldberg, J.H. & Kotval, X.P. (1999). Computer interface evaluation using eye movements: Methods and constructs. International Journal of Industrial Ergonomics, 24, 631-645.
Gopher, D. (1993). The skill of attention control: Acquisition and execution of attention strategies. In D.E. Meyer & S. Kornblum (Eds.), Attention and Performance XIV (pp. 299-322). Cambridge, MA: MIT Press.
Gopher, D. & Donchin, E. (1985). Workload – an examination of the concept. In: Boff, K. R., Kaufmann, L. & Thomas, J. R. (Eds.), Handbook of Perception and Human Performance, Vol. 2 (411-418). New York: Wiley.
Gopher, D., & Navon, D. (1980). How is performance limited? Testing the notion of central capacity. Acta Psychologica, 46, 161-180.
Green, P. (1999a). Visual and Task Demands of Driver Information Systems. Report No. UMTRIl98-16. Ann Arbor, MI: University of Michigan Transportation Research Institute.
Green, P. (1999b). Estimating compliance with the 15-second rule for driver-interface usability and safety. In Proceedings of the Human Factors and Ergonomics Society 43rd Annual Meeting (pp. 987-991). Santa Monica, CA: Human Factors and Ergonomics Society.
Green, P. (2000). Crashes induced by driver information systems and what can be done to reduce them (SAE paper 2000-01-C008). In Proceedings of Convergence 2000 (pp. 26-36). Warrendale, PA: Society of Automotive Engineers.
Green, P. (2004). Driver Distraction, Telematics Design, and Workload Managers: Safety Issues and Solutions (SAE Paper No. 2004-21-0022). Warrendale, PA: SAE International.
Groeger, J.A. (2000). Understanding Driving: Applying Cognitive Psychology to a Complex Everyday Task. Hove, UK: Psychology Press.
Gugerty, L., Rando, C., Rakauskas, M., Brooks, J., & Olson, H. (2003). Differences in remote versus in-person communications while performing a driving task. In Proceedings of the Human Factors and Ergonomics Society 47th Annual Meeting (pp. 1855-1859). Santa Monica, CA: Human Factors and Ergonomics Society.
Hacker, W. (1978). Allgemeine Arbeits- und Ingenieurpsychologie (General Psychology of Work and Engineering). Bern: Huber.
Haigney, D.E., Taylor, R.G., & Westerman, S.J. (2000). Concurrent mobile (cellular) phone use and driving performance: task demand characteristics and compensatory processes. Transportation Research Part F, 3, 113-121.
Haigney, D. & Westerman, S.J. (2001). Mobile (cellular) phone use and driving: a critical review of research methodology. Ergonomics, 44 (2), 132-143.

130
Hancock, P.A., Mouloua, M., & Senders, J.W. (2008). On the philosophical foundations of the distracted driver and driving distraction. In M.A. Regan, J.D. Lee, & K.L. Young (Eds.) Driver Distraction: Theory, Effects, and Mitigation (pp. 11-30). Boca Raton, FL: CRC Press.
Hanson, N.R. (1958). Patterns of Discovery. Cambridge, UK: Cambridge University Press.
Harbluk, J.L., Burns, P.C., Go, E., & Morton, A. (2006). Evaluation of the occlusion procedure for assessing invehicle telematics: Tests of current vehicle systems. In Proceedings of the Human Factors and Ergonomics Society 50th Annual Meeting (pp. 2373-2377). San Fransisco, CA: Human Factors and Ergonomics Society.
Harbluk, J.L., Mitroi, J.S., & Burns, P.C. (2009). Three navigation systems with three tasks: Using the Lane-Change-Test (LCT) to assess distraction demand. In Proceedings of the Fifth International Driving Symposium on Human Factors in Driver Assessment, Training and Vehicle Design (pp. 24-30). Big Sky, MT.
Hart, S. G. & Staveland, L. E. (1988). Development of NASA-TLX: Results of empirical and theoretical research. In P.A. Hancock & N. Meshkati (Eds.), Human Mental Workload (pp. 139-183), Amsterdam, NED: Elsevier.
Helfenstein, S. & Saariluoma, P. (2006). Mental contents in transfer. Psychological Research, 70, 293-303.
Helfenstein, S. & Saariluoma, P. (2007). Apperception in primed problem solving. Cognitive Processing, 8 (4), 211-232.
Hirst, W., & Kalmar, D. (1987). Characterizing attentional resources. Journal of Experimental Psychology: General, 116, 68-81.
Hockey, G.R.J. (1997). Compensatory control in the regulation of human performance under stress and high workload: a cognitive-energetical approach. Biological Psychology, 45, 73-93.
Hoedemaeker, M., & Janssen, W.H. (2000). Driving Behaviour Parameters and Accident Risk with Driver Support. Presentation at ICTTP 2000, 2nd International Conference on Traffic and Transport Psychology, 3-7 September, Bern, Switzerland.
Hoffman, J.D., Lee, J.D., McGehee, D.V., Macias, M., & Gellatly, A.W. (2005). Visual sampling of in-vehicle text messages: Effects of number of lines, page presentation, and message control. Transportation Research Record, 1937, 22-30.
Hollnagel, E. (2007). Coping with complexity: then and now. In W.-P. Brinkman, D.-H. Ham and W. Wong (Eds.), Proceedings of the 14th European Conference on Cognitive Ergonomics (pp. 5-6). USA: Lulu Inc.
Hornbæk, R. (2006). Current practice in measuring usability: Challenges to usability studies and research. International Journal of Human-Computer Studies 64, 79-102.
Horrey, W.J., Alexander, A.L., & Wickens, C.D. (2003). Does workload modulate the effects of in-vehicle display location on concurrent driving

131
and side task performance? In Proceedings of Driving Simulation Conference North America 2003 (pp. 1-20). Dearborn, MI: Ford Motor Company.
Horrey, W.J. & Lesch, M.F. (2009). Driver-initiated distractions: Examining strategic adaptation for in-vehicle task initiation. Accident Analysis and Prevention, 41, 115-122.
Horrey, W.J., Lesch, M.F., & Garabet, A. (2008). Assessing the awareness of performance decrements in distracted drivers. Accident Analysis and Prevention, 40, 675-682.
Horrey, W.J., Lesch, M.F., & Garabet, A. (2009). Dissociation between driving performance and drivers' subjective estimates of performance and workload in dual-task conditions. Journal of Safety Research, 40, 7-12.
Horrey, W.J. & Simons, D.J. (2007). Examining cognitive interference and adaptive safety behaviours in tactical vehicle control. Ergonomics, 50 (8), 1340-1350.
Horrey, W.J., Simons, D.J., Buschmann, E.G., & Zinter, K.M. (2006). Assessing interference from mental workload using a naturalistic simulated driving task: a pilot study. In Proceedings of the Human Factors and Ergonomics Society 50th Annual Meeting (pp. 2003-2007). San Fransisco, CA: Human Factors and Ergonomics Society.
Horrey, W.J. & Wickens, C.D. (2004). Focal and ambient visual contributions and driver visual scanning in lane keeping and hazard detection. In Proceedings of the Human Factors and Ergonomics Society 48th Annual Meeting (pp. 2325-2329). San Fransisco, CA: Human Factors and Ergonomics Society.
Horrey, W.J. & Wickens, C.D. (2006). Examining the impact of cell phone conversations on driving using meta-analytic techniques. Human Factors, 48 (1), 196-205.
Horrey, W.J. & Wickens, C.D. (2007). In-vehicle glance duration: Distributions, tails, and model of crash risk. Transportation Research Record, 2018, 22-28.
Horrey, W.J., Wickens, C.D., & Consalus, K.P. (2006). Modeling drivers’ visual attention allocation while interacting with in-vehicle technologies. Journal of Experimental Psychology: Applied, 12, 67-78.
Hsieh, S. & Yu, Y.-T. (2003). Exploring the nature of switch cost: inferences from P300 and the lateralized readiness potentials. Brain Research Protocols, 12, 49-59.
Huey, B.M., & Wickens, C.D. (1993). Workload Transition: Implications for Individual and Team Performance. Washington, DC: National Academy Press.
Hunton, J. & Rose, J.M. (2005). Cellular telephones and driving performance: The effects of attentional demands on motor vehicle crash risk. Risk Analysis, 25 (4), 855-866.
International Organization for Standardization (2007). ISO16673 Road vehicles - ergonomic aspects of transport information and control systems - Occlusion method to assess visual demand due to the use of in-vehicle systems. Geneva, CH: International Standards Organization.

132
International Organization for Standardization (2008). ISO26022 Road vehicles - Ergonomic aspects of transport information and control systems - Simulated lane change test to assess driver distraction. Geneva, CH: International Standards Organization.
Jahn, G., Krems, J.F., & Gelau, C. (2009). Skill acquisition while operating in-vehicle information systems: Interface design determines the level of safety-relevant distractions. Human Factors, 51, 136-151.
Jahn, G., Oehme, A., Krems, J.F., & Gelau, C. (2005). Peripheral detection as a workload measure in driving: Effects of traffic complexity and route guidance system use in a driving study. Transportation Research Part F, 8, 255-275.
James, W. (1890/1950). The Principles of Psychology. New York: Dover Publications.
Jamson, A.H. & Merat, N. (2005). Surrogate in-vehicle information systems and driver behaviour: Effects of visual and cognitive load in simulated rural driving. Transportation Research Part F, 8, 79-96.
Jamson, A.H., Westerman, S.J., Hockey, G.R.J., & Carsten, O.M.J. (2004). Speech-based e-mail and driver behavior: Effects of an in-vehicle message system interface. Human Factors, 46 (4), 625-639.
Jersild, A.T. (1927). Mental set and shift. Archives of Psychology, 89. Johnson-Laird, P.N. (1983). Mental Models: Towards a Cognitive Science of
Language, Inference, and Consciousness. Cambridge, UK: Cambridge University Press.
Jones, D.G. & Endsley, M.R. (1996). Sources of situation awareness errors in aviation. Aviation, Space, and Environmental Medicine, 67, 507-512.
Just, M.A., Keller, T.A., & Cynkar, J. (2008). A decrease in brain activation associated with driving when listening to someone speak. Brain Research, 1205, 70-80.
Kahneman, D. (1973). Attention and Effort. New York, NY: Prentice Hall. Kakihara, M. & Asoh, T. (2005). JAMA guideline for in-vehicle systems. In
Proceedings of the 12th World Congress on Intelligent Transport Systems (pp. NA). San Francisco, CA: Transportation Research Board.
Kant, I. (1781/1998). Critique of Pure Reason. P. Guyer & A.W. Wood (Eds.). Cambridge, MA: Cambridge University Press.
Kantowitz, B.H. (2000). In-vehicle information systems: Premises, promises, and pitfalls. UMTRI Research Review, 31 (2), 2-19.
Kantowitz, B.H., Lee, J.D., Becker, C.A., Bittner, A.C., Kantowitz, S.C., Hanowski, R.J., Kinghorn, R.A., McCauley, M.E., Sharkey, T.J., McCallum, M.C., & Barlow, S.T. (1997). Development of human factors guidelines for advanced traveler information systems and commercial vehicles: Identify and explore driver acceptance of in-vehicle ITS information (FHWA-RD-96-143). Washington, DC: Federal Highway Administration.
Kantowitz, B.H. & Sorkin, R.D. (1983). Human Factors: Understanding People-system Relationships. New York, NY: Wiley.
133
Kass, S.J., Cole, K.S., & Stanny, C.J. (2007). Effects of distraction and experience on situation awareness and simulated driving. Transportation Research Part F, 10, 321-329.
Keskinen, E., Hatakka, M., & Katila, A. (1992). Inner models as a basis for traffic behaviour. Journal of Traffic Medicine, 20, 147-152.
Keskinen, E., Hatakka, M., Laapotti, S., Katila, A., & Peräaho, M. (2004). Driver behaviour as a hierarchical system. In T. Rothengatter and R.D. Huguenin (Eds.), Traffic and transport psychology: theory and application: proceedings of ICTTP 2000 (pp. 9-24). Oxford, UK: Elsevier Science & Technology Books.
King, D.B. & Wertheimer, M. (2005). Max Wertheimer & Gestalt Theory. New Jersey, NJ: Transaction Publishers.
Kinghorn, R.A., Bittner, A.C., & Kantowitz, B.H. (1994). Identification of desired system features in an advanced traveler information system. In Proceedings of Human Factors and Ergonomics Society 38th Annual Meeting (pp. 1067-1071). Santa Monica, CA: Human Factors and Ergonomics Society.
Klauer, S. G., Dingus, T. A., Neale, V. L., Sudweeks, J. D., & Ramsey, D. J. (2006). The impact of driver inattention on near-crash/crash risk: An analysis using the 100-car naturalistic driving study data (DOT HS Rep. 810 594). Washington DC: U.S. National Highway Traffic Safety Administration.
Knight, J.L. Jr. & Kantowitz, B.H. (1974). Speed-accuracy tradeoff in double stimulation: Effects on the first response. Memory & Cognition, 2 (3), 522-532.
Kuhn, T.S. (1962/1970). The Structure of Scientific Revolutions. Chicago, IL: University of Chicago Press.
Kujala, T. & Karvonen, H. (2010). Effects of control’s vertical location, design, and use on driver’s visual behaviour. In Proceedings of the European Conference on Human Centred Design for Intelligent Transport Systems 2010 (pp. 499-509). Lyon, FR: HUMANIST Publications.
Kushleyeva, Y., Salvucci, D.D., & Lee, F.J. (2005). Deciding when to switch in time-critical multitasking. Cognitive Systems Research, 6, 41-49.
Lajunen, T. & Summala, H. (2003). Can we trust self-reports of driving? Effects of impression management on Driver Behaviour Questionnaire responses. Transportation Research Part F, 6, 97-107.
Lamble, D., Laakso, M., & Summala, H. (1999). Detection thresholds in car following situations and peripheral vision: implications for positioning of visually demanding in-car displays. Ergonomics, 42 (6), 807-815.
Lansdown, T.C., Burns, P.C., & Parkes, A.M. (2004). Perspectives on occlusion and requirements for validation. Applied Ergonomics, 35, 225-232.
Lee, H.C., Lee, A.H., Cameron, D., & Li-Tsang, C. (2003). Using a driving simulator to identify older drivers at inflated risk of motor vehicle crashes. Journal of Safety Research, 34 (4), 453-459.
Lee, J. & Moray, N. (1992). Trust, control strategies and allocation of function in human-machine systems. Ergonomics, 35 (10), 1243-1270.
Lee, J.D., Regan, M.A., & Young, K.L. (2008). What drives distraction? Distraction as a breakdown of multilevel control. In M.A. Regan, J.D. Lee,

134
& K.L. Young (Eds.) Driver Distraction: Theory, Effects, and Mitigation (pp. 41-56). Boca Raton, FL: CRC Press.
Lee, J.D. & See, K.A. (2004). Trust in automation: Designing for appropriate reliance. Human Factors, 46, 50-80.
Lee, J.D. & Strayer, D.L. (2004). Preface to the special section on driver distraction. Human Factors, 46, 583-586.
Lee, J.D., Young, K.L., & Regan, M.A. (2008). Defining driver distraction. In M.A. Regan, J.D. Lee, and K.L. Young, (Eds.), Driver Distraction: Theory, Effects, and Mitigation (pp. 31-40). Boca Raton, FL: CRC Press.
Lenneman, J. K. & Backs, R. W. (2009). Cardiac autonomic control during simulated driving with a concurrent verbal working memory task. Human Factors, 51, 404-418.
Lesch, M.F. & Hancock, P.A. (2004). Driving performance during concurrent cell-phone use: are drivers aware of their performance decrements? Accident Analysis and Prevention, 36, 471-480.
Levison, W. H. (1998). Interactive highway safety design model: Issues related to driver modeling. Transportation Research Record, 1631, 20-27.
Li, Z. & Milgram, P. (2008). An empirical investigation of a dynamic brake light concept for reduction of rear-end collisions through manipulation of optical looming. International Journal of Human-Computer Studies, 66, 158-172.
Liu, Y.C. (2001). Comparative study of the effects of auditory, visual and multimodality displays on drivers’ performance in advanced traveller information systems. Ergonomics, 44 (4), 425-442.
Liu, Y.C. (2003). Effects of using head-up display in automobile context on attention demand and driving performance. Displays, 24, 157-165.
Liu, Y.C. & Wen, M.H. (2004). Comparison of head-up display (HUD) vs. head-down display (HDD): driving performance of commercial vehicle operators in Taiwan. International Journal of Human-Computer Studies, 61, 679-697.
Logan, G. D. (1988). Toward an instance theory of automatization. Psychological Review, 95, 492-527.
Lundqvist, A. & Alinder, J. (2007). Driving after brain injury: Self-awareness and coping at the tactical level of control. Brain Injury, 21 (11), 1109-1117.
Ma, R. & Kaber, D.B. (2005). Situation awareness and workload in driving while using adaptive cruise control and a cell phone. International Journal of Industrial Ergonomics, 35, 939-953.
Mattes, S. & Hallén, A. (2008). Surrogate distraction measurement techniques: The Lane Change Test. In M.A. Regan, J.D. Lee, & K.L. Young (Eds.), Driver Distraction: Theory, Effects, and Mitigation (pp. 107-122). Boca Raton, FL: CRC Press.
McDonald, W. A., & Hoffman, E. R. (1980). Review of relationships between steering wheel reversal rate and driving task demand. Human Factors, 22, 733-739.

135
McLean, J.R. & Hoffmann, E.R. (1975). Steering reversals as a measure of driver performance and steering task difficulty. Human Factors, 17, 248-256.
McPhee, L.C., Scialfa, C.T., Dennis, W.M., Ho, G., & Caird, J.K. (2004). Age differences in visual search for traffic signs during a simulated conversation. Human Factors, 46, 674-685.
Marcus, A. (2004). The next revolution: vehicle user interfaces. Interactions, 11 (1), 40-47.
Matthews, M.L., Bryant, D.J., Webb, R.D. & Harbluk, J.L. (2001). Model for situation awareness and driving. Transportation Research Record, 1779, 26-32.
Meiran, N. (1996). Reconfiguration of processing mode prior to task performance. Journal of Experimental Psychology: Learning, Memory and Cognition, 22, 1423-1442.
Mesken, J., Hagenzieker, M.P., Rothengatter, T, & de Waard, D. (2005). Frequency, determinants, and consequences of different drivers’ emotions: An on-the-road study using self-reports, (observed) behaviour, and physiology. Transportation Research Part F, 10, 458-475.
Michon, J.A. (1985). A critical view of driver behavior models: What do we know, what should we do? In L. Evans and R.C. Schwing, (Eds.), Human Behavior and Traffic Safety (pp. 485-520). New York, NY: Plenum Press.
Mikkonen V. & Keskinen E. (1980). Sisäisten mallien teoria liikennekäyttäytymisessä [Internal Models in the Control of Traffic Behaviour] (General Psychology Monographs, No. B1). University of Helsinki, General Psychology.
Miller, G.A. (1956). The magical number seven, plus or minus two: Some limits on our capacity for processing information. Psychological Review, 63, 81-97.
Mills, J.A. (1998). Control: A History of Behavioral Psychology. New York, NY: New York University Press.
Minsky, M. (1975). A framework for representing knowledge. In P.H. Winston (Ed.) The Psychology of Computer Vision (pp. 211-277). New York, NY: McGraw-Hill.
Monk, C.A., Boehm-Davis, D.A., & Trafton, G. (2004). Recovering from interruptions: Implications for driver distraction research. Human Factors, 46, 650-663.
Monk, C.A. & Kidd D.G. 2007. R we fooling ourselves: Does the occlusion technique shortchange R estimates? In Proceedings of the Fourth International Driving Symposium on Human Factors in Driver Assessment, Training and Vehicle Design (pp. 2-8). Iowa City, IA: University of Iowa Public Policy Center.
Moray, N. (1996). A taxonomy and theory of mental models. In Proceedings of Human Factors and Ergonomics Society 40th Annual Meeting (pp. 164-168). Santa Monica, CA: Human Factors and Ergonomics Society.
Moray, N. (2004). Ou’ sont les neiges d’antan? In D.A. Vincenzi, M. Mouloua, and P.A. Hancock (Eds.), Human performance, situation awareness and automation; Current research and trends (pp. 1-31). Mahwah, NJ: LEA.

136
Muir, B.M. & Moray, N. (1996). Trust in automation. Part II. Experimental studies of trust and human intervention in a process control simulation. Ergonomics, 39 (3), 429-460.
Mulder, L.J.M. & Mulder, G. (1987). Cardiovascular reactivity and mental workload. In R.I. Kitney and O. Rompelman (Eds.), The Beat-to-beat Investigation of Cardiovascular Function: Measurement, Analysis and Application (pp. 216-253). Oxford, UK: Clarendon Press.
Mulder, G., Mulder, L.J.M., Meijman, T.F., Veldman, J.B.P., & Van Roon, A.M. (2000). A psychophysiological approach to working conditions. In R. W. Backs and W. Boucsein (Eds.), Engineering Psychophysiology: Issues and Applications (pp. 139-159). Mahwah, NJ: Lawrence Erlbaum Associates.
Navon, D. (1984). Resources. A theoretical soup stone? Psychological Review, 91, 216-234.
Navon, D. (1985). Attention division or attention sharing? In M.I. Posner & O.S.M. Marin (Eds.), Attention and Performance XI (pp. 133-146). Hillsdale, NJ: Erlbaum.
Navon, D. & Gopher, D. (1979). On the economy of the human-processing system. Psychological Review, 86 (3), 214-255.
Navon D. & Gopher D. (1980). Task difficulty, resources, and dual-task performance. In R.S. Nickerson (Ed.), Attention and Performance VIII (pp. 297-315). Hillsdale, NJ: Erlbaum.
Navon, D. & Miller, J. (1987). Role of outcome conflict in dual-task interference. Journal of Experimental Psychology: Human Perception and Performance, 13, 435-448.
Neisser, U. (1976). Cognition and Reality. San Francisco, CA: Freeman. Neumann, O. (1987). Beyond capacity: A functional view of attention. In
H.Heuer & A.F. Sanders (Eds.), Perspectives on Perception and Action (pp. 361-394). Hillsdale, NJ: Erlbaum.
Neumann, O. (1996). Theories of attention. In O. Neumann, & A. Sanders (Eds.), Handbook of perception and action III. Attention (pp. 185-227). London: Academic Press.
Newell, A. & Simon, H.A. (1972). Human problem solving. Englewood Cliffs, NJ: Prentice-Hall.
Nielsen, J. (1993). Usability engineering. Boston, MA: Academic Press. Norman, D.A. & Shallice, T. (1986). Attention to action: Willed and automatic
control of behavior. In R.J. Davidson, G.E. Schwartz and D. Shapiro (Eds.), Consciousness and Self-regulation: Advances in Research and Theory, (pp. 1-18), New York, NY: Plenum Press.
Noy, Y.I. (1989). Intelligent route guidance: Will the new horse be as good as the old? In D.H.M. Reekie, E.R. Case and J. Tsai (Eds.), Proceedings of the First Vehicle Navigation and Information Systems Conference (pp. 49-55). New York, NY: IEEE.
Noy, Y.I., Lemoine, T.L., Klachan, C., & Burns, P.C. (2004). Task interruptability and duration as measures of visual distraction. Applied Ergonomics, 35, 207-213.

137
Nunes, L. & Recarte, M.A. (2002). Cognitive demands of hands-free-phone conversation while driving. Transportation Research Part F, 5, 133-144.
Nygren, T.E. (1991). Psychometric properties of subjective workload measurement techniques: Implications for their use in the assessment of perceived mental workload. Human Factors, 33, 17-34.
Näätänen, R & Summala, H. (1974) A model for the role of motivational factors in drivers’ decision-making. Accident Analysis and Prevention,6, 243-261.
Oulasvirta, A. & Ericsson, K.A. (2009). Effects of repetitive practice on interruption costs: An empirical review and theoretical implication. In L. Norros, H. Koskinen, L. Salo and P. Savioja (Eds.), Proceedings of the European Conference on Cognitive Ergonomics 2009 (VTT Symposium series 258, pp. 333-340). Helsinki, FI: VTT Technical Research Centre of Finland.
Oulasvirta, A. & Saariluoma, P. (2004). Long-term working memory and interrupting messages in human - computer interaction. Behaviour & Information Technology, 23, 53-64.
Oulasvirta, A. & Saariluoma, P. (2006). Surviving task interruptions: Investigating the implications of long-term working memory theory. International Journal of Human-Computer Studies, 64 (10), 941-961.
Pashler, H. (2000). Task switching and multitask performance. In Monsell, S., and Driver, J. (Eds.). Attention and Performance XVIII: Control of mental processes (pp. 277-307). Cambridge, MA: MIT Press.
Pashler, H. & Johnston, J.C. (1998) Attentional Limitations in Dual-Task Performance. In H. Pashler (Ed.), Attention (pp. 155-189). Hove, UK: Psychology Press.
Pashler, H., Johnston, J.C., & Ruthruff, E. (2001). Attention and performance. Annual Review of Psychology, 52, 629-651.
Patten, C.J.D., Kircher, A., Östlund, J., Nilsson, L., & Svenson, O. (2006). Driver experience and cognitive workload in different traffic environments. Accident Analysis and Prevention, 38, 887-894.
Peters, B. & Nilsson, L. (2007). Modelling the driver in control. In P.C. Cacciabue (Ed.), Modelling Driver Behaviour in Automotive Environments (pp. 85-104). London, UK: Springer.
Pöysti, L., Rajalin, S., & Summala, H. (2005). Factors influencing the use of cellular (mobile) phone during driving and hazards while using it. Accident Analysis and Prevention, 37, 47-51.
Racette, L. & Casson, E.J. (2005). The impact of visual field loss on driving performance: Evidence from on-road driving assessments. Optometry & Vision Science 82 (8), 668-674.
Rajaonah, B., Tricot, N., Anceaux, F., Millot, P. (2008). The role of intervening variables in driver–ACC cooperation. International Journal of Human-Computer Studies, 66, 185-197.
Ranney, T.A. (1994). Models of driving behavior: a review of their evolution. Accident Analysis and Prevention, 26, 733-750.

138
Ranney, T.A., Harbluk, J.L., & Noy, Y.I. (2005). Effects of voice technology on test track driving performance: Implications for driver distraction. Human Factors, 47, 439-454.
Rasmussen, J. (1987). Cognitive control and human error mechanisms. In J. Rasmussen, K. Duncan, and J. Leplat (Eds.), New Technology and Human Error (pp. 53-61). New York, NY: Wiley.
Rauch, N., Gradenegger, B., & Krüger, H.P. (2008). Identifying user strategies for interaction with in-vehicle information systems while driving in a simulator. In C. Brusque (Ed.), Proceedings of the European Conference on Human Centred Design for Intelligent Transport Systems 2008 (pp.153-162). Lyon, FR: HUMANIST Publications.
Reason, J. (1990). Human Error. Cambridge, UK: Cambridge University Press. Recarte, M.A. & Nunes, L.M. (2000). Effects of verbal and spatial-imagery tasks
on eye fixations while driving. Journal of Experimental Psychology: Applied, 6 (1), 31-43.
Recarte, M.A. & Nunes, L. (2002). Mental load and loss of control over speed in real driving. Towards a theory of attentional speed control. Transportation Research Part F, 5, 111-122.
Recarte, M.A. & Nunes, L.M. (2003). Mental workload while driving: Effects on visual search, discrimination, and decision making. Journal of Experimental Psychology: Applied, 9 (2), 119-137.
Regan, M.A., Young, K.L., & Lee, J.D. (2008). Some concluding remarks. In M.A. Regan, J.D. Lee, & K.L. Young (Eds.), Driver Distraction: Theory, Effects, and Mitigation (pp. 621-630). Boca Raton, FL: CRC Press.
Regan, M. A., Young, K. L., Lee, J.D., & Gordon, C. P. (2008). Sources of driver distraction. In M.A. Regan, J.D. Lee, & K.L. Young (Eds.), Driver Distraction: Theory, Effects, and Mitigation (pp. 249-279). Boca Raton, FL: CRC Press.
Reimer, B., D’Ambrosio, L.A., Gilbert J., Coughlin J.F., Biederman J., Surman C., Fried R., & Aleard M. (2005). Behavior differences in drivers with attention deficit hyperactivity disorder: The driving behaviour questionnaire. Accident Analysis & Prevention, 37, 996-1004.
Reyes, M.L. & Lee, J.D. (2004). The influence of IVIS distractions on tactical and control levels of driving performance. In Human Factors and Ergonomics Society 48th Annual Meeting Proceedings (pp. 2369-2373). Santa Monica, CA: Human Factors and Ergonomics Society.
Richter, K.-F. & Duckham, M. (2008). Simplest instructions: Finding easy-to-describe routes for navigation. In Proceedings of GIScience 2008 (pp. 274-289). Berlin, DE: Springer-Verlag.
Rockwell, T.H. (1972). Skills, judgment and information acquisition in driving. In T.W. Forbes (Ed.), Human factors in highway traffic safety research (pp. 133-164). New York: Wiley.
Rockwell, T.H. (1988). Spare visual capacity in driving – revisited: New empirical results for an old idea. In M.H. Freeman, C.M. Haslegrave, P.

139
Smith, S.P. Taylor, & A.G.Gale (Eds.), Vision in Vehicles II (pp. 317-324). Amsterdam, NED: Elsevier Science Publishers B.V.
Rogers, R.D. & Monsell, S. (1995). Costs of a predictable switch between simple cognitive tasks. Journal of Experimental Psychology: General, 124 (2), 207-231.
Runes, D.D. (1972). Dictionary of Philopsophy. New York, NY: Philosophical Library.
Saariluoma, P. (1990). Apperception and restructuring in chess players' problem solving. In K.J. Gilhooly, M.T.G. Keane, R.H. Logie, & G. Erdos (Eds.), Lines of Thought. Reflections on the Psychology of Thinking (pp. 41-57). London, UK: Wiley.
Saariluoma, P. (1992). Error in chess: The apperception-restructuring view. Psychological Research, 54 (1), 17-26.
Saariluoma, P. (1995). Chess Players' Thinking: A Cognitive Psychological Approach. London, UK: Routledge.
Saariluoma, P. (1997). Foundational Analysis. London, UK: Routledge. Saariluoma, P. (2001). Chess and content-oriented psychology of thinking.
Psicológica, 22, 143-164. Saariluoma, P. (2003). Apperception, content-based psychology and design. In
U. Lindeman (Ed.), Human Behaviour in Design (pp. 72-78). Berlin, GER: Springer.
Saariluoma, P. (2004). Explanatory frameworks for interaction design. In A. Pirhonen, H. Isomäki, C. Roast, & P. Saariluoma (Eds.), Future Interaction Design (pp. 67-93). London, UK: Springer.
Saariluoma, P., Kaario, K., Miettinen, K., & Mäkelä, M.M. (2008). Mental contents in interacting with a multi-objective optimization program. International Journal of Technology and Human Interaction, 4, 43-67.
Saariluoma, P. & Maarttola, I. (2003). Stumbling blocks in novice building design. Journal of Architectural and Planning Research, 20 (4), 244-254.
Saariluoma, P., Nevala, K., & Karvinen, M. (2006). Content-based analysis of modes in design engineering. In J.S.Gero (Ed.), Design Computing and Cognition ’06 (pp. 325-344). NL: Springer.
Sakai, K. (2008). Task set and prefrontal cortex. Annual Review of Neuroscience, 31, 219-245.
Salvendy, G. (2006). Handbook of Human Factors and Ergonomics. Hoboken, NJ: John Wiley & Sons.
Salvucci, D.D. (2001). Predicting the effects of in-car interface use on driver performance: An integrated model approach. International Journal of Human-Computer Studies, 55 (1), 85-107.
Salvucci, D.D. (2005). A multitasking general executive for compound continuous tasks. Cognitive Science, 29, 457-492.
Salvucci, DD, Zuber, M., Beregovaia, E., & Markley, D. (2005). Distract-R: Rapid prototyping and evaluation of in-vehicle interfaces. In Proceedings of the SIGCHI conference on Human factors in computing systems CHI’05 (pp. 581-589). New York, NY: ACM Press.

140
Sanders, A.F. (1979). Some remarks on mental load. In N. Moray (Ed.) Mental Workload. Its Theory and Measurement (pp. 41-77). New York, NY: Plenum Press.
Sanders, M.S. & McCormick, E.J. (1987). Human Factors in Engineering Design. New York, NY: McGraw-Hill.
Santos, J., Merat, N., Mouta, S., Brookhuis, K., & de Waard, D. (2005). The interaction between driving and in-vehicle information systems: Comparison of results from laboratory, simulator and real-world studies. Transportation Research Part F: Traffic Psychology and Behaviour, 8, 135-146.
Schlegel, R. E. (1993). Driver mental workload. In B. Peacock & W. Karwowski (Eds.), Automotive Ergonomics (pp. 359-382). London: Taylor & Francis.
Schneider, W. & Shiffrin, R.M. (1977). Controlled and automatic human information processing: I. Detection, search, and attention. Psychological Review, 84, 1-66.
Sellars, W., Rorty, R., & Brandom, R. (1997). Empiricism and the Philosophy of Mind. Cambridge, MA: Harvard University Press.
Senders, J.W., Kristofferson, A.B., Levison, W.H., Dietrich, C.W., & Ward, J.L. (1967). The attentional demand of automobile driving. Highway Research Record, 195, 15-33.
Shannon, C. E., & Weaver, W. (1949). The mathematical theory of communication. University of Illinois Press.
Sheridan, T. B. (2004). Driver distraction from a control theoretic perspective. Human Factors, 46, 587-599.
Shiffrin, R.M. & Schneider, W., (1977). Controlled and automatic human information processing: II. Perceptual learning, automatic attending, and a general theory. Psychological Review, 82, 127-190.
Simon, H. A., & Chase, W. G. (1973). Skill in chess. American Scientist, 61, 394-403.
Smith, K. & Hancock, P.A. (1995). Situation awareness is adaptive, externally directed consciousness. Human Factors, 37, 137-148.
Smith, M.R.H., Witt, G.J., Bakowski, D.L., Leblanc, D., & Lee, J.D. (2008). Adapting collision warnings to real-time estimates of driver distraction. In M.A. Regan, J.D. Lee, & K.L. Young (Eds.), Driver Distraction: Theory, Effects, and Mitigation (pp.501-518). Boca Raton, FL: CRC Press.
Smolin, L. (2006). The Trouble with Physics: The Rise of String Theory, the Fall of a Science, and What Comes Next. Boston, MA: Houghton Mifflin Company.
Society of Automotive Engineers (2000). SAE J2396 Surface vehicle recommended practice, definitions and experimental measures related to the specification of driver visual behavior using video based techniques. Warrendale, PA: Society of Automotive Engineers.
Society of Automotive Engineers (2004). Navigation and route guidance function accessibility while driving, SAE recommended practice J2364. Warrendale, PA: Society of Automotive Engineers.
141
Sodnik J., Dicke C., Tomazic S., & Billinghurst M. (2008). A user study of auditory versus visual interfaces for use while driving. International Journal of Human-Computer Studies, 66, 318-332.
Spelke, E., Hirst, W., & Neisser, U. (1976). Skills of divided attention. Cognition, 4, 215-230.
Spence, C. & Driver, J. (2004). Crossmodal Space and Crossmodal Attention. Oxford, UK: Oxford University Press.
Spence, C. & Ho, C. (2008). Multisensory interface design for drivers: past, present and future. Ergonomics, 51 (1), 65-70.
Spence, C. & Read, L. (2003). Speech shadowing while driving: on the difficulty of splitting attention between eye and ear. Psychological Science, 14 (3), 251-256.
Sperling, G. (1960). The information available in brief visual presentations. Psychological Monographs: General and Applied, 74 (11), 1-29.
Stanton, N.A. & Young, M.S. (1998). Vehicle automation and driving performance. Ergonomics, 41 (7), 1014-1028.
Stanton, N.A. & Young, M.S. (2000). A proposed psychological model of driving automation. Theoretical Issues in Ergonomics Science, 1 (4), 315-331.
Stanton, N.A. & Young, M.S. (2005). Driver behaviour with adaptive cruise control. Ergonomics, 48 (10), 1294-1313.
Strayer, D.L. & Drews, F.A. (2004). Profiles in driver distraction: Effects of cell phone conversations on younger and older drivers. Human Factors, 46, 640-649.
Strayer, D.L., Drews, F.A., & Johnston, W.A. (2003). Cell phone-induced failures of visual attention during simulated driving. Journal of Experimental Psychology: Applied, 9 (1), 23-32.
Sukthankar, R. (1997). Situation Awareness for Tactical Driving. Doctoral dissertation, Robotics Institute, Carnegie Mellon University.
Summala, H. (1985). Modelling driver behavior: A pessimistic prediction? In Evans, L. and Schwing, R.C. (Eds.), Human behavior and traffic safety (pp. 43-65). New York NY: Plenum.
Summala, H. (1988). Risk control is not risk adjustment: the zero-risk theory of driver behaviour and its implications. Ergonomics, 31, 491-506.
Summala, H. (1996). Accident risk and driver behaviour. Safety Science, 22, 103-117.
Summala, H. (1997). Hierachical model of behavioural adaptation and traffic accidents. In: Rothengatter, T. and Vaya, E.C. (Eds.) Traffic and transport psychology. Theory and application. U.K: Pergamon, Elsevier Science.
Summala, H., Lamble, D., & Laakso, M. (1998). Driving experience and perception of the lead car's braking when looking at in-car targets. Accident Analysis & Prevention, 30 (4), 401-407.
Summala, H., Nieminen, T., & Punto M. (1996). Maintaining lane position with peripheral vision during in-vehicle tasks. Human Factors, 38 (3), 442–451.
142
Takayama, L. & Nass, C. (2008). Driver safety and information from afar: An experimental driving simulator study of wireless vs. in-car information services. International Journal of Human-Computer Studies, 66, 173-184.
Taylor, R. M., Selcon, S. J., & Swinden, A. D. (1995). Measurement of situational awareness and performance: A unitary SART index predicts performance on a simulated ATC task. In R. Fuller, N. Johnstone, & N. McDonald (Eds.), Human factors in aviation operations (pp. 275-280). Aldershot: Avebury Aviation.
Tijerina, L. (2001). Issues in the Evaluation of Driver Distraction Associated with In-Vehicle Information and Telecommunications Systems (Report No. S01-0926). East Liberty, OH: Transportation Research Center.
Tijerina, L., Johnston, S., Parmer, E., Winterbottom, M.D., & Goodman, M. (2000). Driver distraction with wireless telecommunications and route guidance systems (DOT HS Rep. 809-069). Washington DC: U.S. National Highway and Traffic Safety Administration.
Tijerina, L. & Kochhar, D. (2007). A measurement systems analysis of total shutter open time (TSOT) as a distraction metric for visual-manual tasks. In Proceedings of the Human Factors and Ergonomics Society 51st Annual Meeting (pp. 1545-1549). Santa Monica, CA: Human Factors and Ergonomics Society.
Tsimhoni, O., Smith, D., & Green, P. (2004). Address entry while driving: Speech recognition versus a touch-screen keyboard. Human Factors, 46 (4), 600-610.
Tsimhoni, O., Yoo, H., & Green, P. (1999). Effects of Workload and Task Complexity on Driving and Task Performance for In-Vehicle Displays As Assessed by Visual Occlusion (UMTRI-99-37). Ann Arbor, MI: The University of Michigan Transportation Research Institute.
Törnros, J. & Bolling, A. (2006). Mobile phone use – effects of conversation on mental workload and driving speed in rural and urban environments. Transportation Research Part F, 9, 298-306.
Uttal, W.R. (2001). The New Phrenology: The Limits of Localizing Cognitive Processes in the Brain. Massachusetts, MI: MIT Press.
van Winsum, W., Martens, M., & Herland, L. (1999). The Effects of Speech Versus Tactile Driver Support Messages on Workload, Driver Behaviour and User Acceptance (TNO-report TM-99-C043). Soesterberg, NL: TNO.
Verwey, W.B. (2000). On-line driver workload estimation. Effects of road situation and age on secondary task measures. Ergonomics, 43 (2), 187-209.
Verwey, W. B. & Veltman, J. A. (1996). Detecting short periods of elevated workload. A comparison of nine common workload assessment techniques. Journal of Experimental Psychology: Applied, 2, 270-285.
Victor, T. W., Engström, J., & Harbluk, J. L. (2008). Distration assessment methods based on visual behavior and event detection. In M.A. Regan, J.D. Lee, & K.L. Young (Eds.), Driver Distraction: Theory, Effects, and Mitigation (pp. 135-165). Boca Raton, FL: CRC Press.

143
von Wright, G.H. (1971/2004) Explanation and Understanding. Ithaca, NY: Cornell University Press.
Walker, G.H., Stanton, N.A., & Young, M.S. (2006). The ironies of vehicle feedback in car design. Ergonomics, 49 (2), 161-179.
Walker, G.H., Stanton, N.A., & Young, M.S. (2008). Feedback and driver situation awareness (SA): A comparison of SA measures and contexts. Transportation Research Part F, 11, 282-299.
Walter, H., Vetter, S.C., Grothe, J., Wunderlich, A.P., Hahn, S., & Spitzer, M. (2001). The neural correlates of driving. NeuroReport, 12, 1763-1767.
Ward, N.J. (2000). Automation of task processed: an example of intelligent transportation systems. Human Factors & Ergonomics in Manufacturing, 10 (4), 395-408.
White, M.P., Eiser, J.R., & Harris, P.R. (2004). Risk perceptions of mobile phone use while driving. Risk Analysis, 24 (2), 323-334.
Wickens, C.D. (1980). The structure of attentional resources. In R.S. Nickerson (Ed.), Attention and Performance VIII (pp. 239-257). Hillsdale, NJ: Erlbaum.
Wickens, C.D. (1984). Processing resources in attention. In R. Parasuraman & D.R. Davies (Eds.), Varieties of Attention (pp. 63-102). Orlando, FL: Academic Press.
Wickens, C.D. (2002). Multiple resources and performance prediction. Theoretical Issues in Ergonomics Science, 3(2), 159 - 177
Wickens, C.D. (2008). Situation awareness: Review of Mica Endsley’s 1995 articles on situation awareness theory and measurement. Human Factors, 50, 397-403.
Wickens, C.D., & Hollands, J.G. (2000). Engineering Psychology and Human Performance. New Jersey, NJ: Prentice Hall.
Wickens, C.D. & Horrey, W.J. (2008). Models of attention, distraction, and highway hazard avoidance. In M.A. Regan, J.D. Lee, & K.L. Young (Eds.), Driver Distraction: Theory, Effects, and Mitigation (pp. 57-69). Boca Raton, FL: CRC Press.
Wierwille, W.W. (1993). An initial model of visual sampling of in-car displays and controls. In A.G. Gale, I.D. Brown, C.M. Haslegrave, H.W. Kruysse, & S.P. Taylor (Eds.), Vision in Vehicles IV (pp. 271-279). Amsterdam, NED: Elsevier.
Wierwille, W.W. (1995). Development of an initial model relating driver in-vehicle visual demands to accident rate. In Proceedings of Third Annual Mid-Atlantic Human Factors Conference (pp. 1-7). Blacksburg, VA: Virginia Polytechnic Institute and State University.
Wierwille, W.W., Antin, J.F., Dingus, T., & Hulse, M.C. (1988). Visual attentional demand of an in-car navigation display system. In A.G. Gale et al. (Eds.), Vision in Vehicles II (pp.307-316), Amsterdam, NL: Noth-Holland Press.
Wierwille, W.W. & Eggemeier, F.T. (1993). Recommendations for mental workload measurement in a test and evaluation environment. Human Factors, 35, 263-281.

144
Wierwille, W.W. & Tijerina, L. (1996). An analysis of driving accident narratives as a means of determining problems caused by in-vehicle visual allocation and visual workload. In A.G. Gale et al. (Eds.), Vision in Vehicles II (pp. 79-86). Amsterdam, NL: North-Holland.
Wierwille, W. W. & Tijerina, L. (1998). Modeling the relationship between driver in-vehicle visual demands and accident occurrence. In A.G. Gale (Ed.) Vision in vehicles VI (pp. 233-243), Amsterdam: Elsevier.
Wierwille, L., Tijerina, S., Kiger, T., Rockwell, T., Lauber, E., & Bittner, A.Jr. (1996). Heavy Vehicle Driver Workload Assessment Task 4: Review of Workload and Related Research (Report DOT HS 808 467). Washington D.C.: U.S. Department of Transportation.
Wiese, E.E. & Lee, J.D. (2004). Auditory alerts for in-vehicle information systems: The effects of temporal conflict and sound parameters on driver attitudes and performance. Ergonomics, 47, 965-986.
Wikiquote. Quotes about Einstein. Retrieved 4 January 2010 from http://en.wikiquote.org/wiki/Albert_Einstein#Quotes_about_Einstein.
Wikman, A. S., Haikonen, S., Summala, H., Kalska, H., Hietanen, M., & Vilkki, J. (2004). Time-sharing strategies in driving after various cerebral lesions. Brain Injury, 18, 419-432.
Wikman, A.S., Nieminen, T. & Summala, H. (1998). Driving experience and time-sharing during in-car tasks on roads of different width. Ergonomics, 41 (3), 358-372.
Wikman, A. S. & Summala, H. (2005). Aging and time-sharing in highway driving. Optometry and Vision Science, 82, 716-723.
Wilde, G.J.S. (1982). The theory of risk homeostasis: implications for safety and health. Risk Analysis, 2, 209-225.
Wilson, G.F. (1992). Applied use of cardiac and respiratory measures: practical considerations and precautions. Biological Psychology, 34, 163-178.
Wilson, G.F. & Eggemeier, F.T. (1991). Psychophysiological assessment of workload in multi-task environments. In D.L. Damos (Ed.), Multiple Task Performance (pp. 329-360). London, UK: Taylor & Francis.
Wilson, M., Smith, N.C., Chattington, M., Ford, M., & Marple-Horvat, D.E. (2006). The role of effort in moderating the anxiety – performance relationship: Testing the prediction of processing efficiency theory in simulated rally driving. Journal of Sports Sciences, 24 (11), 1223-1233.
Wittmann, M., Kiss, M., Gugg, P., Steffen, A., Fink, M., Pöppel, E., & Kamiya, H. (2006). Effects of display position of a visual in-vehicle task on simulated driving. Applied Ergonomics, 37, 187-199.
Xie, B. & Salvendy, G. (2000). Review and reappraisal of modelling and predicting mental workload in single- and multi-task environments. Work & Stress, 14 (1), 74-99.
Young, K.L., Regan, M.A., & Lee, J.D. (2008a). Measuring the effects of driver distraction: Direct driving performance methods and measures. In M.A. Regan, J.D. Lee, & K.L. Young (Eds.), Driver Distraction: Theory, Effects, and Mitigation (pp. 85-105). Boca Raton, FL: CRC Press.

145
Young, K.L., Regan, M.A., & Lee, J.D. (2008b). Factors moderating the impact of distraction on driving performance and safety. In M.A. Regan, J.D. Lee, and K.L. Young (Eds.), Driver Distraction: Theory, Effects, and Mitigation (pp. 335-351). Boca Raton, FL: CRC Press.
Young, M. & Stanton, N. (2002). Malleable attentional resources theory: A new explanation for the effects of mental underload on performance. Human Factors, 44 (3), 365-375.
Young, M.S. & Stanton, N.A. (2007). What’s skill got to do with it? Vehicle automation and driver mental workload. Ergonomics, 50 (8), 1324-1339.
Zhang, H., Smith, M.R.H., & Witt, G.J. (2006). Identification of real-time diagnostic measures of visual distraction with an automatic eye-tracking system. Human Factors, 48, 805-821.
Zhang, H., Smith, M.R.H., & Witt, G.J. (2008). Driving task demand-based distraction mitigation. In M.A. Regan, J.D. Lee, and K.L. Young (Eds.), Driver Distraction: Theory, Effects, and Mitigation (pp. 485-500). Boca Raton, FL: CRC Press.
Zijlstra, F.R.H. (1993). Efficiency in Work Behaviour: A Design Approach for Modern Tools. Delft, NL: Delft University Press.
Zwahlen, H. T., Adams, C. C., & DeBald, D. P. (1988). Safety aspects of CRT touch panel controls in automobiles. In M. H. Freeman, C. M. Haslegrave, P. Smith, S. P. Taylor, & A. G. Gale (Eds.), Vision in vehicles II (pp. 335-344). Amsterdam: Elsevier Science Publishers B.V.
Östlund, J. Carsten, O., Merat, N., Jamson, S., Janssen, W., & Brouwer, R. (2004). Deliverable 2 – HMI and Safety-Related Driver Performance. Human Machine Interface And the Safety of Traffic in Europe (HASTE) Project, Report No. GRD1/2000/25361 S12.319626. Leeds, UK: Institute for Transport Studies.

146
YHTEENVETO (FINNISH SUMMARY)
Perustuen laajaan kirjallisuuskatsaukseen tutkimusalalta, esitän, että psykologisesti hyvin perusteltu kapasiteettikeskeinen malli ihmisen suorituskyvystä rinnakkaistehtävissä muodostaa perustan vallitseville kokeellisille lähestymistavoille arvioida toissijaisten aktiviteettien häiriövaikutuksia ajoneuvon kuljettajan ajokäyttäytymiseen. Mallin mukaan operaattorin suorituskyky rinnakkaistehtävissä on riippuvainen käytettävissä olevista tietojenkäsittelyresursseista, jotka voivat joutua ylikuormitetuiksi rinnakkaistehtävien päällekkäisistä vaatimuksista johtuen. Edelleen esitän, että kuljettajalla on kuitenkin realistisissa rinnakkaistehtävätilanteissa käytössään taktisen ja strategisen tason säätelymahdollisuudet kapasiteettimallin mukaisen operationaalisen tason säätelyn ohella.
Esitetyn tutkimuksen tavoitteena on ollut eksplikoida kapasiteettikeskeisen lähestymistavan rajoitukset ja ala kokeellisessa toissijaisten aktiviteettien häiriövaikutustutkimuksessa, sekä kehittää uusi, mentaalisten representaatioiden informaatiosisältöihin perustuva lähestymis-tapa täydentämään tätä perinteistä lähestymistapaa. Pääasiallisena tutkimusmenetelmänä tutkimuksessa toimi perusteanalyysi, metatieteellinen menetelmä tieteellisen argumentaation validiteetin kehittämiseksi sekä epätäydellisen argumentaation löytämiseksi. Erityisesti käsite- ja operationalisointianalyyseja sovellettiin käsitteisiin kuten kognitiivinen kapasiteetti, kognitiivinen kuormitus, resurssit, toissijaisten aktiviteettien häiriövaikutukset, tilannetietoisuus, sekä tehtävän ennakoitavuus. Tutkimuksen empiirisessä osuudessa toteutettiin kahdeksan kokeen sarja ajosimulaatioympäristössä kapasiteettikeskeisen kokeellisen logiikan rajoitusten edelleen osoittamiseksi, sekä uuden lähestymistavan soveltuvuuden arvioimiseksi. Empiiristen tutkimusten odotettiin paljastavan sellaisia ilmiöitä sekä ajoneuvotietojärjestelmien häiriövaikutuksia, joita kapasiteettikeskeinen tutkimus ei kykene paljastamaan tai selittämään, mutta jotka toisaalta voidaan selittää sisältöperustaisten selitysmallien avulla.
Tutkimus osoittaa vallitsevan kapasiteettikeskeisen kokeellisen paradigman rajoitukset, sekä tarpeen kehittää uusia, kokonaisvaltaisempia lähestymistapoja toissijaisten aktiviteettien häiriövaikutusten arvioimiseksi tulosten validiteetin sekä hyödyllisyyden kehittämiseksi. Empiiriset tulokset osoittavat, että kuljettajan tilannetietoisuuden manipuloiminen välittämällä tietoa tulevista ajotilanteiden vaatimuksista, joko paikkansapitävää tai virheellistä, vaikuttaa merkittävästi kuljettajan ajosuoritukseen. Toiseksi, tulokset osoittavat, että kuljettajan tietoisuus toissijaisten aktiviteettien vaatimuksista, sekä vallitsevista että tulevista, vaikuttaa merkittävällä tavalla kuljettajan tilannetietoisuuteen sekä kykyyn jakaa visuaalista tarkkaavaisuutta tehokkaalla ja turvallisella tavalla ajotehtävän sekä rinnakkaisten aktiviteettien välillä.
Tutkimuksessa kehitettiin uusia sisältöperustaisia mittareita kuljettajan taktisen ja strategisen tehtävien ajoituksen sekä tilannetietoisuuden arvioimiseksi, sekä osoitettiin näiden mittareiden käyttökelpoisuus. Mittareita voidaan hyödyntää lisäksi toissijaisten tehtävien ennakoitavuuden ja keskeytettävyyden arvioinnissa, ja siten ajoneuvokäyttöliittymien kehityksessä.

147
Kaikki mittarit perustuvat psykologisesti perustellulle mallille mitattavan käyttäytymisen varianssin pienenemisestä oppimisen ja toimintamallien automatisoitumisen kautta. Mallin mukaan mitä johdonmukaisempaa ja järjestelmällisempää rinnakkaistehtäväkäyttäytyminen on, joko tietoisen säätelyn tai automatisoituneiden toimintamallien kautta, sitä paremmin kuljettaja on tietoinen rinnakkaistehtävän vaatimuksista.
Kehitettyjen mittarien avulla suoritetut ajosimulaatiokokeet osoittivat kolmen käyttöliittymätyypin häiriövaikutuksia kuljettajien kykyyn jakaa visuaalista tarkkaavaisuutta tehokkaalla ja turvallisella tavalla ajotehtävän ja toissijaisten tehtävien välillä. Toissijaisen tehtävän askeleiden johdon-mukaisuuden, ja siten, ennakoitavuuden, havaittiin vaikuttavan merkittävästi kuljettajien mahdollisuuksiin hyödyntää taktisen tason säätelyä kapasiteettirajoitustensa ylittämiseksi rinnakkaistehtävissä. Kehitetyt mittarit, jotka keskittyvät mittaamaan hajontaa ajoneuvon sisälle suuntautuvien katseiden kestojen jakaumissa, osoittivat herkkyyttä merkityksellisille eroille käyttöliittymäratkaisuissa. Mittarit osoittivat suoremmin käyttöliittymä-suunnitteluratkaisujen negatiivisia vaikutuksia kuljettajien visuaaliseen käyttäytymiseen kuin käytetyt kapasiteettipohjaiset mittarit. Koeasetelmien ulkoisen ja ekologisen validiteetin voidaan esittää olevan korkeammalla tasolla kuin tyypillisten kapasiteettipohjaisten koeasetelmien. Käytetyt asetelmat sallivat tehtävien vapaan ajoittamisen ja priorisoidun ajotehtävän, sekä siten paremmat mahdollisuudet hyödyntää taktista ja strategista säätelyä rinnakkaistehtävissä. Kokeissa keskityttiin ensikokemukseen tutkimuksen kohteina olleista rinnakkaistehtävistä.
Tulokset osoittavat, että kehitettyjä visuaalisen tarkkaavaisuuden jakamisen tehokkuutta arvioivia mittareita voidaan hyödyntää tehokkaalla tavalla kuljettajien taktisten ja strategisten kykyjen arvioimiseen visuaalisia toissijaisia aktiviteetteja sisältävissä rinnakkaistehtävissä. Toisaalta mittarit soveltuvat ajoneuvotietojärjestelmien visuaalis-manuaalisten käyttöliittymien arviointiin toissijaisten tehtävien ennakoitavuuden ja keskeytettävyyden näkökulmista. Tutkimus osoittaa, että tämäntyyppisten mittarien merkitys käyttöliittymäratkaisujen arvioinneissa on sitä suurempi, mitä enemmän informaatiota kuljettajalle tarjotaan testauksen alla olevilla järjestelmillä.
Yleisellä tasolla kokeet osoittavat, että kuljettajien tilannetietoisuuteen sekä taktiseen ja strategiseen ajatteluun keskeisesti liittyvien mentaalisten representaatioiden informaatiosisältöjen analyysia voidaan hyödyntää kuljettajien rinnakkaistehtäväkäyttäytymisen selittämisessä. Empiirinen tutkimus osoitti myös edelleen kapasiteettikeskeisen lähestymistavan rajallisuutta kuljettajien rinnakkaistehtäväkäyttäytymisen ja ajoneuvo-tietojärjestelmien häiriövaikutusten analyyseissa. Edelleen laajemmasta perspektiivistä tarkastellen sovelletulla mielensisältöperustaisella lähestymista-valla saattaa olla merkittävää arvoa myös muilla liikennepsykologian sekä ihminen-teknologia-vuorovaikutustutkimuksen aloilla.

J Y V Ä S K Y L Ä S T U D I E S I N C O M P U T I N G
1 ROPPONEN, JANNE, Software risk management -foundations, principles and empiricalfindings. 273 p. Yhteenveto 1 p. 1999.
2 KUZMIN, DMITRI, Numerical simulation ofreactive bubbly flows. 110 p. Yhteenveto 1 p.1999.
3 KARSTEN, HELENA, Weaving tapestry:collaborative information technology andorganisational change. 266 p. Yhteenveto3 p. 2000.
4 KOSKINEN, JUSSI, Automated transienthypertext support for software maintenance.98 p. (250 p.) Yhteenveto 1 p. 2000.
5 RISTANIEMI, TAPANI, Synchronization and blindsignal processing in CDMA systems. -Synkronointi ja sokea signaalinkäsittelyCDMA järjestelmässä. 112 p. Yhteenveto 1 p.2000.
6 LAITINEN, MIKA, Mathematical modelling ofconductive-radiative heat transfer. 20 p.(108 p.) Yhteenveto 1 p. 2000.
7 KOSKINEN, MINNA, Process metamodelling.Conceptual foundations and application. 213p. Yhteenveto 1 p. 2000.
8 SMOLIANSKI, ANTON, Numerical modeling oftwo-fluid interfacial flows. 109 p. Yhteenveto1 p. 2001.
9 NAHAR, NAZMUN, Information technologysupported technology transfer process. Amulti-site case study of high-tech enterprises.377 p. Yhteenveto 3 p. 2001.
10 FOMIN, VLADISLAV V., The process of standardmaking. The case of cellular mobile telephony.- Standardin kehittämisen prosessi. Tapaus-tutkimus solukkoverkkoon perustuvastamatkapuhelintekniikasta. 107 p. (208 p.)Yhteenveto 1 p. 2001.
11 PÄIVÄRINTA, TERO, A genre-based approachto developing electronic documentmanagement in the organization. 190 p.Yhteenveto 1 p. 2001.
12 HÄKKINEN, ERKKI, Design, implementation andevaluation of neural data analysisenvironment. 229 p. Yhteenveto 1 p. 2001.
13 HIRVONEN, KULLERVO, Towards betteremployment using adaptive control of labourcosts of an enterprise. 118 p. Yhteenveto 4 p.2001.
14 MAJAVA, KIRSI, Optimization-based techniquesfor image restoration. 27 p. (142 p.)Yhteenveto 1 p. 2001.
15 SAARINEN, KARI, Near infra-red measurementbased control system for thermo-mechanicalrefiners. 84 p. (186 p.) Yhteenveto 1 p. 2001.
16 FORSELL, MARKO, Improving component reusein software development. 169 p. Yhteenveto1 p. 2002.
17 VIRTANEN, PAULI, Neuro-fuzzy expert systemsin financial and control engineering.245 p. Yhteenveto 1 p. 2002.
18 KOVALAINEN, MIKKO, Computer mediatedorganizational memory for process control.
Moving CSCW research from an idea to aproduct. 57 p. (146 p.) Yhteenveto 4 p. 2002.
19 HÄMÄLÄINEN, TIMO, Broadband networkquality of service and pricing. 140 p.Yhteenveto 1 p. 2002.
20 MARTIKAINEN, JANNE, Efficient solvers fordiscretized elliptic vector-valued problems.25 p. (109 p.) Yhteenveto 1 p. 2002.
21 MURSU, ANJA, Information systemsdevelopment in developing countries. Riskmanagement and sustainability analysis inNigerian software companies. 296 p. Yhteen-veto 3 p. 2002.
22 SELEZNYOV, ALEXANDR, An anomaly intrusiondetection system based on intelligent userrecognition. 186 p. Yhteenveto 3 p. 2002.
23 LENSU, ANSSI, Computationally intelligentmethods for qualitative data analysis. 57 p.(180 p.) Yhteenveto 1 p. 2002.
24 RYABOV, VLADIMIR, Handling imperfecttemporal relations. 75 p. (145 p.) Yhteenveto2 p. 2002.
25 TSYMBAL, ALEXEY, Dynamic integration of datamining methods in knowledge discoverysystems. 69 p. (170 p.) Yhteenveto 2 p. 2002.
26 AKIMOV, VLADIMIR, Domain decompositionmethods for the problems with boundarylayers. 30 p. (84 p.). Yhteenveto 1 p. 2002.
27 SEYUKOVA-RIVKIND, LUDMILA, Mathematical andnumerical analysis of boundary valueproblems for fluid flow. 30 p. (126 p.) Yhteen-veto 1 p. 2002.
28 HÄMÄLÄINEN, SEPPO, WCDMA Radio networkperformance. 235 p. Yhteenveto 2 p. 2003.
29 PEKKOLA, SAMULI, Multiple media in groupwork. Emphasising individual users indistributed and real-time CSCW systems.210 p. Yhteenveto 2 p. 2003.
30 MARKKULA, JOUNI, Geographic personal data,its privacy protection and prospects in alocation-based service environment. 109 p.Yhteenveto 2 p. 2003.
31 HONKARANTA, ANNE, From genres to contentanalysis. Experiences from four caseorganizations. 90 p. (154 p.) Yhteenveto 1 p.2003.
32 RAITAMÄKI, JOUNI, An approach to linguisticpattern recognition using fuzzy systems.169 p. Yhteenveto 1 p. 2003.
33 SAALASTI, SAMI, Neural networks for heart ratetime series analysis. 192 p. Yhteenveto 5 p.2003.
34 NIEMELÄ, MARKETTA, Visual search ingraphical interfaces: a user psychologicalapproach. 61 p. (148 p.) Yhteenveto 1 p. 2003.
35 YOU, YU, Situation Awareness on the worldwide web. 171 p. Yhteenveto 2 p. 2004.
36 TAATILA, VESA, The concept of organizationalcompetence – A foundational analysis.- Perusteanalyysi organisaationkompetenssin käsitteestä. 111 p. Yhteenveto 2p. 2004.

J Y V Ä S K Y L Ä S T U D I E S I N C O M P U T I N G
37 LYYTIKÄINEN, VIRPI, Contextual and structuralmetadata in enterprise documentmanagement. - Konteksti- ja rakennemetatietoorganisaation dokumenttien hallinnassa.73 p. (143 p.) Yhteenveto 1 p. 2004.
38 KAARIO, KIMMO, Resource allocation and loadbalancing mechanisms for providing qualityof service in the Internet. 171 p. Yhteenveto1 p. 2004.
39 ZHANG, ZHEYING, Model component reuse.Conceptual foundations and application inthe metamodeling-based systems analysisand design environment. 76 p. (214 p.) Yh-teenveto 1 p. 2004.
40 HAARALA, MARJO, Large-scale nonsmoothoptimization variable metric bundle methodwith limited memory. 107 p. Yhteenveto 1 p.2004.
41 KALVINE, VIKTOR, Scattering and point spectrafor elliptic systems in domains withcylindrical ends. 82 p. 2004.
42 DEMENTIEVA, MARIA, Regularization inmultistage cooperative games. 78 p. 2004.
43 MAARANEN, HEIKKI, On heuristic hybridmethods and structured point sets in globalcontinuous optimization. 42 p. (168 p.)Yhteenveto 1 p. 2004.
44 FROLOV, MAXIM, Reliable control overapproximation errors by functional type aposteriori estimates. 39 p. (112 p.) 2004.
45 ZHANG, JIAN, Qos- and revenue-aware resourceallocation mechanisms in multiclass IPnetworks. 85 p. (224 p.) 2004.
46 KUJALA, JANNE, On computation in statisticalmodels with a psychophysical application. 40p. (104 p.) 2004.,
47 SOLBAKOV, VIATCHESLAV, Application ofmathematical modeling for waterenvironment problems. 66 p. (118 p.) 2004.
48 HIRVONEN, ARI P., Enterprise architectureplanning in practice. The Perspectives ofinformation and communication technologyservice provider and end-user. 44 p. (135 p.)Yhteenveto 2 p. 2005.
49 VARTIAINEN, TERO, Moral conflicts in a projectcourse in information systems education.320 p. Yhteenveto 1p. 2005.
50 HUOTARI, JOUNI, Integrating graphicalinformation system models with visualizationtechniques. - Graafisten tietojärjestelmäku-vausten integrointi visualisointitekniikoilla.56 p. (157 p.) Yhteenveto 1p. 2005.
51 WALLENIUS, EERO R., Control and managementof multi-access wireless networks. 91 p.(192 p.) Yhteenveto 3 p. 2005.
52 LEPPÄNEN, MAURI, An ontological frameworkand a methodical skeleton for methodengineering – A contextual approach. 702 p.Yhteenveto 2 p. 2005.
53 MATYUKEVICH, SERGEY, The nonstationaryMaxwell system in domains with edges andconical points. 131 p. Yhteenveto 1 p. 2005.
54 SAYENKO, ALEXANDER, Adaptive scheduling forthe QoS supported networks. 120 p. (217 p.)2005.
55 KURJENNIEMI, JANNE, A study of TD-CDMA andWCDMA radio network enhancements. 144 p.(230 p.) Yhteenveto 1 p. 2005.
56 PECHENIZKIY, MYKOLA, Feature extraction forsupervised learning in knowledge discoverysystems. 86 p. (174 p.) Yhteenveto 2 p. 2005.
57 IKONEN, SAMULI, Efficient numerical methodsfor pricing American options. 43 p. (155 p.)Yhteenveto 1 p. 2005.
58 KÄRKKÄINEN, KARI, Shape sensitivity analysisfor numerical solution of free boundaryproblems. 83 p. (119 p.) Yhteenveto 1 p. 2005.
59 HELFENSTEIN, SACHA, Transfer. Review,reconstruction, and resolution. 114 p. (206 p.)Yhteenveto 2 p. 2005.
60 NEVALA, KALEVI, Content-based designengineering thinking. In the search forapproach. 64 p. (126 p.) Yhteenveto 1 p. 2005.
61 KATASONOV, ARTEM, Dependability aspects inthe development and provision of location-based services. 157 p. Yhteenveto 1 p. 2006.
62 SARKKINEN, JARMO, Design as discourse:Representation, representational practice, andsocial practice. 86 p. (189 p.) Yhteenveto 1 p.2006.
63 ÄYRÄMÖ, SAMI, Knowledge mining usingrobust clustering. 296 p. Yhteenveto 1 p. 2006.
64 IFINEDO, PRINCELY EMILI, Enterprise resourceplanning systems success assessment: Anintegrative framework. 133 p. (366 p.) Yhteen-veto 3 p. 2006.
65 VIINIKAINEN, ARI, Quality of service andpricingin future multiple service classnetworks. 61 p. (196 p.) Yhteenveto 1 p. 2006.
66 WU, RUI, Methods for space-time parameterestimation in DS-CDMA arrays. 73 p. (121 p.)2006.
67 PARKKOLA, HANNA, Designing ICT for mothers.User psychological approach. – Tieto- javiestintätekniikoiden suunnittelu äideille.Käyttäjäpsykologinen näkökulma. 77 p.(173 p.) Yhteenveto 3 p. 2006.
68 HAKANEN, JUSSI, On potential of interactivemultiobjective optimization in chemicalprocess design. 75 p. (160 p.) Yhteenveto 2 p.2006.
69 PUTTONEN, JANI, Mobility management inwireless networks. 112 p. (215 p.)Yhteenveto 1 p. 2006.
70 LUOSTARINEN, KARI, Resource , managementmethods for QoS supported networks. 60 p.(131 p.) 2006.
71 TURCHYN, PAVLO, Adaptive meshes in computergraphics and model-based simulation. 27 p.(79 p.) Yhteenveto 1 p.
72 ZHOVTOBRYUKH, DMYTRO, Context-aware webservice composition. 290 p. Yhteenveto 2 p.2006.

J Y V Ä S K Y L Ä S T U D I E S I N C O M P U T I N G
73 KOHVAKKO, NATALIYA, Context modeling andutilization in heterogeneous networks.154 p. Yhteenveto 1 p. 2006.
74 MAZHELIS, OLEKSIY, Masquerader detection inmobile context based on behaviour andenvironment monitoring. 74 p. (179 p). Yh-teenveto 1 p. 2007.
75 SILTANEN, JARMO, Quality of service anddynamic scheduling for traffic engineering innext generation networks. 88 p. (155 p.) 2007.
76 KUUVA, SARI, Content-based approach toexperiencing visual art. - Sisältöperustainenlähestymistapa visuaalisen taiteen kokemi-seen. 203 p. Yhteenveto 3 p. 2007.
77 RUOHONEN, TONI, Improving the operation of anemergency department by using a simulationmodel. 164 p. 2007.
78 NAUMENKO, ANTON, Semantics-based accesscontrol in business networks. 72 p. (215 p.)Yhteenveto 1 p. 2007.
79 WAHLSTEDT, ARI, Stakeholders’ conceptions oflearning in learning management systemsdevelopment. - Osallistujien käsityksetoppimisesta oppimisympäristöjen kehittämi-sessä. 83 p. (130 p.) Yhteenveto 1 p. 2007.
80 ALANEN, OLLI, Quality of service for triple playservices in heterogeneous networks. 88 p.(180 p.) Yhteenveto 1 p. 2007.
81 NERI, FERRANTE, Fitness diversity adaptation inmemetic algorithms. 80 p. (185 p.) Yhteenveto1 p. 2007.
82 KURHINEN, JANI, Information delivery in mobilepeer-to-peer networks. 46 p. (106 p.) Yhteenve-to 1 p. 2007.
83 KILPELÄINEN, TURO, Genre and ontology basedbusiness information architecture framework(GOBIAF). 74 p. (153 p.) Yhteenveto 1 p. 2007.
84 YEVSEYEVA, IRYNA, Solving classificationproblems with multicriteria decision aidingapproaches. 182 p. Yhteenveto 1 p. 2007.
85 KANNISTO, ISTO, Optimized pricing, QoS andsegmentation of managed ICT services. 45 p.(111 p.) Yhteenveto 1 p. 2007.
86 GORSHKOVA, ELENA, A posteriori error estimatesand adaptive methods for incompressibleviscous flow problems. 72 p. (129 p.) Yhteen-veto 1 p. 2007.
87 LEGRAND, STEVE, Use of background real-worldknowledge in ontologies for word sensedisambiguation in the semantic web. 73 p.(144 p.) Yhteenveto 1 p. 2008.
88 HÄMÄLÄINEN, NIINA, Evaluation andmeasurement in enterprise and softwarearchitecture management. - Arviointi jamittaaminen kokonais- ja ohjelmistoarkki-tehtuurien hallinnassa. 91 p. (175 p.) Yhteen-veto 1 p. 2008.
89 OJALA, ARTO, Internationalization of softwarefirms: Finnish small and medium-sizedsoftware firms in Japan. 57 p. (180 p.) Yhteen-veto 2 p. 2008.
90 LAITILA, ERKKI, Symbolic Analysis andAtomistic Model as a Basis for a ProgramComprehension Methodology. 321 p.Yhteenveto 3 p. 2008.
91 NIHTILÄ, TIMO, Performance of AdvancedTransmission and Reception Algorithms forHigh Speed Downlink Packet Access. 93 p.(186 p.) Yhteenveto 1 p. 2008.
92 SETÄMAA-KÄRKKÄINEN, ANNE, Networkconnection selection-solving a newmultiobjective optimization problem. 52 p.(111p.) Yhteenveto 1 p. 2008.
93 PULKKINEN, MIRJA, Enterprise architecture asa collaboration tool. Discursive process forenterprise architecture management,planning and development. 130 p. (215 p.)Yhteenveto 2 p. 2008.
94 PAVLOVA, YULIA, Multistage coalitionformation game of a self-enforcinginternational environmental agreement.127 p. Yhteenveto 1 p. 2008.
95 NOUSIAINEN, TUULA, Children’s involvement inthe design of game-based learningenvironments. 297 p. Yhteenveto 2 p. 2008.
96 KUZNETSOV, NIKOLAY V., Stability andoscillations of dynamical systems. Theoryand applications. 116 p. Yhteenveto 1 p. 2008.
97 KHRIYENKO, OLEKSIY, Adaptive semantic Webbased environment for web resources. 193 p.Yhteenveto 1 p. 2008.
98 TIRRONEN, VILLE, Global optimization usingmemetic differential evolution withapplications to low level machine vision.98 p. (248 p.) Yhteenveto 1 p. 2008.
99 VALKONEN, TUOMO, Diff-convex combinationsof Euclidean distances: A search for optima.148 p. Yhteenveto 1 p. 2008.
100 SARAFANOV, OLEG, Asymptotic theory ofresonant tunneling in quantum waveguidesof variable cross-section. 69 p. Yhteenveto 1 p.2008.
101 POZHARSKIY, ALEXEY, On the electron andphonon transport in locally periodicalwaveguides. 81 p. Yhteenveto 1 p. 2008.
102 AITTOKOSKI, TIMO, On challenges of simulation-based globaland multiobjective optimization.80 p. (204 p.) Yhteenveto 1 p. 2009.
103 YALAHO, ANICET, Managing offshoreoutsourcing of software development usingthe ICT-supported unified process model: Across-case analysis. 91 p. (307 p.)Yhteenveto 4 p. 2009.
104 K OLLANUS, SAMI, Tarkastuskäytänteidenkehittäminen ohjelmistoja tuottavissa organi-saatioissa. - Improvement of inspectionpractices in software organizations. 179 p.Summary 4 p. 2009.
105 LEIKAS, JAANA, Life-Based Design. ‘Form of life’as a foundation for ICT design for olderadults. - Elämälähtöinen suunnittelu. Elä-mänmuoto ikääntyville tarkoitettujen ICTtuotteiden ja palvelujen suunnittelun lähtö-kohtana. 218 p. (318 p.) Yhteenveto 4 p. 2009.

J Y V Ä S K Y L Ä S T U D I E S I N C O M P U T I N G
106 VASILYEVA, EKATERINA, Tailoring of feedback inweb-based learning systems: Certitude-basedassessment with online multiple choicequestions. 124 p. (184 p.) Yhteenveto 2 p.2009.
107 KUDRYASHOVA, ELENAV., Cycles in continuousand discrete dynamical systems.Computations, computer assisted proofs, andcomputer experiments. 79 p. (152 p.) Yhteen-veto 1 p. 2009.
108 BLACKLEDGE, JONATHAN, Electromagneticscattering and inverse scattering solutions forthe analysis and processing of digital signalsand images. 297 p. Yhteenveto 1 p. 2009.
109 IVANNIKOV, ANDRIY, Extraction of event-relatedpotentials from electroencephalography data.- Herätepotentiaalien laskennallinen eristämi-nen EEG-havaintoaineistosta. 108 p. (150 p.)Yhteenveto 1 p. 2009.
110 KALYAKIN, IGOR, Extraction of mismatchnegativity from electroencephalography data.- Poikkeavuusnegatiivisuuden erottaminenEEG-signaalista. 47 p. (156 p.) Yhteenveto 1 p.2010.
111 HEIKKILÄ, MARIKKA, Coordination of complexoperations over organisational boundaries.265 p. Yhteenveto 3 p. 2010.
112 FEKETE, GÁBOR, Network interfacemanagement in mobile and multihomednodes. 94 p. (175 p.) Yhteenveto 1 p. 2010.
113 KUJALA, TUOMO, Capacity, workload andmental contents - Exploring the foundationsof driver distraction. 146 p. (255 p.) Yhteenve-to 2 p. 2010.