capacity factor risk at nuclear power plants
TRANSCRIPT
CAPACITY FACTOR RISK AT NUCLEAR POWER PLANTS
Yangbo Du* and John E. Parsons**
first draft November 2010 this revision January 2012
We develop a model of the dynamic structure of capacity factor risk. It incorporates the risk that the capacity factor may vary widely from year-to-year, and also the risk that the reactor may be permanently shutdown prior to the end of its anticipated useful life. We then fit the parameters of the model to the IAEA’s PRIS dataset of historical capacity factors on reactors across the globe from 1969 to 2010 (i.e., before the Fukushima disaster). The estimated capacity factor risk is greatest in the first year of operation and quickly declines until it is approximately constant through the life of the reactor. We also obtain a relatively low estimate for the mean capacity factor, approximately 73%. We discuss variations on these estimates and emphasize the importance of judgment in making these estimates.
* Center for Energy and Environmental Policy Research, MIT, E19-411, 77 Massachusetts Ave., Cambridge, MA 02139 USA, E-mail: [email protected] ** Corresponding author: MIT Sloan School of Management, MIT Center for Energy and Environmental Policy Research, and the MIT Joint Program on the Science and Policy of Global Change, MIT, E19-411, 77 Massachusetts Ave., Cambridge, MA 02139 USA, E-mail: [email protected]
Page 2
1. INTRODUCTION
One of the critical risks facing an investor in a nuclear power plant is uncertainty
about the plant’s realized capacity factor. Realized capacity factors show great variation.
Although the typical investor’s cash flow model of a proposed plant shows a projected
capacity factor of 85% or more, many reactors have problems achieving this target.
Oftentimes the shortfall is quite large. According to the Power Reactor Information
System (PRIS) database maintained by the International Atomic Energy Agency (IAEA),
the realized capacity factor is less than 50% in more than 10% of all reactor years. In one
of the countries with the largest nuclear power programs, Japan, the average capacity
factor for the three years before the Fukushima disaster, 2008-2010, was only 63%. In the
US, performance was extremely poor in the 1970s and 1980s. For example, in 1985 the
overall capacity factor for nuclear power plants in the US was 58%. Individual reactor
performance varied widely. Subsequently, capacity factors in the US have climbed
markedly, so that the average is now slightly above 90%.
How should capacity factor risk impact the valuation of a prospective new build
power plant? Few economic analyses address this question explicitly. The standard
discounted cash flow model simply applies a single risk-adjusted discount rate to the
aggregate cash flow line, discounting successive year’s cash flows by the compounded
discount rate. Although not widely appreciated, this simple model embodies a very
restrictive implicit assumption about the dynamic structure of risk at the level of the
aggregate cash flow: that is, the risk or variance of the cash flow grows linearly with
time. This structure is consistent with the risk being well described as a geometric
Brownian motion, but is not consistent with many other dynamic risk structures. Capacity

Page 3
factor risk is unlikely to be well described by a geometric Brownian motion. Uncertainty
on the capacity factor parameter will almost certainly not grow linearly with time. But
what is the dynamic structure of capacity factor risk? Answering this question is a
prerequisite to turning to more advanced valuation techniques, such as a real options
model or similar tools.1
In this paper we provide a fully specified model of the dynamic structure of
capacity factor risk. We then fit the parameters of the model to the IAEA’s PRIS dataset
of historical capacity factors on reactors across the globe from 1969 to 2010 (i.e., before
the Fukushima disaster).
We find that capacity factor risk is greatest in the first year of operation and
quickly declines until it is approximately constant. Whether risk is constant or increasing
in later years depends significantly on the probability of a premature permanent shutdown
of the reactor. Because these should be rare events, the small historical sample may not
provide a reliable estimate, and estimates can vary significantly depending upon how the
data is used. Our base case is parameterized with a conservatively low probability of a
premature permanent shutdown which yields the approximately constant variance after
the initial years of a reactor’s life. We show how the dynamic structure of risk may
change as this estimate changes.
In the course of fitting our model, we also obtain a relatively low estimate for the
mean capacity factor, approximately 73%. This is very low relative to the 85% or higher
figures commonly employed in investor cash flow models. We examine various subsets
1 For example, Rothwell (2006) values a nuclear new build using the real option technique. However, he continues to rely upon the Brownian motion assumption. Another example is Samis (2009), who uses a mean reverting process to model the electricity price risk.
Page 4
of the data to account for possible factors that could bias our numbers to a low level.
These do argue for an upward adjustment in the expected level of the capacity factor
through the life of the plant, but the adjustments are small and the final estimate remains
well short of the 85% mark, unless the sample chosen is restricted to selected countries
over select years.
There is a large literature analyzing the determinants of the capacity factor.
Joskow and Rozanski (1979) estimate a significant learning curve for the operator, with
the expected capacity factor increasing significantly in the first years of operation. They
also document some learning by the manufacturer as successive plants of the same design
are produced. They document some difference in the learning curve by reactor design,
but essentially no difference across countries. Finally, they noted that the larger reactor
designs had lower capacity factors. Easterling (1982) estimates that the learning effect on
capacity factors is greatest during the first five years of operation. The variability of
capacity factors is highest in the first year. He notes that different designs have different
mean capacity factors, and that there are persistent differences in the individual unit
capacity factors that could possibly represent any number of other factors. Krautmann
and Solow (1988) find that the age of the unit, its vintage, the size of the unit, and the
past year’s capacity factor are all significant determinants of the expected capacity factor.
Rothwell (1990) refines the observation of the capacity factor by organizing the data
according to the frequency for refueling, which need not be annual, the frequency used in
most analyses. He also decomposes the capacity factor into the service factor—i.e.,
whether the unit is available or has been taken down for refueling or for repair—and the
capacity utilization when operating. Finally, he segments the dataset by manufacturer.

Page 5
The results for age are very mixed across manufacturers, and so he argues it should not
be used to estimate the expected capacity factor. Similarly, the results for size seem to
relate to specific designs and not to size generally.2 Krautmann and Solow (1992) show
that improvements in the expected capacity factor with the age of the unit appear to have
exhausted themselves in the period following the Three Mile Island accident, and that the
units of at least one design were on the declining side of the age-performance curve.
Lester and McCabe (1993) find a learning curve effect in the first three years of a units
operation, and then document the differential learning curves for units operated at the
same site, as well as the role of experience by design, by company and for the industry as
a whole. Sturm (1993) identifies declining performance with age for countries in the
former Soviet Union and Eastern Europe, especially attributable to the years immediately
following the political transformations of the late 1980s and early 1990s. This is in
contrast to the improving performance with age in the West at the same time, and even
with identical reactor designs. Noting the significant improvements in the capacity factors
among US nuclear power plants, Rothwell (2000) provides an updated estimate of the
expected capacity factors by design type, manufacturer and size of the unit. Rothwell
(2006) updates this for one cohort. Koomey and Hultman (2007) also note the significant
improvement in the mean capacity factor at US units.
2 There is related work on factors that one might expect to enter as a determinant of the capacity factor. For example, Roberts and Burwell (1981) estimate the learning curve in licensee events reports and how this is impacted by placing new reactors at the same site as existing reactors. A lower number of events may lead to an increased capacity factor, although the authors did not report on capacity factors. David Maude-Griffin and Rothwell (1996) document how the hazard rate for an unplanned outage declined after the Three-Mile-Island reactor incident and the ensuing regulatory policy changes. Sturm (1994) also evaluates the time between forced outages, and finds significant country differences. Within country no differences by design generation or date of construction are identifiable.

Page 6
Our contribution to this literature is our focus on the variability in the capacity
factor and the risk structure through time.
A portion of the previous literature touches on the variability in the capacity
factor, including the random process of unplanned shutdowns and the decision to
permanently shutdown a reactor. Rothwell (2007) incorporates a measure of the volatility
in the capacity factor into his valuation model. It appears that volatility is estimated as if
the factor were generated by a Brownian motion. Sturm (1995) estimates nuclear power
production at a plant as a controlled stochastic process. The technology defines certain
tradeoffs facing plant managers, and these managers make choices in operating the plant
to optimize an objective function. This yields an estimated stochastic process for
unplanned outages and plant capacity when operating. Given the complexity of the
problem, the data used for estimating the model is chosen from a narrow time window
likely to reflect a stable technology and objective function. Rothwell and Rust (1995)
estimate a similar type of model in order to estimate the endogenous decision to
permanently shutdown a plant. Rothwell (2000) also estimates the differential likelihood
of different US plants being permanently shutdown as the regulatory environment shifts.
Our paper does not report the volatility or likelihood of a shutdown estimated
from an optimization problem. We model the capacity factor risk structure as if the
capacity factor were an exogenous variable.
2. A STOCHASTIC MODEL OF THE CAPACITY FACTOR
Denote a nuclear power plant’s capacity factor in year t as Ft. Denote by T the
number of years in the normal economic life of the plant—for example, the normal

Page 7
economic life may be 40 or 60 years. Then the profile of the capacity factor over the life
of the plant, t=1,…T, is, F1,…,FT. We assume that in each year, the capacity factor can
take on only the integer values from 0% to 100%. In addition, we assume that the plant
may permanently shut-down, despite not having yet reached the end of its normal
economic life, i.e., despite the fact that t≤T. We call this a premature permanent
shutdown. Once a plant is permanently shutdown, it cannot be restarted, so there is a
difference between a capacity factor of 0% and the state of being permanently shutdown.
We model the evolution of the capacity factor over the life of the plant as a
stochastic process. This allows us to reflect correlation between the capacity factors
across years. For example, a plant currently operating at 50% capacity factor may be
more likely to operate at 50% in the next year than is a plant currently operating at 95%.
We initially assume that the probability distribution for the capacity factor at t is
conditioned only on the capacity factor at t-1, and so is independent of the age of the
plant. Obviously, one could make a case that the distribution might vary according to the
reactor’s age, among other factors, and we revisit this possibility later in the paper.
Define start,j as the probability that in the year of start-up the capacity factor takes
the value j{0%,1%,…,100%}. For any other year, t, the probability that a reactor with
capacity factor i transitions to capacity factor j in year t+1, is denoted by i,j,
i{0%,1%,…,100%}, j{0%,1%,…,100%}. These probabilities are all conditional on
the reactor still operating in year t+1, i.e., it has not been permanently shutdown. Note
that except for the start-up year, they are independent of the year t. Define as the
conditional transition matrix with 102101 elements i,j,
i{“start”}{0%,1%,…,100%}, j{0%,1%,…,100%}.

Page 8
Define i as the probability that a reactor with a capacity factor i in year t the plant
is permanently shutdown in year t+1. Define as the 1021 matrix of permanent
shutdown probabilities, i, i{“start”}{0%,1%,…,100%}.
Define i,j as the unconditional transition probability, with i being the capacity
factor in year t and j being the value in year t+1, i{“start”}{0%,1%,…,100%},
j{0%,1%,…,100%}{“shutdown”}. We assume the probability i,j is a mixture of two
distributions: the probability of a permanent shutdown, and, given no permanent
shutdown, the probability of transitioning from one integer capacity factor value to
another:
shutdown=jforθ
,jforθφ=π
i
iji,ji,
99%,1000%,1%,...1.
Define as the unconditional transition matrix with 102102 elements i,j,
i{“start”}{0%,1%,…,100%}, j{0%,1%,…,100%}{“shutdown”}.
This simple structure enables us to calculate a time profile of stochastic capacity
factors for a new build nuclear power plant. Define pt,j as the unconditional probability
that the capacity factor in year t equals j. Define P as the T102 matrix with elements pt,j,
t=1,…T, j{0%,1%,…,100%}{“shutdown”}. The first row of P is the first year’s
probability distribution, p1,j=start,j. We can derive the successive rows by successive
matrix multiplication using :
Πp=p tt 1,*,* ,
Page 9
where pt,* is the tth row of P, with 1102 elements, pt-1,* is the previous row of P, with
1102 elements, and is the 102102 transition matrix.
3. ESTIMATION
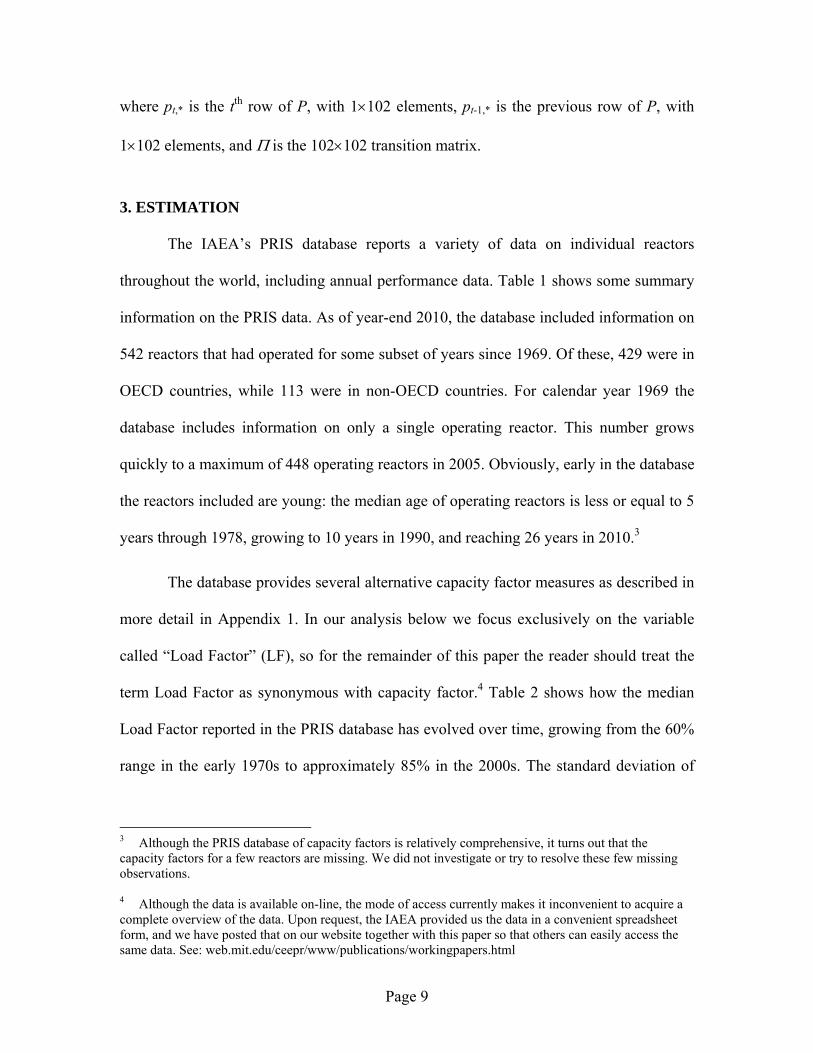
The IAEA’s PRIS database reports a variety of data on individual reactors
throughout the world, including annual performance data. Table 1 shows some summary
information on the PRIS data. As of year-end 2010, the database included information on
542 reactors that had operated for some subset of years since 1969. Of these, 429 were in
OECD countries, while 113 were in non-OECD countries. For calendar year 1969 the
database includes information on only a single operating reactor. This number grows
quickly to a maximum of 448 operating reactors in 2005. Obviously, early in the database
the reactors included are young: the median age of operating reactors is less or equal to 5
years through 1978, growing to 10 years in 1990, and reaching 26 years in 2010.3
The database provides several alternative capacity factor measures as described in
more detail in Appendix 1. In our analysis below we focus exclusively on the variable
called “Load Factor” (LF), so for the remainder of this paper the reader should treat the
term Load Factor as synonymous with capacity factor.4 Table 2 shows how the median
Load Factor reported in the PRIS database has evolved over time, growing from the 60%
range in the early 1970s to approximately 85% in the 2000s. The standard deviation of
3 Although the PRIS database of capacity factors is relatively comprehensive, it turns out that the capacity factors for a few reactors are missing. We did not investigate or try to resolve these few missing observations. 4 Although the data is available on-line, the mode of access currently makes it inconvenient to acquire a complete overview of the data. Upon request, the IAEA provided us the data in a convenient spreadsheet form, and we have posted that on our website together with this paper so that others can easily access the same data. See: web.mit.edu/ceepr/www/publications/workingpapers.html

Page 10
the annual Load Factors has not changed very much over time, fluctuating modestly
around 22% throughout the life of the database.
Importantly, the database includes the time series of performance data on reactors
that have since been permanently shutdown. Table 1 shows the number of reactors
permanently shutdown each year, together with the cumulative number of permanent
shutdowns. There are 99 reactors in the database that had been permanently shutdown as
of 2010. The large majority of these shutdowns occurred because the reactor reached the
end of its useful life, or became technologically outdated, or because economic factors no
longer make it worth operating. A few of these shutdowns occur because of accidents or
other operational problems. The database provides some information on these reasons,
although it is useful to have more detail on each case.5 We will return later to examine
more carefully the issue of reactors that are both temporarily and permanently shutdown.
The PRIS database includes several different types of reactors. The vast
majority—407 of the 542 reactors, or 75%—belong to either the boiling light water
reactor (BWR) or to the pressurized light water reactor (PWR) categories that currently
dominate the commercial reactor industry. The database also includes less popular
commercial designs such as the 55 pressurized heavy water reactors (including the
Canadian CANDUs), and designs no longer built for commercial purposes, such as the 42
gas cooled, graphite moderated reactors (widely used in the UK among other places) or
the 21 light water cooled, graphite moderated reactors (which includes the shutdown
5 Table 1 counts permanent shutdowns among those reactors reporting load factors in the PRIS dataset. Separately, the IAEA provides a list of 125 permanently shutdown reactors, with 7 shutdown prior to 1969 and 118 since. We have not investigated the discrepancy of 19 reactors shutdown since 1969 with no load factor data in the PRIS dataset.

Page 11
Chernobyl reactors and cousins elsewhere in the territory of the former Soviet Union).
Being comprehensive, the database also includes unusual and experimental designs,
including 4 high temperature reactors, 4 heavy water moderated reactors, and 1 steam
generating heavy water moderated, light water cooled reactor. There are 8 fast reactors, a
very different type of reactor that has primarily been constructed on an experimental or a
demonstration basis. A few of the reactors in the larger categories, too, were small
experimental or demonstration reactors.
We limit ourselves to data on the broad classes of BWR, PWR and PHWR
designs, and to exclude all reactors with capacity less than 300 MW since most of these
are either experimental or demonstration projects and not commercial reactors. This
leaves us with a total of 428 reactors.
We organize the sample data into a conditional transition matrix, sample, by
populating the elements of the matrix with a simple count of the observed transitions.
Reactor-by-reactor, we simply count the number of year-to-year transitions from capacity
factor i to capacity factor j, and sum across all reactors. In the PRIS database, capacity
factors are reported to the 12th decimal place. In doing our count, we round down to the
nearest integer. Therefore, the row denoted by 90 percent includes all capacity factors
from 90 percent up to, but strictly less than 91 percent. An exception to this rule applies
for reactors operating above 100 percent capacity factor, which are classed in the 100
percent level regardless of the margin the actual power generation exceeds the reference
power generation. The mass of observations is for Load Factors above 50%, and there are
transition elements with no observations. Count values in each row are then normalized
to a sum of one by dividing each row entry by the sum of the count values for the row.
Page 12
Table 3 shows an extract of this sample conditional transition matrix. Figure 1 is a
graphical display of the matrix.
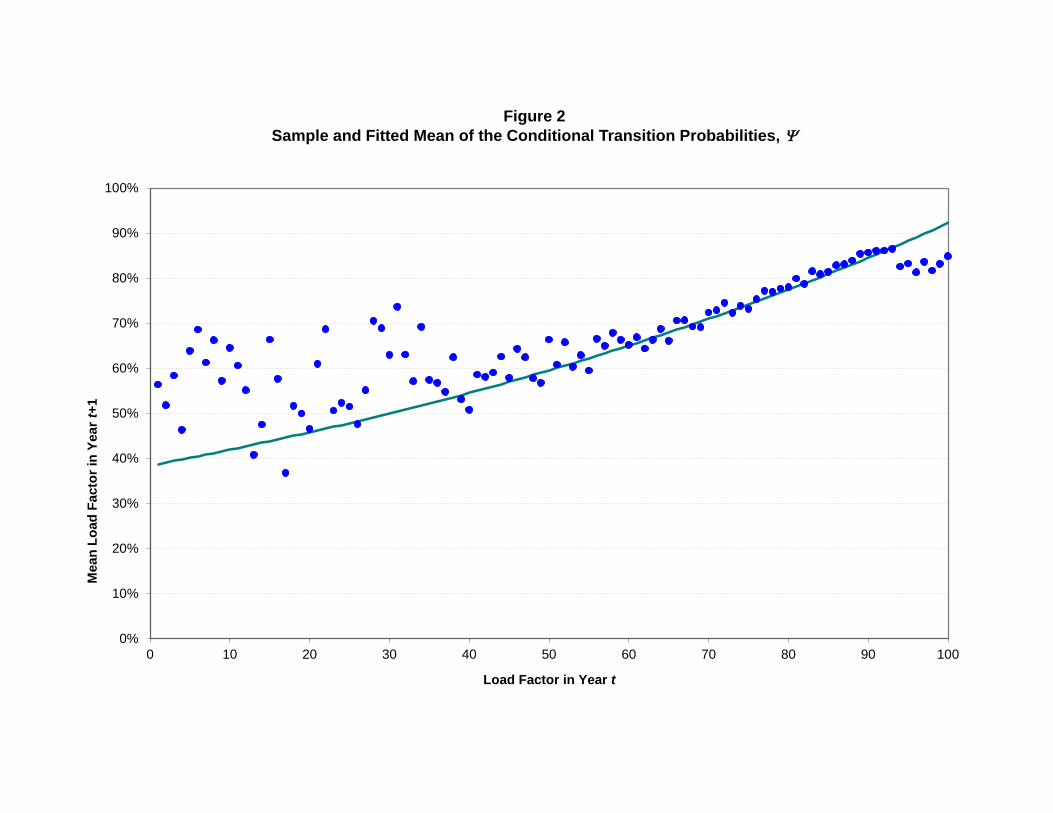
Table 4 shows the conditional sample mean capacity factor in year t, given each
capacity factor in year t-1, 100
0=j
sampleji,
samplei φj=φ , i{0%,1%,…,100%}. These values are
also plotted in Figure 2. Clearly the conditional expected capacity factor in year t+1is
increasing as a function of the capacity factor in year t. Reactors performing at a high
capacity factor tended to maintain a high capacity factor. Table 5 also shows the sample
variance of the capacity factor in year t+1, given each capacity factor in year t,
100
0
2
=j
sampleji,
samplei φφj , and these values are also plotted in Figure 3. The variance of the
capacity factor in year t is a declining function of the capacity factor in year t-1. Reactors
performing at a low capacity factor tended to exhibit more variable performance the
following year.
We go from this sample matrix to the estimated matrix by making some regularity
assumptions on the structure of the estimated matrix. In particular, we estimated the
underlying distribution means and variances by regressing the log of the sample mean
and the log of the sample variance onto the initial capacity factor. Since there are many
more observations at higher capacity factors, we weight these regressions by the number
of observations at each initial capacity factor. Table 5 reports the results of this OLS
regression with robust standard errors. Table 4 shows the fitted moments at each capacity
factor using the parameter estimates from the regression in Table 5. We then assume that

Page 13
i,j is a Beta-binomial distribution with n=100 and parameters (Fi) and (Fi). We back
out the parameters from the estimated mean and variance using the relations
iiii FFFF , and
122 iiiiiii FFFFFFF .
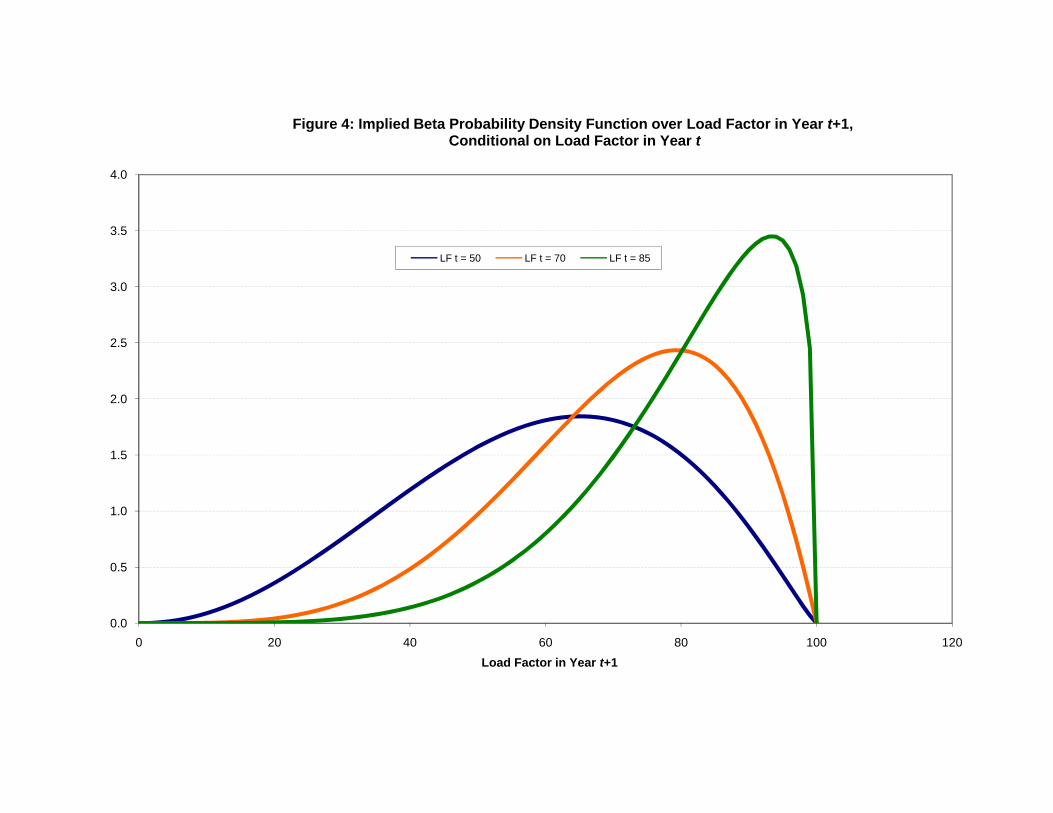
The resulting estimates for (Fi) and (Fi) are also shown in Table 5. For the start-up
year, we let the sample moments be our inputs to the estimation of the alpha and beta
parameters. Figure 4 illustrates the results by displaying three probability distributions
associated with three different initial capacity factors. Each distribution describes the
probability of the capacity factor in year t+1 given its respective capacity factor in year t.
The pattern described above—in which reactors already performing at a high capacity
factor tend to maintain such performance, while reactors performing at lower capacity
factors at any given year tend to exhibit more-variable performance the following year—
is reflected in the resulting conditional implied Beta distributions.
Having estimated the conditional transition matrix, we now turn to estimating the
probability of permanent shutdown, . Not all permanent shutdowns convey the same
information: a permanent shutdown precipitated by an accident is different from a
permanent shutdown after 40 years of commercial life when license renewal would
require major capital investments.6 We also must be careful to identify reactors which,
though still technically licensed to operate, have nevertheless been effectively shutdown.
6 What we observe in the PRIS database is not a purely exogenous variable. It is, in part, an outcome of a valuation decision being made. This is most obvious in the case of permanent shutdowns. As we mentioned in the introduction, a few studies attempt to address this distinction explicitly, at least with respect to certain specific variables. These include Sturm (1995), Rothwell and Rust (1995) and Rothwell (2000).
Page 14
Table 6a lists all reactors in our base case sample that are reported by the PRIS
database to have been permanently shutdown prior to 2011. We sort this list into 2
mutually exclusive categories. One is involuntary shutdowns. This is the count that we
use to construct our premature permanent shutdown probability. The second is voluntary
shutdowns. These are excluded from the count that we use to construct our permanent
shutdown probability. The sort is done as follows. All shutdowns that occur after the 35th
year of operation are excluded from the “exogenous” shutdown category on the basis that
the plant is approximately at the end of its originally intended useful life. We then
reference the “reasons” for shutdown listed in the IAEA database. Categories 1-3 and 5-7
are counted as voluntary shutdowns and excluded from our count of premature permanent
shutdowns. Categories 4 and 8-10 are counted as involuntary shutdowns and included in
our count of premature permanent shutdowns. In some cases multiple reasons are given:
whenever at least one reason falls in the involuntary category, the reactor is categorized
as involuntarily shutdown and added to our premature permanent shutdown count. At the
conclusion of this step we are left with 13 reactors in our base case sample that were
involuntarily shutdown and that enter into our count as premature permanent shutdowns.
Table 6b lists all reactors in our base case sample that are reported by the PRIS
database to have experienced an extended period of dormancy, i.e., 4 or more years with
no commercial production. These are reactors that are shutdown for an extended period
of time, but continue on the IAEA’s list as still licensed for operation and show a zero
Load Factor. In 11 cases identified in the table we treat these reactors as having been
permanently shutdown at the start of the dormancy period. According to our algorithm
stated above, these shutdowns are treated as voluntary and therefore do not add to the

Page 15
permanent shutdown count. However, this eliminates the successive zero Load Factor
counts from affecting our estimation of the transition probability given a zero Load
Factor. In four cases identified in the table, after substantive reinvestment and new
construction, the reactor is re-started, and we treat this as an entirely new reactor, which
impacts our estimate of the start-up probability.
This methodology is likely to underestimate the sample frequency of premature
permanent shutdowns caused by exogenous factors, at least as a financial investor
considering the value of constructing a new reactor is likely to view it. Several of the
shutdowns that are categorized as voluntary could easily be categorized as involuntary,
once again from the perspective of the financial investor: for example, the shutdown of
the Browns Ferry reactors in the US, the shutdown of the Armenia reactor, and the
shutdown of the Barsebäck reactor in Switzerland, to name a few. And some reactors that
began construction but were never completed or that never generated power
commercially—such as the Shoreham plant in the US—never make it into the dataset and
so do not add to the count of permanent shutdowns.
Because even a small number of permanent shutdowns has a large impact on the
unconditional expected capacity factor, and because of the subjective element involved in
assessing the relevance of the small sample of permanent shutdowns for future operation,
the correct estimation of the probability of a permanent shutdown going forward is likely
a very contentious issue in valuation of a new nuclear power plant. The algorithm chosen
here results in a much smaller count of prematurely permanently shutdown reactors than
in the raw dataset. This has a major effect on the unconditional expected capacity factor
and on the unconditional volatility of the capacity factor, as we shall see below. This

Page 16
emphasizes the necessity of applying careful judgment in estimating this probability
using historical data.
Table 7 shows the sample distribution of permanent shutdowns, sample,
determined by counting the number of premature permanent shutdowns for each given
load factor range and then dividing by the total count of transitions for that particular load
factor range. We then constructed a smoothed, fitted set of probabilities via
heteroscedacity-robust ordinary least squares regression of natural logs of raw probability
figures against load factor in year t. The exponential best-fit curve was then scaled so that
the sum of all fitted values equaled the sum of the sample values.7 Both the fitted and the
scaled results are also shown in Table 7.
The estimated conditional transition matrix, , and the estimated probability of a
permanent shutdown, , combine to form the estimated unconditional transition matrix,
. With this we can calculate P, the matrix of estimated probability distributions for the
capacity factor in each year of a reactor’s life. Table 8 shows the unconditional mean and
variance of the load factor in each year of operation from P. The table shows these
calculated unconditionally and conditional on the reactor still being in operation, i.e., not
permanently shutdown.
7 The unconditional probability of a permanent shutdown is determined by the interaction between the conditional transition matrix which determines the probability of arriving at any load factor in year t, and this conditional probability of shutdown. Therefore, unfortunately, this scaling does not necessarily assure that the resulting unconditional probability of a shutdown matches the sample frequency. We have not estimated the discrepancy in our estimations.
Page 17
We can see from Table 8 that the conditional variance is 9.6% in the first year and
asymptotes quickly to 3.9%. The unconditional variance also is 9.6% in the first year.8 It
declines quickly in the next few years. Ultimately, due to the compounding probability of
a permanent shutdown, the unconditional variance begins to gradually rise with the year
of operation, although this ascent is negligible here given our construction of the
probability of shutdown. This risk profile is the main result of this paper. It is graphed in
Figure 5.
Table 8 also shows that for the raw sample, the conditional mean capacity factor
is 54% in year 1. It quickly increases and asymptotes to 77%. The unconditional mean
capacity factor is 54% in the first year after start-up. The unconditional mean capacity
factor also rises gradually over the first few years of operation, reaching a peak at
approximately 76%. However, due to the compounding probability of a permanent
shutdown, the mean capacity factor falls again, if only trivially to 75% by year 60 of
operation. The increasing mean of the conditional probability distribution in the first few
years reflects the fact that the conditional transition probability at start-up has a relatively
low mean, below the steady-state conditional distribution to which it must rise. This
happens to produce the same empirical observation as one would get with an explicit
learning curve.
4. FURTHER ANALYSIS
In this section we briefly summarize the impact of segmenting the data in selected
ways. The full results for all of these variations are provided in Appendix 2.
8 The mean and the variance of the first year of operation as shown in Table 7 should match the sample mean and variance in the year of start-up as shown in Table 4. The discrepancy between the entries in the two tables comes from our discretization of the range of load factors in the P matrix.
Page 18
Age results
The model employed here assumes that the transition probability is completely
determined by the current capacity factor. No other information determines the transition
probability. One of the many alternative factors that could be relevant is the age of the
reactor. As a first pass at this problem, we separately estimate the model for the first 5
years of reactor operation and for later years. Transitions from year 4 into year 5 are in
the first category, and transitions from year 5 into year 6 are in the second category.
Allowing the age of the reactor to determine its transition probability causes the mean
capacity factor to peak at a higher level, approximately 3 percentage points higher,
reflecting better performance of older reactors. Curiously, the variance in performance is
greater among older reactors. This raises the level at which the unconditional variance in
the capacity factor flattens out with reactor age, moving it from 3.9% to 4.7%.
Epoch results
We have already noted the obvious trend in the median capacity factor apparent in
Table 2. This trend may reflect a number of different things, including changes in reactor
design that make them more reliable and easier to maintain, as well as improved
management practices. For example, in the United States, the number of days required to
reload fuel fell from 104 in 1990 to 40 in 2010. This contributed significantly to raising
capacity factors in the US.9 Given changes such as this, to what extent is the historical
data informative about future expectations for a new reactor’s capacity factor? To take a
first look at this issue, the base case dataset is divided into transitions occurring pre- and
post-2000. For pre-2000 data, the mean capacity factor, conditional on operation,
9 Davis and Wolfram (2011) analyze the role that deregulation and consolidation played in the changing performance of the US industry.

Page 19
asymptotes to 72%, 5 percentage points below the asymptote for the base case. For post-
2000 data, the mean capacity factor conditional on operation asymptotes just above 90%,
a full 13 percentage points above the asymptote for the base case. However, post-2000
data is slower in adjusting to its asymptote, so this overstates the increase in the capacity
factor in levelized terms. Using a 7% discount rate, in levelized terms the difference from
the base case is approximately 6 percentage points, not 13. Therefore, in comparable
terms the base case asymptote is a 77% mean capacity factor and the post-2000 data
yields an 83% capacity factor.
Bloc results
As one can see in Table 2, the mean capacity factor of reactors operated in OECD
countries is higher than the mean capacity factor of reactors operated in non-OECD
countries. To explore the impact of the very different contexts of these two settings, we
divided the dataset into two and estimated the transition matrix separately for each.
Because the OECD reactors dominate the dataset, the results for the OECD only differ
slightly from the results for the base case. For the non-OECD, the asymptote of the mean
capacity factor conditional on operation is more than 4 percentage points below the base
case. The major difference arises in the unconditional means and variances because of the
different estimated probability of shutdown. Non-OECD reactors dominate the sample of
permanent reactor shutdowns, and when this sample is used with a smaller overall
number of reactor years it markedly raises the probability of shutdown. Therefore, the
unconditional mean capacity factor drops after peaking in year 7. This emphasizes the
difficulty inherent in reliably estimating the probability of permanent shutdown. This
difficulty applies to the whole dataset, including OECD countries. The disaster at

Page 20
Fukushima serves to reinforce this caution mightily, since it is not in our dataset, but
including it will markedly alter the unconditional mean capacity factor in the OECD.
Country results
Obviously, finer breakdowns within the dataset lead to even sharper distinctions.
For example, if we look exclusively at reactors in the US we see an even more
pronounced change between the pre- and post-2000 periods. The asymptote of the
conditional mean capacity factor in the US is 71% pre-2000 and 91% post-2000. This
change is at least in part due to major institutional changes in the US, and the latter figure
is employed to justify forecasts of capacity factor of 90% or more for new builds in the
US. However, one must be cautious about relying on the limited experience in one
country at one time to set the forecast going forward. Elsewhere, change has been in the
wrong direction. If we look exclusively at reactors in Japan, we find that the asymptote of
the conditional mean capacity factor is 72% pre-2000 and only 62% post-2000. Recall
that this poor performance in Japan precedes Fukushima. For US investors to use the
91% figure requires confidence that the institutional improvements in the US are
irreversible and that new problems like those that plagued Japan could not arise in the
US.
The segmentations performed above are not statistically independent of one
another. For example, non-OECD reactor year observations are more heavily
concentrated in the post-2000 data set. The post-2000 data set contains a different profile
of reactor ages as compared to the pre-2000 data set. We have not attempted formal
statistical tests of the differences identified above.
Page 21
5. CONCLUSIONS
We developed a fully specified model of the dynamic structure of capacity factor
risk. It incorporates the risk that the capacity factor may vary widely from year-to-year,
and also the risk that the reactor may be permanently shutdown prior to its anticipated
useful life. We then fit the parameters of the model to the IAEA’s PRIS dataset of
historical capacity factors on reactors across the globe.
Our main result is determining how capacity factor risk evolves through the life of
a reactor, from the high starting level in the first year of operation, declining quickly over
the next couple of years, after which it is approximately constant or gradually increasing.
Whether risk is constant or increasing in later years depends significantly on the
probability of an early, permanent shutdown of the reactor. Our base case is
parameterized with a conservatively low probability of a permanent shutdown which
yields approximately constant variance after the first few years.
Although our original objective was to understand the dynamic structure of
capacity factor risk, in estimating our model we also found interesting results about the
expected level of the capacity factor. Our model, combined with the global historical
dataset, yields relatively low estimates for the expected level of the capacity factor
through the life of the plant. Our base case estimate is an asymptote of approximately
77%. If we construct our estimate using historical data only for reactors installed in
OECD countries, the estimate improves by approximately 1 percentage point. If we
construct our estimate using historical data only for reactor performance since the year
2000, the estimate improves by approximately 6 percentage points. If we construct our
estimate recognizing the different performance characteristics of young and old reactors,

Page 22
the estimated mean capacity factor is reduced in the first few years of operation, and
increased in the later years. In this preliminary analysis, we did not attempt to construct
an estimate combining each of these effects. But it is difficult to see from this first pass
through the data how that would likely yield a result close to the 90% figures that are
commonly used in advocating construction of new nuclear power plants.
Justification for such a high estimated mean capacity factor appears to require
focusing exclusively on a much smaller subset of the data—e.g. only at the performance
of mature plants in the United States since the year 2000—and simultaneously ignoring
all of the other available data and experience. Certainly there may be a good reason for
focusing on a small subset of the data and ignoring the other data. It is equally wrong to
naively treat all datapoints as equally informative as it is to naively focus on only some of
the datapoints and ignore the others. But we have not seen a careful justification for high
estimates of the mean capacity factor that seriously confront the potential information
available in the full data set.
We should reiterate here that we have been very conservative in calculating our
estimate of the probability of a permanent shutdown. Our estimates using the raw data set
show that a higher probability of a permanent shutdown could be easily rationalized
using the historical experience. This parameter has a very strong influence on the
unconditional mean capacity factor. Here again, judgment in exploiting the historical data
is key. The disaster at Fukushima only reinforces that conclusion. We obtain our low
estimate of the unconditional mean capacity factor despite being very conservative in
estimating the probability of a permanent shutdown.
Page 23
APPENDIX 1: ALTERNATIVE DEFINITIONS OF CAPACITY FACTOR
PRIS reports a variety of data on a reactor’s operating performance, including the
portion of time the reactor was on-line, the total energy generated, the energy lost due to
planned outages, the energy lost due to unplanned outages and the energy lost due to
external factors. PRIS also reports a reference level of energy generation, which is a
measure of the nameplate capacity of the unit. These variables can be combined to
calculate a number of different versions of a capacity factor. Discrepancies between the
different versions tend to occur because they each reflect differently events in which the
plant’s potential generating capacity differs from its reference power rating due to factors
outside the control of the plant operator. These factors include but are not limited to
ambient temperature, which affects the plant’s thermal efficiency, and periods of low
electricity demand that do not result in complete utilization of a plant’s electricity output.
Higher generating potential arises during periods of colder temperatures relative to that of
the plant’s nameplate capacity, which increases the plant’s heat sink capacity and in turn
its power output. Therefore output may be greater than capacity. Examples of this are
widespread among units reporting high capacity factors. One version of a capacity factor
will reflect this, recording a capacity factor above 100%, while another version will
adjust the baseline capacity to reflect the higher potential and record a capacity factor of
100%. Conversely, in a country like France where nuclear capacity exceeds base-load
demand, inevitably some units are forced to follow load and cut generation below
capacity although the plant is fully available. One version of a capacity factor will reflect
this lower generation, while another version will adjust the baseline capacity to reflect the
external constraint. In France in 2008, where nuclear power supplies over three-quarters
Page 24
of electricity output, the average capacity factor as measured by one version, the Load
Factor, was a full two percentage points below the average capacity factor as measured
by another version, the Energy Availability Factor — 75.9 percent versus 77.9 percent
respectively.
To formalize this discussion, we provide the definitions of various elements in the
calculation of capacity factors, and the formulas for different versions of capacity factors.
These are the definitions as provided by the IAEA’s PRIS dataset:
T – Reference period – time from beginning of period, first electrical production (for units in power ascension), or start of commercial operation (for units in commercial operation), whichever comes last, to the end of the period or final shutdown, whichever comes first
t – On-line hours – hours of operation (breakers closed to the station bus) during the reference period
OF – Operating factor (%) = t/T×100
RUP – Reference unit power (MW) – Maximum electrical power output maintained during prolonged operation at reference ambient conditions,
REG – Reference energy generation (MWh) = RUP×T
EG – Energy generated – net electric energy output after subtracting station load (electric energy drawn by the power station’s components)
LF – Load factor (%) = EG/REG×100
PEL – Planned energy loss – energy not produced during the reference period due to planned outages (foreseen at least four months in advance) during refueling and other operations and maintenance activities
PUF – Planned Unavailability Factor = PEL/REG
UEL – Unplanned energy loss – energy not produced during the reference period due to unplanned outages (foreseen less than four months in advance) internal to the plant
UUF – Unplanned Unavailability Factor = UEL/REG
UCF – Unit capability factor (%) = (REG – PEL – UEL)/REG×100
XEL – External energy loss – any energy loss due to causes external to the plant
XUF – External Unavailability Factor = XEL/REG

Page 25
EAF – Energy availability factor (%) = (REG – PEL – UEL – XEL)/REG×100
To illustrate how the different versions of capacity factors reflect the specific
situation of different units, Table A1 shows the data for four different reactors as reported
in 2007. Column E shows the Genkai 4 Unit in Japan. It operated 100% of the time, so
that its Operating Factor was 100%. However, its Load Factor was 101.5%. This is
because the Energy Generated was more than its Reference Energy Generation, i.e. the
ambient conditions in that year produced an actual capacity greater than the nameplate or
reference capacity. Its Energy Availability Factor was 100%. This demonstrates the
difference between the LF and the EAF. The LF reflects actual energy produced as
against a reference or nameplate capacity, although the actual capacity may be higher or
lower than the reference. In contrast, the EAF is normalized by whatever is the actual
capacity of production. Therefore the EAF cannot be greater than 100%. Column F
shows the Sequoyah 1 Unit in the United States. This unit operated 87.5% of the time,
with 12.5% of the time down for planned outages. When it was operating, it must have
been operating at full capacity since the EAF equals the OF. The LF is lower than the
EAF, which must be because actual capacity across the hours of planned operation was
less than the reference capacity. Column D shows the Wolsong 4 Unit in Korea. This unit
operated 93.1% of the time. However, the EAF is only at 92.8%, so during some portion
of the time it was operating it must have done so at slightly less than full capacity. Most
of the time it was not operating was for planned outages, although a small portion was for
unplanned outages. Column C shows the Cattenom 1 Unit in France. In addition to the
planned and unplanned outages, there is a portion of its generation capacity that is
unutilized, 1.5%, because of external factors. This is likely due to the need in France to

Page 26
operate some units in a load following mode, i.e. to not take the full capacity of the unit
even when it is made available to the system. Therefore, the UCF is higher than the EAF.

Page 27
APPENDIX 2: RESULTS FOR ALTERNATIVE SEGMENTATIONS OF
THE DATA
Tables A2 through A26 present the estimation results for the data segmented by
age of reactor, by epoch (pre- and post-2000), by OECD and non-OECD and the US and
Japan results.

Page 28
REFERENCES
David, Paul A, Roland Maude-Griffin, and Geoffrey Rothwell, 1996, Learning by Accident? Reductions in the Risk of Unplanned Outages in U.S. Nuclear Power Plants After Three Mile Island, Journal of Risk and Uncertainty, 13, 175-198.
Davis, Lucas and Catherine Wolfram, 2011, Deregulation, Consolidation, and Efficiency:
Evidence from U.S. Nuclear Power, Energy Institute at Haas Working Paper 217. Easterling, Robert G., 1982, Statistical Analysis of U.S. Power Plant Capacity Factors
through 1979, Energy, 7.3, 253-258. Hultman, Nathan E., Jonathan G. Koomey, and Daniel M. Kammen, 1 April 2007, What
History Can Teach Us about the Future Costs of U.S. Nuclear Power, Environmental Science and Technology, 2088-2093.
Joskow, Paul L. and George A. Rozanski, 1979, The Effects of Learning by Doing on
Nuclear Plant Operating Reliability, The Review of Economics and Statistics, 61.2, 161-168.
Komanoff, Charles, 1981, Power Plant Cost Escalation: Nuclear and Coal Capital Costs,
Regulations, and Economics, New York: Van Nostrand Reinhold Company. Koomey, Jonathan and Nathan E. Hultman, 2007, A reactor-level analysis of busbar costs
for US nuclear plants, 1970-2005, Energy Policy, 35, 5630-5642. Krautmann, Anthony C. and John L. Solow, 1988, Economies of Scale in Nuclear Power
Generation, Southern Economic Journal, 55.1, 70-85. Lester, Richard K. and Mark J. McCabe, 1993, The Effect of Industrial Structure on
Learning by Doing in Nuclear Power Plant Operation, The RAND Journal of Economics, 24.3, 418-438.
Rothwell, Geoffrey, 1990, Utilization and Service: Decomposing Nuclear Reactor
Capacity Factors, Resources and Energy, 12, 215-229. ---, 1996, Organizational Structure and Expected Output at Nuclear Power Plants, The
Review of Economics and Statistics, 78.3, 482-488. ---, 2006. “A Real Options Approach to Evaluating New Nuclear Power Plants,” The
Energy Journal 27, 1. Rothwell, Geoffrey and John Rust, 1995, A dynamic programming model of US nuclear
power plant operations, University of Wisconsin Department of Economics.
Page 29
---, 1995, Optimal Response to a Shift in Regulatory Regimes, Journal of Applied Econometrics, 10. S75-S118.
---, 1997, On the Optimal Lifetime of Nuclear Power Plants, Journal of Business and
Economic Statistics, 15.2, 195-208. Samis, Michael, 2009, Using Dynamic Discounted Cash Flow and Real Option
Simulation to Analyze a Financing Proposal for a Nuclear Power Plant, Ernst & Young presentation.
Sturm, Roland, 1993, Nuclear power in Eastern Europe: Learning or forgetting curves?,
Energy Economics, 15.3, 183-189. ---, 1994, Proportional hazard regression models for point processes: An analysis of
nuclear power plant operations in Europe, Journal of Applied Statistics, 21.6, 533-540.
---, 1995, Why does nuclear power performance differ across Europe?, European
Economic Review, 39.6, 1197-1214.

100
84
68
52
36
20
4
0
0.1
0.2
0.3
0.4
0.5
0.6
100
96 92 88 84 80 76 72 68 64 60 56 52 48 44 40 36 32 28 24 20 16 12 8 4 0
LF in year t
Prob
ability of transition
LF in year t+1
Figure 1Sample Conditional Transition Matrix
0%
10%
20%
30%
40%
50%
60%
70%
80%
90%
100%
0 10 20 30 40 50 60 70 80 90 100
Mea
n Lo
ad F
acto
r in
Year
t+1
Load Factor in Year t
Figure 2 Sample and Fitted Mean of the Conditional Transition Probabilities, Ψ

0%
2%
4%
6%
8%
10%
12%
14%
0 10 20 30 40 50 60 70 80 90 100
Varia
nce
of th
e Lo
ad F
acto
r in
Year
t+1
Load Factor in Year t
Figure 3 Sample and Fitted Variance of the Conditional Transition Probabilities, Ψ
2.5
3.0
3.5
4.0
Figure 4: Implied Beta Probability Density Function over Load Factor in Year t+1, Conditional on Load Factor in Year t
LF t = 50 LF t = 70 LF t = 85
0.0
0.5
1.0
1.5
2.0
0 20 40 60 80 100 120
Load Factor in Year t+1

Figure 5: Unconditional Variance of the Capacity Factor Through the Life of the Reactor
12%
Figure 5: Unconditional Variance of the Capacity Factor Through the Life of the Reactor
10%
or
8%
e of Cap
acity
Facto
6%
ndition
al Variance
2%
4%
Uncon
0%
2%
0%0 10 20 30 40 50 60
Year of Reactor Operation
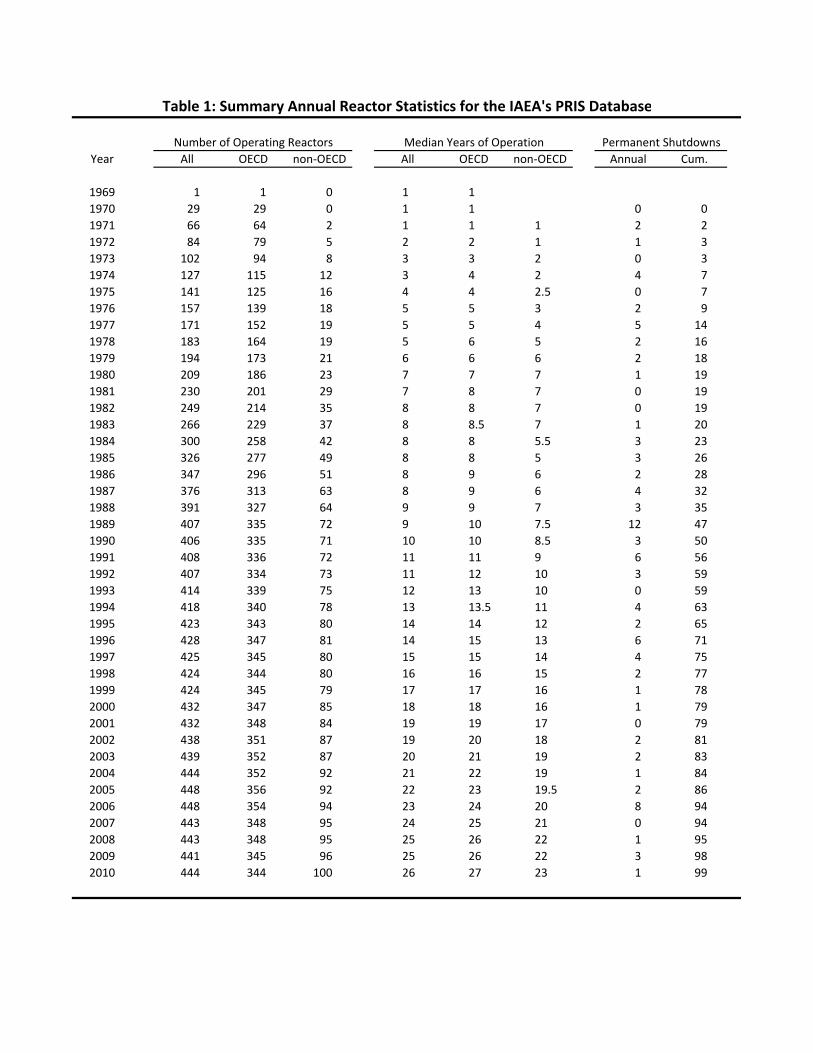
Table 1: Summary Annual Reactor Statistics for the IAEA's PRIS Database
Number of Operating Reactors Median Years of Operation Permanent ShutdownsYear All OECD non‐OECD All OECD non‐OECD Annual Cum.
1969 1 1 0 1 11970 29 29 0 1 1 0 01971 66 64 2 1 1 1 2 21972 84 79 5 2 2 1 1 31973 102 94 8 3 3 2 0 31974 127 115 12 3 4 2 4 71975 141 125 16 4 4 2.5 0 71976 157 139 18 5 5 3 2 91977 171 152 19 5 5 4 5 141978 183 164 19 5 6 5 2 161979 194 173 21 6 6 6 2 181980 209 186 23 7 7 7 1 191981 230 201 29 7 8 7 0 191982 249 214 35 8 8 7 0 191983 266 229 37 8 8.5 7 1 201984 300 258 42 8 8 5.5 3 231985 326 277 49 8 8 5 3 261986 347 296 51 8 9 6 2 281987 376 313 63 8 9 6 4 321988 391 327 64 9 9 7 3 351989 407 335 72 9 10 7.5 12 471990 406 335 71 10 10 8.5 3 501991 408 336 72 11 11 9 6 561992 407 334 73 11 12 10 3 591993 414 339 75 12 13 10 0 591994 418 340 78 13 13.5 11 4 631995 423 343 80 14 14 12 2 651996 428 347 81 14 15 13 6 711997 425 345 80 15 15 14 4 751998 424 344 80 16 16 15 2 771999 424 345 79 17 17 16 1 782000 432 347 85 18 18 16 1 792001 432 348 84 19 19 17 0 792002 438 351 87 19 20 18 2 812003 439 352 87 20 21 19 2 832004 444 352 92 21 22 19 1 842005 448 356 92 22 23 19.5 2 862006 448 354 94 23 24 20 8 942007 443 348 95 24 25 21 0 942008 443 348 95 25 26 22 1 952009 441 345 96 25 26 22 3 982010 444 344 100 26 27 23 1 99

Table 2: Summary Annual Load Factor Statistics for the IAEA's PRIS Database
Median Load Factor Standard Deviation of Load FactorYear All OECD non‐OECD All OECD non‐OECD
1969 5.8 5.81970 66.4 66.4 21.3 21.31971 66.0 66.4 1.7 25.2 23.2 0.61972 61.8 63.7 35.4 21.7 20.7 23.01973 61.0 61.9 53.3 24.5 24.7 23.01974 62.1 62.5 58.1 24.6 25.1 19.51975 66.0 69.3 49.4 24.2 24.6 18.31976 64.5 65.6 62.4 22.4 22.8 19.11977 67.9 68.9 63.1 22.0 22.5 17.21978 69.3 69.4 69.2 23.1 23.4 21.01979 64.9 63.4 73.2 22.3 22.3 22.11980 67.3 66.3 78.2 23.0 22.7 25.61981 67.9 67.4 75.7 23.1 22.8 25.51982 68.0 67.0 73.0 24.7 24.3 27.51983 69.9 69.4 76.9 23.3 23.3 23.81984 74.0 73.0 79.3 23.7 24.0 21.81985 75.2 75.2 77.3 21.1 21.2 20.71986 73.5 73.7 73.0 23.0 23.2 21.61987 73.0 72.9 73.6 22.5 22.2 23.91988 72.0 71.3 74.6 20.4 20.7 18.51989 72.8 72.8 73.2 21.5 21.4 21.91990 72.6 73.0 69.8 20.3 19.8 22.31991 74.7 75.9 64.3 20.1 19.9 19.01992 74.2 75.2 69.2 20.8 20.0 22.81993 75.0 77.2 63.4 21.5 20.5 22.11994 76.4 78.9 56.1 22.5 20.3 23.61995 77.9 79.6 60.5 21.4 18.9 23.01996 78.2 80.1 64.5 21.0 19.3 23.21997 78.4 80.9 67.4 22.6 22.3 21.51998 80.6 82.7 64.1 22.2 21.8 18.81999 82.4 84.8 66.4 19.7 18.5 19.52000 82.7 84.8 72.0 20.0 19.9 17.72001 83.8 85.7 73.7 19.2 19.0 17.22002 85.4 87.3 76.2 20.4 19.7 20.82003 83.5 85.1 79.3 21.8 22.3 19.02004 84.4 86.0 80.2 19.0 16.9 23.82005 84.1 85.8 76.7 18.6 17.3 21.02006 85.1 86.9 76.3 19.0 17.2 22.52007 84.4 85.4 79.7 20.9 20.2 22.12008 84.5 85.8 79.4 23.6 23.2 24.22009 83.6 84.6 78.2 23.8 23.3 24.72010 84.8 85.7 79.3 22.1 22.3 21.3
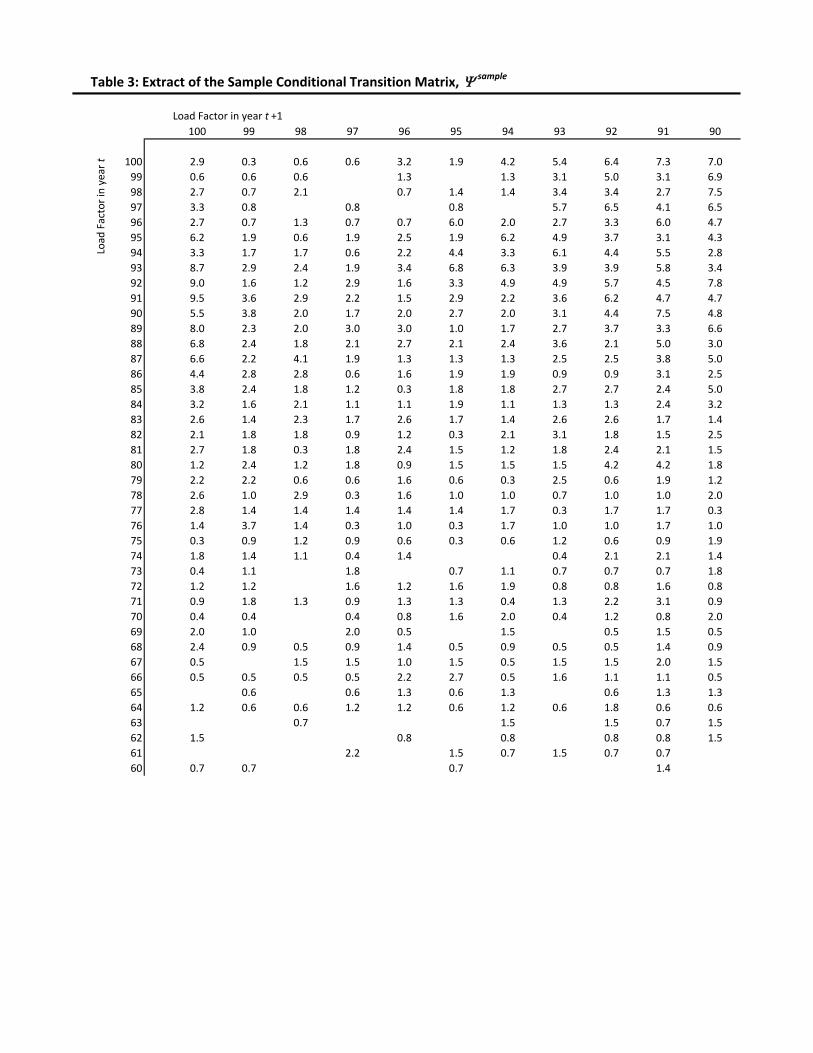
Table 3: Extract of the Sample Conditional Transition Matrix, sample
Load Factor in year t +1100 99 98 97 96 95 94 93 92 91 90
100 2.9 0.3 0.6 0.6 3.2 1.9 4.2 5.4 6.4 7.3 7.099 0.6 0.6 0.6 1.3 1.3 3.1 5.0 3.1 6.998 2.7 0.7 2.1 0.7 1.4 1.4 3.4 3.4 2.7 7.597 3.3 0.8 0.8 0.8 5.7 6.5 4.1 6.596 2.7 0.7 1.3 0.7 0.7 6.0 2.0 2.7 3.3 6.0 4.795 6.2 1.9 0.6 1.9 2.5 1.9 6.2 4.9 3.7 3.1 4.394 3.3 1.7 1.7 0.6 2.2 4.4 3.3 6.1 4.4 5.5 2.893 8.7 2.9 2.4 1.9 3.4 6.8 6.3 3.9 3.9 5.8 3.492 9.0 1.6 1.2 2.9 1.6 3.3 4.9 4.9 5.7 4.5 7.891 9.5 3.6 2.9 2.2 1.5 2.9 2.2 3.6 6.2 4.7 4.790 5.5 3.8 2.0 1.7 2.0 2.7 2.0 3.1 4.4 7.5 4.889 8.0 2.3 2.0 3.0 3.0 1.0 1.7 2.7 3.7 3.3 6.688 6.8 2.4 1.8 2.1 2.7 2.1 2.4 3.6 2.1 5.0 3.087 6.6 2.2 4.1 1.9 1.3 1.3 1.3 2.5 2.5 3.8 5.086 4.4 2.8 2.8 0.6 1.6 1.9 1.9 0.9 0.9 3.1 2.585 3.8 2.4 1.8 1.2 0.3 1.8 1.8 2.7 2.7 2.4 5.084 3.2 1.6 2.1 1.1 1.1 1.9 1.1 1.3 1.3 2.4 3.283 2.6 1.4 2.3 1.7 2.6 1.7 1.4 2.6 2.6 1.7 1.482 2.1 1.8 1.8 0.9 1.2 0.3 2.1 3.1 1.8 1.5 2.581 2.7 1.8 0.3 1.8 2.4 1.5 1.2 1.8 2.4 2.1 1.580 1.2 2.4 1.2 1.8 0.9 1.5 1.5 1.5 4.2 4.2 1.879 2.2 2.2 0.6 0.6 1.6 0.6 0.3 2.5 0.6 1.9 1.278 2.6 1.0 2.9 0.3 1.6 1.0 1.0 0.7 1.0 1.0 2.077 2.8 1.4 1.4 1.4 1.4 1.4 1.7 0.3 1.7 1.7 0.376 1.4 3.7 1.4 0.3 1.0 0.3 1.7 1.0 1.0 1.7 1.075 0.3 0.9 1.2 0.9 0.6 0.3 0.6 1.2 0.6 0.9 1.974 1.8 1.4 1.1 0.4 1.4 0.4 2.1 2.1 1.473 0.4 1.1 1.8 0.7 1.1 0.7 0.7 0.7 1.872 1.2 1.2 1.6 1.2 1.6 1.9 0.8 0.8 1.6 0.871 0.9 1.8 1.3 0.9 1.3 1.3 0.4 1.3 2.2 3.1 0.970 0.4 0.4 0.4 0.8 1.6 2.0 0.4 1.2 0.8 2.069 2.0 1.0 2.0 0.5 1.5 0.5 1.5 0.568 2.4 0.9 0.5 0.9 1.4 0.5 0.9 0.5 0.5 1.4 0.967 0.5 1.5 1.5 1.0 1.5 0.5 1.5 1.5 2.0 1.566 0.5 0.5 0.5 0.5 2.2 2.7 0.5 1.6 1.1 1.1 0.565 0.6 0.6 1.3 0.6 1.3 0.6 1.3 1.364 1.2 0.6 0.6 1.2 1.2 0.6 1.2 0.6 1.8 0.6 0.663 0.7 1.5 1.5 0.7 1.562 1.5 0.8 0.8 0.8 0.8 1.561 2.2 1.5 0.7 1.5 0.7 0.760 0.7 0.7 0.7 1.4
Load
Factor in year t

Table 4: Parameters of the Conditional Transition Probability, ,Base Case
Load Sample Fitted Implied BetaFactor Moments Moments Distribution
in Year t Mean Var Mean Var Alpha Beta
100 85% 1.2% 92% 1.5% 3.55 0.3099 83% 1.2% 92% 1.5% 3.85 0.3698 82% 1.8% 91% 1.5% 4.12 0.4297 84% 0.9% 90% 1.5% 4.37 0.4996 81% 2.3% 89% 1.6% 4.58 0.5695 83% 2.2% 88% 1.6% 4.77 0.6394 83% 2.4% 88% 1.6% 4.94 0.7093 87% 1.7% 87% 1.7% 5.08 0.7792 86% 1.4% 86% 1.7% 5.21 0.8491 86% 1.6% 85% 1.7% 5.32 0.9190 86% 1.6% 85% 1.8% 5.40 0.9989 85% 1.7% 84% 1.8% 5.48 1.0688 84% 2.3% 83% 1.8% 5.53 1.1287 83% 2.2% 82% 1.9% 5.58 1.1986 83% 1.7% 82% 1.9% 5.61 1.2685 81% 1.9% 81% 1.9% 5.63 1.3284 81% 1.9% 80% 2.0% 5.63 1.3983 82% 1.4% 80% 2.0% 5.63 1.4582 79% 2.3% 79% 2.1% 5.62 1.5181 80% 2.1% 78% 2.1% 5.60 1.5680 78% 2.3% 77% 2.1% 5.57 1.6279 78% 1.9% 77% 2.2% 5.53 1.6778 77% 1.9% 76% 2.2% 5.49 1.7277 77% 2.1% 75% 2.3% 5.44 1.7776 75% 2.8% 75% 2.3% 5.38 1.8175 73% 2.0% 74% 2.3% 5.33 1.8674 74% 2.2% 74% 2.4% 5.26 1.9073 72% 2.3% 73% 2.4% 5.19 1.9372 75% 2.3% 72% 2.5% 5.12 1.9771 73% 3.2% 72% 2.5% 5.05 2.0070 72% 2.5% 71% 2.6% 4.97 2.0369 69% 3.0% 70% 2.6% 4.89 2.0668 69% 3.6% 70% 2.7% 4.81 2.0967 71% 2.7% 69% 2.7% 4.72 2.1166 71% 3.3% 69% 2.8% 4.64 2.1365 66% 3.6% 68% 2.8% 4.55 2.1564 69% 3.5% 67% 2.9% 4.46 2.1763 66% 3.5% 67% 2.9% 4.38 2.1862 64% 4.2% 66% 3.0% 4.29 2.1961 67% 3.5% 66% 3.1% 4.20 2.20
Table 4
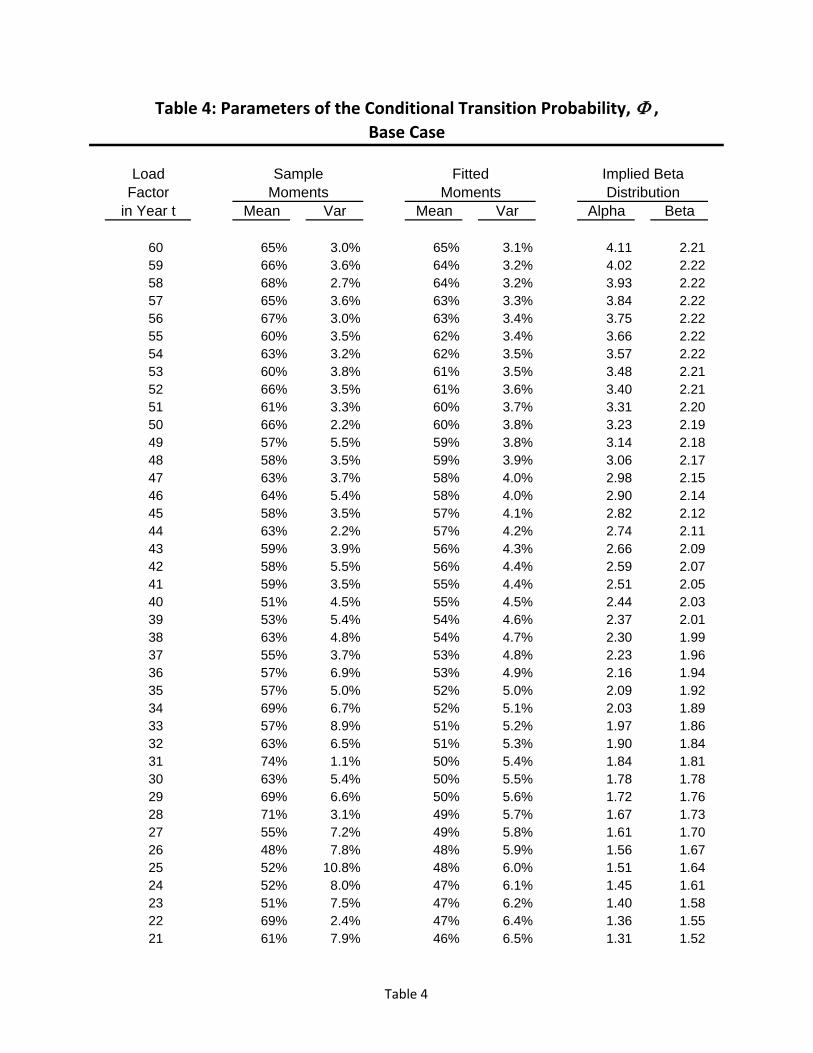
Table 4: Parameters of the Conditional Transition Probability, ,Base Case
Load Sample Fitted Implied BetaFactor Moments Moments Distribution
in Year t Mean Var Mean Var Alpha Beta
60 65% 3.0% 65% 3.1% 4.11 2.2159 66% 3.6% 64% 3.2% 4.02 2.2258 68% 2.7% 64% 3.2% 3.93 2.2257 65% 3.6% 63% 3.3% 3.84 2.2256 67% 3.0% 63% 3.4% 3.75 2.2255 60% 3.5% 62% 3.4% 3.66 2.2254 63% 3.2% 62% 3.5% 3.57 2.2253 60% 3.8% 61% 3.5% 3.48 2.2152 66% 3.5% 61% 3.6% 3.40 2.2151 61% 3.3% 60% 3.7% 3.31 2.2050 66% 2.2% 60% 3.8% 3.23 2.1949 57% 5.5% 59% 3.8% 3.14 2.1848 58% 3.5% 59% 3.9% 3.06 2.1747 63% 3.7% 58% 4.0% 2.98 2.1546 64% 5.4% 58% 4.0% 2.90 2.1445 58% 3.5% 57% 4.1% 2.82 2.1244 63% 2.2% 57% 4.2% 2.74 2.1143 59% 3.9% 56% 4.3% 2.66 2.0942 58% 5.5% 56% 4.4% 2.59 2.0741 59% 3.5% 55% 4.4% 2.51 2.0540 51% 4.5% 55% 4.5% 2.44 2.0339 53% 5.4% 54% 4.6% 2.37 2.0138 63% 4.8% 54% 4.7% 2.30 1.9937 55% 3.7% 53% 4.8% 2.23 1.9636 57% 6.9% 53% 4.9% 2.16 1.9435 57% 5.0% 52% 5.0% 2.09 1.9234 69% 6.7% 52% 5.1% 2.03 1.8933 57% 8.9% 51% 5.2% 1.97 1.8632 63% 6.5% 51% 5.3% 1.90 1.8431 74% 1.1% 50% 5.4% 1.84 1.8130 63% 5.4% 50% 5.5% 1.78 1.7829 69% 6.6% 50% 5.6% 1.72 1.7628 71% 3.1% 49% 5.7% 1.67 1.7327 55% 7.2% 49% 5.8% 1.61 1.7026 48% 7.8% 48% 5.9% 1.56 1.6725 52% 10.8% 48% 6.0% 1.51 1.6424 52% 8.0% 47% 6.1% 1.45 1.6123 51% 7.5% 47% 6.2% 1.40 1.5822 69% 2.4% 47% 6.4% 1.36 1.5521 61% 7.9% 46% 6.5% 1.31 1.52
Table 4

Table 4: Parameters of the Conditional Transition Probability, ,Base Case
Load Sample Fitted Implied BetaFactor Moments Moments Distribution
in Year t Mean Var Mean Var Alpha Beta
20 47% 11.7% 46% 6.6% 1.26 1.4919 50% 5.1% 45% 6.7% 1.22 1.4618 52% 8.7% 45% 6.9% 1.17 1.4317 37% 7.2% 45% 7.0% 1.13 1.4016 58% 7.2% 44% 7.1% 1.09 1.3715 66% 3.6% 44% 7.3% 1.05 1.3414 48% 11.5% 43% 7.4% 1.01 1.3113 41% 12.7% 43% 7.5% 0.97 1.2812 55% 9.8% 43% 7.7% 0.93 1.2511 61% 6.9% 42% 7.8% 0.90 1.2210 65% 7.3% 42% 8.0% 0.86 1.199 57% 6.7% 42% 8.1% 0.83 1.168 66% 4.0% 41% 8.3% 0.79 1.137 61% 9.5% 41% 8.4% 0.76 1.106 69% 3.0% 41% 8.6% 0.73 1.075 64% 5.3% 40% 8.8% 0.70 1.044 46% 5.6% 40% 8.9% 0.67 1.013 58% 6.8% 39% 9.1% 0.64 0.982 52% 9.9% 39% 9.3% 0.61 0.951 56% 10.4% 39% 9.5% 0.59 0.920 21% 8.8% 38% 9.6% 0.56 0.90
start-up 52% 9.5% 0.85 0.79
Table 4
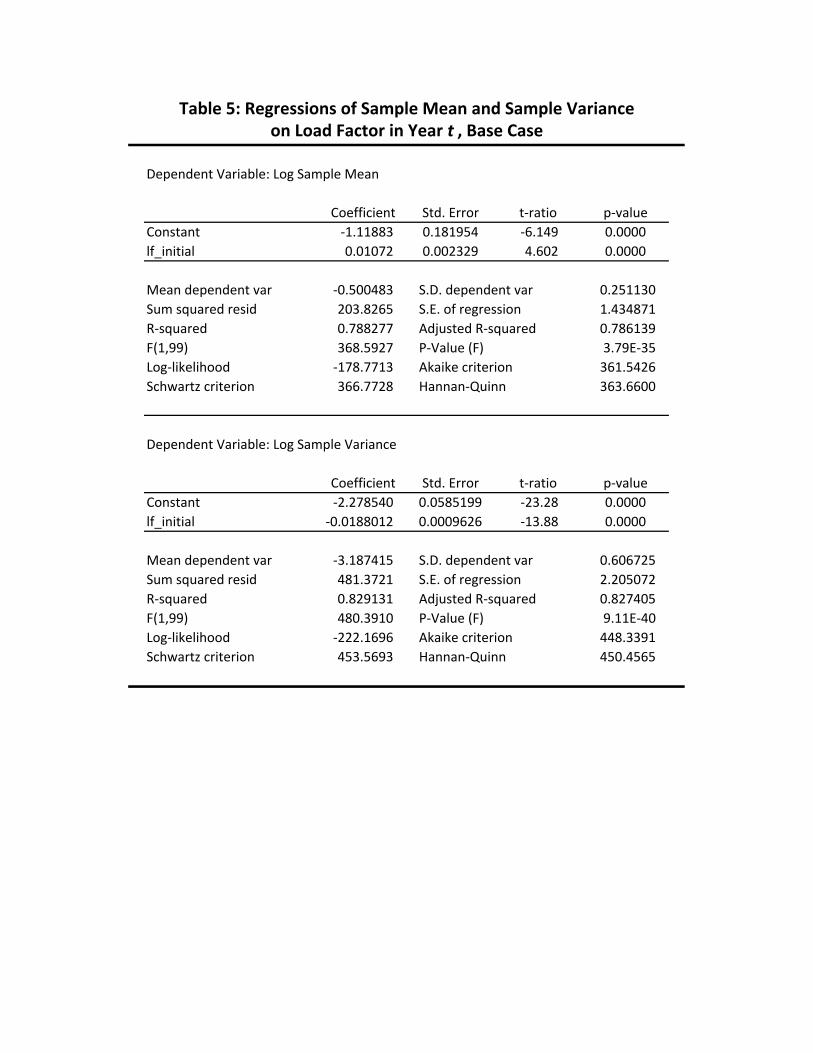
Table 5: Regressions of Sample Mean and Sample Varianceon Load Factor in Year t , Base Case
Dependent Variable: Log Sample Mean
Coefficient Std. Error t‐ratio p‐valueConstant ‐1.11883 0.181954 ‐6.149 0.0000lf_initial 0.01072 0.002329 4.602 0.0000
Mean dependent var ‐0.500483 S.D. dependent var 0.251130Sum squared resid 203.8265 S.E. of regression 1.434871R‐squared 0.788277 Adjusted R‐squared 0.786139F(1,99) 368.5927 P‐Value (F) 3.79E‐35Log‐likelihood ‐178.7713 Akaike criterion 361.5426Schwartz criterion 366.7728 Hannan‐Quinn 363.6600
Dependent Variable: Log Sample Variance
Coefficient Std. Error t‐ratio p‐valueConstant ‐2.278540 0.0585199 ‐23.28 0.0000lf_initial ‐0.0188012 0.0009626 ‐13.88 0.0000
Mean dependent var ‐3.187415 S.D. dependent var 0.606725Sum squared resid 481.3721 S.E. of regression 2.205072R‐squared 0.829131 Adjusted R‐squared 0.827405F(1,99) 480.3910 P‐Value (F) 9.11E‐40Log‐likelihood ‐222.1696 Akaike criterion 448.3391Schwartz criterion 453.5693 Hannan‐Quinn 450.4565
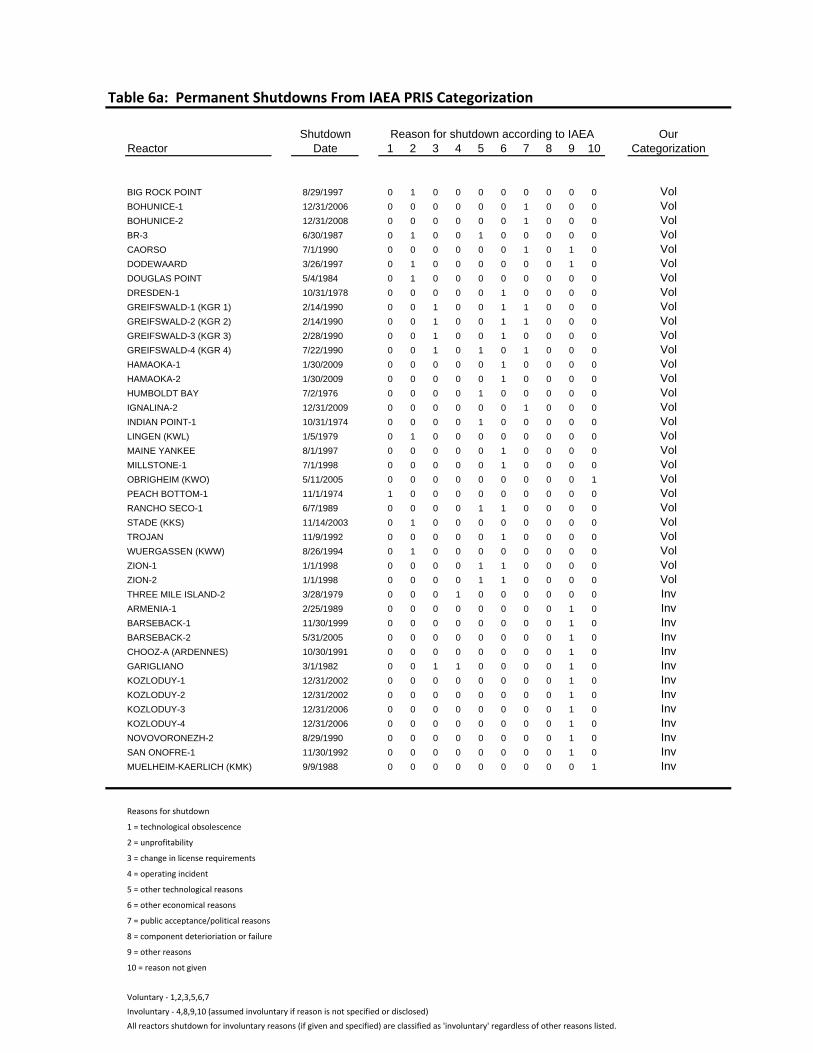
Table 6a: Permanent Shutdowns From IAEA PRIS Categorization
Shutdown Reason for shutdown according to IAEA OurReactor Date 1 2 3 4 5 6 7 8 9 10 Categorization
BIG ROCK POINT 8/29/1997 0 1 0 0 0 0 0 0 0 0 VolBOHUNICE-1 12/31/2006 0 0 0 0 0 0 1 0 0 0 VolBOHUNICE-2 12/31/2008 0 0 0 0 0 0 1 0 0 0 VolBR-3 6/30/1987 0 1 0 0 1 0 0 0 0 0 VolCAORSO 7/1/1990 0 0 0 0 0 0 1 0 1 0 VolDODEWAARD 3/26/1997 0 1 0 0 0 0 0 0 1 0 VolDOUGLAS POINT 5/4/1984 0 1 0 0 0 0 0 0 0 0 VolDRESDEN-1 10/31/1978 0 0 0 0 0 1 0 0 0 0 VolGREIFSWALD-1 (KGR 1) 2/14/1990 0 0 1 0 0 1 1 0 0 0 VolGREIFSWALD-2 (KGR 2) 2/14/1990 0 0 1 0 0 1 1 0 0 0 VolGREIFSWALD-3 (KGR 3) 2/28/1990 0 0 1 0 0 1 0 0 0 0 VolGREIFSWALD-4 (KGR 4) 7/22/1990 0 0 1 0 1 0 1 0 0 0 VolHAMAOKA-1 1/30/2009 0 0 0 0 0 1 0 0 0 0 VolHAMAOKA-2 1/30/2009 0 0 0 0 0 1 0 0 0 0 VolHUMBOLDT BAY 7/2/1976 0 0 0 0 1 0 0 0 0 0 VolIGNALINA-2 12/31/2009 0 0 0 0 0 0 1 0 0 0 VolINDIAN POINT-1 10/31/1974 0 0 0 0 1 0 0 0 0 0 VolLINGEN (KWL) 1/5/1979 0 1 0 0 0 0 0 0 0 0 VolMAINE YANKEE 8/1/1997 0 0 0 0 0 1 0 0 0 0 VolMILLSTONE-1 7/1/1998 0 0 0 0 0 1 0 0 0 0 VolOBRIGHEIM (KWO) 5/11/2005 0 0 0 0 0 0 0 0 0 1 VolPEACH BOTTOM-1 11/1/1974 1 0 0 0 0 0 0 0 0 0 VolRANCHO SECO-1 6/7/1989 0 0 0 0 1 1 0 0 0 0 VolSTADE (KKS) 11/14/2003 0 1 0 0 0 0 0 0 0 0 VolTROJAN 11/9/1992 0 0 0 0 0 1 0 0 0 0 VolWUERGASSEN (KWW) 8/26/1994 0 1 0 0 0 0 0 0 0 0 VolZION-1 1/1/1998 0 0 0 0 1 1 0 0 0 0 VolZION-2 1/1/1998 0 0 0 0 1 1 0 0 0 0 VolTHREE MILE ISLAND-2 3/28/1979 0 0 0 1 0 0 0 0 0 0 InvARMENIA-1 2/25/1989 0 0 0 0 0 0 0 0 1 0 InvBARSEBACK-1 11/30/1999 0 0 0 0 0 0 0 0 1 0 InvBARSEBACK-2 5/31/2005 0 0 0 0 0 0 0 0 1 0 InvCHOOZ-A (ARDENNES) 10/30/1991 0 0 0 0 0 0 0 0 1 0 InvGARIGLIANO 3/1/1982 0 0 1 1 0 0 0 0 1 0 InvKOZLODUY-1 12/31/2002 0 0 0 0 0 0 0 0 1 0 InvKOZLODUY-2 12/31/2002 0 0 0 0 0 0 0 0 1 0 InvKOZLODUY-3 12/31/2006 0 0 0 0 0 0 0 0 1 0 InvKOZLODUY-4 12/31/2006 0 0 0 0 0 0 0 0 1 0 InvNOVOVORONEZH-2 8/29/1990 0 0 0 0 0 0 0 0 1 0 InvSAN ONOFRE-1 11/30/1992 0 0 0 0 0 0 0 0 1 0 InvMUELHEIM-KAERLICH (KMK) 9/9/1988 0 0 0 0 0 0 0 0 0 1 Inv
Reasons for shutdown
1 = technological obsolescence
2 = unprofitability
3 = change in license requirements
4 = operating incident
5 = other technological reasons
6 = other economical reasons
7 = public acceptance/political reasons
8 = component deterioriation or failure
9 = other reasons
10 = reason not given
Voluntary ‐ 1,2,3,5,6,7
Involuntary ‐ 4,8,9,10 (assumed involuntary if reason is not specified or disclosed)
All reactors shutdown for involuntary reasons (if given and specified) are classified as 'involuntary' regardless of other reasons listed.
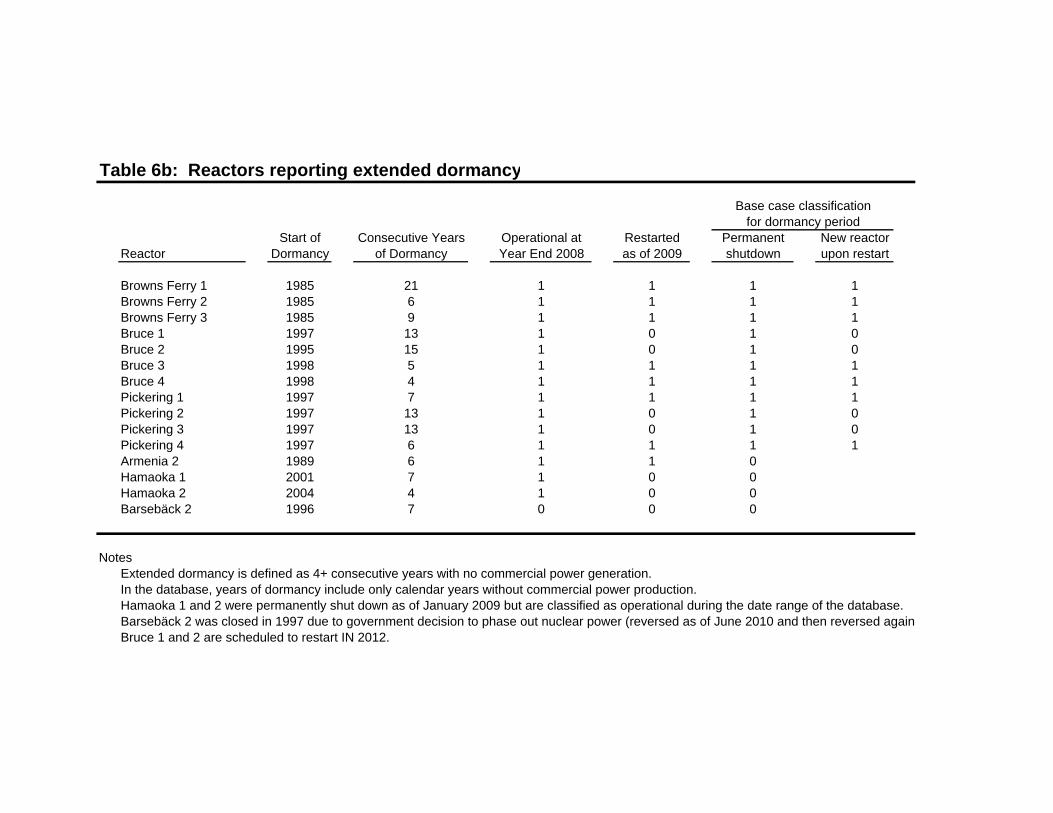
Table 6b: Reactors reporting extended dormancy
Base case classificationfor dormancy period
Start of Consecutive Years Operational at Restarted Permanent New reactorReactor Dormancy of Dormancy Year End 2008 as of 2009 shutdown upon restart
Browns Ferry 1 1985 21 1 1 1 1Browns Ferry 2 1985 6 1 1 1 1Browns Ferry 3 1985 9 1 1 1 1Bruce 1 1997 13 1 0 1 0Bruce 2 1995 15 1 0 1 0Bruce 3 1998 5 1 1 1 1Bruce 4 1998 4 1 1 1 1Pickering 1 1997 7 1 1 1 1Pickering 2 1997 13 1 0 1 0Pickering 3 1997 13 1 0 1 0Pickering 4 1997 6 1 1 1 1Armenia 2 1989 6 1 1 0Hamaoka 1 2001 7 1 0 0Hamaoka 2 2004 4 1 0 0Barsebäck 2 1996 7 0 0 0
NotesExtended dormancy is defined as 4+ consecutive years with no commercial power generation.In the database, years of dormancy include only calendar years without commercial power production.Hamaoka 1 and 2 were permanently shut down as of January 2009 but are classified as operational during the date range of the database.Barsebäck 2 was closed in 1997 due to government decision to phase out nuclear power (reversed as of June 2010 and then reversed again Bruce 1 and 2 are scheduled to restart IN 2012.
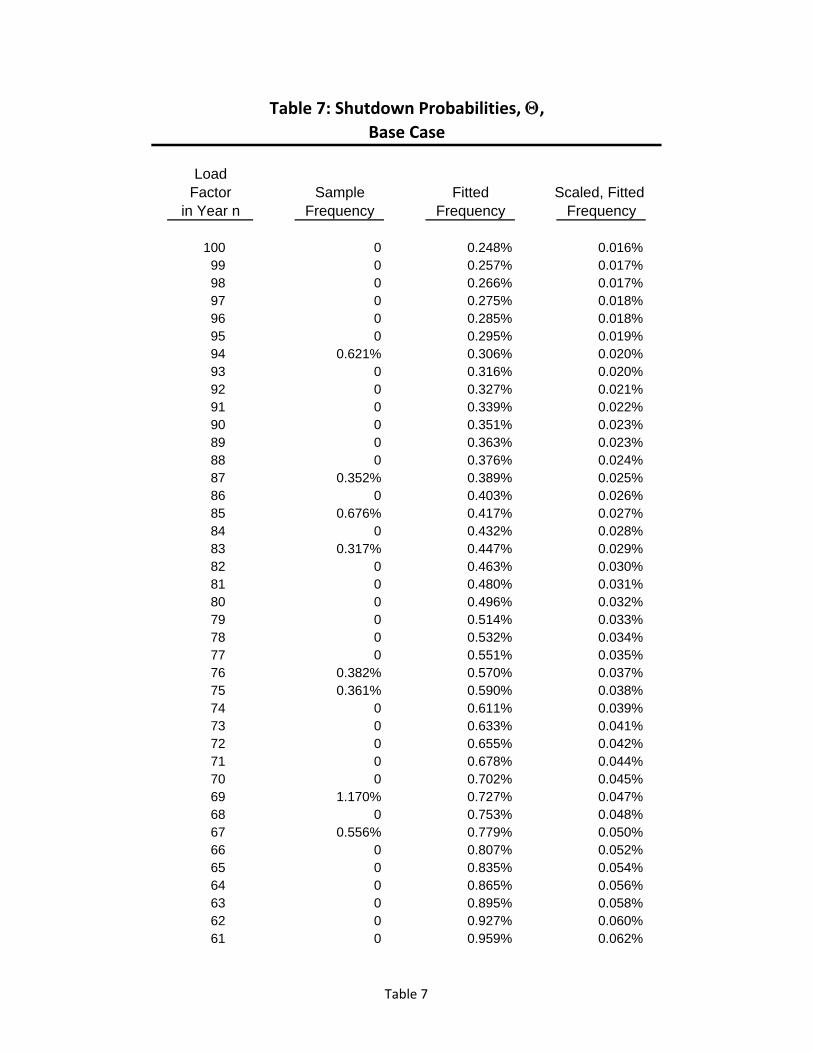
Table 7: Shutdown Probabilities, ,Base Case
LoadFactor Sample Fitted Scaled, Fitted
in Year n Frequency Frequency Frequency
100 0 0.248% 0.016%99 0 0.257% 0.017%98 0 0.266% 0.017%97 0 0.275% 0.018%96 0 0.285% 0.018%95 0 0.295% 0.019%94 0.621% 0.306% 0.020%93 0 0.316% 0.020%92 0 0.327% 0.021%91 0 0.339% 0.022%90 0 0.351% 0.023%89 0 0.363% 0.023%88 0 0.376% 0.024%87 0.352% 0.389% 0.025%86 0 0.403% 0.026%85 0.676% 0.417% 0.027%84 0 0.432% 0.028%83 0.317% 0.447% 0.029%82 0 0.463% 0.030%81 0 0.480% 0.031%80 0 0.496% 0.032%79 0 0.514% 0.033%78 0 0.532% 0.034%77 0 0.551% 0.035%76 0.382% 0.570% 0.037%75 0.361% 0.590% 0.038%74 0 0.611% 0.039%73 0 0.633% 0.041%72 0 0.655% 0.042%71 0 0.678% 0.044%70 0 0.702% 0.045%69 1.170% 0.727% 0.047%68 0 0.753% 0.048%67 0.556% 0.779% 0.050%66 0 0.807% 0.052%65 0 0.835% 0.054%64 0 0.865% 0.056%63 0 0.895% 0.058%62 0 0.927% 0.060%61 0 0.959% 0.062%
Table 7
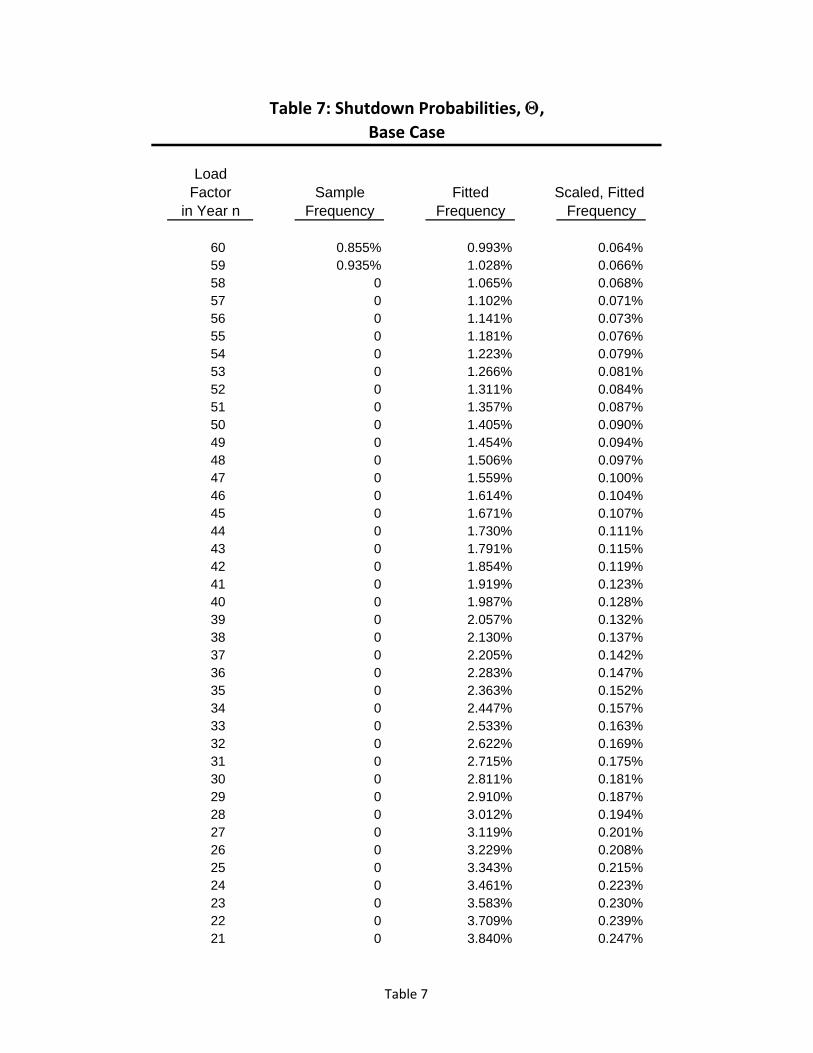
Table 7: Shutdown Probabilities, ,Base Case
LoadFactor Sample Fitted Scaled, Fitted
in Year n Frequency Frequency Frequency
60 0.855% 0.993% 0.064%59 0.935% 1.028% 0.066%58 0 1.065% 0.068%57 0 1.102% 0.071%56 0 1.141% 0.073%55 0 1.181% 0.076%54 0 1.223% 0.079%53 0 1.266% 0.081%52 0 1.311% 0.084%51 0 1.357% 0.087%50 0 1.405% 0.090%49 0 1.454% 0.094%48 0 1.506% 0.097%47 0 1.559% 0.100%46 0 1.614% 0.104%45 0 1.671% 0.107%44 0 1.730% 0.111%43 0 1.791% 0.115%42 0 1.854% 0.119%41 0 1.919% 0.123%40 0 1.987% 0.128%39 0 2.057% 0.132%38 0 2.130% 0.137%37 0 2.205% 0.142%36 0 2.283% 0.147%35 0 2.363% 0.152%34 0 2.447% 0.157%33 0 2.533% 0.163%32 0 2.622% 0.169%31 0 2.715% 0.175%30 0 2.811% 0.181%29 0 2.910% 0.187%28 0 3.012% 0.194%27 0 3.119% 0.201%26 0 3.229% 0.208%25 0 3.343% 0.215%24 0 3.461% 0.223%23 0 3.583% 0.230%22 0 3.709% 0.239%21 0 3.840% 0.247%
Table 7
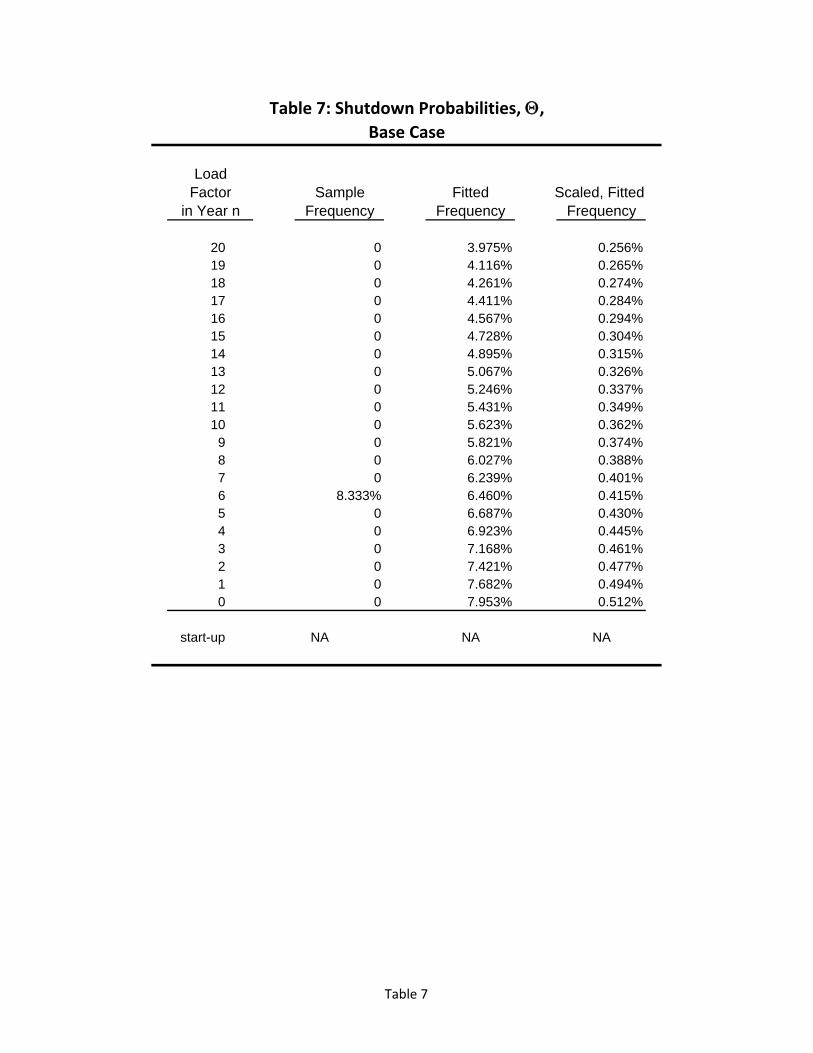
Table 7: Shutdown Probabilities, ,Base Case
LoadFactor Sample Fitted Scaled, Fitted
in Year n Frequency Frequency Frequency
20 0 3.975% 0.256%19 0 4.116% 0.265%18 0 4.261% 0.274%17 0 4.411% 0.284%16 0 4.567% 0.294%15 0 4.728% 0.304%14 0 4.895% 0.315%13 0 5.067% 0.326%12 0 5.246% 0.337%11 0 5.431% 0.349%10 0 5.623% 0.362%9 0 5.821% 0.374%8 0 6.027% 0.388%7 0 6.239% 0.401%6 8.333% 6.460% 0.415%5 0 6.687% 0.430%4 0 6.923% 0.445%3 0 7.168% 0.461%2 0 7.421% 0.477%1 0 7.682% 0.494%0 0 7.953% 0.512%
start-up NA NA NA
Table 7

Table 8: Distribution Moments for the Load Factor, Unconditional and Conditional on Continuing Operation, From P,
Base Case
Year Conditional onof Unconditional Operation
Operation Mean Var Mean Var
1 54% 9.6% 54% 9.6%2 64% 7.0% 64% 7.0%3 70% 5.5% 70% 5.5%4 73% 4.7% 73% 4.8%5 74% 4.4% 75% 4.4%6 75% 4.2% 76% 4.2%7 76% 4.1% 76% 4.1%8 76% 4.0% 76% 4.0%9 76% 4.0% 77% 4.0%
10 76% 3.9% 77% 4.0%11 76% 3.9% 77% 4.0%12 76% 3.9% 77% 4.0%13 76% 3.9% 77% 3.9%14 76% 3.9% 77% 3.9%15 76% 3.9% 77% 3.9%16 76% 3.9% 77% 3.9%17 76% 3.9% 77% 3.9%18 76% 3.9% 77% 3.9%19 76% 3.9% 77% 3.9%20 76% 3.9% 77% 3.9%21 76% 3.9% 77% 3.9%22 76% 3.9% 77% 3.9%23 76% 3.9% 77% 3.9%24 76% 3.9% 77% 3.9%25 76% 3.9% 77% 3.9%26 76% 3.9% 77% 3.9%27 76% 3.9% 77% 3.9%28 76% 3.9% 77% 3.9%29 76% 3.9% 77% 3.9%30 76% 3.9% 77% 3.9%31 76% 3.9% 77% 3.9%32 76% 3.9% 77% 3.9%33 76% 3.9% 77% 3.9%34 76% 3.9% 77% 3.9%35 76% 3.9% 77% 3.9%36 76% 3.9% 77% 3.9%37 76% 3.9% 77% 3.9%38 76% 3.9% 77% 3.9%39 76% 3.9% 77% 3.9%
Table 8
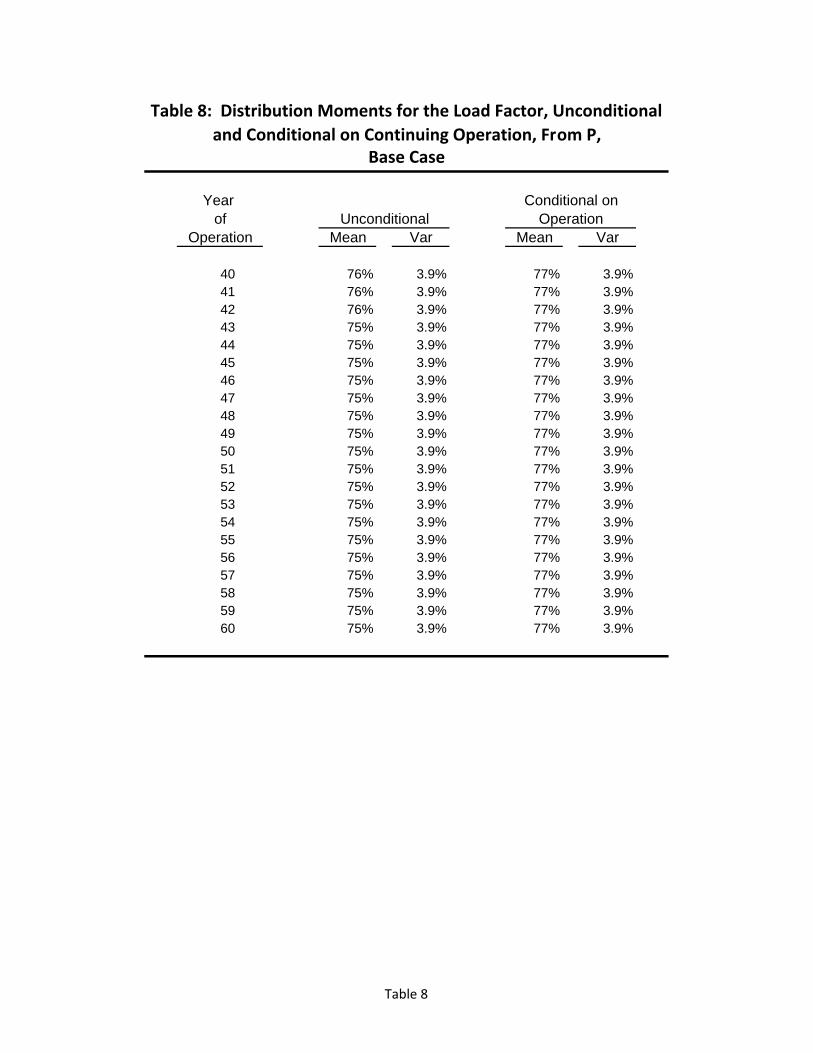
Table 8: Distribution Moments for the Load Factor, Unconditional and Conditional on Continuing Operation, From P,
Base Case
Year Conditional onof Unconditional Operation
Operation Mean Var Mean Var
40 76% 3.9% 77% 3.9%41 76% 3.9% 77% 3.9%42 76% 3.9% 77% 3.9%43 75% 3.9% 77% 3.9%44 75% 3.9% 77% 3.9%45 75% 3.9% 77% 3.9%46 75% 3.9% 77% 3.9%47 75% 3.9% 77% 3.9%48 75% 3.9% 77% 3.9%49 75% 3.9% 77% 3.9%50 75% 3.9% 77% 3.9%51 75% 3.9% 77% 3.9%52 75% 3.9% 77% 3.9%53 75% 3.9% 77% 3.9%54 75% 3.9% 77% 3.9%55 75% 3.9% 77% 3.9%56 75% 3.9% 77% 3.9%57 75% 3.9% 77% 3.9%58 75% 3.9% 77% 3.9%59 75% 3.9% 77% 3.9%60 75% 3.9% 77% 3.9%
Table 8

Table A1: Sample Capacity Factor Data from PRIS
Country & ReactorFrance South Korea Japan United States
Data Label Units Cattenom‐1 Wolsong‐4 Genkai‐4 Sequoyah‐1[A] [B] [C] [D] [E] [F]
[1] RUP MW 1,300 685 1,127 1,150[2] T h 8,766 8,766 8,766 8,766[3] t h 8,432 8,163 8,766 7,674[4] REG MWh 11,395,800 6,004,710 9,879,282 10,080,900[5] EG MWh 9,698,200 5,770,400 10,025,300 8,758,300[6] PUF % 0.2 6.6 0.0 12.5[7] UUF % 5.9 0.6 0.0 0.0[8] XUF % 1.5 0.0 0.0 0.0[9] OF % 96.2 93.1 100.0 87.5[10] LF % 85.1 96.1 101.5 86.9[11] EAF % 92.4 92.8 100.0 87.5[12] UCF % 93.9 92.8 100.0 87.5
Notes:
All figures as reported for 2007 annual. The following relationships hold:
[9]= 100 x [3]/[2].
[10]= 100 x [5]/[4].
[11]= 100 ‐ [6] ‐ [7] ‐ [8].
[12]= 100 ‐ [6] ‐ [7].
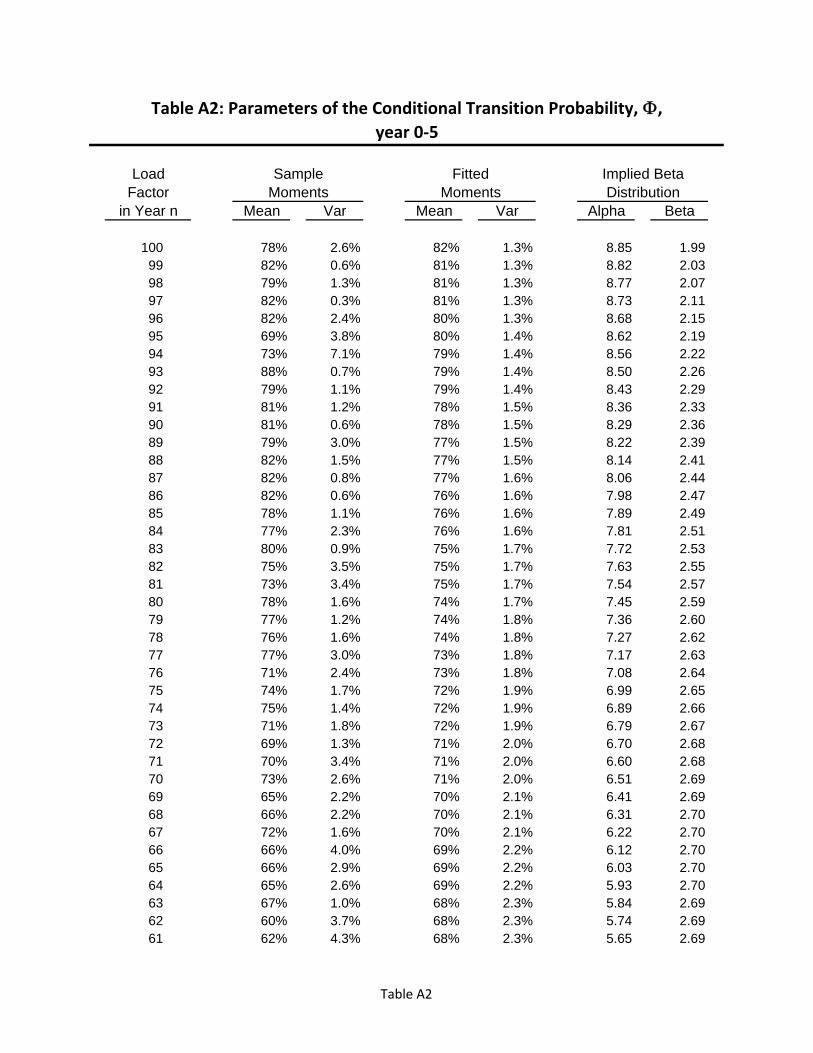
Table A2: Parameters of the Conditional Transition Probability, ,year 0‐5
Load Sample Fitted Implied BetaFactor Moments Moments Distribution
in Year n Mean Var Mean Var Alpha Beta
100 78% 2.6% 82% 1.3% 8.85 1.9999 82% 0.6% 81% 1.3% 8.82 2.0398 79% 1.3% 81% 1.3% 8.77 2.0797 82% 0.3% 81% 1.3% 8.73 2.1196 82% 2.4% 80% 1.3% 8.68 2.1595 69% 3.8% 80% 1.4% 8.62 2.1994 73% 7.1% 79% 1.4% 8.56 2.2293 88% 0.7% 79% 1.4% 8.50 2.2692 79% 1.1% 79% 1.4% 8.43 2.2991 81% 1.2% 78% 1.5% 8.36 2.3390 81% 0.6% 78% 1.5% 8.29 2.3689 79% 3.0% 77% 1.5% 8.22 2.3988 82% 1.5% 77% 1.5% 8.14 2.4187 82% 0.8% 77% 1.6% 8.06 2.4486 82% 0.6% 76% 1.6% 7.98 2.4785 78% 1.1% 76% 1.6% 7.89 2.4984 77% 2.3% 76% 1.6% 7.81 2.5183 80% 0.9% 75% 1.7% 7.72 2.5382 75% 3.5% 75% 1.7% 7.63 2.5581 73% 3.4% 75% 1.7% 7.54 2.5780 78% 1.6% 74% 1.7% 7.45 2.5979 77% 1.2% 74% 1.8% 7.36 2.6078 76% 1.6% 74% 1.8% 7.27 2.6277 77% 3.0% 73% 1.8% 7.17 2.6376 71% 2.4% 73% 1.8% 7.08 2.6475 74% 1.7% 72% 1.9% 6.99 2.6574 75% 1.4% 72% 1.9% 6.89 2.6673 71% 1.8% 72% 1.9% 6.79 2.6772 69% 1.3% 71% 2.0% 6.70 2.6871 70% 3.4% 71% 2.0% 6.60 2.6870 73% 2.6% 71% 2.0% 6.51 2.6969 65% 2.2% 70% 2.1% 6.41 2.6968 66% 2.2% 70% 2.1% 6.31 2.7067 72% 1.6% 70% 2.1% 6.22 2.7066 66% 4.0% 69% 2.2% 6.12 2.7065 66% 2.9% 69% 2.2% 6.03 2.7064 65% 2.6% 69% 2.2% 5.93 2.7063 67% 1.0% 68% 2.3% 5.84 2.6962 60% 3.7% 68% 2.3% 5.74 2.6961 62% 4.3% 68% 2.3% 5.65 2.69
Table A2
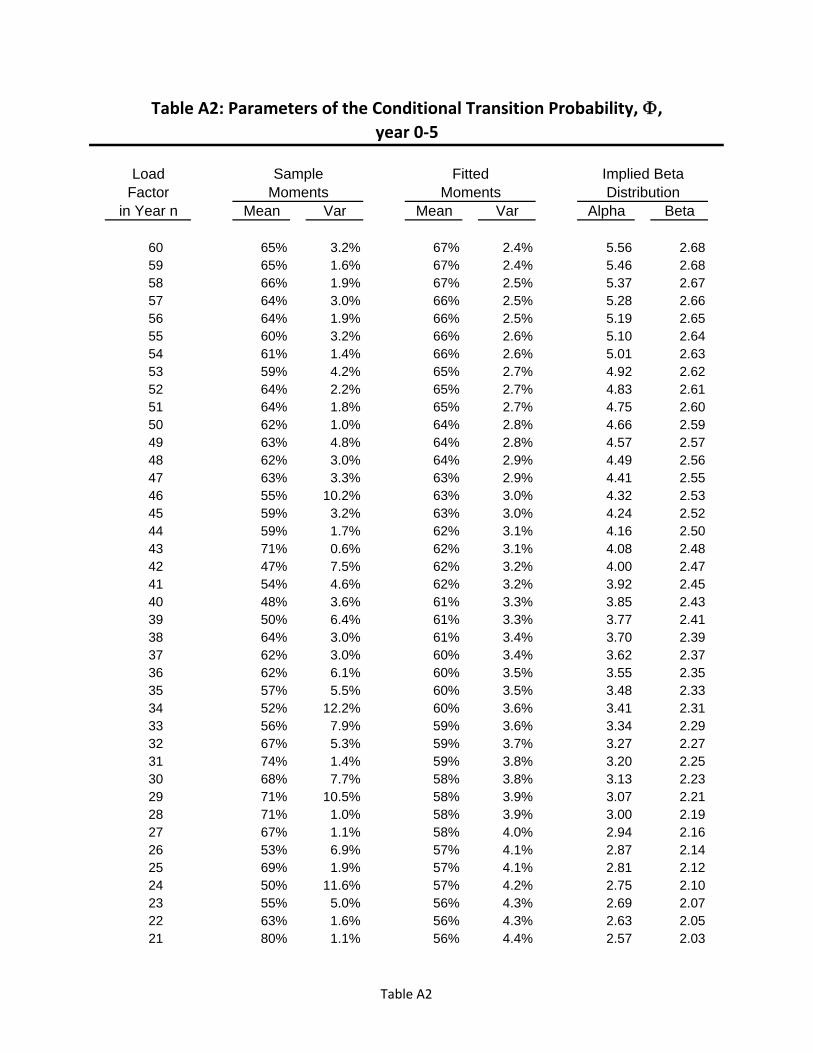
Table A2: Parameters of the Conditional Transition Probability, ,year 0‐5
Load Sample Fitted Implied BetaFactor Moments Moments Distribution
in Year n Mean Var Mean Var Alpha Beta
60 65% 3.2% 67% 2.4% 5.56 2.6859 65% 1.6% 67% 2.4% 5.46 2.6858 66% 1.9% 67% 2.5% 5.37 2.6757 64% 3.0% 66% 2.5% 5.28 2.6656 64% 1.9% 66% 2.5% 5.19 2.6555 60% 3.2% 66% 2.6% 5.10 2.6454 61% 1.4% 66% 2.6% 5.01 2.6353 59% 4.2% 65% 2.7% 4.92 2.6252 64% 2.2% 65% 2.7% 4.83 2.6151 64% 1.8% 65% 2.7% 4.75 2.6050 62% 1.0% 64% 2.8% 4.66 2.5949 63% 4.8% 64% 2.8% 4.57 2.5748 62% 3.0% 64% 2.9% 4.49 2.5647 63% 3.3% 63% 2.9% 4.41 2.5546 55% 10.2% 63% 3.0% 4.32 2.5345 59% 3.2% 63% 3.0% 4.24 2.5244 59% 1.7% 62% 3.1% 4.16 2.5043 71% 0.6% 62% 3.1% 4.08 2.4842 47% 7.5% 62% 3.2% 4.00 2.4741 54% 4.6% 62% 3.2% 3.92 2.4540 48% 3.6% 61% 3.3% 3.85 2.4339 50% 6.4% 61% 3.3% 3.77 2.4138 64% 3.0% 61% 3.4% 3.70 2.3937 62% 3.0% 60% 3.4% 3.62 2.3736 62% 6.1% 60% 3.5% 3.55 2.3535 57% 5.5% 60% 3.5% 3.48 2.3334 52% 12.2% 60% 3.6% 3.41 2.3133 56% 7.9% 59% 3.6% 3.34 2.2932 67% 5.3% 59% 3.7% 3.27 2.2731 74% 1.4% 59% 3.8% 3.20 2.2530 68% 7.7% 58% 3.8% 3.13 2.2329 71% 10.5% 58% 3.9% 3.07 2.2128 71% 1.0% 58% 3.9% 3.00 2.1927 67% 1.1% 58% 4.0% 2.94 2.1626 53% 6.9% 57% 4.1% 2.87 2.1425 69% 1.9% 57% 4.1% 2.81 2.1224 50% 11.6% 57% 4.2% 2.75 2.1023 55% 5.0% 56% 4.3% 2.69 2.0722 63% 1.6% 56% 4.3% 2.63 2.0521 80% 1.1% 56% 4.4% 2.57 2.03
Table A2
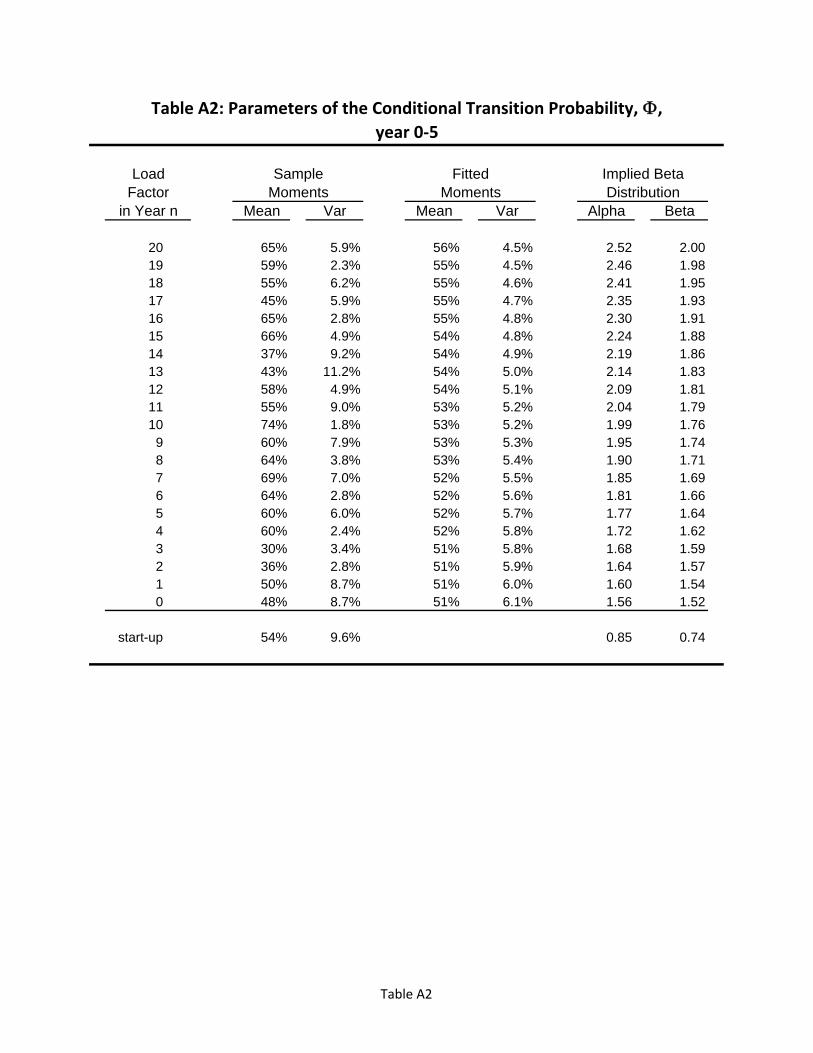
Table A2: Parameters of the Conditional Transition Probability, ,year 0‐5
Load Sample Fitted Implied BetaFactor Moments Moments Distribution
in Year n Mean Var Mean Var Alpha Beta
20 65% 5.9% 56% 4.5% 2.52 2.0019 59% 2.3% 55% 4.5% 2.46 1.9818 55% 6.2% 55% 4.6% 2.41 1.9517 45% 5.9% 55% 4.7% 2.35 1.9316 65% 2.8% 55% 4.8% 2.30 1.9115 66% 4.9% 54% 4.8% 2.24 1.8814 37% 9.2% 54% 4.9% 2.19 1.8613 43% 11.2% 54% 5.0% 2.14 1.8312 58% 4.9% 54% 5.1% 2.09 1.8111 55% 9.0% 53% 5.2% 2.04 1.7910 74% 1.8% 53% 5.2% 1.99 1.769 60% 7.9% 53% 5.3% 1.95 1.748 64% 3.8% 53% 5.4% 1.90 1.717 69% 7.0% 52% 5.5% 1.85 1.696 64% 2.8% 52% 5.6% 1.81 1.665 60% 6.0% 52% 5.7% 1.77 1.644 60% 2.4% 52% 5.8% 1.72 1.623 30% 3.4% 51% 5.8% 1.68 1.592 36% 2.8% 51% 5.9% 1.64 1.571 50% 8.7% 51% 6.0% 1.60 1.540 48% 8.7% 51% 6.1% 1.56 1.52
start-up 54% 9.6% 0.85 0.74
Table A2
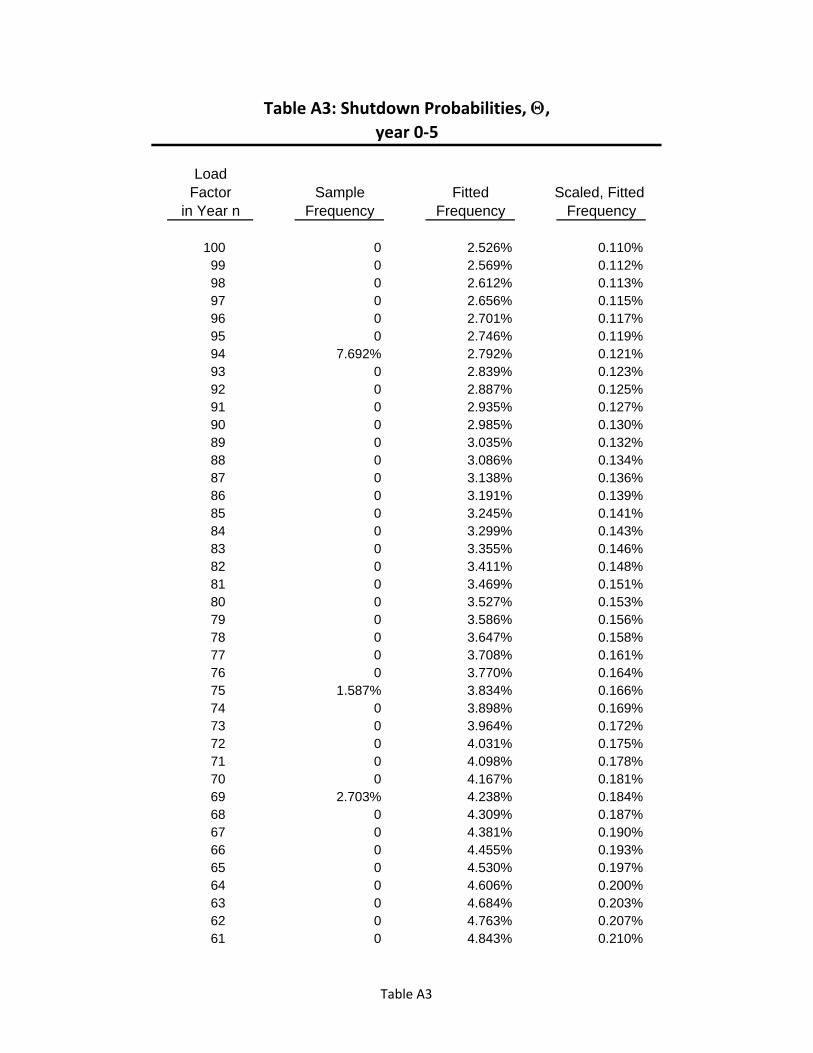
Table A3: Shutdown Probabilities, ,year 0‐5
LoadFactor Sample Fitted Scaled, Fitted
in Year n Frequency Frequency Frequency
100 0 2.526% 0.110%99 0 2.569% 0.112%98 0 2.612% 0.113%97 0 2.656% 0.115%96 0 2.701% 0.117%95 0 2.746% 0.119%94 7.692% 2.792% 0.121%93 0 2.839% 0.123%92 0 2.887% 0.125%91 0 2.935% 0.127%90 0 2.985% 0.130%89 0 3.035% 0.132%88 0 3.086% 0.134%87 0 3.138% 0.136%86 0 3.191% 0.139%85 0 3.245% 0.141%84 0 3.299% 0.143%83 0 3.355% 0.146%82 0 3.411% 0.148%81 0 3.469% 0.151%80 0 3.527% 0.153%79 0 3.586% 0.156%78 0 3.647% 0.158%77 0 3.708% 0.161%76 0 3.770% 0.164%75 1.587% 3.834% 0.166%74 0 3.898% 0.169%73 0 3.964% 0.172%72 0 4.031% 0.175%71 0 4.098% 0.178%70 0 4.167% 0.181%69 2.703% 4.238% 0.184%68 0 4.309% 0.187%67 0 4.381% 0.190%66 0 4.455% 0.193%65 0 4.530% 0.197%64 0 4.606% 0.200%63 0 4.684% 0.203%62 0 4.763% 0.207%61 0 4.843% 0.210%
Table A3
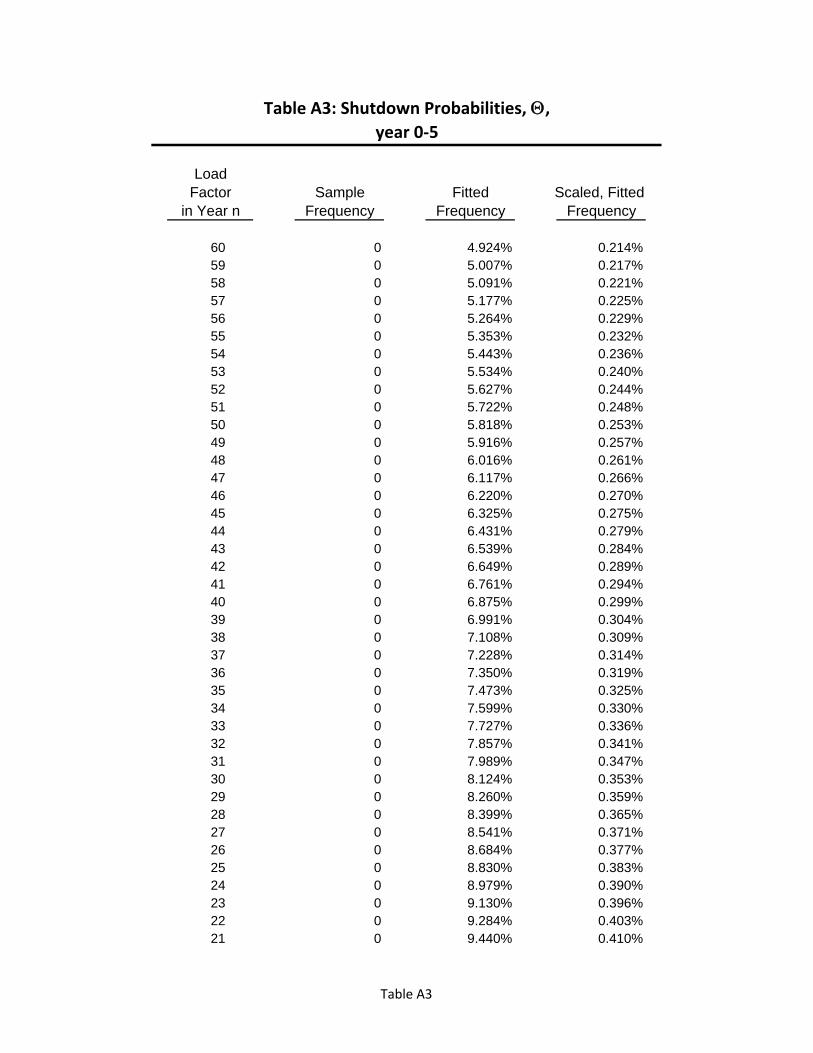
Table A3: Shutdown Probabilities, ,year 0‐5
LoadFactor Sample Fitted Scaled, Fitted
in Year n Frequency Frequency Frequency
60 0 4.924% 0.214%59 0 5.007% 0.217%58 0 5.091% 0.221%57 0 5.177% 0.225%56 0 5.264% 0.229%55 0 5.353% 0.232%54 0 5.443% 0.236%53 0 5.534% 0.240%52 0 5.627% 0.244%51 0 5.722% 0.248%50 0 5.818% 0.253%49 0 5.916% 0.257%48 0 6.016% 0.261%47 0 6.117% 0.266%46 0 6.220% 0.270%45 0 6.325% 0.275%44 0 6.431% 0.279%43 0 6.539% 0.284%42 0 6.649% 0.289%41 0 6.761% 0.294%40 0 6.875% 0.299%39 0 6.991% 0.304%38 0 7.108% 0.309%37 0 7.228% 0.314%36 0 7.350% 0.319%35 0 7.473% 0.325%34 0 7.599% 0.330%33 0 7.727% 0.336%32 0 7.857% 0.341%31 0 7.989% 0.347%30 0 8.124% 0.353%29 0 8.260% 0.359%28 0 8.399% 0.365%27 0 8.541% 0.371%26 0 8.684% 0.377%25 0 8.830% 0.383%24 0 8.979% 0.390%23 0 9.130% 0.396%22 0 9.284% 0.403%21 0 9.440% 0.410%
Table A3

Table A3: Shutdown Probabilities, ,year 0‐5
LoadFactor Sample Fitted Scaled, Fitted
in Year n Frequency Frequency Frequency
20 0 9.599% 0.417%19 0 9.760% 0.424%18 0 9.925% 0.431%17 0 10.092% 0.438%16 0 10.261% 0.446%15 0 10.434% 0.453%14 0 10.610% 0.461%13 0 10.788% 0.468%12 0 10.970% 0.476%11 0 11.154% 0.484%10 0 11.342% 0.493%9 0 11.533% 0.501%8 0 11.727% 0.509%7 0 11.924% 0.518%6 16.667% 12.125% 0.527%5 0 12.329% 0.535%4 0 12.536% 0.544%3 0 12.747% 0.554%2 0 12.962% 0.563%1 0 13.180% 0.572%0 0 13.402% 0.582%
start-up NA NA NA
Table A3
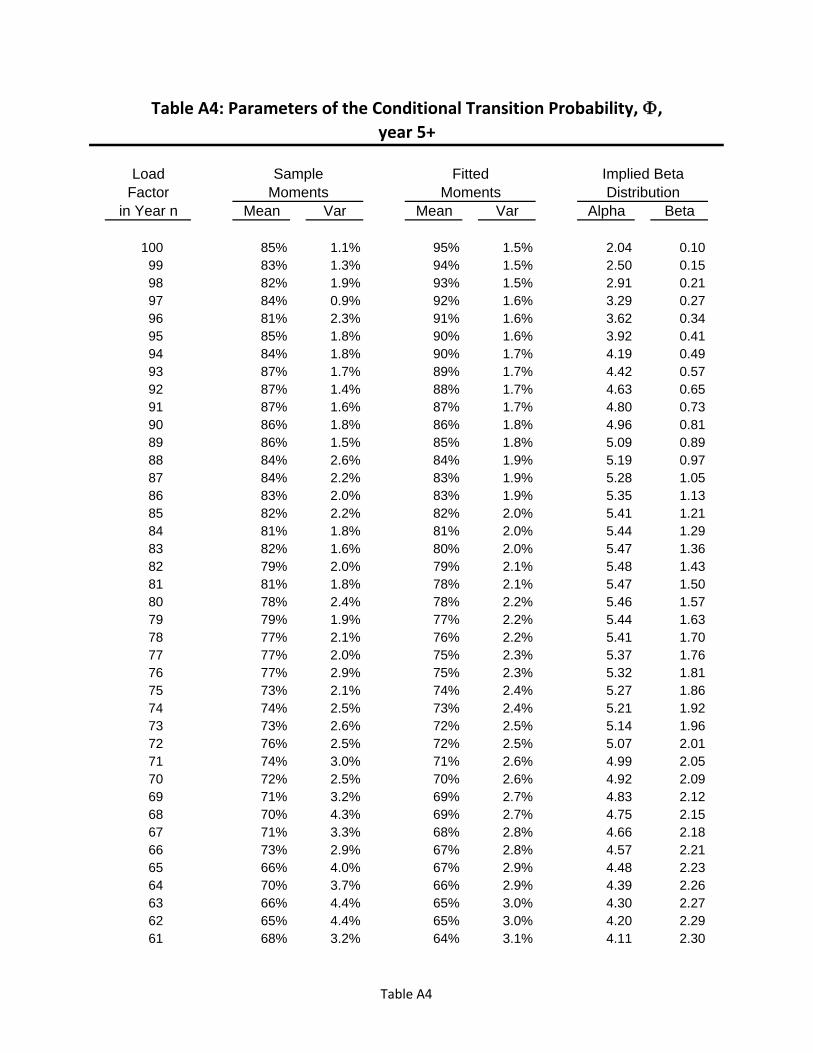
Table A4: Parameters of the Conditional Transition Probability, ,year 5+
Load Sample Fitted Implied BetaFactor Moments Moments Distribution
in Year n Mean Var Mean Var Alpha Beta
100 85% 1.1% 95% 1.5% 2.04 0.1099 83% 1.3% 94% 1.5% 2.50 0.1598 82% 1.9% 93% 1.5% 2.91 0.2197 84% 0.9% 92% 1.6% 3.29 0.2796 81% 2.3% 91% 1.6% 3.62 0.3495 85% 1.8% 90% 1.6% 3.92 0.4194 84% 1.8% 90% 1.7% 4.19 0.4993 87% 1.7% 89% 1.7% 4.42 0.5792 87% 1.4% 88% 1.7% 4.63 0.6591 87% 1.6% 87% 1.7% 4.80 0.7390 86% 1.8% 86% 1.8% 4.96 0.8189 86% 1.5% 85% 1.8% 5.09 0.8988 84% 2.6% 84% 1.9% 5.19 0.9787 84% 2.2% 83% 1.9% 5.28 1.0586 83% 2.0% 83% 1.9% 5.35 1.1385 82% 2.2% 82% 2.0% 5.41 1.2184 81% 1.8% 81% 2.0% 5.44 1.2983 82% 1.6% 80% 2.0% 5.47 1.3682 79% 2.0% 79% 2.1% 5.48 1.4381 81% 1.8% 78% 2.1% 5.47 1.5080 78% 2.4% 78% 2.2% 5.46 1.5779 79% 1.9% 77% 2.2% 5.44 1.6378 77% 2.1% 76% 2.2% 5.41 1.7077 77% 2.0% 75% 2.3% 5.37 1.7676 77% 2.9% 75% 2.3% 5.32 1.8175 73% 2.1% 74% 2.4% 5.27 1.8674 74% 2.5% 73% 2.4% 5.21 1.9273 73% 2.6% 72% 2.5% 5.14 1.9672 76% 2.5% 72% 2.5% 5.07 2.0171 74% 3.0% 71% 2.6% 4.99 2.0570 72% 2.5% 70% 2.6% 4.92 2.0969 71% 3.2% 69% 2.7% 4.83 2.1268 70% 4.3% 69% 2.7% 4.75 2.1567 71% 3.3% 68% 2.8% 4.66 2.1866 73% 2.9% 67% 2.8% 4.57 2.2165 66% 4.0% 67% 2.9% 4.48 2.2364 70% 3.7% 66% 2.9% 4.39 2.2663 66% 4.4% 65% 3.0% 4.30 2.2762 65% 4.4% 65% 3.0% 4.20 2.2961 68% 3.2% 64% 3.1% 4.11 2.30
Table A4
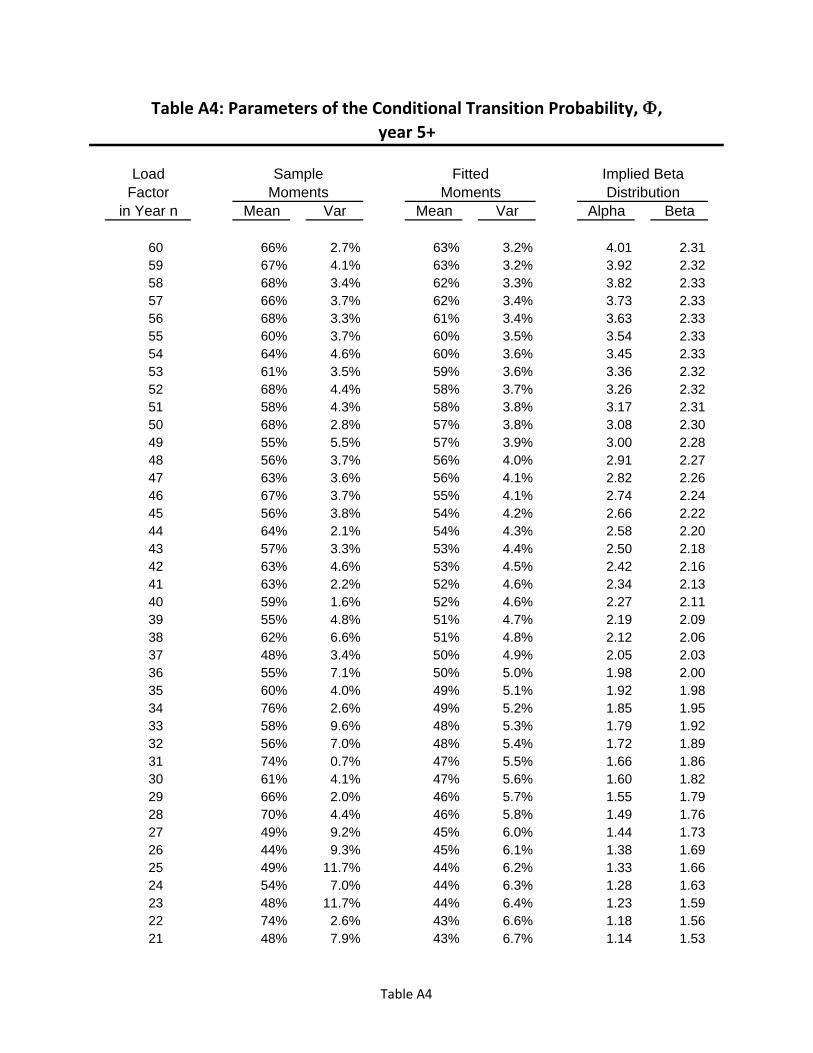
Table A4: Parameters of the Conditional Transition Probability, ,year 5+
Load Sample Fitted Implied BetaFactor Moments Moments Distribution
in Year n Mean Var Mean Var Alpha Beta
60 66% 2.7% 63% 3.2% 4.01 2.3159 67% 4.1% 63% 3.2% 3.92 2.3258 68% 3.4% 62% 3.3% 3.82 2.3357 66% 3.7% 62% 3.4% 3.73 2.3356 68% 3.3% 61% 3.4% 3.63 2.3355 60% 3.7% 60% 3.5% 3.54 2.3354 64% 4.6% 60% 3.6% 3.45 2.3353 61% 3.5% 59% 3.6% 3.36 2.3252 68% 4.4% 58% 3.7% 3.26 2.3251 58% 4.3% 58% 3.8% 3.17 2.3150 68% 2.8% 57% 3.8% 3.08 2.3049 55% 5.5% 57% 3.9% 3.00 2.2848 56% 3.7% 56% 4.0% 2.91 2.2747 63% 3.6% 56% 4.1% 2.82 2.2646 67% 3.7% 55% 4.1% 2.74 2.2445 56% 3.8% 54% 4.2% 2.66 2.2244 64% 2.1% 54% 4.3% 2.58 2.2043 57% 3.3% 53% 4.4% 2.50 2.1842 63% 4.6% 53% 4.5% 2.42 2.1641 63% 2.2% 52% 4.6% 2.34 2.1340 59% 1.6% 52% 4.6% 2.27 2.1139 55% 4.8% 51% 4.7% 2.19 2.0938 62% 6.6% 51% 4.8% 2.12 2.0637 48% 3.4% 50% 4.9% 2.05 2.0336 55% 7.1% 50% 5.0% 1.98 2.0035 60% 4.0% 49% 5.1% 1.92 1.9834 76% 2.6% 49% 5.2% 1.85 1.9533 58% 9.6% 48% 5.3% 1.79 1.9232 56% 7.0% 48% 5.4% 1.72 1.8931 74% 0.7% 47% 5.5% 1.66 1.8630 61% 4.1% 47% 5.6% 1.60 1.8229 66% 2.0% 46% 5.7% 1.55 1.7928 70% 4.4% 46% 5.8% 1.49 1.7627 49% 9.2% 45% 6.0% 1.44 1.7326 44% 9.3% 45% 6.1% 1.38 1.6925 49% 11.7% 44% 6.2% 1.33 1.6624 54% 7.0% 44% 6.3% 1.28 1.6323 48% 11.7% 44% 6.4% 1.23 1.5922 74% 2.6% 43% 6.6% 1.18 1.5621 48% 7.9% 43% 6.7% 1.14 1.53
Table A4
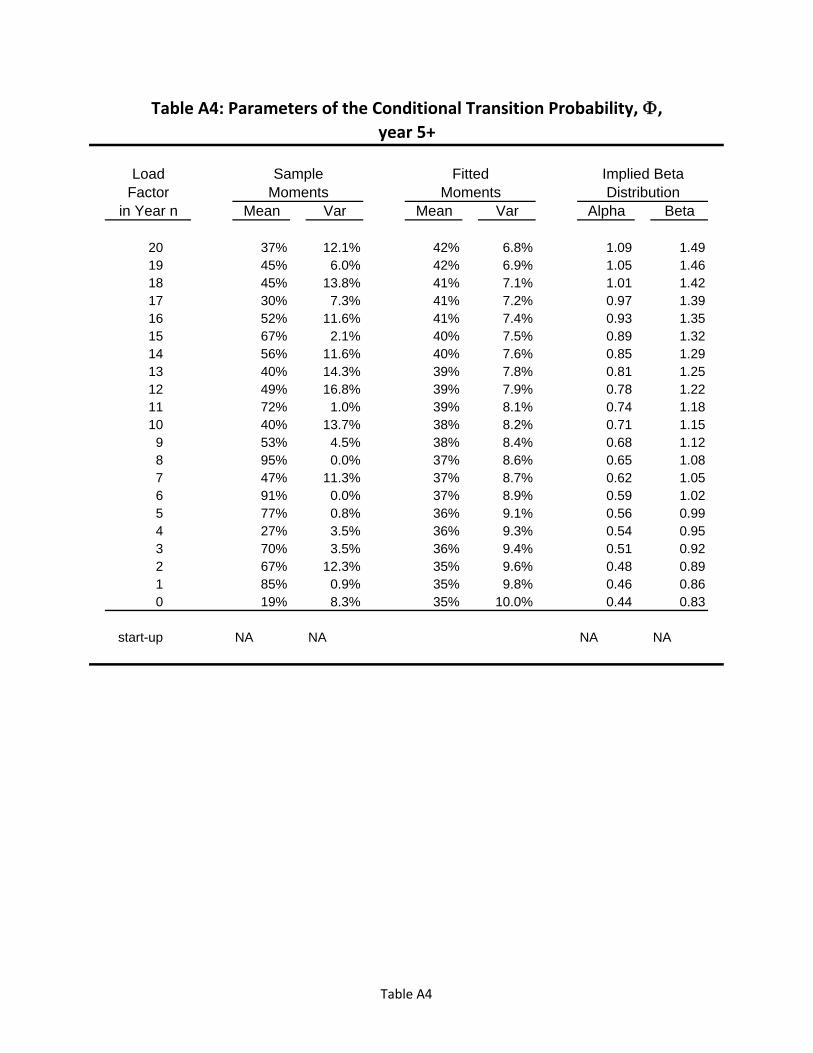
Table A4: Parameters of the Conditional Transition Probability, ,year 5+
Load Sample Fitted Implied BetaFactor Moments Moments Distribution
in Year n Mean Var Mean Var Alpha Beta
20 37% 12.1% 42% 6.8% 1.09 1.4919 45% 6.0% 42% 6.9% 1.05 1.4618 45% 13.8% 41% 7.1% 1.01 1.4217 30% 7.3% 41% 7.2% 0.97 1.3916 52% 11.6% 41% 7.4% 0.93 1.3515 67% 2.1% 40% 7.5% 0.89 1.3214 56% 11.6% 40% 7.6% 0.85 1.2913 40% 14.3% 39% 7.8% 0.81 1.2512 49% 16.8% 39% 7.9% 0.78 1.2211 72% 1.0% 39% 8.1% 0.74 1.1810 40% 13.7% 38% 8.2% 0.71 1.159 53% 4.5% 38% 8.4% 0.68 1.128 95% 0.0% 37% 8.6% 0.65 1.087 47% 11.3% 37% 8.7% 0.62 1.056 91% 0.0% 37% 8.9% 0.59 1.025 77% 0.8% 36% 9.1% 0.56 0.994 27% 3.5% 36% 9.3% 0.54 0.953 70% 3.5% 36% 9.4% 0.51 0.922 67% 12.3% 35% 9.6% 0.48 0.891 85% 0.9% 35% 9.8% 0.46 0.860 19% 8.3% 35% 10.0% 0.44 0.83
start-up NA NA NA NA
Table A4
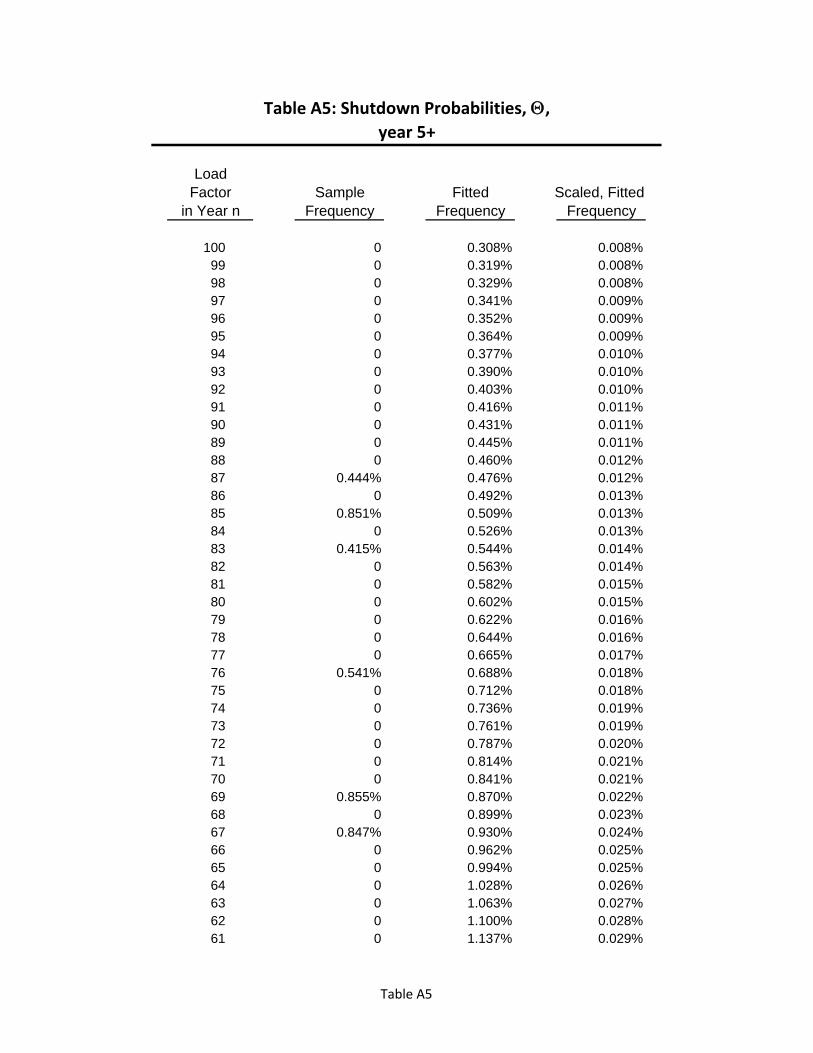
Table A5: Shutdown Probabilities, ,year 5+
LoadFactor Sample Fitted Scaled, Fitted
in Year n Frequency Frequency Frequency
100 0 0.308% 0.008%99 0 0.319% 0.008%98 0 0.329% 0.008%97 0 0.341% 0.009%96 0 0.352% 0.009%95 0 0.364% 0.009%94 0 0.377% 0.010%93 0 0.390% 0.010%92 0 0.403% 0.010%91 0 0.416% 0.011%90 0 0.431% 0.011%89 0 0.445% 0.011%88 0 0.460% 0.012%87 0.444% 0.476% 0.012%86 0 0.492% 0.013%85 0.851% 0.509% 0.013%84 0 0.526% 0.013%83 0.415% 0.544% 0.014%82 0 0.563% 0.014%81 0 0.582% 0.015%80 0 0.602% 0.015%79 0 0.622% 0.016%78 0 0.644% 0.016%77 0 0.665% 0.017%76 0.541% 0.688% 0.018%75 0 0.712% 0.018%74 0 0.736% 0.019%73 0 0.761% 0.019%72 0 0.787% 0.020%71 0 0.814% 0.021%70 0 0.841% 0.021%69 0.855% 0.870% 0.022%68 0 0.899% 0.023%67 0.847% 0.930% 0.024%66 0 0.962% 0.025%65 0 0.994% 0.025%64 0 1.028% 0.026%63 0 1.063% 0.027%62 0 1.100% 0.028%61 0 1.137% 0.029%
Table A5
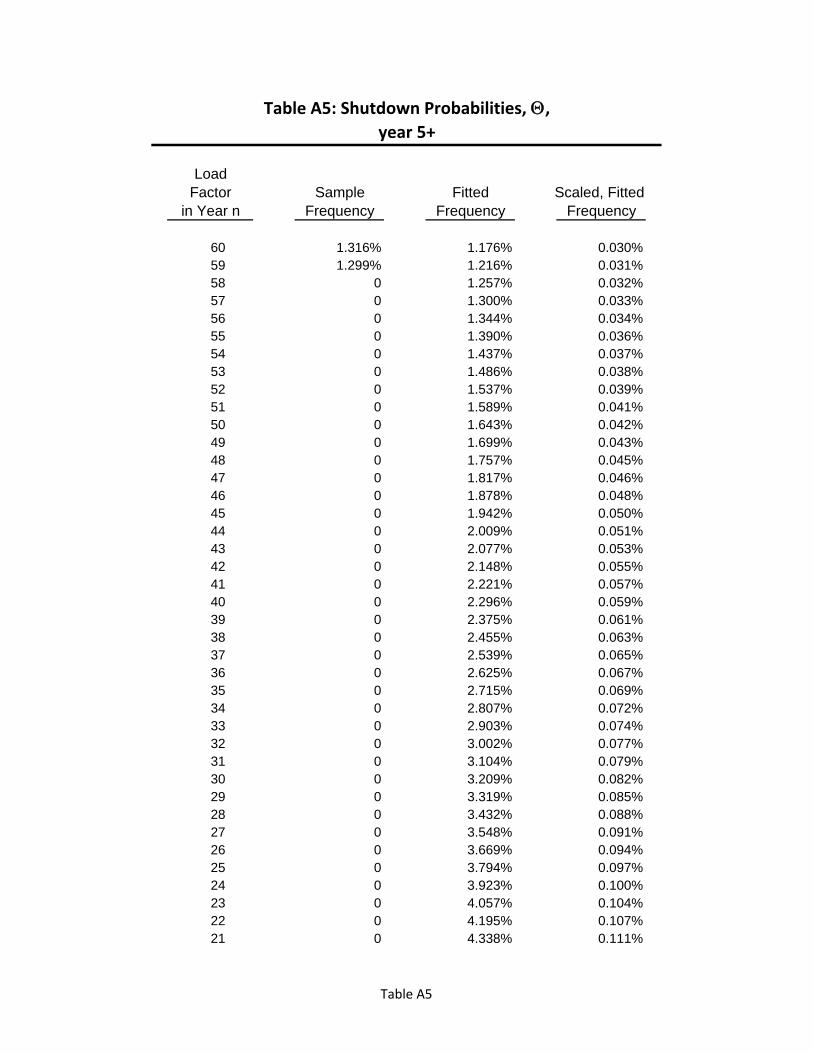
Table A5: Shutdown Probabilities, ,year 5+
LoadFactor Sample Fitted Scaled, Fitted
in Year n Frequency Frequency Frequency
60 1.316% 1.176% 0.030%59 1.299% 1.216% 0.031%58 0 1.257% 0.032%57 0 1.300% 0.033%56 0 1.344% 0.034%55 0 1.390% 0.036%54 0 1.437% 0.037%53 0 1.486% 0.038%52 0 1.537% 0.039%51 0 1.589% 0.041%50 0 1.643% 0.042%49 0 1.699% 0.043%48 0 1.757% 0.045%47 0 1.817% 0.046%46 0 1.878% 0.048%45 0 1.942% 0.050%44 0 2.009% 0.051%43 0 2.077% 0.053%42 0 2.148% 0.055%41 0 2.221% 0.057%40 0 2.296% 0.059%39 0 2.375% 0.061%38 0 2.455% 0.063%37 0 2.539% 0.065%36 0 2.625% 0.067%35 0 2.715% 0.069%34 0 2.807% 0.072%33 0 2.903% 0.074%32 0 3.002% 0.077%31 0 3.104% 0.079%30 0 3.209% 0.082%29 0 3.319% 0.085%28 0 3.432% 0.088%27 0 3.548% 0.091%26 0 3.669% 0.094%25 0 3.794% 0.097%24 0 3.923% 0.100%23 0 4.057% 0.104%22 0 4.195% 0.107%21 0 4.338% 0.111%
Table A5
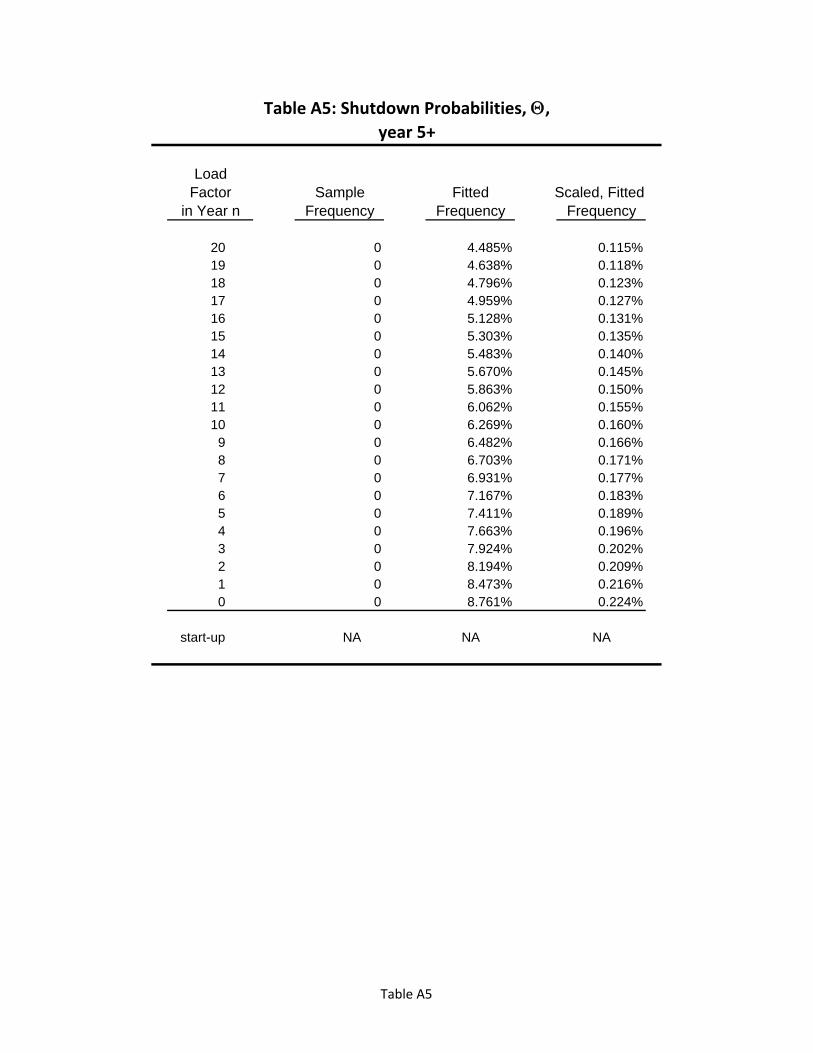
Table A5: Shutdown Probabilities, ,year 5+
LoadFactor Sample Fitted Scaled, Fitted
in Year n Frequency Frequency Frequency
20 0 4.485% 0.115%19 0 4.638% 0.118%18 0 4.796% 0.123%17 0 4.959% 0.127%16 0 5.128% 0.131%15 0 5.303% 0.135%14 0 5.483% 0.140%13 0 5.670% 0.145%12 0 5.863% 0.150%11 0 6.062% 0.155%10 0 6.269% 0.160%9 0 6.482% 0.166%8 0 6.703% 0.171%7 0 6.931% 0.177%6 0 7.167% 0.183%5 0 7.411% 0.189%4 0 7.663% 0.196%3 0 7.924% 0.202%2 0 8.194% 0.209%1 0 8.473% 0.216%0 0 8.761% 0.224%
start-up NA NA NA
Table A5

Table A6: Distribution Moments for the Load Factor, Unconditional and Conditional on Continuing Operation, From P,
Base Case adjusted by vintage
Year Conditional onof Unconditional Operation
Operation Mean Var Mean Var
1 54% 9.6% 54% 9.6%2 67% 3.9% 67% 3.9%3 70% 2.6% 70% 2.7%4 71% 2.4% 72% 2.4%5 71% 2.3% 72% 2.3%6 72% 3.7% 73% 3.8%7 73% 4.4% 74% 4.5%8 75% 4.8% 75% 4.8%9 76% 4.9% 76% 4.9%
10 76% 4.9% 77% 5.0%11 77% 4.9% 78% 5.0%12 77% 4.9% 78% 4.9%13 78% 4.9% 78% 4.9%14 78% 4.9% 79% 4.9%15 78% 4.8% 79% 4.9%16 78% 4.8% 79% 4.9%17 78% 4.8% 79% 4.9%18 78% 4.8% 79% 4.9%19 78% 4.8% 79% 4.8%20 78% 4.8% 79% 4.8%21 78% 4.8% 79% 4.8%22 78% 4.8% 79% 4.8%23 78% 4.8% 79% 4.8%24 78% 4.8% 79% 4.8%25 78% 4.8% 79% 4.8%26 78% 4.8% 79% 4.8%27 78% 4.8% 79% 4.8%28 78% 4.8% 79% 4.8%29 78% 4.8% 79% 4.8%30 78% 4.8% 79% 4.8%31 78% 4.8% 79% 4.8%32 78% 4.8% 79% 4.8%33 78% 4.8% 79% 4.8%34 78% 4.8% 79% 4.8%35 78% 4.8% 79% 4.8%36 78% 4.8% 79% 4.8%37 78% 4.8% 79% 4.8%38 78% 4.8% 79% 4.8%39 78% 4.8% 79% 4.8%
Table A6

Table A6: Distribution Moments for the Load Factor, Unconditional and Conditional on Continuing Operation, From P,
Base Case adjusted by vintage
Year Conditional onof Unconditional Operation
Operation Mean Var Mean Var
40 78% 4.8% 79% 4.8%41 78% 4.8% 79% 4.8%42 78% 4.8% 79% 4.8%43 78% 4.8% 79% 4.8%44 78% 4.8% 79% 4.8%45 78% 4.8% 79% 4.8%46 78% 4.8% 79% 4.8%47 78% 4.8% 79% 4.8%48 78% 4.8% 79% 4.8%49 78% 4.8% 79% 4.8%50 78% 4.8% 79% 4.8%51 78% 4.8% 79% 4.8%52 78% 4.8% 79% 4.8%53 78% 4.8% 79% 4.8%54 78% 4.8% 79% 4.8%55 78% 4.8% 79% 4.8%56 78% 4.8% 79% 4.8%57 78% 4.8% 79% 4.8%58 78% 4.8% 79% 4.8%59 78% 4.8% 79% 4.8%60 78% 4.7% 79% 4.8%
Table A6

Table A7: Parameters of the Conditional Transition Probability, ,pre‐2000
Load Sample Fitted Implied BetaFactor Moments Moments Distribution
in Year n Mean Var Mean Var Alpha Beta
100 80% 1.3% 89% 1.6% 4.76 0.6199 81% 0.4% 88% 1.6% 4.92 0.6798 78% 1.1% 87% 1.6% 5.07 0.7497 78% 0.9% 87% 1.7% 5.20 0.8196 75% 2.3% 86% 1.7% 5.31 0.8895 78% 2.1% 85% 1.7% 5.41 0.9494 76% 3.3% 84% 1.8% 5.49 1.0193 80% 2.1% 84% 1.8% 5.55 1.0892 82% 1.1% 83% 1.8% 5.61 1.1491 79% 2.2% 82% 1.8% 5.65 1.2090 82% 1.6% 82% 1.9% 5.68 1.2789 82% 1.9% 81% 1.9% 5.70 1.3388 78% 3.6% 80% 1.9% 5.71 1.3987 80% 2.4% 80% 2.0% 5.71 1.4586 80% 2.0% 79% 2.0% 5.70 1.5085 78% 2.4% 79% 2.0% 5.69 1.5684 79% 2.2% 78% 2.1% 5.67 1.6183 80% 1.4% 77% 2.1% 5.64 1.6682 76% 2.6% 77% 2.2% 5.60 1.7181 78% 2.7% 76% 2.2% 5.56 1.7680 76% 2.9% 75% 2.2% 5.52 1.8079 77% 2.0% 75% 2.3% 5.46 1.8478 76% 1.9% 74% 2.3% 5.41 1.8877 76% 2.1% 74% 2.4% 5.35 1.9276 75% 2.7% 73% 2.4% 5.29 1.9675 72% 2.0% 72% 2.4% 5.22 1.9974 72% 2.6% 72% 2.5% 5.15 2.0273 70% 2.1% 71% 2.5% 5.08 2.0572 74% 2.3% 71% 2.6% 5.01 2.0871 69% 3.3% 70% 2.6% 4.93 2.1170 72% 1.8% 70% 2.7% 4.86 2.1369 67% 3.3% 69% 2.7% 4.78 2.1568 68% 3.1% 68% 2.7% 4.70 2.1767 69% 2.7% 68% 2.8% 4.62 2.1966 69% 3.9% 67% 2.8% 4.53 2.2065 66% 3.5% 67% 2.9% 4.45 2.2264 65% 3.9% 66% 2.9% 4.37 2.2363 66% 2.8% 66% 3.0% 4.28 2.2462 65% 3.3% 65% 3.0% 4.20 2.2561 66% 3.5% 65% 3.1% 4.12 2.26
Table A7

Table A7: Parameters of the Conditional Transition Probability, ,pre‐2000
Load Sample Fitted Implied BetaFactor Moments Moments Distribution
in Year n Mean Var Mean Var Alpha Beta
60 65% 3.2% 64% 3.2% 4.03 2.2659 65% 3.2% 64% 3.2% 3.95 2.2658 66% 3.1% 63% 3.3% 3.86 2.2657 62% 3.8% 63% 3.3% 3.78 2.2656 65% 3.2% 62% 3.4% 3.70 2.2655 59% 3.2% 62% 3.4% 3.62 2.2654 62% 2.8% 61% 3.5% 3.53 2.2653 60% 3.7% 61% 3.6% 3.45 2.2552 63% 3.7% 60% 3.6% 3.37 2.2451 60% 3.8% 60% 3.7% 3.29 2.2350 63% 2.0% 59% 3.8% 3.21 2.2349 56% 5.1% 59% 3.8% 3.14 2.2148 57% 3.2% 58% 3.9% 3.06 2.2047 61% 3.6% 58% 4.0% 2.98 2.1946 61% 3.6% 57% 4.0% 2.91 2.1845 55% 3.6% 57% 4.1% 2.83 2.1644 60% 2.6% 56% 4.2% 2.76 2.1543 58% 2.6% 56% 4.2% 2.69 2.1342 48% 5.0% 55% 4.3% 2.62 2.1141 59% 2.7% 55% 4.4% 2.55 2.0940 48% 4.2% 54% 4.5% 2.48 2.0739 54% 5.2% 54% 4.5% 2.41 2.0538 54% 5.1% 54% 4.6% 2.35 2.0337 56% 4.6% 53% 4.7% 2.28 2.0136 54% 5.2% 53% 4.8% 2.22 1.9935 55% 6.0% 52% 4.9% 2.16 1.9734 66% 8.3% 52% 5.0% 2.09 1.9433 52% 6.4% 51% 5.0% 2.03 1.9232 59% 7.5% 51% 5.1% 1.98 1.8931 70% 1.4% 51% 5.2% 1.92 1.8730 56% 7.6% 50% 5.3% 1.86 1.8529 69% 8.1% 50% 5.4% 1.81 1.8228 68% 3.6% 49% 5.5% 1.75 1.7927 53% 6.8% 49% 5.6% 1.70 1.7726 48% 6.7% 49% 5.7% 1.65 1.7425 44% 11.4% 48% 5.8% 1.60 1.7124 51% 6.8% 48% 5.9% 1.55 1.6923 53% 6.2% 47% 6.0% 1.50 1.6622 55% 7.1% 47% 6.1% 1.45 1.6321 56% 8.1% 47% 6.2% 1.40 1.60
Table A7

Table A7: Parameters of the Conditional Transition Probability, ,pre‐2000
Load Sample Fitted Implied BetaFactor Moments Moments Distribution
in Year n Mean Var Mean Var Alpha Beta
20 51% 8.2% 46% 6.3% 1.36 1.5819 52% 5.0% 46% 6.4% 1.32 1.5518 52% 7.6% 46% 6.5% 1.27 1.5217 30% 6.7% 45% 6.7% 1.23 1.4916 57% 6.6% 45% 6.8% 1.19 1.4615 62% 6.1% 44% 6.9% 1.15 1.4414 48% 11.5% 44% 7.0% 1.11 1.4113 38% 11.9% 44% 7.1% 1.07 1.3812 49% 8.2% 43% 7.3% 1.03 1.3511 52% 8.7% 43% 7.4% 1.00 1.3210 62% 7.4% 43% 7.5% 0.96 1.299 52% 7.5% 42% 7.6% 0.93 1.268 63% 3.0% 42% 7.8% 0.90 1.247 58% 9.0% 42% 7.9% 0.86 1.216 54% 7.5% 41% 8.1% 0.83 1.185 58% 5.4% 41% 8.2% 0.80 1.154 46% 5.1% 41% 8.3% 0.77 1.123 51% 6.8% 40% 8.5% 0.74 1.102 38% 7.5% 40% 8.6% 0.71 1.071 50% 9.6% 40% 8.8% 0.68 1.040 20% 7.9% 39% 8.9% 0.66 1.01
start-up 52% 9.5% 0.85 0.79
Table A7
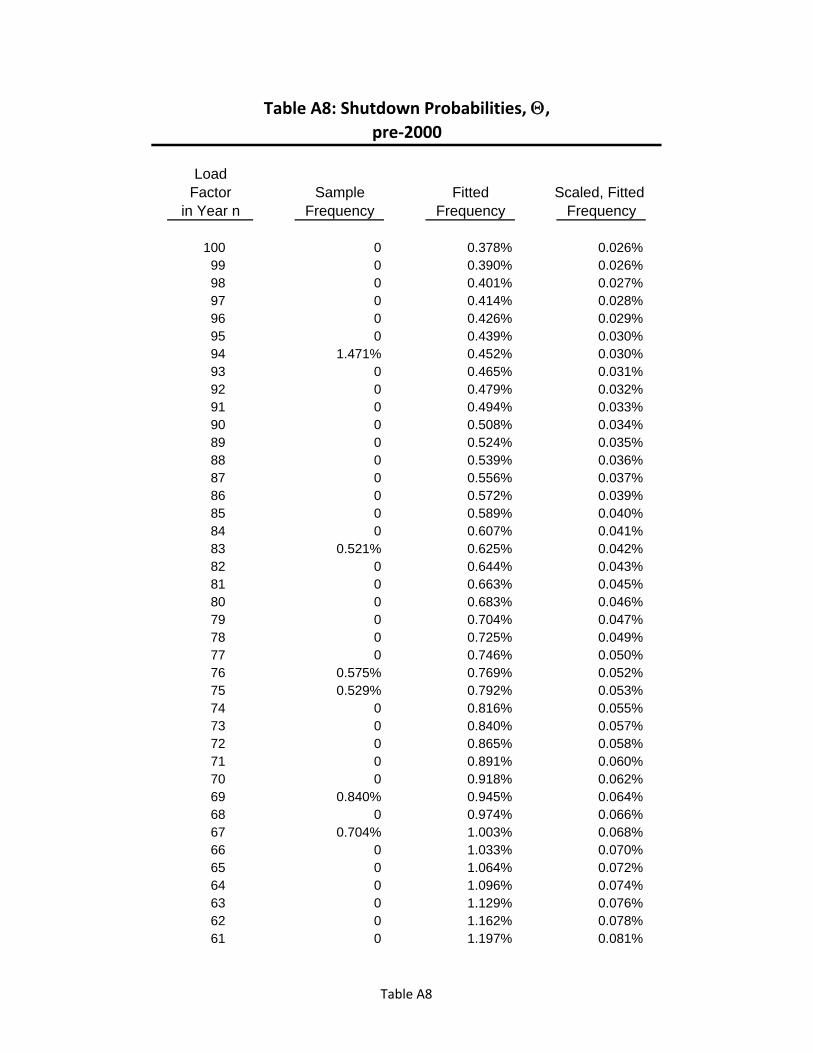
Table A8: Shutdown Probabilities, ,pre‐2000
LoadFactor Sample Fitted Scaled, Fitted
in Year n Frequency Frequency Frequency
100 0 0.378% 0.026%99 0 0.390% 0.026%98 0 0.401% 0.027%97 0 0.414% 0.028%96 0 0.426% 0.029%95 0 0.439% 0.030%94 1.471% 0.452% 0.030%93 0 0.465% 0.031%92 0 0.479% 0.032%91 0 0.494% 0.033%90 0 0.508% 0.034%89 0 0.524% 0.035%88 0 0.539% 0.036%87 0 0.556% 0.037%86 0 0.572% 0.039%85 0 0.589% 0.040%84 0 0.607% 0.041%83 0.521% 0.625% 0.042%82 0 0.644% 0.043%81 0 0.663% 0.045%80 0 0.683% 0.046%79 0 0.704% 0.047%78 0 0.725% 0.049%77 0 0.746% 0.050%76 0.575% 0.769% 0.052%75 0.529% 0.792% 0.053%74 0 0.816% 0.055%73 0 0.840% 0.057%72 0 0.865% 0.058%71 0 0.891% 0.060%70 0 0.918% 0.062%69 0.840% 0.945% 0.064%68 0 0.974% 0.066%67 0.704% 1.003% 0.068%66 0 1.033% 0.070%65 0 1.064% 0.072%64 0 1.096% 0.074%63 0 1.129% 0.076%62 0 1.162% 0.078%61 0 1.197% 0.081%
Table A8

Table A8: Shutdown Probabilities, ,pre‐2000
LoadFactor Sample Fitted Scaled, Fitted
in Year n Frequency Frequency Frequency
60 1.053% 1.233% 0.083%59 1.176% 1.270% 0.086%58 0 1.308% 0.088%57 0 1.347% 0.091%56 0 1.388% 0.094%55 0 1.429% 0.096%54 0 1.472% 0.099%53 0 1.516% 0.102%52 0 1.562% 0.105%51 0 1.609% 0.108%50 0 1.657% 0.112%49 0 1.707% 0.115%48 0 1.758% 0.119%47 0 1.810% 0.122%46 0 1.865% 0.126%45 0 1.920% 0.130%44 0 1.978% 0.133%43 0 2.037% 0.137%42 0 2.098% 0.142%41 0 2.161% 0.146%40 0 2.226% 0.150%39 0 2.293% 0.155%38 0 2.361% 0.159%37 0 2.432% 0.164%36 0 2.505% 0.169%35 0 2.580% 0.174%34 0 2.658% 0.179%33 0 2.737% 0.185%32 0 2.819% 0.190%31 0 2.904% 0.196%30 0 2.991% 0.202%29 0 3.080% 0.208%28 0 3.173% 0.214%27 0 3.268% 0.220%26 0 3.366% 0.227%25 0 3.467% 0.234%24 0 3.571% 0.241%23 0 3.678% 0.248%22 0 3.788% 0.255%21 0 3.901% 0.263%
Table A8

Table A8: Shutdown Probabilities, ,pre‐2000
LoadFactor Sample Fitted Scaled, Fitted
in Year n Frequency Frequency Frequency
20 0 4.018% 0.271%19 0 4.139% 0.279%18 0 4.263% 0.287%17 0 4.391% 0.296%16 0 4.522% 0.305%15 0 4.658% 0.314%14 0 4.797% 0.324%13 0 4.941% 0.333%12 0 5.089% 0.343%11 0 5.242% 0.354%10 0 5.399% 0.364%9 0 5.561% 0.375%8 0 5.727% 0.386%7 0 5.899% 0.398%6 9.091% 6.076% 0.410%5 0 6.258% 0.422%4 0 6.445% 0.435%3 0 6.639% 0.448%2 0 6.838% 0.461%1 0 7.042% 0.475%0 0 7.254% 0.489%
start-up NA NA NA
Table A8

Table A9: Distribution Moments for the Load Factor, Unconditional and Conditional on Continuing Operation, From P,
pre‐2000
Year Conditional onof Unconditional Operation
Operation Mean Var Mean Var
1 54% 9.6% 54% 9.6%2 63% 6.4% 63% 6.4%3 68% 5.0% 68% 5.0%4 70% 4.4% 70% 4.4%5 71% 4.1% 71% 4.1%6 71% 4.0% 71% 4.0%7 71% 3.9% 72% 4.0%8 71% 3.9% 72% 3.9%9 71% 3.9% 72% 3.9%
10 71% 3.9% 72% 3.9%11 71% 3.9% 72% 3.9%12 71% 3.9% 72% 3.9%13 71% 3.9% 72% 3.9%14 71% 3.9% 72% 3.9%15 71% 3.9% 72% 3.9%16 71% 3.9% 72% 3.9%17 71% 3.9% 72% 3.9%18 71% 3.9% 72% 3.9%19 71% 3.9% 72% 3.9%20 71% 3.8% 72% 3.9%21 71% 3.8% 72% 3.9%22 71% 3.8% 72% 3.9%23 71% 3.8% 72% 3.9%24 71% 3.8% 72% 3.9%25 71% 3.8% 72% 3.9%26 71% 3.8% 72% 3.9%27 71% 3.8% 72% 3.9%28 71% 3.8% 72% 3.9%29 71% 3.8% 72% 3.9%30 70% 3.8% 72% 3.9%31 70% 3.8% 72% 3.9%32 70% 3.8% 72% 3.9%33 70% 3.8% 72% 3.9%34 70% 3.8% 72% 3.9%35 70% 3.8% 72% 3.9%36 70% 3.8% 72% 3.9%37 70% 3.8% 72% 3.9%38 70% 3.8% 72% 3.9%39 70% 3.8% 72% 3.9%
Table A9
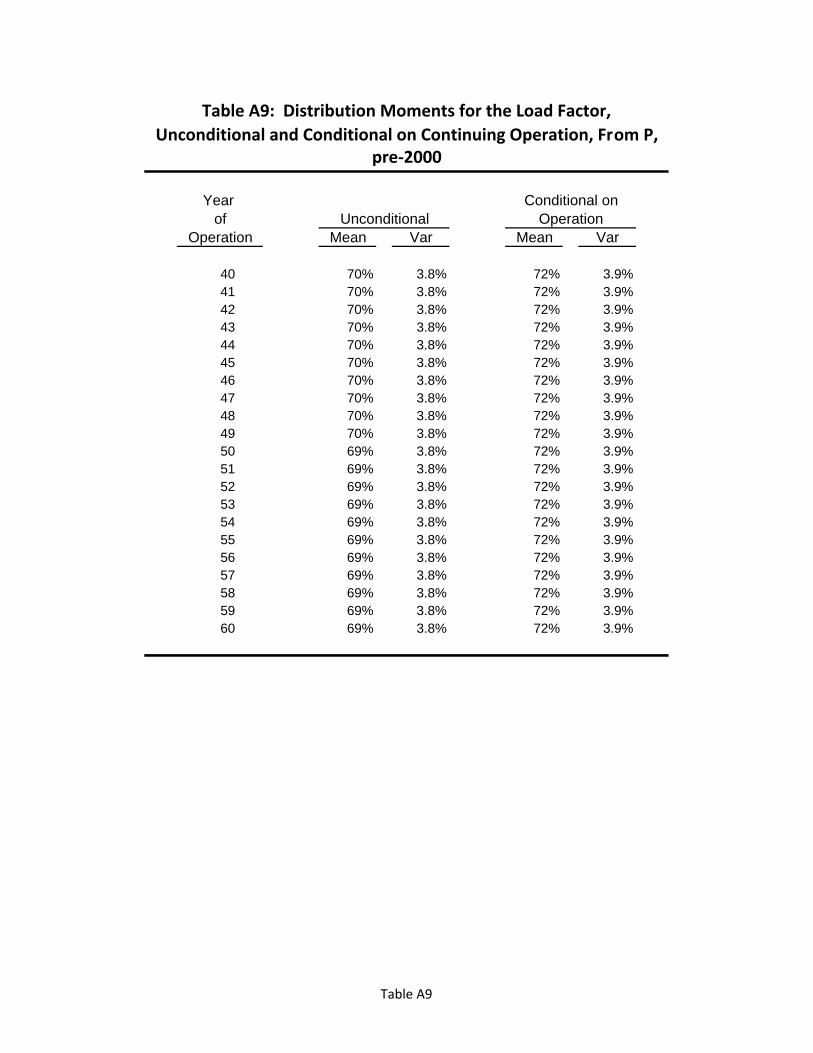
Table A9: Distribution Moments for the Load Factor, Unconditional and Conditional on Continuing Operation, From P,
pre‐2000
Year Conditional onof Unconditional Operation
Operation Mean Var Mean Var
40 70% 3.8% 72% 3.9%41 70% 3.8% 72% 3.9%42 70% 3.8% 72% 3.9%43 70% 3.8% 72% 3.9%44 70% 3.8% 72% 3.9%45 70% 3.8% 72% 3.9%46 70% 3.8% 72% 3.9%47 70% 3.8% 72% 3.9%48 70% 3.8% 72% 3.9%49 70% 3.8% 72% 3.9%50 69% 3.8% 72% 3.9%51 69% 3.8% 72% 3.9%52 69% 3.8% 72% 3.9%53 69% 3.8% 72% 3.9%54 69% 3.8% 72% 3.9%55 69% 3.8% 72% 3.9%56 69% 3.8% 72% 3.9%57 69% 3.8% 72% 3.9%58 69% 3.8% 72% 3.9%59 69% 3.8% 72% 3.9%60 69% 3.8% 72% 3.9%
Table A9
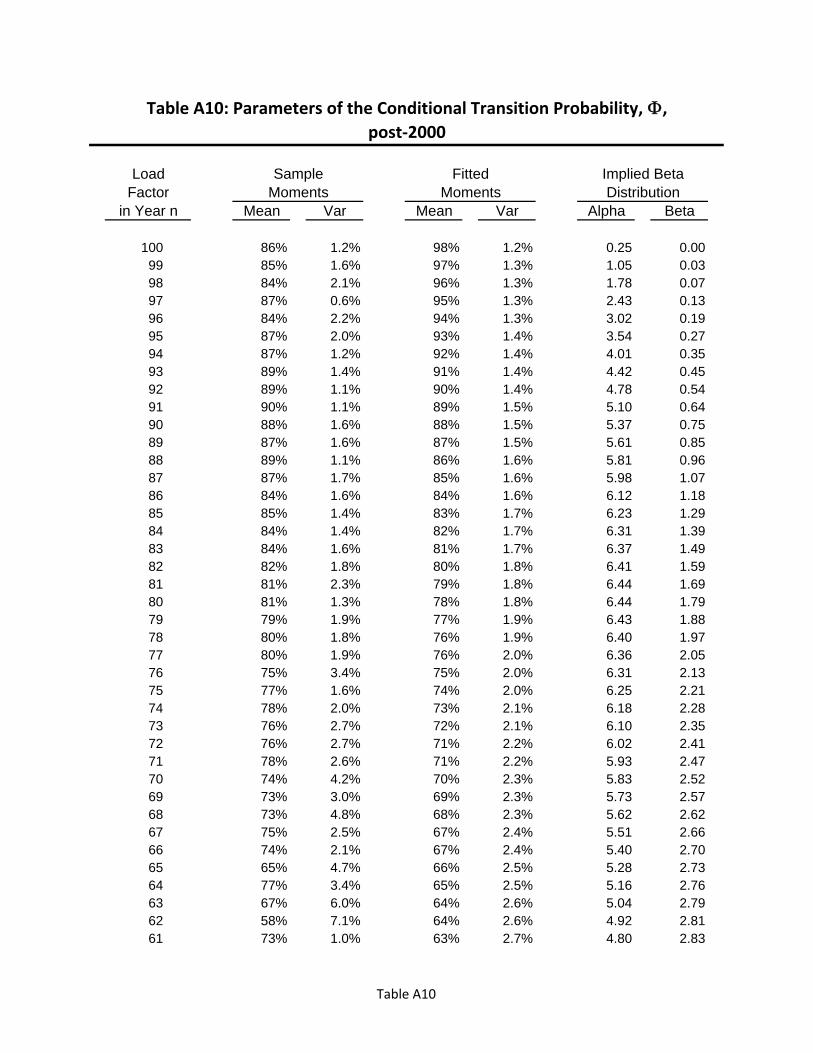
Table A10: Parameters of the Conditional Transition Probability, ,post‐2000
Load Sample Fitted Implied BetaFactor Moments Moments Distribution
in Year n Mean Var Mean Var Alpha Beta
100 86% 1.2% 98% 1.2% 0.25 0.0099 85% 1.6% 97% 1.3% 1.05 0.0398 84% 2.1% 96% 1.3% 1.78 0.0797 87% 0.6% 95% 1.3% 2.43 0.1396 84% 2.2% 94% 1.3% 3.02 0.1995 87% 2.0% 93% 1.4% 3.54 0.2794 87% 1.2% 92% 1.4% 4.01 0.3593 89% 1.4% 91% 1.4% 4.42 0.4592 89% 1.1% 90% 1.4% 4.78 0.5491 90% 1.1% 89% 1.5% 5.10 0.6490 88% 1.6% 88% 1.5% 5.37 0.7589 87% 1.6% 87% 1.5% 5.61 0.8588 89% 1.1% 86% 1.6% 5.81 0.9687 87% 1.7% 85% 1.6% 5.98 1.0786 84% 1.6% 84% 1.6% 6.12 1.1885 85% 1.4% 83% 1.7% 6.23 1.2984 84% 1.4% 82% 1.7% 6.31 1.3983 84% 1.6% 81% 1.7% 6.37 1.4982 82% 1.8% 80% 1.8% 6.41 1.5981 81% 2.3% 79% 1.8% 6.44 1.6980 81% 1.3% 78% 1.8% 6.44 1.7979 79% 1.9% 77% 1.9% 6.43 1.8878 80% 1.8% 76% 1.9% 6.40 1.9777 80% 1.9% 76% 2.0% 6.36 2.0576 75% 3.4% 75% 2.0% 6.31 2.1375 77% 1.6% 74% 2.0% 6.25 2.2174 78% 2.0% 73% 2.1% 6.18 2.2873 76% 2.7% 72% 2.1% 6.10 2.3572 76% 2.7% 71% 2.2% 6.02 2.4171 78% 2.6% 71% 2.2% 5.93 2.4770 74% 4.2% 70% 2.3% 5.83 2.5269 73% 3.0% 69% 2.3% 5.73 2.5768 73% 4.8% 68% 2.3% 5.62 2.6267 75% 2.5% 67% 2.4% 5.51 2.6666 74% 2.1% 67% 2.4% 5.40 2.7065 65% 4.7% 66% 2.5% 5.28 2.7364 77% 3.4% 65% 2.5% 5.16 2.7663 67% 6.0% 64% 2.6% 5.04 2.7962 58% 7.1% 64% 2.6% 4.92 2.8161 73% 1.0% 63% 2.7% 4.80 2.83
Table A10
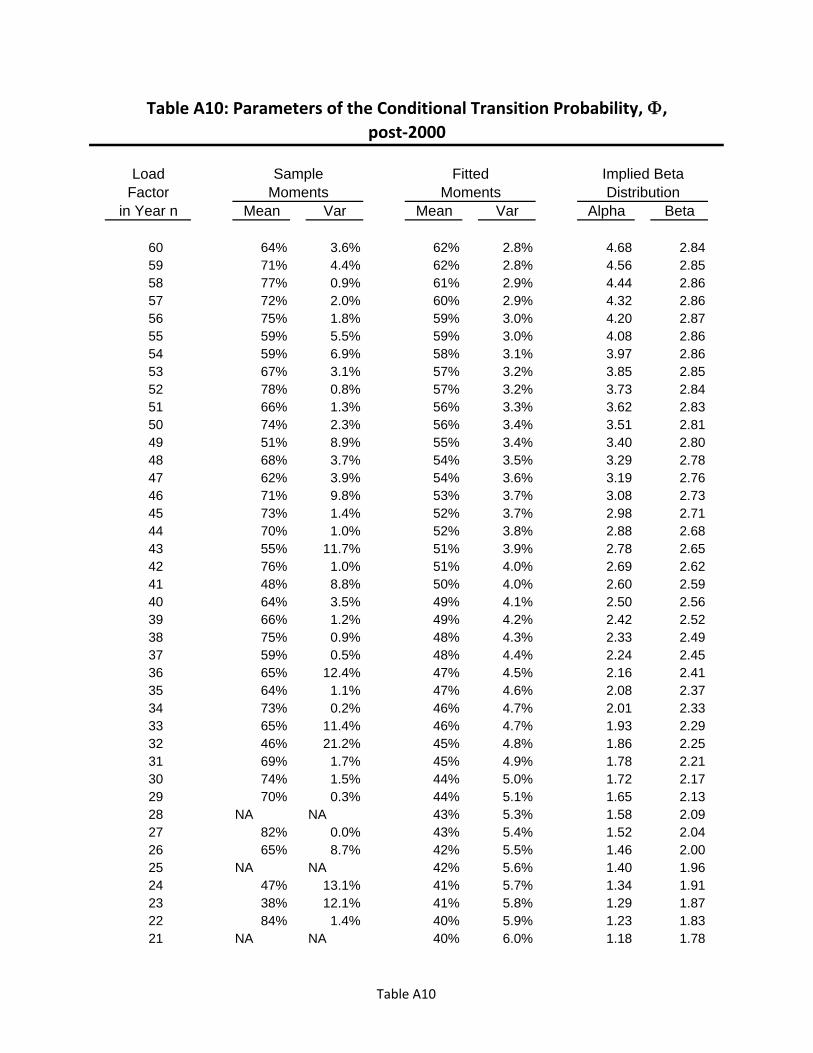
Table A10: Parameters of the Conditional Transition Probability, ,post‐2000
Load Sample Fitted Implied BetaFactor Moments Moments Distribution
in Year n Mean Var Mean Var Alpha Beta
60 64% 3.6% 62% 2.8% 4.68 2.8459 71% 4.4% 62% 2.8% 4.56 2.8558 77% 0.9% 61% 2.9% 4.44 2.8657 72% 2.0% 60% 2.9% 4.32 2.8656 75% 1.8% 59% 3.0% 4.20 2.8755 59% 5.5% 59% 3.0% 4.08 2.8654 59% 6.9% 58% 3.1% 3.97 2.8653 67% 3.1% 57% 3.2% 3.85 2.8552 78% 0.8% 57% 3.2% 3.73 2.8451 66% 1.3% 56% 3.3% 3.62 2.8350 74% 2.3% 56% 3.4% 3.51 2.8149 51% 8.9% 55% 3.4% 3.40 2.8048 68% 3.7% 54% 3.5% 3.29 2.7847 62% 3.9% 54% 3.6% 3.19 2.7646 71% 9.8% 53% 3.7% 3.08 2.7345 73% 1.4% 52% 3.7% 2.98 2.7144 70% 1.0% 52% 3.8% 2.88 2.6843 55% 11.7% 51% 3.9% 2.78 2.6542 76% 1.0% 51% 4.0% 2.69 2.6241 48% 8.8% 50% 4.0% 2.60 2.5940 64% 3.5% 49% 4.1% 2.50 2.5639 66% 1.2% 49% 4.2% 2.42 2.5238 75% 0.9% 48% 4.3% 2.33 2.4937 59% 0.5% 48% 4.4% 2.24 2.4536 65% 12.4% 47% 4.5% 2.16 2.4135 64% 1.1% 47% 4.6% 2.08 2.3734 73% 0.2% 46% 4.7% 2.01 2.3333 65% 11.4% 46% 4.7% 1.93 2.2932 46% 21.2% 45% 4.8% 1.86 2.2531 69% 1.7% 45% 4.9% 1.78 2.2130 74% 1.5% 44% 5.0% 1.72 2.1729 70% 0.3% 44% 5.1% 1.65 2.1328 NA NA 43% 5.3% 1.58 2.0927 82% 0.0% 43% 5.4% 1.52 2.0426 65% 8.7% 42% 5.5% 1.46 2.0025 NA NA 42% 5.6% 1.40 1.9624 47% 13.1% 41% 5.7% 1.34 1.9123 38% 12.1% 41% 5.8% 1.29 1.8722 84% 1.4% 40% 5.9% 1.23 1.8321 NA NA 40% 6.0% 1.18 1.78
Table A10
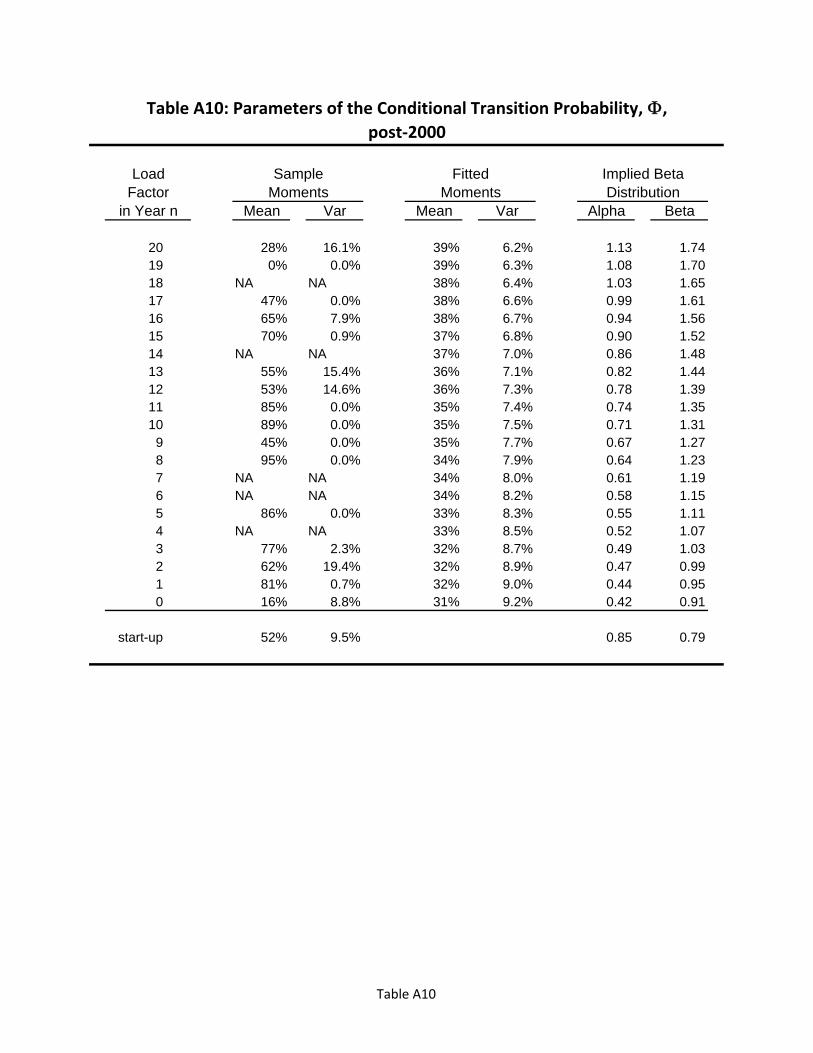
Table A10: Parameters of the Conditional Transition Probability, ,post‐2000
Load Sample Fitted Implied BetaFactor Moments Moments Distribution
in Year n Mean Var Mean Var Alpha Beta
20 28% 16.1% 39% 6.2% 1.13 1.7419 0% 0.0% 39% 6.3% 1.08 1.7018 NA NA 38% 6.4% 1.03 1.6517 47% 0.0% 38% 6.6% 0.99 1.6116 65% 7.9% 38% 6.7% 0.94 1.5615 70% 0.9% 37% 6.8% 0.90 1.5214 NA NA 37% 7.0% 0.86 1.4813 55% 15.4% 36% 7.1% 0.82 1.4412 53% 14.6% 36% 7.3% 0.78 1.3911 85% 0.0% 35% 7.4% 0.74 1.3510 89% 0.0% 35% 7.5% 0.71 1.319 45% 0.0% 35% 7.7% 0.67 1.278 95% 0.0% 34% 7.9% 0.64 1.237 NA NA 34% 8.0% 0.61 1.196 NA NA 34% 8.2% 0.58 1.155 86% 0.0% 33% 8.3% 0.55 1.114 NA NA 33% 8.5% 0.52 1.073 77% 2.3% 32% 8.7% 0.49 1.032 62% 19.4% 32% 8.9% 0.47 0.991 81% 0.7% 32% 9.0% 0.44 0.950 16% 8.8% 31% 9.2% 0.42 0.91
start-up 52% 9.5% 0.85 0.79
Table A10
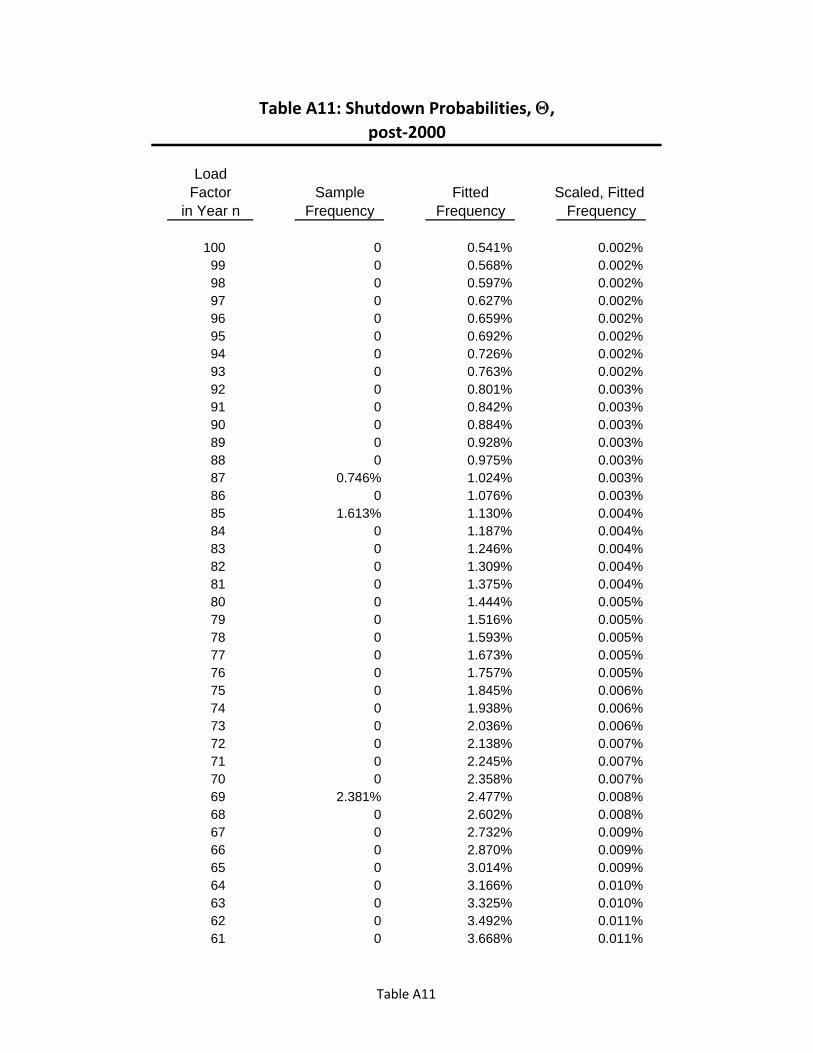
Table A11: Shutdown Probabilities, ,post‐2000
LoadFactor Sample Fitted Scaled, Fitted
in Year n Frequency Frequency Frequency
100 0 0.541% 0.002%99 0 0.568% 0.002%98 0 0.597% 0.002%97 0 0.627% 0.002%96 0 0.659% 0.002%95 0 0.692% 0.002%94 0 0.726% 0.002%93 0 0.763% 0.002%92 0 0.801% 0.003%91 0 0.842% 0.003%90 0 0.884% 0.003%89 0 0.928% 0.003%88 0 0.975% 0.003%87 0.746% 1.024% 0.003%86 0 1.076% 0.003%85 1.613% 1.130% 0.004%84 0 1.187% 0.004%83 0 1.246% 0.004%82 0 1.309% 0.004%81 0 1.375% 0.004%80 0 1.444% 0.005%79 0 1.516% 0.005%78 0 1.593% 0.005%77 0 1.673% 0.005%76 0 1.757% 0.005%75 0 1.845% 0.006%74 0 1.938% 0.006%73 0 2.036% 0.006%72 0 2.138% 0.007%71 0 2.245% 0.007%70 0 2.358% 0.007%69 2.381% 2.477% 0.008%68 0 2.602% 0.008%67 0 2.732% 0.009%66 0 2.870% 0.009%65 0 3.014% 0.009%64 0 3.166% 0.010%63 0 3.325% 0.010%62 0 3.492% 0.011%61 0 3.668% 0.011%
Table A11
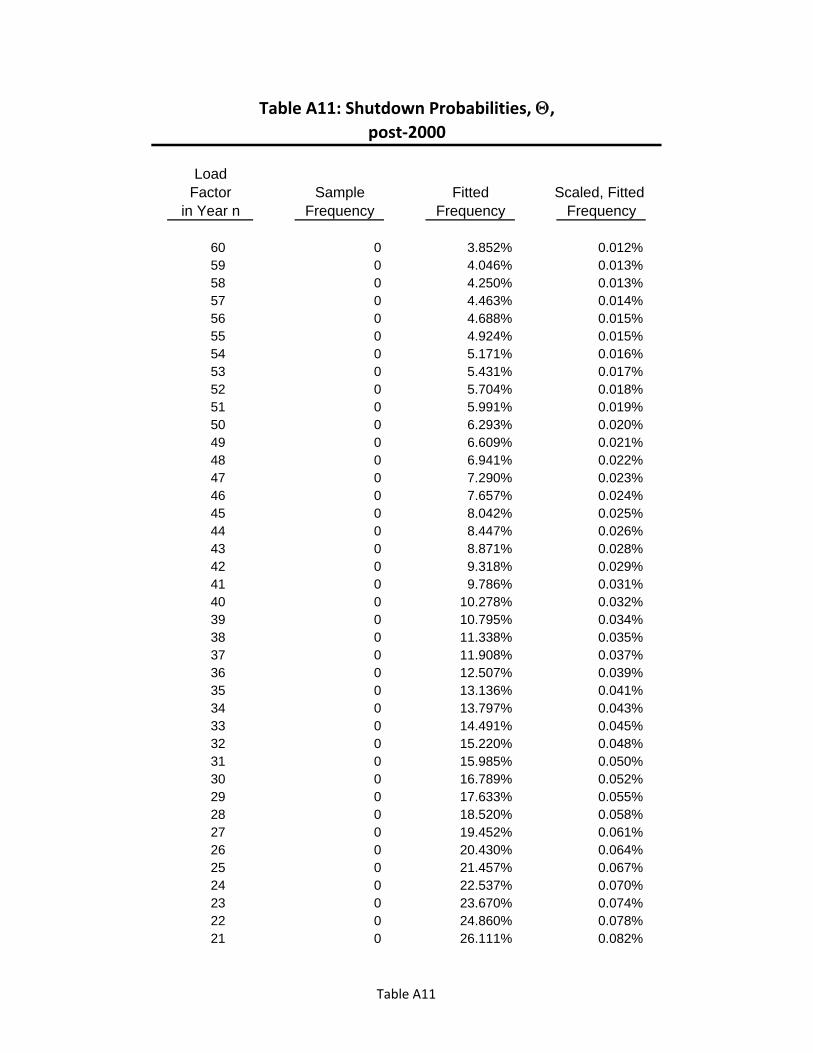
Table A11: Shutdown Probabilities, ,post‐2000
LoadFactor Sample Fitted Scaled, Fitted
in Year n Frequency Frequency Frequency
60 0 3.852% 0.012%59 0 4.046% 0.013%58 0 4.250% 0.013%57 0 4.463% 0.014%56 0 4.688% 0.015%55 0 4.924% 0.015%54 0 5.171% 0.016%53 0 5.431% 0.017%52 0 5.704% 0.018%51 0 5.991% 0.019%50 0 6.293% 0.020%49 0 6.609% 0.021%48 0 6.941% 0.022%47 0 7.290% 0.023%46 0 7.657% 0.024%45 0 8.042% 0.025%44 0 8.447% 0.026%43 0 8.871% 0.028%42 0 9.318% 0.029%41 0 9.786% 0.031%40 0 10.278% 0.032%39 0 10.795% 0.034%38 0 11.338% 0.035%37 0 11.908% 0.037%36 0 12.507% 0.039%35 0 13.136% 0.041%34 0 13.797% 0.043%33 0 14.491% 0.045%32 0 15.220% 0.048%31 0 15.985% 0.050%30 0 16.789% 0.052%29 0 17.633% 0.055%28 0 18.520% 0.058%27 0 19.452% 0.061%26 0 20.430% 0.064%25 0 21.457% 0.067%24 0 22.537% 0.070%23 0 23.670% 0.074%22 0 24.860% 0.078%21 0 26.111% 0.082%
Table A11
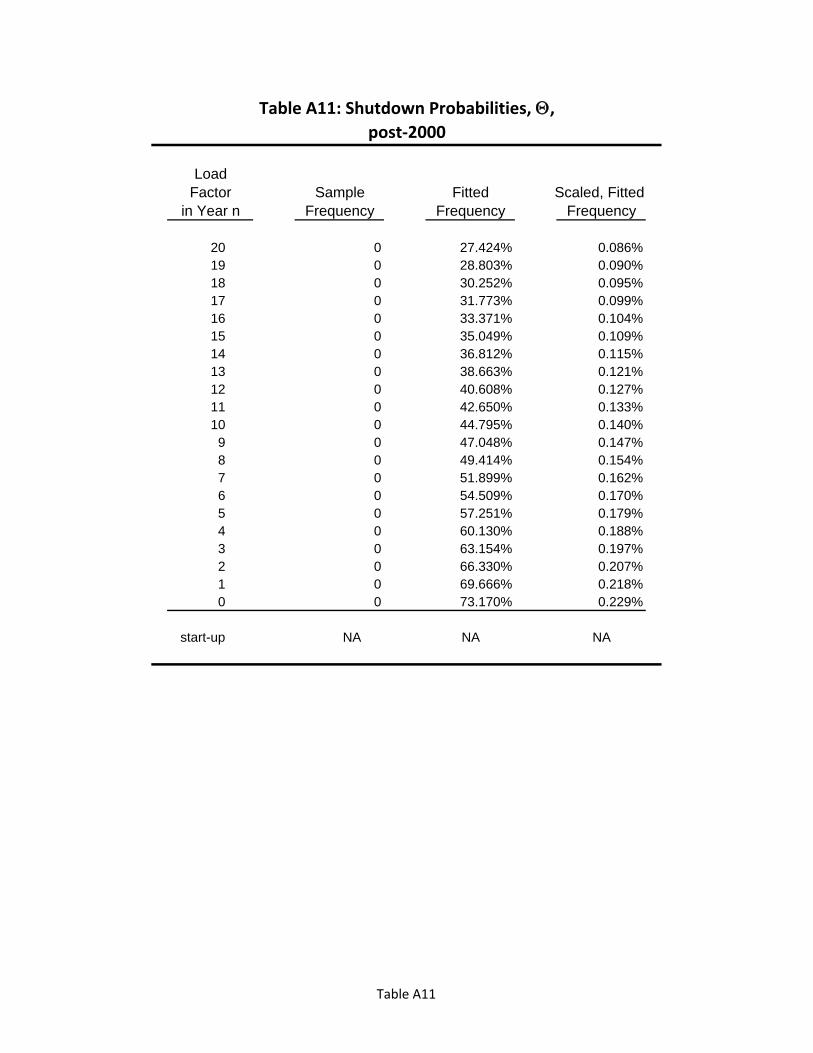
Table A11: Shutdown Probabilities, ,post‐2000
LoadFactor Sample Fitted Scaled, Fitted
in Year n Frequency Frequency Frequency
20 0 27.424% 0.086%19 0 28.803% 0.090%18 0 30.252% 0.095%17 0 31.773% 0.099%16 0 33.371% 0.104%15 0 35.049% 0.109%14 0 36.812% 0.115%13 0 38.663% 0.121%12 0 40.608% 0.127%11 0 42.650% 0.133%10 0 44.795% 0.140%9 0 47.048% 0.147%8 0 49.414% 0.154%7 0 51.899% 0.162%6 0 54.509% 0.170%5 0 57.251% 0.179%4 0 60.130% 0.188%3 0 63.154% 0.197%2 0 66.330% 0.207%1 0 69.666% 0.218%0 0 73.170% 0.229%
start-up NA NA NA
Table A11

Table A12: Distribution Moments for the Load Factor, Unconditional and Conditional on Continuing Operation, From P,
post‐2000
Year Conditional onof Unconditional Operation
Operation Mean Var Mean Var
1 54% 9.6% 54% 9.6%2 62% 8.2% 62% 8.2%3 68% 7.3% 68% 7.3%4 71% 6.7% 71% 6.7%5 74% 6.4% 74% 6.4%6 76% 6.1% 77% 6.1%7 78% 6.0% 78% 6.0%8 80% 5.8% 80% 5.9%9 81% 5.7% 81% 5.7%
10 82% 5.6% 82% 5.6%11 83% 5.5% 83% 5.5%12 84% 5.4% 84% 5.4%13 85% 5.3% 85% 5.3%14 85% 5.2% 86% 5.2%15 86% 5.1% 86% 5.1%16 87% 5.0% 87% 5.1%17 87% 5.0% 87% 5.0%18 87% 4.9% 88% 4.9%19 88% 4.8% 88% 4.8%20 88% 4.8% 88% 4.8%21 88% 4.7% 89% 4.7%22 89% 4.7% 89% 4.7%23 89% 4.6% 89% 4.6%24 89% 4.6% 89% 4.6%25 89% 4.5% 89% 4.6%26 89% 4.5% 90% 4.5%27 89% 4.5% 90% 4.5%28 89% 4.5% 90% 4.5%29 90% 4.4% 90% 4.4%30 90% 4.4% 90% 4.4%31 90% 4.4% 90% 4.4%32 90% 4.4% 90% 4.4%33 90% 4.4% 90% 4.4%34 90% 4.4% 90% 4.4%35 90% 4.3% 90% 4.4%36 90% 4.3% 90% 4.3%37 90% 4.3% 90% 4.3%38 90% 4.3% 90% 4.3%39 90% 4.3% 90% 4.3%
Table A12
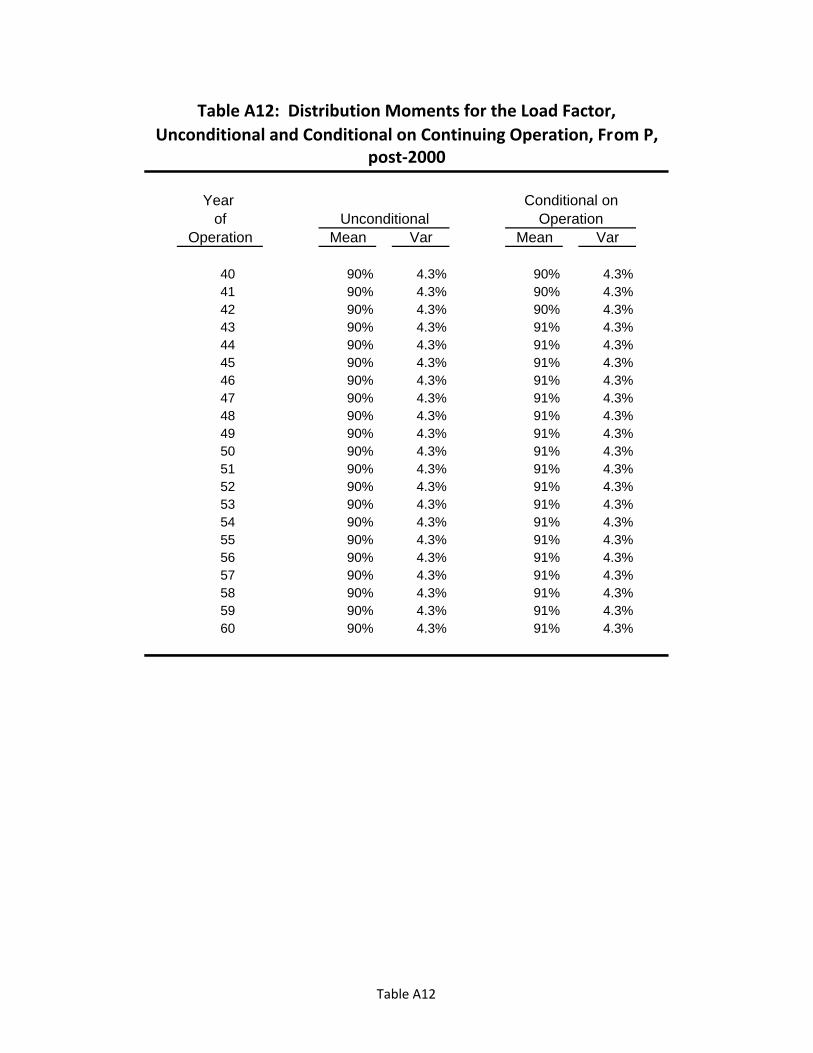
Table A12: Distribution Moments for the Load Factor, Unconditional and Conditional on Continuing Operation, From P,
post‐2000
Year Conditional onof Unconditional Operation
Operation Mean Var Mean Var
40 90% 4.3% 90% 4.3%41 90% 4.3% 90% 4.3%42 90% 4.3% 90% 4.3%43 90% 4.3% 91% 4.3%44 90% 4.3% 91% 4.3%45 90% 4.3% 91% 4.3%46 90% 4.3% 91% 4.3%47 90% 4.3% 91% 4.3%48 90% 4.3% 91% 4.3%49 90% 4.3% 91% 4.3%50 90% 4.3% 91% 4.3%51 90% 4.3% 91% 4.3%52 90% 4.3% 91% 4.3%53 90% 4.3% 91% 4.3%54 90% 4.3% 91% 4.3%55 90% 4.3% 91% 4.3%56 90% 4.3% 91% 4.3%57 90% 4.3% 91% 4.3%58 90% 4.3% 91% 4.3%59 90% 4.3% 91% 4.3%60 90% 4.3% 91% 4.3%
Table A12
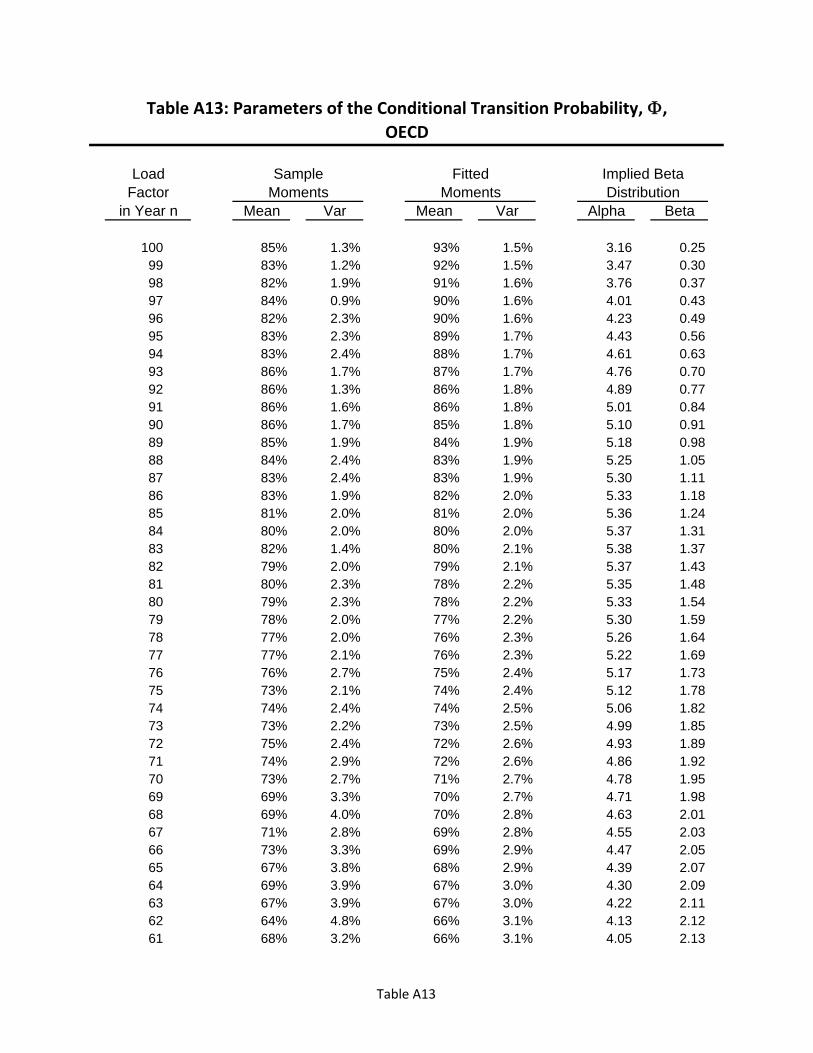
Table A13: Parameters of the Conditional Transition Probability, ,OECD
Load Sample Fitted Implied BetaFactor Moments Moments Distribution
in Year n Mean Var Mean Var Alpha Beta
100 85% 1.3% 93% 1.5% 3.16 0.2599 83% 1.2% 92% 1.5% 3.47 0.3098 82% 1.9% 91% 1.6% 3.76 0.3797 84% 0.9% 90% 1.6% 4.01 0.4396 82% 2.3% 90% 1.6% 4.23 0.4995 83% 2.3% 89% 1.7% 4.43 0.5694 83% 2.4% 88% 1.7% 4.61 0.6393 86% 1.7% 87% 1.7% 4.76 0.7092 86% 1.3% 86% 1.8% 4.89 0.7791 86% 1.6% 86% 1.8% 5.01 0.8490 86% 1.7% 85% 1.8% 5.10 0.9189 85% 1.9% 84% 1.9% 5.18 0.9888 84% 2.4% 83% 1.9% 5.25 1.0587 83% 2.4% 83% 1.9% 5.30 1.1186 83% 1.9% 82% 2.0% 5.33 1.1885 81% 2.0% 81% 2.0% 5.36 1.2484 80% 2.0% 80% 2.0% 5.37 1.3183 82% 1.4% 80% 2.1% 5.38 1.3782 79% 2.0% 79% 2.1% 5.37 1.4381 80% 2.3% 78% 2.2% 5.35 1.4880 79% 2.3% 78% 2.2% 5.33 1.5479 78% 2.0% 77% 2.2% 5.30 1.5978 77% 2.0% 76% 2.3% 5.26 1.6477 77% 2.1% 76% 2.3% 5.22 1.6976 76% 2.7% 75% 2.4% 5.17 1.7375 73% 2.1% 74% 2.4% 5.12 1.7874 74% 2.4% 74% 2.5% 5.06 1.8273 73% 2.2% 73% 2.5% 4.99 1.8572 75% 2.4% 72% 2.6% 4.93 1.8971 74% 2.9% 72% 2.6% 4.86 1.9270 73% 2.7% 71% 2.7% 4.78 1.9569 69% 3.3% 70% 2.7% 4.71 1.9868 69% 4.0% 70% 2.8% 4.63 2.0167 71% 2.8% 69% 2.8% 4.55 2.0366 73% 3.3% 69% 2.9% 4.47 2.0565 67% 3.8% 68% 2.9% 4.39 2.0764 69% 3.9% 67% 3.0% 4.30 2.0963 67% 3.9% 67% 3.0% 4.22 2.1162 64% 4.8% 66% 3.1% 4.13 2.1261 68% 3.2% 66% 3.1% 4.05 2.13
Table A13
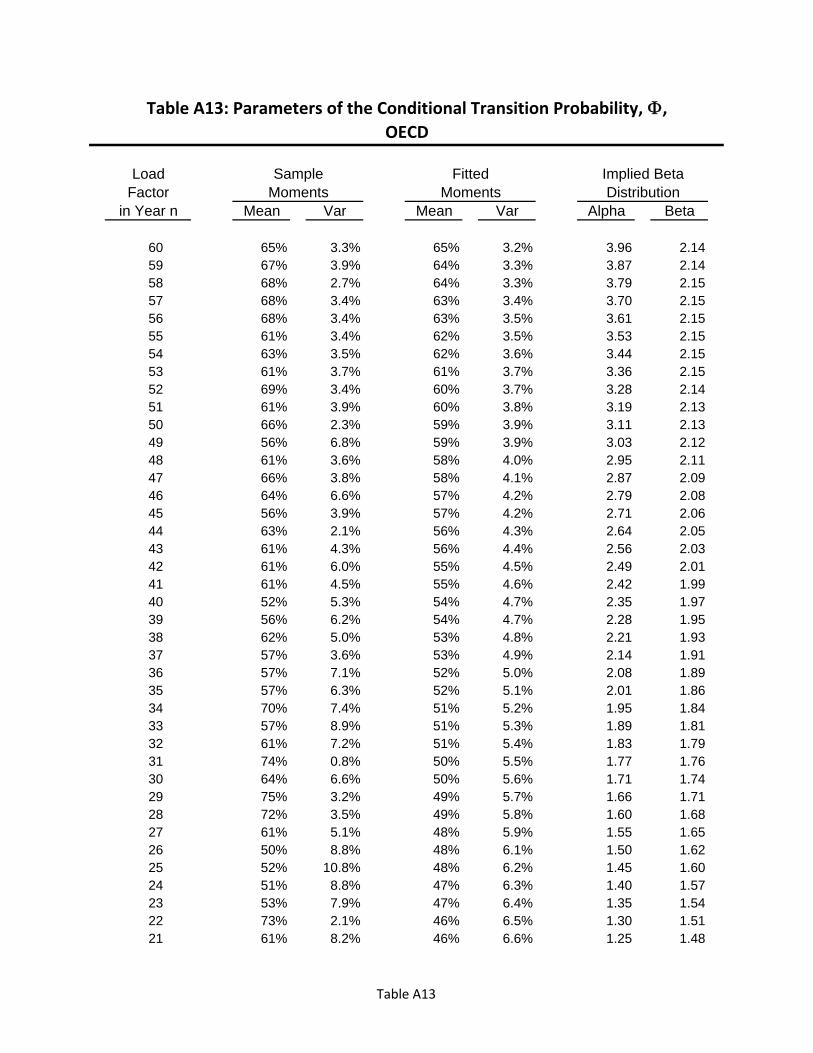
Table A13: Parameters of the Conditional Transition Probability, ,OECD
Load Sample Fitted Implied BetaFactor Moments Moments Distribution
in Year n Mean Var Mean Var Alpha Beta
60 65% 3.3% 65% 3.2% 3.96 2.1459 67% 3.9% 64% 3.3% 3.87 2.1458 68% 2.7% 64% 3.3% 3.79 2.1557 68% 3.4% 63% 3.4% 3.70 2.1556 68% 3.4% 63% 3.5% 3.61 2.1555 61% 3.4% 62% 3.5% 3.53 2.1554 63% 3.5% 62% 3.6% 3.44 2.1553 61% 3.7% 61% 3.7% 3.36 2.1552 69% 3.4% 60% 3.7% 3.28 2.1451 61% 3.9% 60% 3.8% 3.19 2.1350 66% 2.3% 59% 3.9% 3.11 2.1349 56% 6.8% 59% 3.9% 3.03 2.1248 61% 3.6% 58% 4.0% 2.95 2.1147 66% 3.8% 58% 4.1% 2.87 2.0946 64% 6.6% 57% 4.2% 2.79 2.0845 56% 3.9% 57% 4.2% 2.71 2.0644 63% 2.1% 56% 4.3% 2.64 2.0543 61% 4.3% 56% 4.4% 2.56 2.0342 61% 6.0% 55% 4.5% 2.49 2.0141 61% 4.5% 55% 4.6% 2.42 1.9940 52% 5.3% 54% 4.7% 2.35 1.9739 56% 6.2% 54% 4.7% 2.28 1.9538 62% 5.0% 53% 4.8% 2.21 1.9337 57% 3.6% 53% 4.9% 2.14 1.9136 57% 7.1% 52% 5.0% 2.08 1.8935 57% 6.3% 52% 5.1% 2.01 1.8634 70% 7.4% 51% 5.2% 1.95 1.8433 57% 8.9% 51% 5.3% 1.89 1.8132 61% 7.2% 51% 5.4% 1.83 1.7931 74% 0.8% 50% 5.5% 1.77 1.7630 64% 6.6% 50% 5.6% 1.71 1.7429 75% 3.2% 49% 5.7% 1.66 1.7128 72% 3.5% 49% 5.8% 1.60 1.6827 61% 5.1% 48% 5.9% 1.55 1.6526 50% 8.8% 48% 6.1% 1.50 1.6225 52% 10.8% 48% 6.2% 1.45 1.6024 51% 8.8% 47% 6.3% 1.40 1.5723 53% 7.9% 47% 6.4% 1.35 1.5422 73% 2.1% 46% 6.5% 1.30 1.5121 61% 8.2% 46% 6.6% 1.25 1.48
Table A13
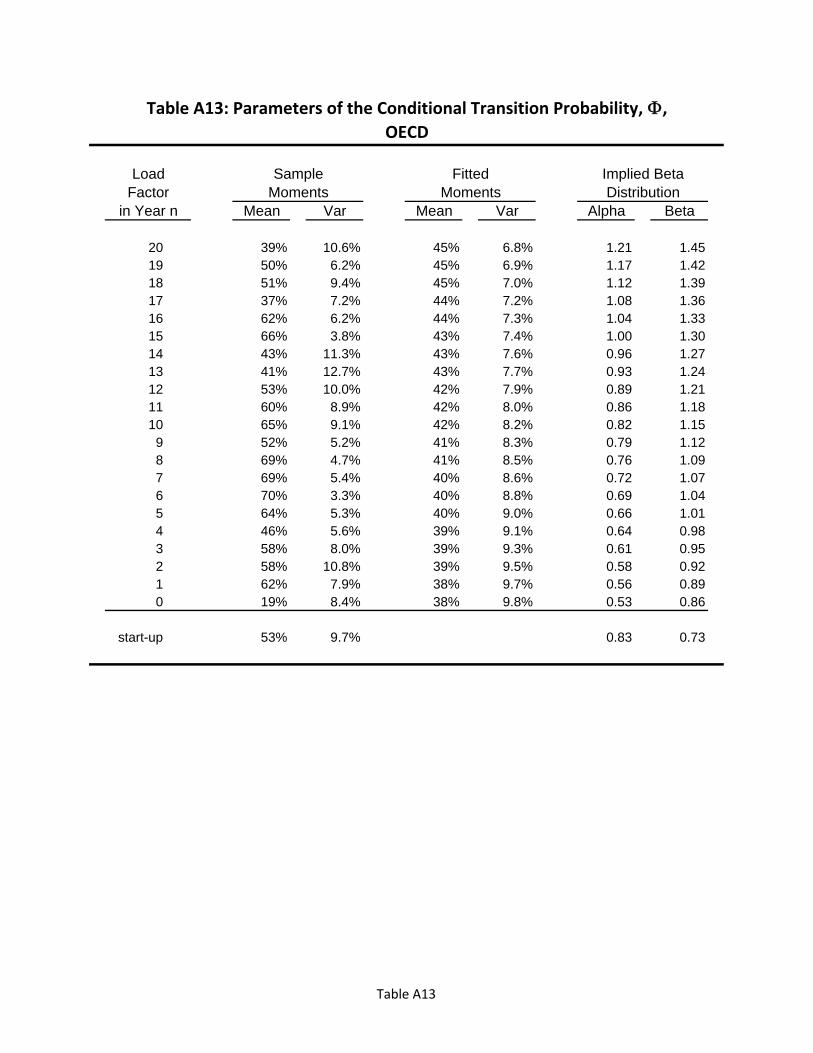
Table A13: Parameters of the Conditional Transition Probability, ,OECD
Load Sample Fitted Implied BetaFactor Moments Moments Distribution
in Year n Mean Var Mean Var Alpha Beta
20 39% 10.6% 45% 6.8% 1.21 1.4519 50% 6.2% 45% 6.9% 1.17 1.4218 51% 9.4% 45% 7.0% 1.12 1.3917 37% 7.2% 44% 7.2% 1.08 1.3616 62% 6.2% 44% 7.3% 1.04 1.3315 66% 3.8% 43% 7.4% 1.00 1.3014 43% 11.3% 43% 7.6% 0.96 1.2713 41% 12.7% 43% 7.7% 0.93 1.2412 53% 10.0% 42% 7.9% 0.89 1.2111 60% 8.9% 42% 8.0% 0.86 1.1810 65% 9.1% 42% 8.2% 0.82 1.159 52% 5.2% 41% 8.3% 0.79 1.128 69% 4.7% 41% 8.5% 0.76 1.097 69% 5.4% 40% 8.6% 0.72 1.076 70% 3.3% 40% 8.8% 0.69 1.045 64% 5.3% 40% 9.0% 0.66 1.014 46% 5.6% 39% 9.1% 0.64 0.983 58% 8.0% 39% 9.3% 0.61 0.952 58% 10.8% 39% 9.5% 0.58 0.921 62% 7.9% 38% 9.7% 0.56 0.890 19% 8.4% 38% 9.8% 0.53 0.86
start-up 53% 9.7% 0.83 0.73
Table A13
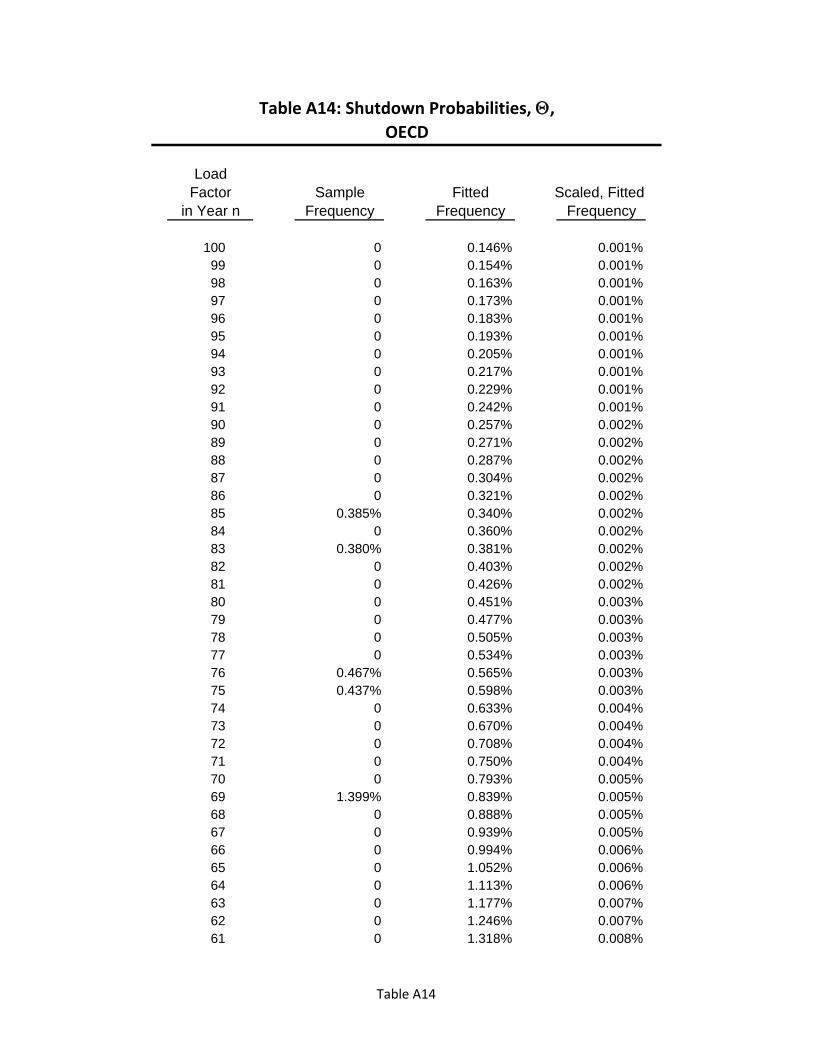
Table A14: Shutdown Probabilities, ,OECD
LoadFactor Sample Fitted Scaled, Fitted
in Year n Frequency Frequency Frequency
100 0 0.146% 0.001%99 0 0.154% 0.001%98 0 0.163% 0.001%97 0 0.173% 0.001%96 0 0.183% 0.001%95 0 0.193% 0.001%94 0 0.205% 0.001%93 0 0.217% 0.001%92 0 0.229% 0.001%91 0 0.242% 0.001%90 0 0.257% 0.002%89 0 0.271% 0.002%88 0 0.287% 0.002%87 0 0.304% 0.002%86 0 0.321% 0.002%85 0.385% 0.340% 0.002%84 0 0.360% 0.002%83 0.380% 0.381% 0.002%82 0 0.403% 0.002%81 0 0.426% 0.002%80 0 0.451% 0.003%79 0 0.477% 0.003%78 0 0.505% 0.003%77 0 0.534% 0.003%76 0.467% 0.565% 0.003%75 0.437% 0.598% 0.003%74 0 0.633% 0.004%73 0 0.670% 0.004%72 0 0.708% 0.004%71 0 0.750% 0.004%70 0 0.793% 0.005%69 1.399% 0.839% 0.005%68 0 0.888% 0.005%67 0 0.939% 0.005%66 0 0.994% 0.006%65 0 1.052% 0.006%64 0 1.113% 0.006%63 0 1.177% 0.007%62 0 1.246% 0.007%61 0 1.318% 0.008%
Table A14
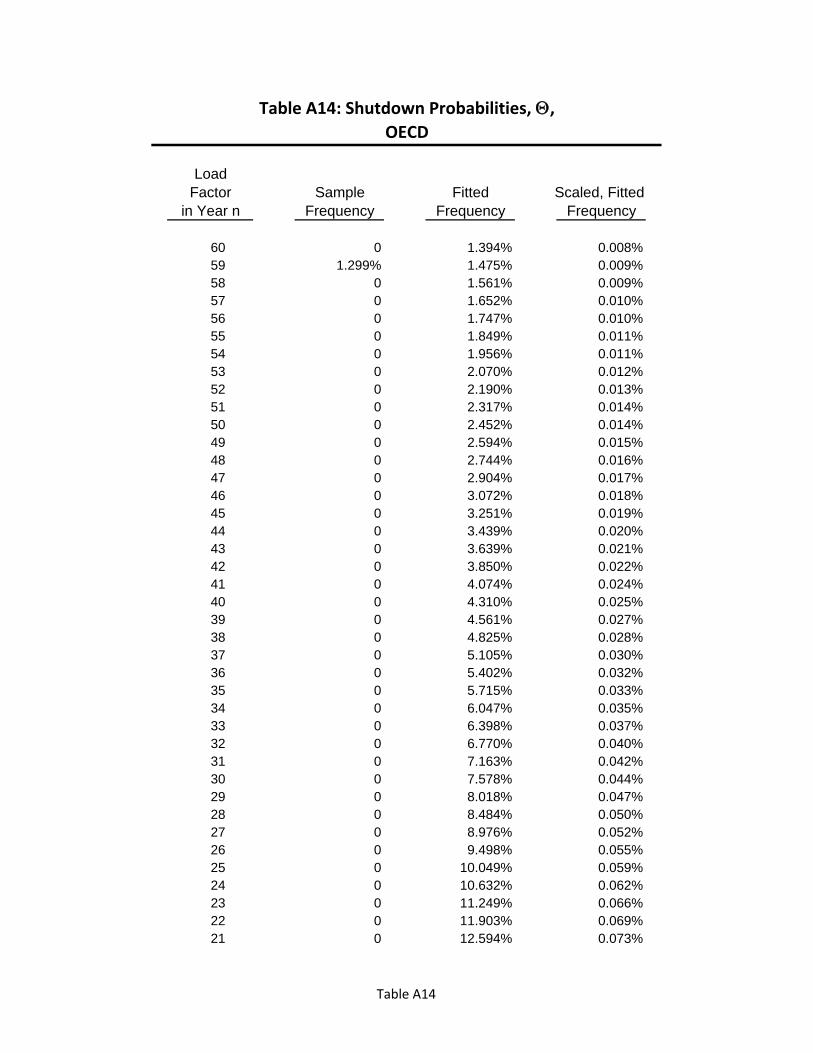
Table A14: Shutdown Probabilities, ,OECD
LoadFactor Sample Fitted Scaled, Fitted
in Year n Frequency Frequency Frequency
60 0 1.394% 0.008%59 1.299% 1.475% 0.009%58 0 1.561% 0.009%57 0 1.652% 0.010%56 0 1.747% 0.010%55 0 1.849% 0.011%54 0 1.956% 0.011%53 0 2.070% 0.012%52 0 2.190% 0.013%51 0 2.317% 0.014%50 0 2.452% 0.014%49 0 2.594% 0.015%48 0 2.744% 0.016%47 0 2.904% 0.017%46 0 3.072% 0.018%45 0 3.251% 0.019%44 0 3.439% 0.020%43 0 3.639% 0.021%42 0 3.850% 0.022%41 0 4.074% 0.024%40 0 4.310% 0.025%39 0 4.561% 0.027%38 0 4.825% 0.028%37 0 5.105% 0.030%36 0 5.402% 0.032%35 0 5.715% 0.033%34 0 6.047% 0.035%33 0 6.398% 0.037%32 0 6.770% 0.040%31 0 7.163% 0.042%30 0 7.578% 0.044%29 0 8.018% 0.047%28 0 8.484% 0.050%27 0 8.976% 0.052%26 0 9.498% 0.055%25 0 10.049% 0.059%24 0 10.632% 0.062%23 0 11.249% 0.066%22 0 11.903% 0.069%21 0 12.594% 0.073%
Table A14
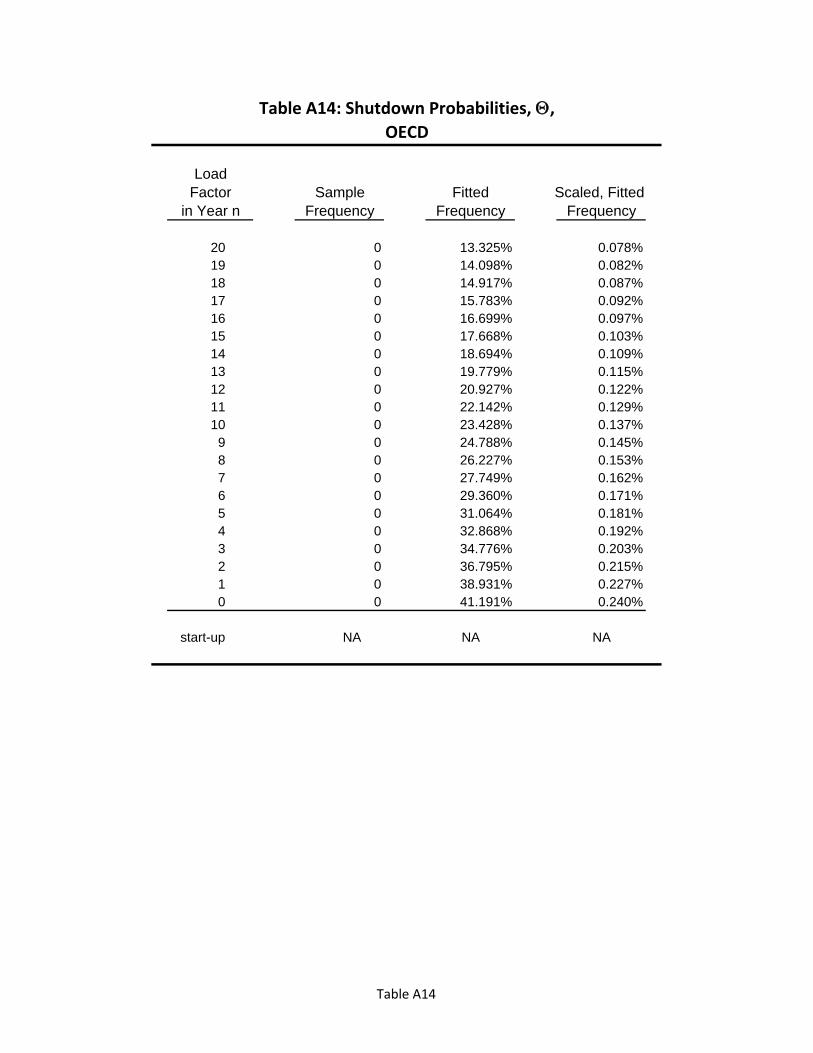
Table A14: Shutdown Probabilities, ,OECD
LoadFactor Sample Fitted Scaled, Fitted
in Year n Frequency Frequency Frequency
20 0 13.325% 0.078%19 0 14.098% 0.082%18 0 14.917% 0.087%17 0 15.783% 0.092%16 0 16.699% 0.097%15 0 17.668% 0.103%14 0 18.694% 0.109%13 0 19.779% 0.115%12 0 20.927% 0.122%11 0 22.142% 0.129%10 0 23.428% 0.137%9 0 24.788% 0.145%8 0 26.227% 0.153%7 0 27.749% 0.162%6 0 29.360% 0.171%5 0 31.064% 0.181%4 0 32.868% 0.192%3 0 34.776% 0.203%2 0 36.795% 0.215%1 0 38.931% 0.227%0 0 41.191% 0.240%
start-up NA NA NA
Table A14

Table A15: Distribution Moments for the Load Factor, Unconditional and Conditional on Continuing Operation, From P,
OECD
Year Conditional onof Unconditional Operation
Operation Mean Var Mean Var
1 54% 9.7% 54% 9.7%2 64% 7.2% 64% 7.2%3 70% 5.8% 70% 5.8%4 73% 5.0% 73% 5.0%5 75% 4.6% 75% 4.6%6 76% 4.4% 76% 4.4%7 76% 4.3% 77% 4.3%8 77% 4.2% 77% 4.2%9 77% 4.2% 77% 4.2%
10 77% 4.2% 77% 4.2%11 77% 4.2% 78% 4.2%12 77% 4.1% 78% 4.2%13 78% 4.1% 78% 4.1%14 78% 4.1% 78% 4.1%15 78% 4.1% 78% 4.1%16 78% 4.1% 78% 4.1%17 78% 4.1% 78% 4.1%18 78% 4.1% 78% 4.1%19 78% 4.1% 78% 4.1%20 78% 4.1% 78% 4.1%21 78% 4.1% 78% 4.1%22 78% 4.1% 78% 4.1%23 78% 4.1% 78% 4.1%24 78% 4.1% 78% 4.1%25 78% 4.1% 78% 4.1%26 78% 4.1% 78% 4.1%27 78% 4.1% 78% 4.1%28 78% 4.1% 78% 4.1%29 77% 4.1% 78% 4.1%30 77% 4.1% 78% 4.1%31 77% 4.1% 78% 4.1%32 77% 4.1% 78% 4.1%33 77% 4.1% 78% 4.1%34 77% 4.1% 78% 4.1%35 77% 4.1% 78% 4.1%36 77% 4.1% 78% 4.1%37 77% 4.1% 78% 4.1%38 77% 4.1% 78% 4.1%39 77% 4.1% 78% 4.1%
Table A15
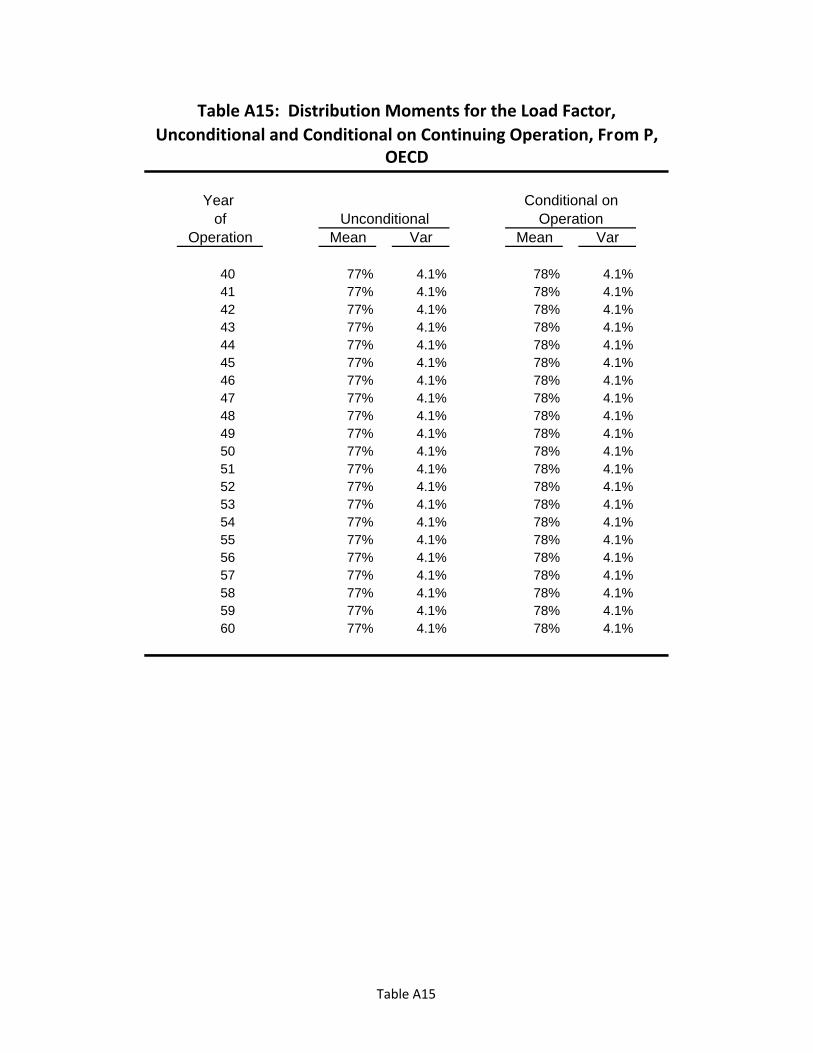
Table A15: Distribution Moments for the Load Factor, Unconditional and Conditional on Continuing Operation, From P,
OECD
Year Conditional onof Unconditional Operation
Operation Mean Var Mean Var
40 77% 4.1% 78% 4.1%41 77% 4.1% 78% 4.1%42 77% 4.1% 78% 4.1%43 77% 4.1% 78% 4.1%44 77% 4.1% 78% 4.1%45 77% 4.1% 78% 4.1%46 77% 4.1% 78% 4.1%47 77% 4.1% 78% 4.1%48 77% 4.1% 78% 4.1%49 77% 4.1% 78% 4.1%50 77% 4.1% 78% 4.1%51 77% 4.1% 78% 4.1%52 77% 4.1% 78% 4.1%53 77% 4.1% 78% 4.1%54 77% 4.1% 78% 4.1%55 77% 4.1% 78% 4.1%56 77% 4.1% 78% 4.1%57 77% 4.1% 78% 4.1%58 77% 4.1% 78% 4.1%59 77% 4.1% 78% 4.1%60 77% 4.1% 78% 4.1%
Table A15
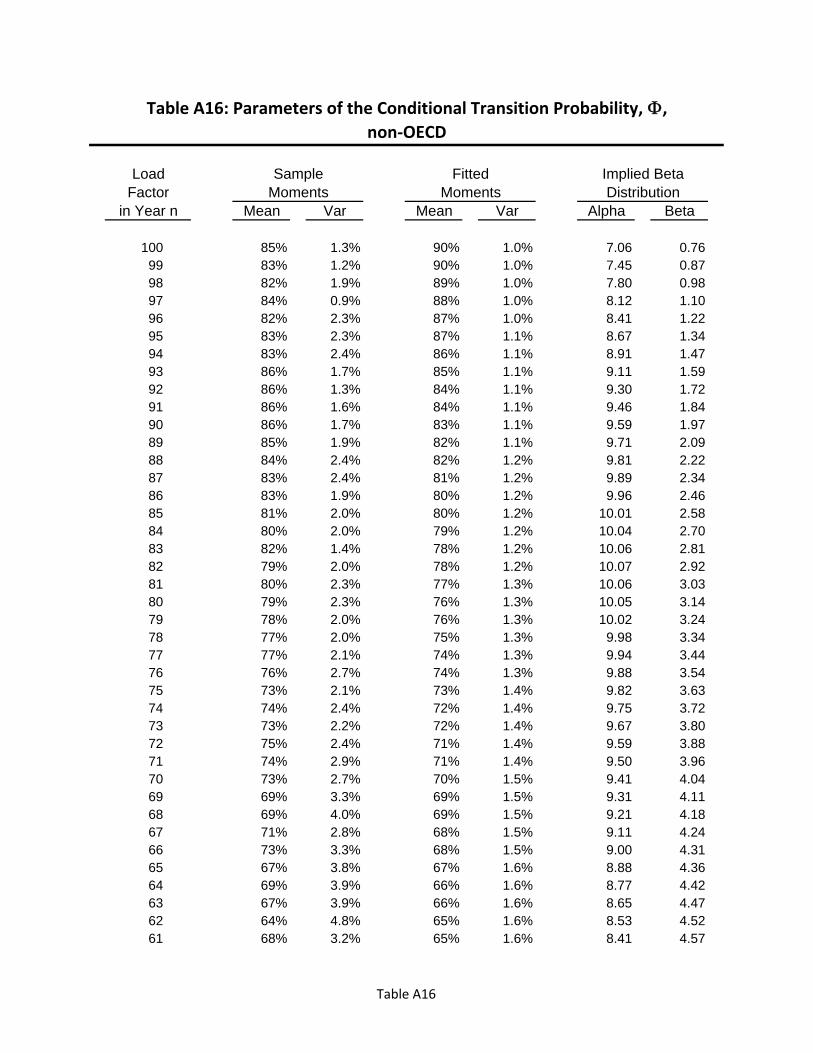
Table A16: Parameters of the Conditional Transition Probability, ,non‐OECD
Load Sample Fitted Implied BetaFactor Moments Moments Distribution
in Year n Mean Var Mean Var Alpha Beta
100 85% 1.3% 90% 1.0% 7.06 0.7699 83% 1.2% 90% 1.0% 7.45 0.8798 82% 1.9% 89% 1.0% 7.80 0.9897 84% 0.9% 88% 1.0% 8.12 1.1096 82% 2.3% 87% 1.0% 8.41 1.2295 83% 2.3% 87% 1.1% 8.67 1.3494 83% 2.4% 86% 1.1% 8.91 1.4793 86% 1.7% 85% 1.1% 9.11 1.5992 86% 1.3% 84% 1.1% 9.30 1.7291 86% 1.6% 84% 1.1% 9.46 1.8490 86% 1.7% 83% 1.1% 9.59 1.9789 85% 1.9% 82% 1.1% 9.71 2.0988 84% 2.4% 82% 1.2% 9.81 2.2287 83% 2.4% 81% 1.2% 9.89 2.3486 83% 1.9% 80% 1.2% 9.96 2.4685 81% 2.0% 80% 1.2% 10.01 2.5884 80% 2.0% 79% 1.2% 10.04 2.7083 82% 1.4% 78% 1.2% 10.06 2.8182 79% 2.0% 78% 1.2% 10.07 2.9281 80% 2.3% 77% 1.3% 10.06 3.0380 79% 2.3% 76% 1.3% 10.05 3.1479 78% 2.0% 76% 1.3% 10.02 3.2478 77% 2.0% 75% 1.3% 9.98 3.3477 77% 2.1% 74% 1.3% 9.94 3.4476 76% 2.7% 74% 1.3% 9.88 3.5475 73% 2.1% 73% 1.4% 9.82 3.6374 74% 2.4% 72% 1.4% 9.75 3.7273 73% 2.2% 72% 1.4% 9.67 3.8072 75% 2.4% 71% 1.4% 9.59 3.8871 74% 2.9% 71% 1.4% 9.50 3.9670 73% 2.7% 70% 1.5% 9.41 4.0469 69% 3.3% 69% 1.5% 9.31 4.1168 69% 4.0% 69% 1.5% 9.21 4.1867 71% 2.8% 68% 1.5% 9.11 4.2466 73% 3.3% 68% 1.5% 9.00 4.3165 67% 3.8% 67% 1.6% 8.88 4.3664 69% 3.9% 66% 1.6% 8.77 4.4263 67% 3.9% 66% 1.6% 8.65 4.4762 64% 4.8% 65% 1.6% 8.53 4.5261 68% 3.2% 65% 1.6% 8.41 4.57
Table A16

Table A16: Parameters of the Conditional Transition Probability, ,non‐OECD
Load Sample Fitted Implied BetaFactor Moments Moments Distribution
in Year n Mean Var Mean Var Alpha Beta
60 65% 3.3% 64% 1.7% 8.28 4.6159 67% 3.9% 64% 1.7% 8.16 4.6558 68% 2.7% 63% 1.7% 8.03 4.6857 68% 3.4% 63% 1.7% 7.91 4.7156 68% 3.4% 62% 1.7% 7.78 4.7455 61% 3.4% 62% 1.8% 7.65 4.7754 63% 3.5% 61% 1.8% 7.52 4.8053 61% 3.7% 61% 1.8% 7.39 4.8252 69% 3.4% 60% 1.8% 7.26 4.8351 61% 3.9% 60% 1.9% 7.13 4.8550 66% 2.3% 59% 1.9% 7.00 4.8649 56% 6.8% 59% 1.9% 6.87 4.8748 61% 3.6% 58% 1.9% 6.75 4.8847 66% 3.8% 58% 2.0% 6.62 4.8946 64% 6.6% 57% 2.0% 6.49 4.8945 56% 3.9% 57% 2.0% 6.37 4.8944 63% 2.1% 56% 2.0% 6.24 4.8943 61% 4.3% 56% 2.1% 6.12 4.8942 61% 6.0% 55% 2.1% 5.99 4.8841 61% 4.5% 55% 2.1% 5.87 4.8740 52% 5.3% 54% 2.1% 5.75 4.8639 56% 6.2% 54% 2.2% 5.63 4.8538 62% 5.0% 53% 2.2% 5.51 4.8437 57% 3.6% 53% 2.2% 5.40 4.8236 57% 7.1% 52% 2.3% 5.28 4.8035 57% 6.3% 52% 2.3% 5.17 4.7834 70% 7.4% 51% 2.3% 5.06 4.7633 57% 8.9% 51% 2.3% 4.95 4.7432 61% 7.2% 51% 2.4% 4.84 4.7231 74% 0.8% 50% 2.4% 4.73 4.6930 64% 6.6% 50% 2.4% 4.62 4.6629 75% 3.2% 49% 2.5% 4.52 4.6428 72% 3.5% 49% 2.5% 4.41 4.6127 61% 5.1% 49% 2.5% 4.31 4.5826 50% 8.8% 48% 2.6% 4.21 4.5425 52% 10.8% 48% 2.6% 4.11 4.5124 51% 8.8% 47% 2.6% 4.02 4.4823 53% 7.9% 47% 2.7% 3.92 4.4422 73% 2.1% 46% 2.7% 3.83 4.4121 61% 8.2% 46% 2.7% 3.74 4.37
Table A16

Table A16: Parameters of the Conditional Transition Probability, ,non‐OECD
Load Sample Fitted Implied BetaFactor Moments Moments Distribution
in Year n Mean Var Mean Var Alpha Beta
20 39% 10.6% 46% 2.8% 3.65 4.3319 50% 6.2% 45% 2.8% 3.56 4.2918 51% 9.4% 45% 2.8% 3.47 4.2517 37% 7.2% 45% 2.9% 3.39 4.2116 62% 6.2% 44% 2.9% 3.30 4.1715 66% 3.8% 44% 2.9% 3.22 4.1314 43% 11.3% 43% 3.0% 3.14 4.0913 41% 12.7% 43% 3.0% 3.06 4.0512 53% 10.0% 43% 3.1% 2.98 4.0111 60% 8.9% 42% 3.1% 2.91 3.9610 65% 9.1% 42% 3.1% 2.83 3.929 52% 5.2% 42% 3.2% 2.76 3.878 69% 4.7% 41% 3.2% 2.69 3.837 69% 5.4% 41% 3.3% 2.62 3.786 70% 3.3% 41% 3.3% 2.55 3.745 64% 5.3% 40% 3.4% 2.48 3.694 46% 5.6% 40% 3.4% 2.42 3.653 58% 8.0% 40% 3.4% 2.35 3.602 58% 10.8% 39% 3.5% 2.29 3.551 62% 7.9% 39% 3.5% 2.23 3.510 19% 8.4% 39% 3.6% 2.17 3.46
start-up 53% 9.7% 0.83 0.73
Table A16
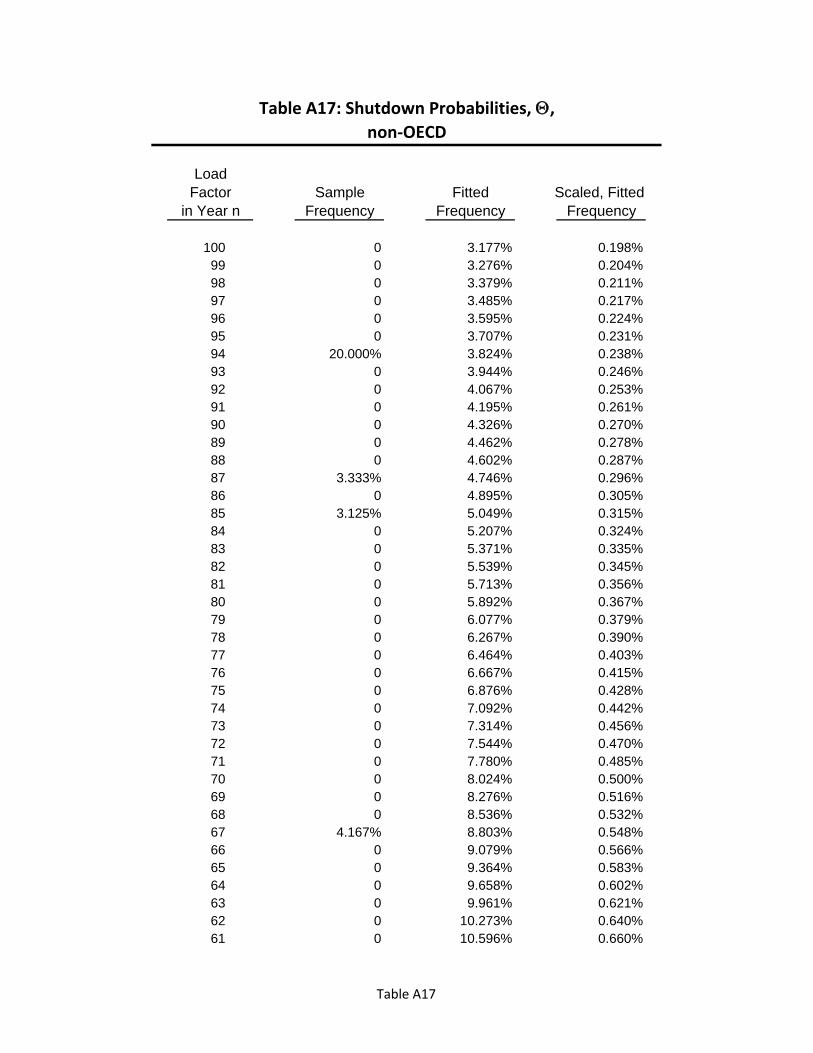
Table A17: Shutdown Probabilities, ,non‐OECD
LoadFactor Sample Fitted Scaled, Fitted
in Year n Frequency Frequency Frequency
100 0 3.177% 0.198%99 0 3.276% 0.204%98 0 3.379% 0.211%97 0 3.485% 0.217%96 0 3.595% 0.224%95 0 3.707% 0.231%94 20.000% 3.824% 0.238%93 0 3.944% 0.246%92 0 4.067% 0.253%91 0 4.195% 0.261%90 0 4.326% 0.270%89 0 4.462% 0.278%88 0 4.602% 0.287%87 3.333% 4.746% 0.296%86 0 4.895% 0.305%85 3.125% 5.049% 0.315%84 0 5.207% 0.324%83 0 5.371% 0.335%82 0 5.539% 0.345%81 0 5.713% 0.356%80 0 5.892% 0.367%79 0 6.077% 0.379%78 0 6.267% 0.390%77 0 6.464% 0.403%76 0 6.667% 0.415%75 0 6.876% 0.428%74 0 7.092% 0.442%73 0 7.314% 0.456%72 0 7.544% 0.470%71 0 7.780% 0.485%70 0 8.024% 0.500%69 0 8.276% 0.516%68 0 8.536% 0.532%67 4.167% 8.803% 0.548%66 0 9.079% 0.566%65 0 9.364% 0.583%64 0 9.658% 0.602%63 0 9.961% 0.621%62 0 10.273% 0.640%61 0 10.596% 0.660%
Table A17
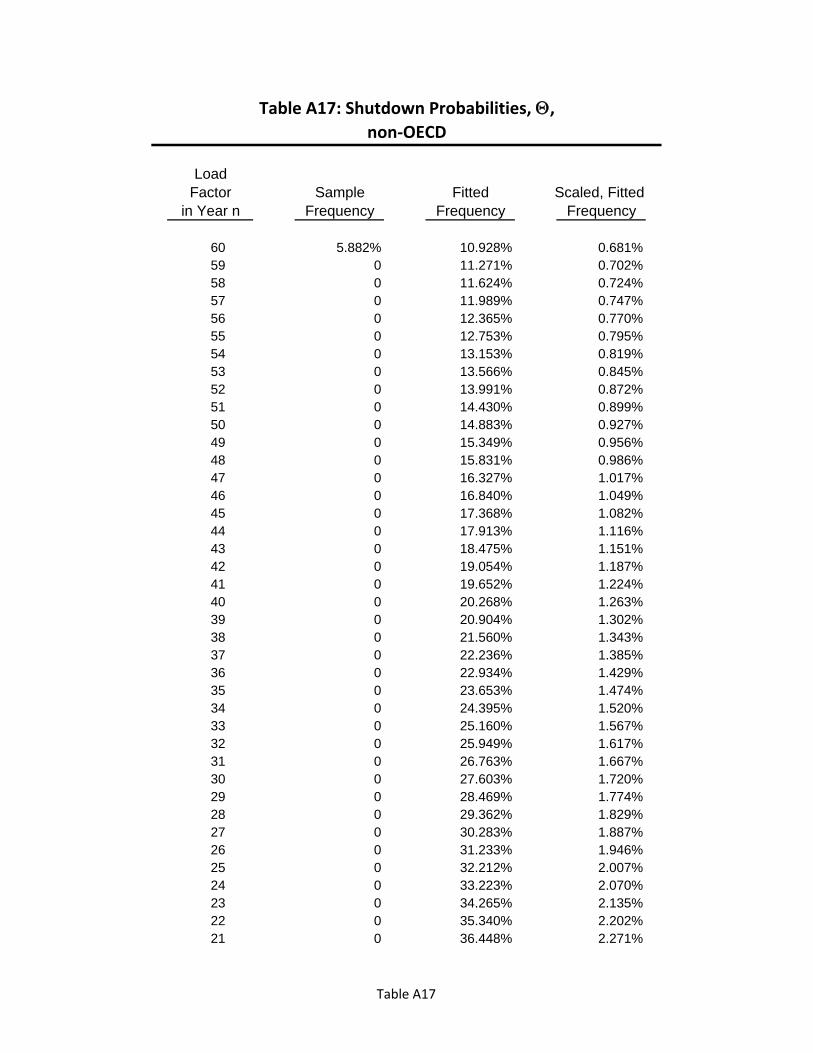
Table A17: Shutdown Probabilities, ,non‐OECD
LoadFactor Sample Fitted Scaled, Fitted
in Year n Frequency Frequency Frequency
60 5.882% 10.928% 0.681%59 0 11.271% 0.702%58 0 11.624% 0.724%57 0 11.989% 0.747%56 0 12.365% 0.770%55 0 12.753% 0.795%54 0 13.153% 0.819%53 0 13.566% 0.845%52 0 13.991% 0.872%51 0 14.430% 0.899%50 0 14.883% 0.927%49 0 15.349% 0.956%48 0 15.831% 0.986%47 0 16.327% 1.017%46 0 16.840% 1.049%45 0 17.368% 1.082%44 0 17.913% 1.116%43 0 18.475% 1.151%42 0 19.054% 1.187%41 0 19.652% 1.224%40 0 20.268% 1.263%39 0 20.904% 1.302%38 0 21.560% 1.343%37 0 22.236% 1.385%36 0 22.934% 1.429%35 0 23.653% 1.474%34 0 24.395% 1.520%33 0 25.160% 1.567%32 0 25.949% 1.617%31 0 26.763% 1.667%30 0 27.603% 1.720%29 0 28.469% 1.774%28 0 29.362% 1.829%27 0 30.283% 1.887%26 0 31.233% 1.946%25 0 32.212% 2.007%24 0 33.223% 2.070%23 0 34.265% 2.135%22 0 35.340% 2.202%21 0 36.448% 2.271%
Table A17

Table A17: Shutdown Probabilities, ,non‐OECD
LoadFactor Sample Fitted Scaled, Fitted
in Year n Frequency Frequency Frequency
20 0 37.592% 2.342%19 0 38.771% 2.415%18 0 39.987% 2.491%17 0 41.241% 2.569%16 0 42.535% 2.650%15 0 43.869% 2.733%14 0 45.245% 2.819%13 0 46.665% 2.907%12 0 48.128% 2.998%11 0 49.638% 3.092%10 0 51.195% 3.189%9 0 52.801% 3.290%8 0 54.457% 3.393%7 0 56.166% 3.499%6 100.000% 57.927% 3.609%5 0 59.745% 3.722%4 0 61.619% 3.839%3 0 63.551% 3.959%2 0 65.545% 4.083%1 0 67.601% 4.212%0 0 69.722% 4.344%
start-up NA NA NA
Notes:
Sample moments correspond to the Transition Matrix shown in Table 4.
Fitted moment values are based on the regression results shown in Table 6. The regression fits the l
log variance. The fitted log values are then translated back into percentage levels.
Beta Distribution Parameters are calculated by the method of moments using these equations:
Mean = alpha / (alpha+beta),
Variance = (alpha*beta) / [(alpha+beta)^2 * (alpha+beta+1)].
Table A17
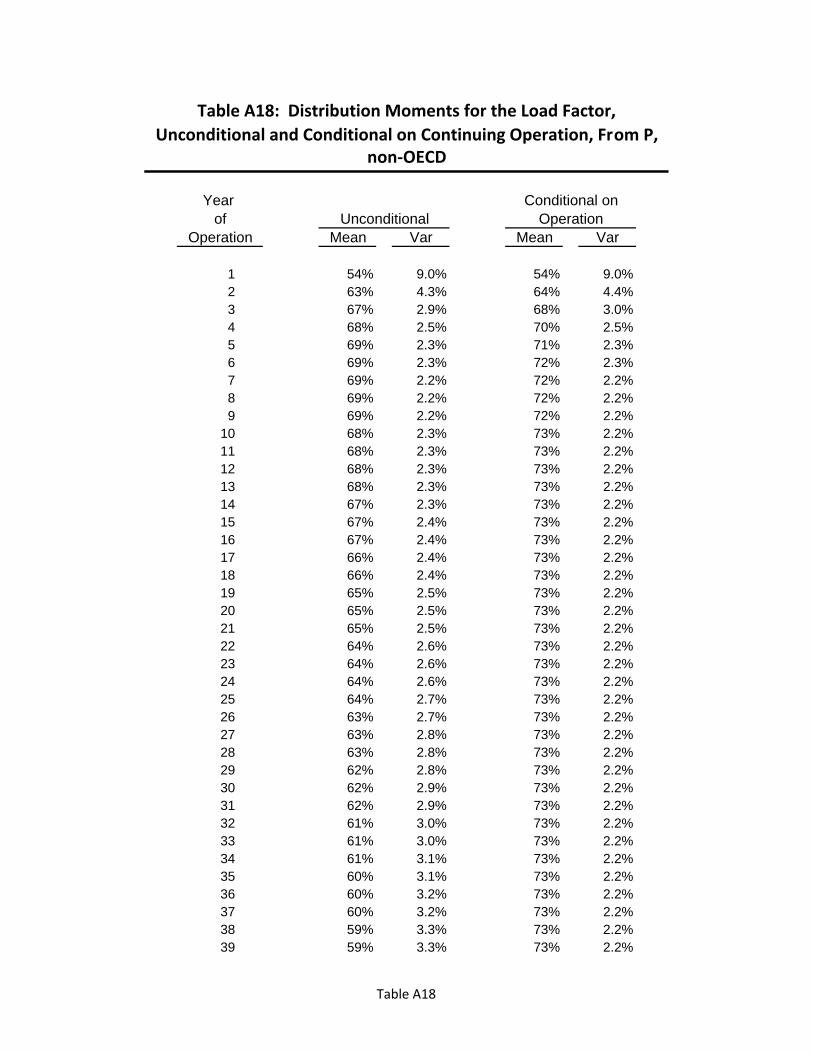
Table A18: Distribution Moments for the Load Factor, Unconditional and Conditional on Continuing Operation, From P,
non‐OECD
Year Conditional onof Unconditional Operation
Operation Mean Var Mean Var
1 54% 9.0% 54% 9.0%2 63% 4.3% 64% 4.4%3 67% 2.9% 68% 3.0%4 68% 2.5% 70% 2.5%5 69% 2.3% 71% 2.3%6 69% 2.3% 72% 2.3%7 69% 2.2% 72% 2.2%8 69% 2.2% 72% 2.2%9 69% 2.2% 72% 2.2%
10 68% 2.3% 73% 2.2%11 68% 2.3% 73% 2.2%12 68% 2.3% 73% 2.2%13 68% 2.3% 73% 2.2%14 67% 2.3% 73% 2.2%15 67% 2.4% 73% 2.2%16 67% 2.4% 73% 2.2%17 66% 2.4% 73% 2.2%18 66% 2.4% 73% 2.2%19 65% 2.5% 73% 2.2%20 65% 2.5% 73% 2.2%21 65% 2.5% 73% 2.2%22 64% 2.6% 73% 2.2%23 64% 2.6% 73% 2.2%24 64% 2.6% 73% 2.2%25 64% 2.7% 73% 2.2%26 63% 2.7% 73% 2.2%27 63% 2.8% 73% 2.2%28 63% 2.8% 73% 2.2%29 62% 2.8% 73% 2.2%30 62% 2.9% 73% 2.2%31 62% 2.9% 73% 2.2%32 61% 3.0% 73% 2.2%33 61% 3.0% 73% 2.2%34 61% 3.1% 73% 2.2%35 60% 3.1% 73% 2.2%36 60% 3.2% 73% 2.2%37 60% 3.2% 73% 2.2%38 59% 3.3% 73% 2.2%39 59% 3.3% 73% 2.2%
Table A18

Table A18: Distribution Moments for the Load Factor, Unconditional and Conditional on Continuing Operation, From P,
non‐OECD
Year Conditional onof Unconditional Operation
Operation Mean Var Mean Var
40 59% 3.4% 73% 2.2%41 58% 3.4% 73% 2.2%42 58% 3.5% 73% 2.2%43 58% 3.5% 73% 2.2%44 58% 3.6% 73% 2.2%45 57% 3.6% 73% 2.2%46 57% 3.7% 73% 2.2%47 57% 3.7% 73% 2.2%48 56% 3.8% 73% 2.2%49 56% 3.8% 73% 2.2%50 56% 3.9% 73% 2.2%51 56% 3.9% 73% 2.2%52 55% 4.0% 73% 2.2%53 55% 4.0% 73% 2.2%54 55% 4.1% 73% 2.2%55 54% 4.2% 73% 2.2%56 54% 4.2% 73% 2.2%57 54% 4.3% 73% 2.2%58 54% 4.3% 73% 2.2%59 53% 4.4% 73% 2.2%60 53% 4.4% 73% 2.2%
Table A18

Table A19: Parameters of the Conditional Transition Probability, ,US, pre‐2000
Load Sample Fitted Implied BetaFactor Moments Moments Distribution
in Year n Mean Var Mean Var Alpha Beta
100 82% 1.2% 85% 2.3% 3.74 0.6499 81% 0.5% 85% 2.3% 3.83 0.6998 83% 0.2% 84% 2.4% 3.90 0.7397 77% 0.7% 84% 2.4% 3.97 0.7896 73% 2.1% 83% 2.4% 4.03 0.8295 74% 2.7% 82% 2.4% 4.08 0.8794 70% 3.7% 82% 2.5% 4.13 0.9293 75% 2.5% 81% 2.5% 4.17 0.9692 79% 1.6% 81% 2.5% 4.21 1.0191 77% 3.4% 80% 2.5% 4.24 1.0590 76% 3.4% 80% 2.6% 4.27 1.1089 84% 1.9% 79% 2.6% 4.29 1.1488 76% 4.0% 78% 2.6% 4.31 1.1887 73% 5.9% 78% 2.6% 4.32 1.2286 79% 3.6% 77% 2.7% 4.33 1.2785 77% 4.3% 77% 2.7% 4.33 1.3184 77% 3.8% 76% 2.7% 4.33 1.3583 84% 1.7% 76% 2.7% 4.33 1.3982 76% 3.7% 75% 2.8% 4.33 1.4381 77% 4.5% 75% 2.8% 4.32 1.4680 75% 5.0% 74% 2.8% 4.31 1.5079 74% 4.0% 74% 2.8% 4.29 1.5478 77% 2.5% 73% 2.9% 4.28 1.5777 80% 2.8% 73% 2.9% 4.26 1.6176 75% 3.0% 72% 2.9% 4.24 1.6475 71% 2.7% 72% 3.0% 4.21 1.6774 69% 3.7% 71% 3.0% 4.19 1.7073 72% 2.5% 71% 3.0% 4.16 1.7372 75% 3.4% 70% 3.0% 4.13 1.7671 73% 4.0% 70% 3.1% 4.10 1.7970 70% 2.6% 69% 3.1% 4.07 1.8269 65% 3.4% 69% 3.1% 4.03 1.8468 67% 3.7% 68% 3.2% 4.00 1.8767 67% 4.3% 68% 3.2% 3.96 1.8966 69% 3.7% 67% 3.2% 3.92 1.9165 65% 2.8% 67% 3.3% 3.88 1.9464 65% 4.1% 66% 3.3% 3.84 1.9663 65% 3.7% 66% 3.3% 3.80 1.9862 64% 3.1% 65% 3.4% 3.76 2.0061 68% 4.5% 65% 3.4% 3.72 2.01
Table A19
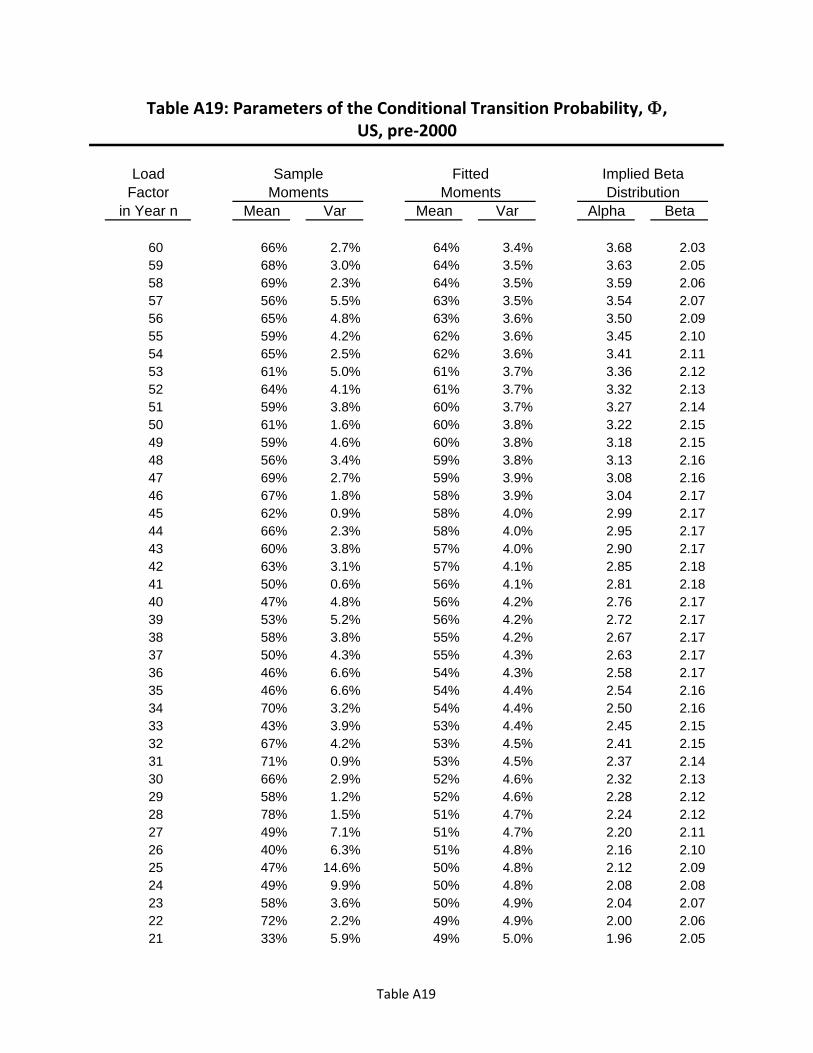
Table A19: Parameters of the Conditional Transition Probability, ,US, pre‐2000
Load Sample Fitted Implied BetaFactor Moments Moments Distribution
in Year n Mean Var Mean Var Alpha Beta
60 66% 2.7% 64% 3.4% 3.68 2.0359 68% 3.0% 64% 3.5% 3.63 2.0558 69% 2.3% 64% 3.5% 3.59 2.0657 56% 5.5% 63% 3.5% 3.54 2.0756 65% 4.8% 63% 3.6% 3.50 2.0955 59% 4.2% 62% 3.6% 3.45 2.1054 65% 2.5% 62% 3.6% 3.41 2.1153 61% 5.0% 61% 3.7% 3.36 2.1252 64% 4.1% 61% 3.7% 3.32 2.1351 59% 3.8% 60% 3.7% 3.27 2.1450 61% 1.6% 60% 3.8% 3.22 2.1549 59% 4.6% 60% 3.8% 3.18 2.1548 56% 3.4% 59% 3.8% 3.13 2.1647 69% 2.7% 59% 3.9% 3.08 2.1646 67% 1.8% 58% 3.9% 3.04 2.1745 62% 0.9% 58% 4.0% 2.99 2.1744 66% 2.3% 58% 4.0% 2.95 2.1743 60% 3.8% 57% 4.0% 2.90 2.1742 63% 3.1% 57% 4.1% 2.85 2.1841 50% 0.6% 56% 4.1% 2.81 2.1840 47% 4.8% 56% 4.2% 2.76 2.1739 53% 5.2% 56% 4.2% 2.72 2.1738 58% 3.8% 55% 4.2% 2.67 2.1737 50% 4.3% 55% 4.3% 2.63 2.1736 46% 6.6% 54% 4.3% 2.58 2.1735 46% 6.6% 54% 4.4% 2.54 2.1634 70% 3.2% 54% 4.4% 2.50 2.1633 43% 3.9% 53% 4.4% 2.45 2.1532 67% 4.2% 53% 4.5% 2.41 2.1531 71% 0.9% 53% 4.5% 2.37 2.1430 66% 2.9% 52% 4.6% 2.32 2.1329 58% 1.2% 52% 4.6% 2.28 2.1228 78% 1.5% 51% 4.7% 2.24 2.1227 49% 7.1% 51% 4.7% 2.20 2.1126 40% 6.3% 51% 4.8% 2.16 2.1025 47% 14.6% 50% 4.8% 2.12 2.0924 49% 9.9% 50% 4.8% 2.08 2.0823 58% 3.6% 50% 4.9% 2.04 2.0722 72% 2.2% 49% 4.9% 2.00 2.0621 33% 5.9% 49% 5.0% 1.96 2.05
Table A19
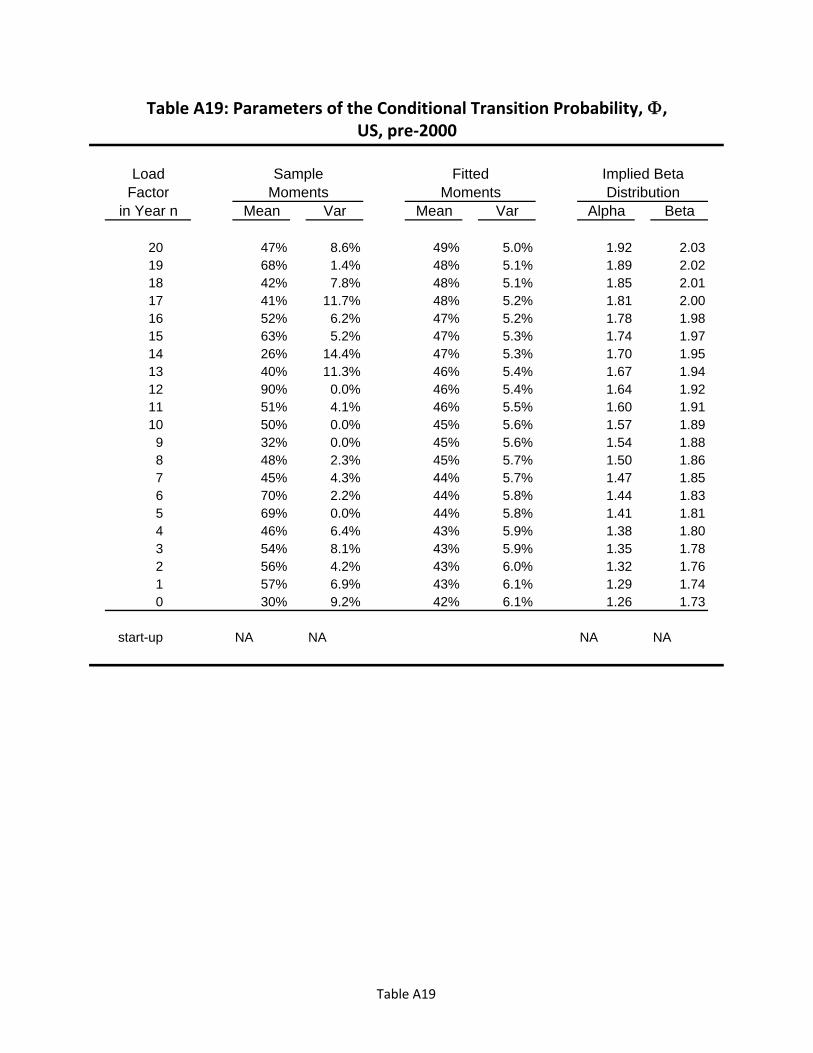
Table A19: Parameters of the Conditional Transition Probability, ,US, pre‐2000
Load Sample Fitted Implied BetaFactor Moments Moments Distribution
in Year n Mean Var Mean Var Alpha Beta
20 47% 8.6% 49% 5.0% 1.92 2.0319 68% 1.4% 48% 5.1% 1.89 2.0218 42% 7.8% 48% 5.1% 1.85 2.0117 41% 11.7% 48% 5.2% 1.81 2.0016 52% 6.2% 47% 5.2% 1.78 1.9815 63% 5.2% 47% 5.3% 1.74 1.9714 26% 14.4% 47% 5.3% 1.70 1.9513 40% 11.3% 46% 5.4% 1.67 1.9412 90% 0.0% 46% 5.4% 1.64 1.9211 51% 4.1% 46% 5.5% 1.60 1.9110 50% 0.0% 45% 5.6% 1.57 1.899 32% 0.0% 45% 5.6% 1.54 1.888 48% 2.3% 45% 5.7% 1.50 1.867 45% 4.3% 44% 5.7% 1.47 1.856 70% 2.2% 44% 5.8% 1.44 1.835 69% 0.0% 44% 5.8% 1.41 1.814 46% 6.4% 43% 5.9% 1.38 1.803 54% 8.1% 43% 5.9% 1.35 1.782 56% 4.2% 43% 6.0% 1.32 1.761 57% 6.9% 43% 6.1% 1.29 1.740 30% 9.2% 42% 6.1% 1.26 1.73
start-up NA NA NA NA
Table A19

Table A20: Distribution Moments for the Load Factor, Unconditional and Conditional on Continuing Operation, From P,
US, pre‐2000
Year Conditional onof Unconditional Operation
Operation Mean Var Mean Var
1 54% 9.6%2 64% 5.6%3 68% 4.5%4 69% 4.2%5 70% 4.1%6 70% 4.1%7 70% 4.1%8 71% 4.1%9 71% 4.1%
10 71% 4.0%11 71% 4.0%12 71% 4.0%13 71% 4.0%14 71% 4.0%15 71% 4.0%16 71% 4.0%17 71% 4.0%18 71% 4.0%19 71% 4.0%20 71% 4.0%21 71% 4.0%22 71% 4.0%23 71% 4.0%24 71% 4.0%25 71% 4.0%26 71% 4.0%27 71% 4.0%28 71% 4.0%29 71% 4.0%30 71% 4.0%31 71% 4.0%32 71% 4.0%33 71% 4.0%34 71% 4.0%35 71% 4.0%36 71% 4.0%37 71% 4.0%38 71% 4.0%39 71% 4.0%
Table A20

Table A20: Distribution Moments for the Load Factor, Unconditional and Conditional on Continuing Operation, From P,
US, pre‐2000
Year Conditional onof Unconditional Operation
Operation Mean Var Mean Var
40 71% 4.0%41 71% 4.0%42 71% 4.0%43 71% 4.0%44 71% 4.0%45 71% 4.0%46 71% 4.0%47 71% 4.0%48 71% 4.0%49 71% 4.0%50 71% 4.0%51 71% 4.0%52 71% 4.0%53 71% 4.0%54 71% 4.0%55 71% 4.0%56 71% 4.0%57 71% 4.0%58 71% 4.0%59 71% 4.0%60 71% 4.0%
Notes:
Unconditional values not calculated due to lack of any permanent shutdowns during
the relevant period.
Distribution in Year 1 are based on start-up parameters for the OECD as a whole, i.e. from
Table 13.
Table A20
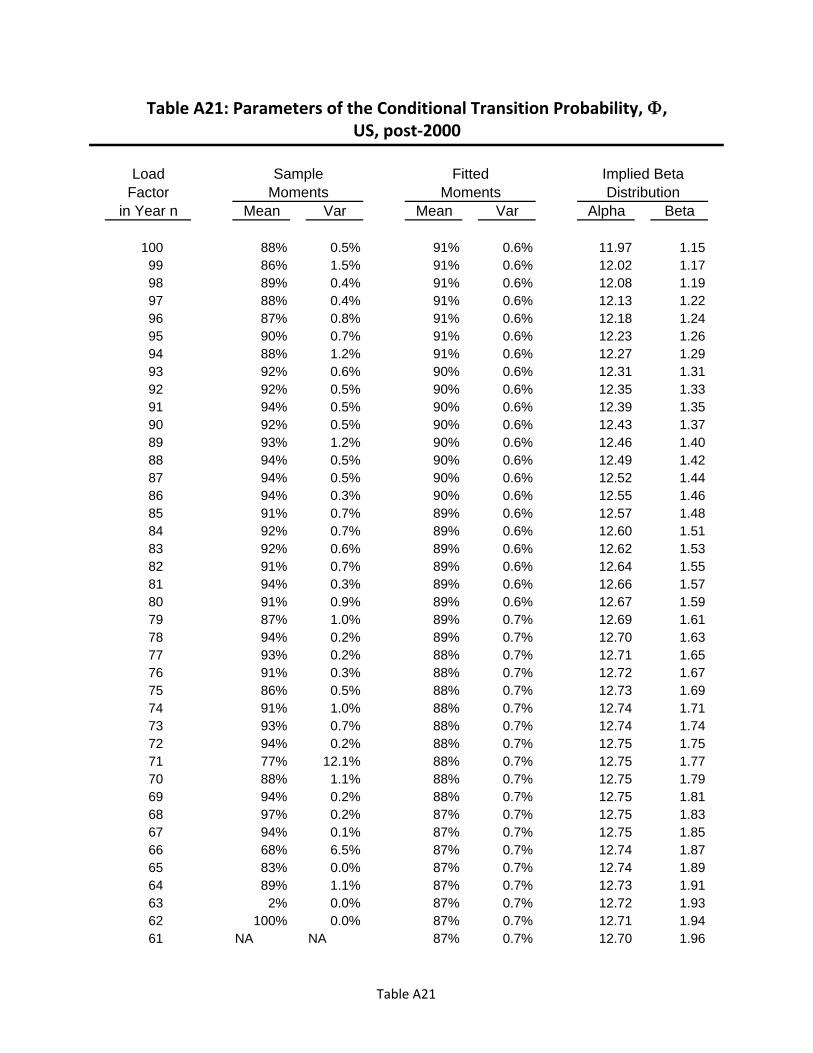
Table A21: Parameters of the Conditional Transition Probability, ,US, post‐2000
Load Sample Fitted Implied BetaFactor Moments Moments Distribution
in Year n Mean Var Mean Var Alpha Beta
100 88% 0.5% 91% 0.6% 11.97 1.1599 86% 1.5% 91% 0.6% 12.02 1.1798 89% 0.4% 91% 0.6% 12.08 1.1997 88% 0.4% 91% 0.6% 12.13 1.2296 87% 0.8% 91% 0.6% 12.18 1.2495 90% 0.7% 91% 0.6% 12.23 1.2694 88% 1.2% 91% 0.6% 12.27 1.2993 92% 0.6% 90% 0.6% 12.31 1.3192 92% 0.5% 90% 0.6% 12.35 1.3391 94% 0.5% 90% 0.6% 12.39 1.3590 92% 0.5% 90% 0.6% 12.43 1.3789 93% 1.2% 90% 0.6% 12.46 1.4088 94% 0.5% 90% 0.6% 12.49 1.4287 94% 0.5% 90% 0.6% 12.52 1.4486 94% 0.3% 90% 0.6% 12.55 1.4685 91% 0.7% 89% 0.6% 12.57 1.4884 92% 0.7% 89% 0.6% 12.60 1.5183 92% 0.6% 89% 0.6% 12.62 1.5382 91% 0.7% 89% 0.6% 12.64 1.5581 94% 0.3% 89% 0.6% 12.66 1.5780 91% 0.9% 89% 0.6% 12.67 1.5979 87% 1.0% 89% 0.7% 12.69 1.6178 94% 0.2% 89% 0.7% 12.70 1.6377 93% 0.2% 88% 0.7% 12.71 1.6576 91% 0.3% 88% 0.7% 12.72 1.6775 86% 0.5% 88% 0.7% 12.73 1.6974 91% 1.0% 88% 0.7% 12.74 1.7173 93% 0.7% 88% 0.7% 12.74 1.7472 94% 0.2% 88% 0.7% 12.75 1.7571 77% 12.1% 88% 0.7% 12.75 1.7770 88% 1.1% 88% 0.7% 12.75 1.7969 94% 0.2% 88% 0.7% 12.75 1.8168 97% 0.2% 87% 0.7% 12.75 1.8367 94% 0.1% 87% 0.7% 12.75 1.8566 68% 6.5% 87% 0.7% 12.74 1.8765 83% 0.0% 87% 0.7% 12.74 1.8964 89% 1.1% 87% 0.7% 12.73 1.9163 2% 0.0% 87% 0.7% 12.72 1.9362 100% 0.0% 87% 0.7% 12.71 1.9461 NA NA 87% 0.7% 12.70 1.96
Table A21

Table A21: Parameters of the Conditional Transition Probability, ,US, post‐2000
Load Sample Fitted Implied BetaFactor Moments Moments Distribution
in Year n Mean Var Mean Var Alpha Beta
60 88% 1.6% 87% 0.7% 12.69 1.9859 NA NA 86% 0.8% 12.68 2.0058 NA NA 86% 0.8% 12.66 2.0157 NA NA 86% 0.8% 12.65 2.0356 NA NA 86% 0.8% 12.63 2.0555 NA NA 86% 0.8% 12.61 2.0754 NA NA 86% 0.8% 12.60 2.0853 NA NA 86% 0.8% 12.58 2.1052 NA NA 86% 0.8% 12.56 2.1151 85% 0.0% 85% 0.8% 12.53 2.1350 NA NA 85% 0.8% 12.51 2.1549 NA NA 85% 0.8% 12.49 2.1648 NA NA 85% 0.8% 12.47 2.1847 NA NA 85% 0.8% 12.44 2.1946 NA NA 85% 0.8% 12.41 2.2145 NA NA 85% 0.8% 12.39 2.2244 NA NA 85% 0.8% 12.36 2.2443 NA NA 85% 0.8% 12.33 2.2542 77% 0.0% 84% 0.8% 12.30 2.2741 NA NA 84% 0.8% 12.27 2.2840 NA NA 84% 0.9% 12.24 2.2939 NA NA 84% 0.9% 12.21 2.3138 NA NA 84% 0.9% 12.18 2.3237 NA NA 84% 0.9% 12.15 2.3336 99% 0.0% 84% 0.9% 12.12 2.3535 NA NA 84% 0.9% 12.08 2.3634 NA NA 84% 0.9% 12.05 2.3733 NA NA 83% 0.9% 12.01 2.3832 NA NA 83% 0.9% 11.98 2.4031 NA NA 83% 0.9% 11.94 2.4130 NA NA 83% 0.9% 11.91 2.4229 NA NA 83% 0.9% 11.87 2.4328 NA NA 83% 0.9% 11.83 2.4427 NA NA 83% 0.9% 11.79 2.4526 NA NA 83% 0.9% 11.75 2.4625 NA NA 83% 0.9% 11.71 2.4824 NA NA 82% 1.0% 11.67 2.4923 NA NA 82% 1.0% 11.63 2.5022 NA NA 82% 1.0% 11.59 2.5121 NA NA 82% 1.0% 11.55 2.52
Table A21
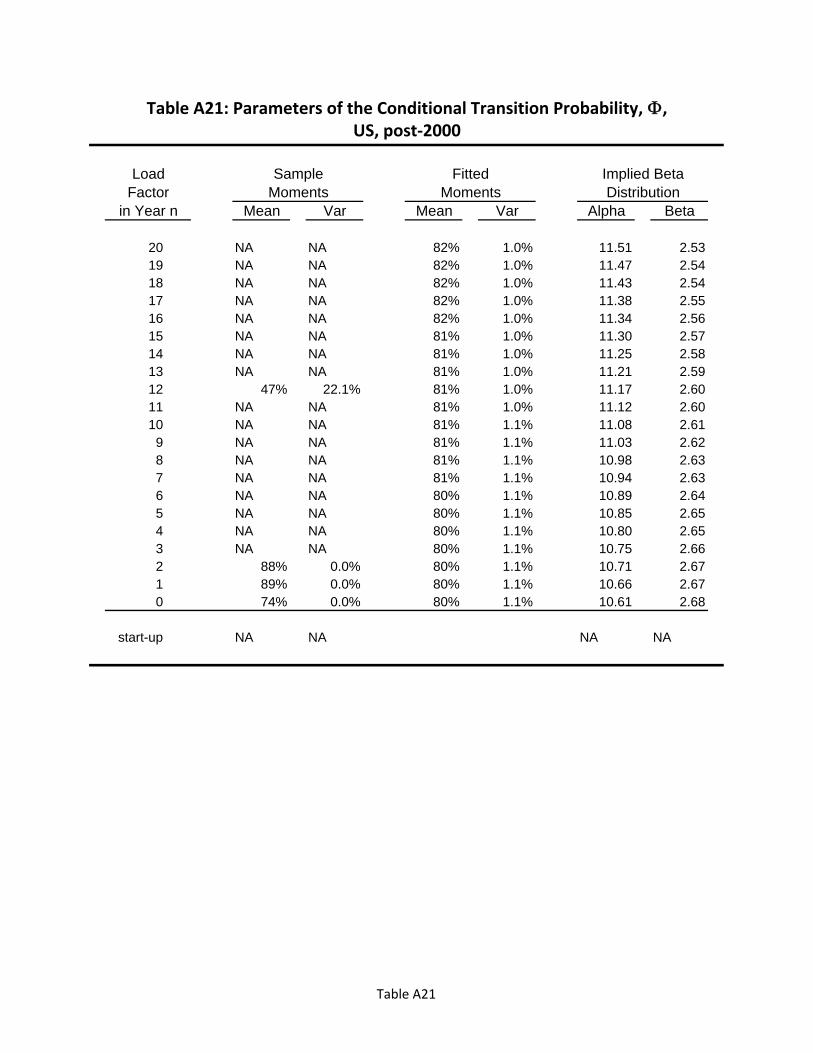
Table A21: Parameters of the Conditional Transition Probability, ,US, post‐2000
Load Sample Fitted Implied BetaFactor Moments Moments Distribution
in Year n Mean Var Mean Var Alpha Beta
20 NA NA 82% 1.0% 11.51 2.5319 NA NA 82% 1.0% 11.47 2.5418 NA NA 82% 1.0% 11.43 2.5417 NA NA 82% 1.0% 11.38 2.5516 NA NA 82% 1.0% 11.34 2.5615 NA NA 81% 1.0% 11.30 2.5714 NA NA 81% 1.0% 11.25 2.5813 NA NA 81% 1.0% 11.21 2.5912 47% 22.1% 81% 1.0% 11.17 2.6011 NA NA 81% 1.0% 11.12 2.6010 NA NA 81% 1.1% 11.08 2.619 NA NA 81% 1.1% 11.03 2.628 NA NA 81% 1.1% 10.98 2.637 NA NA 81% 1.1% 10.94 2.636 NA NA 80% 1.1% 10.89 2.645 NA NA 80% 1.1% 10.85 2.654 NA NA 80% 1.1% 10.80 2.653 NA NA 80% 1.1% 10.75 2.662 88% 0.0% 80% 1.1% 10.71 2.671 89% 0.0% 80% 1.1% 10.66 2.670 74% 0.0% 80% 1.1% 10.61 2.68
start-up NA NA NA NA
Table A21

Table A22: Distribution Moments for the Load Factor, Unconditional and Conditional on Continuing Operation, From P,
US, post‐2000
Year Conditional onof Unconditional Operation
Operation Mean Var Mean Var
1 54% 9.6%2 86% 0.9%3 90% 0.6%4 91% 0.6%5 91% 0.6%6 91% 0.6%7 91% 0.6%8 91% 0.6%9 91% 0.6%
10 91% 0.6%11 91% 0.6%12 91% 0.6%13 91% 0.6%14 91% 0.6%15 91% 0.6%16 91% 0.6%17 91% 0.6%18 91% 0.6%19 91% 0.6%20 91% 0.6%21 91% 0.6%22 91% 0.6%23 91% 0.6%24 91% 0.6%25 91% 0.6%26 91% 0.6%27 91% 0.6%28 91% 0.6%29 91% 0.6%30 91% 0.6%31 91% 0.6%32 91% 0.6%33 91% 0.6%34 91% 0.6%35 91% 0.6%36 91% 0.6%37 91% 0.6%38 91% 0.6%39 91% 0.6%
Table A22

Table A22: Distribution Moments for the Load Factor, Unconditional and Conditional on Continuing Operation, From P,
US, post‐2000
Year Conditional onof Unconditional Operation
Operation Mean Var Mean Var
40 91% 0.6%41 91% 0.6%42 91% 0.6%43 91% 0.6%44 91% 0.6%45 91% 0.6%46 91% 0.6%47 91% 0.6%48 91% 0.6%49 91% 0.6%50 91% 0.6%51 91% 0.6%52 91% 0.6%53 91% 0.6%54 91% 0.6%55 91% 0.6%56 91% 0.6%57 91% 0.6%58 91% 0.6%59 91% 0.6%60 91% 0.6%
Notes:
Unconditional values not calculated due to lack of any permanent shutdowns during
the relevant period.
Distribution in Year 1 are based on start-up parameters for the OECD as a whole, i.e. from
Table 13.
Table A22
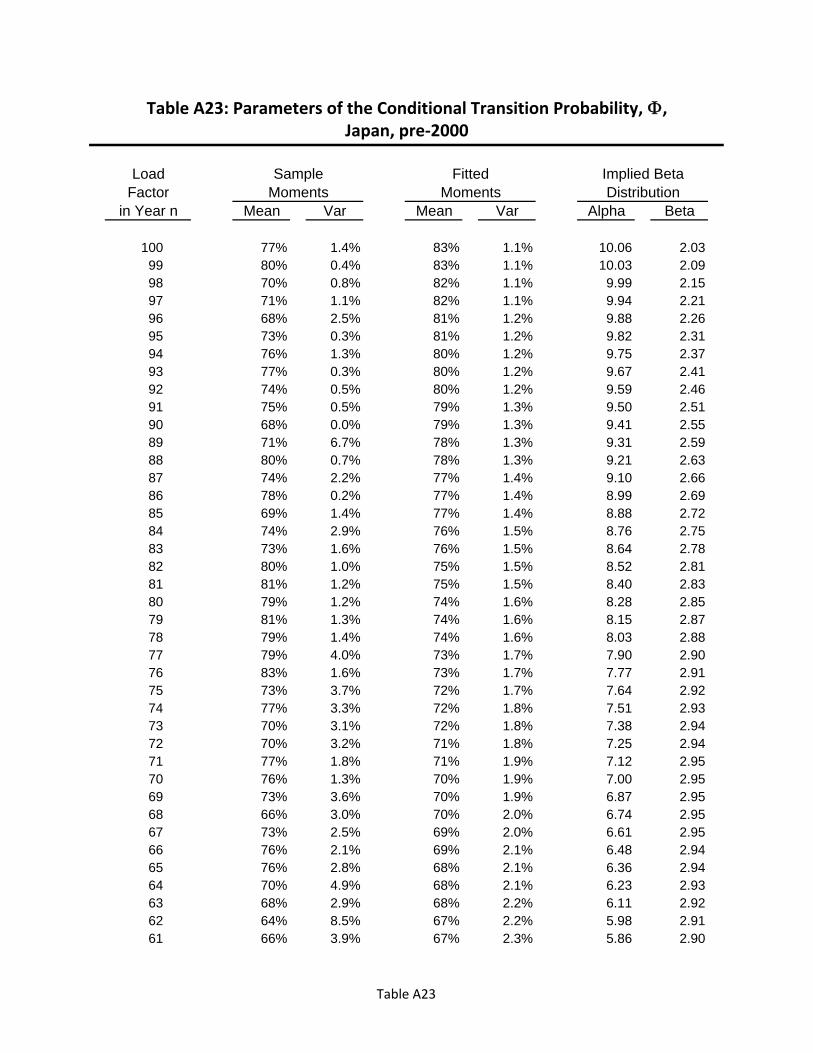
Table A23: Parameters of the Conditional Transition Probability, ,Japan, pre‐2000
Load Sample Fitted Implied BetaFactor Moments Moments Distribution
in Year n Mean Var Mean Var Alpha Beta
100 77% 1.4% 83% 1.1% 10.06 2.0399 80% 0.4% 83% 1.1% 10.03 2.0998 70% 0.8% 82% 1.1% 9.99 2.1597 71% 1.1% 82% 1.1% 9.94 2.2196 68% 2.5% 81% 1.2% 9.88 2.2695 73% 0.3% 81% 1.2% 9.82 2.3194 76% 1.3% 80% 1.2% 9.75 2.3793 77% 0.3% 80% 1.2% 9.67 2.4192 74% 0.5% 80% 1.2% 9.59 2.4691 75% 0.5% 79% 1.3% 9.50 2.5190 68% 0.0% 79% 1.3% 9.41 2.5589 71% 6.7% 78% 1.3% 9.31 2.5988 80% 0.7% 78% 1.3% 9.21 2.6387 74% 2.2% 77% 1.4% 9.10 2.6686 78% 0.2% 77% 1.4% 8.99 2.6985 69% 1.4% 77% 1.4% 8.88 2.7284 74% 2.9% 76% 1.5% 8.76 2.7583 73% 1.6% 76% 1.5% 8.64 2.7882 80% 1.0% 75% 1.5% 8.52 2.8181 81% 1.2% 75% 1.5% 8.40 2.8380 79% 1.2% 74% 1.6% 8.28 2.8579 81% 1.3% 74% 1.6% 8.15 2.8778 79% 1.4% 74% 1.6% 8.03 2.8877 79% 4.0% 73% 1.7% 7.90 2.9076 83% 1.6% 73% 1.7% 7.77 2.9175 73% 3.7% 72% 1.7% 7.64 2.9274 77% 3.3% 72% 1.8% 7.51 2.9373 70% 3.1% 72% 1.8% 7.38 2.9472 70% 3.2% 71% 1.8% 7.25 2.9471 77% 1.8% 71% 1.9% 7.12 2.9570 76% 1.3% 70% 1.9% 7.00 2.9569 73% 3.6% 70% 1.9% 6.87 2.9568 66% 3.0% 70% 2.0% 6.74 2.9567 73% 2.5% 69% 2.0% 6.61 2.9566 76% 2.1% 69% 2.1% 6.48 2.9465 76% 2.8% 68% 2.1% 6.36 2.9464 70% 4.9% 68% 2.1% 6.23 2.9363 68% 2.9% 68% 2.2% 6.11 2.9262 64% 8.5% 67% 2.2% 5.98 2.9161 66% 3.9% 67% 2.3% 5.86 2.90
Table A23

Table A23: Parameters of the Conditional Transition Probability, ,Japan, pre‐2000
Load Sample Fitted Implied BetaFactor Moments Moments Distribution
in Year n Mean Var Mean Var Alpha Beta
60 68% 3.3% 67% 2.3% 5.74 2.8959 61% 5.4% 66% 2.4% 5.62 2.8858 63% 3.0% 66% 2.4% 5.50 2.8657 71% 0.6% 65% 2.5% 5.38 2.8556 75% 0.4% 65% 2.5% 5.27 2.8355 57% 1.4% 65% 2.5% 5.15 2.8254 65% 2.6% 64% 2.6% 5.04 2.8053 66% 0.0% 64% 2.6% 4.93 2.7852 91% 0.8% 64% 2.7% 4.82 2.7651 75% 1.9% 63% 2.8% 4.71 2.7450 62% 2.3% 63% 2.8% 4.60 2.7249 50% 7.9% 63% 2.9% 4.49 2.6948 64% 0.4% 62% 2.9% 4.39 2.6747 62% 2.2% 62% 3.0% 4.29 2.6546 42% 7.1% 61% 3.0% 4.19 2.6245 47% 0.0% 61% 3.1% 4.09 2.6044 55% 2.4% 61% 3.2% 3.99 2.5743 57% 0.6% 60% 3.2% 3.89 2.5542 2% 0.0% 60% 3.3% 3.80 2.5241 65% 0.7% 60% 3.3% 3.70 2.4940 33% 5.6% 59% 3.4% 3.61 2.4639 63% 5.2% 59% 3.5% 3.52 2.4438 65% 0.0% 59% 3.5% 3.44 2.4137 53% 0.9% 58% 3.6% 3.35 2.3836 62% 2.2% 58% 3.7% 3.26 2.3535 84% 1.5% 58% 3.8% 3.18 2.3234 97% 0.0% 57% 3.8% 3.10 2.2933 61% 9.6% 57% 3.9% 3.02 2.2632 56% 9.2% 57% 4.0% 2.94 2.2331 NA NA 57% 4.1% 2.86 2.2030 84% 1.8% 56% 4.1% 2.79 2.1729 95% 0.0% 56% 4.2% 2.71 2.1428 71% 1.0% 56% 4.3% 2.64 2.1127 55% 0.0% 55% 4.4% 2.57 2.0826 NA NA 55% 4.5% 2.50 2.0525 33% 0.0% 55% 4.6% 2.43 2.0124 67% 5.2% 54% 4.6% 2.36 1.9823 72% 7.8% 54% 4.7% 2.30 1.9522 54% 0.0% 54% 4.8% 2.23 1.9221 73% 0.0% 53% 4.9% 2.17 1.89
Table A23
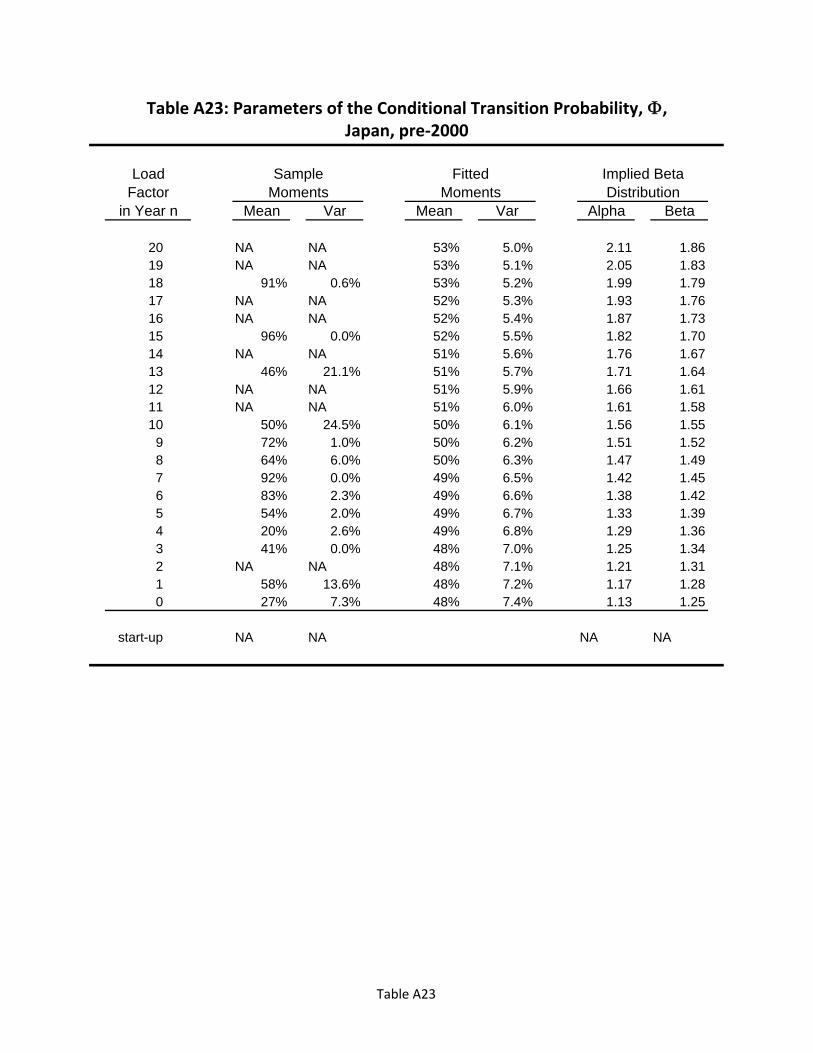
Table A23: Parameters of the Conditional Transition Probability, ,Japan, pre‐2000
Load Sample Fitted Implied BetaFactor Moments Moments Distribution
in Year n Mean Var Mean Var Alpha Beta
20 NA NA 53% 5.0% 2.11 1.8619 NA NA 53% 5.1% 2.05 1.8318 91% 0.6% 53% 5.2% 1.99 1.7917 NA NA 52% 5.3% 1.93 1.7616 NA NA 52% 5.4% 1.87 1.7315 96% 0.0% 52% 5.5% 1.82 1.7014 NA NA 51% 5.6% 1.76 1.6713 46% 21.1% 51% 5.7% 1.71 1.6412 NA NA 51% 5.9% 1.66 1.6111 NA NA 51% 6.0% 1.61 1.5810 50% 24.5% 50% 6.1% 1.56 1.559 72% 1.0% 50% 6.2% 1.51 1.528 64% 6.0% 50% 6.3% 1.47 1.497 92% 0.0% 49% 6.5% 1.42 1.456 83% 2.3% 49% 6.6% 1.38 1.425 54% 2.0% 49% 6.7% 1.33 1.394 20% 2.6% 49% 6.8% 1.29 1.363 41% 0.0% 48% 7.0% 1.25 1.342 NA NA 48% 7.1% 1.21 1.311 58% 13.6% 48% 7.2% 1.17 1.280 27% 7.3% 48% 7.4% 1.13 1.25
start-up NA NA NA NA
Table A23

Table A24: Distribution Moments for the Load Factor, Unconditional and Conditional on Continuing Operation, From P,
Japan, pre‐2000
Year Conditional onof Unconditional Operation
Operation Mean Var Mean Var
1 54% 9.6%2 66% 4.3%3 70% 2.9%4 71% 2.5%5 72% 2.3%6 72% 2.3%7 72% 2.3%8 72% 2.3%9 72% 2.3%
10 72% 2.3%11 72% 2.3%12 72% 2.3%13 72% 2.3%14 72% 2.3%15 72% 2.3%16 72% 2.3%17 72% 2.3%18 72% 2.3%19 72% 2.3%20 72% 2.3%21 72% 2.3%22 72% 2.3%23 72% 2.3%24 72% 2.3%25 72% 2.3%26 72% 2.3%27 72% 2.3%28 72% 2.3%29 72% 2.3%30 72% 2.3%31 72% 2.3%32 72% 2.3%33 72% 2.3%34 72% 2.3%35 72% 2.3%36 72% 2.3%37 72% 2.3%38 72% 2.3%39 72% 2.3%
Table A24
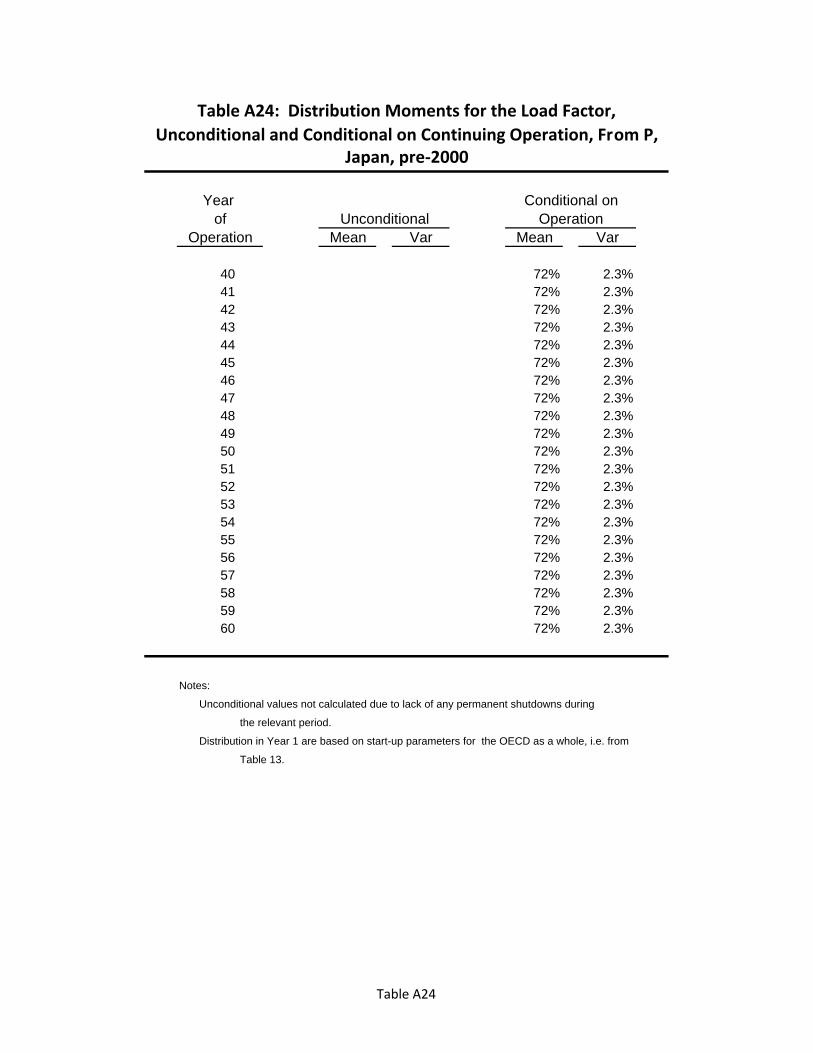
Table A24: Distribution Moments for the Load Factor, Unconditional and Conditional on Continuing Operation, From P,
Japan, pre‐2000
Year Conditional onof Unconditional Operation
Operation Mean Var Mean Var
40 72% 2.3%41 72% 2.3%42 72% 2.3%43 72% 2.3%44 72% 2.3%45 72% 2.3%46 72% 2.3%47 72% 2.3%48 72% 2.3%49 72% 2.3%50 72% 2.3%51 72% 2.3%52 72% 2.3%53 72% 2.3%54 72% 2.3%55 72% 2.3%56 72% 2.3%57 72% 2.3%58 72% 2.3%59 72% 2.3%60 72% 2.3%
Notes:
Unconditional values not calculated due to lack of any permanent shutdowns during
the relevant period.
Distribution in Year 1 are based on start-up parameters for the OECD as a whole, i.e. from
Table 13.
Table A24
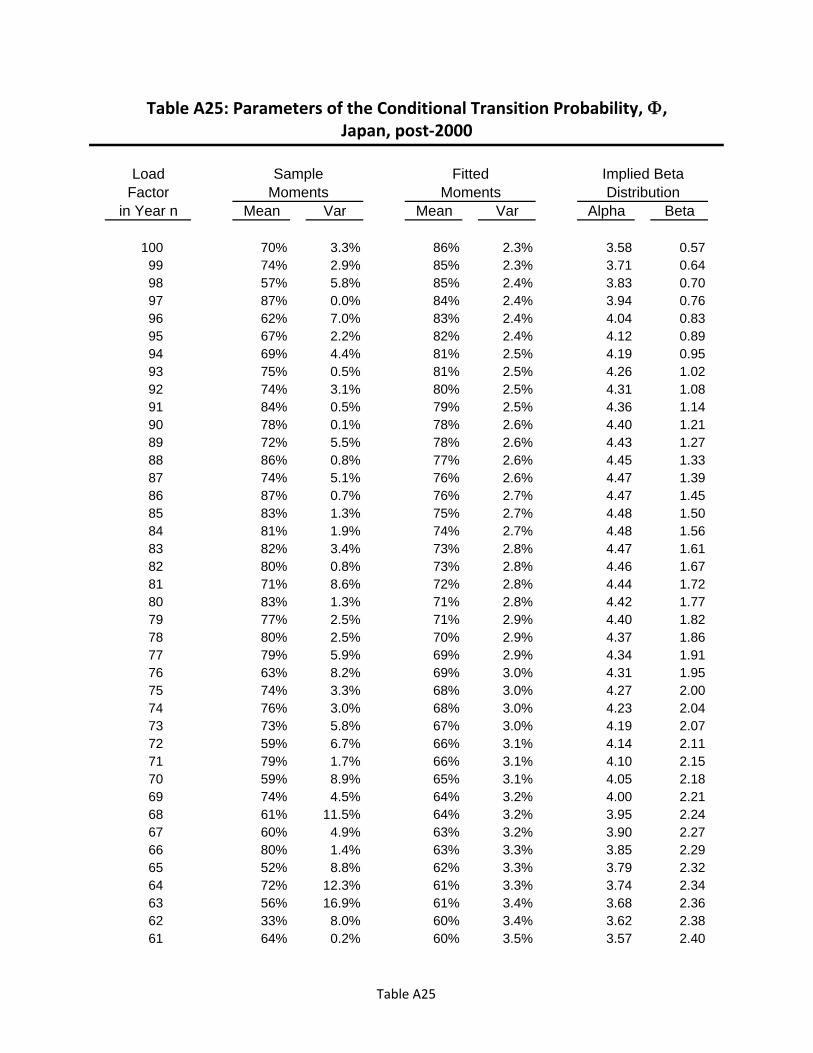
Table A25: Parameters of the Conditional Transition Probability, ,Japan, post‐2000
Load Sample Fitted Implied BetaFactor Moments Moments Distribution
in Year n Mean Var Mean Var Alpha Beta
100 70% 3.3% 86% 2.3% 3.58 0.5799 74% 2.9% 85% 2.3% 3.71 0.6498 57% 5.8% 85% 2.4% 3.83 0.7097 87% 0.0% 84% 2.4% 3.94 0.7696 62% 7.0% 83% 2.4% 4.04 0.8395 67% 2.2% 82% 2.4% 4.12 0.8994 69% 4.4% 81% 2.5% 4.19 0.9593 75% 0.5% 81% 2.5% 4.26 1.0292 74% 3.1% 80% 2.5% 4.31 1.0891 84% 0.5% 79% 2.5% 4.36 1.1490 78% 0.1% 78% 2.6% 4.40 1.2189 72% 5.5% 78% 2.6% 4.43 1.2788 86% 0.8% 77% 2.6% 4.45 1.3387 74% 5.1% 76% 2.6% 4.47 1.3986 87% 0.7% 76% 2.7% 4.47 1.4585 83% 1.3% 75% 2.7% 4.48 1.5084 81% 1.9% 74% 2.7% 4.48 1.5683 82% 3.4% 73% 2.8% 4.47 1.6182 80% 0.8% 73% 2.8% 4.46 1.6781 71% 8.6% 72% 2.8% 4.44 1.7280 83% 1.3% 71% 2.8% 4.42 1.7779 77% 2.5% 71% 2.9% 4.40 1.8278 80% 2.5% 70% 2.9% 4.37 1.8677 79% 5.9% 69% 2.9% 4.34 1.9176 63% 8.2% 69% 3.0% 4.31 1.9575 74% 3.3% 68% 3.0% 4.27 2.0074 76% 3.0% 68% 3.0% 4.23 2.0473 73% 5.8% 67% 3.0% 4.19 2.0772 59% 6.7% 66% 3.1% 4.14 2.1171 79% 1.7% 66% 3.1% 4.10 2.1570 59% 8.9% 65% 3.1% 4.05 2.1869 74% 4.5% 64% 3.2% 4.00 2.2168 61% 11.5% 64% 3.2% 3.95 2.2467 60% 4.9% 63% 3.2% 3.90 2.2766 80% 1.4% 63% 3.3% 3.85 2.2965 52% 8.8% 62% 3.3% 3.79 2.3264 72% 12.3% 61% 3.3% 3.74 2.3463 56% 16.9% 61% 3.4% 3.68 2.3662 33% 8.0% 60% 3.4% 3.62 2.3861 64% 0.2% 60% 3.5% 3.57 2.40
Table A25
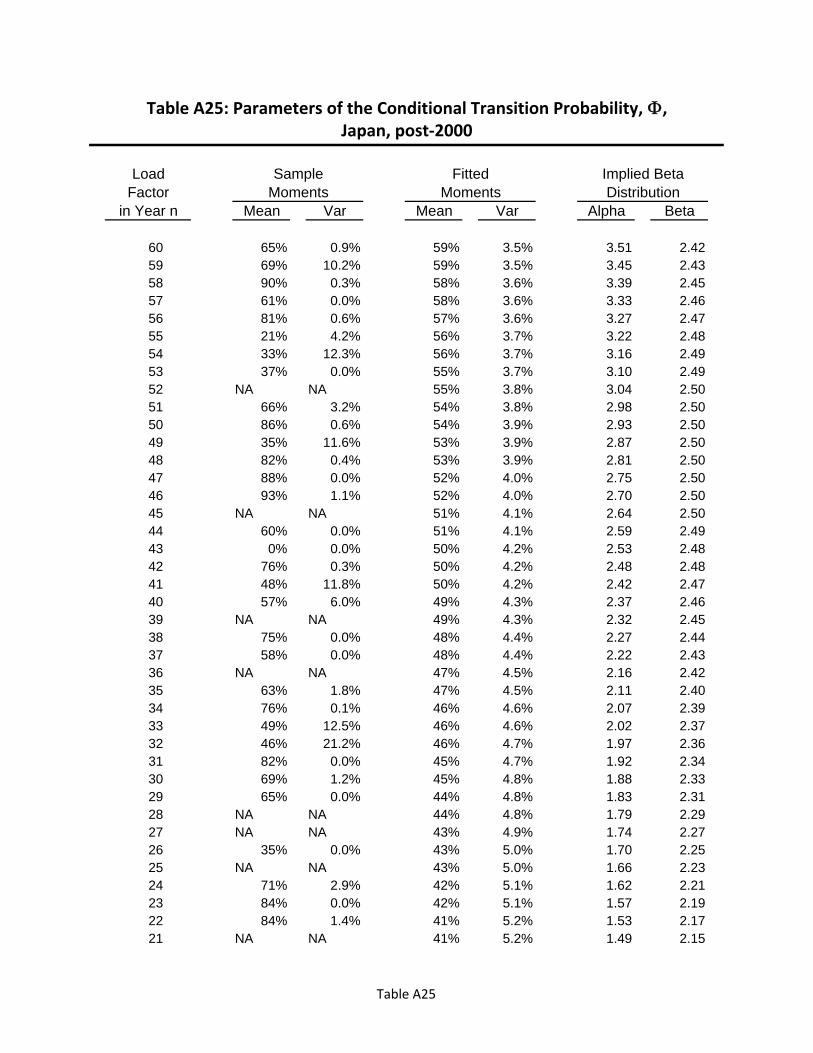
Table A25: Parameters of the Conditional Transition Probability, ,Japan, post‐2000
Load Sample Fitted Implied BetaFactor Moments Moments Distribution
in Year n Mean Var Mean Var Alpha Beta
60 65% 0.9% 59% 3.5% 3.51 2.4259 69% 10.2% 59% 3.5% 3.45 2.4358 90% 0.3% 58% 3.6% 3.39 2.4557 61% 0.0% 58% 3.6% 3.33 2.4656 81% 0.6% 57% 3.6% 3.27 2.4755 21% 4.2% 56% 3.7% 3.22 2.4854 33% 12.3% 56% 3.7% 3.16 2.4953 37% 0.0% 55% 3.7% 3.10 2.4952 NA NA 55% 3.8% 3.04 2.5051 66% 3.2% 54% 3.8% 2.98 2.5050 86% 0.6% 54% 3.9% 2.93 2.5049 35% 11.6% 53% 3.9% 2.87 2.5048 82% 0.4% 53% 3.9% 2.81 2.5047 88% 0.0% 52% 4.0% 2.75 2.5046 93% 1.1% 52% 4.0% 2.70 2.5045 NA NA 51% 4.1% 2.64 2.5044 60% 0.0% 51% 4.1% 2.59 2.4943 0% 0.0% 50% 4.2% 2.53 2.4842 76% 0.3% 50% 4.2% 2.48 2.4841 48% 11.8% 50% 4.2% 2.42 2.4740 57% 6.0% 49% 4.3% 2.37 2.4639 NA NA 49% 4.3% 2.32 2.4538 75% 0.0% 48% 4.4% 2.27 2.4437 58% 0.0% 48% 4.4% 2.22 2.4336 NA NA 47% 4.5% 2.16 2.4235 63% 1.8% 47% 4.5% 2.11 2.4034 76% 0.1% 46% 4.6% 2.07 2.3933 49% 12.5% 46% 4.6% 2.02 2.3732 46% 21.2% 46% 4.7% 1.97 2.3631 82% 0.0% 45% 4.7% 1.92 2.3430 69% 1.2% 45% 4.8% 1.88 2.3329 65% 0.0% 44% 4.8% 1.83 2.3128 NA NA 44% 4.8% 1.79 2.2927 NA NA 43% 4.9% 1.74 2.2726 35% 0.0% 43% 5.0% 1.70 2.2525 NA NA 43% 5.0% 1.66 2.2324 71% 2.9% 42% 5.1% 1.62 2.2123 84% 0.0% 42% 5.1% 1.57 2.1922 84% 1.4% 41% 5.2% 1.53 2.1721 NA NA 41% 5.2% 1.49 2.15
Table A25
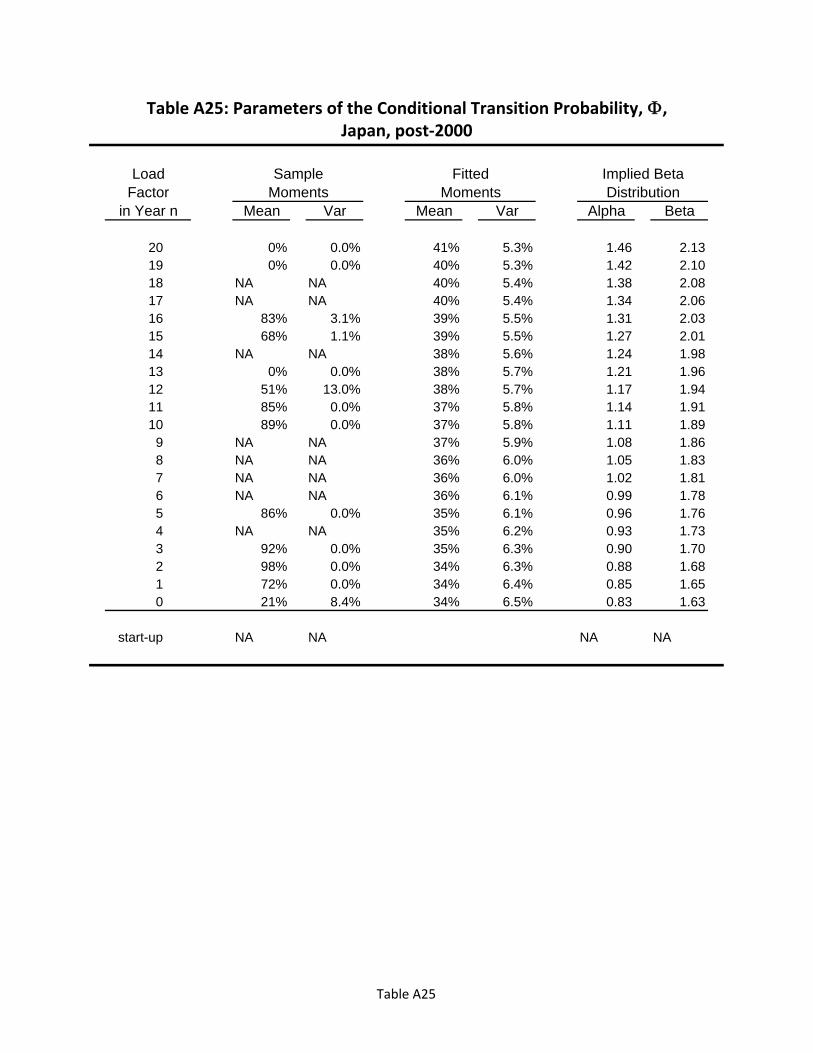
Table A25: Parameters of the Conditional Transition Probability, ,Japan, post‐2000
Load Sample Fitted Implied BetaFactor Moments Moments Distribution
in Year n Mean Var Mean Var Alpha Beta
20 0% 0.0% 41% 5.3% 1.46 2.1319 0% 0.0% 40% 5.3% 1.42 2.1018 NA NA 40% 5.4% 1.38 2.0817 NA NA 40% 5.4% 1.34 2.0616 83% 3.1% 39% 5.5% 1.31 2.0315 68% 1.1% 39% 5.5% 1.27 2.0114 NA NA 38% 5.6% 1.24 1.9813 0% 0.0% 38% 5.7% 1.21 1.9612 51% 13.0% 38% 5.7% 1.17 1.9411 85% 0.0% 37% 5.8% 1.14 1.9110 89% 0.0% 37% 5.8% 1.11 1.899 NA NA 37% 5.9% 1.08 1.868 NA NA 36% 6.0% 1.05 1.837 NA NA 36% 6.0% 1.02 1.816 NA NA 36% 6.1% 0.99 1.785 86% 0.0% 35% 6.1% 0.96 1.764 NA NA 35% 6.2% 0.93 1.733 92% 0.0% 35% 6.3% 0.90 1.702 98% 0.0% 34% 6.3% 0.88 1.681 72% 0.0% 34% 6.4% 0.85 1.650 21% 8.4% 34% 6.5% 0.83 1.63
start-up NA NA NA NA
Table A25
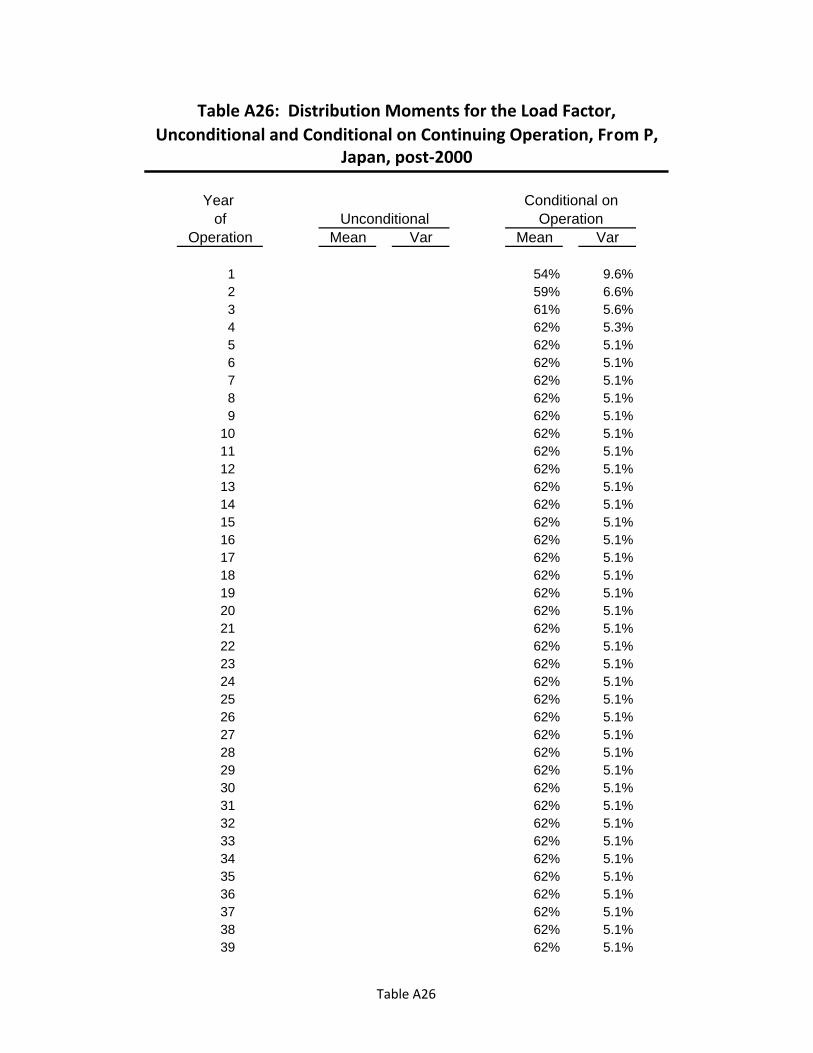
Table A26: Distribution Moments for the Load Factor, Unconditional and Conditional on Continuing Operation, From P,
Japan, post‐2000
Year Conditional onof Unconditional Operation
Operation Mean Var Mean Var
1 54% 9.6%2 59% 6.6%3 61% 5.6%4 62% 5.3%5 62% 5.1%6 62% 5.1%7 62% 5.1%8 62% 5.1%9 62% 5.1%
10 62% 5.1%11 62% 5.1%12 62% 5.1%13 62% 5.1%14 62% 5.1%15 62% 5.1%16 62% 5.1%17 62% 5.1%18 62% 5.1%19 62% 5.1%20 62% 5.1%21 62% 5.1%22 62% 5.1%23 62% 5.1%24 62% 5.1%25 62% 5.1%26 62% 5.1%27 62% 5.1%28 62% 5.1%29 62% 5.1%30 62% 5.1%31 62% 5.1%32 62% 5.1%33 62% 5.1%34 62% 5.1%35 62% 5.1%36 62% 5.1%37 62% 5.1%38 62% 5.1%39 62% 5.1%
Table A26

Table A26: Distribution Moments for the Load Factor, Unconditional and Conditional on Continuing Operation, From P,
Japan, post‐2000
Year Conditional onof Unconditional Operation
Operation Mean Var Mean Var
40 62% 5.1%41 62% 5.1%42 62% 5.1%43 62% 5.1%44 62% 5.1%45 62% 5.1%46 62% 5.1%47 62% 5.1%48 62% 5.1%49 62% 5.1%50 62% 5.1%51 62% 5.1%52 62% 5.1%53 62% 5.1%54 62% 5.1%55 62% 5.1%56 62% 5.1%57 62% 5.1%58 62% 5.1%59 62% 5.1%60 62% 5.1%
Notes:
Unconditional values not calculated due to lack of any permanent shutdowns during
the relevant period.
Distribution in Year 1 are based on start-up parameters for the OECD as a whole, i.e. from
Table 13.
Table A26