capacity development of small-scale farmers in developing
TRANSCRIPT

Capacity development of small-scale farmers
in developing countries:
Analysis of preferences and the role of
information and communication technologies
Dissertation to obtain the doctoral degree in the International Ph. D. Program
for Agricultural Sciences in Göttingen (IPAG)
at the Department of Agricultural Economics and Rural Development
Faculty of Agricultural Sciences
Georg-August-University Göttingen, Germany
presented by
Dirk Hauke Landmann
born in Göttingen, Germany
Göttingen, May 2018

D7
First supervisor: Prof. Dr Ludwig Theuvsen
Second supervisor: Prof. Dr Carl Johan Lagerkvist
Third supervisor: Prof. Dr Jan-Henning Feil
Date of dissertation: 19.07.2018

I hereby express my deepest respect and gratitude to all the farmers interviewed for this
dissertation. Each and every one has her or his place in this dissertation and I sincerely hope that
the papers of this dissertation will be helpful for you one day! You are the reason why we are doing
this.

i
Summary
Capacity development through agricultural training is a proven approach to enhance the
management skills of small-scale farmers in developing countries, aiming to increase their standard
of living in the long run. Yet, little is known about their preferences for different types of
agricultural training as well as the impact of trainers’ qualification on participants’ learning success
and satisfaction. Moreover, modern information and communication technologies are increasingly
promoted as means to spread agricultural knowledge because of their large technical possibilities,
wide coverage, and high exchange rate of information. In particular, the use of smartphones is
discussed as a new way to train farmers in developing countries. However, the drivers of small-
scale farmers’ intention to use smartphones still seem largely under-explored. Besides modern
technologies, innovation platforms also called learning alliances are another method to develop
farmers’ capacities, where all stakeholders involved into agricultural production try to solve
problems and improve the value added for everybody. Yet, frameworks to evaluate these alliances
are rare. Against this background, this dissertation presents four papers, which focus on capacity
development from small-scale farmers’ perspectives regarding their preferences, intentions to use
smartphones, learning success, satisfaction and trust.
Capacity development in agriculture still follows standardised top-down models driven by the
public sector in most developing countries. In contrast, in industrialised countries training activities
are increasingly privatised and service provision demand-driven. This is due to the increasing
specialisation and industrialisation of agricultural production in recent decades. The trend is
prompting researchers and other stakeholders to re-think the contextual fit of capacity development
models whereby small-scale farmers in developing countries are passive knowledge recipients
rather than holders of traditional know-how and capacities that can be exploited and further
developed in customised training. To analyse this research gap, paper one examines the preferences
of small-scale farmers for agricultural training with respect to training method, trainer, duration
and location of training, and additional offers. A discrete choice experiment was conducted with
664 randomly selected farmers in Bihar state, India, in 2016. The data obtained are analysed using
a mixed logit model in a willingness-to-pay space, including analyses for different subgroups.
Based on their particular willingness-to-pay for the studied attributes, the analysis depicts small-
scale farmers’ preference for training activities that include demonstrations, additionally offered
inputs (seeds, fertilisers, credit) and an academic trainer.

ii
The second paper builds on the findings of the first paper and focuses on trainers’ qualification.
Within capacity development, the type and quality of the trainer play a crucial role in promoting
farmers’ capacity, which is underlined by the results of our first paper. Whilst several studies have
addressed the identification of farmers’ capacity development preferences, few have investigated
the relationship between trainer qualification, learning success and satisfaction of participants.
Hence, the main purpose of this paper is to examine the relationship between trainers’ qualification
and learning success as well as satisfaction of small-scale farmers. Moderated mediation analysis
is utilised to measure the influence of direct and indirect effects through trainers’ qualification on
learning success and satisfaction. In this framework, psychological and relevant proven constructs
from the Theory of Planned Behaviour are taken into account: attitude and perceived control
operate as mediators, subjective norm acts as moderator, and gender and age are considered as
covariates. This framework is applied on primary survey data from 217 farmers collected in Bihar
state, India, in December 2016, by the use of a structured questionnaire. The results show no
difference in the degrees of satisfaction among farmers related to trainers’ qualification. However,
learning success decreases with an academically educated trainer. The change of attitude during
the training has a significant positive effect on satisfaction. Subjective norms also affect the
participants’ satisfaction positively. With respect to the theories used, the results indicate that the
behavioural constructs are relevant in the field of agricultural education and extension to explain
participants’ satisfaction. Theoretical implications can be drawn regarding the improvement of this
conceptual framework and other related studies.
Besides the trainer, also the method of training is important, whereby the smartphone is one
possible device and method to transfer knowledge. The use of smartphones is increasingly
supported by non-governmental organisations as well as governmental institutions as a modern
information and communication technology to spread agricultural information. However, uptake
of the smartphone usage in agriculture is still relatively low in developing countries. Up to now,
psycho-economic drivers of farmers’ adoption behaviour are mostly not taken into account, or the
stakeholders are unaware of the possible importance of non-monetary factors. The aim of the third
paper is to identify and quantify drivers of farmers’ adoption behaviour through the development
of a complex conceptual framework, based on the Theory of Planned Behaviour and its further
advances. This framework is applied to primary survey data from 664 farmers collected in Bihar
state, India, in 2016, using a structured questionnaire. The results of a partial least squares analysis

iii
indicate that subjective norms, attitude, self-control, as well as positive and even negative emotions
exert positive influences on the intention to use a smartphone for agricultural purposes. With these
results, the paper extends the academic literature through new conceptual insights and provides
application-oriented implications for stakeholders, such as non-governmental organisations,
extension services and research institutes.
Another approach to strengthen small-scale farmers’ capacities is to use multi-stakeholder
innovation systems or learning platforms, such as the Nicaraguan Learning Alliance. However,
tools for the evaluation of multi-stakeholder innovation systems are rare so far. The fourth paper
reports the application of a conceptual framework to evaluate multi-stakeholder innovation systems
using the Nicaraguan Learning Alliance in this paper. The assessment focuses on the business
relationship constructs of trust and capacity development. In total, 90 survey interviews of producer
organisations, 20 in-depth interviews, and six focus group discussions were collected from
agribusiness stakeholders linked with the Nicaraguan Learning Alliance and from a control group
of stakeholders involved with other networks. The quantitative data were analysed through factor
and regression analyses. Results from the quantitative analyses were triangulated with qualitative
data. The analysis shows that the Nicaraguan Learning Alliance has been successful in developing
smallholder farmers’ capacities as a result of trust developed through its dedicated project
managers. Nonetheless, the Nicaraguan Learning Alliance has not been more successful at
developing agribusiness capacities among Nicaraguan farmers than other networks with the same
goals. Results from this study point to the need for facilitating more interactions between the
different networks of farmers’ cooperatives and organisations with other stakeholders already
active within the Nicaraguan agrifood innovation system.
Based on the results of the four presented paper a series of practical recommendations for training
activities apply. One of those is to combine the strength of an expert trained on-the-job as the main
trainer with an academically educated trainer. The academic trainer could be integrated directly in
some parts of the training activities or via modern technologies such as videos or smartphones.
This seems to be the most promising approach with respect to the farmers preferences and in order
to achieve the greatest learning success and satisfaction of the participants. Furthermore, by the
usage of modern information and communication technologies the effectiveness of the training
could also be increased. Besides the professional background of the trainer, it is important that
trainers gain qualifications in teaching methods and other soft skills. With respect to modern

iv
information and communication technologies like smartphones, our results indicate that presenting
trainers and later farmers with the various possibilities of smartphones and creating a positive
image of these technologies could help to reinforce the willingness to adopt this new method of
communication for agricultural purposes. Hereby, also the social environment needs to be
addressed, for example within the training. Smartphones cannot replace direct contact, but their
importance regarding capacity development will increase rapidly as previous developments in
mobile phone use have shown.
These findings provide politicians and other stakeholders with tangible recommendations to
improve their training programmes. Ultimately this could make capacity development more
attractive and therefore more likely to be attended by small-scale farmers in the short and long-
term. These consequences in return could have further implications for the agricultural productivity
and poverty reduction.

v
Acknowledgements
First, I want to thank my supervisor, Prof. Ludwig Theuvsen, for his endless trust in my work and
the freedom he gave me to bring in own research ideas. Your fundamental positive way of thinking
and your overall support were exceptional and gave me diverse possibilities and opportunities. My
decisions were always backed by you which helped me finish this dissertation. Second, I would
like to thank Prof. Carl Johan Lagerkvist for welcoming me into his research team and providing
me with profound scientific feedback and guidance during my research stay in Sweden and beyond.
Without your expertise and inspiration as my second supervisor, mentor and co-author, the papers
presented in this dissertation would not be the same. I am also thankful for Prof. Jan-Henning Feil,
whom I got to know in my early years of my academic career. Today you are also a professor,
supervisor, and co-author. Your scientific support and your professional guidance and personal
advice motivated me in the good and in the bad times. I owe gratitude to my co-author Dr Verena
Otter for her feedback and time. I am very thankful for working with Sabrina Kimmig. You have
been a great student, a helpful field manager, a co-author, and I am glad to say, nowadays also a
supportive and very good friend. Jo Cadilhon supervised and guided me in an outstanding and great
way through my master thesis. You inspired me by your scientific ideology, your feeling for social
justice and at the same time of your spirit regarding work-life balance. Your inspiration was one
reason why I did my PhD and you are now part of it as a co-author. Thanks for that.
The financial support of this research received from the German Research Foundation (DFG)
through the ‘GlobalFood’ programme (RTG 1666) and the Fiat Panis Foundation is gratefully
acknowledged. The data collection and field survey were implemented in close collaboration with
the International Livestock Research Institute (ILRI), ‘Preservation and Proliferation of Rural
Resources And Nature’ (PRAN) and Farms and Farmers Foundation (FnF). I thank Sneha,
Dharmendra, Vivek, Vikash and all enumerators for managing and collecting the data presented in
this dissertation, which was not always easy. I also thank Anil Kumar Verma, Devesh, Pramodh,
Shiv Prakash and his colleagues from PRAN and also Shashank Kumar, Manish Kumar and their
colleagues from FnF for your organisational support during our time in Bihar.
The field work for my fourth paper, which is presented in this dissertation was undertaken and
funded as part of the CGIAR research program humidtropics and the program Policies, Institutions,
and Markets (PIM) led by the International Food Policy Research Institute (IFPRI). I thank Falguni

vi
Guharay for guidance as well as for the tremendous support and good discussions during my stay
in Nicaragua. I am also thankful for the colleagues at the ‘International Center of Tropical
Agriculture’ (CIAT) in Nicaragua for supporting and assisting in the fieldwork.
The GlobalFood team has always been an outstanding place for scientific discussion and still is my
safe harbour respecting my work, social, and private relationships. The fruitful interactions with
different principal investigators and the scientific input of postdocs and PhD students during
presentations and discussions were essential and helped me to build up my research ideas and my
field studies. I am especially thankful for Prof. Matin Qaim, the speaker of the training group, and
the coordination office, with Melanie and Katrin who made bureaucracy an easy task even for me
and for the assistants who are office neighbours for me and good friends. GlobalFood was very
important for me as a social environment and positive working atmosphere, and I am proud to call
myself a ‘GlobalFoodie’! I am also thankful for the international colleagues of the Theuvsen chair
and the extend GlobalFood-family. My special thanks go to Kathrin, Lutz, and Malte who formed
my knowledge regarding Stata, nutrition, gender and tried hard to teach me a sense of ‘normal’
humour. Further, I would like to thank my friends and colleagues Lisa, Andrea, Denise, Caetano,
Marion, Jana, Thuy, Jessie, Susa and Ayo.
Supervising students was not only a learning process for Thatiana, Sofia, Hanno, Julian, Stephanie
and Emilie. It was also a fruitful and a good experience for me, and I am grateful for that.
I would also like to thank my family and close friends Valerie, Klaas, Mareike, and Sebastian, for
their encouragement, creative ideas, and their honest friendship. Especially, I want to thank my
biggest and oldest supporter Annegret. You have not only formed me as an adolescent, you also
inspired my studies in Göttingen as a grandmother, housemate, and as a friend. Due to your big
heart and endless positive energy in every situation, you will always be an unreachable idol for me!
Finally, I am grateful to my parents who enabled and always supported me in this long academic
journey and who encouraged me to proceed.

vii
Table of content
Summary .......................................................................................................................................... i
Acknowledgements ......................................................................................................................... v
List of tables ................................................................................................................................... ix
List of figures .................................................................................................................................. x
1 General introduction .............................................................................................................. 1
1.1 Background ................................................................................................................................ 1
1.2 Problem statement and research gaps ..................................................................................... 4
1.3 Research objectives and approach ........................................................................................... 6
2 Analysing small-scale farmers’ preferences for capacity development activities in
developing countries - an experimental approach ...................................................................... 9
2.1 Introduction .............................................................................................................................. 10
2.2 Literature review and conceptual framework ....................................................................... 11
2.3 Methods ..................................................................................................................................... 14
2.4 Results ....................................................................................................................................... 17
2.5 Discussion ................................................................................................................................. 21
2.6 Conclusion ................................................................................................................................ 24
2.7 Appendix 2 ................................................................................................................................ 26
3 Understanding the relationship between trainers’ qualification, learning success and
satisfaction for agricultural capacity development in rural Bihar .......................................... 27
3.1 Introduction .............................................................................................................................. 28
3.2 Literature review and present study ...................................................................................... 29
3.3 Materials and methods ............................................................................................................ 32
3.4 Results ....................................................................................................................................... 35
3.5 Discussion ................................................................................................................................. 37
3.6 Appendix 3 ................................................................................................................................ 40
4 Determinants of small-scale farmers’ intention to use smartphones for generating
agricultural knowledge in developing countries - evidence from rural India ........................ 43
4.1 Introduction .............................................................................................................................. 44
4.2 The role of ICT for agricultural capacity development ....................................................... 45
4.3 Conceptual framework ............................................................................................................ 47

viii
4.4 Methods and data ..................................................................................................................... 49
4.5 Partial Least Square- Estimations .......................................................................................... 51
4.6 Conclusion and implications ................................................................................................... 53
4.7 Appendix 4 ................................................................................................................................ 55
5 The role of trust and networks in developing Nicaraguan farmers’ agribusiness
capacities ....................................................................................................................................... 60
5.1 Introduction .............................................................................................................................. 61
5.2 Literature review ..................................................................................................................... 63
5.3 Conceptual framework and research design ......................................................................... 66
5.4 Results ....................................................................................................................................... 72
5.5 Discussion and conclusions ...................................................................................................... 77
6 General conclusion ............................................................................................................... 82
6.1 Main findings ............................................................................................................................ 83
6.2 Policy recommendations .......................................................................................................... 85
6.3 Limitations and future research ............................................................................................. 87
References ..................................................................................................................................... 88
General appendix ....................................................................................................................... 108

ix
List of tables
Table 2.1: Training attributes and attribute levels used in the discrete choice experiment ........... 13
Table 2.2: Demographic data on respondents, households and farms (N= 664) ........................... 18
Table 2.3: Mixed logit model in a willingness to pay space .......................................................... 20
Table A3.1: Characteristics of respondents, and farms (N= 217) .................................................. 40
Table A3.2: Model summary ......................................................................................................... 40
Table A3.3: Direct effects of mediators, moderators and covariates on the dependent variables . 41
Table A3.4: Indirect effects of mediators on dependent variables ................................................. 42
Table A3.5: Test(s) of highest order unconditional interaction(s) ................................................. 42
Table A4.1: Demographic data (Respondent and household and farm) ........................................ 55
Table A4.2: Mean, standard deviation and factor loading of statements ....................................... 56
Table A4.3: Reliability measures of the model constructs ............................................................. 59
Table A4.4: Fornell-Larcker criteria .............................................................................................. 59
Table 5.1: Institutions of key informants interviewed ................................................................... 70
Table 5.2: Regression analysis of structure and conduct indicators on the factor ‘innovation’ .... 74

x
List of figures
Figure A2.1: Example of an unlabelled choice card ...................................................................... 26
Figure 3.1: Research model 1 with y = learning success ............................................................... 31
Figure 3.2: Research model 2 with y = perceived satisfaction ....................................................... 32
Figure 3.3: Path coefficient of the research model 1- learning success ......................................... 35
Figure 3.4: Path coefficient of the research model 2 -perceived satisfaction................................. 36
Figure 4.1: Smartphone research model with hypotheses .............................................................. 47
Figure 4.2: Path coefficient of the smartphone research model ..................................................... 51
Figure 5.1: Structure of knowledge replication within the Nicaraguan Learning Alliance ........... 65
Figure 5.2: Elements of the conceptual framework to evaluate innovation platforms................... 67
Figure 5.3: Map of Nicaragua identifying provinces where data collection took place ................ 69

1
1 General introduction
The majority of the world’s poor population in developing countries are dependent on the
agriculture, particularly in the form of small-scale farming. The output of small scale farming
is influenced by access to factors such as markets, inputs, technical equipment and the farmers
capacity. This dissertation aims at improving the output of small-scale farmers by capacity
development (CD). CD has been a key position on the agenda of the United Nations (UN) and
other parties in order to reduce poverty and inequality in these countries (World Bank 2007,
2013; UN 2015; Vallejo and Wehn 2016). The UN defines CD as a ‘process through which
individuals […] obtain, strengthen and maintain the capabilities to set and achieve their own
development objectives over time’ (UNDP 2008, 4). In the context of small-scale agriculture
in developing countries, training activities are crucial for developing and enhancing farmers’
capacities and ultimately improving their livelihoods (de Rosa et al. 2016; Horton et al. 2003).
1.1 Background
In the early 2000s, the World Bank identified the great potential of the so-called ‘community-
driven approach’ to develop capacities of rural people living below the poverty line. The
potential of this approach lies in its demand-driven character based on farmers’ own control
over resources and decisions that could be complemented by new technologies and
communication possibilities (Fukuda-Parr, Lopes, and Malik 2002; Gillespie 2004; World
Bank 2002; Fu and Akter 2016). Currently, CD models are characterised by ineffectiveness.
This has also prompted institutions and organisations in developing countries including India –
the country a large part of the dissertation focusses on - to make further attempts directed
towards decentralisation, privatisation, and use of demand-induced community-driven
approaches in their CD work (S. Ghosh 2012; Kotvojs and Hurworth 2013).
The community-driven approach is also implemented in other practical approaches such as the
Nicaraguan Learning Alliance (NLA). These can be assimilated to innovation platforms,
defined as a group of individuals with diverse backgrounds and interests, who come together to
diagnose and solve problems they face by fostering knowledge sharing and innovations
(Homann-Kee Tui et al. 2013; Klerkx, Aarts, and Leeuwis 2010). Hereby, synergistic
relationships between different members are created and a network across multiple levels is
build up (CRS 2009). The NLA is an alliance of organisations formed in 2003. The
organisations train their partners on agribusiness management and access to markets. This
knowledge is then replicated through different geographical and organisational levels along its
2
partner network down to farmers (AdA 2014; World Bank 2012). Trust also has a major role in
the interplay of different individuals and can be seen as a factor, which substantially influences
individuals, organisations, partner’s competence, processes, institutions, economics, intentional
relations, technology or services. It is an important component in value chains and has gained
more attention from scientists within the recent decades. Thus, trust is described as a
complicated and multifaceted concept with no uniform definition and measurement method
available up to now. However, trust has a great influence on perception and individuality, which
depends on participants (Laeequddin et al. 2010).
Apart from trust other agricultural training measures also become more diverse in terms of their
institutionalisation, training methods and content (Prasad, Sulaiman, and Mittal 2015;
Robinson-Pant 2016). Demand-induced use of these training measures in combination with
(partial) privatisation of providers has particular potential to meet small-scale farmers’
constantly changing needs to be more flexible in times of fast information and innovation
change (Chikaire et al. 2015).
However, until today, preferences of small-scale farmers regarding traditional knowledge-
transfer and modern ICT remain unclear. Therefore, the preferences regarding CD activities of
small-scale farmers, especially in developing countries and regions, should be analysed in the
context of specific training measures (Charatsari, Papadaki-Klavdianou, and Michailidis 2011).
Against this background, we analyse the CD demand of small-scale farmers in a developing
country using a discrete choice experiment.
One specific aspect of training measures is the trainers’ qualification. A wide range of agents
is involved in the extension system for agricultural development such as scientists, producers,
trainers, and extension agents (Ludemann et al. 2012). These agents and trainers need expertise,
a special skill set and experiences with small-scale farmers’ demands in order to work
successfully (Hellin 2012; Höckert and Ljung 2013). The concept of teaching small-scale
farmers by academics was used around 30 years ago and was declared as not successful in
comparison to the participatory approach (Ferroni and Zhou 2012). The participatory approach
and also the community-driven approach, which nowadays is the most common concept, was
developed to be more efficient, more sustainable regarding the duration of professional
relationships, and is considered to be more flexible regarding its adaptation to local
circumstances (Birner et al. 2009). Other approaches such as the ‘agricultural knowledge and
information system’ create direct links between scientists and farmers via modern
communication technologies to strengthen the communication (J. R. Anderson 2007).

3
Information and Communication Technology (ICT), such as smartphones, provide a great
possibility to develop farmers’ capacities also impersonally over long distances through specific
applications by offering fast access to continually updated and reliable information (Aker,
Ghosh, and Burrell 2016; Aker 2011). These possibilities seem specifically promising for
regions characterised by poor infrastructure such as Bihar, India.
The majority of paper (chapter two, three and four) within this dissertation analyses data
collected in Bihar state, India. Whereas one paper (chapter five) is based on data collected in
Nicaragua. Bihar was chosen as a suitable study site for the first three papers since it shows
certain characteristics typical for the agricultural sector in developing countries and, thus,
allows for partial transferability of results. The state of Bihar has a high population density of
1,106 habitants per square kilometre and more than 100 million habitants, 34 per cent of them
living below the poverty line of 1.90 USD per day. With 89 per cent, a large proportion of the
population lives in rural areas in a geographically diverse terrain, mostly in scattered villages.
Correspondingly, around 62 per cent of the population is working in the agricultural sector
(World Bank 2016a; Census Organisation of India 2015). As in many other developing
countries, agriculture in Bihar shows low crop productivity, lack of water management, low
investment rates, and weak infrastructure with regards to transport and marketing (World Bank
2005; Bansil 2011; Rodgers et al. 2013). Various non-governmental organisations (NGOs) such
as ‘Farms and Farmers Foundation’ (FnF) and ‘Preservation and Proliferation of Rural
Resources and Nature’ (PRAN) target the rural population living under these unfavourable
conditions through CD activities, amongst others.
Nicaraguan farmers, which have a crucial role in one paper of this dissertation, are organised
in a dense network of cooperatives (Lafortezza and Consorzio 2009). However, at present many
farmers are not well equipped to link themselves to suppliers and customers in today’s market-
oriented system. International and local organisations identified this lack of capacity as training
opportunity to help rural farming communities link to markets. Based on this situation the NLA
launched in 2003 (Lundy and Gottret 2005). The NLA’s idea is to use the existing network of
agricultural cooperatives to snowball the training to individual farmer households. Three
learning cycles of the NLA included 77 producer organisations and reached a total of 19,350
farming families involved in the production of various crops (AdA-Nicaragua 2012; Landmann
and Cadilhon 2016).

4
1.2 Problem statement and research gaps
Agricultural sectors in developing countries are making steady progress towards greater market
orientation and competitiveness (Kahan 2013). However, in practice, CD still follows
standardised top-down models driven by the public sector in most developing countries (Birner
et al. 2009), whereas in industrialised countries CD is increasingly characterised by
privatisation and demand-driven service provision due to increasing specialisation and
industrialisation of agricultural production in recent decades (Rivera 2011). This trend is
prompting researchers and other stakeholders to re-think the contextual fit of CD models in
which small-scale farmers in developing countries are passive knowledge recipients rather than
holders of traditional know-how and capacities that can be exploited in customised training
(Baser et al. 2008; Birner et al. 2009).
Only a few previous case studies have sought to identify small-scale farmers’ preferences and
to quantify their willingness to pay (WTP) for CD measures in developing and transition
countries. For example, using probit model estimations and survey data, Holloway and Ehui
(2001) detected a substantial WTP for advisory services under the assumption of privatisation
among Ethiopian farmers. Moreover, using a probit regression model in combination with
survey data, Oladele (2008) identified a partial WTP for privatised advisory services among
farmers in Nigeria. Mwaura (2010) also used a probit regression model for analysing the
influence of socio-demographic characteristics on WTP for advisory service in Uganda.
Aydogdu (2017), Budak et al. (2010) and Ajayi (2006) applied similar methods to measure
farmers’ WTP for public advisory services in Nigeria and Turkey, after determining their needs
for specific advisory content using the contingent valuation method. The existing research,
therefore, indicates some WTP for CD among farmers in developing countries. However, small-
scale farmers’ preferred form of training within a CD context has hardly been investigated.
The trainer’s level of education is one important attribute influencing the preferred training
form of the farmers and plays a crucial role in the improvement of educational systems around
the world. In comparison to the agricultural domain, many other economic sectors seem to be
characterised by a higher level of ‘professionalism’, i.e. they have more profound specifications
regarding a trainer’s qualification. The ‘Global Forum for Rural Advisory Service’ (GFRAS)
conducted a scoping study in 2016 to improve their offers and to encourage certification and
standards regarding training on a worldwide level (Terblanche 2017). According to Davis
(2015), extension should be recognised as a profession and guarantee that the staff is connected
to societies of the farmers to allow for professional education and development. Apart from the

5
trainer, the farmers participating in the training continually modify, revise, and even set back
their personal beliefs, opinions, views, and own behaviours (Bhattacherjee and Premkumar
2004). However, investigation of beliefs influencing learning success and satisfaction have not
been done yet.
Besides the preferences of farmers for certain trainer’s qualification and their effects on the
participants, there are also different types of training methods. One method to train farmers
could be to use modern ICT and more specifically smartphones. However, the use of
smartphones for these purposes among small-scale farmers in rural areas of developing
countries is still limited, even though ownership of smartphones increases in developing
countries and also in India rapidly (Statista 2018). Furthermore, the success of implementation
programmes conducted by NGOs and governmental institutions is also limited, even though the
general availability of smartphones is increasing (Deichmann, Goyal, and Mishra 2016; World
Bank 2016b). This disparity has recently motivated researchers to recommend stakeholders to
better respect those farmers’ needs during the implementation process of modern digital
technology (Mundy, Addom, and Bheenick 2017). However, this recommendation is still
lacking psycho-economic dimensions and foundations since existing studies on ICT usage in
developing countries’ agricultural sectors either focus mainly on socio-economic adoption
drivers or on usage-related performance effects (Deichmann, Goyal, and Mishra 2016; Mittal
and Tripathi 2009; Ganesan et al. 2013; Jain, Kumar, and Singla 2015).
Smartphones seem to be important in the future and innovation platforms are seen as a
successful tool and used in many different countries and value chains right now. However, the
literature on the assessment of innovation platforms is very rare. Existing literature mostly
focuses on the analysis of particular cases with a specific method, thus restricting the transfer
to other platforms (Nederlof, Wongtschowski, and van der Lee 2011). The conceptual
framework already embeds certain variables, factors, and other influences relevant to the
development and aims of innovation platforms. This is the only conceptual framework that
combines the different categories structure, conduct, and performance with the topics of
transaction costs and marketing concepts for the purpose of monitoring and evaluation of the
impact of innovation platforms (Cadilhon 2013).
With the present work, we aim to add to the scarce literature on farmers preferences for CD
services, the importance of trainer characteristics for the success of these services, as well as
the drivers of smartphone use for agricultural CD. Furthermore, we analyse the case of one

6
learning alliance regarding trust with the purpose to develop farmers’ business capacities. The
ultimate goal is to derive well-informed policy recommendations regarding CD interventions.
1.3 Research objectives and approach
Therefore, the main research objective of the dissertation is to improve and uptake CD activities
by analysing farmers demand and the possibility to use other approaches, such as learning
alliances and different trainers’ education, and new technologies (e.g. smartphones).
The first paper in the second chapter of this dissertation has more specifically the objective of
‘Analysing small-scale farmers’ preferences for capacity development activities using an
experimental approach’. For this purpose, we used a discrete choice experiment (DCE), which
allows us to determine preferences for different alternatives without explicitly asking for them
(e.g. Train 2003). In our DCE, farmers in Bihar were asked to make a choice on their preferred
CD activities from training alternatives specified by relevant attributes such as qualification of
the trainer, method of training, additional offers connected to the training as well as location
and duration of the training. Moreover, the cost of training was included as a monetary attribute,
to apply a mixed logit model in WTP space to estimate the marginal WTP measures. This is a
particularly relevant approach in view of the fact that NGOs such as PRAN intend to introduce
payment systems in the near future in order to offer improved CD activities (PRAN 2016). To
our knowledge, this is the first study to estimate marginal WTP measures for different types of
agricultural CD methods especially in a developing country context with small-scale farmers.
The results obtained could directly support NGOs in improving and pricing training measures
in order to increase their effectiveness.
The second paper in chapter three of this dissertation is based on the attribute trainers’
qualification of the first paper. It deals with ‘Understanding the relationship between trainers’
qualification, learning success and satisfaction for agricultural capacity development in rural
Bihar’. For this purpose, we investigate whether the change of attitude and perceived control of
farmers participating in training for agricultural capacity development mediate the effect of
learning success or perceived satisfaction depending on the type of trainer. Finally, we test
whether the relation between trainer type and learning success or perceived satisfaction is
moderated by farmers’ subjective norms. To this end, attitudes, perceived control, subjective
norms, as well as perceived satisfaction for participation in agricultural training, can be
expected to represent key determinants to learning success and satisfaction of the agricultural
training and can be expected to act as catalysts in accordance with the learning success and

7
perceived satisfaction (Topală 2014; Ko and Chung 2014; Chatman and Sparrow 2011; Bihler
2006).
In order to close the gap of understanding the psycho-economic dimension during the
implementation process of modern digital technology in the academic literature the third paper
in chapter four focusses on ‘Determinants of Smallholder Farmers’ Intention to use
smartphones for generating agricultural knowledge’. In this regard, a complex conceptual
framework is developed based on the Theory of Planned Behaviour (TPB), a theory originating
in social psychology and first introduced by Ajzen (1991). In doing so, conceptualizations from
the Technology Acceptance Model 2 of Venkatesh and Davis (2000), Cheon et al. (2012) as
well as Perugini and Bagozzi (2001), who further elaborated the concept of emotions as psycho-
economic drivers, are also taken into account. The research framework developed in this study
further enhances these attempts by adapting the circumstances of small-scale farmers in
developing countries and testing it in the agricultural sector of Bihar, India, one of the poorest
regions in the world.
The focus of the fourth paper presented in chapter five is to evaluate ‘The role of trust and
networks in developing Nicaraguan farmers’ agribusiness capacities’. Trust is seen in this
context as a factor, which substantially influences individuals, organisations, processes or
institutions (Laeequddin et al. 2010). Capacity development is a principal goal of the NLA to
increase the replication efficiency of the knowledge being produced within the network. To
contribute to the evaluation of the NLA’s activities, the fourth paper aims to answer the research
question: How does the NLA strengthen producers’ capacities through its structure and network
of members and partners? The contribution of this article to the literature on innovation
platforms as a collaborative agricultural education mechanism is the pilot-testing of a
conceptual framework characterizing how innovation platforms work in a Latin American
context through mixed research methods. Although learning alliances and innovation platforms
are common, this study aims to contribute a conceptual framework to evaluate them. This
framework uses quantitative and mixed methods which have not been combined before.
The results of these analyses are expected to provide policymakers and training organisations
with profound insights into the underlying psychological factors that influence the participation
in agricultural training. The insights of this dissertation can be used to adjust current policies
and to develop new initiatives in order to stimulate knowledge transfer and participation in
agricultural training programmes by small-scale farmers (e.g. by smartphone support).

8
Chapter six draws broader conclusions and policy implications based on all four papers. Both
questionnaires used in 2016 are displayed in the general appendix. Details about the sampling
procedure are included in the three essays themselves.

9
2 Analysing small-scale farmers’ preferences for capacity development activities in
developing countries - an experimental approach1
Abstract
Capacity development through agricultural training is a proven approach for improving small-
scale farmers’ management capacities in developing countries, thereby raising their long-term
standard of living, but little is known about their preferences for different types of agricultural
training. Therefore, this study examines the preferences of small-scale farmers for agricultural
training with respect to training method, trainer, duration, location and additional offers. A
discrete choice experiment (DCE) was conducted with 664 randomly selected farmers in Bihar
state, India. The data obtained are analysed by using a mixed logit model in willingness-to-pay
(WTP) space, including analyses for different subgroups. Based on their marginal WTP for the
attributes studied, it is found that small-scale farmers prefer training measures which include
demonstrations, would like to receive additional offers (seeds, fertilisers, credit) during training
and would prefer an academic trainer. These findings provide politicians and other stakeholders
with concrete indications to improve their training programmes and ultimately make capacity
development more attractive for small-scale farmers.
Keywords
capacity development, discrete choice experiment, willingness to pay, small-scale farmers,
developing countries, India, Bihar
1 This chapter is co-authored with Jan-Henning Feil (JHF), Carl Johan Lagerkvist (CJL) and Verena Otter (VO).
The authors’ contributions are as follows: Dirk Landmann (DL) designed the research and collected the data. DL
analysed and interpreted the data. JHF and CJL assisted in the analysis and interpretation of the results. DL wrote
the paper. JHF, CJL commented at the various stages of the research and contributed to writing and revising the
paper. VO contributed to writing of the paper. All authors read and approved the final manuscript. This manuscript
is submitted to the Journal ‘Development and Change’. The share of the total work done by DL is 70 per cent.

10
2.1 Introduction
The Millennium Development Goals set by the United Nations (UN) have been a turning point
in global efforts regarding poverty reduction and equality improvement in developing countries
(UN 2015). Most measures for achieving these goals directly target the agricultural sector and,
more specifically, capacity development (CD), since most of the poor in developing countries
are dependent on small-scale farming in rural areas (World Bank 2007, 2013; UN 2015; Vallejo
and Wehn 2016). The UN defines CD as a ‘process through which individuals […] obtain,
strengthen and maintain the capabilities to set and achieve their own development objectives
over time’ (UNDP 2008, 4). Farmers’ capacities are mostly developed by training activities
(Horton et al. 2003).
In the early 2000s, the World Bank identified the great potential of a so-called ‘community-
driven approach’ for enhancing the standard of living of rural people living below the poverty
line. The potential of this approach lies in its demand-driven character based on farmers’ own
control over resources and decisions that could be complemented by new technologies and
communication possibilities (Fukuda-Parr, Lopes, and Malik 2002; Gillespie 2004; World
Bank 2002). The ineffectiveness of current CD models has also prompted institutions and
organisations in India and other developing countries to make further attempts for
decentralisation, privatisation and use of demand-induced community-driven approaches in
their CD work (S. Ghosh 2012; Kotvojs and Hurworth 2013). Thus agricultural training
measures are becoming more diverse in terms of their institutionalisation, training methods and
content (Prasad, Sulaiman, and Mittal 2015; Robinson-Pant 2016). Demand-induced use of
training measures in combination with (partial) privatisation of providers has particular
potential to meet small-scale farmers’ constantly changing needs more flexibly in times of fast
information and innovation change (Chikaire et al. 2015). Therefore, the preferences of small-
scale farmers, especially in developing countries, should be analysed in the context of
implementing specific training measures as capacity is built (Charatsari, Papadaki-Klavdianou,
and Michailidis 2011). A few previous case studies have sought to identify small-scale farmers’
preferences and to quantify their willingness to pay (WTP) for CD measures in developing and
transition countries. For example, using probit model estimations and survey data, Holloway
and Ehui (2001) detect significant WTP for advisory services under the assumption of
privatisation among Ethiopian farmers. Moreover, using a probit regression model in
combination with survey data, Oladele (2008) identifies WTP for privatised advisory services
among farmers in Nigeria. Mwaura (2010) also uses a probit regression model for analysing the

11
influence of socio-demographic characteristics on WTP for advisory service in Uganda.
Aydogdu (2017), Budak et al. (2010) and Ajayi (2006) apply similar methods to measure
farmers’ WTP for public advisory services in Nigeria and Turkey, after determining their needs
for specific advisory content using the contingent valuation method. Existing research,
therefore, indicates that a WTP for CD among farmers in developing countries generally exists.
However, the preferred form of training of small-scale farmers within the CD context has not
yet been identified and its respective WTP determined.
The objective of this study is therefore to investigate the preferences of small-scale farmers in
developing countries for CD activities. To this end, we use a discrete choice experiment (DCE),
which permits data collection under controlled conditions and, based on this, allows preferences
for action alternatives to be determined without explicitly asking for them (for instance Train,
2003). In our DCE, farmers living in rural Bihar, India, were asked to make choices on their
preferred CD activities among training alternatives specified by relevant attributes such as
qualification of the trainer, method of training, additional offers connected to the training and
location and duration of the training. Moreover, the cost of training is included as a monetary
attribute, to allow the ‘implicit price’ to be calculated for a change in each of the above
mentioned non-monetary attributes. This is done by applying a mixed logit model in WTP space
to estimate the marginal WTP measures. This is a particularly relevant approach in view of the
fact that non-government organisations (NGOs) such as Preservation and Proliferation of Rural
Resources and Nature (PRAN) intend to introduce payment systems in the near future in order
to offer improved CD activities (PRAN 2016). To our knowledge, this is the first study to
estimate marginal WTP measures for different types of agricultural CD methods and it is also
the first to do so in a developing country context with small-scale farmers. The data obtained
could directly support NGOs in improving and pricing training measures in order to increase
their effectiveness.
The remainder of the paper is structured as follows: The section below describes the most
important characteristics of CD reported in the literature, the experimental design and the data
analysis method used. The empirical results obtained are presented and discussed, respectively,
in the next two sections. The final section provides a brief summary and suggests some
implications for experts conducting CD activities in the field and for policymakers.
2.2 Literature review and conceptual framework
Capacity development can occur in three different dimensions, that is at the systematic,
organisational and individual level. In this study, we focus on CD at the individual level, which

12
includes changes in behaviour and attitudes brought about by developing personal skills or
important knowledge through training (UNDP 2010; Mizrahi 2004; Fukuda-Parr, Lopes, and
Malik 2002). While CD also includes incentives and governance, its main focus is on the
process, followed by knowledge and skills acquisition (OECD 2006; Prasad, Sulaiman, and
Mittal 2015). Below we provide an overview of different criteria and dimensions, also defined
as attributes and levels, describing the CD process.
Training methods can be characterised as coaching, mentoring, short courses, formal education,
face-to-face interaction and distance/e-learning (Ludemann et al. 2012). Birner et al. (2009)
divide types of training into demonstrations, field days, short courses and farmer-to-farmer
exchanges. Rivera and Alex (2008) refer to sources of knowledge and information and split
these sources into schools, advisory services, in-service training and mass media and distance
learning. In the present study, this attribute is called ‘method of training’ and three levels are
defined: mass media, classroom training and classroom training with demonstration (Table 1).
Ludemann et al. (2012) divide different types of training provider into the categories scientists,
producers, research managers, education staff, trainers, advisory agents and staff from support
services. In the present study, these categories defining the attribute ‘trainer’ from small-scale
farmers’ perspectives are clustered into three levels: expert trained by university, expert trained
on the job and farming colleague.
Farmers are often supported with different goods and services. Besides the training and
education activity itself, other offers are credit (financial support), production inputs (trials of
seeds and fertiliser) and network activities (for example self-help groups) (Bingen, Serrano, and
Howard 2003; Gray et al. 2009; Peterson 1997; UNDP 2010). In the present study, this attribute
is called ‘additional offer’ (besides the training itself) and four levels are defined: credit,
production inputs, network activities and no offer at all.
Olenik and Fawcett (2013) split training duration into long-term courses, short-term courses
and flexible schedules, but do not provide explicit definitions of the terms. Therefore, we
analyse the duration of current training offered to farmers. Based on the terms used by Olenik
and Fawcett (2013) and the qualitative information collected, the attribute ‘training duration’ is
defined on three levels: half a day, one day and two days.
Training can be given at different locations. Robinson-Pant (2016) defines the location as
schools or other places such as community centres. However, UNESCO defines location by the
frequency of visits to participants (Robinson-Pant 2016). In this study, we focus on the distance,
explained in such a way that the participating farmers understood the levels. Thus, the attribute

13
‘location of training’ is divided into three levels: village, region with compensation for travel
costs and distant location, also with compensation for travel costs.
Table 2.1: Training attributes and attribute levels used in the discrete choice experiment
Attribute Level
Method of training Mass media
Classroom training
Classroom training with field demonstration*
Trainer Farming colleague*
Expert trained on the job
Expert trained by university
Additional offer Credit (financial support)
Inputs (trials of seeds/fertiliser)
Regular network activities with colleagues
No offer*
Duration of training Half a day*
One day
Two days
Location Village*
Regional, with compensation for travel costs
Distant, with compensation for travel costs
Training costs 50 Indian rupees (INR)
100 INR
150 INR
*This attribute level is common for farmers working with PRAN and was set as a reference
level
In developed countries, there is a trend towards privatisation of advisory services provided by
companies, but also by parastatals or agencies working for the government, but this trend is
more visible on commercial farms than on small-scale farms. Generating an income through
agricultural training offers stakeholders more possibilities for providing a supply of training
and also for meeting the specific demands of farmers (Ponniah et al. 2008). Research by Essers
et al. (2010) and Pederson et al. (2011) shows that the introduction of cost attributes does not
lead to changes in preferences of respondents. Based on focus group discussions with farmers
and expert discussions with stakeholders working in this region, we conclude that small-scale
farmers are price sensitive and that the average WTP for agricultural training is 100 Indian
rupees (INR; 100 INR = 1.56 USD). To assure the quality of the data, we set a linear price
attribute so that the difference between each price level is equal (Fifer, Rose, and Greaves
2014). Based on the qualitative data and literature, we define the attribute ‘cost of the training’

14
on three levels: below assumed WTP (50 INR), at assumed WTP (100 INR) and above assumed
WTP (150 INR).
2.3 Methods
Research area and sample
In order to collect empirical data, 664 smallholder farmers living in 27 villages in Bihar state,
north-east India, were interviewed in 2016. In Bihar state, 89 per cent of the population live in
rural areas and 62 per cent work in the agricultural sector (Census Organisation of India 2015;
World Bank 2016a). Agriculture in Bihar is characterised by low crop productivity relative to
potential yield, lack of water management, low investment rates and weak transport and
marketing infrastructure (World Bank 2005).
The farmers interviewed live in the districts of Nalanda, Gaya and Vaishali and were selected
in consultation with two partner organisations, Farms and Farmers Foundation (FnF) and
PRAN. To our knowledge, farmers in Bihar building agricultural capacity currently do not pay
for agricultural training, so we set the base price at zero INR. The villages in which the
interviewees live were also randomly chosen from a list of all villages in the region provided
by the partner organisations. We used a stratified random sampling method with the sampling
strategy to interview a minimum of 250 farmers working with a partner organisation and a
minimum of 250 farmers not working with a partner organisation. In the final sample, 196
respondents work together with PRAN and 98 together with FnF. Both organisations focus on
the agricultural sector and, until a couple of years ago, PRAN only worked with female farmers,
but nowadays male farmers also attend the agricultural training. FnF is more involved in
business activities than PRAN and is seeking to link advisory channels between farmers and
FnF business partners through modern communication technology, such as mobile phones and
smartphones. The FnF business partners mainly provide crop production inputs. The reference
level of the training attributes (Table 1) is based on training carried out by PRAN, as this is best
known to the respondents. The reference level is also the most common method currently used
to train farmers.
In our analysis, we use a qualitative approach as basis for the design of the DCE. Data from
pre-field visit was used to confirm the relevance and importance of the attributes and levels
used in the study, which are based on existing literature. During the pre-field visit, 16 key
informant interviews and five focus group discussions with a total of 71 participating farmers
were conducted. The focus group discussions were held in the villages. First, the groups and

15
key informants were asked about their understanding and definition of certain terms, such as
‘training’ and ‘capacity development’. Second, they were asked open questions about the
characteristics of training which matter to them and why. Third, farmers were asked to rate the
importance of characteristics defined as important in the literature, but not mentioned by the
farmers themselves.
The interviews in 2016 to collect the DCE data were carried out face-to-face by eight trained
Indian students using tablet computers with ‘Sawtooth Software’ (SawtoothSoftware 2017).
Before starting the interview, the interviewers checked that the main income of the household
comes from agricultural activities and that the interviewee works on the household’s farm. This
ensured that only small-scale farmers were interviewed. Graphics (Figure A2.1) were used
before starting the DCE, to explain the training characteristics, and during the DCE, to ensure
that all respondents understood the definitions in the same way (Mangham, Hanson, and
McPake 2009).
Experimental design
An unlabelled choice task approach is adopted in the DCE. The heading of each alternative
(within choice tasks) was generic (training 1, training 2) and the only way to discriminate
between the two alternatives were through the attributes. In the DCE, farmers’ training for CD
was characterised by six attributes (Table 1). The experimental design using Sawtooth software
(SawtoothSoftware 2017) meant that a total of 972 (35 x 41) training options were possible. A
balanced overlap heterogeneous design, rather than a homogeneous design, was used to
increase statistical efficiency in providing more variation across respondents and to reduce
problems with scale effects (that is variations in preferences due to the block of the design from
which data were generated) (Sándor and Wedel 2005). In this study, a heterogeneous design
meant that respondents were randomly assigned to one of 85 versions of the full design, each
of which includes seven randomised choice sets. An example of a choice task used for the DCE
is given in Figure 1. After the respondents had chosen one out of two possible options, they
were asked the closed-ended question: ‘Would you really choose the option selected, given
your current situation?’. This so-called ‘dual-response question’ was presented after each
choice set. Existing research suggests that inclusion of a dual-response question increases
statistical efficiency (Brazell et al. 2006).
Modelling and data analysis
Choice experiments are based on Lancaster’s theory of consumers and Mc Fadden’s random
utility theory (Abebe et al. 2013; McFadden 1973; Lancaster 1966). Following Lancaster

16
(1966), respondents chose the option with the highest level of utility. The utility of respondents
(𝑈𝑖𝑛) is represented as:
𝑼𝒊𝒏 = 𝑽𝒊𝒏 + 𝜺𝒊𝒏 (1)
where 𝑉 represents the deterministic part where factors observable by the analyst are included
and 𝜀 is a random component, which represents the non-observable components (Abebe et al.
2013).
The data are analysed using a mixed logit model estimated in WTP space. This method is
accepted practice in economics (Train and Weeks 2005; Sonnier, Ainslie, and Otter 2007;
Scarpa, Thiene, and Train 2008; Balcombe, Chalak, and Fraser 2009; Thiene and Scarpa 2009).
The utility function to be estimated is:
𝑈𝑛𝑗𝑡 = 𝑎𝑛𝑝𝑛𝑗𝑡 + 𝛽𝑛′ 𝑥𝑛𝑗𝑡 + 𝜀𝑛𝑗𝑡
(2)
where denotes the individual, 𝑗 describes alternatives and 𝑡 the choice situation. 𝑝𝑛𝑗𝑡
represents the price function, while 𝑥𝑛𝑗𝑡 represents other attributes (non-price attributes) of the
alternatives with a non-monetary value. 𝑎𝑛 represents specific individual coefficient for price
and 𝛽𝑛′ for the other attributes. 𝜀𝑛𝑗𝑡 is a random term of the function.
Following Train and Week (2005), we assume that 𝜀𝑛𝑗𝑡 is an extreme value distributed with
variance 𝜇𝑛2(
𝜋2
6). Dividing equation Fehler! Verweisquelle konnte nicht gefunden werden. b
y 𝜇𝑛 does not affect behaviour and results in a new error term that is independent and identically
distributed with variance of 𝜋2
6 :
𝑈𝑛𝑗𝑡 = 𝜆𝑛𝑝𝑛𝑗𝑡 + 𝑐𝑛′ 𝑥𝑛𝑗𝑡 + 𝜀𝑛𝑗𝑡
with: 𝜆𝑛 =𝛼𝑛
𝜇𝑛 and 𝑐𝑛 =
𝛽𝑛
𝜇𝑛
(3)
Equation (3) then represents the utility function in preference space.
The WTP for the attributes can be written as 𝛾𝑛 =𝑐𝑛
𝜆𝑛. Then equation (3) can be converted into:
𝑈𝑛𝑗𝑡 = 𝜆𝑛[𝑝𝑛𝑗𝑡 + 𝛾𝑛′𝑥𝑛𝑗𝑡] + 𝜀𝑛𝑗𝑡 (4)
which is what Train and Weeks (2005) call the mixed logit model in WTP space.

17
2.4 Results
Descriptive statistics
The sample (N=664) consists of 450 (68 per cent) male farmers and 214 (32 per cent) female
farmers, with an average age of 43 years (Table 2). The data used in this study is representative
for Bihar state based on the comparison with data of the Government and World Bank (Census
Organisation of India 2015; World Bank 2016a).
These farmers cultivate on average 1.8 acres (0.7 ha). Crop production is the most important
agricultural activity for 600 respondents (90 per cent), crop production and livestock production
are equally important for 49 respondents (7 per cent) and livestock is more important than crop
production for 15 respondents (2 per cent).
In total, 355 respondents (53 per cent) work together with a partner organisation, defined here
as any organisation working in the agricultural sector and supporting the farmers. Of the farmers
working with a partner organisation, 196 are PRAN members, 98 are members of FnF and 61
are members of another organisation, mostly a government organisation such as Jeevika or
‘Krishi Vigyan Kendra’ (KVK). Of the 664 respondents, 449 (68 per cent) had not received
training in the past year, 100 farmers had participated in one training event in the past year, 66
farmers in two training events, 32 farmers in three training events, 14 farmers in four training
events and three farmers had participated in more than five training events (mean 0.61 events
in the year; standard deviation 1.06; max. 7; min. 0).
As regards the DCE decision, 96 per cent would also have been taken under real circumstances
following the dual-response answers given by the interviewees. This is the reason why all
observations are taken into account in the analysis, even though the respondents were forced to
choose.

18
Table 2.2: Demographic data on respondents, households and farms (N= 664)
Respondent Freq. Per cent Mean SD Min Max
Age in years
43.06 12.61 13 90
Share of female farmers 214 32
Female head of household 49 13
Male head of household 329 87
Able to read (literacy rate) 490 74 0.44
Level of education
No degree 224 34
Primary school 187 28
Secondary school 179 27
Graduate and post-graduate 74 11
Hindu (religion) 658 99
General category 79 12
Other backward class 476 72
Scheduled caste 69 11
Another caste 34 5
Owner of a mobile phone 492 74 0.44
Owner of a smartphone 99 15 0.36
Household
Number of household members 6.06 2.49 1 15
Access to electricity 613 92 0.27
Access to internet 30 5 0.21
Access to television 217 33 0.47
Farm
Most important sector of farming
More crops than livestock 600 90
Crop and livestock equally 49 7
More livestock than crops 15 2
Working with PRAN 196 30 0.46
Working with FnF 98 15 0.36
Working together with a partner
organisation 355 53 0.50
Own land, total (acre)
1.76 3.38
Cultivated land, total (acre)
1.84 3.39 0 41
Participation in agricultural training events (no. in the past
year):
0.61 1.06 0 7
0 449 68
1 100 15
2< 115 17
(Source: authors own data and calculations)

19
Farmers’ preferences for capacity development
Total population
In the comparison of all attributes and levels, training method is found to be the most important
for the farmers interviewed, followed in order of rated importance by: additional offers,
duration of training, trainer and (least important) location of training. For the training method
attribute, classroom training with demonstration is set as the reference level and the levels ‘mass
media’ and ‘classroom training’ are both rated highly significantly negative relative to this.
‘Mass media’ (-175 INR) is less preferred than ‘classroom teaching’ (-152 NR) (Table 3).
Regarding the three levels of the attribute additional offer, the respondents report greatest
positive marginal WTP for inputs such as fertiliser or seeds (159 INR), followed by credit (135
INR) and network activities (121 INR). This indicates that any additional offer is more preferred
than the reference level (no additional offer). Regarding the attribute training duration, the
reference level of half a day is the most preferred, followed by one-day training (-30 INR) and
then two-day training (-84 INR). Regarding the attribute trainer, the reference level (farming
colleague as a trainer) is the least preferred, expert trained on the job is intermediate, with a
significant coefficient of 22 INR, and the most preferred level is academic trainer, with a highly
significant coefficient of 60 INR. The attribute location was the least important attribute and
within this attribute, the reference level of village training is the most preferred. The other two
levels (regional and distant training location) are represented by negative coefficients, with the
coefficient for training in a distant location being significant (-45 INR).
Comparison with partner organisation, training participants and gender
Differences between sub-groups of farmers are examined based on a data split per sub-group.
Model estimations using covariates were unfeasible because the model was not identifiable
(lack of degrees of freedom) (Kwak, Wang, and Louviere 2016). Farmers working together
with a partner organisation usually have more contact with consultants and staff of the
organisation, which might influence their preferences for training. In our sample, 53 per cent
of farmers work with a partner organisation. Furthermore, farmers experienced in training may
have different preferences (Dror et al. 2016; Birner et al. 2009). In our sample, 68 per cent of
farmers did not receive any training in the previous year. Besides the great variation in training
experience, Bihar is also still affected by a gender gap in access to advisory services (World
Bank 2010; D. M. M. Ghosh and Ghosh 2014), making it necessary to analyse the different
preferences of males (68 per cent in our study) and females.

20
Table 2.3: Mixed logit model in a willingness to pay space
Mean (All) Mean (Partner Org) Mean (No Training) Mean (Male)
Rank
Marginal
WTP
Std.
Err. Rank
Marginal
WTP
Std.
Err. Rank
Marginal
WTP
Std.
Err. Rank
Marginal
WTP Std. Err.
Method of
training
Mass media 3 -174.84*** -26.00 3 -181.85*** 35.85 2 -173.45*** 33.30 3 -224.17*** 58.31
Classroom 2 -152.39*** 22.77 2 -142.13*** 28.25 3 -175.72*** 32.62 2 -217.57*** 54.48
Classroom with
demonstration
1
Reference
1
1
1
Additional
offer
Credit 2 134.80*** 21.80 2 147.29*** 30.08 2 148.89*** 32.20 3 165.91*** 45.70
Inputs 1 158.79*** 23.83 1 151.93*** 31.36 1 175.47*** 33.51 1 199.42*** 52.37
Network
activities
3
120.60*** 20.46
3
119.98*** 27.11
3
124.73*** 27.94
2
180.03*** 49.42
None 4 Reference 4 4 4
Duration of
training Half a day 1 Reference 1 1 1
One full day 2 -29.53** 14.68 2 -9.07 18.33 2 -38.92** 19.44 2 -29.57 26.11
Two full days 3 -84.33*** 18.09 3 -82.39*** 25.08 3 -82.74*** 22.98 3 -94.73*** 33.42
Trainer Farmer 3 Reference 3 3 3
Expert 2 22.46* 12.67 2 20.18 16.31 2 3.63 16.18 2 33.90 24.36
Academic 1 60.46*** 15.54 1 72.25*** 21.73 1 36.46** 18.41 1 104.99*** 34.49
Location Village 1 Reference 1 1 1 Regional 2 -11.79 11.94 2 -2.27 15.56 2 -16.02 15.66 2 -2.49 21.98
Remote 3 -44.93*** 14.03 3 -31.52* 17.68 3 -46.13** 18.65 3 -72.59* 29.22
Price PP -5.45 0.15 -5.32 0.19 -5.48 0.19 -5.77 0.23
Log Likelihood -2938.46 -1548.42 -1981,74 -2006.42
Observations 9296
4970
6286
6300
(Note: *P<0.10 ,**P<0.05, ***P<0.01. Source: authors own data and calculations)

21
The most obvious difference between the results for the whole sample and for the different sub-
groups is that the marginal WTP among respondents who work with a partner organisation and
respondents who are male is higher than the WTP in the whole sample. In the following, the
results for the different attributes are explained one by one, each covering the three different
subgroups.
For the attribute method of training, respondents working with a partner organisation and male
respondents most preferred the reference level classroom training with demonstration and least
preferred mass media as a training method, for which their marginal WTP is -182 INR and -
224 INR, respectively. Male respondents indicate a greater aversion to mass media training than
all other groups in the total sample. Those who had not received any training in the previous
year show only a minor difference in WTP for mass media training (-173 INR) and classroom
training (-176 INR) in relation to the total sample.
The levels defining the attribute trainer are ranked similarly by the whole sample and all three
subgroups. The reference level (farming colleague as a trainer) is the least preferred and
academic trainer is the most preferred level of this attribute, with the main difference being the
marginal WTP for each group. The marginal WTP for an academic trainer is on average 61 INR
for the whole sample, 72 INR for respondents working with a partner organisation, 36 INR for
those without training in the past year and 105 INR for male respondents.
Regarding the attribute additional offer, the whole sample and all subgroups are most interested
in crop production inputs. The whole sample, respondents working with a partner organisation
and respondents without training in the past year show more interest in credit as an additional
offer than in network activities. The only exception is the male respondent’s sub-group, which
is more interested in network activities (WTP 180 INR) than in credit (166 INR).
For the whole sample and all subgroups, the reference level of training in the village is the most
preferred training location. As regards training duration, the reference level of half a day
training is most preferred by the whole sample and by all sub-groups.
2.5 Discussion
This study investigates the preferences of Biharian small-scale farmers regarding capacity
development (CD) activities. The results reveal that the most important attribute for farmers
regarding agricultural training is training method, with classroom training with demonstrations
being most preferred. This probably reflects the fact that most of the farmers in the study region
have a low education level. Mass media devices such as smartphones are the least preferred

22
level of the training method attribute. This can be explained by lack of experience of these
devices, based on lack of ownership, with the consequence that the interviewees could not see
the potential benefits of using smartphones. However, the accessibility of smartphones is
increasing rapidly worldwide (Karlsson et al. 2017). The low rating given to mass media
training contradicts previous findings on the ongoing development of ICT in agriculture in
developing countries (Aker 2011). One possible reason for this contradiction is that Aker (2011)
focus on mobile phones as an ICT device, whereas our study also includes smartphones, tablets,
television and radio. Use of ICT may also increase in Bihar in future when farmers see the
benefits and added value of using mass media for the development of agricultural capacities.
The organisation FnF is currently advising and providing farmers in the region individually
with relevant agricultural information through mobile phones now and smartphones in the
future.
To further support the use of mass media in agricultural capacity development, the target group
must already use a form of mass media and the providers of knowledge must be able to supply
the information by way of this mass media channel. In our study, the mass media training
method was less acceptable to male participants than to the entire sample, contradicting findings
by Antonio and Tuffley (2014) that men in developing countries, including India, have a higher
technology participation rate. However, Antonio and Tuffley (2014) also reported that women
have the capacity and desire to use more ICT devices such as smartphones. From this, it could
be assumed that there would be greater benefits for families and communities if women engaged
more in ICT use (Antonio and Tuffley 2014). Based on our results and the literature, it can be
recommended that, besides empowerment of females in developing countries, it is also
reasonable to support female adoption of mass media in order to develop capacities, because
this also strengthens families and communities.
The attribute ‘additional offer’ was rated the second most important overall and, within this
attribute, crop production inputs, such as fertiliser and seeds, was the most preferred level.
According to Peterson (1997), the reasons why farmers have a lack of inputs include limited
financial resources (for example credit), which is rated as the second most preferred additional
offer in this study. Credit would enable farmers to invest in inputs, which would increase yield
and farm income directly, in comparison with other additional offers (Bingen, Serrano, and
Howard 2003; Gray et al. 2009; Peterson 1997). Within the additional offer attribute, male
participants show greater WTP for network activities than for credit, which distinguish them
from the entire sample. In the study region, men are normally in charge of the household budget,

23
although financial empowerment of women can have positive influences on nutrition, education
and health (Fletschner 2009). Our results confirm that it would be more beneficial for
smallholder households if women had more control over financial decisions in agriculture.
Our results also show that, regarding the attribute ‘trainer’, respondents prefer an academic over
an expert trained on the job or a farming colleague, despite having least experience of academic
trainers. Male farmers and farmers working with a partner organisation show even greater WTP
for an academic trainer compared with the whole sample. This preference is reasonable because
researchers and scientists are generally seen as the most important source of information for
advisory services in developing countries (van den Ban 1997). However, small-scale farmers
were often trained by academics around 30 years ago and it was found to be less successful than
the participatory approach (Ferroni and Zhou 2012; Glendenning, Babu, and Asenso-Okyere
2010; Jones and Garforth 1997). At present, training in developing countries is predominantly
carried out using self-help groups, innovation platforms or train-the-trainer, without any
payment system, as PRAN is doing (Waddington et al. 2014). In Bihar, government
organisations such as KVK work together with agricultural universities at the district level
(Glendenning, Babu, and Asenso-Okyere 2010), but local farmers rarely cooperate with
organisations such as KVK. Thus, there seems to be a contradiction between our results and the
development of agricultural CD in recent decades. In future, research institutions and actors
involved in CD activities should seek to include academics in a successful way in training
activities.
With respect to the attribute ‘duration’, farmers prefer half-day training. The most reasonable
explanation is that farmers would like to include agricultural training without disrupting their
daily schedule, which depends on seasonal aspects, workload and production technique.
Women, in particular, take care of most daily responsibilities (FAO 2011). PRAN already takes
the preferred duration into account in its organised training sessions, so that more farmers are
able to participate.
Concerning the attribute ‘location’, respondents preferred the reference level of village-based
training, a preference which is already taken into account by local NGOs such as PRAN but not
by government organisations as KVK. Location of training was the least important attribute in
this study, confirming findings by FAO (2011). Farmers working with a partner organisation
revealed higher preferences for one-day training in a different village, possibly because of
positive experiences of their partner organisation and their training. Likewise, male respondents

24
reported a higher preference for training in another village than all respondents, possibly due to
less daily responsibilities.
Overall, the results add to the discussion on the private sector’s role in agricultural advisory
systems in developing countries raised by for example Feder, Birner and Anderson (2011).
Their study mentioned examples including India, where input suppliers are the most important
source of information for farmers. A pluralistic demand-induced community-driven approach
for India has been requested by previous studies (Babu et al. 2013). Involving private training
suppliers can be a good contextual fit, as it corresponds most closely to farmers’ preferences.
For example, FnF is already working with input suppliers and agricultural advisors. While
privatisation of agricultural training is not visible in our study area, it can be a way to meet
farmers’ demand for agricultural CD in future. Ensuring that poor farmers have access to
knowledge is one of the greatest challenges in the privatisation of advisory services (Feder,
Birner, and Anderson 2011). PRAN wants to apply a payment system for training activities in
the near future. One possible way to implement such a payment system could be to expand into
new regions and conduct scientific studies to analyse the effects.
2.6 Conclusion
Bihar is one of the poorest states in India, with a large share of the population living in rural
areas with poor infrastructure and resource scarcity, a common feature in developing countries.
To produce agricultural goods and gain a stable and sufficient income, small-scale farmers
living in rural areas need to develop their agricultural capacity. To improve agricultural capacity
development, it is necessary to understand farmers’ needs and demand for capacity-building
measures. There is little guidance in the literature on farmers’ preferences regarding agricultural
training. To our knowledge, this study is the first to analyse farmers’ preferences as WTP for
aspects of agricultural training such as training method, type of trainer, additional offers,
training duration and training location and the first to attempt this with a discrete choice
experiment. The data are analysed using a mixed logit in WTP space.
Overall, the results indicate that policymakers and stakeholders in agriculture in developing
countries should continue to shift from standardised top-down models towards decentralisation,
privatisation and demand-induced community-driven approaches, in order to achieve greater
mutuality, flexibility and customisation of training measures.
Training method prove to be the most important attribute of training, and within this attribute,
classroom training with demonstrations is most preferred, as PRAN is mostly doing. Farmers

25
indicate an aversion to using smartphones in agricultural training, despite global digitalisation
trends and current efforts to include modern ICT in agricultural capacity development. Mass
media would allow academic trainers (the most preferred type of trainer) to be involved in
training without increasing the costs and would allow agricultural production and marketing
information to be disseminated. Thus, policymakers should seek to overcome psychographic
and regional barriers to the implementation of mass media in capacity development.
The expressed preference for academic trainers questions the use of current approaches such as
‘train-the-trainer’, involving farmers in the knowledge replication process. Other approaches as
the ‘agricultural knowledge and information system’ already create direct links between
scientists and farmers by way of modern communication technologies.
Farmers prefer any kind of additional offer to no offer and most prefer an offer of crop
production inputs or credit, which are the best options for increasing agricultural yield and could
be included by training organisations. The respondents, especially women, prefer having
training close to home and fitting within a day, allowing them to perform their daily
responsibilities in the household. However, these are the least important attributes in the study.
The additional costs of demand-driven upgrading of capacity development activities could be
covered by a fee that complies with farmers’ WTP. To avoid exclusion of the poorest farmers
and also meet farmers’ demands, different additional services and goods, such as seeds, could
be introduced based on a voluntary payment system.
The hypothetical nature of the experiment is opposing one limitation of this study as it is not
able to measure actual behaviour of the respondents. Another way to analyse the preferences of
small-scale farmers regarding agricultural training in developing countries would be to use data
of a field experiment. However, the approach taken is appropriate because DCE permits data
collection under controlled conditions in an indirect survey, which is difficult to achieve by
other experiments and the number of respondents represented in this sample.

26
2.7 Appendix 2
Figure A2.1: Example of an unlabelled choice card
(Source: authors own graphic)

27
3 Understanding the relationship between trainers’ qualification, learning success and
satisfaction for agricultural capacity development in rural Bihar2
Abstract
Within capacity development, the type and quality of the trainer can play a crucial role in
promoting farmers’ capacity. Hence, the main purpose of this paper is to examine the
relationship between trainers’ qualification and learning success and satisfaction of small-scale
farmers during training activities in Bihar, India. Moderated mediation analysis is utilized to
measure the direct and indirect effects of trainers’ qualification on learning success and
satisfaction. Therefore, the psychological constructs of attitude and perceived control from the
Theory of Planned Behaviour (TPB) operate as mediators, subjective norms act as moderator,
and gender and age serve as covariates. The results do not indicate a distinction of satisfaction
among farmers regarding trainer qualification. However, learning success decreases with an
academically educated trainer. The change of attitude during the training has a significantly
positive influence on satisfaction. Subjective norms also influence the participants’ satisfaction
positively. Thus, we suggest for practical implications combining an expert trained on-the-job
as the main trainer with an academically educated trainer integrated via modern technologies.
In addition, the social environment has to be addressed within the training. Besides the
professional background, it is important that trainer gets trained on teaching methods and other
soft skills. The results further show that the behavioural constructs are relevant in the field of
agricultural education and extension. Theoretical implications can be drawn regarding the
improvement of this conceptual framework and other related studies. Whilst various studies
have addressed the identification of farmers’ capacity development preferences, few have
investigated the relationship between trainer qualification, learning success and satisfaction.
Keywords
Agricultural training, trainer qualification, moderated mediation, small-scale farmers, India
2 This chapter is co-authored with Sabrina Kimmig (SK) and Carl Johan Lagerkvist (CJL). The authors’
contributions are as follows: Dirk Landmann (DL) designed the research. DL and SK collected the data. DL
analysed and interpreted the data. CJL assisted in the analysis and interpretation of the results. DL wrote the paper.
SK and CJL commented at the various stages of the research and contributed to writing and revising the paper. All
authors read and approved the final manuscript. This manuscript is published in the ‘GlobalFood Discussion Paper
Series’ and submitted to the ‘Journal of Agricultural Extension and Education’. The share of the total work done
by DL is 70 per cent.

28
3.1 Introduction
Agricultural training activities are integrated into the programmes of international development
organisations such as the FAO (Food and Agriculture Organization of the United Nations),
which utilize training as the primary method to strengthen the capacities of actors - such as
small-scale farmers – in the areas of agriculture, nutrition, food security and rural development
(World Bank 2007; de Rosa et al. 2016). A wide range of agents is involved in the extension
system for agricultural development including scientists, producers, managers, education staff,
trainers, extension agents and staff of support services (Ludemann et al. 2012, 19–21).
Extension agents play a major role in promoting farmers’ capacity. Extension agents and
trainers need expertise, a special skill set and experience with addressing the needs of small-
scale farmers in order to work successfully (Hellin 2012; Höckert and Ljung 2013). Teaching
of practical skills for agricultural purposes involve the use of accurate explanations to allow
participating farmers to follow the processes and apply the skills. Therefore, teaching needs a
high level of competency in a teacher to both disseminate knowledge and demonstrate precise
step-by-step guidance (Swailes and Roodhouse 2004).
The approach of teaching small-scale farmers by academics was used around 30 years ago and
was declared as not successful in comparison to the participatory approach (Ferroni and Zhou
2012). However, researchers and scientists are seen as the most important source of information
for extension services in developing countries (van den Ban 1997). The participatory approach,
which is currently more often used, was developed to be more efficient, more sustainable
regarding the duration of professional relationships, and more adaptable to local circumstances
(Birner et al. 2009). Other approaches such as the ‘agricultural knowledge and information
system’ create direct links between scientists and farmers via modern communication
technologies to strengthen communication (J. R. Anderson 2007). Teachers’ education has a
crucial role in the improvement of educational systems around the world. In comparison,
businesses worldwide have a certain level of ‘professionalism,’ meaning standard qualifications
such as master’s degree. ‘Extension and Advisory Services’ (EAS) for agricultural development
have only recently begun to increase their level of professionalism. Hence, in 2016 the ‘Global
Forum for Rural Advisory Service’ (GFRAS) conducted a scoping study to evaluate their
regional networks and draw conclusions to improve their services. Additionally, it aimed to
encourage information exchange regarding training, talent and career development,
performance incentives, certification and standards (Terblanche 2017). According to Davis
(2015), extension should be recognised as a profession and staff should be connected to

29
societies to allow for professional education and development. This also includes a better
balance between technical and practical skills.
Relevant to the participation in training programs, farmers continually modify, revise and even
set aside their personal beliefs and views as they learn more about the subject of interest, their
own behaviours and social environments (Bhattacherjee and Premkumar 2004). To this end,
the attitude and perceived control for participation in agricultural training can be expected to
represent key determinants to learning success and satisfaction of agricultural training while
acting to induce behavioural change in accordance with the training activity (Topală 2014; Ko
and Chung 2014; Chatman and Sparrow 2011; Bihler 2006).
The aim of the present study is to examine whether there is a distinction in learning success and
perceived satisfaction of agricultural training among farmers as a result of the trainer’s
educational qualification. For this purpose, we investigate whether the change of attitude and
perceived control of farmers participating in training for agricultural capacity development
mediate the effect of learning success or perceived satisfaction depending on the type of trainer.
Finally, we test whether the relation between trainer type and the learning success or perceived
satisfaction is moderated by farmers’ subjective norms.
The results of this paper are expected to provide policymakers and providers of extension
services with insight into the underlying psychological factors that influence participation in
agricultural training. These insights can be used to adjust current policies and to develop new
initiatives to stimulate knowledge transfer and participation in agricultural training programmes
by small-scale farmers.
3.2 Literature review and present study
Lack of information and knowledge is a frequently cited barrier to the adoption of new
agricultural practices in developing countries (Aker 2011; Norton, Alwang, and Masters 2006).
Often, farmers are simply not aware of new techniques and associated benefits, or they do not
possess the necessary skills or know- how. Hence, active promotion - as well as provision of
accurate information, extension and education on technologies - are frequently identified as
indispensable for building awareness and improving farmers’ knowledge and skills (Knowler
and Bradshaw 2007). Providing agricultural extension services to farmers can bridge the
knowledge and capacity gap by educating farmers in agricultural production and management.
Furthermore, extension is an opportunity to answer to farmers’ needs concerning knowledge
and skills. Extension serves as the intermediary between farmers and scientists(J. R. Anderson

30
2007). Depending on the farmers’ knowledge, the trainer can fulfil different roles, from the
traditional role of an expert delivering answers to specific questions, to a facilitator engaging
in a joint learning process together with the farmer (Ingram 2008; Leeuwis and van den Ban
2004). Therefore, trainer and extension agents should be qualified with regard to technical and
functional skills (J. R. Anderson 2007; K. Davis 2015).
However, some actors within the extension system may have a vested interest in maintaining
the status quo, hidden agendas or a reluctance to deal with more marginalized areas
(Chowdhury, Odame, and Leeuwis 2014; Muyanga and Jayne 2008). This means a good
working programme needs clear rules, education and training for staff and adequate financial
resources. Otherwise, the system risks becoming relatively ineffective (Norton, Alwang, and
Masters 2006).
The conceptual framework developed for the present study describes the relationship between
trainer type and learning success (Figure 3.1) as well as learning satisfaction (Figure 3.2). For
this study, attitude defines the respondent’s unfavourable or favourable evaluation regarding
the agricultural training programme. Perceived control describes the perceived ease or difficulty
to behave in a certain way. Subjective norms denotes social pressure to act in a specific way or
not (Ajzen 1991). There are various causes why farmers are affected by their social
environment: they aspire for respect, they want to demonstrate their commitment to family
values, or they aspire to improve through advise and additional knowledge of a third person
(Martínez-García, Dorward, and Rehman 2013).
Learning success
According to Gardner (2009), success means to improve the results of one’s actions in a
particular situation, e.g. learning success within an agricultural training as a purposeful activity
to change one's own capacities. Learning can occur with the most varied results, and therefore
it is necessary to measure learning success and to set precise learning goals. The learning control
describes the outcome of the offered training. The acquisition of knowledge can be subdivided
into declarative and percentage knowledge. Declarative knowledge involves the more factual
knowledge as well as complex content. Percentage knowledge controls the execution of the
skill. Therefore, it is important to integrate various types of knowledge acquisition methods to
prevent conveying information that cannot be applied (Kirkpatrick and Kirkpatrick 2012).
A further distinction is made related to quantitative knowledge, which includes professional
development, and qualitative knowledge acquisition describing a deeper discussion with
interdisciplinary connections. In the context of learning success quantitative and qualitative

31
knowledge increasement have emerged. Another important point which is influenced by further
training is the change of motivational factors. Individuals’ interest arises when a person is
concerned with specific learning objects. In this context, interest development should be
directly related to the subjective experience that influences the experience (Bihler 2006).
Figure 3.1: Research model 1 with y = learning success
(Source: own depiction based on Hayes 2012; Ajzen 1991)
In the first research model (Figure 3.1), changes in attitudes and perceived control due to the
training can potentially influence the relation between trainer type and learning success. The
direct relationship between trainer type and learning success are also assumed to be moderated
by farmers’ subjective norms. Additionally, gender and age are introduced as covariates.
Perceived satisfaction
Satisfaction of training is described as a cognitive-evaluative attitude of the person related to
his or her educational situation. Satisfaction is characterised by a subjective perception, which
is a comparison of perceived and assessed characteristics of a training situation compared to
personal expectations. If the individual expectations exceed the assessed training situation,
dissatisfaction develops. In general, perceived satisfaction does not always lead to learning
success and is not directly related to performance, but it is a value to compare and evaluate
further training. Perceived satisfaction and learning success can be used as a reference variable
to measure the quality of an agricultural training activity. The more demanding a situation or
task the more important is the promotion of professional competencies among the trainers in
further training measures (Bihler 2006).
In the second research model (Figure 3.2), perceived training satisfaction refers to outcome
expectancies (i.e. a comparison between perception and evaluation of the learning situation). It

32
is hypothesized that changes in attitudes and perceived control due to the training mediate the
relation between trainer type and learning satisfaction and the individual expectations. The
direct relationship between trainer type and learning success are again assumed to be moderated
by farmers’ subjective norms.
Figure 3.2: Research model 2 with y = perceived satisfaction
(Source: own depiction based on Bihler 2006; Hayes 2012)
3.3 Materials and methods
Data collection and sample
This study is based on face-to-face interviews as part of a questionnaire that was developed
following literature review, discussion with NGOs and related stakeholders in Bihar state in the
North-East of India.
Bihar state has a population of 104 million people (2011), owing to a population growth of 25
per cent in the last decade. In India, Bihar is one of the poorest states in India, with a per capita
Net State Domestic Product of 235 USD (Rodgers et al. 2013). In 2011, 62 per cent of the total
population were literate. In rural areas of Bihar, the literacy rate for males and females stood at
70 per cent and 44 per cent. However, only 24 per cent of adults have a secondary education or
higher. Agriculture is the most important employment sector in Bihar, since 81 per cent of the
entire population work in the agricultural sector (Government of India 2008). Yet the
agricultural share of the Bihar GDP decreased from 43 per cent in 1980-1981 to 18 per cent in
2009-2010 (Sharma and Rodgers 2015). In rural Bihar, agriculture remains the primary
livelihood of individuals. The sector is dominated by small-scale farmers and is central in
improving living standards (Rodgers et al. 2013).

33
During December 2016, a total sample of 217 randomly selected farmers from ten villages of
Nalanda and Gaya completed the survey. The data collection and training carried out as part of
the study were conducted in cooperation with the local NGO ‘Preservation and Proliferation of
Rural Resources and Nature’ (PRAN). The focus of PRAN’s work is to improve the standard
of living regarding food security and to generate income through climate resilience technology
(PRAN 2015).
Participants were recruited through stratified random sampling. A minimum of 100 farmers
receiving agricultural training given by an expert trained on the job were interviewed. Likewise,
a minimum of 100 farmers receiving a training by an academically educated trainer were
interviewed. Both training covered ‘good agricultural practices’ and used a similar method to
train on the management and intensification of wheat production.
The questionnaire first explored sociodemographic variables, attitude, subjective norms,
perceived control before the training. Following a short introduction and after receiving a
consent to participate, participants were randomly allocated to one out of a total of ten training
sessions. Out of these ten sessions, five were given by a PRAN trainer who was trained on-the-
job and five by an academically educated trainer. Each training session lasted approximately
three hours. After the training, participants completed a follow-up survey detailing attitude,
perceived control, and other aspects related to training experiences including satisfaction and
learning success.
Out of the entire sample size, the proportion of male respondents is 34 per cent, while that of
female respondents is 66 per cent, which is to be expected given that PRAN worked only with
women until a couple of years ago. The age range of the participants is between 19 and 90 years
with an average age of 44 years. The education is shown to be mainly low. A large per centage
of the surveyed farmers have no degree (59 per cent). On the other hand, 24 per cent attended
primary school, another 11 per cent secondary school, and five per cent graduated.
Approximately 32 per cent reported having participated in one agricultural training course, 26
per cent having taken part in two agricultural trainings in the last 12 months, and 33 per cent
have not attended a training session. The farmers focus mainly on crops, especially wheat,
paddy and vegetables. The characteristics of the sample are presented in Table A3.1.
Measures
Measures for the psychological constructs of the TPB are adapted from items according to
Ajzen (2006). The participants were asked how likely they were to agree about e.g. importance
and usefulness of agricultural training using Five-point Likert scales, ranging from ‘strongly

34
disagree’ (1) to ‘strongly agree’ (5). Similar statements are used to measure attitude towards
information exchange, self-organisation, application of training content and how instructive the
session was. The same statements were asked before and after the agricultural training. The
construct ‘attitudes’ (Cronbach’s alpha = 0.63) is created through factor analysis with the
differences of equally asked statements before and after the training session.
The same process is applied for perceived control. Dimensions are adapted from other literature.
The farmers were asked how much they would agree with statements regarding their ability to
improve their income, their ability to acquire new agricultural techniques, their desire to
develop themselves, opportunities for future agricultural training and the overall effect
generated by agricultural training. The construct ‘perceived control’ (Cronbach’s Alpha = 0.39)
is built by aggregating the different responses to the same statements before and after the
training through factor analysis.
Respondents were asked to what extent family members expect them to succeed and improve
their knowledge through agricultural training. Additionally, questions related to support of the
family, close relatives and the overall social environment in relation to agricultural training
were asked. The construct ‘subjective norms’ (Cronbach’s Alpha = 0.72) is developed by
aggregating the statements through factor analysis.
The measurement of perceived satisfaction is particularly difficult due to differences in opinion,
in that the same results cannot be expected despite the same survey instrument Žabkar, Brenčič,
and Dmitrović (2010). To operationalize the construct ‘perceived satisfaction’, we use a set of
various statements belonging to different criteria, such as reason to attend, knowledge transfer,
training content, trainer and duration (Cronbach’s Alpha = 0.81).
Participants were asked ten questions related to the training content such as the quantity of seeds
per land unit, the requirements for wheat seed sowing and information related to irrigation and
fertilizer application. The respondents had the choice between four answers of which one
statement is clearly correct. If a respondent answered all ten questions correct, a total score of
100 per cent is achieved.
Data analysis
Statistical analyses are performed with the software programme SPSS 24. Descriptive statistics
such as chi-square association tests and independent sample t-tests are applied to profile
respondents according to their familiarity with agricultural training. The adequate internal
reliability consistency of the multi-item scales is assessed with Cronbach’s alpha. Kline (1993)

35
quotes that even values below 0.7 are acceptable regarding psychological constructs because of
the construct’s diversity. Individual item loadings for constructs with a value greater than 0.5
are acceptable. Kaiser-Meyer-Olkin (KMO) measurements and Bartlett’s test of sphericity are
also tested for scale reliability and validity (Field 2009).
A general linear modelling approach was adopted to estimate the direct and indirect effects in
Figure 3.1 and 3.2 respectively based on the literature on moderated mediation (Hayes 2012;
Hayes and Preacher 2014; Preacher and Hayes 2004; Hayes 2015). Changes in perceived
control and changes in attitude of farmers during the training were used as mediators.
3.4 Results
Learning success
Figure 3.3 shows the results from the moderated-mediation model one in which the trainers’
qualification predicts the dependent variable learning success. Learning success explains 27.9
per cent of the total amount of variance, which is described as medium effect size by Cohen
(1992), and is highly significant (Table A3.2). The variable trainers’ qualification has a highly
significant negative influence (Coeff. = -20.662; Table A3.3) on learning success, meaning that
farmers’ learning success drops by 21 percent if they were taught by an academically educated
trainer.
Figure 3.3: Path coefficient of the research model 1- learning success
(Source: authors own illustration; *** p < 0.01; Note: solid lines represent statistically
significant relationships)
The indirect effects of mediators and the behavioural constructs of attitude and perceived
control cannot be confirmed respecting the score based and performance-driven variable

36
learning success. This interpretation is based on the fact that the confidence interval produced
by bootstraps includes the value of zero (Table A3.4). The results in Table A3.5, show that the
product of the trainers’ qualification and the factor subjective norms does not have a significant
influence on learning success. By this fact we cannot confirm a moderating role of subjective
norms.
Perceived satisfaction
Figure 3.4 presents the results from the moderated-mediation model two in which the trainers’
qualification predicts the dependent variable perceived satisfaction, explaining a medium
effective size (34.7 per cent). The perceived construct satisfaction is highly significant (Table
A3.2) but is not driven by the trainers’ qualification. However, the behavioural construct
attitude has a positive significant influence (Coeff. = 0.356; Table A3.3) on participant
satisfaction. This means the change of respondents’ attitude during the training has a positive
influence on satisfaction. The mediator attitude is significant but only explains 6.7 per cent of
the total amount of variance, which can be described as a small effect size magnitude but is still
acceptable in social science (Cohen 1992).
Figure 3.4: Path coefficient of the research model 2 -perceived satisfaction
(Note: *** p < 0.01; solid lines represent statistically significant relationships;
Source: authors own data, calculations and illustration)
The indirect effects of attitude and perceived control cannot be confirmed regarding perceived
satisfaction (Table A3.4). Perceived control is also not significant and explains 1.4 per cent of
the total amount of variance. The moderator and independent variable subjective norms (formed
for example by neighbours or colleagues) influence the satisfaction positively (Coeff. = 0.618).

37
However, we cannot confirm a moderating role of subjective norms between trainers’
qualification and satisfaction (Table A3.5).
With respect to the covariates, gender - more specifically being a male respondent - has a
negative significant influence on perceived satisfaction (Coeff. = -0.255). The covariate gender
also has a highly significant but positive influence (Coeff. = 0.483) on the construct attitude
(Table A3.3). This means that being a male respondent has a positive influence on the change
in attitude during the training.
3.5 Discussion
This study investigated how learning success and satisfaction of agricultural training
participants were influenced by trainers’ qualification and to what extent this influence was
affected by gender, age, attitude, perceived control and subjective norms. The results from this
study, therefore, contribute to the existing literature on farmer training and agricultural
extension by using psychological constructs from the TPB to explore the relationship between
trainers’ qualification and learning success as well as satisfaction. To our best knowledge, this
is the first study providing such in-depth account of physiological constructs in the context of
agricultural training. The paper shows that farmers’ learning success is reduced if an
academically educated trainer conducts the training. However, the reduced learning success in
the first model confirms (e.g. Hellin 2012) that trainers need to be well educated and require a
special skill set along with experience of working with small-scale farmers in order to achieve
the desired effect of the training. This leads to the conclusion that, based on our study, the
missing experience of the academic trainer related to the agent causes lower learning success
of the participants. The change in attitude does not mediate the relation between trainer and
learning success in a statistically significant way in the first model. The interpretation for this
could be that farmers are not aware of their own learning performance. Furthermore, the change
of perceived control did not mediate the relation between trainers’ qualification and learning
success. The most reasonable explanation for the low influence of perceived control could be
that this behavioural construct does not change during the time of training. Also, subjective
norms have no significant direct effect on learning success. A possible interpretation of the
insignificant influence of the behavioural constructs is the low importance regarding learning
success due to the fact that learning success is a score based and performance driven variable.
The results of the second model, including the depended perceived satisfaction, do not show a
distinction in the perceived satisfaction as a result of the trainers’ qualification, even though the
learning success decreases with an academically educated trainer. Training given by academics

38
is declared as not successful in comparison to the participatory approach (e.g. Ferroni and Zhou
2012; Birner et al. 2009). Even if these arguments sound reasonable after analysis of the
literature, it might not be the case from the small-scale farmer point of view in developing
countries (e.g. van den Ban 1997). The second model also indicates that the changes of attitude
over the training do not function as a mediator on perceived satisfaction. However, the change
of attitude influences the perceived satisfaction positively and significantly. It is well known
from social-psychology literature that attitudes are important determinants of subsequent
behavioural change (Ajzen 1991). A positive influence towards satisfaction can be a sign that
the trainer, at least to a certain extent, is able to reach the farmers with the content of the training,
and this leads to a higher possibility of knowledge transfer as well as implementation and
replication of what was discussed during the training. The prospect of improvement of
agronomic practice and farm management as a result of the training is an important factor. If
farmers are not interested in improving their skills and knowledge, the training is superfluous
and will likely not involve the farmers asking questions or starting a discussion. Farmers who
do not want to learn new skills or gain from other associated benefits do not attend training at
all. A positive attitude can be a driver for successful participation in an agricultural training. In
this regard, opinions and behaviour of peers are important factors influencing the formation of
the decision-maker’s attitude (Rogers 1995).
Furthermore, the change of perceived control did not mediate the relation between trainers’
qualification and perceived satisfaction. Possible explanations could be that perceived control
is not important regarding perceived satisfaction, or the construct perceived control does not
change during the training.
Next, subjective norms were found to have a significant direct effect on perceived satisfaction.
However, subjective norms do not moderate the relationship between trainers’ qualification
towards perceived satisfaction or learning success. Subjective norms are important in
individuals’ behaviour and perception because individuals are not unbiased of cultural and
social effects. Instead, they continuously refer their behaviour to individuals who are of
fundamental importance (Burton 2004). In this way, peers can actively bias farmers’ intention
to participate in agricultural training courses by motivating them and making evident their
positive attitude towards participation and application of the new methods. Even though a
farmer holds a positive attitude towards the adoption of a certain technology such as the system
of wheat intensification, social influence can inhibit this attitude from being presented in real
behaviour (Burton 2004). However, the social environment can stimulate a farmer to adopt a

39
new methodology, even while that farmer has a negative attitude towards the behaviour. These
individuals can be used as central key to influence and motivate farmers to adopt a new
methodology (Garforth et al. 2004; Martínez-García, Dorward, and Rehman 2013). In the
context of the present case, farmers may be encouraged by individuals such as their spouse,
village chief, farmers group, and extension workers to participate in agricultural training
activities. Against this background, the social environment plays a pivotal role with regard to
the quality of the training.
The results of this study are expected to provide policymakers and NGOs with insights into the
underlying psychological factors that influence the participation in agricultural training. These
findings can be utilized to adjust current policies and to develop new activities to promote
knowledge transfer and participation in agricultural training programmes among farmers. We
suggest combining the strengths of both trainer types. An expert trained on-the-job could be the
main trainer, while an academically educated trainer could support or lead one of the number
of training using modern ICT. With this method, the benefits of both trainer types could be
utilized without increasing costs. Our results also indicate that farmers are influenced by
individuals who are close to them, such as family, friends, neighbours as well as fellow farmers.
Therefore, actors involved in the provision of extension should keep in mind that a good image
and support among local stakeholders is of upmost importance in order to have quality
participation among targeted farmers and encouragement of the social environment. Training
activities in line with the preferences of farmers as well as, for instance, open days to promote
the NGO approach can help in this regard. Besides the professional background, it is important
that training of trainers is undertaken integrating cultural sensitivity, various teaching methods
and other soft skills. In addition, policymakers can prioritize expanding training opportunities
for extension workers in order to improve trainers’ qualification and thus increase access to
quality information among small-scale farmers.

40
3.6 Appendix 3
Table A3.1: Characteristics of respondents, and farms (N= 217)
Respondents Per cent Production focus Per cent
Gender Only crops 46
Female 66 More crops than livestock 53
Male 34 Crop type*1
Average age (years) 44 Paddy 95
Education
Wheat 91
No degree 59 Vegetables 83
Primary school 24
Secondary school 11
Graduate 5
No training experience 33
(Description: *1 Yes/No answers; Source: authors own data and calculations)
Table A3.2: Model summary
Construct R R-sq MSE F df1 df2 p
Attitude 0.259 0.067 0.962 4.828 3 201 0.003
Perceived control 0.118 0.014 1.015 0.952 3 201 0.417
Learning success 0.528 0.279 307.408 10.894 7 197 0.000
Perceived satisfaction 0.589 0.347 0.671 14.925 7 197 0.000
(Source: authors own data and calculations)

41
Table A3.3: Direct effects of mediators, moderators and covariates on the dependent variables
Dependent
variable
Independen
t variable Coeff. se t p LLCI ULCI
Attitude
Constant 0.325 0.290 1.120 0.264 -0.247 0.896
Treated -0.190 0.143 -1.331 0.185 -0.471 0.092
Gender 1 0.483 0.148 3.257 0.001 0.191 0.775
Age -0.009 0.006 -1.534 0.127 -0.020 0.003
Perceived control
Constant -0.196 0.298 -0.658 0.512 -0.783 0.391
Treated -0.144 0.147 -0.980 0.328 -0.433 0.145
Gender 1 0.010 0.152 0.066 0.947 -0.290 0.310
Age 0.006 0.006 1.077 0.283 -0.005 0.018
Learning success
Constant 79.998 5.241 15.264 0.000 69.663 90.334
Treated -20.662 2.572 -8.032 0.000 -25.735 -15.589
Attitude 0.857 1.422 0.603 0.547 -1.947 3.661
Perc. control -0.655 1.291 -0.507 0.613 -3.202 1.891
Subjective
norms 1.680 1.881 0.893 0.373 -2.031 5.390
Int_1 -1.159 2.542 -0.456 0.649 -6.171 3.853
Gender 1 4.382 2.742 1.598 0.112 -1.026 9.789
Age -0.103 0.104 -0.987 0.325 -0.309 0.103
Perceived
satisfaction
Constant 0.320 0.245 1.307 0.193 -0.163 0.803
Treated -0.065 0.120 -0.538 0.591 -0.302 0.172
Attitude 0.356 0.066 5.366 0.000 0.225 0.487
Perc. control -0.049 0.060 -0.816 0.416 -0.168 0.070
Sub. norms 0.618 0.088 7.028 0.000 0.444 0.791
Int_1 -0.056 0.119 -0.475 0.636 -0.291 0.178
Gender 1 -0.255 0.128 -1.993 0.048 -0.508 -0.003
Age -0.005 0.005 -0.948 0.345 -0.014 0.005
(Note: 1 0= Female; 1= Male; Int_1 : treated x FacSN; Source: authors own data and calculations)

42
Table A3.4: Indirect effects of mediators on dependent variables
Dependent variable Mediators Effect BootSE BootLLCI BootULCI
Learning success
TOTAL -0.069 0.376 -0.914 0.660
Attitude -0.163 0.320 -0.903 0.413
Perceived control 0.094 0.271 -0.405 0.736
Perceived satisfaction
TOTAL -0.061 0.050 -0.164 0.033
Attitude -0.068 0.050 -0.172 0.028
Perceived control 0.007 0.015 -0.016 0.043
(Note: Boot= bootstrapping; Source: authors own data and calculations)
Table A3.5: Test(s) of highest order unconditional interaction(s)
Dependent variable Independent variable R2-chng F df1 df2 p
Learning success X*W 0.001 0.208 1 197 0.649
Perceived satisfaction X*W 0.001 0.225 1 197 0.636
(Source: authors own data and calculations)

43
4 Determinants of small-scale farmers’ intention to use smartphones for generating
agricultural knowledge in developing countries - evidence from rural India3
Abstract
Access to and usage of smartphones for agricultural purposes amongst small-scale farmers in rural
areas of developing countries is still limited. Smartphones may provide an opportunity to develop
farmers’ capacities with specific applications offering fast access to continually updated and
reliable information. This study investigated the behavioural drivers of smallholder farmers´
intention to use a smartphone in a developing country context. For this, survey data was collected
from 664 randomly selected small-scale farmers in Bihar State, India in 2016. The analysis
included a partial least square estimation of the behavioural model. The results confirm positive
influences on the intention to use a smartphone for agricultural purposes through subjective norms,
attitude, self-control, as well as positive and negative anticipated emotions. There is no evidence
that negative anticipated emotions related to failure outweighed other factors. These results extend
the academic literature with new conceptual insights and provide application-oriented implications
for stakeholders, such as NGOs, extension services and research institutes.
Keywords
Smartphone, agriculture, small-scale farmers, Theory of Planned Behaviour (TPB), Structural
Equation Modeling (SEM), Partial Least Squares (PLS), developing countries, India
3 This chapter is joint work with Carl Johan Lagerkvist (CJL) and Verena Otter (VO). The contributions are as follows:
Design of the research Dirk Landmann (DL), CJL, VO; Literature review: DL, VO; Data collection: DL; Analysis of
the data: DL; Interpretation of the results: DL, CJL, VO; Writing the paper: DL, VO. The share of the total work done
by DL is 60 per cent.

44
4.1 Introduction
Agricultural production is complex, and farmers need to make proper and timely decisions on a
range of several agricultural subjects at different stages of the production cycle. To this end,
external information sources may provide farmers with input to help with the best time for seeding,
to improve market access or to adopt more efficient technologies (Aker 2011; Mittal, Gandhi, and
Tripathi 2010). In this regard, it is not only the pure access to information but also the generation
of knowledge through combining, reflecting and concluding on information sought, that should
enhance farmers’ capacities (Aker, Ghosh, and Burrell 2016). Smallholder farmers in the rural
areas of developing countries are still especially disadvantaged with regard to capacities involving
modern sustainable farming practices. In such a developing country context, the most common
measures with which to disseminate knowledge over the past decades have been extension services
such as Farmer-Field-Schools or Self-Help-Groups based on frontal teaching methods to farmers
or with direct interaction with experts through a participatory and demand-driven approach
(Phillips, Waddington, and White 2014). The necessity of personal presence and the resulting
inequalities of access have been criticised as inhibiting such measures’ efficiency (Phillips,
Waddington, and White 2014).
Information and Communication Technology (ICT) provide potential for developing farmers’
management capacity. Additionally, ICT can also be catalyst to improve the effectiveness of the
agricultural extension system (Glendenning and Ficarelli 2012). Existing studies on ICT usage in
developing countries’ agricultural sectors have either focused on socio-economic adoption drivers
(e.g. Aleke, Ojiako, and Wainwright 2011), on cognitive usage drivers (Verma and Sinha, 2016),
or on usage-related performance effects (e.g. Aker 2011; Sekabira and Qaim 2017). Recent
research has suggested that smartphones may provide an opportunity to further develop farmers’
capacities through specific applications offering fast access to continually updated and reliable
information (Aker 2011; Aker, Ghosh, and Burrell 2016). However, the access and usage of
smartphones for agricultural purposes among small-scale farmers in rural areas of developing
countries is still limited, even though this type of phone is becoming more widespread. To the best
of our knowledge, no previous study has examined the drivers of farmers’ smartphone usage for
agricultural purposes by taking the affect into account. Based on a conceptual model which
integrates Perugini’s and Bagozzi’s (2001) goal-based behavioural model with the model of
technology acceptance by Cheon et al. (2012) and Venkatesh and Davis (2000), the objective of
the present study is to develop and empirically test a comprehensive behavioural model for

45
identifying and quantifying the drivers of smallholder farmers´ intention to use a smartphone in
developing countries. For this purpose, primary data from 664 small-scale farmers was collected
in Bihar State, India, in 2016. The results of this study may provide the foundation for concrete
smartphone implementation strategies in the agricultural production sectors of developing
countries.
The Indian state of Bihar has a high population density of more than 100 million inhabitants, of
which 34 per cent live below the poverty line - 1.90 USD per day. A large proportion of the
population (89%) lives in rural areas with geographically diverse terrain and mostly in scattered
villages (Census Organisation of India 2015; World Bank 2016a; Chauhan 2010).
Correspondingly, 62 per cent of the population works in the agricultural sector. As in many other
developing countries, agriculture in Bihar shows low crop productivity, lack of water management,
low investment rates, and weak infrastructure with regards to transport and marketing (World Bank
2005; Rodgers et al. 2013). Such circumstances are addressed by NGOs such as ’Farms and
Farmers Foundation’ (FnF) and ‘Preservation and Proliferation of Rural Resources and Nature’
(PRAN) through capacity development activities (Census Organization of India, 2015). However,
NGO’s reach to smallholder farmers is impeded by limited information and communication
technology (ICT) coverage. In 2011 mobile phone coverage still provided for only 52 per cent of
the Biharian population (Census Organisation of India 2015), over 10 per cent less compared to
the whole Indian population in 2010 (Jain, Kumar, and Singla 2015), but 16 per cent more
compared to the Indian farmers/agricultural labour force in 2010/2011 (Cole and Fernando 2012).
The share of mobile phone owners over the whole of India using smartphones increased from 21
per cent in 2014 up to 33 per cent in 2017 (Statista 2018). Furthermore, data from the Telecom
Regulatory Authority of India (2017) give evidence that the number of wireless subscribers in rural
India has been steadily increasing since 2012 and almost reached the 500 million mark in 2017.
4.2 The role of ICT for agricultural capacity development
Modern ICTs have enabled the increasing use of mobile phones for capacity development purposes
in developing countries’ agricultural sectors as they have done elsewhere. The distance-
eliminating character of this technology is especially recognized as one of its major advantages.
Consequently, Short Message Service (SMS) is nowadays still the most applied digital technology
used in agricultural extension projects (Deichmann, Goyal, and Mishra 2016; Aker 2011) even
though mobile phone successor technology, smartphones and corresponding internet applications,
have been on the advance over recent years. Smartphones, with their advances in size, hardware
and applications, provide additional possibilities to measure a variety of data such as the lightening

46
level, GPS coordinates or humidity. Furthermore, they are able to capture, store and transfer
information in different formats such as text, pictures, audio, and video very rapidly.
Smartphones are considered to offer potential access to information, generational knowledge,
extension services, market linkages, distribution networks, financial resources, new technologies
and other inputs (Deichmann, Goyal, and Mishra 2016; Aker 2011). Such access has already been
identified in predecessor ICTs’ usage with numerous studies on various cases all over the world
looking at increasing household/farm marketing performance (Beheraa et al. 2015; Sekabira and
Qaim 2017; e.g. Aker 2011), production performance (e.g. Aker 2011; Cole and Fernando 2012)
or both (Deichmann, Goyal, and Mishra 2016; Rao 2007; e.g. Ali and Kumar 2011). Consequently,
smartphone usage can be expected to improve income generation and thus poverty reduction in
developing countries’ agricultural sectors. Simultaneously, smartphone technology can allow
stakeholders, such as NGOs or financial institutions, to have a targeted design and to share
customised, more detailed information at lower cost. Smartphones represent an upcoming tool
which can generate agricultural knowledge through capacity development measures more
efficiently than frontal teaching methods or even other ICTs can (e.g. Aditya and Sing 2014).
Despite this potential and increasing access to the technology, adoption and usage rates among
farmers in developing and emerging economies are still relatively low. Such disparities have
already been observed for predecessor ICTs and motivated researchers to take account of
psychological usage drivers– conceptually as well as empirically. In their qualitative
argumentation, Kameswari et al. (2011) include psycho-economic factors by highlighting “socio-
cultural context” factors. Trust within farmers’ business networks, combined with favourable
production conditions are regarded as crucial for ICT usage in general and information search in
particular, within the Indian agricultural sector. The study by Venkatesh and Sykes (2013)
extended conceptual ideas on the role of social networks for the successful implementation of
digital divide initiatives in rural India. They developed and tested a framework based on social
network theory in comparison to traditional theory of planned behaviour (TBP) and technology
acceptance model (TAM) applications. These are well-established in academic literature on non-
agricultural cases. Here farmers’ PC usage behaviour was based on shared use of PCs provided in
an internet kiosk and under supervision. For this type of intermediated ICT use, the social network
framework’s greater explanatory power was observed, although also recognising that for other
types of use, different models have to be developed. In line with this finding, Verma and Sinha
(2016) successfully applied TAM to analyse mobile-based agricultural extension service under
independent individual usage in India. Nevertheless, further development of such individual-

47
centric approaches beyond purely cognitive considerations remains neglected in the academic
literature on individual ICT usage among farmers in developing countries.
4.3 Conceptual framework
The conceptual framework in Figure 1 puts forward a combination of the goal-based behavioral
model (MGB) (Perugini and Bagozzi 2001) based on the Theory of Planned Behavior (TPB)
(Ajzen 1991), and the Technology Acceptance Model (TAM) and its further advances based on
Cheon et al. (2012) and Venkatesh and Davis (2000). The TAM part of the model addresses the
case-specific character of the action, namely the acceptance of a new technology as part of the
intention to use it for generating agricultural knowledge. The MGB broadened the TPB by
introducing desires as the most proximal determinant of intention, since the TPB is silent on how
intentions become energized (Perugini and Bagozzi 2001). As the majority of Biharian farmers
did not own a smartphone in 2016, actual smartphone usage behaviour for capacity development
activities was not measurable. Due to these circumstances, the main outcome variable at that time
of the survey was intention.
Figure 4.1: Smartphone research model with hypotheses
(Source: authors own graphic based on Perugini and Bagozzi 2001; Cheon et al. 2012)
TPB and relative approaches, especially TAM and TAM 2, have been successfully applied in
earlier studies to predict behaviour regarding technology, IT-acceptance, ICT-usage and intention
towards agricultural practices among others (e.g. Cheon et al. 2012; Verma and Sinha 2016;
Venkatesh and Sykes 2013; Zeweld et al. 2017; Krone, Dannenberg, and Nduru 2016). The TPB

48
defines behavioural control, attitude and subjective norm as key-determinants of the behavioural
intention. Thereby, behavioural control describes the perceived level of ease an individual ascribes
to the conduction of a certain action. This self-evaluation exceeds personal opportunities and
resources such as education and income. In the specific context of smartphone usage among small-
scale farmers in developing countries, behavioural control reflects the perception of control over
the functionality of the smartphone and its applications. Next, attitude denotes the degree of overall
favourability assigned to the particular technology from an individual’s perspective. In contrast,
subjective norm acknowledges the role of social pressure from the personal network related to the
performance or non-performance of a particular action. In this study, it can be described as the
individual farmer’s perception of the opinion on smartphone usage for capacity development
prevailing among other individuals’ in his or her social and professional network (Ajzen 1991).
This study then hypothesises that the intention to use the smartphone technology is positively
related to behavioural control (H6+), attitude (H4+) and subjective norm (H5+), however, not
directly.
In relation to the TPB, desire can be described as a motivational impetus for the behavioural
intention resulting from personal awareness and acceptance of the desire to act (W. A. Davis 1984).
It is therefore hypothesised that desires reflect the transformation of attitude, subjective norms and
behavioural control into a motivation to act (H1 +) (Perugini and Bagozzi 2001; Leone, Perugini,
and Ercolani 1999). Furthermore, Perugini and Bagozzi (2001) broadened the TPB by
acknowledging the existence of personal goals associated with certain behaviour. In the case of
smartphone usage for generating agricultural knowledge, such goals could be; innovativeness,
technological progress and improvements in economic and farming performance (Deichmann,
Goyal, and Mishra 2016). Anticipated emotions are meant to explain goal achievements (positive
anticipated emotions) or goal failures (negative anticipated emotions) in the MGB (Perugini and
Bagozzi 2001). In this context, such anticipated emotions are described as prefectural appraisals
since they capture decision makers’ imagined consequences before taking real action (Gleicher et
al. 1995). Following Perugini and Bagozzi (2001), it is assumed that positive anticipated emotions
and negative anticipated emotions are included as direct predictors of desire in our framework
(H2a +; H3a -). Different to the MGB, the influence of these two variables is also tested on the
construct intention (H2b +; H3b -) to take into account the bounded rationality of the effect (Zhang
and Li 2005).
In accordance with the TAM 2 -model developed by Venkatesh and Davis (2000) and the
subsequent conceptualization by Cheon et al. (2012), the main TPB-determinants to intention;

49
attitude, subjective norm and behavioural control are assumed to be influenced by three different
types of salient beliefs: attitudinal beliefs, normative beliefs and control beliefs (Ajzen 1991).
Attitudinal beliefs comprise perceived usefulness and perceived ease of use. Perceived usefulness
reflects individual user-beliefs regarding the advantageousness of a technology for own job
performance and consequent life-quality (Verma and Sinha 2016). In several studies regarding
ICT innovations usefulness is a proven and important motivator for acceptance (e.g. Liu, Li, and
Carlsson 2010). Perceived ease of use describes users’ beliefs regarding the expected individual
time- and strain-effort connected to the technology usage, e.g. for learning the functionality of a
smartphone (Venkatesh and Davis, 2000). These two attitudinal beliefs (H4a +; H4b +) are
hypothesised to determine attitude.
Normative beliefs represent the individuals’ perception of beliefs persisting among important
actors in their social and professional network (Ajzen 1991; Cheon et al. 2012). As suggested by
Cheon et al. (2012), the present study differentiates between the readiness of trainers and other
farmers, both considered the most important actors in the process of agricultural knowledge
generation. Since farmers include the beliefs they assimilate from trainers and other farmers’ in
their own belief structure, the two latent variables of trainer readiness and farmer readiness are
hypothesised to influence the behavioural control positively (H5a +; H5b +) (Venkatesh and Davis
2000; Cheon et al. 2012).
Control beliefs describe an individuals’ self-confidence towards behaviour. Thus, perceived self-
efficacy, (Cheon et al. 2012; Ajzen 1991, 2002) captures the beliefs of individuals about their own
motivation and ability to behave in a particular manner, such as using a smartphone for agricultural
purposes. Furthermore, learning autonomy is expected to be relevant for smartphone usage for
agricultural purposes, since its adoption requires a comparatively high degree of self-motivation
and self-discipline as a downside to the greater flexibility and mobility it provides (Cheon et al.
2012). Hence, it is hypothesised that perceived self-efficacy (H6a +) as well as learning autonomy
(H6b +) has a positive effect on behavioural control.
4.4 Methods and data
The study is based on a survey questionnaire that was developed following a literature review,
with a specific focus on technology acceptance and usage. The measures used were tested in six
focus group discussions each with on average 25 farmers during the pre-field visit. Third, a pre-
testing of the questionnaire was undertaken. The questionnaire included 16 sections, each
measured on a 5-point Likert scale format (from 1= totally disagree to 5= totally disagree). Table

50
2 (Appendix) presents the measurement indicators. The questionnaire first presented an info-
graphic overview so as to provide a baseline of background information on smartphone usage for
agricultural purposes.
From April to July 2016 a total of 664 small-scale farmers, who generate their main income from
agricultural activities, were recruited to participate using a stratified random sampling strategy to
achieve two relatively equal groups. Stratification was thereby related to cooperation with local
NGOs involved in agricultural extension activities, such as FnF and PRAN. The interviews had an
average duration of 77 minutes and were carried out face-to-face by eight trained enumerators with
the help of tablets using ‘Sawtooth Software‘.
The characteristics of the sample are described in Table 1. The final sample consisted of 68 per
cent male and 32 per cent female respondents with an average age of 43 years and a literacy rate
of 74 per cent. The share of females in the sample is below the national average of ca. 48 per cent
reported in the year 2011 but the majority of the farmland in India is owned by males. In this
sample, 74 per cent own a mobile phone and 15 per cent own a smartphone, giving evidence of an
increasing penetration of mobile devices in India in recent years. However, none of the farmers
owning a smartphone use it for agricultural purposes, including capacity development as the focus
group discussions clarified. The farmers cultivate 1.8 acres (0.7 ha) on average. Out of all
respondents, 30 per cent are PRAN-members, 15 per cent are members of FnF and nine per cent
are members of other governmental or non-governmental organisations such as Jeevika or ‘Krishi
Vigyan Kendra’ (KVK).
The variance-based Partial Least Square (PLS) method was used to analyse the pooled data. The
PLS approach is appropriate to test explorative models with complex relations between latent
constructs (Chin 1998; Henseler, Hubona, and Ray 2016; Hair et al. 2017). The statistical analysis
was done with the programme Smart-PLS 3. In addition to a pooled PLS-estimation, a Multi-
Group-Analysis according to the stratification criterion was conducted in order to test for a
potential bias of outcomes (Sarstedt, Henseler, and Ringle 2011). During the PLS-estimations, the
testing of the measurement model was conducted regarding reliability (indicator reliability and
composite reliability) and validity (convergent validity and discriminant validity) criteria, as well
as multicollinearity before the hypotheses were tested based on R-square-values, path-coefficients
and their significance-levels (Balderjahn et al. 2013; Fornell and Larcker 1981).
Reliability of the indicators is given if all items in the model show factor loadings above the
threshold of 0.7 (Henseler, Hubona, and Ray 2016) internal consistency if the composite reliability

51
value exceeds 0.7 (Fornell and Larcker 1981) and convergent validity if the Average Variance
Extracted (AVE) is greater than 0.5 (Bagozzi and Yi 1988). Discriminant validity is firstly checked
by cross-loadings, whereby all items need to have a higher correlation with their assigned factor
than with other factors (Henseler, Hubona, and Ray 2016). Secondly discriminant validity is tested
using the Fornell-Larcker criterion. The criterion is fulfilled if the square root of each construct´s
AVE is greater than the correlation with other constructs (Hair et al. 2017). Multicollinearity is
checked with the VIF (Variance Inflation Factor). This factor should be smaller than five
(Henseler, Hubona, and Ray 2016). The explanatory power is evaluated according to the power
primer (R-square = 0.1: small; R- square = 0.3: middle; R-square = 0.5: large) developed by Cohen
(1992).
4.5 Partial Least Square- Estimations
The parameters for the quality criteria shown in Table 3 and 4 (Appendix) proof the reliability and
validity of the model estimated with the pooled data set. The Multi-Group-Analysis indicates that
a bias of results from sample stratification can be rejected since no significant differences between
the two strata are found. Figure 2 shows the R-square-values, path-coefficients and their
significance-levels of the PLS-estimations. The R-squares range from 0.374 to 0.633 and can, thus,
be interpreted as middle to large. The intention construct shows an R-square value of 0.633.
Figure 4.2: Path coefficient of the smartphone research model
(Note: * P < 0.10, ** p < 0.05, *** p < 0.01; Source: authors own data, calculations and
illustration)

52
The TPB key-determinants attitude (0.340***; H4+), subjective norms (0.217***; H5+), and
behavioural control (0.164***; H6+) have a highly significant influence on desires. Thereby,
especially attitudes, show a greater influence than perceived social pressures from farmers’
individual networks and their self-evaluation regarding own opportunities to appropriately
maintain the smartphone (Venkatesh and Sykes 2013).
Desires are strong and highly significant in influencing intentions (b-value = 0.684***; H1+),
which supports the finding by Perugini and Bagozzi (2001). However, the results for the two
emotional constructs are not in accordance with the finding by Perugini and Bagozzi (2001).
Positive anticipated emotions have no significant influence on desires (-0.021; H2a-) but a strong
as well as highly significant influence on intentions (0.251***; H2b+). Reversely, negative
anticipated emotions have a relatively low and significant influence on desires (0.073**; H3a+)
but no significant influence on intention (-0.002; H3b-). Therefore, this results suggest that
positive anticipated emotions seem to facilitate spontaneous behaviour, most likely due to their
high degree of personalization and innovation (Kim and Shin 2015). Simultaneously, negative
anticipated emotions should contribute to increased motivation to use smartphones for capacity
development. Such influences of automation have been observed in the past for fear, shame,
sadness and anger in smartphone purchase decisions among Iranian urbanites as the linking pin
between cognition (attitude, subjective norm, behavioural control) and conation (intention)
(Koshkaki and Solhi 2016).
Attitudinal beliefs in form of perceived usefulness (0.518***; H4a+) and perceived ease of use
(0.149***; H4b+) are found to influence attitude (R-square = 0.400). Thus, concern about
extraordinary time, strain and financial effort farmers using smartphones in developing countries
may face as part of the digital divide debate cannot be confirmed to be present in farmer’s decision
processes.
Both trainer readiness (0.272***; H5a+) and farmer readiness (0.447***; H5b+) is found to
influence subjective norms. These results are in line with results by Cheon et al. (2012) on US
college students’ ICT usage behaviour regarding trainer readiness. The result on farmer readiness
suggests that within the social and professional network, peers have a comparatively greater
influence on Indian small-scale farmers’ subjective norms. Such findings may seem surprising
after capacity development activities in developing countries over the past decades have been
predominated by frontal teaching methods, for instance in Farmer-Field-Schools (Phillips,
Waddington, and White 2014). However, such measures may not have reached a large share of the
rural population in India, which simultaneously provides an explanation for the importance of

53
group dynamics in these close communities, many of which exist in developing countries’ remote
areas.
Regarding control beliefs, self-efficacy (0.522***; H6a+) is an influential construct of behavioural
control. This supports the importance of beliefs in own motivation and ability for smartphone
usage. Such self-confidence in connection with the ability to learn autonomously may help in using
a smart-device successfully over distances and amongst the scattered villages in developing
countries’ remote areas (Aker 2011; Aker, Ghosh, and Burrell 2016; World Bank 2016b).
However, since the statements included in the latent variable learning autonomy are negatively
phrased, the effect observed is consequently a negative one. This contradictory influence possibly
results from differences in the definition of autonomous learning among societies, since
corresponding measures have been derived from a study on an industrialized country (Cheon et al.
2012).
4.6 Conclusion and implications
This study presents a comprehensive behavioural model for identifying and quantifying the drivers
of small-scale farmers´ intention to use a smartphone for capacity development activities in the
remote areas of Bihar, one of the poorest regions in India (World Bank 2016a). The results confirm
the conceptual integration of the MGM approach and the models for technological acceptance into
the framework and give evidence of its overall applicability in the context of a developing
country’s agricultural sectors. It explains almost 70 per cent of the variance of farmers’ intention
to use a smartphone for capacity development purposes, approximately 40 per cent more than
averagely observed in other TPB-based studies (Sheeran, 2002) and approximately 20 per cent
more than the model proposed by Venkatesh and Sykes (2013). The inclusion of the affect (desires
and emotions) and its proven relevance as the linking pin between cognition and conation
regarding smartphone usage for agricultural purposes (Chhachhar and Maher 2014; Koshkaki and
Solhi 2016) represent an especially important finding. This finding addresses various stakeholders
(e.g. researchers, NGOs and politics) involved in developing measures for the enhancement of
sector-wide capacities for modern sustainable farming practices. From a research perspective, the
framework provides a valid and reliable basis for future applications in similar settings, especially
in the context of developing countries, where the respondents are not used to modern ICT yet and
live in close communities with strong social bonds in villages scattered throughout remote areas.
Empirical research may offer crucial results for leveraging efforts by politics and NGOs
(Deichmann, Goyal, and Mishra 2016; Aker 2011) not only in supporting the introduction of

54
smartphones monetarily, so that farmers have the possibility to overcome the digital divide and
benefit from rapid information access over distances, but also by acknowledging farmers’ psycho-
economic usage drivers to facilitate the diffusion of the technology in the sector (Venkatesh and
Sykes 2013). The perceived favourability of smartphones for capacity development among farmers
should be the special focus of extension programmes. Since Indian farmers seem to prefer initial
guiding support when getting started with this technology and attach great importance to the
opinion of other farmers, smartphones should be promoted more strongly using village-wide field
demonstrations to increase usage-rates. Negative emotions arising from usage failure can thereby
function as motivation-triggers as a reflection of ambition (Koshkaki and Solhi 2016) while
positive emotions arising from usage success may lead to spontaneous affective usage decisions.
Correspondingly, smartphone applications should be designed with user-friendly interfaces for the
specific target groups.
However, due to current low smartphone coverage in the study area, actual usage behaviour could
not be included as the final outcome variable. Neglecting actual behavioural action in the model
hinders any drawing of conclusions on the potential existence of an intention-behaviour gap. When
extending the conceptual framework of smartphone usage behaviour, it should be tested in the
context of a country with appropriate smartphone coverage or in an experiment with a distribution
of smartphones along with respective applications. In addition, socio-demographic characteristics
are not part of the current framework so that no more specific user groups can be identified among
farmers. In this regard, the framework should be further developed by implementing conceptual
ideas from the Unified Theory of Acceptance and Use of Technology (UTAUT). In order to
capture learning autonomy appropriately, societal differences should be accounted for during scale
development in future studies.
Despite its advantages for analysing complex causalities on exploratory data, PLS is also criticised
for inconsistencies and biases in estimates (Henseler et al. 2014). Additionally, the framework
used in combination with PLS does not allow setting smartphone-based capacity development
activities to contrast with other discrete alternatives. In this regard, farmers’ preferences for
different teaching methods should be further investigated using a choice experimental design.

55
4.7 Appendix 4
Table A4.1: Demographic data (Respondent and household and farm)
Variable (Respondent) Freq. Per cent Mean Sd Min Max N
Age in years
43.06 12.61 13 90
Share of female farmers 214 32.0
664
Female-headed households 49 13.0
378
Male-headed households 329 87.0
378
Able to read 490 74.0
0.4401
664
Level of education
No degree 224 33.7
664
Primary School 187 28.2
664
Secondary School 179 27.0
664
Graduate 58 8.7
664
Post-Graduate 16 2.4
664
Owner of a mobile phone 492 74.0
0.44
664
Owner of a smartphone 99 15.0
0.36
664
Variable (Household) Freq. Per cent Mean Sd Min Max N
Number of household members
6.06 2.49 1 15
Access to electricity 613 92.0
0.27
664
Access to internet 30 5.0
0.21
664
Access to radio 83 12.5
0.33
664
Access to newspaper 89 13.0 0.34 664
Access to television 217 33.0 0.47 664
Own land Total (acre) 1.76 3.38 664
Cultivated land Total (acre) 1.84 3.39 0 41.4 664
(Source: authors own data and calculations)

56
Table A4.2: Mean, standard deviation and factor loading of statements
Code* Statement Mean Standard
Deviation
STD
factor
loadings
(>0.70)
PU14 I think that using a smartphone would enable me to
generate agricultural knowledge more quickly. 4.024 0.904 0.801
PU24
I think that using a smartphone would make it more
convenient for me to generate agricultural
knowledge.
4.012 0.805 0.853
PU34 I think a smartphone to generate agricultural
knowledge is useful. 3.962 0.901 0.829
PU45 Overall, I think that using a smartphone to generate
agricultural knowledge is advantageous. 4.088 0.791 0.845
PU56 With using a smartphone, I can access information on
agricultural practices whenever I need it. 4.003 0.866 0.854
PU66 Being familiar with smartphones also enables me to
work with other technological innovations. 4.014 0.822 0.828
PU76 Agricultural knowledge I could obtain from
smartphones is knowledge I need. 3.98 0.853 0.829
PEU14 I think that using a smartphone to generate
agricultural knowledge would be easy. 3.779 1.052 0.740
PEU25
I think that using a smartphone to generate
agricultural knowledge does not require a lot of
mental effort.
3.556 1.069 0.769
PEU36 Using a smartphone to generate agricultural
knowledge will save time. 4.021 0.867 0.815
PEU44
Agricultural knowledge presented by smartphone
applications is much easier to understand than normal
training.
3.874 0.932 0.814
AT17 Using a smartphone to generate agricultural
knowledge will be helpful. 3.961 1.015 0.881
AT27 The use of the smartphone as a learning tool excites
me. 3.874 1.032 0.908
AT37 Using a smartphone for generation of agricultural
knowledge would be a pleasant experience. 3.92 1.005 0.913
AT47 Using a smartphone to generate agricultural
knowledge will make my work more attractive. 3.772 1.081 0.904
AT54 I would like the agricultural work more if I would use
a smartphone. 3.751 1.092 0.866
4 (Based on: Cheon et al., 2012) 5 (Based on: Venkatesh & Bala, 2008) 6 (Based on: Davis, 1984) 7 (Based on: Perugini &Bagozzi, 2001)

57
TR14
I think trainers and experts would be in favour of
utilizing a smartphone to generate agricultural
knowledge.
3.94 0.994 0.892
TR24
I think trainers and experts would believe that a
smartphone could be a useful educational tool in their
training.
3.965 0.852 0.898
TR34 I think trainers and experts would possess adequate
technical skills to use a smartphone in their training. 3.988 0.88 0.918
FR14 I think other farmers would be in favour of utilizing
smartphones in their training. 3.902 0.928 0.886
FR24
I think other farmers would believe that a smartphone
could be a useful educational tool in their
coursework.
3.814 0.949 0.877
FR34 I think other farmers would possess adequate
technical skills to use a smartphone in the training. 3.741 0.97 0.869
SN18
Stakeholders I am working with think I should
integrate smartphones to generate agricultural
knowledge.
3.764 1.131 0.793
SN24
Most people who are important to me would be in
favour of using a smartphone to generate agricultural
knowledge.
3.625 1.086 0.833
SN35
Other farmers in my surrounding think I should take
advantage of smartphones to generate agricultural
knowledge.
3.691 1.058 0.836
SN45
People whose opinions are valued to me expect that
people like me should use smartphones to generate
agricultural knowledge.
3.678 1.059 0.834
SN54
I think other farmers in my village would be willing
to adopt a smartphone to generate agricultural
knowledge.
3.773 0.989 0.840
SN65 Generally, it is expected of me to use a smartphone to
generate agricultural knowledge. 3.805 0.966 0.848
SE14 I am confident about using a smartphone to generate
agricultural knowledge. 3.997 0.886 0.842
SE24 Using a smartphone to generate agricultural
knowledge would not challenge me. 3.753 1.053 0.800
SE34 I would be comfortable to use a smartphone to
generate agricultural knowledge. 3.789 0.997 0.859
BC15 I think that I have the discipline to learn how to use a
smartphone to generate agricultural knowledge. 4.011 0.873 0.890
BC25 My own decisions and actions are decisive whether I
will use a smartphone. 3.939 0.92 0.870
PE17 If I would succeed to increase agricultural knowledge
by the aid of using a smartphone, I will feel Excited 3.287 1.434 0.904
8 (Based on: Ajzen 1991)

58
PE27 If I would succeed to increase agricultural knowledge
by the aid of using a smartphone, I will feel Delighted 3.431 1.315 0.927
PE37 If I would succeed to increase agricultural knowledge
by the aid of using a smartphone, I will feel Happy 3.537 1.26 0.922
PE47 If I would succeed to increase agricultural knowledge
by the aid of using a smartphone, I will feel Glad 3.421 1.297 0.920
PE57 If I would succeed to increase agricultural knowledge
by the aid of using a smartphone, I will feel Satisfied. 3.475 1.323 0.929
PE67 If I would succeed to increase agricultural knowledge
by the aid of using a smartphone, I will feel Proud 3.443 1.394 0.889
PE77
If I would succeed to increase agricultural knowledge
by the aid of using a smartphone, I will feel self-
assured
3.712 1.27 0.875
NE17
If I would NOT succeed to increase agricultural
knowledge by the aid of using a smartphone, I will
feel Angry
2.035 1.156 0.880
NE27
If I would NOT succeed to increase agricultural
knowledge by the aid of using a smartphone, I will
feel Frustrated
1.941 1.178 0.895
NE37
If I would NOT succeed to increase agricultural
knowledge by the aid of using a smartphone, I will
feel Guilty
1.783 1.151 0.854
NE47
If I would NOT succeed to increase agricultural
knowledge by the aid of using a smartphone, I will
feel Ashamed
1.925 1.12 0.856
NE57
If I would NOT succeed to increase agricultural
knowledge by the aid of using a smartphone, I will
feel Sad
2.17 1.158 0.829
NE67
If I would NOT succeed to increase agricultural
knowledge by the aid of using a smartphone, I will
feel Disappointed
2.261 1.169 0.788
DE17
My desire for using a smartphone in order to increase
agricultural knowledge can be described as very
strong
3.968 1.029 0.952
DE27 I want to use a smartphone to generate agricultural
knowledge. 4.021 0.921 0.957
IT17 I am planning to use a smartphone to generate
agricultural knowledge. 3.847 1.042 0.909
IT27 I will expand efforts on using a smartphone to
generate agricultural knowledge. 4.002 0.894 0.920
*Abbreviation see also Table A4.3
(Source: authors own data and calculations)

59
Table A4.3: Reliability measures of the model constructs
Construct Abbre-
viation
Nr.
of
items
Cronbach's
Alpha
(>0.70)
Composite
Reliability
(>0.70)
Average
Variance
Extracted
(>0.50)
Perceived Usefulness PU 7 0.927 0.941 0.696
Perceived Ease of Use PEU 4 0.799 0.865 0.617
Attitude AT 5 0.938 0.953 0.801
Trainers´ Readiness TR 3 0.887 0.930 0.815
Farmers´ Readiness FR 3 0.851 0.909 0.770
Subjective Norms SN 6 0.910 0.930 0.691
Self-Efficacy SE 3 0.782 0.889 0.668
Behavioural Control BC 2 0.709 0.873 0.774
Positive Anticipated Emotions PE 7 0.965 0.971 0.827
Negative Anticipated Emotions NE 6 0.924 0.940 0.724
Desire DE 2 0.903 0.954 0.911
Intention IT 2 0.804 0.911 0.836
(Source: authors own data and calculations)
Table A4.4: Fornell-Larcker criteria
AT BC DE FR IT NE PEU PU PE SE SN TR
AT 0.895
BC 0.450 0.880
DE 0.561 0.407 0.955
FR 0.583 0.462 0.580 0.877
IT 0.538 0.509 0.759 0.596 0.914
NE 0.140 0.037 0.146 0.184 0.157 0.851
PEU 0.519 0.521 0.529 0.643 0.616 0.261 0.785
PU 0.624 0.607 0.644 0.732 0.724 0.195 0.715 0.834
PE 0.466 0.361 0.301 0.460 0.456 0.235 0.363 0.545 0.910
SE 0.621 0.628 0.572 0.618 0.638 0.177 0.646 0.716 0.488 0.834
SN 0.675 0.438 0.518 0.639 0.525 0.110 0.523 0.620 0.399 0.672 0.831
TR 0.657 0.480 0.688 0.706 0.619 0.195 0.562 0.740 0.463 0.635 0.588 0.903
(Source: authors own data and calculations)

60
5 The role of trust and networks in developing Nicaraguan farmers’ agribusiness
capacities9
Abstract
The main focus of most programmes in developing countries carried out by NGOs is to develop
small-scale farmers’ capacities. One approach hereby is to use multi-stakeholder innovation
systems, such as the ‘Nicaraguan Learning Alliance’ (NLA). However, tools for the evaluation
of multi-stakeholder innovation systems are rare. This paper reports on the implementation of
a conceptual framework to carry out an impact evaluation of multi-stakeholder innovation
systems using the NLA as the object of study. The assessment focused on the business
relationship constructs of trust and capacity development. Survey interviews, in-depth
interviews and focus group discussions collected data from agribusiness stakeholders linked
with the NLA and from a control group of stakeholders involved with other networks. The
quantitative data were analysed through factor and regression analyses. Results from the
quantitative analyses were triangulated with qualitative data. The analysis shows that the NLA
has been successful in developing smallholder farmers’ capacities as a result of trust developed
through its dedicated project managers. Nonetheless, the NLA has not been more successful at
developing agribusiness capacities among Nicaraguan farmers than other networks with the
same goals. Results from this study point to the need for facilitating more interactions between
the different networks of farmers’ cooperatives and organisations with other stakeholders
already active within the Nicaraguan agrifood innovation system.
Keywords
capacity development, impact evaluation, innovation systems, Latin America, value chains
9 This chapter is co-authored with Jean-Joseph Cadilhon (JJC). The authors’ contributions are as follows: Dirk
Landmann (DL) designed the research, collected the data and analysed and interpreted the data. JJC
assisted in the analysis and interpretation of the results. DL wrote the paper. JJC commented at the various
stages of the research and contributed to writing and revising the paper. JJC took a major lead in the basic
development of the conceptual framework. All authors read and approved the final manuscript. This
manuscript is also accepted for publication in the ‘Journal of Agriculture and Rural Development in the
Tropics and Subtropics’ (JARTS). The share of the total work done by DL is 85 per cent.

61
5.1 Introduction
Traditionally, researchers and experts transferred their agricultural knowledge to their target
group following a linear approach. This model has largely failed because it did not respond to
the actual problems of its intended beneficiaries, it rather evaluated the knowledge of locals as
inferior and did not take into account how the different stakeholders influence production one
way or another (Chambers 1994; Pretty 1995; Klerkx, van Mierlo, and Leeuwis 2012).
This shortcoming formed the basis for ‘model two’ also known as ‘Participatory-Research-
Action’ (PRA), in which more interactions between the different stakeholders occur and
changes can be adopted more rapidly (Hall 2007). This new form of capacity development
could be defined generally as an approach focusing on organisational, communal and social
issues. The core of this approach is to combine theory and action in the process of collaborative
learning. Reflection is taking place throughout the whole process and is also prompting the next
actions (Coghlan and Brydon-Miller 2014).
The ‘International Center for Tropical Agriculture’ (CIAT) has developed Learning Alliances
(LA) based on this knowledge (World Bank 2012). LAs can be assimilated to innovation
platforms (IPs): a group of individuals with different backgrounds and interests, who come
together to diagnose and solve problems they face (Homann-Kee Tui et al. 2013). The LA
concept has so far been adopted in 20 countries worldwide (Lundy and Gottret 2005).
Innovation systems as applied to agriculture rely on the interaction of different stakeholders to
foster knowledge sharing and innovation (Klerkx, Aarts, and Leeuwis 2010). The general idea
is to add value and create synergistic relationships between different members and to build up
a network that transcends micro, meso and macro socio-geographical levels (CRS 2009). The
Nicaraguan Learning Alliance (NLA) is an alliance of organisations formed in 2003. The
alliance is training its partners on agribusiness management and access to markets to replicate
this knowledge through different geographical levels along its partner network down to farmers
(AdA 2014; World Bank 2012).
Although innovation platforms are seen as a successful tool and used in many different
countries and value chains, literature on the assessment of innovation platforms is very rare.
Existing literature mostly focuses on the analysis of particular cases with a specific method,
thus restricting the transfer to other platforms (Nederlof, Wongtschowski, and van der Lee
2011). The conceptual framework developed by Cadilhon (2013) attempts to simplify complex
data within the categories of structure, conduct, and performance. The conceptual framework

62
already embeds certain variables, factors, and other influences relevant to the development and
aims of innovation platforms. This is the only conceptual framework that combines the different
categories (structure, conduct, and performance) with the topics of transaction costs and
marketing concepts for the purpose of analysing innovation platforms. The data of this study
will help test and refine the conceptual framework for monitoring and evaluation of the impact
of innovation platforms (Cadilhon 2013).
The focus of this study was to evaluate trust as a conduct variable and capacity development as
a performance variable following the alliance’s objectives. Trust is an important component in
value chains and has gained more attention from scientists within the past two decades. This
important component can be seen as a factor, which significantly influences individuals,
organisations, partner’s competence, process, characteristics and institutions, systems,
calculations, economics, intentional relations, technology or services. Thus, it is described by
many researchers as a complicated and multifaceted concept with no uniform definition and
measurement method available up to now. However, trust has a great influence on perception
and individuality, which varies with participants (Laeequddin et al. 2010).
Capacity development has also been discussed extensively in the last few decades (Watson
2010). It is dependent on principles, dimensions, actors, levels and strategies, and each case has
to be seen as a combination of different influencing factors (Neely 2010). In an agricultural
context, it often takes the form of training activities and workshops (Horton et al. 2003).
Capacity development is a principal goal of the NLA to increase the replication efficiency of
the knowledge being produced within the network.
However, there are no studies or data comparing NLA participants and non-participants
pertaining to the cooperatives and organisations using the NLA-guides. Furthermore, there are
no measures to evaluate whether the capacity of the partners is generally increasing or not. To
contribute to the evaluation of the NLA’s activities, this article aims to answer the following
research question: How does the NLA strengthen producers’ capacities through its structure
and network of members and partners?
The contribution of this article to the literature on IPs as a collaborative agricultural education
mechanism is the pilot-testing of a conceptual framework characterizing how IPs work in a
Latin American context through mixed research methods. Although LAs and IPs are more and
more common, this study aims to contribute practical tools to evaluate them using quantitative
and mixed methods are rare.

63
5.2 Literature review
Learning Alliances in the agricultural sector
The LA approach is based on the concept of ‘social learning’ and ‘innovation systems’. Social
learning is defined as an interactive process of learning-by-doing between different
stakeholders for the purpose of solving problems (Bandura 1971). LAs specifically focus on
research organisations, as well as donor and development agencies. Combining these two
concepts creates a process of collaborative learning, adaption, and innovation among the
participants. The objectives of LAs are to develop cumulative and shared knowledge about
distinct approaches, learn across different boundaries, create synergies among participants (e.g.
to advance specialised knowledge), exchange information between the participants, and
develop flexible mechanisms that apply to different topics (CRS 2009). It is typical for LAs to
mix traditional socio-economic research with action research. The founding principles of LAs
include clear objectives, shared responsibilities, costs and benefits, outputs and inputs,
differentiated learning mechanisms, and long-term trust-based relationships. Every participant
will have different objectives and interests, but it is crucial that common ground can be
identified. A more general objective enables participation by a wider array of members.
Benefits for each stakeholder must exceed the value of their individual costs. In addition, the
goals and interests of the alliance should not be in conflict with other key actions. Methods,
tools, and approaches should change over time corresponding to changing situations of
participants. All types of participants must be considered and respected regardless of gender,
race, function, and other differentiating factors. In order to accomplish this, learning methods
need to be flexible, interconnected and viewed as long-term processes (CRS 2009).
The main approach in the methodology of LAs is to move from a single cycle learning process
to a double loop learning process. One cycle is divided into three segments. In the first step
‘Reviewing our framework,’ problems are identified, learning topics are selected and defined,
existing practices are analysed, and methods and tools are designed for adoption. The second
step ‘Implementing strategic actions,’ involves planning and implementing the approaches,
methods and tools of development projects. In the third step, ‘Documenting and analysing
results’ intervention results are systemized and evaluated before the changes in the state of
development are presented to the members through workshops, training programmes, platforms
or other methods. After the completion of this cycle, the process starts again with the first step.
This time, the results from the first cycle are taken into account (Lundy and Gottret 2005).

64
CIAT's experiences with LAs have been very positive since they were first initiated in the year
2000. Positive aspects are that stakeholders participate directly, pilot innovation occurs where
help is needed, face to face information exchange occurs, and analyses throughout the entire
experience help evaluate the alliance including its processes (Lundy & Gottret, 2005).
However, LAs do not work for every project. One reason is member composition. Members
have to be open to share information and reflect in order to enable the learning. This can be
influenced by clusters or different methods of communication. Establishing an LA takes a
considerable amount of time (CRS 2009). The initiators must invest sufficient time in managing
and coordinating the alliance as well as documenting, analysing, and sharing the information
and results on every level. Though time commitments may be substantial, they are crucial
elements of the process. Additionally, providing funding becomes essential. It is easier to
receive funding for specific projects than for projects with a wider scope. It is also vital to
consider who is funding the project and to examine their motives and interests (Lundy and
Gottret 2005).
Background information on Nicaragua and the NLA
Although small in size, Nicaragua has a varied tropical landscape with fertile volcanic soil on
agricultural plains, dry rangeland plateaus and hills, and humid evergreen agro-forested
mountains. Agriculture is an important economic sector for the country, representing 22 per
cent of the national GDP, 32 per cent of national exports and 32 per cent of employment (FAO
2014). However, Nicaragua is one of the poorest countries in Latin America (World Bank
2017). Nicaraguan farmers are organised in a dense network of cooperatives, a heritage of the
former socialist Sandinista regime (Lafortezza and Consorzio 2009). Due to the current
government’s connection to the previous regime, it embraces this socialist heritage and may
continue to influence the structure of Nicaraguan agriculture. At present, many farmers are not
well equipped to link themselves to suppliers and customers in today’s market-oriented system.
Agribusiness training could thus make a big difference in empowering farmers and their
cooperatives to become better managers of their enterprises and livelihoods (Landmann and
Cadilhon 2016). Having identified this training opportunity as a good long-term strategy to help
rural farming communities link to markets, a partnership of ten international and local research

65
organisations, non-government organisations, and one national-level farmers’ cooperative10
launched the NLA in 2003 (Lundy and Gottret 2005).
The objective of the NLA is farmer training on agribusiness. Much of the development of these
activities and training in the first years were funded by aid money channelled through the
international partners in the NLA. To achieve this, the NLA members first consulted each other
to identify training topics and develop appropriate training methods. Based on this information,
the NLA has established five training guides containing the skills and capacities farmers needed
to improve11.
Figure 5.1: Structure of knowledge replication within the Nicaraguan Learning Alliance
(Source: Landmann and Cadilhon 2016)
These guides use methodologies designed to target Latin American farmers’ cooperatives and
rely on the participation of trainees in building their own understanding of the topic. The
trainees first auto-evaluate the training process, before their results can be compared to training
beneficiaries at different sites. Training methods and topics are adaptable to the local context
of each farmer’s cooperative. The process and topics of the training also promote equity across
gender and social groups. Finally, the training process encourages individual and collective
10 CATIE (Center for Tropical Agricultural Research and Education); CIAT (International Center for Tropical
Agriculture); CRS (Catholic Relief Service); FUNICA (Foundation for Technological Development of Agriculture
and Forestry of Nicaragua); VECO Mesoamerica (VredesEilanden Country Office Central America); GIZ
(German Agency for International Cooperation); LWR (Lutheran World Relief); FENACOOP R.L. (National
Federation of Agricultural Cooperatives and Agribusiness) 11 Guide 1: Self-evaluation provided for the management of rural associative enterprises; Guide 2: Strengthening
socio-organisational processes; Guide 3: Strategic orientation with a focus on value chain; Guide 4: Development
of business plans; Guide 5: Strengthening of services. These are all available in Spanish from
http://www.alianzasdeaprendizaje.org/metodologia (accessed 15 January 2017)

66
empowerment to engage in entrepreneurial activities. The NLA’s novel idea was to use the
existing network of agricultural cooperatives to snowball the training to individual farmer
households. The NLA members trained regional-level cooperatives, which used the same
methods to train village-level cooperatives, which in turn used them to train their individual
farmer members (Figure 5.1). Importantly, the NLA members assigned the training activities
to one clearly identified project manager, who became the physical link between alliance
members and the beneficiary cooperatives, thus creating a trusting relationship with the network
of cooperatives.
Three learning cycles included 77 producer organisations and reached a total of 19,350 farming
families involved in the production of various crops. Women represented 30 per cent of the
trained farmers (AdA-Nicaragua 2012; Landmann and Cadilhon 2016) . Although the process
was at first subsidised by international partners, later on, one of the NLA-members used the
guides developed together with the other members independently.
5.3 Conceptual framework and research design
Conceptual framework to outline the analysis
Mariami, Cadilhon, and Werthmann (2015) describe a conceptual framework evaluating the
impact of IPs. The authors build their framework based on three strands of literature from socio-
economic theory.
First, the authors use the Structure-Conduct-Performance (SCP) model as a general outline for
the study of multi-stakeholder groups such as IPs. Although it has been criticised for its use as
a tool to understand the functioning of real-life markets, the authors noted the SCP model’s
elegant overarching logic: the structure of IPs can impact on its stakeholders’ conduct, and in
turn on the performance of the platform measured by reaching its objectives. Mariami,
Cadilhon, and Werthmann (2015) incorporate elements from New Institutional Economics
(NIE) to complement the overall SCP logic. Indeed, the NIE literature takes into account the
uncertainty endemic within the food industry: technical and economic characteristics of the
products due to agricultural production seasonality, weather instability, and food market cycles
(Furubotn and Richter 2010). NIE’s focus on transaction costs, the organisation and
development of economic activity pose a perfect complement to the SCP model in trying to
understand how IPs work to reach their objectives.
Mariami, Cadilhon, and Werthmann (2015) then suggest going further into the characterisation
of the way IP conduct and performance are measured by using concepts and constructs from

67
the marketing management literature. Endorsing transaction cost economics, this strand of
research studies in great detail how organisations reach more satisfactory marketing
relationships by developing information sharing (Sanzo et al. 2003), communication (Kumar
1996), cooperation, coordination and joint planning (J. C. Anderson and Narus 1984; Claro,
Hagelaar, and Omta 2003), and trust (Kumar 1996; Trienekens 2011). Though IPs are not
generally a means to organise the market transactions between its members, in the case of the
NLA, the alliance does help its members improve the marketing orientation of their production
and planning activities. Therefore, it is still relevant to use the conceptual framework proposed
by Mariami, Cadilhon, and Werthmann (2015) to structure this analysis. The authors combine
the three complementary theories of the SCP model, NIE, and marketing relationships
management into an overarching conceptual framework to understand how IPs work and to
help evaluate their impact. Figure 5.2 shows how the conceptual framework proposed by these
authors has been adapted from the original to fit the specific context of the NLA.
Figure 5.2: Elements of the conceptual framework to evaluate innovation platforms
(Source: Landmann and Cadilhon 2016)
Trust has already been identified as an important component of business relationships in
agricultural value chains of developing countries (Trienekens 2011). Kumar (1996) defines
trust as the belief that each party in a marketing relationship is interested in the other’s welfare;
neither will take action without first considering its impact on the other party. Many researchers
describe trust as a multifaceted concept dependent in each case on the local context. Thus, trust
can be seen as a factor related to competence, process, characteristics, institutions, systems,
services, and even technology (a piece of equipment). Trust can be observed in the decision and

68
actions of participants. From a business perspective, trust is an expected outcome of a certain
event or action (Laeequddin et al., 2010). Applying the concept of trust as found in the business
relationship literature to the context of IPs seems particularly relevant as the different
stakeholders found in an IP also have to develop trust between each other to reach common
objectives. At the same time, these value chain stakeholders can also be competitors or
dependent on one another.
Capacity development is defined in many ways (Ubels, Acquaye-Baddoo, and Fowler 2010).
The United Nations define capacity development as a “process through which individuals […]
obtain, strengthen and maintain the capabilities to set and achieve their own development
objectives over time” (UNDP 2008, 4). This definition includes social, political, and technical
aspects. Bolger's (2000) review concluded that ‘capacity development refers to approaches,
strategies and methodologies used to improve performance at the individual, organisational,
network/sector or broader system level’. Farmers’ capacities are mostly developed by training
activities and workshops given or provided by different actors (Hall 2007; Horton et al. 2003).
In this respect, capacity development describes both the process and the outcome of these
activities, whereby the outcome is defined as changes in working processes and the introduction
of new production methods (Hall 2005; Lusthaus, Adrien, and Perstinger 1999).
Data collection
Data were collected in Nicaragua from NLA members, their influenced partners, non-members
of the NLA and their influenced partners, as well as from agribusiness private companies and
universities. The data collection took place from July to September 2014 in Managua, and in
the provinces of Matagalpa, Jinotega, Estelí, Madriz, Nueva Segovia, Masaya, and Chinandega
(Figure 5.3). These provinces were chosen since most NLA members are working in these
regions (e.g. CATIE in Matagalpa, CRS and FUNICA in Estelí and Jinotega).

69
Figure 5.3: Map of Nicaragua identifying provinces where data collection took place
(Source: Landmann and Cadilhon 2016)
To collect qualitative data, key informant interviews and focus group discussions were held.
Quantitative data were gathered through individual interviews using a structured questionnaire.
Key informants (Table 5.1) were also interviewed with the aim of gaining a more profound
understanding through a less structured conversation. The key informants in the different
regions were chosen based on the different types of stakeholders involved in agricultural
development: governmental organisations, non-governmental organisations, research institutes,
universities, and private companies. The interviews conducted used a guide based on the
individual survey and the conceptual framework. Focus group discussions were held in the
regions where the NLA is active. The characteristics of the villages and the composition of the
members involved in the group discussions had to be similar to those of the villages
representing the area of study. Focus group discussants and key informants were not included
in the sample of individual questionnaires. The locations for the focus groups were randomly
selected from the different regions in our study. All interview questionnaires and guidelines are
accessible on the internet (Cadilhon and Landmann 2015). Focus group discussions followed
the approaches of asking specific questions about definitions and background information,
while also observing the direction taken by the focus group discussion. Focus group participants
were members of first-level cooperatives chosen according to their membership and partners in
the NLA network and their location. Three focus group discussions with different groups of
producers and key informant interviews were held at the beginning of fieldwork as pre-tests of
the individual questionnaire. Results were considered before finalizing the questionnaire.

70
Table 5.1: Institutions of key informants interviewed
Type of
institution Name of institutions
Consultant Kuan-Consultants & Associates
Foundation FUNICA- Nicaraguan Foundation for Technological Development of
Agriculture and Forestry
Gov. institution CONICYT- Nicaraguan Council of Science and Technology
Gov. institution MAGFOR- Ministry of Agriculture and Forestry
Gov. institution MINED- Ministry of Education
NGO CATIE- Tropical Agricultural Research and Higher Education Center
NGO CRS- Catholic Relief Services
NGO HEIFER International Nicaragua
NGO LWR- Lutheran World Relief
NGO SWISSAID
NGO VECO MA- VredesEilanden Country Offices Mesoamerica
Private company Exportadora Atlantic S.A.; ECOM Nicaragua
Private company Ritter Sport
Producers org. APEN- Association of Producers and Exporters of Nicaragua
Producers org. FENACOOP- National Agricultural Cooperative Federation and
Agroindustrial R.L.
Producers org. MAONIC- Movement of Nicaraguan Agroecology and Organic
Producers
Producers org. UPANIC- Union of Agricultural Producers of Nicaragua
University UCA- Centroamerican University
University UCATSE- Agricultural Catholic University of the Dry Tropics
University UNA- National Agrarian University
(Note: Gov. = Governmental; Org. = Organisation; Source: authors own data)
The individual questionnaire collected structural data about the organisation interviewed and
used 53 Likert-scale statements to quantify the levels of conduct and performance. The
respondents expressed their agreement with the statements proposed by the researcher through
the Likert scale (Coding from 1 = ‘strongly disagree’ up to 5 = ‘strongly agree’ as well as N/A=
not applicable).
In each location, preliminary individual interviews were held with managers of farmers’ groups
involved in NLA capacity development. To constitute the control group of farmers’
organisations not involved in the NLA network, contact was made with other cooperatives and
organisations with a similar structure in the same region. These organisations were identified
by asking for references from the respondents within the NLA network, as well as by randomly
interviewing numerous farmer organisations in the region where the fieldwork was undertaken.

71
The resulting sample of interviews in all regions was double-checked against lists of all farmer
organisations active in these areas. In total, 38 NLA-members or influenced partners and 52
members of other agribusiness development networks and organisations not influenced by the
NLA were interviewed.
At the end of data collection, focus group discussions with NLA-influenced and non-influenced
cooperatives were held to discuss unclear topics. Overall, data from six focus group discussions,
20 key informant interviews and 90 individual questionnaires were collected (Cadilhon and
Landmann 2015).
Data analysis
Graphical inspection and descriptive analysis of the structural data were undertaken first.
Statistical differences were then identified between NLA members and their influenced groups
as well as between the different levels of the network of the agricultural sector, compared with
the reference group.
To avoid multicollinearity due to potential interrelationships between statements, factor
analysis with orthogonal VARIMAX rotation reduced trust and capacity development
statements to a smaller number of uncorrelated underlying factors. Reliability tests were carried
out with all statements and afterwards with the calculated factors. The factors were also
analysed with values of Cronbach’s Alpha, Kaiser-Meyer-Olkin (KMO) measurement and
Bartlett’s Test of Sphericity. The acceptable factor loading chosen for this study (population of
90) is 0.564 (Field 2009).
A multiple linear regression was undertaken with the factors developed from performance
variables representing capacity development as the dependent variable. Independent variables
were factors representing the trust component of the NLA members’ conduct and additional
individual structure and conduct variables as hypothesized by the conceptual framework
(Figure 5.2). To affirm the validity and robustness of the regression models, common diagnostic
tests were used: R-Squared showed the overall fit of the model and Variance Inflation Factor
(VIF) values were analysed (Field 2009). Landmann (2015) describes the complete process of
the factor and regression analyses.
The qualitative data relating to information sharing, communication, coordination, joint
planning, and trust gathered from the focus group discussions and individual interviews were
transcribed into a single document. Following best practices in mixed research methods (Patton
2002), quotes from the stakeholders interviewed were selected to provide backing for the

72
statistically significant results of the regression. Various other quotes were chosen because they
enabled the interpretation of some of the non-significant results of the regression. The results
presented below build upon the triangulation of both quantitative and qualitative data, therefore,
go beyond an analysis produced by Landmann and Cadilhon (2016) in a case study form.
5.4 Results
Descriptive statistics of farmers’ organisations
Coffee was the most produced crop for 41 farmers’ organisations sampled; 33 reported basic
grains (beans, corn and rice) and 16 declared other products (cattle, milk or dairy, vegetable,
honey, cocoa). Twenty-six organisations focused on only one agricultural product. In total, 12
respondents represent a national organisation (one NLA-member and 11 others). Six
respondents represented regional organisations (three NLA-members and three others), two are
from national-level cooperatives (one NLA-member and one other) and 14 represent regional-
level cooperatives (seven NLA-partners and seven others). The sample included 54 village-
level cooperatives (26 NLA-partners and 28 others). Seventy respondents out of 90 mentioned
their organisation was participating in more than one capacity development group. The majority
of respondent organisations performed the function of farming, marketing or processing groups.
Most groups were also providing capacity development services. Two-thirds of the
organisations interviewed also had some financial role in providing credit to their members.
Out of the 90 respondent organisations, 57 were established cooperatives, 14 associations, eight
NGOs, five private companies, and six were related to government. The most important source
of funding came from NGOs (37 cases) followed by cash from operations generated (25 cases),
credit provided by the private sector (11 cases), membership fees (10 cases), while seven were
government funded. Of all organisations sampled, twenty-six organisations have fewer than
100 members as producers while 27 represent between 100 and 499 producers. Organisations
speaking for 500 to 999 farmers are represented by nine respondents and organisations having
1,000 to 4,999 farmers as members are represented by 16 respondents. Only ten organisations
represent more than 5,000 producers. The largest organisation interviewed counts 50,000
producers as members. In terms of gender balance of the producers, 69 per cent were men and
31 per cent women (Cadilhon and Landmann 2015).
Regression analysis – structure and conduct influencing performance
The regression results presented in Table 5.2 derive from an econometric model to test selected
parts of the conceptual framework depicted in figure 5.2. The variables chosen as explanatory

73
variables are consistent with the literature review and conceptual elaboration by Mariami,
Cadilhon, and Werthmann (2015), who propose constructs that can be used to measure
structure, conduct, and performance in the context of innovation platforms. Thus, Table 5.2
identifies, on the one hand, the influence of structure (characterised by the number of years the
interviewee has worked for the organisation, the connection of the organisation with the NLA,
and the position of the organisation inside the network) on the factor ‘innovation’. Secondly, it
describes the influence of the learning partners’ conduct (represented by statements clustered
into information sharing, coordination, joint planning and two trust factors) on the factor
‘innovation’. The factor ‘innovation’ represents the capacities developed by the organisation in
the last years measured by new products, knowledge and new techniques or machinery.
‘Innovation’ is based on the following statements: 1- We have developed new products in the
last six years; 2- Our knowledge about our activity has improved in the past six years; 3- In the
past six years, we have used new techniques or machinery in our production, production process
or management. In the end, two structure variables, two joint planning statements and both trust
factors show a significant impact on performance. The adjusted R-Squared of this regression is
40.4 per cent, and the whole regression is statistically significant at a level inferior to 0.1 per
cent. All B-values are between one and minus one with only one exception. Respecting the
conditions of the equation model meant that the influence of the independent variables on the
dependent variable is relatively small (Field 2009).
The number of years working for the organisation has a significance of 0.1 per cent and a Beta-
value of 0.294, which shows that the amount of time the interviewee has worked for an
organisation increases the factor innovation. The connection of the organisation with the NLA
does not have a statistically significant influence on the factor innovation. On the other hand,
the position of the organisation inside the network does have a significant influence (Sig.= 4.8
per cent; Beta-value= -0.178). The attributes of this variable are ordered on an ordinal scale
related to the position inside the network: national organisations or institutions have a value of
one, regional organisations a value of two, cooperatives at third level a value of three,
cooperatives at second level a value of four and cooperatives at the first level closest to the
farmers a value of five. The bigger the value, the more local the organisation. Being closer to
the farmers’ level rather than at national level decreases ‘innovation’.

74
Table 5.2: Regression analysis of structure and conduct indicators on the factor ‘innovation’
Dependent variable: Factor: Innovation
Unstandardized Standardized
Collinearity
Coef. Coef. Statistics
B Std. Error Beta t Sig. Tolerance VIF12
(Constant) -1.709 0.907 -1.883 0.064
Structure
Years working for the organisation13 0.044 0.013 0.294 3.381 0.001 0.914 1.094
Connection with NLA14 0.249 0.177 0.124 1.405 0.164 0.885 1.129
Position of the organisation inside the network15 -0.131 0.065 -0.178 -2.01 0.048 0.883 1.132
Conduct Information
exchange
We usually share information about production
with other stakeholders.16 0.172 0.117 0.13 1.467 0.147 0.881 1.135
The NLA/ our organisation exchange information
about their on-going activities with us.7 0.208 0.123 0.167 1.69 0.095 0.711 1.407
Conduct Co-
ordination
We plan our activities together with the NLA/ our
organisation according to our production
potential and customer demand.7
-0.26 0.115 -0.224 -2.265 0.026 0.707 1.415
Conduct Joint
planning
Our viewpoints are taken into account by the NLA/
our organisation when they plan their activities.7 0.028 0.142 0.022 0.201 0.842 0.558 1.791
Joint planning of activities with the NLA/ our
organisation has improved in the last six years. 7 0.447 0.126 0.378 3.541 0.001 0.607 1.646
Conduct Trust
We prefer to have long term relationships.7 -0.174 0.125 -0.127 -1.387 0.169 0.828 1.208
Factor: Trustful relationships 0.252 0.096 0.248 2.613 0.011 0.771 1.298
Factor: Trustful contracts 0.23 0.091 0.231 2.532 0.013 0.834 1.2
Notes: Variables with significant influence on factor ‘Innovation’ are shown in italics; R-Square= 0.480; Adjusted R-Square= .404; Significance= 0.000; level of
significance p < 0.05
Source: Landmann & Cadilhon (2016)
12 VIF= Variance inflation factor 13 Scale: Years in numbers 14 Scale: 0= No; 1= Yes 15 Scale: 1= National organisation; 2= Regional organisation; 3= Cooperative 3rd level; 4= Cooperative 2nd level; 5= Cooperative 1st level 16 Scale: 1= strongly disagree; 2= disagree; 3= undecided; 4= agree; 5= strongly agree

75
Two statements related to information sharing between the farmers and other stakeholders as well
as between the NLA or their organisations and the farmers do not have a significant influence. The
statement ‘We plan our activities together with the NLA/ our organisation according to our
production potential and customer demand’ has a negative significant influence (Sig.= 2.6 per cent;
Beta-value= -.224). On the other hand, the statement ‘Joint planning of activities with the NLA/
our organisation has improved in the last six years’ has a positive and statistically significant
influence (Sig.= 0.1 per cent; Beta-value= .378) on innovation. Yet, the statements ‘our viewpoints
are taken into account by the NLA/ our organisation when they plan their activities’ as well as ‘we
prefer to have long-term relationships’ do not have a significant influence. Both trust factors
labelled ‘trustful relationships’ (Sig.= 1.1 per cent; Beta-value= 0.248) and ‘trustful contracts’
(Sig.= 1.3 per cent; Beta-value= 0.231) have a positive significant influence on ‘innovation’. The
factor ‘trustful relationships’ is based on the following statements: 1- The NLA/ our organisation
always keeps their promises; 2- The NLA/ our organisation always gives us correct information;
3- The NLA/ our organisation actions and behaviours are very consistent; 4- The NLA/ our
organisation always tries to inform us if problems occur. The factor ‘trustful contracts’ is based on
the statements: 1- We only develop a relationship with business partners who are fair to us and 2-
We only maintain a relationship with our business partners with clearly written terms and
conditions.
Qualitative data
According to one key informant and professor at UCATSE – Agricultural Catholic University of
the Dry Tropics: “It will be given [the same] training that another organisation has conducted. It
could be provided with a service complementing the organisations offers: currently this is a little
bit the problem in Nicaragua. There are sixty-eight organisations working in extension, but there
is nobody who offers credit or the full range of extension service”. This statement underlines the
findings from the regression model that joint planning of activities between farmers’ cooperatives
and training organisations is negatively related with innovations. Because there might be other
organisations involved in training activities on similar subjects.
Information sharing is strongly linked to trust, which in return has a strong impact on fostering
innovations. For example, a key informant and a board member of the national commission for
coordination and management at MAONIC, the Movement of Agro-ecological and Organic
Producers of Nicaragua, declared: “Each alliance depends to which extent transparency is achieved.

76
If the organisation is transparent, trust is existing. […] That is the condition we see, which is
required. But we also ask the other partner, if he agrees on our point of view when possible.” The
professor at UCATSE explained the discrepancy between information sharing and innovation by a
mainly top-down flow of information in Nicaraguan agricultural development and extension: “one
problem of these alliances is the management of information. […] Feedback is required, as a
member but also from the bottom, meaning producer of the cooperative and the organisations.
There should be a bottom-up information flow but according to our experience, it doesn’t work.
The information does not flow with the same speed from one side to another [as easily as from the
other].”
Our key informant from MAONIC supports the fact that organisations and stakeholders working
with producers are mostly aware of challenges and improve farmer’s training. To “focus on small
producers as the core of the solution to solve problems” is one goal of MAONIC. According to the
board member, the farmer himself is the “leader of change to achieve the goal of change and
improvement”. MAONIC is “empowering [the farmer] to improve the information about his own
farm […]. If that fails, no project […and] no government will help him out of poverty.”
A project manager at FUNICA – the Nicaragua Foundation for Agricultural and Forestry
Technological Development, an NLA member and key informant, supports the point that trust
influences the factor innovation, saying “the level of trust has an influence on capacity development
within the NLA.” He explains how trust was created within the NLA network and the beneficiary
farmers’ organisations: “meeting their expected contributions is important. For example, if there is
a project and they will comply, the organisation has to contribute a certain amount of resources,
generate the planned results, provide information which is requested, basically.”
To illustrate the results of the ’trustful relationships’ factor, we consider the declarations of a
manager working for the private sector firm Exportadora Atlantic S.A. in Nicaragua and key
informant. He states very generally that “everything is based on trust. Trust and transparency have
to be the axis of all organisations.” More specifically, he explains that farmers trust “the economic
solidity of the company” as well as “the transparency” with which the company negotiates with
farmers. “We also trust in producers; we deposit 2,000, 3,000, 20 or 100 million dollars that he can
work and grow his fruits.” The board member of MAONIC confirms the statement of the private
firm by highlighting the importance of the relationship between transparency and trust but also
says that, “If there is trust then, even with a few resources, much more could be done.”

77
A consultant at CATIE – the Tropical Agricultural Research and Higher Education Centre – and
key informant describes the structure of the NLA as one where “[all NLA-members] are at the
same level. There is no hierarchical structure, […] There is a lot of trust, and quite some
transparency in communication.”
During a focus group discussion with small-scale farmers on 5th August 2014 in Chinandega, the
farmers said they trust NGOs and “mistrust the governmental institutions”. They linked the former
to the fulfilment of promises and financial support. A consultant of MINED – the Ministry of
Education – and key informant supports this argument saying that: “producers […] distrust the
government […], because sometimes […] the financial expectations of producers are not fulfilled.”
Most stakeholders do not work together with governmental institutions. The farmers “read [the
contracts and agreements of the government] […] but they do not have much confidence.” The
farmers interviewed explain this as follows: “we do not have all information […] and do not know
the intention of the government”. From the farmers’ perspective, there is a lack of transparency in
governmental activities.
5.5 Discussion and conclusions
Representativeness of the data
The Central American Bank for Economic Integration (BCIE) has undertaken a similar study of
farmers’ organisations in Central America using data from 63 representative Nicaraguan
cooperatives (Lafortezza and Consorzio 2009). The results from this study are similar to those of
the BCIE study: the main products produced and exported are the same, as is the gender balance
within the cooperatives. The main difference between the two studies lies in the size of the
organisations interviewed: our study incorporates very large cooperatives with more than 10,000
members and active at regional and village levels. The BCIE study’s sample also differs from the
sample of this study as 35 percent of the BCIE sample had not received any training while all the
farmers’ organisations sampled in this study had benefited from some sort of training. Although
there are some differences between the two studies’ samples, the similarity in overall results allows
considering that this study’s sample is also representative of farmers’ organisations active in the
provinces where the NLA is present.

78
Efficiency of the NLA’s capacity development process
The old structures of cooperatives and the different levels within the cooperative network are still
present and an important factor in agribusiness development. The private, public, and NGO sectors
are familiar with farmers’ cooperatives being widely spread out in Nicaragua and have adapted
their methods to this structure. The NLA has used the wide network of agricultural cooperatives to
snowball its training on agribusiness from the national level to a large number of individual
farmers. However, the other support organisations in the Nicaraguan agricultural innovation system
are doing the same so all farmers’ cooperatives and their farmer members are connected one way
or another to a source of training on agribusiness management. Every key stakeholder interviewed
was practising capacity development in the study area. A majority, 77 per cent, of respondents,
reported being supported by more than one organisation. This is the most reasonable explanation
for the fact that a ‘connection to the NLA’ does not have a significant influence on ‘innovation’.
The lack of significant influence of information sharing on innovation in the regression is surprising
as qualitative data indicate that information sharing is strongly linked to trust, which in turn has a
strong impact on fostering innovations. However, one possible explanation is that agricultural
training is generally a top-down process. As a probable consequence, information sharing has no
significant influence on innovation. The generalised top-down extension method also explains that
only when joint planning is seen to be improving does it have a positive impact on innovation.
Furthermore, the data show that the farmers’ viewpoint is not taken into account. This supports the
idea of rethinking and reorganizing the capacity development sector as well as the structure of
agricultural organisations and institutions, just as the NLA has done. Although all providers of
agribusiness training in Nicaragua are using the strong cooperative-oriented structure within the
country’s agricultural sector to improve farmers’ knowledge of agribusiness and markets, yet, all
stakeholders follow their own approaches. Cooperation and networks between different types of
stakeholders are rare.
In fact, the qualitative data indicated that the organisations participating in the NLA network would
greatly value an exchange of their experience and progress with other organisations. Thus, the NLA
and other stakeholders working in the sector of capacity development should open their network
to other stakeholder types, even though the government does not seem to show interest in such a
cooperation. This could make the training method more efficient, sustainable, and successful.
Using organised networks seems to be the right pathway for agricultural training given the structure

79
of Nicaragua’s agriculture, but interactions could be improved between actors of the same level
and different levels. On the other hand, there is no visible influence on the duration of a relationship
on ‘innovation’. One explanation could be farmers’ easy access to cooperatives: out of 90
respondents, 70 were at least in two different cooperatives.
Several cooperatives consider that capacity development will be successful only if accompanied
by financial support. The NLA has thus embedded financial support to put the agribusiness
development skills learned during its learning cycles into practice. Financial support is necessary,
but the main goal is to have successful producers who are not dependent on the financial support
from NGOs (Lundy and Gottret 2005). Indeed, successful IPs in the long-term are those that
manage to renew their funding source to keep covering their costs, or those that manage to change
their business model in order to become financially self-sustainable (Dror et al. 2016).
The quantitative and qualitative data show on the one hand that the content and process of NLA’s
training are very good. On the other hand, the qualitative data show that the way the training is
undertaken with farmers could be improved if adjusted to the regional circumstances. This
statement was confirmed during the focus group discussions, several key informant interviews, and
some individual questionnaires. The current strategies of some NLA members to adapt the training
to the local environment are successful, and this is a response to some criticism from the final
beneficiaries. On the other hand, it is difficult to trace the success of the NLA training. If one
member changes the method and uses the information on their own, it is no longer helpful for the
other NLA members. Indeed, changing the learning method to adapt it to local context jeopardizes
the approach of the LAs to build up a platform to share information and learn from each other. The
institutional learning platform is no longer efficient and sustainable if improvements and changes
are not shared with the other NLA members. Opportunities for communication and meetings with
other knowledge networks to share and exchange information are also missed by some
cooperatives. Lundy and Gottret (2005) describe an approach in the method of the LA to create
networks at the micro, meso, and macro levels. These intertwined networks do not exist in
Nicaragua and would be the answer to some current criticisms. The NLA itself already identified
enlarging knowledge networks as one weakness and included this in the changes that are planned
for the coming years (AdA-Nicaragua 2012).

80
Trustful relationships improve the NLA learning process
The quantitative and qualitative results of this study show a clear impact of various components of
trust within the NLA network and its capacity development outcomes. The regression model
showed that ‘trustful relationships’ and ‘trustful contracts’ both had a positive significant influence
on ‘innovation’.
As described above, the farmers have a better perception of NGOs than of government. More
worryingly, it seems that NGOs almost have no collaboration with governmental organisations.
This, on the one hand, shows distrust of government action but on the other hand, also shows that
the alliances between NLA members and governmental institutions could be strengthened.
The study’s results identify the relationship existing between trust and capacity development in the
case of the NLA. The regression and qualitative data triangulation indicate that structure and
conduct have an influence on performance. The influence of trust on capacity development and
innovation identified by this research contributes evidence for the conceptual framework of
innovation platforms proposed by Mariami, Cadilhon, and Werthmann (2015). Furthermore, the
influence between IP structure and conduct is also observable, for example, in the fact that NGOs,
as financial sources of the farmers’ organisations, have a significant influence on ‘trustful
relationships’. The influence of conduct on performance is visible as well: results show that
‘trustful relationships’ and ‘trustful contracts’ have a positive influence on ‘innovation’ emerging
from capacity development variables. The findings complement those of past research identifying
linkages between how an IP is structured, the conduct of its members and its expected outcomes
(Badibanga, Ragasa, and Ulimwengu 2013; Kago et al. 2015; Mariami, Cadilhon, and Werthmann
2015; Pham, Cadilhon, and Maass 2015; Dror et al. 2016; Teno and Cadilhon 2016).
Reverse causality is a limitation which could occur using regressions as an analysis tool (Field
2009). In our study, we assume that this problem is relatively small as the conceptual framework
is based on theories which are already used very often. Furthermore, this specific conceptual
framework was already used in a similar way in different settings, moreover, we triangulated our
quantitative data with qualitative data. However, to be sure that reverse causality is not occurring,
more detailed data would be helpful.
The method used to evaluate the impact of the NLA could also be improved, by including financial
and business figures in the questionnaire for direct comparison of economic impacts. This data

81
could also be collected through the auto-evaluation mechanism developed by the NLA whereby
farmers’ organisations evaluate their own learning progress. This would simplify making
adjustments to the training method and the conceptual framework used to evaluate impact.

82
6 General conclusion
Small-scale farmers living in rural areas need to develop their agricultural capacity, in order to
produce agricultural goods and gain a stable and sufficient income. To improve agricultural
capacity development, it is necessary to understand farmers’ needs and demands for capacity-
building measures. With respect to agricultural capacity development, there is little guidance in the
literature on farmers’ preferences, the effects of trainers’ qualifications, behavioural drivers of
farmers to use new technology. Regarding new technology especially smartphones have a high
potential for capacity development activities. Further there is little guidance to evaluate innovation
platforms focusing on capacity development.
The papers of this dissertation, to my best knowledge, presents the first study analysing farmers’
WTP with a discrete choice experiment for different aspects of agricultural training such as training
method, location and duration, the type of trainer and additional offers. The data were analysed
using a mixed logit in WTP space. Further, we analyse whether there are differences in learning
success and perceived satisfaction through agricultural training among farmers due to the trainer’s
educational qualification. In order to close the gap of understanding the psycho-economic
dimension during the implementation process of modern digital technology, the third paper
presents a study identifying and quantifying the drivers of small-scale farmers´ intention to use a
smartphone to acquire agricultural knowledge with a complex conceptual framework. The data of
the first three papers was collected in Bihar, India. As one of the poorest states in India, a large
share of the population is living in rural areas characterised by poor infrastructure and resource
scarcity, a common feature in developing countries. These are common features in developing
countries and this for a good possible base for external validity
The fourth paper is pilot-testing a conceptual framework with respect to innovation platforms as a
collaborative agricultural education mechanism. It analyses how innovation platforms work in a
Latin American context through mixed research methods.
The results from this dissertation contribute to the existing literature in the topics mentioned above
and to our best knowledge, these are the first studies providing such in-depth account in the context
of agricultural training.

83
6.1 Main findings
Overall, the results indicate that policymakers and stakeholders in agriculture in developing
countries should continue to shift from standardised top-down models towards decentralisation and
demand-induced community-driven approaches. This would help to achieve greater mutuality,
flexibility, and customisation of training measures.
The results of the discrete choice experiment presented in the second chapter prove that the training
method used is the most important attribute of training, and within this attribute, classroom training
with demonstrations is most preferred, as the NGO PRAN is mostly applying. Farmers indicate an
aversion using smartphones in agricultural training, despite global digitalisation trends and current
efforts to include modern information and communication technology, such as mobile phones or
smartphones in agricultural capacity development in developing countries. Accessibility and usage
of smartphones are increasing and improving daily (Aker, Ghosh, and Burrell 2016). However,
regions such as Bihar are still hardly influenced by smartphones. The conceptual framework of the
third paper analyses the behavioural drivers of farmers to use smartphones and proves that the
constructs of attitude, subjective norms and behavioural control influence first desire and later
intentions to use smartphones in agriculture. Emotions influence desires as well as intention to use
smartphones for the generation of agricultural knowledge.
The expressed preference in the discrete choice experiment for academic trainers questions the use
of current approaches such as ‘train-the-trainer’, which involves farmers in the knowledge
replication process. A typical example of this approach is the Nicaraguan Learning Alliance, which
is analysed in chapter five. Other approaches as the ‘agricultural knowledge and information
system’, already create direct links between scientists and farmers via modern communication
technologies. The second paper shows that the trainers’ qualification does not cause distinction in
the perceived satisfaction of the farmers, even though the learning success decreases with an
academically educated trainer. The difference in the participants’ learning success is probably
caused by the missing experience of the academic trainer compared to the agent.
Farmers preferred any kind of additional offer to no offer and most preferred an offer of crop
production inputs or credit, which are the best options for increasing agricultural yield and could
be included by training organisations. The respondents, particularly women, preferred having
training close to home and lasting only half a day, allowing them to perform their daily
responsibilities in the household. However, these were the least important attributes in the study.

84
The second paper analyses farmers’ performance and satisfaction participating in agricultural
training. It shows that farmers seem not to be aware of their own learning performance, as changes
in the attitude and perceived control do not mediate the relation between trainers’ qualification and
learning success. Also, subjective norm has no significant direct effect on learning success, which
could be due to irrelevance of the behavioural construct caused by the fact that learning success is
a score based and performance driven variable. Even if the changes of attitude over the training
neither mediate respecting perceived satisfaction, they still influence the perceived satisfaction
positively. Furthermore, the results give evidence that changes of perceived control are not
occurring during the training or the changes are not important regarding perceived satisfaction
neither regarding learning success. Subjective norms have a positive direct effect on perceived
satisfaction. However, subjective norm does not moderate the relationship between trainers’
qualification towards perceived satisfaction or learning success. Against this background, it plays
a pivotal role with regard to the quality of the training that the social environment for instance,
their spouse, neighbours or farmers colleagues supports the participation in training sessions.
To understand the drivers of the intention to use smartphones for agricultural purposes a model
based on the Theory of Planned Behaviour was developed and adapted to developing countries -
in this case Bihar. The research model represents the data set to a high degree. In addition, it
emphasizes the good functionality of the model and the constructs adopted from Cheon et al. (2012)
and Perugini and Bagozzi (2001). The successful application of our model shows that positive and
negative anticipated emotions can be considered as an important extension of the TPB. This
extension of the TPB with emotions should be taken into account in conceptual frameworks of
empirical studies on smartphone adoption behaviour in context developing countries where the
respondents are not used to a new technology yet.
The study’s results of the fourth paper identify the relationship existing between trust and capacity
development in the case of the NLA. The quantitative and qualitative data indicate that structure
and conduct influence performance. The influence of trust on capacity development and innovation
identified by this research contributes evidence for the conceptual framework of innovation
platforms proposed by Mariami et al. (2015). Furthermore, the influence between innovation
platform structure and conduct is also noticeable, for example, in the fact that NGOs, as financial
sources of the farmers’ organisations, have a significant influence on ‘trustful relationships’. The
influence of conduct on performance is visible as well: results show that ‘trustful relationships’ and

85
‘trustful contracts’ have a positive influence on ‘innovation’ emerging from capacity development
variables. The findings complement those of past research identifying linkages between how an
innovation platform is structured, the conduct of its members and its expected outcomes
(Badibanga, Ragasa, and Ulimwengu 2013; Subedi et al. 2014; Kago et al. 2015; Mariami,
Cadilhon, and Werthmann 2015; Pham, Cadilhon, and Maass 2015; Dror et al. 2016; Teno and
Cadilhon 2016).
6.2 Policy recommendations
The results of this dissertation are expected to provide policymakers and NGOs with insights into
the underlying psychological factors that influence the participation in agricultural training. These
insights can be used to adjust current policies and to develop new initiatives to stimulate the
knowledge transfer and participation in agricultural training programmes by farmers.
Regarding the trainer of agricultural capacity development activities, I suggest combining the
strength of local agents trained by NGOs or other institutions and an academically educated trainer.
An expert educated on-the-job could be the main trainer and an academic person could supplement
the extension service by giving one training in a session of many. With this method, the benefits
of both trainer’ types could be used without higher costs. Mass media would also allow academic
trainers (the most preferred type of trainer) to be involved in the capacity development activities
without increasing the costs and would allow agricultural production and marketing information to
be disseminated. Thus, policymakers should seek to overcome psychographic and regional barriers
to the implementation of mass media in capacity development. However, besides the professional
background, discussed in the second paper, it is important that trainers are trained on the particular
cultural background, different teaching methods as well as other soft skills. In addition, policy-
makers can set basic standards regarding trainers’ qualification, e.g. vocational training.
Our results regarding the farmers’ satisfaction and their intention to use smartphones also indicate
that farmers are influenced by people who are close to them, such as family members, friends,
neighbours and farmers colleagues. Therefore, a good image as well as recommendations of the
implementing NGO, the approach and the training sessions are required in order to have the support
of the social environment. Training activities tailored to the preferences of farmers as well as, for
instance, open days to promote the NGO and the training approach can help.

86
Seeds and fertiliser could be used as incentives for farmers to participate in agricultural training.
The additional costs of demand-driven upgrading of capacity development activities could be
covered by a fee that complies with farmers’ WTP. In order to avoid exclusion of the poorest
farmers and to meet farmers’ demands, different additional services and goods, such as seeds, could
be introduced based on a voluntary payment system.
If stakeholders want to support the use of smartphones, individual farmers and farmer groups
should be addressed. The intention to use a smartphone is already influenced long before owning
a smartphone. If one key person of a farmer’s network is against smartphones for the generation of
knowledge, the desire of using smartphones of the entire network could decrease. Stakeholders
such as NGOs (e.g. PRAN, FnF or NLA) or governmental organisations can provide the basis for
the successful establishment of smartphone-generated knowledge today. If the stakeholders
produce a positive smartphone image, explain the usefulness and show that stakeholders
themselves are ready for this technology, it will indirectly influence the intention of the farmers to
use smartphones. However, trainers and extension workers can influence farmers’ attitudes,
subjective norms, and behavioural control beliefs indirectly by sharing their opinions.
The Nicaraguan data show that the farmers’ viewpoint is not always taken into account, which
supports the idea of rethinking and reorganising the capacity development sector as well as the
structure of agricultural organisations and institutions. The NLA is one case where adjustments in
the knowledge replication were done to improve the process of knowledge replication. However,
as the changes do not seem to be more successful as the approaches of other capacity development
actors, more changes are required, which leads to approaches presented in the first papers. The
qualitative data analysing the NLA indicate that the organisations participating in the NLA network
would greatly value an exchange of their experience and progress with other organisations. Thus,
the NLA and other stakeholders working in the sector of capacity development should open their
networks to other stakeholder types, even though the government does not seem to show interest
in such cooperation’s. This could make the training method more efficient, sustainable, and
successful. Using organised networks seems to be the right pathway for agricultural training given
the structure of Nicaragua’s agriculture, but interactions could be improved between actors of the
same level and different levels. The results of the NLA case prove that financial support of capacity
development activities in developing countries is necessary, but the main goal is to have successful
producers who are not dependent on the financial support from NGOs (Lundy and Gottret 2005).

87
Indeed, successful innovation platforms in the long-term are those that manage to renew their
funding source to keep covering their costs, or those that manage to change their business model
in order to become financially self-sustainable (Dror et al., 2016). By this fact, we suggest to also
support the development of farmers’ capacities via smartphones, with academic trainers or other
recommendations mentioned above financially. However, we also suggest to already plan from the
beginning how the activities can be financially sustainable in the long run.
6.3 Limitations and future research
The research presented in this dissertation is characterised by some limitations. First, although
discrete choice experiment is a scientifically well-accepted method, it comprises a hypothetical
experiment and therefore may entail a hypothetical bias to a certain extent. Thus, other studies
about farmers’ behaviour regarding training preferences and WTP in real decision situations are
needed.
The PLS- analysis of the third paper is often presented as a method with weaknesses. Another
possibility would be, to back up our results with a covariance-based structural equation modelling
as recommended by Rönkkö and Evermann (2013). As we are not able to measure and observe the
actual behaviour with respecting to intentional behaviour to use a smartphone, we assume, based
on the analysis by Sheeran (2002), that intention later influences indirectly the adoption of
smartphones for the generation of agricultural knowledge. However, the implementation of
smartphones to generate agricultural knowledge could be tested by using different methods to
confirm that the constructs pointed out are relevant.
As the data of the first three papers were collected in three districts in Bihar, India, the conceptual
framework and approaches can only be generalised to a certain degree. To assure that the methods
used, and the results presented also work in other settings and that the conclusions and
recommendations can be withdrawn there as well the usage of the survey and conceptual
framework have to be carried out in other developing countries.
Reverse causality is a possible limitation of all papers using regressions as an analysis tool (Field
2009). In our study, we assume that this problem is relatively small as the conceptual frameworks
and constructs are based on theories which have already been used very frequently. Furthermore,
the conceptual framework of the fourth paper was already used in a similar way in different settings.
Moreover, we triangulated our quantitative data with qualitative data. However, to be sure that
reverse causality is not occurring, more detailed data would be helpful.

88
References
Abebe, Gumataw K, Jos Bijman, Ron Kemp, Onno Omta, and Admasu Tsegaye. 2013. “Contract
Farming Configuration: Smallholders’ Preferences for Contract Design Attributes.” Food
Policy 40: 14–24.
AdA-Nicaragua. 2012. “Alianza de Aprendizaje Nicaragua- Plan Estratégico 2013-2016.” Alianza
de Aprendizaje Nicaragua, 13.
AdA. 2014. “Alianza de Aprendizaje.” 2014.
http://www.alianzasdeaprendizaje.org/portal/index.php.
Aditya, and S. R Sing. 2014. “Mobile Learning for Transforming Education and Improving
Learning Outcomes on Agriculture in India.” International Journal of Agricultural Science,
Research and Technology 3 (3): 163–71.
Ajayi, O. A. 2006. “An Assessment of Farmers’ Willingness to Pay for Extension Services Using
the Contingent Valuation Method (CVM): The Case of Oyo State, Nigeria.” Journal of
Agricultural Education and Extension 12 (2): 97–108.
https://doi.org/10.1080/13892240600861567.
Ajzen, Icek. 1991. “The Theory of Planned Behavior.” Organizational Behavior and Human
Decision Processes 50 (2): 179–211. https://doi.org/10.1016/0749-5978(91)90020-T.
———. 2002. “Perceived Behavioral Control, Self-Efficacy, Locus of Control, and the Theory of
Planned Behavior.” Journal of Applied Social Psychology 32 (4): 665–83.
https://doi.org/10.1111/j.1559-1816.2002.tb00236.x.
———. 2006. “Constructing a Theory Of Planned Behavoir Questionnaire.” 2006.
Aker, Jenny C. 2011. “Dial ‘A’ for Agriculture: A Review of Information and Communication
Technologies for Agricultural Extension in Developing Countries.” Agricultural Economics
42 (6): 631–47. https://doi.org/10.1111/j.1574-0862.2011.00545.x.
Aker, Jenny C., Ishita Ghosh, and Jenna Burrell. 2016. “The Promise (and Pitfalls) of ICT for
Agriculture Initiatives.” Agricultural Economics 47: 35–48.
https://doi.org/10.1111/agec.12301.
Aleke, Bartholomew, Udechukwu Ojiako, and David W. Wainwright. 2011. “ICT Adoption in
Developing Countries: Perspectives from Small‐scale Agribusinesses.” Journal of Enterprise

89
Information Management 24 (1): 68–84. https://doi.org/10.1108/17410391111097438.
Ali, Jabir, and Sushil Kumar. 2011. “Information and Communication Technologies ({ICTs}) and
Farmers’ Decision-Making across the Agricultural Supply Chain.” International Journal of
Information Management 31 (2): 149–59. https://doi.org/10.1016/j.ijinfomgt.2010.07.008.
Anderson, James C., and James A. Narus. 1984. “A Model of the Distributor’s Perspective of
Distributor-Manufacturer Working Relationships.” Journal of Marketing 48 (4): 62–74.
https://doi.org/10.2307/1251511.
Anderson, Jock R. 2007. “Agricultural Advisory Services.” In Background Paper for World
Development Report 2008- Agriculture for Development. Washington D.C: The World Bank.
Antonio, Amy, and David Tuffley. 2014. “The Gender Digital Divide in Developing Countries.”
Future Internet 6: 673–87. https://doi.org/10.3390/fi6040673.
Aydogdu, M. H. 2017. “Evaluation of Farmers’ Willingness to Pay for Agricultural Extension
Services in GAP-Harran Plain, Turkey.” Journal of Agricultural Science and Technology 19
(4): 785–96.
Babu, Suresh, P.K. Joshi, Claire J. Glendenning, Kwadwo Asenso-Okyere, and Rasheed V
Sulaiman. 2013. “The State of Agricultural Extension Reforms in India: Strategic Priorities
and Policy Options.” Agricultural Economics Research Review 26 (2): 159–72.
Badibanga, Thaddee, Catherine Ragasa, and John Ulimwengu. 2013. “Assessing the Effectiveness
of Multistakeholder Platforms.” 01258. IFPRI Discussion Paper. Washington, DC: IFPRI-
International Food Policy Research Institute.
Bagozzi, Richard P., and Youjae Yi. 1988. “On the Evaluation of Structural Equation Models.”
Journal of the Academy of Marketing Science 16 (1): 74–94.
https://doi.org/10.1007/BF02723327.
Balcombe, Kelvin, Ali Chalak, and Iain Fraser. 2009. “Model Selection for the Mixed Logit with
Bayesian Estimation.” Journal of Environmental Economics and Management 57 (2): 226–
37. https://doi.org/10.1016/j.jeem.2008.06.001.
Balderjahn, Ingo, Anja Buerke, Manfred Kirchgeorg, Mathias Peyer, Barbara Seegebarth, and
Klaus-Peter Wiedmann. 2013. “Consciousness for Sustainable Consumption: Scale
Development and New Insights in the Economic Dimension of Consumers’ Sustainability.”

90
AMS Review 3 (4): 181–92. https://doi.org/10.1007/s13162-013-0057-6.
Ban, A.W. van den. 1997. “Successful Agricultural Extension Agencies Are Learning
Organization.” In Management of Agricultural Extension in Global Perspectives, edited by
R.K. Samanta and S.K. Arora, 47–77. Delhi: B.R. Publishing.
Bandura, Albert. 1971. “Social Learning Theory.” Edited by General Learning Press. New York
City.
Bansil, P.C. 2011. Bihar Agriculture. A Perspective. New Delhi: Concept Publishing Company.
Baser, Heather, Peter Morgan, Joe Bolger, Derick Brinkerhoff, Anthony Land, Suzanne
Taschereau, David Watson, and Julia Zinke. 2008. “Capacity, Change and Performance-
Study Report.” European Centre for Development Policy Management.
Beheraa, Bibhu Santosh, Babita Panda, Rudra Ashish Behera, Narayan Nayak, Anama Charan
Beherae, and S. Jena. 2015. “Information Communication Technology Promoting Retail
Marketing in Agriculture Sector in India as a Study.” Procedia Computer Science 48. Elsevier
Masson SAS: 652–59. https://doi.org/10.1016/j.procs.2015.04.148.
Bhattacherjee, Anol, and G Premkumar. 2004. “Understanding Changes in Belief and Attitude
toward Information Technology Usage: A Theoretical Model and Longitudinal Test.” MIs
Quarterly 28 (2): 229–54.
Bihler, Wolfgang. 2006. Weiterbildungserfolg in Betrieblichen Lehrveranstaltungen; Messung
Und Einflussfaktoren Im Bereich Finance and Controlling. Wiesbaden: Deutscher
Universitätsverlag.
Bingen, Jim, Alex Serrano, and Julie Howard. 2003. “Linking Farmers to Markets: Different
Approaches to Human Capital Development.” Food Policy 28 (4): 405–19.
Birner, Regina, Kristin Davis, John Pender, Ephraim Nkonya, Ponniah Anandajayasekeram, Javier
Ekboir, Adiel Mbabu, et al. 2009. “From Best Practice to Best Fit: A Framework for
Designing and Analyzing Pluralistic Agricultural Advisory Services Worldwide.” The
Journal of Agricultural Education and Extension 15 (4): 341–55.
https://doi.org/10.1080/13892240903309595.
Bolger, Joe. 2000. “Capacity Development.” CIDA, Policy Branch Vol. 1, No.
Brazell, Jeff D., Christopher G. Diener, Ekaterina Karniouchina, William L. Moore, Válerie

91
Séverin, and Pierre Francois Uldry. 2006. “The No-Choice Option and Dual Response Choice
Designs.” Marketing Letters 17 (4): 255–68. https://doi.org/10.1007/s11002-006-7943-8.
Budak, Dilek Bostan, Fuat Budak, and Özlem Özgür Kaçira. 2010. “Livestock Producers’ Needs
and Willingness to Pay for Extension Services in Adana Province of Turkey.” African Journal
of Agricultural Research 5 (11): 1187–90. https://doi.org/10.5897/AJAR09.567.
Burton, Rob J F. 2004. “Reconceptualising the ‘Behavioural Approach’ in Agricultural Studies: A
Socio-Psychological Perspective.” Journal of Rural Studies 20 (3): 359–71.
https://doi.org/10.1016/j.jrurstud.2003.12.001.
Cadilhon, Jean-Joseph. 2013. “A Conceptual Framework to Evaluate the Impact of Innovation
Platforms on Agrifood Value Chains Development.” In 138th EAAE Seminar on Pro-Poor
Innovations in Food Supply Chains, 14. Ghent: EAAE.
Cadilhon, Jean-Joseph, and Dirk Landmann. 2015. “Evaluation of Nicaragua Learning Alliance.”
Nairobi, Kenya: ILRI- International Livestock Research Institute. 2015.
http://data.ilri.org/portal/dataset/nicaragualearningalliance.
Cadilhon, Jean-Joseph, N.D. Pham, and B.L. Maass. 2016. “The Tanga Dairy Platform: Fostering
Innovations for More Efficient Dairy Chain Coordination in Tanzania.” International Journal
on Food System Dynamics 7 (2): 81–91. https://doi.org/10.18461/ijfsd.v7i2.723.
Census Organisation of India. 2015. “Population Census 2011.” 2015.
http://www.census2011.co.in/.
Chambers, Robert. 1994. “Participatory Rural Appraisal (PRA): Challenges, Potentials and
Paradigm.” World Development 22 (10): 1437–54. https://doi.org/10.1016/0305-
750X(94)90030-2.
Charatsari, Chrysanthi, Afroditi Papadaki-Klavdianou, and Anastasios Michailidis. 2011.
“Farmers as Consumers of Agricultural Education Services: Willingness to Pay and Spend
Time.” Journal of Agricultural Education and Extension 17 (3): 253–66.
https://doi.org/10.1080/1389224X.2011.559078.
Chatman, Ljubica, and Betsy Sparrow. 2011. “The Feeling of Doing across Levels of Analysis-
The Effects of Perceived Control on Learning.” Horizons of Psychology 20 (3): 73–91.
Chauhan, Nikulsinh M. 2010. “Farmers ’ Perception about ICT Application: A Case Study of

92
Gujarat State.” Indian Research Journal of Extension Education 10 (3): 21–26.
Cheon, Jongpil, Sangno Lee, Steven M. Crooks, and Jaeki Song. 2012. “An Investigation of Mobile
Learning Readiness in Higher Education Based on the Theory of Planned Behavior.”
Computers and Education 59 (3). Elsevier Ltd: 1054–64.
https://doi.org/10.1016/j.compedu.2012.04.015.
Chhachhar, Abdul Razaque, and Zulfiqar Ahmed Maher. 2014. “Use of Mobile Phone among
Farmers for Agriculture Information.” European Journal of Scientific Research 119 (2): 265–
71.
Chikaire, J.U, A.O. Ani, C.N. Atoma, and A.R. Tijjani. 2015. “Capacity Building: Key to
Agricultural Extension Survival.” Scholars Journal of Agriculture and Veterinary Sciences 2
(1A): 13–21.
Chin, Wynne W. 1998. “The Partial Least Squares Approach for Structural Equation Modeling.”
In Modern Methods for Business Research, 295–336.
https://doi.org/10.1016/j.aap.2008.12.010.
Chowdhury, Ataharul Huq, Helen Hambly Odame, and Cees Leeuwis. 2014. “Transforming Roles
of Public Extension to Strengthen Innovation: Lessons from Bangladesh.” The Journal of
Agriculture Education and Extension 20 (1): 7–25.
Claro, Danny Pimentel, Geoffrey Hagelaar, and Onno Omta. 2003. “The Determinants of
Relational Governance and Performance: How to Manage Business Relationships?”
Industrial Marketing Management 32 (8): 703–16.
https://doi.org/10.1016/j.indmarman.2003.06.010.
Coghlan, David, and Mary Brydon-Miller. 2014. The Sage Encyclopedia of Action Research. Los
Angeles: SAGE Reference.
Cohen, Jacob. 1992. “A Power Primer.” Psychological Bulletin 112 (1): 155–59.
https://doi.org/10.1037/0033-2909.112.1.155.
Cole, Shawn, and Asanga Nilesh Fernando. 2012. “The Value of Advice: Evidence from Mobile
Phone-Based Agricultural Extension.” Harvard Business School Working Paper, No. 13–047.
Cambridge.
CRS. 2009. Working Together, Learning Together- Learning Alliances in Agroenterprise

93
Development. Edited by Rupert Best, Shaun Ferris, and Paul Mundy. Baltimore, USA:
Catholic Relief Services.
Davis, Kristin. 2015. The New Extensionist: Core Competencies for Individuals. GFRAS Brie.
Lindau, Switzerland: Global Forum for Rural Advisory Services (GFRAS).
Davis, Wayne A. 1984. “A Causal Theory of Intending.” American Philosophical Quarterl 21 (1):
43–54.
Deichmann, Uwe, Aparajita Goyal, and Deepak Mishra. 2016. “Will Digital Technologies
Transform Agriculture in Developing Countries?” Agricultural Economics (United Kingdom)
47: 21–33. https://doi.org/10.1111/agec.12300.
Dror, Iddo, Jean-Joseph Cadilhon, Marc Schut, Michael Misiko, and S. Maheshwari, eds. 2016.
Innovation Platforms for Agricultural Development. Evaluating the Mature Innovation
Platforms Landscape. Oxon (United Kingdom) and New York (USA): Routledge.
Essers, Brigitte A B, Debby Van Helvoort-Postulart, Martin H. Prins, Martino Neumann, and
Carmen D. Dirksen. 2010. “Does the Inclusion of a Cost Attribute Result in Different
Preferences for the Surgical Treatment of Primary Basal Cell Carcinoma?: A Comparison of
Two Discrete-Choice Experiments.” PharmacoEconomics 28 (6): 507–20.
https://doi.org/10.2165/11532240-000000000-00000.
FAO. 2011. The State of Food and Agriculture 2010-2011- Women in Agriculture- Closing the
Gender Gap for Development. Vol. 2. Rome, Italy: Food and Agriculture Organization of the
United Nations (FAO).
———. 2014. “Nicaragua- Country Indicator.” Rome, Italy. 2014.
http://www.fao.org/faostat/en/#country/157.
Feder, Gershon, Regina Birner, and Jock R. Anderson. 2011. “The Private Sector’s Role in
Agricultural Extension Systems: Potential and Limitations.” Journal of Agribusiness in
Developing and Emerging Economies 1 (1): 31–54.
https://doi.org/10.1108/20440831111131505.
Ferroni, Marco, and Yuan Zhou. 2012. “Achievements and Challenges in Agricultural Extension
in India.” Global Journal of Emerging Market Economies 4 (3): 319–46.
https://doi.org/10.1177/0974910112460435.

94
Field, Andy. 2009. “Discovering Statistics Using SPSS.” Introducing Statistical Methods. Los
Angeles [i.e. Thousand Oaks, Calif.]; London: SAGE Publications.
Fifer, Simon, John Rose, and Stephen Greaves. 2014. “Hypothetical Bias in Stated Choice
Experiments: Is It a Problem? And If so, How Do We Deal with It?” Transportation Research
Part A 61. Elsevier Ltd: 164–77.
Fletschner, Diana. 2009. “Rural Women’s Access to Credit: Market Imperfections and
Intrahousehold Dynamics.” World Development 37 (3). Elsevier Ltd: 618–31.
Fornell, Claes, and David F. Larcker. 1981. “Evaluating Structural Equation Models with
Unobservable Variables and Measurement Error.” Journal of Marketing Research 18 (1): 39.
https://doi.org/10.2307/3151312.
Fu, Xiaolan, and Shaheen Akter. 2016. “The Impact of Mobile Phone Technology on Agricultural
Extension Services Delivery: Evidence from India.” The Journal of Development Studies 52
(11): 1561–76. https://doi.org/10.1080/00220388.2016.1146700.
Fukuda-Parr, Sakiko, Carlos Lopes, and Khalid Malik. 2002. “Institutional Innovations for
Capacity Development.” In Capacity for Development: New Solutions to Old Problems,
edited by Sakiko Fukuda-Parr, Carlos Lopes, and Khalid Malik, 1–21. London: Earthscan
Publications Ltd.
Furubotn, E. G., and R. Richter, eds. 2010. “Introduction.” In The New Institutional Economics of
Markets. Cheltenham, UK: Edward Elgar.
Ganesan, M, Kavitha Karthikeyan, Suma Prashant, and Jayalakshmi Umadikar. 2013. “Use of
Mobile Multimedia Agricultural Advisory Systems by Indian Farmers : Results of a Survey.”
Journal of Agricultural Extension and Rural Development 5 (4): 89–99.
https://doi.org/10.5897/JAERD13.0466.
Gardner, Susan K. 2009. “Conceptualizing Success in Doctoral Education: Perspectives of Faculty
in Seven Disciplines.” The Review of Higher Education 32 (3): 383–406.
https://doi.org/10.1353/rhe.0.0075.
Garforth, C, T Rehman, K Mckemey, R Tranter, R Cooke, C Yates, J Park, and P Dorward. 2004.
“Improving the Design of Knowledge Transfer Strategies By Understanding Farmer Attitudes
and Behaviour 1.” Journal of Farm Management 1212 (11): 17–32.

95
Ghosh, Dr. Mun Mun, and Dr. Arindam Ghosh. 2014. “Analysis of Women Participation in Indian
Agriculture.” IOSR Journal of Humanities and Social Science 19 (5): 01–06.
https://doi.org/10.9790/0837-19540106.
Ghosh, Souvik. 2012. “Innovations in Public Sector-Led Agricultural Extension.” Scientific
Research and Essays 7 (49): 4170–75. https://doi.org/10.5897/SRE12.228.
Gillespie, Stuart. 2004. “Scaling Up Community-Driven Development : A Synthesis of
Experience.” FCND Discussion Paper, no. 181.
Gleicher, F., D. S. Boninger, A. Strathman, D. Armor, J. Hetts, and M. Ahn. 1995. “With an Eye
toward the Future: The Impact of Counterfactual Thinking on Affect, Attitudes, and
Behaviour.” In What Might Have Been : The Social Psychology of Counterfactual Thinking,
edited by N., J. Roese, and M. M. Olson, 283–304. Lawrence Erlbaum Assoc Inc.
Glendenning, Claire J., Suresh Babu, and Kwadwo Asenso-Okyere. 2010. “Review of Agricultural
Extension in India: Are Farmers’ Information Needs Being Met?” IFPRI Discussion Papers
01048: 1–48.
Glendenning, Claire J, and Pier Palo Ficarelli. 2012. “The Relevance of Content in ICT Initiatives
in Indian Agriculture.” IFPRI Discussion Paper. Washington D.C.
Government of India. 2008. “Bihar’s Agriculture Development : Opportunities & Challenges - a
Report of the Special Task Force on Bihar,” 154.
Gray, B., J. Sebstad, M. Cohen, and K. Stack. 2009. “Can Financial Education Change Behavior ?”
Journal of Human Evolution 61 (4): 347–62.
Hair, Joseph F., G. Tomas M. Hult, Christian M. Ringle, and Marko Sarstedt. 2017. A Primer on
Partial Least Squares Structural Equation Modeling (PLS-SEM). Los Angeles: SAGE
Publications, Inc.
Hall, Andy. 2005. “Capacity Development for Agricultural Biotechnology in Developing
Countries: An Innovation Systems View of What It Is and How to Develop It.” Journal of
International Development 17 (5): 611–30. https://doi.org/10.1002/jid.1227.
———. 2007. “Challenges to Strengthening Agricultural Innovation Systems: Where Do We Go
From Here?” United Nations University- UNU-MERIT.
Hayes, Andrew F. 2015. “An Index and Test of Linear Moderated Mediation.” Multivariate

96
Behavioral Research 50 (1): 1–22. https://doi.org/10.1080/00273171.2014.962683.
Hayes, Andrew F., and Kristopher J. Preacher. 2014. “Statistical Mediation Analysis with a
Multicategorical Independent Variable.” British Journal of Mathematical and Statistical
Psychology 67 (3): 451–70. https://doi.org/10.1111/bmsp.12028.
Hayes, Andrew F. 2012. “PROCESS: A Versatile Computational Tool for Observed Variable
Mediation, Moderation, and Conditional Process Modeling.”
Hellin, Jon. 2012. “Agricultural Extension, Collective Action and Innovation Systems: Lessons on
Network Brokering from Peru and Mexico.” Journal of Agricultural Education and Extension
18 (2): 141–59.
Henseler, Jörg, Theo K Dijkstra, Marko Sarstedt, Christian M Ringle, Adamantios
Diamantopoulos, Detmar W Straub, Ketchen Jr. David J, Joseph F Hair, G Tomas M Hult,
and Roger J Calantone. 2014. “Common Beliefs and Reality About PLS: Comments on
Rönkkö and Evermann (2013).” Organizational Research Methods 17 (2): 182–209.
https://doi.org/10.1177/1094428114526928.
Henseler, Jörg, Geoffrey Hubona, and Pauline Ash Ray. 2016. “Using PLS Path Modeling in New
Technology Research: Updated Guidelines.” Industrial Management & Data Systems 116 (1):
2–20. https://doi.org/10.1108/IMDS-09-2015-0382.
Höckert, Jenny, and Magnus Ljung. 2013. “Advisory Encounters Towards a Sustainable Farm
Development—Interaction between Systems and Shared Lifeworlds.” The Journal of
Agriculture Education and Extension 19 (3): 291–309.
Holloway, Garth John, and Simeon K Ehui. 2001. “Demand, Supply and Willingness-To-Pay for
Extension Services in an Emerging-Market Setting.” American Journal of Agricultural
Economics 83 (3): 764–68. https://doi.org/10.1111/0002-9092.00205.
Homann-Kee Tui, Sabine, Adewale Adekunle, Mark Lundy, Josephine Tucker, Eliud Birachi,
Marc Schut, Laurens Klerkx, et al. 2013. “What Are Innovation Platforms?” Innovation
Platforms Practice Brief. Nairobi, Kenya: ILRI- International Livestock Research Institute.
Horton, Douglas, Anastasia Alexaki, Samuel Bennett-Lartey, Kim Noële Brice, Dindo Campilan,
Fred Carden, José de Souza Silva, et al. 2003. Evaluating Capacity Development. Hague;
Ottawa, ON; Wageningen, the Netherlands: International Service for National Agricultural

97
Research.
Ingram, Julie. 2008. “Agronomist-Farmer Knowledge Encounters: An Analysis of Knowledge
Exchange in the Context of Best Management Practices in England.” Agriculture and Human
Values 25 (3): 405–18. https://doi.org/10.1007/s10460-008-9134-0.
Jain, Lokesh, Harish Kumar, and R. K. Singla. 2015. “Assessing Mobile Technology Usage for
Knowledge Dissemination among Farmers in Punjab.” Information Technology for
Development 21 (4): 668–76.
Jones, Gwyn E., and Chris Garforth. 1997. “The History, Development, and Future of Agricultural
Extension.” In Improving Agricultural Extension. A Reference Manual, edited by Burton E.
Swanson, Robert P. Bentz, and Andrew J. Sofranko. Rome, Italy: Food and Agriculture
Organization of the United Nations.
Kago, Kennedy Macharia, Jean-Joseph Cadilhon, Mary Maina, and Amos Omore. 2015. “Influence
of Innovation Platforms on Information Sharing and Nurturing of Smaller Innovation
Platforms: A Case Study of the Tanzania Dairy Development Forum.” In 29th International
Conference of Agricultural Economists. Milan, Italy: IAAE.
Kahan, David. 2013. Market-Oiented Farming: An Overview. Rome, Italy: Food and Agriculture
Organization of the United Nations (FAO).
Karlsson, Madeleine, Gaia Penteriani, Helen Croxson, Alexandra Stanek, Robin Miller, Darshana
Pema, and Fadzai Chitiyo. 2017. “Accelerating Affordable Smartphone Ownership in
Emerging Markets.” GSMA, no. July: 1–59.
Kim, Ki Joon, and Dong-Hee Shin. 2015. “An Acceptance Model for Smart Watches: Implications
for the Adoption of Future Wearable Technology.” Internet Research 25 (4): 527–41.
https://doi.org/10.1108/IntR-05-2014-0126.
Kirkpatrick, Donald L., and James D. Kirkpatrick. 2012. Implementing the Four Levels: A
Practical Guide for Effective Evaluation of Training Programs. San Francisco: Berrett‐
Koehler Publishers.
Klerkx, Laurens, Noelle Aarts, and Cees Leeuwis. 2010. “Adaptive Management in Agricultural
Innovation Systems: The Interactions between Innovation Networks and Their Environment.”
Agricultural Systems M4 - Citavi.

98
Klerkx, Laurens, Barbara van Mierlo, and Cees Leeuwis. 2012. “Evolution of Systems Approaches
to Agricultural Innovation: Concepts, Analysis and Interventions.” In Farming Systems
Research into the 21st Century: The New Dynamic, edited by I. Darnhofer, D. Gibbon, B.
Dedieu, and Dordrecht, 457–83. Berlin: Springer.
Kline, Paul. 1993. The Handbook of Psychological Testing (2nd Ed.). The Handbook of
Psychological Testing (2nd Ed.). https://doi.org/10.1016/S0191-8869(96)90047-1.
Knowler, Duncan, and Ben Bradshaw. 2007. “Farmers’ Adoption of Conservation Agriculture: A
Review and Synthesis of Recent Research.” Food Policy 32 (1): 25–48.
https://doi.org/10.1016/j.foodpol.2006.01.003.
Ko, Wen-Hwa, and Feng-Ming Chung. 2014. “Teaching Quality, Learning Satisfaction, and
Academic Performance among Hospitality Students in Taiwan.” World Journal of Education
4 (5). https://doi.org/10.5430/wje.v4n5p11.
Koshkaki, Emadeddin Rahmanian, and Sepideh Solhi. 2016. “The Facilitating Role of Negative
Emotion in Decision Making Process: A Hierarchy of Effects Model Approach.” The Journal
of High Technology Management Research 27 (2): 119–28.
https://doi.org/10.1016/j.hitech.2016.10.010.
Kotvojs, Fiona, and Rosalind Hurworth. 2013. “Evaluating Capacity Development: What Do We
Really Want to Know ?” Evaluation Journal of Australasia 13 (1): 4–14.
https://doi.org/10.1177/1035719X1301300102.
Krone, Madlen, Peter Dannenberg, and Gilbert Nduru. 2016. “The Use of Modern Information and
Communication Technologies in Smallholder Agriculture: Examples from Kenya and
Tanzania.” Information Development 32 (5): 1503–12.
https://doi.org/10.1177/0266666915611195.
Kumar, Nirmalya. 1996. “The Power of Trust in Manufacturer-Retailer Relationship.” Harvard
Business Review.
Kwak, Kyuseop, Paul Wang, and Jordan J. Louviere. 2016. “A Novel Approach to Detect Attribute
by Covariate Interactions in Discrete Choice Models.” Journal of Choice Modelling 21.
Elsevier: 42–47.
Laeequddin, Mohammed, B S Sahay, Vinita Sahay, and K Abdul Waheed. 2010. “Measuring Trust

99
in Supply Chain Partners Relationships.” Measuring Business Excellence 14 (3): 53–69.
Lafortezza, Daniela, and Etimos S C Consorzio. 2009. “Inventario de Las Cooperativas
Productivas.” Tegucigalpa, Bandera de HondurasHonduras: BCIE- Banco Centroamericano
de Integración Económica.
Lancaster, Kelvin J. 1966. “A New Approach to Consumer Theory.” Journal of Political Economy
74 (2): 132–57.
Landmann, Dirk. 2015. “The Influence of Trust in the Nicaraguan Learning Alliance on Capacity
Development of Members and Other Influenced Groups.” Göttingen. 2015.
Landmann, Dirk, and Jean-Joseph Cadilhon. 2016. “With Trust and a Little Help from Our Friends:
How the Nicaragua Learning Alliance Scaled up Training in Agribusiness.” In Innovation
Platforms for Agricultural Development.Evaluating the Mature Innovation Platforms
Landscape, edited by Iddo Dror, Jean-Joseph Cadilhon, Marc Schut, Michael Misiko, and
Shreya Maheshwari, 16–41. New York: Routledge.
Leeuwis, Cees, and Anne van den Ban. 2004. Communication for Rural Innovation. 3rd ed.
Blackwell Science Ltd, Oxford. https://doi.org/10.1002/9780470995235.
Leone, Luigi, Marco Perugini, and Anna Paola Ercolani. 1999. “A Comparison of Three Models
of Attitude-Behavior Relationships in the Studying Behavior Domain.” European Journal of
Social Psychology. https://doi.org/10.1002/(SICI)1099-0992(199903/05)29:2/3<161::AID-
EJSP919>3.0.CO;2-G.
Liu, Yong, Hongxiu Li, and Christer Carlsson. 2010. “Factors Driving the Adoption of M-
Learning: An Empirical Study.” Computers and Education 55 (3). Elsevier Ltd: 1211–19.
https://doi.org/10.1016/j.compedu.2010.05.018.
Ludemann, Ruud, Marianne van Dorp, Tim Chancellor, and Annemarie Groot-Kormelinck. 2012.
Capacity Development in Agricultural Research for Development. Wageningen/Greenwich.
Lundy, Mark, and María Verónica Gottret. 2005. “Learning Alliances: An Approach for Building
Multi-Stakeholder Innovation Systems.” Cali, Colombia: CIAT- International Center for
Tropical Agriculture.
Lusthaus, C, M Adrien, and M Perstinger. 1999. “Capacity Development: Definitions, Issues and
Implications for Planning, Monitoring and Evaluation.” Universalia Occasional Paper 35

100
(35): 1–21. http://preval.org/documentos/2034.pdf.
Mangham, Lindsay J., Kara Hanson, and Barbara McPake. 2009. “How to Do (or Not to
Do)...Designing a Discrete Choice Experiment for Application in a Low-Income Country.”
Health Policy and Planning 24 (2): 151–58. https://doi.org/10.1093/heapol/czn047.
Mariami, Zewdie Adane, Jean-Joseph Cadilhon, and Christine Werthmann. 2015. “Impact of
Innovation Platforms on Marketing Relationships: The Case of Volta Basin Integrated Crop-
Livestock Value Chains in Ghana.” African Journal of Agricultural and Resource Economics.
Martínez-García, Carlos Galdino, Peter Dorward, and Tahir Rehman. 2013. “Factors Influencing
Adoption of Improved Grassland Management by Small-Scale Dairy Farmers in Central
Mexico and the Implications for Future Research on Smallholder Adoption in Developing
Countries.” Livestock Science 152 (2–3): 228–38.
https://doi.org/10.1016/j.livsci.2012.10.007.
McFadden, Daniel. 1973. “Conditional Logit Analysis of Qualitative Choice Behavior.” In
Frontiers in Econometrics (Economic Theory and Mathematical Economics), edited by P.
Zarembka, 252. New York, USA: Academic Press.
Mittal, Surabhi, Sanjay Gandhi, and Gaurav Tripathi. 2010. “Socio-Economic Impact of Mobile
Phones on Indian Agriculture.” 246. New Delhi: Indian Council for Research on International
Economic Relations.
Mittal, Surabhi, and Gaurav Tripathi. 2009. “Role of Mobile Phone Technology in Improving
Small Farm Productivity.” Agricultural Economics Research Review 22: 451–59.
Mizrahi, Yemile. 2004. “Capacity Enhancement Indicators.” World Bank Institute Working
Papers. Vol. 37232. Washington D.C.
Mundy, Paul, Benjamin Kwasi Addom, and Krishan Bheenick. 2017. “Beyond the Hype: Mobile
Phones and the Web to Improve Agricultural Value Chains.” CTA Technical Briefs 06.
Muyanga, Milu, and T.S Jayne. 2008. “Private Agricultural Extension System in Kenya: Practice
and Policy Lessons.” The Journal of Agriculture Education and Extension 14 (2): 111–24.
Mwaura, Francis, Fred Roland Muwanika, and Geofrey Okoboi. 2010. “Willingness to Pay for
Extension Services in Uganda among Farmers Involved in Crop and Animal Husbandry.” In
Joint 3rd AAAE and 48th AEASA Conference. Cape Town, South Africa: African Association

101
of Agricultural Economists (AAAE).
Nederlof, Suzanne, Mariana Wongtschowski, and Femke van der Lee, eds. 2011. Putting Heads
Together- Agricultural Innovation Platforms in Practice. Amsterdam, Netherlands: Bulletin
396, KIT Publishers.
Neely, Constance L. 2010. “Capacity Development for Environmental Management in the
Agricultural Sector in Developing Countries.” OECD Environment Working Papers. Vol. 26.
https://doi.org/10.1787/5km4kntgq7xx-en Y3.
Norton, George W., Jeffery Alwang, and William A. Masters. 2006. Economics of Agricultural
Development; World Food Systems and Resource Use. 2nd ed. London; New York:
Routledge.
OECD. 2006. “The Challenge of Capacity Development- Working Towards Good Practice.”
Future Virology.
Oladele, O I. 2008. “Factors Determining Farmers ’ Willingness To Pay for Extension Services in
Oyo State , Nigeria.” Agricultura Tropica et Subtropica 41 (4): 165–70.
Olenik, Christina, and Caroline Fawcett. 2013. “State of the Field Report: Examining the Evidence
in Youth Workforce Development.” USAID- United States Agency for International
Development.
Patton, Michael Quinn. 2002. Qualitative Research and Evaluation Methods. Vol. 3rd. London,
UK: SAGE Publications Ltd. https://doi.org/10.2307/330063.
Pedersen, Line Bjørnskov, Trine Kjær, Jakob Kragstrup, and Dorte Gyrd-Hansen. 2011. “Does the
Inclusion of a Cost Attribute in Forced and Unforced Choices Matter? Results from a Web
Survey Applying the Discrete Choice Experiment.” Journal of Choice Modelling 4 (3): 88–
109. https://doi.org/10.1016/S1755-5345(13)70044-7.
Perugini, Marco, and Richard P. Bagozzi. 2001. “The Role of Desires and Anticipated Emotions
in Goal-Directed Behaviours: Broadening and Deepening the Theory of Planned Behaviour.”
British Journal of Social Psychology 40 (1): 79–98.
https://doi.org/10.1348/014466601164704.
Peterson, Warren. 1997. “The Context of Extension in Agricultural and Rural Development.” In
Improving Agricultural Extension. A Reference Manual, edited by Burton E. Swanson, Robert

102
P. Bentz, and Andrew J. Sofranko. Rome, Italy: FAO.
Pham, Ngoc Die, Jean-Joseph Cadilhon, and Brigitte L. Maass. 2015. “Field Testing a Conceptual
Framework for Innovation Platform Impact Assessment : The Case of MilkIT Dairy Platforms
in Tanga Region , Tanzania.” East African Agricultural and Forestry Journal 81 (1). Taylor
& Francis: 58–63. https://doi.org/10.1080/00128325.2015.1041257.
Phillips, Daniel, Hugh Waddington, and Howard White. 2014. “Better Targeting of Farmers as a
Channel for Poverty Reduction: A Systematic Review of Farmer Field Schools Targeting.”
Development Studies Research 1 (1): 113–36.
https://doi.org/10.1080/21665095.2014.924841.
Ponniah, Anandajayasekeram, Ranjitha Puskur, Sindu Workneh, and Dirk Hoekstra. 2008.
Concepts and Practices in Agricultural Extension in Developing Countries: A Source Book.
International Livestock Research Institute, Addis Ababa, Ethiopia, ISBN.
https://doi.org/10.1017/CBO9781107415324.004.
PRAN. 2015. Annual Report 2014-1015. Third. Gaya, India: PRAN.
———. 2016. “Interview with Members of the Board of Trustees of PRAN.”
Prasad, R M, Rasheed Sulaiman, and Nimisha Mittal. 2015. “Assessing Capacity Development
Needs of Extension and Advisory Services (EAS): A Review.”
Preacher, Kristopher J., and Andrew F. Hayes. 2004. “SPSS and SAS Procedures for Estimating
Indirect Effects in Simple Mediaton Models.” Behavior Research Methods, Instruments, &
Computers 36 (4): 717–31. https://doi.org/10.3758/BF03206553.
Pretty, Jules N. 1995. “Participatory Learning for Sustainable Agriculture.” World Development
23 (8): 1247–63. https://doi.org/10.1016/0305-750X(95)00046-F.
Rao, N. H. 2007. “A Framework for Implementing Information and Communication Technologies
in Agricultural Development in India.” Technological Forecasting and Social Change 74:
491–518. https://doi.org/10.1016/j.techfore.2006.02.002.
Rivera, William M. 2011. “Public Sector Agricultural Extension System Reform and the
Challenges Ahead.” Journal of Agricultural Education and Extension 17 (2): 165–80.
Rivera, William M., and Gary E. Alex. 2008. “Human Resource Development for Modernizing the
Agricultural Workforce.” Human Resource Development Review 7 (4): 374–86.

103
https://doi.org/10.1177/1534484308324633.
Robinson-Pant, Anna. 2016. Learning Knowledge and Skills- for Agriculture to Improve Rural
Livelihoods. Nurse Educator. Vol. 13. Rome, Italy: UNESCO.
https://doi.org/10.1097/00006223-198811000-00008.
Rodgers, Gerry, Amrita Datta, Janine Rodgers, Sunil K. Mishra, and Alakh N. Sharma. 2013. The
Challenge of Inclusive Development in Rural Bihar. New Delhi, India: Institute for Human
Development and MANAK Publications PVT. LTD.
Rogers, Everett M. 1995. “Diffusion of Innovations.” New York 12.
Rönkkö, Mikko, and Joerg Evermann. 2013. “A Critical Examination of Common Beliefs About
Partial Least Squares Path Modeling.” Organizational Research Methods 16 (3): 425–48.
https://doi.org/10.1177/1094428112474693.
Rosa, Cecilia de, Andrew Nadeau, Emilio Hernandez, Fred Kafeero, and Jacques Zahiga. 2016.
“Delivery Strategies to Enhance the Sustainability of Training: Lessons from the Food and
Agriculture Organization of the United Nations.” International Journal of Training and
Development 20 (2): 164–76. https://doi.org/10.1111/ijtd.12074.
Sándor, Zsolt, and Michel Wedel. 2005. “Heterogeneous Conjoint Choice Designs.” Journal of
Marketing Research 42 (2): 210–18.
Sanzo, M. José, M. Leticia Santos, Rodolfo Vázquez, and Luis I. Alvarez. 2003. “The Role of
Market Orientation In Business Dyadic Relationships: Testing an Integrator Model.” Journal
of Marketing Management 19 (1): 73–107. https://doi.org/10.1362/026725703763771971.
Sarstedt, Marko, Jörg Henseler, and Christian M. Ringle. 2011. “Multigroup Analysis in Partial
Least Squares (PLS) Path Modeling: Alternative Methods and Empirical Results.” Advances
in International Marketing 22 (June 2014): 195–218. https://doi.org/10.1108/S1474-
7979(2011)0000022012.
SawtoothSoftware. 2017. “SawtoothSoftware.” 2017. http://www.sawtoothsoftware.com/.
Scarpa, Riccardo, Mara Thiene, and Kenneth E. Train. 2008. “Utility in Willingness to Pay Space:
A Tool to Address Confounding Random Scale Effects in Destination Choice to the Alps.”
American Journal of Agricultural Economics 90 (4): 994–1010.
https://doi.org/10.1111/j.1467-8276.2008.01155.x.

104
Sekabira, Haruna, and Matin Qaim. 2017. “Mobile Money, Agricultural Marketing, and off-Farm
Income in Uganda.” Agricultural Economics 48: 597–611.
https://doi.org/10.1111/agec.12360.
Sharma, Alakh N., and Gerry Rodgers. 2015. “Structural Change in Bihar ’ s Rural Economy
Findings from a Longitudinal Study.” Economic and Political Weekly l (52): 1998–2000.
Sheeran, Paschal. 2002. “Intention—Behavior Relations: A Conceptual and Empirical Review.”
European Review of Social Psychology 12: 1–36.
https://doi.org/10.1080/14792772143000003.
Sonnier, Garrett, Andrew Ainslie, and Thomas Otter. 2007. “Heterogeneity Distributions of
Willingness-to-Pay in Choice Models.” Quantitative Marketing and Economics 5 (3): 313–
31. https://doi.org/10.1007/s11129-007-9024-6.
Statista. 2018. “Share of Mobile Phone Users That Use a Smartphone in India from 2014 to 2019.”
2018. https://www.statista.com/statistics/257048/smartphone-user-penetration-in-india/.
Subedi, Shanker, Jean-Joseph Cadilhon, Thanammal Ravichandranc, and Nils Teufel. 2014.
“Impact Evaluation of Innovation Platforms to Increase Dairy Production: A Case from
Uttarakhand, Northern India.” 8th International Conference of Asian Society of Agricultural
Economists (ASAE) on Viability of Small Farmers in Asia 2014; Saver, Banladesh. Nairobi,
Kenya: ILRI- International Livestock Research Institute.
Swailes, Stephen, and Simon Roodhouse. 2004. “Vocational Qualifications and Higher Education:
Some Policy Issues.” Policy Futures in Education 2 (1): 31–52.
Teno, Gabriel, and Jean-Joseph Cadilhon. 2016. “Innovation Platforms as a Tool for Improving
Agricultural Production: The Case of Yatenga Province, Northern Burkina Faso.” Field
Actions Science Reports 9 (September). http://factsreports.revues.org/4239.
Terblanche, S.E. 2017. “Professionalism in Rural Advisory Services.” Global Forum for Rural
Advisory Services (GFRAS).
Thiene, Mara, and Riccardo Scarpa. 2009. “Deriving and Testing Efficient Estimates of WTP
Distributions in Destination Choice Models.” Environmental and Resource Economics 44 (3):
379–95. https://doi.org/10.1007/s10640-009-9291-7.
Topală, Ioana. 2014. “Attitudes towards Academic Learning and Learning Satisfaction in Adult

105
Students.” Procedia - Social and Behavioral Sciences 142: 227–34.
https://doi.org/10.1016/j.sbspro.2014.07.583.
TRAI. 2017. Overview of Telecom & Broadcasting Sectors- Annual Report 2016- 2017. Telecom
Regulatory Authority of India.
Train, Kenneth E. 2003. Discrete Choice Methods with Simulation. Cambridge: Cambridge
University Press. https://doi.org/10.1017/CBO9780511753930.
Train, Kenneth E., and Melvyn Weeks. 2005. “Discrete Choice Models in Preference Space and
Willing-to-Pay Space.” In Applications of Simulation Methods in Environmental and
Resource Economics, edited by Riccardo Scarpa and Anna Eds. Alberini, 1–16. Dordrecht.
https://doi.org/10.1007/1-4020-3684-1.
Trienekens, Jacques H. 2011. “Agricultural Value Chains in Developing Countries A Framework
for Analysis.” International Food and Agribusiness Management Review 14 (2): 51–82.
Ubels, Jan, Naa-Aku Acquaye-Baddoo, and Alan Fowler, eds. 2010. Capacity Development in
Practice. London; Washington, DC: Earthscan.
UN. 2015. “The Millennium Development Goals Report 2015.” United Nations.
UNDP. 2008. Capacity Assessment Methodology: User’s Guide. Edited by Jennifer Colville. New
York, USA: UNDP- United Nations Development Programme.
———. 2010. “Monitoring Guidelines of Capacity Development in GEF Operations.” United
Nations Development Programme, 26.
Vallejo, Bertha, and Uta Wehn. 2016. “Capacity Development Evaluation: The Challenge of the
Results Agenda and Measuring Return on Investment in the Global South.” World
Development 79. Elsevier Ltd: 1–13. https://doi.org/10.1016/j.worlddev.2015.10.044.
Venkatesh, Viswanath, and H. Bala. 2008. “Technology Acceptance Model 3 and a Research
Agenda on Interventions.” Decision Sciences 39 (2): 273–315. https://doi.org/10.1111/j.1540-
5915.2008.00192.x.
Venkatesh, Viswanath, and Fred D. Davis. 2000. “A Theoretical Extension of the Technology
Acceptance Model: Four Longitudinal Studies.” Management Science 46 (2): 186–205.
https://doi.org/10.1287/mnsc.46.2.186.11926.

106
Venkatesh, Viswanath, and Tracy Ann Sykes. 2013. “Digital Divide Initiative Success in
Developing Countries: A Longitudinal Field Study in a Village in India.” Information Systems
Research 24 (2): 239–60. https://doi.org/10.1287/isre.1110.0409.
Verma, Pranay, and Neena Sinha. 2016. “Technology Acceptance Model Revisited for Mobile-
Based Agricultural Extension Services in India.” Management Research and Practice 8 (4):
29–38.
Waddington, Hugh, Birte Snilstveit, Jorge Hombrados, Martina Vojtkova, Daniel Phillips, Philip
Davies, and Howard White. 2014. “Farmer Field Schools for Improving Farming Practices
and Farmer Outcomes : A Systematic Review.” Campbell Systematic Reviews 6: 335.
https://doi.org/10.4073/csr.2014.6.
Watson, David. 2010. “Improving on Results.” In Capacity Development in Practice, edited by Jan
Ubels, Naa-Aku Acquaye-Baddoo, and Alan Fowler, 239–249 T4–Combining the ‘Best of
Two Worlds’ i. London; Washington, DC: Earthscan.
World Bank. 2002. Voices of the Poor From Many Lands. Edited by Deepa Narayan and Patti
Petesch. Oxford University Press and The World Bank. Washington D.C.
https://doi.org/10.1596/0-8213-5049-8.
———. 2005. “Bihar: Towards a Development Strategy.” 2005.
hhttp://documents.worldbank.org/curated/en/624671468035374716/Bihar-Towards-a-
development-strategy.
———. 2007. World Development Report 2008- Agriculture for Development. Agriculture.
Washington D.C.: World Bank. https://doi.org/10.1596/978-0-8213-7233-3.
———. 2010. Gender and Governance in Rural Services: Insights from India, Ghana and
Ethiopia. Washington. Edited by World Bank. Washington D.C., USA.
https://doi.org/10.1596/978-0-8213-7658-4.
———. 2012. Agricultural Innovation Systems. Washington D.C.: World Bank.
https://doi.org/10.1596/978-0-8213-8684-2.
———. 2013. Implementing Agriculture for Development- Agriculture Action Plan. Washington
D.C.: World Bank.
———. 2016a. “Bihar- Indicators at a Glance.” 2016.

107
http://documents.worldbank.org/curated/en/908411467992055870/Bihar-Indicators-at-a-
glance.
———. 2016b. World Development Report 2016: Digital Dividends. Edited by Bruce Ross-
Larson. World Development REport. Vol. 65. Washington D.C.: World Bank.
https://doi.org/10.1596/978-1-4648-0671-1.
———. 2017. “Nicaragua: Paving the Way to Faster Growth and Inclusion. Systematic Country
Diagnostic.”
Žabkar, Vesna, Maja Makovec Brenčič, and Tanja Dmitrović. 2010. “Modelling Perceived Quality,
Visitor Satisfaction and Behavioural Intentions at the Destination Level.” Tourism
Management 31 (4): 537–46. https://doi.org/10.1016/j.tourman.2009.06.005.
Zeweld, Woldegebrial, Guido Van Huylenbroeck, Girmay Tesfay, and Stijn Speelman. 2017.
“Smallholder Farmers’ Behavioural Intentions towards Sustainable Agricultural Practices.”
Journal of Environmental Management 187. Elsevier Ltd: 71–81.
https://doi.org/10.1016/j.jenvman.2016.11.014.
Zhang, Ping, and Na Li. 2005. “The Importance of Affective Quality.” Commun. ACM
Communications of the ACM 48 (9): 105–8.

108
General appendix
Appendix 1: Farmers Questionnaire – Summer 2016 .................................................................. 109
Appendix 2: Farmers Questionnaire – December 2016 ............................................................... 130
Appendix 3: Curriculum Vitae of Dirk Landmann ................. Fehler! Textmarke nicht definiert.

109
E-ID Year Month Day Number
16
Appendix 1: Farmers Questionnaire – Summer 2016
Objective of survey
I am a research associate from University of Göttingen. We are doing a study to understand extension
service preferences of small-scale farmers and the factors influencing these preferences. You have
been randomly selected among many other farmers to participate in our study. Your participation is
voluntary, and your responses will be most appreciated.
Informed consent
Your responses will be treated COMPLETELY CONFIDENTIAL. Therefore, your responses will
not be associated to your name in any of our work or in our further interviews. They will be added to
those of 500 other respondents and analysed together. Do you have any questions or comments about
this survey? If no, thank you and let us proceed.
Dirk Landmann; Tel: 9.102.276.949; Email: [email protected]
ENUMERATOR: Find the household member that is doing most of the work (regarding to working
hours) on this farm. If you find the person doing most of the work or at least doing second most of the
work, please start the interview. Otherwise, DO NOT interview the person on the farm. Please go to
next household doing farming.
Before starting the interview, please make sure the respondent knows that answers are confidential,
that she/ he understands the aim of the survey and that his/her help is much appreciated.

110
Place of Interview
Date:
Start time: S1. District: 1 2 3 4 5 6 7 8 9 10
S2. Block: 1 2 3 4 5 6 7 8 9 10
S3. Panchayat: 1 2 3 4 5 6 7 8 9 10
S4. Village:
S5. Enumerator-ID: 1 2 3 4 5 6 7 8
S6. GPS Coordinates:
S6a. Latitude
S6b. Longitude
S6c. Altitude
Please choose one of the five options and then follow the instructions with which sections you
should continue, after answering the general questions.
ENUMERATOR: This question is very important for the next block about agriculture. Please make
sure that the farmer gives the correct answer.
S7. Which farm activities does your household currently carry out?
1= Only
Crops
2= More crops than
Livestock
3= Both equally
divided
4= More livestock
than crops
5= Only
livestock
C-TYPE C-LS-TYPE: LS-TYPE:

111
Household
Introduction: The following question aims to find out how the household is structured and who of your household is active in agriculture.
Please provide us first with the total number of household members.
Household members: Have to be older than one year. That are the people who live together for more than one year, usually pool their income and eat at least
one meal together every day when they are at home. This does not include people who have permanently migrated or are considered visitors.
Afterwards please provide us with more detailed information about each household member.
S8. Who is living in your household?
A) Number of
Householder
member
B) Position inside the
household (related to
the household head) *1
C)
Age
D) Gender
(1= Male; 2=
Female)
E) Main working occupation (1= Agriculture of Household; 2=
Wage labour; 3= Migrated wage labour; 4= Working in the
household; 5= Farmworker outside the household; 6= Not
Applicable; 7= Other)
F) Who are you?
(Please mark the
person you are)
… … … … … …
*1 1= Household Head; 2= Husband/ wife/ spouse; 3= Son/ daughter; 4= Brother/sister; 5= Father/ mother; 6= Father/ mother-in-law; 7= Daughter/son -in-
law; 8= Brother/Sister-in-law; 9= grandson/ daughter; 10= Niece/Nephew; 11= Permanent servant; 12= Farm worker; 13= Other relative
ENUMERATOR: Check Question S7: to see which Question applies to the current respondent. If the question does not apply use” 0= not applicable”
S9a. For those who are working in agriculture, please provide us with the following information about crop production.
Those working in
agriculture (Age)
Working hours per week and
person in crop production.
Who is the main decision maker of
agricultural crop production?
Who is the main decision maker about buying agricultural
inputs and selling agricultural produce for crop production?
… … … …
S9b. For those who are working in agriculture, please provide us with the following information about livestock production.
Those working in
agriculture (Put their Age
here)
Working hours per week and
person in livestock production.
Who is the main decision maker of
agricultural livestock production?
Who is the main decision maker about buying
agricultural inputs and selling agricultural produce for
livestock production?
… … … …

112
ENUMERATOR: Please continue the interview with the person doing most of the agricultural
work or at least with the second place.
The following section comprises questions about you and the household you live in. Please
provide us with the following information or choose an option.
A: Respondent
A1. Name A2. Mobile-Phone-Number
A3. Religion: 1= Hindu 2= Muslim 3= Christian 4= No religion 5= Other: ______
If you belong to Hindi, please choose one category and a caste you belong to. If you belong to
another religion, please continue with Question A4.
A3a. What is your category (a) and caste (b)?
Caste
Cat
egory
1 = Gen. category a) Brahmin b) Bhumihar c) Rajput d) Kayasth
a
e) Other
2 = Other backward
class
a) Yadav b) Koiri c) Kurmee d) Lohar e) Baniya
f) Kahar g) Badhai h) Garediya i) Naai j) Other
3 = Scheduled caste a) Paswan b) Bhuiya c) Pasi d) Dhuniya
e) Chamar f) Musahar g) Dhobi h) Other:
4= Others:
5= None
A4. Marital Status: 1= Married 2= single 3= divorced 4= widowed
A5. What is your highest
Education completed?
(Choose one option)
1= No
degree
2= Primary
School
3= Secondary
School
4=
Graduate
5= Post-
Graduate
6= Other
Specify:
A6. Literacy status (Please answer with yes and no)?
A6a. Can you read? 1= Yes 2= No
A6b. Can you write? 1= Yes 2= No
A6c. Can you calculate? 1= Yes 2= No
A7. Does your household have access to
(More than one option possible)?
A)
Electricity
B)
Internet
C)
Radio
D)
Newspaper
E)
Television
A8. Do you own a smartphone? 1= Yes 2= No
A8a. If no, do you have access to use a smartphone? 1= Yes 2= No
Now I would like us to discuss matters related to the farming activities such as crop and livestock
production. Thus, the next section deals with you as a farmer. Please answer the questions with
regard to your business and farming activities.

113
B: Farm
How much land do you own? Please specify a.) how much land you own in total, b) how much
of this total land is used for own purposes, c) how much of the total land you rent out and d)
how much is fallow land. Please also specify the unit you are using in order to answer the three
questions.
B1.
Own
Land:
a)
TOTAL
b) Used for
own purposes
c) Rented
out:
d) Fallow land
(unused)
e) Unit (1= Bigha, 2= Katha,
3= Decimal, 4= Acres, 5=
Hectare)
How much land do you cultivate? Please specify a.) how much land you cultivate in total, b)
how much of this total land is your own, c) how much of the total land you rented. Please also
specify the unit you are using in order to answer the three questions (Use the one you mentioned
above).
B2.
Cultivated
Land:
a) TOTAL b) Own land c) Rented in d) Unit (1= Bigha, 2= Kattha,3=
Decimal, 4= Acres, 5= Hectare)
B3. How many plots* do you cultivate?
Plots: a piece of land that is not spatially segmented and where one crop have more or less the same
age and managed in the same way
B4. For how many years have you been farming (as an independent household)?

114
B5. What produce is the outcome of your crop production? What crops did you produce in the last year (From 01.03.2015 until 29.02.2016)?
Please fill out the list. Please only fill in the information for the crops you are cultivating and answer all questions until M).
A) B) C) D) E) F) G) H) I) J) K) L) M)
Crop
Season:
W=
Winter; S=
Spring; R=
Rainy*1
Area Yield (Quantity) Expenditure
in INR in the
last three
seasons (one
Year)
Revenues
in INR in
the last
three
seasons
(one Year)
Profits in
INR in the
last three
seasons
(one Year)
Buyer: 1= Direct
(Consumer),
2=Local market,
3=Middleman;
4= Cooperative
5= Export
Company; 6=Other
Total
Unit (1= Bigha,
2= Kattha,
3= Decimal,
4= Acres,
5= Hectare)
Total Home
consume
Sold Seed Unit
Paddy
Wheat
Vegetables
Millets
Oilseeds
Pulses
Lentils
Sugarcane
Maize
Gram
Other
*1: W= Winter (14.Dec. - 30. Feb.); S= Spring (1. March- 15. Jun); R= Rainy (16. Jun- 15. Dec)

115
Next, we will discuss livestock production and marketing activities.
Which animals did you have on your farm in the last season (between 01.03.2015 and 29.02.2016?
Please fill out the list, starting with A) choosing a type of animal you possess, and answer all questions until N) for each type of livestock you have for
production. Please one option or put the number according to your farm.
B6. What kind of livestock do you have and what are the (a) production characteristics of your livestock production?
A) B) C) D) E) F) G) H) I) J) K) L)
Type of
livestock
TOTAL
number
of
animals
Number of
animals
active in
the
production
right now
Produced
good (1= milk,
2= eggs;
3= meat;
4= living
animals; 5=
Work force;
6= Other-
Specify)
Quantity Expenditure
in INR in
the last
three
seasons
(Year)
Revenues
in INR in
the last
three
seasons
(Year)
Profits in
INR in the
last three
seasons
(Year)
Buyer: 1= Direct
(Consumer),
2=Local market,
3=Middleman;
4= Supermarket;
5= Cooperative
6= Export
Company;
7=Other
Unit (1= kg;
2=
Quintal;
3=
pieces;
4= Litre;
5= other)
Total pro-
duction
per day
Home
consume
Sold
Cows
Buffalo
Goats
Pigs
Poultry
Laying
hens
Other:
TOTAL

116
Let’s now talk about external workers use of agricultural production (Crop and Livestock) on your farm.
Please indicate for each season how many external workers are working on your farm in agricultural production (Crop and Livestock), starting with
(B) and fill out the table until H). If something is not applicable use 999 and if something is not known use 888.
ENUMERATOR (EXAMPLE): During winter 3 external workers were working on your farm. Two of them, C) 2 male, D) 1 female; E) per person they work
4 hours each day and F) receive 200 INR for salary. G) in total each of them worked 40 days the winter season; H) Activities they did were 1= Seeding and
3= harvesting.)
B7. External Workers- How many external workers are working on your farm? How many workers do you have, hired?
A) B) C) D) E) F)
Season Number of
workers
Male Female Working days per worker and per season Working area: (1= Crops; 2= Livestock)
I. Winter (14.12.2015- 30.02.2016)
II. Spring (01.03.2015- 15.06.2015)
III. Rainy (16.06.2015- 15.12.2015)
999= Not applicable; 888= Not known
C: Society structure; network; Organisation
The following chapter is about how connected you are within the village or with other organisations, institutions, companies etc. Please answer each
question, reminding yourself how you act and work with others.
C1. Are you a member of a network, society or organisation?
1= Yes 2= No
C1a. What are the reasons why you are not participating in an organisation/ network?
1= No benefits 2= No opportunity to participate 3= Bad experience in the past 4= Other Specify:
C2. With whom are you working together with related to your agricultural production/ business? (Private companies [e.g. Buyer, traders, agents) networks,
cooperations]) Which of the following organisations do you work together with related to your agricultural production/ business?
If one of the options in A) applies to you, please complete the table regarding your choice in A). One sector can represent more than one institution
or company (e.g. Private sector here can describe several different private companies).

117
A) Form of organisation
you are working with
B) Type
of support
(you can
choose
several
options)
*1
C) What is the most important factor, why
you are working together (Choose one
option)? 1= Best price; 2= Long relationship; 3= Closest
Distance; 4= Only option; 5= recommended by
others; 6= Best product/ service; 7= Best
facilities; 8= Others
D)
Working
together
since/
Member
since
E)
Member-
ship fee
(INR per
month)
Numbers of members I) Ranking
of most
important
partners
(1: Most
important)
F)
TOTAL
G)
Male
H)
Female
1= PRAN
2= FnF
3= Jeevika
4= KVK
5= Other Government
6= Other NGO
7= Private sector
8= Public
9= Other Association
10= Other Organisation
11= Other Cooperative
12= Other specify:
*1 Type
of
support
1= Seeds 2= Fertilizer 3= Pesticides,
Herbicides 4= Medicine for livestock
5= Input support for
livestock
6= Technical support
(machinery)
7= Trainings 8=
Demonstrations 9= Extension service
10= Network activity- Information
exchange 11= Trader 12= Processor
13= Retailer 14= Service
Provider
15= Provision of
credits 16= Other 17= None
Please choose Yes or No. If yes: specify reasons with choosing the option that applies most to you.
C3. Have you ever left a Community, network or society? 1= Yes 2= No
C3a. If Yes, what was the reason for leaving: 1= stopped their activity 2= No benefits 3= Better option 4= Other Specify:

118
D: Information
Please answer the question by choosing 3 options for each category: Production and Business.
Please rank your choices from 1 (most important) to 3 (least important)
D1. What is the most important channel of communication you usually use for your Production
/Business? Rank (1-3)
A) Production B) Business
1= Telephone
2= Mobil phone
3= Smartphone
4= Computer
5= Radio
6= TV
7= newspaper
8= Direct individual contact
9= Group meetings
10= Other specify:
D1a. Which channel of communication will be the most important
in the next five years for agricultural production/ business?
Code: ____ Code: ____
Please answer the question by choosing 3 options for each category: Production and Business.
Please rank your choices from 1 (most important) to 3 (least important)
D2. What is the most important source of information about the Business/Production for you? Rank
(1-3)
A) Production B) Business
1= Extension agents
2= newspaper
3= TV
4= Neighbours, Farmer-colleagues
5= Group member (or my cooperative)
6= Regional organisations
7= Governmental organisations
8= Private companies
9= NGOs
10= Other organisations
11= Other (Specify)
D2a. Which source of information will be the most important in the
next five years about agricultural production/ business?
Code: ____ Code: ____
E: experience with Capacity development activities
This section deals with your experience in capacity development activities/ training. Please
choose yes, if you ever participated in a capacity development activity/ training, or if you are
right now participating. If you answer No, please continue with 1a. and then the next section
E1. If you already participated at training or you are doing it right now continue with question
E2.
E1. Have you ever had the possibility to participate at training? 1= Yes 2= No
E1a.If you are not participating
at the training, which reason
applies most to you?
1= no
benefits
2= no
options
3= Bad
experience
4= Costs
are too
high
5= No
time
6=
Other

119
E2. What kind of training/ extension services did you already participate?
Please use for each training one row. One training can be one meeting or can go on for several weeks or month. One training is about one topic and
is set by a certain schedule. Please choose in each box only one option or put a number.
A) B) C) D) E) F) G) H) I) J) K)
Type of
training (1= Mass media
(Smartphones,
Radio,
Television); 2=
Classroom; 3=
Classroom +
demonstrations)
When did the
training start?
Who provided
the training? (1= PRAN;
2= FnF;
3= NGO;
4= Jeevica;
5= KVK;
4= Government;
5= Private sector
6= Other Specify)
Duration
of the
training
in days?
Duration
of each
meeting?
(hours)
What was
it about? (1= Crop
production;
2=
Livestock;
3= markets)
Distance
from
place of
training
to your
house (in
Traveling
hours)?
What was your main
motivation to
participate in the
training? (1= gaining knowledge;
2= free provision; 3= my
friends/ neighbour
farmers are going; 4=
Getting benefits/inputs at
the training; 5= Other
Specify)
How
satisfied
are you
with this
training? Scale: 1 (not
at all) to 5
(Extremely)
How did
the training
fit your
needs? Scale: 1 (not
at all)
to 5
(Extremely
much)
Month Year
… … … … … … … … … … …
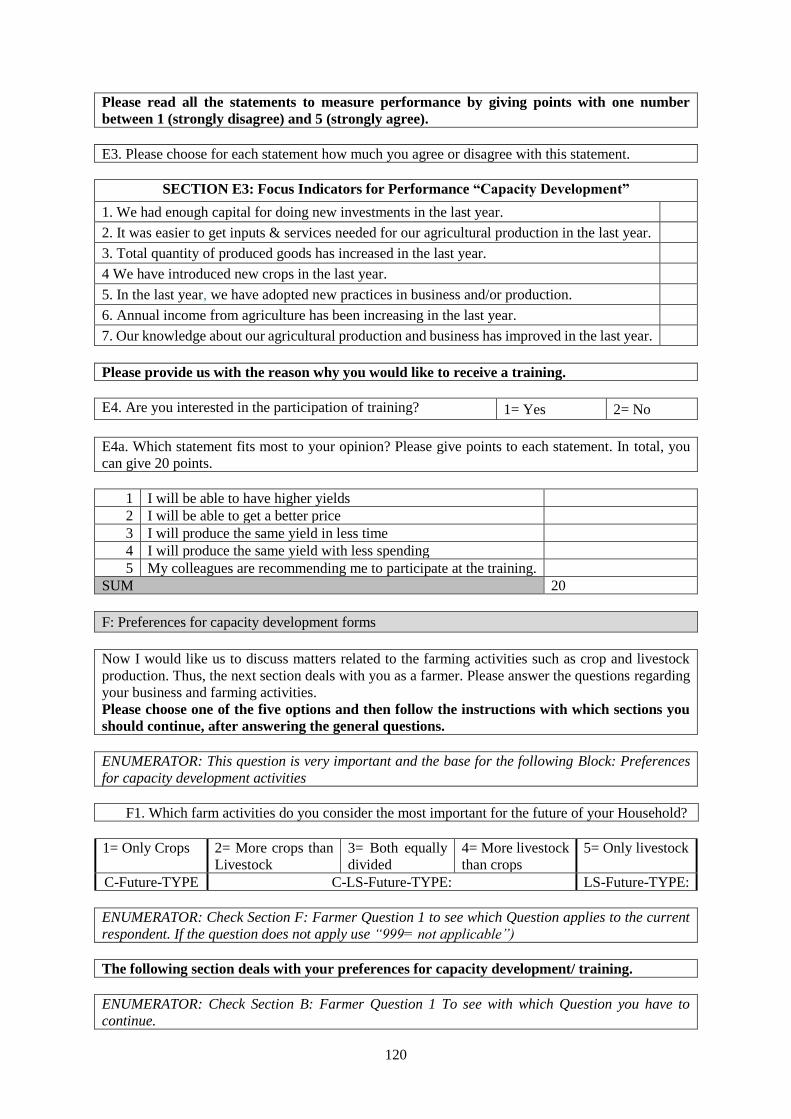
120
Please read all the statements to measure performance by giving points with one number
between 1 (strongly disagree) and 5 (strongly agree).
E3. Please choose for each statement how much you agree or disagree with this statement.
SECTION E3: Focus Indicators for Performance “Capacity Development”
1. We had enough capital for doing new investments in the last year.
2. It was easier to get inputs & services needed for our agricultural production in the last year.
3. Total quantity of produced goods has increased in the last year.
4 We have introduced new crops in the last year.
5. In the last year, we have adopted new practices in business and/or production.
6. Annual income from agriculture has been increasing in the last year.
7. Our knowledge about our agricultural production and business has improved in the last year.
Please provide us with the reason why you would like to receive a training.
E4. Are you interested in the participation of training? 1= Yes 2= No
E4a. Which statement fits most to your opinion? Please give points to each statement. In total, you
can give 20 points.
1 I will be able to have higher yields
2 I will be able to get a better price
3 I will produce the same yield in less time
4 I will produce the same yield with less spending
5 My colleagues are recommending me to participate at the training.
SUM 20
F: Preferences for capacity development forms
Now I would like us to discuss matters related to the farming activities such as crop and livestock
production. Thus, the next section deals with you as a farmer. Please answer the questions regarding
your business and farming activities.
Please choose one of the five options and then follow the instructions with which sections you
should continue, after answering the general questions.
ENUMERATOR: This question is very important and the base for the following Block: Preferences
for capacity development activities
F1. Which farm activities do you consider the most important for the future of your Household?
1= Only Crops 2= More crops than
Livestock
3= Both equally
divided
4= More livestock
than crops
5= Only livestock
C-Future-TYPE C-LS-Future-TYPE: LS-Future-TYPE:
ENUMERATOR: Check Section F: Farmer Question 1 to see which Question applies to the current
respondent. If the question does not apply use “999= not applicable”)
The following section deals with your preferences for capacity development/ training.
ENUMERATOR: Check Section B: Farmer Question 1 To see with which Question you have to
continue.

121
Please fill out the table if you are a C-Future-TYPE (Section F: Farmer Question 1).
Please mark the topics in each section which you consider to be NOT important to develop your
capacities on crop production in agriculture. Afterwards, distribute points between 0 and 20 to those
who are NOT marked/ you consider as important, to express the relevance of each topic to you (the
sum has to be 20 in total).
F2. Crop Topics
Topics 1. Please mark
topics NOT
important to
you with an X
2. Focusing on the topics that then
remain
(those not marked with X: please
distribute points between 0 and 20 to
express the relevance of each topic
to you. (The sum has to be 20)
Cro
p P
roduct
ion
A)
Pro
duct
ion i
nfo
rmat
ion
ab
ou
t 1. Selection of seed
2. New varieties
3. Use of pesticide
4. Production techniques/
equipment/ machinery
5. Production management
6. Use of fertilizer
7. Extension access
8. Irrigation
B)
Mar
ket
info
rmat
ion a
bout
mar
ket
s
1.Acess of inputs
2. Credit possibilities
3.Labour access
4. Market opportunities
(where to sell)
5. Market prices
6. Market requirements or
standards
E)
Hu
man
cap
acit
y/
soft
skil
ls
1. Leadership Skills
2. Media/
Communication skills
3. Self-competence
4. Social competence
20

122
Please fill out the table if you are a LS-Future-TYPE (Section F: Farmer Question 1).
Please mark the topics in each section which you consider to be NOT important to develop your
capacities on livestock production in agriculture. Afterwards, distribute points between 0 and 20 to
those who are NOT marked /you consider as important, to express the relevance of each topic to you
(the sum has to be 20 in total).
F3. Livestock topics
Topics 1. Please mark
topics NOT
important to
you with an X
2. Focusing on the topics that then remain
(those not marked with X: please distribute
points between 0 and 20 to express the
relevance of each topic to you. (The sum
has to be 20)
Liv
esto
ck p
roduct
ion
C)
Pro
duct
ion
in
form
atio
n
1. Feeding
2. Reproduction,
Breeding
3. Production
techniques/
equipment
4.Livestock
management
6. Animal Health,
Diseases detection
7. Extension access
D)
Mar
ket
info
rmat
ion
1.Acess of inputs
2. Market
opportunities (where
to sell)
3. Credit possibilities
4.Labour access
5. Prices
6. Market
requirements or
standards
E)
Hum
an c
apac
ity/
soft
skil
ls
1= Leadership Skills
2. Media/
Communication
skills
3. Self-competence
4. Social competence
20

123
Please fill out the table if you are a C-LS-Future-TYPE (Section F: Farmer Question 1).
Please mark the topics in each section which you consider to be NOT important to develop your
capacities on livestock production in agriculture. Afterwards, distribute points between 0 and 20 to those
who you did NOT mark /you consider as important, to express the relevance of each topic to you (the
sum has to be 20 in total).
F4. Crops and Livestock topics together
Topics about: 1. Please
mark topics
NOT
important to
you with an X
2. Focusing on the topics that remain
(those not marked). Please distribute
points between 0 and 20 to express the
relevance of each topic to you. (The
sum has to be 20)
Cro
p P
roduct
ion
A)
Pro
duct
ion
in
form
atio
n 1. Selection of seed
2. New varieties
3. Use of pesticide
4. Production techniques/
equipment/ machinery
5. Production
management
6. Use of fertilizer
7. Extension access
8. Irrigation
B)
Mar
ket
info
rmat
ion
1.Acessment of inputs
2. Credit possibilities
3.Labour access
4. Market opportunities
(where to sell)
5. Prices
6. Market requirements/
standards
Liv
esto
ck p
roduct
ion
C)
Pro
duct
ion
info
rmat
ion
1. Feeding
2. Reproduction,
Breeding
3. Production techniques/
equipment
4.Livestock management
5. Animal Health,
Diseases detection
6. Extension access
D)
Mar
ket
info
rmat
ion
1.Assessment of inputs
2. Market opportunities
(where to sell)
3. Credit possibilities
4.Labour access
5. Prices
6. Market requirements or
standards
E)
Hum
an
capac
ity
/ so
ft
skil
ls
1. Leadership Skills
2. Media/ Communication
skills
3. Self-competence
4. Social competence
20

124
G: Discrete Choice Experiment
Please answer the questions reminding yourself what you would consider as most suitable for
you.
ENUMERATOR: Check Section B: Farmer- Question 1 to see which Question you have to continue.
C-Type: EVERY choice they have is related to crops! LS-Type: EVERY choice they have
is related to livestock! C-LS-Type: They will have two sections. Section DCE-C is ONLY
related to Crops, Section DCE-LS is ONLY related to livestock. Please make sure that the
respondents consider this while taking the choice.
In the following, we present different training options to you. Imagine that you would have to
choose between different trainings about CROP/ LIVESTOCK production. Please always select
the one which you would prefer the most under realistic conditions. Afterwards, you will always
be asked if you would take this choice in real life as well.
The three different schemes of training are presented in the table. Please read it carefully and
make sure you understand each of them.
Attribute Method of
training
Trainer Additional
offer
Duration
of one
training
Training
costs
Location
Level Mass Media Farmers’
colleague-
Known by
participants
Credits
(Financial
support)
Half a day 50 INR Local/ village-
no travel costs
compensation
Class-room-
training
Expert
trained on
the job
Inputs (Trials
of Seeds/
Fertilizer)
1 full day 100 INR Regional-
travel costs
compensation
Classroom
training with
field
demonstration
Expert
trained by
university
Network
activities
(regular
information
exchange
with
colleagues)
Two full
days
150 INR Remote- travel
costs
compensation
No offer

125
H: ICT- Theory of Planned Behaviour
ENUMERATOR: Please explain the following example to the farmer. Make sure that the farmer understood the possible ideas through asking a few questions.
Now we present you a possible way how smartphones could be used in the future to provide you with information and develop your skills. What we show to
you is not available yet. It might be available in the near future. We want to understand your point of view concerning this way of receiving agricultural
information and knowledge. Please do always have the following examples in your mind while answering the question of the next block.
Here are the examples:
Information about the
use of seeds and their
stress tolerance
Information about the
time when to use
fertilizer
Information about
Diseases of animals
and ways to treat
those
Information about
characteristics of
different cows
Information about
current market prices
of your produce
Information about
estimated future
prices
You can receive
information about the
stress tolerance of
different varieties and
how to deal best with
drought seasons.
Here you can receive
information about the
best point of time when
to use fertilizer during
the growth of a crop.
You can receive
information about
symptoms of animal
diseases and ways to
treat those (example:
body temperature)
You can receive
information about
different breeds.
(example what they need
to eat, and they are able
to produce)
You can also receive
information where you
can sell your different
products and what
current price you will
receive.
You can get
information about
estimated future prices
for different goods
based on the last
season & experts.

126
Please judge the following statements by choosing a point on a scale between “1= strongly
disagree” and “5= strongly agree.”
H-II: Norms
1 Stakeholders I am working with think I should integrate smartphones to generate agricultural
knowledge.
2 Most people who are important to me would be in favour of using a smartphone to generate
agricultural knowledge.
3 Other farmers in my surrounding think I should take advantage of smartphones to generate
agricultural knowledge.
4 People whose opinions are valued to me expect that people like me should use smartphones to
generate agricultural knowledge.
5 I feel under pressure by most people who are important to me to use a smartphone to generate
agricultural knowledge.
6 I think other farmers in my village would be willing to adapt a smartphone to generate
agricultural knowledge.
7 Generally, it is expected of me to use a smartphone to generate agricultural knowledge.
H-III: Beliefs- Self-efficacy
1 I could generate agricultural knowledge using a smartphone if I try hard enough.
2 I am confident about using a smartphone to generate agricultural knowledge.
3 Using a smartphone to generate agricultural knowledge would not challenge me.
4 I could generate agricultural knowledge using a smartphone if there was no one around to tell
me what to do.
5 I would be able to generate agricultural knowledge using a smartphone if I had seen someone
else using it before trying it myself.
6 I could generate agricultural knowledge using a smartphone if someone would help me to get
started
7 I would be comfortable to use a smartphone to generate agricultural knowledge.
H-IV: Beliefs- Self-control
1 Political decisions have a decisive influence on the usage of a smartphone to generate
agricultural knowledge.
2 Whether I use a smartphone to generate agricultural knowledge or not is not entirely up to
me.
3 Farm performance is due to luck.
4 I think that I have the discipline to learn how to use a smartphone to generate agricultural
knowledge.
5 My own decisions and actions are decisive whether I will use a smartphone.
6 The interests of other Household-members have a decisive influence on my usage of a
smartphone to generate agricultural knowledge.
7 If I use a smartphone for generating agricultural knowledge or not depends on the funding
provided.
H-I: Attitude
1 Using a smartphone to generate agricultural knowledge will be good.
2 Using a smartphone to generate agricultural knowledge will increase productivity.
3 Using a smartphone to generate agricultural knowledge will be helpful.
4 The use of the smartphone as a learning tool excites me.
5 Using a smartphone for generation of agricultural knowledge would be a pleasant experience.
6 Using a smartphone to generate agricultural knowledge will make my work more attractive.
7 I would like the agricultural work more if I would use a smartphone.

127
H-V: Positive anticipated emotions
If I would succeed to increase agricultural knowledge by the aid of using a smartphone, I will feel …
Not at all Slightly Moderately Very Extremely
1 Excited not at all 1 2 3 4 5 Extremely
2 Delighted not at all 1 2 3 4 5 Extremely
3 Happy not at all 1 2 3 4 5 Extremely
4 Glad not at all 1 2 3 4 5 Extremely
5 Satisfied not at all 1 2 3 4 5 Extremely
6 Proud not at all 1 2 3 4 5 Extremely
7 Self-assured not at all 1 2 3 4 5 Extremely
H-VI: Negative anticipated emotions
If I would NOT succeed to increase agricultural knowledge by the aid of using a smartphone, I will
feel …
Not at all Slightly Moderately Very Extremely
1 Angry not at all 1 2 3 4 5 Extremely
2 Frustrated not at all 1 2 3 4 5 Extremely
3 Guilty not at all 1 2 3 4 5 Extremely
4 Ashamed not at all 1 2 3 4 5 Extremely
5 Sad not at all 1 2 3 4 5 Extremely
6 Disappointed not at all 1 2 3 4 5 Extremely
7 Worried not at all 1 2 3 4 5 Extremely
Please judge the following statements by choosing a point on a scale between “1= strongly
disagree” and “5= strongly agree.”
VII: Trainers readiness
1 I think trainers and experts would be in favour of utilizing a smartphone to generate agricultural
knowledge.
2 I think trainers and experts would believe that a smartphone could be a useful educational tool
in their training.
3 I think trainers and experts would possess adequate technical skills to use a smartphone in their
training.
VIII: Farmers readiness
1 I think other farmers would be in favour of utilizing smartphones in their training.
2 I think other farmers would believe that a smartphone could be a useful educational tool in their
coursework.
3 I think other farmers would possess adequate technical skills to use a smartphone in the training.
IX: Perceived usefulness
1 I think that using a smartphone would enable me to generate agricultural knowledge more
quickly.
2 I think that using a smartphone would make it more convenient for me to generate agricultural
knowledge.
3 I think a smartphone to generate agricultural knowledge is useful.
4 Overall, I think that using a smartphone to generate agricultural knowledge is advantageous.
5 With using a smartphone, I can access information on agricultural practices whenever I need it.
6 Being familiar with smartphones also enables me to work with other technological innovations.
7 Using a smartphone frequently increases farmers’ skills in reading and writing.
8 Agricultural knowledge I could obtain from smartphones is knowledge I need.

128
X: Perceived ease of use
1 I think that using a smartphone to generate agricultural knowledge would be easy.
2 I think that using a smartphone to generate agricultural knowledge does not require a lot of
mental effort.
3 Using a smartphone to generate agricultural knowledge will save time.
4 Agricultural knowledge presented by smartphone applications is much easier to understand than
normal training.
5 Smartphones need to be charged very often.
6 Smartphones might easily get damaged when working in the fields with them
7 I would be completely overstrained if the smartphone does not work as it should
XI: Perceived costs
1 Learning how to use a smartphone will cost me a lot of time.
2 Getting a smartphone will be challenging for me.
3 I think I am able to afford a smartphone in the following two years.
4 The charges for a smartphone are very high
5 The purchase prices of smartphones are expensive
6 Smartphone-accessories are very cheap
XII: Image
1 In our sector, a smartphone to generate agricultural knowledge will be a relevant feature.
2 Farmers that have a smartphone to generate agricultural knowledge enjoy a better reputation.
3 Smartphone to generate agricultural knowledge will gain greater significance in society.
4 Smartphones have a good image
5 Smartphones are too complicated to generate agricultural knowledge.
6 Smartphones are more reliable than other sources to generate agricultural knowledge.
7 Smartphones only fit young people
H-XIII: Desire
1 My desire for using a smartphone in order to increase agricultural knowledge can be described
as very strong
2 I want to use a smartphone to generate agricultural knowledge.
3 I am willing to put efforts to get a smartphone.
H-XIV: Intention
1 I am planning to use a smartphone to generate agricultural knowledge.
2 I will expand efforts on using a smartphone to generate agricultural knowledge.
A-II: Respondent/ Household
1. Please specify your sources of income of the last 12 months and how much are you generate/
receive through this source. Please name the most important one first.
Source In INR (in per cent) 1 Agriculture
2 Agricultural wage labour
3 Wage Labour
4 Support by family members
5 support by other institutions
6 Other business
7 Other

129
2. Would you like to give us any comments regarding our study?
____________________________________________________________________
____________________________________________________________________
____________________________________________________________________
____________________________________________________________________
Ending Time:
Thank you for your attention

130
E-ID Year Month Day Number
16
Appendix 2: Farmers Questionnaire – December 2016
Objective of the survey
I am a research associate from Göttingen University. We are doing a study to understand which
factors influence the participation and evaluation satisfaction of PRANs agricultural training. You
have been randomly selected among many other farmers to participate in our study. Your
participation is voluntary, and your responses will be most appreciated.
Informed consent
Your responses will be treated COMPLETELY CONFIDENTIAL. Therefore, your responses will
not be associated with your name in any of our work or in our further interviews. They will be added
to those of 250 other respondents and analysed together. Do you have any questions or comments
about this survey? If no, thank you and let us proceed.
Dirk Landmann; Tel: 9.102.276.949; Email: [email protected]
A1: Respondent
A1. Name
A2. Mobile-Phone-Number
A3. Did you attend the interview last summer? 1=
Yes 2= No
A3a: If yes, what was your respondent number (RESP_NUM)?
B. Place of Interview
B2. Enumerator-ID: 1 2 3 4 5 6 7 8
Please choose one of the five options and then follow the instructions with which sections you
should continue, after answering the general questions.
ENUMERATOR: This question is very important for the next block about agriculture. Please make
sure that the farmer understands the question correctly.
B3. Which farm activities does your household currently carry out?
1 = Only
Crops
2 = More crops than
Livestock
3 = Both equally
divided
4 = More livestock
than crops
5 = Only
livestock
C. Household
Introduction: The following question aims to find out how the structure of your household is and
who of your household members are working in agriculture. Please provide us with the total number
of household members first.
Household members: Have to be older than one year. These are the people who live together for
more than one year, usually pool their income and eat at least one meal together every day when they
are at home. This does not include people who have permanently migrated or are considered visitors.
Afterwards please provide us with more detailed information about each household member.
C1. How many members does your household have?

131
A) Number of household
members working in
agriculture.
B) Position inside the
household (related to
the household head) *1
C)
Age
D) Gender (1= Female;
2= Male)
E) Who are you?
(Please mark the
person you are)
*1 1= Household Head; 2= Husband/ wife/ spouse; 3= Son/ daughter; 4= Brother/sister; 5= Father/ mother;
6= Father/ mother-in-law; 7= Daughter/son -in-law; 8= Brother/Sister-in-law; 9= grandson/ daughter; 10=
Niece/Nephew; 11= Permanent servant; 12= Farm worker; 13= Other relative
C2a. For those who are working in agriculture, please provide us with the following information about
crop production.
A) Those working
in agriculture (put
their age here)
B) Who is doing
most of the
agricultural work?
(Scale of sum with
10 points)
C) Who is the main
decision maker of
agricultural crop
production?
D) Who is the main decision
maker about buying
agricultural inputs and selling
agricultural produce for crop
production?
… … … …
SUM 10
C2b. For those who are working in agriculture, please provide us with the following information
about livestock production.
A) Those
working in
agriculture (Put
their age here)
B) Who is doing most
of the agricultural
work? (Scale of sum
with 10 points)
C) Who is the main
decision maker of
agricultural livestock
production?
D) Who is the main decision
maker about buying
agricultural inputs and selling
agricultural produce for
livestock production?
… … … …
SUM 10
The following section comprises questions about you and the household you live in. Please
provide us with the following information or choose an option.
A2 Respondent
A4. What religious group do you belong too?
1 = Hindu 2 = Muslim 3 = Christian 4 = No religion 5 = Other: ______
If you belong to Hindi, please answer the following question and choose one category and a
caste you belong too. If you belong to another religion, please continue with Question A4.
Caste
Cate
gory
1 = General
category
f) Brahmin g) Bhumi
har
h) Rajput i) Kayastha j) other
2 = Other
backward cast
a) Yadav b) Koiri c) Kurmee d) Lohar e) Baniya
f) Kahar g) Badhai h) Garediya i) Naai j) Other
_____
4 = Others i) Paswan j) Bhuiya k) Pasi l) Dhuniya m) Chamar
n) Musahar o) Dhobi p) Other
A5. Marital Status: 1= Married 2= Single 3= Divorced 4= Widowed

132
A6. What is your highest
education completed?
(Choose one option)
1= No
degree
2=
Primary
School
3=
Secondary
School
4=
Graduate
5= Post-
Graduate
6= Other
Specify:
A7. Literacy status (please answer with yes or no)?
A7a. Can you read? 1= Yes 2= No A7b. Can you write? 1= Yes 2= No
A7c. Can you calculate? 1= Yes 2= No
A8. Do you have access to…?
(more than one option possible)
A)
Electricity
B)
Internet
C)
Radio
D)
Newspaper
E)
Television
A9. Which kind of water access does your household have?
A) Tapped water B) Pumped water C) Portable water D) Wells E) Other:
A10. Do you own a smartphone? 1= Yes 2= No
A10a: If no, do you have access to one? 1= Yes 2= No
A5. What do you expect from today’s agricultural training?
1= Gaining
knowledge
2=
New
skills
3= Free
provision
4= My friends/
neighbour
farmers are
going
5= Getting
benefits/
inputs at the
training
6= Infor-
mation
exchange
7=
Other:
…
8=
None
D. Farm
How much land do you cultivate? Please specify a.) how much land you cultivate in total, b)
how much of this total land is your own, c) how much of the total land you rented. Please also
specify the unit you are using in order to answer the three questions (use the one you mentioned
above).
D1. Cultivated
land: a) TOTAL b) Own land c) Rented in
d) Unit (1= Bigha, 2= Kattha,3=
Decimal, 4= Acres, 5= Hectare)
D2. How many plots* do you cultivate?
* Plots: A piece of land that is not spatially segmented and where one crop has more or less the same
age and is managed in the same way.
D3. For how many years have you been farming (as an independent household)?

133
D4. What produce is the outcome of your crop production? What crops did you produce in the last year (From 01.03.2015 to 15.12.2016)?
Please fill out the list. Please only fill in the information for the crops you are cultivating and answer all questions until M).
A) B) C) D) E) F) G) H) I) J) K) L) M)
Crop
Season: 1= Winter;
2= Spring;
3= Rainy*1;
4= Winter and
Spring; 5=
Winter and
rainy;
6= Spring and
rainy; 7=
Winter, spring
and rainy
Area Yield (Quantity) Expenditu
re in INR
in the last
three
seasons
(one Year)
Revenues
in INR in
the last
three
seasons
(one
Year)
Profits
in INR
in the
last
three
seasons
(one
Year)
Buyer: 1= Direct
(Consumer),
2=Local market,
3=Middleman;
4= Cooperative
5= Export
Company;
6=NGO; 7=
Other; 8= Not
applicable
Total
Unit
(1= Bigha,
2= Kattha,
3=
Decimal,
4= Acres,
5= Hectare)
Tot
al
Home
consump-
tion
Sold Seed Unit: 1= kg;
2=
Quintal
;
3=
Pieces;
4=
Litre
Paddy
Wheat (Total)
SWI2
Vegetables (If
not listed)
Millets
Oilseeds
Pulses
Lentils
Sugarcane
Maize
Gram
Other:
Potato
Cauliflower
Ladyfinger
Cabbage
Tomato
*1: W= Winter (14. Dec. - 30. Feb.); S= Spring (1. March- 15. Jun); R= Rainy (16. Jun- 15. Dec); 2SWI= System of Wheat Intensification

134
D5. What type of livestock (A) do you have and what is your TOTAL number of animals (B)?
A) B)
Type of livestock TOTAL number of animals
1.Cows
2. Buffalo
3. Goats
4. Pigs
5. Poultry
6. Laying hens
7. Other:
8. No animals
Let us talk about the employment of external workers for agricultural production (crop and livestock)
on your farm.
D6. Did you hire external workers for doing agricultural related work in the last year?
A) B) C) D) E)
Season Number of
workers
Working days per
worker and per
season
Working in crop
production?
Please mark.
Working in livestock
production? Please
mark.
I. Winter
(14.12.2015-
30.02.2016)
II. Spring
(01.03.2015-
15.06.2015)
III. Rainy
(16.06.2016-
15.12.2016)
999= Not applicable; 888= Not known
E: Network
The following chapter is about how connected you are within the village or with other
organisations, institutions, companies. Please answer each question, reminding yourself how
you act and work with others.
E1. Are you a member of a network, society or organisation? Are you working together with other
sectors or receiving goods through them?
1= Yes 2= No
E1a. What are the reasons why you are not participating in an organisation/ network?
1= No benefits 2= No opportunity to
participate
3= Bad experience in the
past
4= Other Specify:
E2. With whom are you working together with related to your agricultural production/ business?
(Private companies [e.g. Buyer, traders, agents) networks, cooperations]) Which of the following
organisations do you work together with related to your agricultural production/ business?
Next, we will discuss livestock production. Which animals did you have on your farm in the last season
between 01.03.2015 and 15.12.2016?

135
If one of the options in A) applies to you, please complete the table regarding your choice in A). One sector can represent more than one institution
or company (e.g. Private sector here can describe several different private companies).
A) Form of organisation you are working
with
B) Type of
support (you can
choose several
options) *1
C) What is the most important factor, why you are
working together (Choose one option)? 1= Best price; 2= Long relationship; 3= Closest
Distance; 4= Only option; 5= recommended by others;
6= Best product/ service; 7= Best facilities; 8= Others
D) How long you
are working
together? /
Member since (in
years)?
E) Ranking of
most important
partners
(1: Most
important)
1= PRAN
2= FnF
3= Jeevika
4= KVK
5= Other Government
6= Other NGOs
7= Private sector in general
8= Public
9= Other Association
10= Other Organisation
11= Other Societies/ Cooperatives
12= Other specify:
13= No
*1 Type
of
support
1= Seeds
7= Trainings
13= Retailer
2= Fertilizer
8= Demonstrations
14= Service Provider
3= Pesticides, Herbicides
9= Extension service
15= Provision of credits
4= Medicine for livestock
10= Network activity- Information
exchange
16= Other
5= Input support
for livestock
11= Trader
17= None
6= Technical support
(machines)
12= Processor

136
F. Information
Please answer the question by choosing 3 options. Please rank your choices from 1 (most important) to 3 (least important)
F1. What is the most important source of information for you? Please, rank from 1 (most important) to 3 (less important).
1= Extension agents
2= Newspaper
3= TV
4= Neighbours, Farmer-colleagues
5= Group member (members of my group, cooperative,)
6= Regional organisations
7= Governmental organisations
8= Private companies
9= NGOs
10= Other organisations
11= Internet
12= Agricultural training
13= Other:
F1a. Which source of information will be the most important in the next five years about agriculture? Code:_______
G: Experience with other training
This section deals with your experience in training. Please use for each training one row. One training can be one day- meeting or can go on for
several weeks or months. One training is about one topic and is set by a certain schedule. Please choose in each box only one option or put a number
inside.
A) B) C) D) E) F) G) H)
Type of training (1= Mass media
(Smartphones,
Radio, Television);
2= Classroom; 3=
Classroom +
demonstrations)
Who provided the
training?
(1= PRAN; 2= FnF;
3= NGO;4= Jeevika;
5= KVK; 4=
Government; 5=
Private sector6=
Other Specify)
Duration
of the
training
in days?
Duration
of each
meeting
(Hours)?
What was it about? (1= Crop production
in rainy season; 2=
Crop production in
summer; 3= Crop
production in winter;
4= Livestock; 5=
markets)
What was your main motivation
to participate in the training? (1= Gaining knowledge; 2= New
skills; 3= Free provision; 4= my
friends/ neighbour farmers are
going; 5= Getting benefits/inputs at
the training; 6= information
exchange; 7= Other Specify; 8=
None)
How satisfied
are you with
this training?
Scale:
1 (not at all) to
5 (extremely)
How did the
training fit
your needs?
Scale: 1 (not
at all) to 5
(extremely)

137
Now we would like to ask you some statements about your opinion towards agricultural training.
Please judge the following statements by choosing a point on a scale between “1= strongly disagree”
and “5= strongly agree”.
H1. Attitude
1 I see agricultural training as something positive to be educated in cultivation on winter crops.
2 Participation in agricultural training is very important to me to acquire new methods.
3
I find agricultural training useful to exchange information about local improvements with other
farmers.
4 I want to continue producing in a traditional manner rather than trying new ways of production.
5 I believe that participation in agricultural training will increase my productivity.
6 By participating in agricultural training, I want to improve our household’s standard of living.
7 Participation in agricultural trainings helps me to be better organized.
8 Participation in agricultural training courses is instructive.
9 I can apply the training content in practice.
10 The agricultural training is about a relevant topic.
H2. Subjective Norm
1
I believe that my relatives expect me to succeed in farm work and to improve our income through
agricultural training.
2 My family supports participation in agricultural training.
3 People who influence me think I should participate in agricultural training.
4 People in my environment who attend agricultural training are highly respected.
5 Others think I could gain knowledge through agricultural training.
6 It is important for me to be respected and appreciated by my environment.
7 I participate in agricultural training without any advice from friends and family.
8 I participate in agricultural training even if others do not recommend it.
H3. Perceived Control
1 I think I can improve our income through agricultural training.
2 I find it easy to acquire new agricultural techniques during the training.
3 I think that using agricultural training to generate agricultural knowledge does not require a lot of
mental effort.
4 I have the desire to develop myself constantly through agricultural training.
5 I think there should be access to agricultural training in the future.
6 I think that the overall effect generated by agricultural training will be positive.
7 Most farmers in my environment have the possibility to participate in agricultural training.
H4: Intention
1 I intend to participate in agricultural training within the next 6 months.
2 I am planning to apply the knowledge gained today within the next 4 weeks.
H. Theory of Planned Behaviour

138
H5. Respondent/ Household/Source of Income
Please specify your sources of income of the last 12 months and how much are you generate/ receive
through this source. Please name the most important one first.
Source In INR In per cent
1 Agriculture
2 Agricultural wage labour 3 Wage Labour
4 Support by family members
5 Support by other institutions
6 Other business
7 Other
Now the agricultural training you participate in will start. We wish you an interesting training.
Second part of the study
Now the second part of the survey starts, which is again about your intention to participate in an
agricultural training but also about your satisfaction and learning success.
Please judge the following statements by choosing a point on a scale between “1= strongly disagree”
and “5= strongly agree”.
H1.1. Attitude after
1 I believe that participation in agricultural training will increase my productivity.
2 The agricultural training was positive to be educated in cultivation on winter crops.
3 Participation in agricultural training is very important to me to acquire new methods.
4 I find agricultural training useful to exchange information about local improvements with
other farmers.
5 I think that the overall effect generated by agricultural training will be positive.
6 Participation in agricultural trainings helps me to be better organized.
7 Participation in agricultural training courses is instructive.
8 I can apply the training content in practice.
H3.1. Perceived Control after
1a I think I can improve our income through agricultural training.
2a I find it easy to acquire new agricultural techniques during the training.
3a I think that using agricultural training to generate agricultural knowledge does not require a
lot of mental effort.
4a I have the desire to develop myself constantly through agricultural training.
5b I think there should be access to agricultural training in the future.
6b I would like to have a different training than the one we had today.
7b I think that the overall effect generated by agricultural training will be positive.
H4.1 Intention after
1 I intend to participate in agricultural training within the next 6 months.
2 I can apply the knowledge gained today in the next 5 weeks.

139
Please judge the following statements by choosing a point on a scale between “1= strongly disagree”
and “5= strongly agree”.
I1. Satisfaction
I1.1 Reasons for joining I gained knowledge during the training.
My friends /family attended the training. I exchanged knowledge with other farmers. I improved my agricultural skills.
I had no costs through the training.
I had benefits through the agricultural training.
I1.2 Expectation My expectations were fulfilled to my satisfaction.
I1.3 Duration The training lasted much too long. The training was well timed. The training was too short.
I1.4 Training content The training contained irrelevant information. The training was too theoretical.
The training was perfectly balanced between practical and theoretical
information.
1.5 Practical importance I will be able to apply most of the training content in practice.
I could hardly apply today's training content in practice.
The training content was irrelevant for me.
1.6 Trainers‘ competence The instructor was able to convey the contents of the training very well. The trainer could handle the participants very well.
The instructor was not good.
The next question is about other possible topics for agricultural training. Please rate those statements,
which topic is important to you and you would participate in a training.
Please judge the following statements by choosing a point on a scale between “1= not at all and 5=
extremely”.
I2. Which topics are very important to you?
I2. Which of the following subjects would you consider in another training session?
1 I would like to educate myself further in the cultivation of winter crops.
2 I would like to educate myself further in farm mechanization.
3 I would like to have more information access to fertiliser, seedlings, planting material and pesticides.
4 I would like to learn, how I can improve post-harvest storage and treatment.
5 I would like to learn more about business planning.
6 I would like to learn, how to manage a change.
7 I would like to have market information on sales and prices.

140
J. Learning Success
J1. In this part of the study, we would like to check, which learning contents you have kept? Please
choose one of the four possible answers.
ENUMERATOR: The survey is divided into two parts. One part an expert by PRAN is teaching the
farmers and in the second part, an academic is teaching. It is very important to choose the right kind of
trainer. Please double check your answer.
J. Which kind of trainer has taught you? Please specify.
1= Expert by PRAN
2= Academic
If you have chosen the Expert by PRAN, please go on with the direct following learning success J1. If
you have chosen the academic as an expert, please skip the following learning success J1 and start with
J2 Learning success for academic.
J1.1 For Shree vidhi process to sow wheat seeds, one needs seeds per katha.
1= 3 kilogram 2= 5 kilogram 3= 0,5 kilogram 4= 7 kilogram 5= I don’t know
J1.2 The requirements for wheat seed sowing are?
1= Carbondagym copper
oxychloride phytolum
2= Hot water, cow urine,
jagerry, vermiwash, pot
3= PSB, trycoma,
vibhistin
4=
none
5= I don’t
know
J1.3 Materials used in seed treatment?
1= Vibhistin, diethane M45 2= Captain,
phytolum
3= seed trycoderma 4= none 5= I don’t know
J1.4 While sowing seeds via shree vidi, the number of seeds at one place will be?
1= 5 2= 8 3= 6 4= 2 5= I don’t know
J1.5 For sowing wheat seeds via shree vidhi, one line is how far from the next line?
1= 10 inch 2= 12 inch 3= 8 inch 4= 14 inch 5= I don’t know
J1.6 The wheat that is planted through shree vidhi, when do you first water it?
1= 20 days 2= 15 days 3= 25 days 4= 30 days 5= I don’t know
J1.7 When is the first time you plough the field?
1= 20 days 2= 25 days 3= 35 days 4= 30 days 5= I don’t know
J1.8 Before harvesting, what are the fertilizers one should use?
1= DAP,
Urea, potash
2= Shreepranamitra, shreejivamitra,
Shreedhanjivamitra
3= Single super
phosphate, NPK
4=
None
5= I don’t know
J1.9 After using the first weeder, what are the fertilisers you need to use?
1= urea, DAP 2= Potash sulpher 3= Shreepranamitra,
shreejivamitra
4= None 5= I don’t know

141
J1.10 How many particles are there in 1 kilogram of wheat seeds?
1= 20000 2= 40000 3= 60000 4= 80000 5= I don’t know
J2 Learning Success for Academic
In this part of the study, we would like to check, which learning contents you have kept? Please choose
one of the four possible answers.
2.1 If you sow seeds on time, what quantity of seeds would you need per katha?
1=2 kilograms 2=750 grams 3=1.8 kilogram 4=1 kilogram 5= I don’t know
2.2What are the things required for seed treatment?
1=Bavistin and
Trychoderma
2=Capton,
Phytolom
3=Trychoderma
or bavistin
4=None of these 5= I don’t know
2.3 Which of the following is recommended when you sow the wheat seeds late?
1=HD 2967 2= HI 1563 3= K9351 4=None of these 5= I don’t know
2.4 Which time is the best to sow seeds for wheat?
1= The whole month of
October
2= 15 Nov
to 10 Dec
3= The whole month of
December
4=15 Oct to
15 Nov
5= I don’t know
2.5 If you sow on time, what should be the distance between the two lines of seeds?
1=10 inch 2=12 inch 3=8 inch 4=14 inch 5= I don’t know
2.6 If you have the possibility of one irrigation for the wheat crops, when should you do it?
1= 20-25 days later 2= 40-45 days later 3= 60-65 days later 4= 80-85 days
later
5= I don’t know
2.7 How many days after sowing wheat seeds do you use Krptwarnashi?
1= 40-45 days later 2= 30-35 days later 3= 50-55 days later 4= 20-25 days
later
5= I don’t know
2.8 Name the Micronutrient to be sprayed to meet the deficiency of zinc:
1= Muriate of Potash
(KCl)
2= Harakashish
(FeSO4- Iron Sulfate)
3= Zinc-Sulfate
(ZnSO4)
4=1 None of
them
5= I don’t know
2.9 Between zero till seed cum fertiliser drill to sow seeds, how many times should you
till the field?
1= Twice 2= Thrice 3= Four times 4= No ploughing required 5= I don’t know
2.10 How many seed grains do you have in one kilogram of wheat?
1= 20000 2= 40000 3= 60000 4=80000 5= I don’t know

142
Thank you for your answers. Now we would like to know if you would recommend and participate again
in the training.
K1: Would you recommend the
agricultural training today? 1= Yes 2= No
K1a: If you would not recommend
the training, which reason applies to
you most?
1= No
benefits
2= No
options
3= Bad
experienc
e
4= Costs
are too high
5= No
time
6=
Other
K1b: If yes, why do you recommend
today’s agricultural training?
1=
Useful
topic
2= Good
trainer
3= No
costs
4=
Instructive
5= Good
expla-
nation
6=
Other
K2. Would you attend today’s
agricultural training again? 1= Yes 2= No
K2a. If you would not attend
today’s training again, which
reason applies to you most?
1= No
benefits 2= No
options 3= Bad
experience
4= Costs
are too high 5= No
time 6= Other
Please judge the following statements by choosing a point on a scale between “1= strongly disagree”
and “5= strongly agree”.
L. PRAN
1 PRAN is a respected partner organisation for me.
2 PRAN has a positive impact on agricultural development of my farm.
The next question depends on your trainer. If the expert of PRAN trained you, please go on with M1. If
the academic was your trainer please go on with M2.
N1. Would you like to give us any comments regarding our study?
___________________________________________________________________________________
___________________________________________________________________________________
__________________________________________________________________________
Ending Time:
Thank you for your attention