capacity, business objectives, success factors and ... · pdf file• factors affecting...
TRANSCRIPT

Felix Schmid, School of Civil EngineeringClive Roberts, School of Electrical, Electronic and Computer Engineering
College of Engineering and Physical SciencesBCRRE, University of Birmingham
Capacity, Business Objectives, Success Factors and Measurement of KPIs
IRSE Seminar 29 March 2012Delivering Business Performance
Including some Lessons from BCRRE Projects

Slide No: 2
IRSE Seminar 29 March 2012 - Delivering Business Performance

Slide No: 3
IRSE Seminar 29 March 2012 - Delivering Business Performance
Overview of presentation• From the triangle of
railway capacity to the pentagon and hexagon;
• Who are we working for:• Passengers?• Freight users?• Government?
• Two research projects:• Deciding on viable actions
– the capability trade-off tool;
• ON-TIME – measuring and enhancing performance.

Slide No: 4
IRSE Seminar 29 March 2012 - Delivering Business Performance
The old railway is getting fuller and fuller

Slide No: 5
IRSE Seminar 29 March 2012 - Delivering Business Performance
Strategic triangle of railway capacity
TIMETABLE DESIGN
ROLLING STOCK INFRASTRUCTURE
© Swiss Railways (SBB-CFF)
Slide No: 6
IRSE Seminar 29 March 2012 - Delivering Business Performance
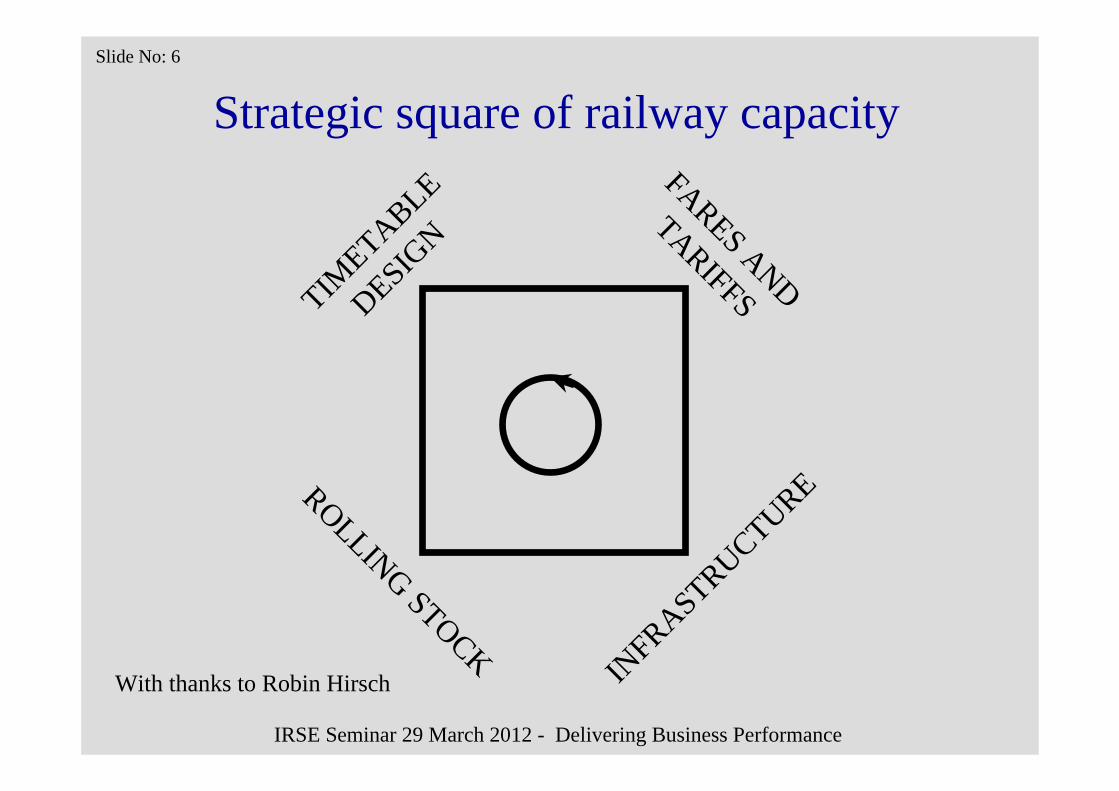
Strategic square of railway capacity
TIMETABLE
DESIGN
ROLLING STOCK
INFRASTRUCTURE
FARES AND
TARIFFS
With thanks to Robin Hirsch

Slide No: 7
IRSE Seminar 29 March 2012 - Delivering Business Performance
Strategic pentagon of railway capacity
STA
FF
RESO
URC
ES
ROLLING STOCKINFRASTRUCTURE
FARES A
ND
TARIFFS
TIMETABLE DESIGN
Slide No: 8
IRSE Seminar 29 March 2012 - Delivering Business Performance
STA
FF
RESO
URC
ES
ROLLING STOCKINFRASTRUCTURE
FARES A
ND
TARIFFS
TIMETABLE DESIGN
ROLLING STOCKINFRASTRUCTURE
FARES A
ND
TARIFFS
TIMETABLE DESIGN
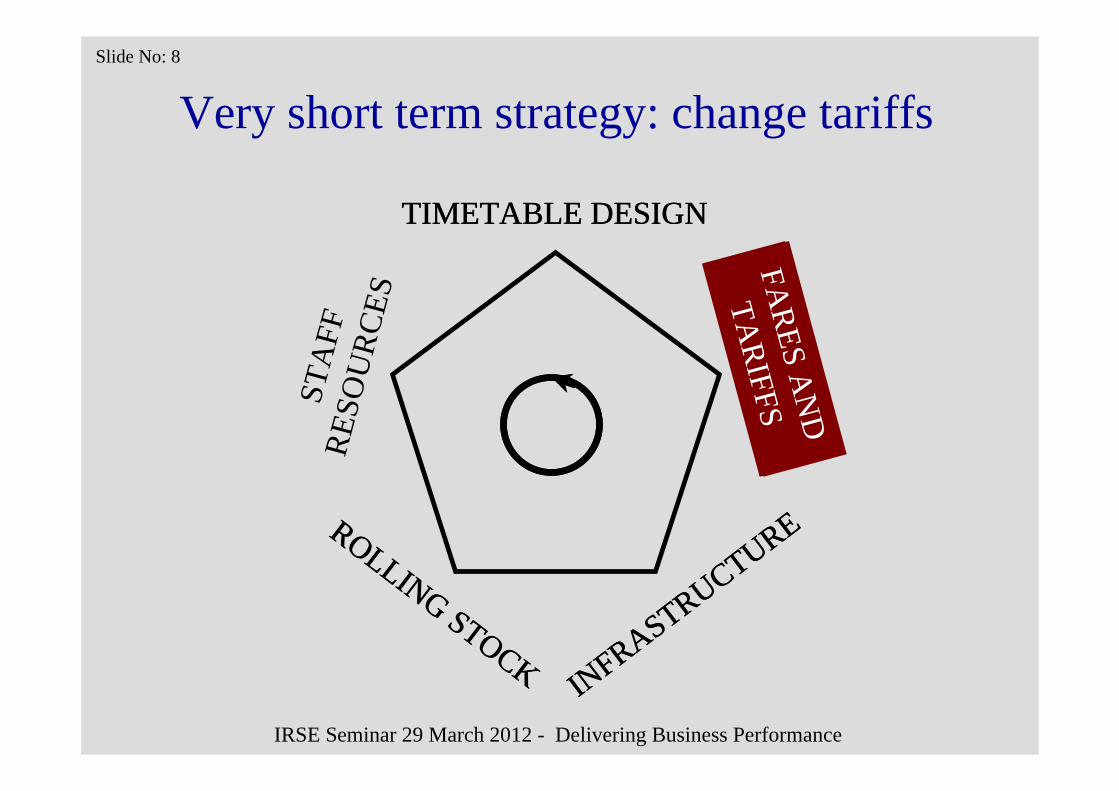
Very short term strategy: change tariffs

Slide No: 9
IRSE Seminar 29 March 2012 - Delivering Business Performance
Managing capacity by means of tariffs• Discourage demand:
• Selectively increase fares;• Selectively increase goods tariffs.
• Encourage demand:• Introduce season tickets;• Reduce passenger fares;• Reduce goods tariffs.
• Control demand:• Introduce market pricing;• Imitate budget airlines.
• Advantages:• Cheap and cheerful approach to capacity management;• Can be implemented quite rapidly.
• Drawbacks:• Likelihood of customer dissatisfaction;• Potential loss of traffic;• Increased complexity of fare system.

Slide No: 10
IRSE Seminar 29 March 2012 - Delivering Business Performance
Short term strategy: change timetables
STA
FF
RESO
URC
ES
ROLLING STOCKINFRASTRUCTURE
FARES A
ND
TARIFFS
TIMETABLE DESIGN

Slide No: 11
IRSE Seminar 29 March 2012 - Delivering Business Performance
Managing capacity using timetables• Discourage demand:
• Run trains at unsociable times;• Extend journey times by introducing more stops.
• Encourage Demand:• Add stops to improve market penetration;• Regularise timetable (fixed interval / clockface);• Re-time trains to coincide with demand;• Establish better connections.
• Improve Resource Use:• Reduce turn around times;• Reduce dwell times;• Reduce conflicts;• Reduce staff inefficiency.
• Generally quite low cost but thought intensive;• Generally quite quick.

Slide No: 12
IRSE Seminar 29 March 2012 - Delivering Business Performance
Short to medium term strategy: staffing
STA
FF
RESO
URC
ES
ROLLING STOCKINFRASTRUCTURE
FARES A
ND
TARIFFS
TIMETABLE DESIGN

Slide No: 13
IRSE Seminar 29 March 2012 - Delivering Business Performance
Managing capacity through staff changes• Employ more staff:
• Can increase reliability;• Can enhance revenue.
• Reduce staff numbers:• Can enhance productivity;• Can save money.
• Change staff incentive schemes:• Enhance / reduce basic salary vs. overtime;• Revenue linked bonus.
• Enhance staff training:• Better performance;• Better communication with customers.
• Drawbacks:• Can be relatively slow• Can be high cost due to training and wage bills;• Can be high risk due to strike action.
Slide No: 14
IRSE Seminar 29 March 2012 - Delivering Business Performance
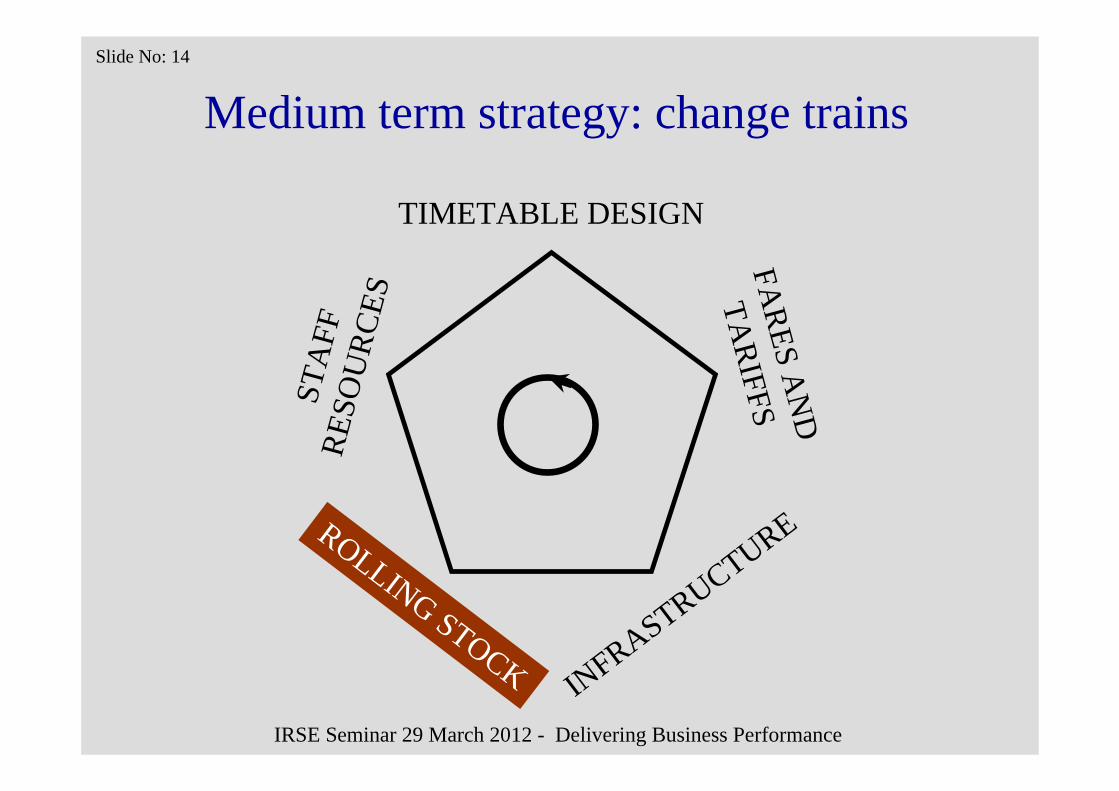
Medium term strategy: change trains
STA
FF
RESO
URC
ES
ROLLING STOCK INFRASTRUCTURE
FARES A
ND
TARIFFS
TIMETABLE DESIGN

Slide No: 15
IRSE Seminar 29 March 2012 - Delivering Business Performance
Managing railways through rolling stock• Rectify rolling stock:
• Increase reliability;• Increase availability.
• Modify rolling stock:• Reduce number of seats;• Increase number of seats;• Faster access / egress;• Enhance quality.
• Buy new rolling stock:• Higher capacity;• Greater comfort;• Greater acceleration levels;• Higher speeds;• Reduce performance spread;• Move to electric trains;• More flexible use of trains.

Slide No: 16
IRSE Seminar 29 March 2012 - Delivering Business Performance
Long term strategy: infrastructure changes
STA
FF
RESO
URC
ES
ROLLING STOCK INFRASTRUCTURE
FARES A
ND
TARIFFS
TIMETABLE DESIGN

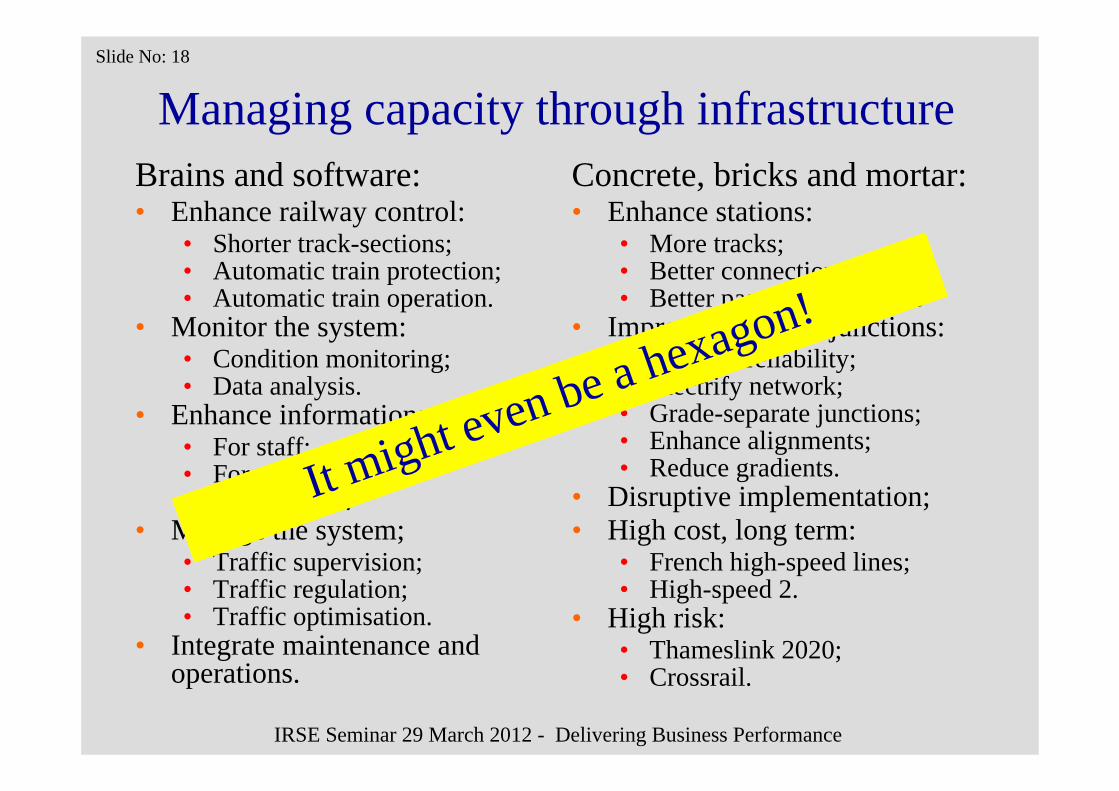
It might even be a hexagon!
Slide No: 18
IRSE Seminar 29 March 2012 - Delivering Business Performance
Managing capacity through infrastructureBrains and software:• Enhance railway control:
• Shorter track-sections;• Automatic train protection;• Automatic train operation.
• Monitor the system:• Condition monitoring;• Data analysis.
• Enhance information:• For staff;• For passengers;• For shippers.
• Manage the system;• Traffic supervision;• Traffic regulation;• Traffic optimisation.
• Integrate maintenance and operations.
Concrete, bricks and mortar:• Enhance stations:
• More tracks;• Better connections;• Better passenger facilities
• Improve track and junctions:• Improve reliability;• Electrify network;• Grade-separate junctions;• Enhance alignments;• Reduce gradients.
• Disruptive implementation;• High cost, long term:
• French high-speed lines;• High-speed 2.
• High risk:• Thameslink 2020;• Crossrail.
It might even be a hexagon!

Slide No: 19
IRSE Seminar 29 March 2012 - Delivering Business Performance
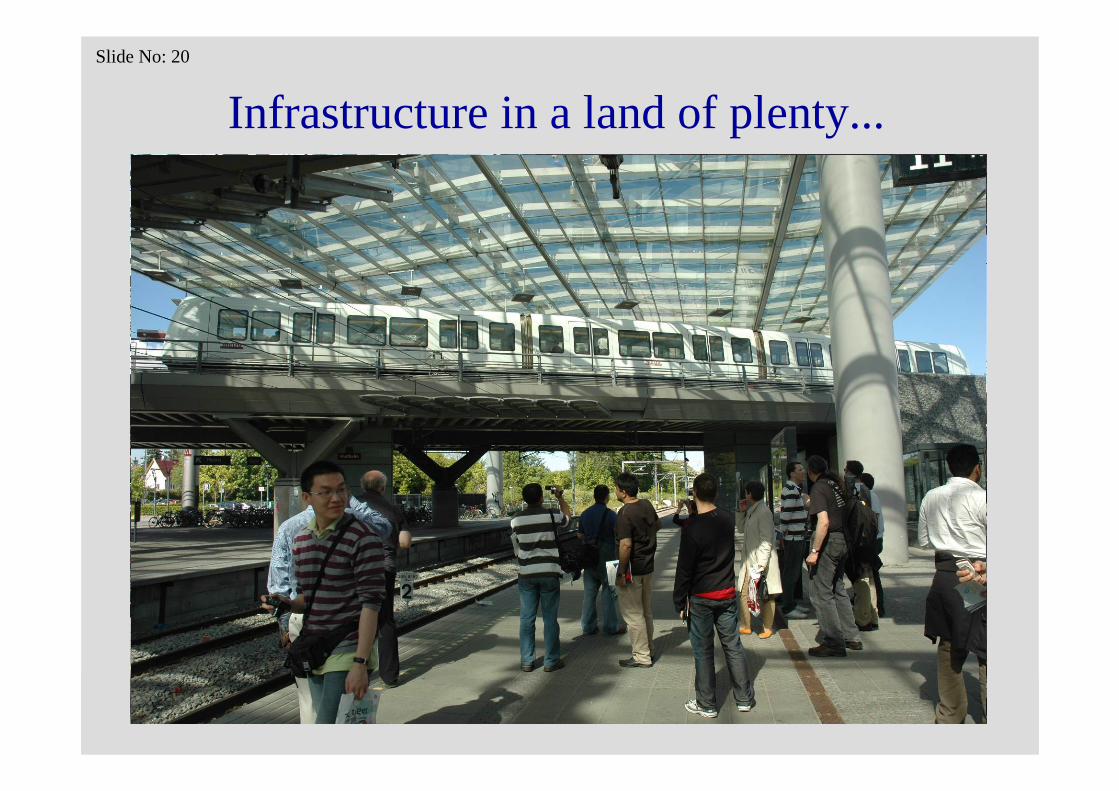
Lakes, mountains, a terminus and concrete
©Th
omas
Sch
mid
, 201
2
Slide No: 20
IRSE Seminar 29 March 2012 - Delivering Business Performance
Infrastructure in a land of plenty...

Clive Roberts and Felix Schmid, BCRRE, UoBVijay Ramdas and Jonathan Shawe, TRL
with grateful thanks to the Department for Transport
How do we decide between strategic capacity management actions?

Slide No: 22
IRSE Seminar 29 March 2012 - Delivering Business Performance
Capital expenditure
CostService
Working capital
vers
us
versusversus
versus versus
versus
Manufacturing strategy’s trade-off pairs

Slide No: 23
IRSE Seminar 29 March 2012 - Delivering Business Performance
Setting the sceneSetting the scene
•• What is the definition of rail network capacity?What is the definition of rail network capacity?
•• Where, how and why is capacity lost?Where, how and why is capacity lost?
•• What modelling tools are available to support What modelling tools are available to support rational rail capability traderational rail capability trade--off decisions?off decisions?
•• A project sponsored by the DfTA project sponsored by the DfT
Slide No: 24
IRSE Seminar 29 March 2012 - Delivering Business Performance
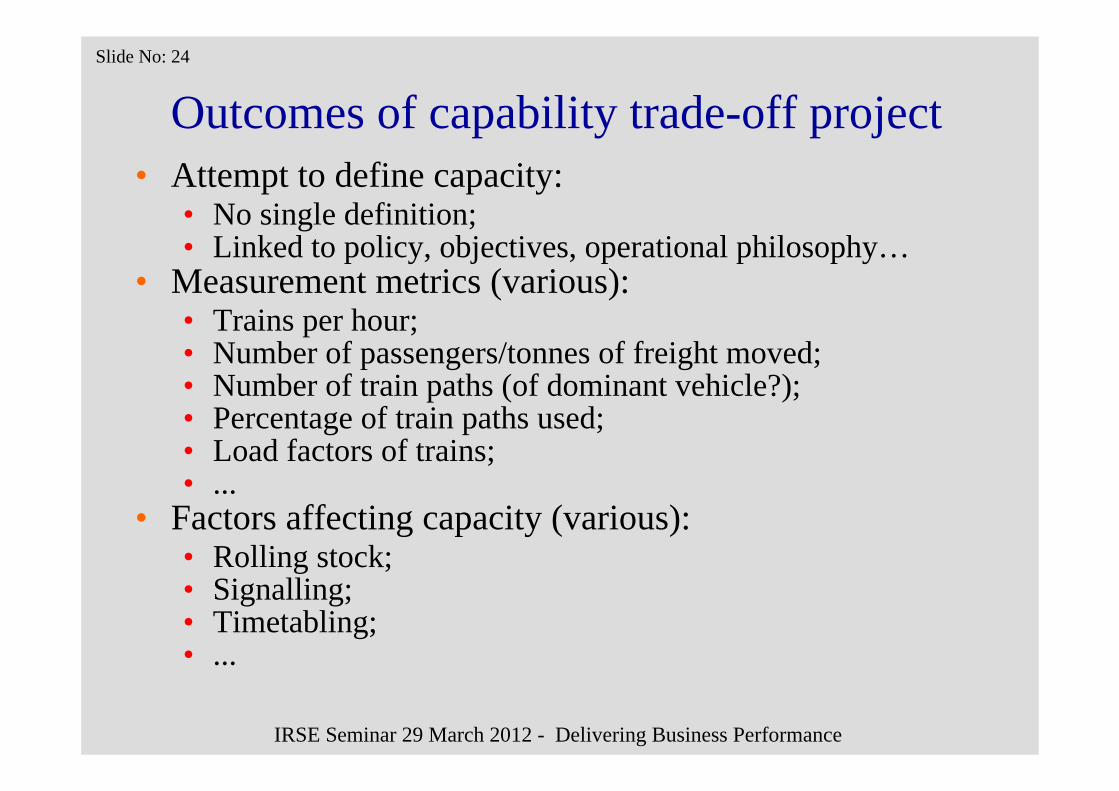
Outcomes of capability trade-off project• Attempt to define capacity:
• No single definition;• Linked to policy, objectives, operational philosophy…
• Measurement metrics (various):• Trains per hour;• Number of passengers/tonnes of freight moved;• Number of train paths (of dominant vehicle?);• Percentage of train paths used;• Load factors of trains;• ...
• Factors affecting capacity (various):• Rolling stock;• Signalling;• Timetabling;• ...
Slide No: 25
IRSE Seminar 29 March 2012 - Delivering Business Performance
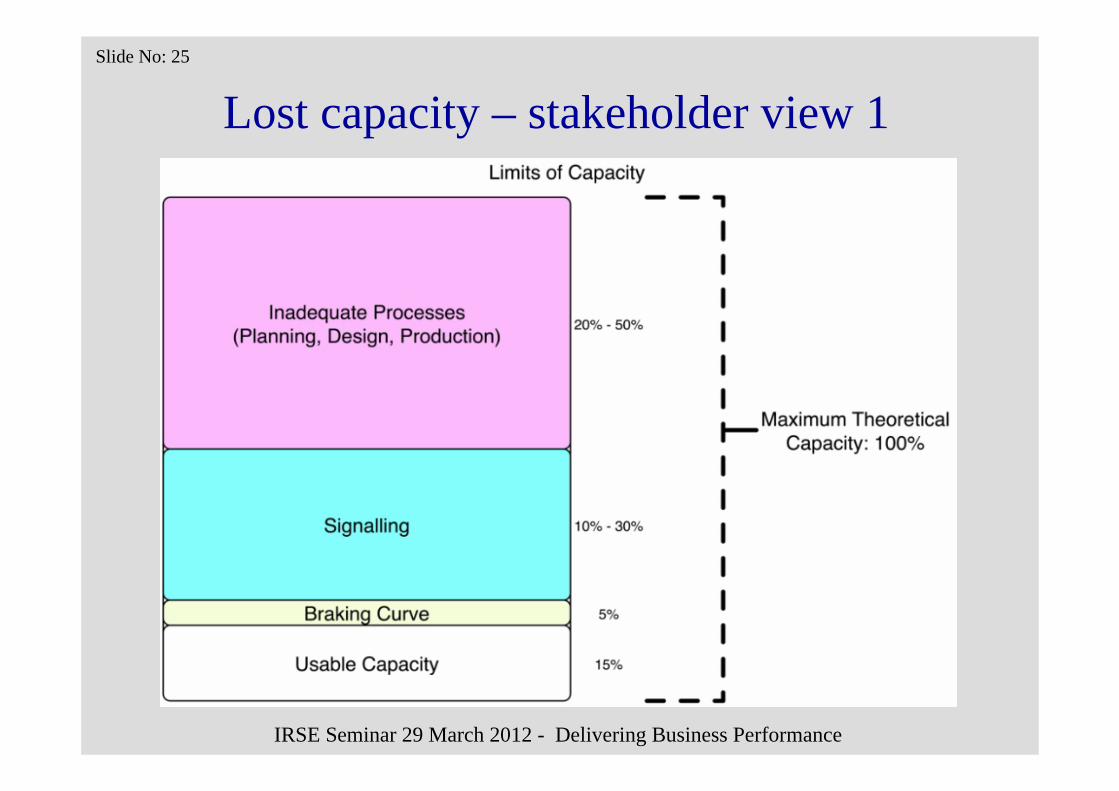
Lost capacity – stakeholder view 1

Slide No: 26
IRSE Seminar 29 March 2012 - Delivering Business Performance
Lost capacity – stakeholder view 2

Slide No: 27
IRSE Seminar 29 March 2012 - Delivering Business Performance
Lost capacity – stakeholder view 3

Slide No: 28
IRSE Seminar 29 March 2012 - Delivering Business Performance
Conclusions on capability• No single view;• Line- and route-specific characteristics;• Lack of systems approach and no easy-to-use
tools to support this.

System Capacity Examples:The bad, the ugly and the good!

Slide No: 30
IRSE Seminar 29 March 2012 - Delivering Business Performance
Heathrow Airtrack Project I

Slide No: 31
IRSE Seminar 29 March 2012 - Delivering Business Performance
Heathrow Airtrack Project II• A feasibility study to identify possible new rail
connections to Heathrow was carried out in 1984;
• In 2003, planning formally began;• A route, that became known as Airtrack, was
proposed to join Heathrow T5 with direct rail services to: Reading, Guildford and London Waterloo.
Slide No: 32
IRSE Seminar 29 March 2012 - Delivering Business Performance
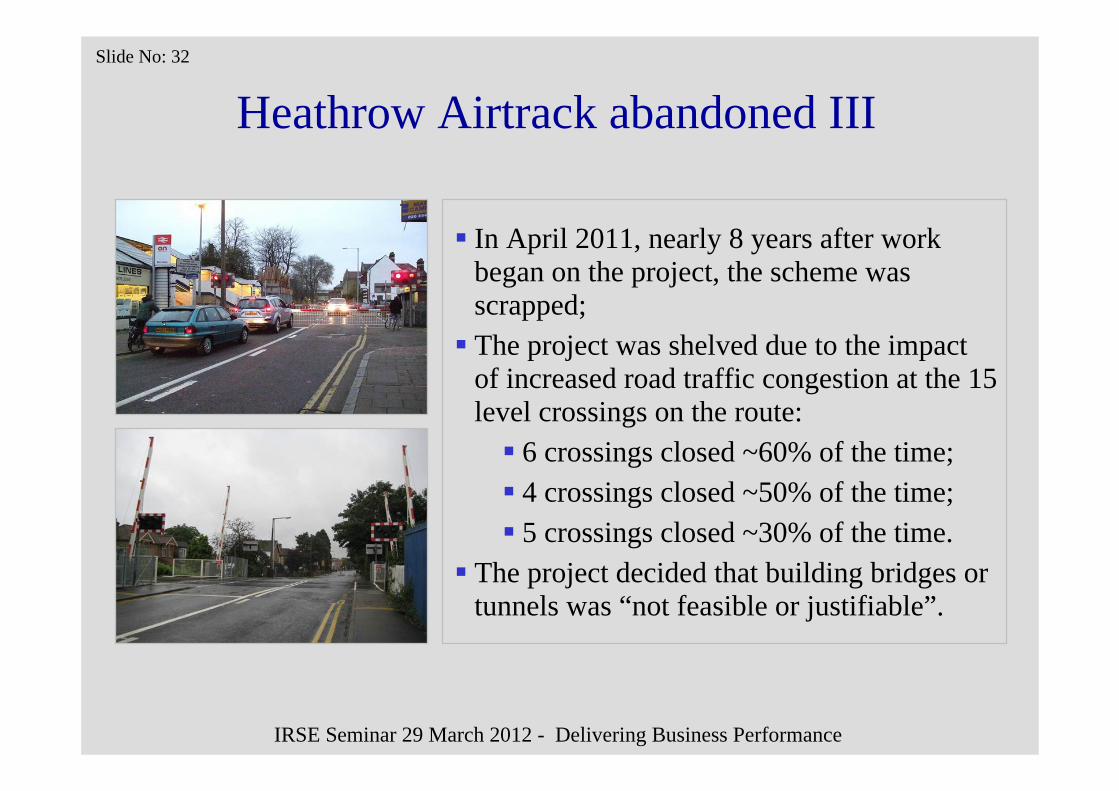
Heathrow Airtrack abandoned III
In April 2011, nearly 8 years after work began on the project, the scheme was scrapped;The project was shelved due to the impact of increased road traffic congestion at the 15 level crossings on the route:
6 crossings closed ~60% of the time;4 crossings closed ~50% of the time;5 crossings closed ~30% of the time.
The project decided that building bridges or tunnels was “not feasible or justifiable”.

Slide No: 33
IRSE Seminar 29 March 2012 - Delivering Business Performance
South West Trains upgrade programme I
In 2001, 785 new vehicles were ordered to replace South West Trains’ slam-door stock;
The new trains were to replace the existing out-dated rolling stock and improve capacity;
The new trains have a higher acceleration rate, which has a positive effect on capacity.

Slide No: 34
IRSE Seminar 29 March 2012 - Delivering Business Performance
South West Trains upgrade programme II
The introduction of the new fleet was delayed due to the power system not being capable of operating the proposed timetable for the new stock;Network Rail spent £1 billion upgrading the power supply to take account of this;In terms of capacity, the trains’ faster acceleration is in practice counterbalanced by the need to dwell longer at each station, as the trains have fewer doors;Since introduction, the trains’ interior layout has been remodelled to improve capacity.

Slide No: 35
IRSE Seminar 29 March 2012 - Delivering Business Performance
Chiltern Railways Project ‘Evergreen’ I
Since taking on the franchise in 1996, Chiltern committed to undertake a series of journey and capacity improvement projects;A whole-system approach has been taken to consider what upgrades have been required in each phase;The range of capability factors impacting on capacity that were addressed include:
Junction layout;Signalling;Line speed;Passenger handling facilities;Train characteristics.

Slide No: 36
IRSE Seminar 29 March 2012 - Delivering Business Performance
Chiltern Railways Project ‘Evergreen’ II
Evergreen 1 Doubling of line from Aynho Junction to Princes Riseborough; new platforms at Princes Riseborough and Haddenham and Thame ParkwayEvergreen 2 Realignment of the route through Beaconsfield to increase speed; improve signalling from High Wycombe to Bicester and from Princes Riseborough and Aylesbury; new platforms at MaryleboneEvergreen 3 (Phase 1) Junction remodelling at Neasden, Northolt and Aynho; a platform loop at Princes Riseborough; a turnback siding at Gerard’s Cross; removal of speed restrictions

Slide No: 37
IRSE Seminar 29 March 2012 - Delivering Business Performance
Systems approach to capacity – the issues:

Slide No: 38
IRSE Seminar 29 March 2012 - Delivering Business Performance
Maintenance needs;Timetable quality and punctuality;System complexity vs. Affordability;Reliability;Efficient use of infrastructure;Padding and recovery time;Data;Train fleet heterogeneity;Soft solutions;Regulations;Where and why do things go wrong;Innovation and maturity;Implementation of new approaches / systems.
Systems approach to capacity – the issues:
Approach to risk – radical solutions;Business case;Automated solutions;Effective use of technology;Resilience and security – degraded modes, less fragile systems;Interdependencies;Freight and passenger traffic trade-offs;Knowledge & history;Trade-offs – sensible, practical;....Peak movements – demand management;Metrics – what do we value?
Slide No: 39
IRSE Seminar 29 March 2012 - Delivering Business Performance
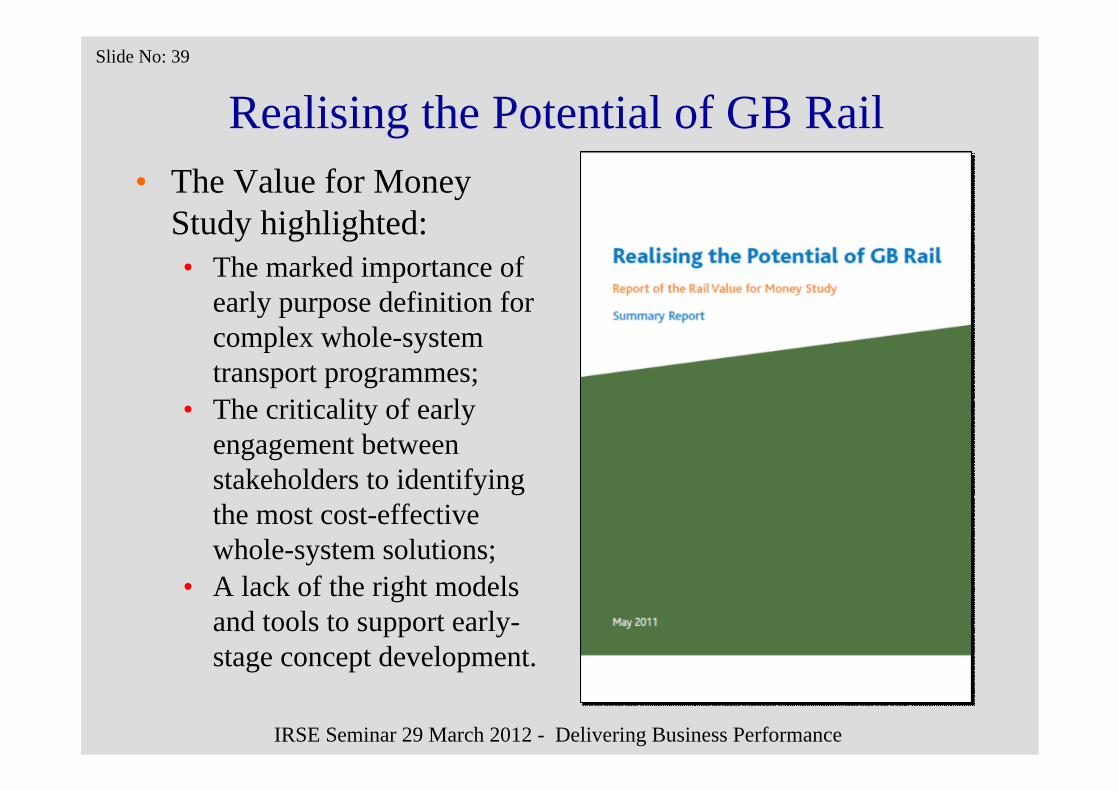
Realising the Potential of GB Rail• The Value for Money
Study highlighted:• The marked importance of
early purpose definition for complex whole-system transport programmes;
• The criticality of early engagement between stakeholders to identifying the most cost-effective whole-system solutions;
• A lack of the right models and tools to support early-stage concept development.

Slide No: 40
IRSE Seminar 29 March 2012 - Delivering Business Performance
Overall Strategy
System Requirements
Functional Decomposition
Technology decision
Detailed Design
Scheme Upgrade
Verification Process
Integration Process
Test of Subsystems
Test of System
Validate to Requirements
Micro simulation
Time
Decomposition
Macro view
Micro view
Macro simulation
Capturing current system
Integration
Increasing depth
When should capacity be considered?

Slide No: 41
IRSE Seminar 29 March 2012 - Delivering Business Performance
Typical project cost behaviour
20%
40%
60%
Pro
gram
me
Cos
t
80%
100%
Cost Incurred
Cost Committed
Cost Influence
Purpose Development Delivery OperateConcept
©A
tkin
s 201
1

Slide No: 42
IRSE Seminar 29 March 2012 - Delivering Business Performance
Committed cost – tunnel boring machines
©Th
omas
Sch
mid
, 201
1

Slide No: 43
IRSE Seminar 29 March 2012 - Delivering Business Performance
When should capacity be considered?
Strategic
assessment
Business
justification
Delivery
strategy
Investment
decision
Readiness
for service
Ops review
and benefits
realisation
Capability assessment1 2 3 4 5 6 7 8
Output
definition
Pre‐
feasibility
Option
selection
Single
option
selection
Detailed
design
Construct,
Test and
commission
Scheme
Hand
back
Project
Close
out
Railway system delivery

Slide No: 44
IRSE Seminar 29 March 2012 - Delivering Business Performance
“Macrosimulation”
•Gut instinct
Decision making approaches
Microsimulation
•RailSys
•PRIME
•OpenTrack
Macrosimulation
•???
Exhaustive
modelling
Slide No: 45
IRSE Seminar 29 March 2012 - Delivering Business Performance
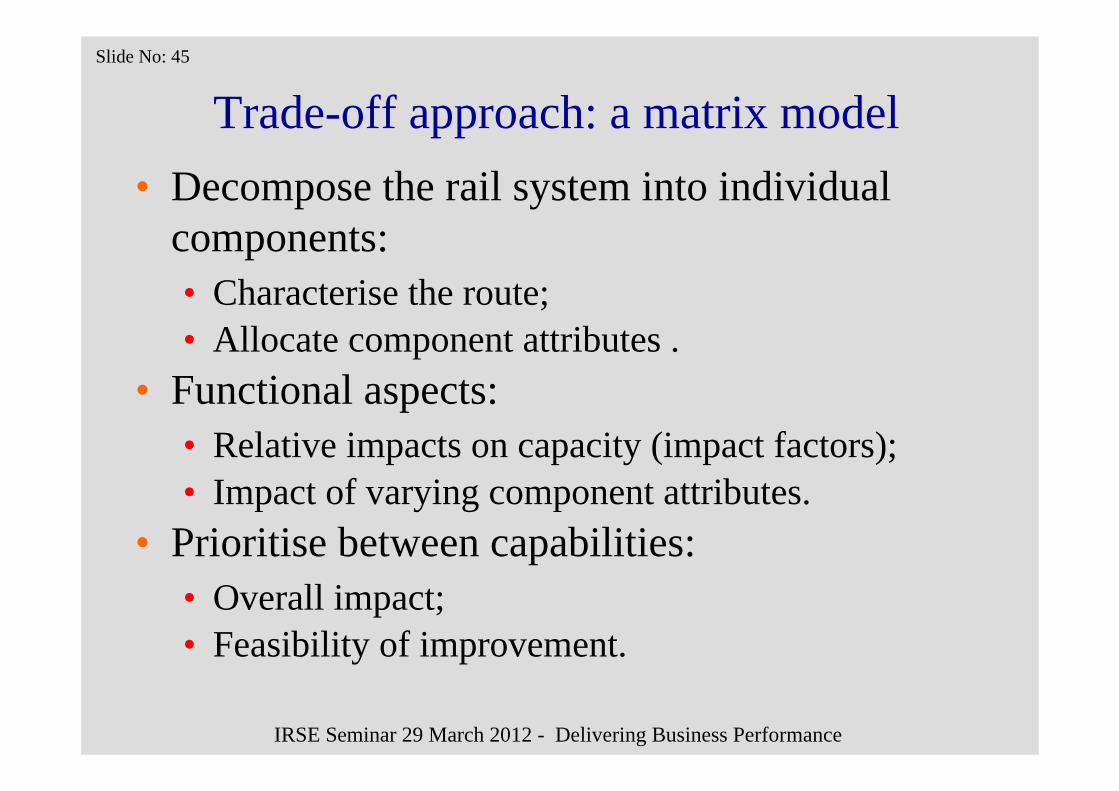
Trade-off approach: a matrix model• Decompose the rail system into individual
components: • Characterise the route;• Allocate component attributes .
• Functional aspects:• Relative impacts on capacity (impact factors);• Impact of varying component attributes.
• Prioritise between capabilities:• Overall impact;• Feasibility of improvement.

Slide No: 46
IRSE Seminar 29 March 2012 - Delivering Business Performance
Overall view of matrix model
Existing Condition (Value)
Railway Line Capacity
Overall Impact Score
Feasibility for Improvement
Combined Impact and Feasibility Score
Infrastructure Capacity or Timetable Capacity (Trains/hour)
Train Capacity (Passengers or Tonnes/Train)
Usable Capacity Minimum headway time
Regular recovery time Dwell time Waiting time Buffer time Special recovery time Train capacity (Carriages-
Wagons/train)
Carriage-Wagon capacity (Spaces/carriage or
Tonnes/wagon)Contextual ( G / I / B ) Financial ( H / M /
L ) Technical ( E / D )
10 3 1 1 1 2 1 5 3
Rail system
Railway Infrastructure
Track
Track Utilisation (CUI or Trains/track/hour) -
Track condition
Track Structure (Line Speed, mph) -
Min Curve (m) -
Max Gradient -
Station
Platform Utilisation (Trains/platform/hour) -
Platform Length -
Passenger Handling Facilities -
Junction Characteristics -
Distance between Stations/Junctions -
Power Supply -
Signalling -
Vehicle Fleet
Train Heterogeneity (Max/Min Speed Ratio) -
Train characteristics
Train Utilisation (Seat Occupancy) -
Car / Wagon Characteristics
Carriage Utilisation (Seat Occupacy) -
Door Characteristics -
Braking System (braking rate) -
Operations
Safety Rules -
Priority Rules -
Traction Type -
Environment Protection Rules -
Station Stops -
Public Performance Measure of Feeding -
Timetabling Techniques -
Maintenance Strategy -
Slide No: 47
IRSE Seminar 29 March 2012 - Delivering Business Performance
Decomposing the rail system
Rail System

Slide No: 48
IRSE Seminar 29 March 2012 - Delivering Business Performance
Decomposing the rail systemHigh-level components
Rail System
Rolling Stock OperationsInfrastructure

Slide No: 49
IRSE Seminar 29 March 2012 - Delivering Business Performance
Rail System
Vehicle fleet OperationsInfrastructure ???
High-level componentsDecomposing the rail system

Slide No: 50
IRSE Seminar 29 March 2012 - Delivering Business Performance
Decomposing the rail system
Rail System
Infrastructure
Signalling Power Supply StationTrack Junctions
Component attributes - infrastructure
Distance Stn/Jct

Slide No: 51
IRSE Seminar 29 March 2012 - Delivering Business Performance
Decomposing the rail system
Rail System
Infrastructure
Signalling Power Supply StationTrack Junctions Level
Crossings
Component attributes - infrastructure
Distance Stn/Jct

Slide No: 52
IRSE Seminar 29 March 2012 - Delivering Business Performance
Decomposing the rail system
Rail System
Infrastructure
Signalling Power Supply StationTrack Junctions Level
Crossings ???
Component attributes - infrastructure
Distance Stn/Jct
Slide No: 53
IRSE Seminar 29 March 2012 - Delivering Business Performance
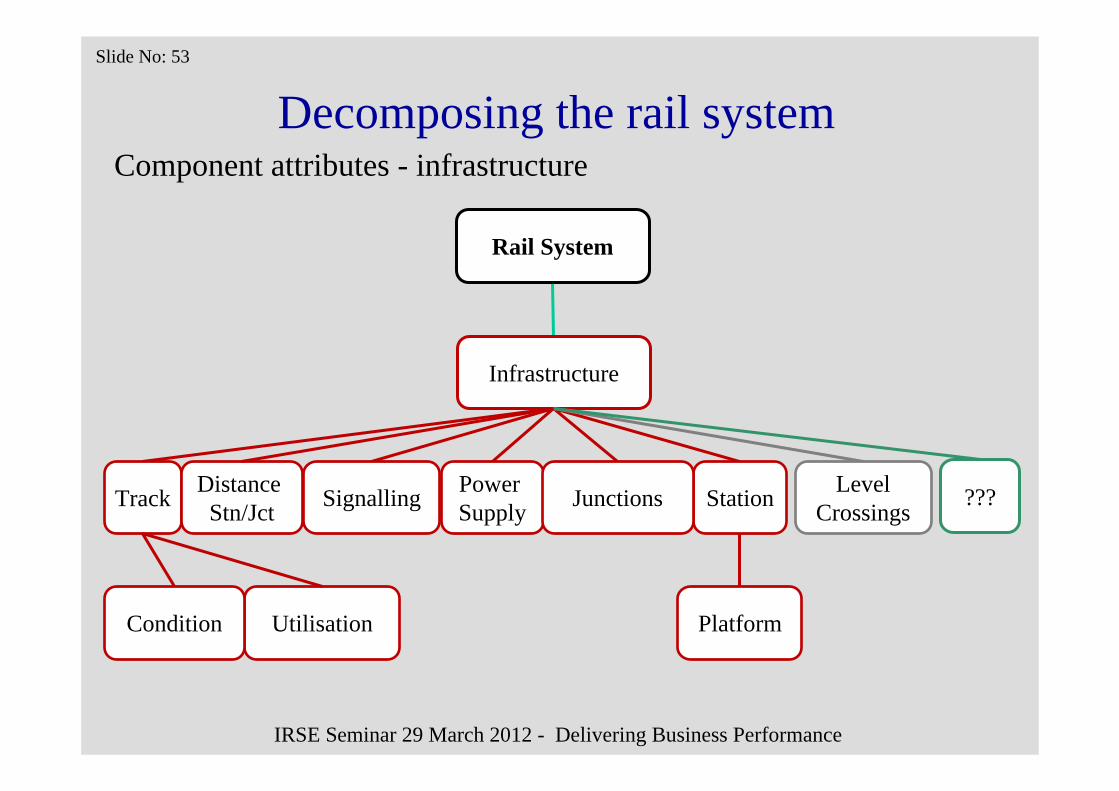
Decomposing the rail system
Rail System
Infrastructure
Signalling Power Supply StationTrack Junctions Level
Crossings ???
Component attributes - infrastructure
Distance Stn/Jct
UtilisationCondition Platform

Slide No: 54
IRSE Seminar 29 March 2012 - Delivering Business Performance
Decomposing the rail system
Rail System
Vehicle fleet
Heterogeneity Train characteristics
Car/WagonCharacteristics
BrakingSystem Utilisation
Component attributes – rolling stock
Min/Max
Speed ratioAcceleration

Slide No: 55
IRSE Seminar 29 March 2012 - Delivering Business Performance
Decomposing the rail system
Rail System
Operations
PriorityRules
PPM Adjacent sections
TimetablingTechniques
Safety Rules
StationStops
EnvironmentProtection
MaintenanceStrategy
Component attributes – operations
Electrical supply

Slide No: 56
IRSE Seminar 29 March 2012 - Delivering Business Performance
Functional decomposition
Railway Line
Rolling StockInfrastructure/Timetable
MinimumHeadway
RegularRecovery Time
UsableCapacity
DwellTime
BufferTime
WaitingTime
SpecialRecovery Time
Infrastructure or timetable capacity

Slide No: 57
IRSE Seminar 29 March 2012 - Delivering Business Performance
Functional decomposition
Railway Line
Rolling StockInfrastructure/Timetable
Number ofCarriages
Carriage/WagonCapacity
Train capacity

Slide No: 58
IRSE Seminar 29 March 2012 - Delivering Business Performance
Matrix model – rail system components

Slide No: 59
IRSE Seminar 29 March 2012 - Delivering Business Performance
Matrix model: functional impact factors

Slide No: 60
IRSE Seminar 29 March 2012 - Delivering Business Performance
Matrix model: prioritisation of options

Lei Chen, Linsha Dai, Menglei Lu, Clive RobertsFelix Schmid
BCRRE, University of Birmingham
And, finally, defining quality: an output of the project ON-TIME

Slide No: 62
IRSE Seminar 29 March 2012 - Delivering Business Performance

Slide No: 63
IRSE Seminar 29 March 2012 - Delivering Business Performance

Slide No: 64
IRSE Seminar 29 March 2012 - Delivering Business Performance
Objective measures for ON-TIME• Transport Volume:
• Passengers/section/time;• Tonnes /section/time;• Volume/section/time.
• Journey Time:• Journey time without
transfer times.• Connectivity:
• Interchange time between main services / modes.
• Punctuality:• Train delays at every stop;• Train delays at destination.
• Resilience:• Resistance to disruption;• Robustness;• Recoverability.
• Passenger Comfort:• Number of jerks;• Duration of accelerations.
• Energy:• Energy Consumption.
• Resource consumption:• Track usage;• Rolling stock usage;• Crew Usage.
Slide No: 65
IRSE Seminar 29 March 2012 - Delivering Business Performance
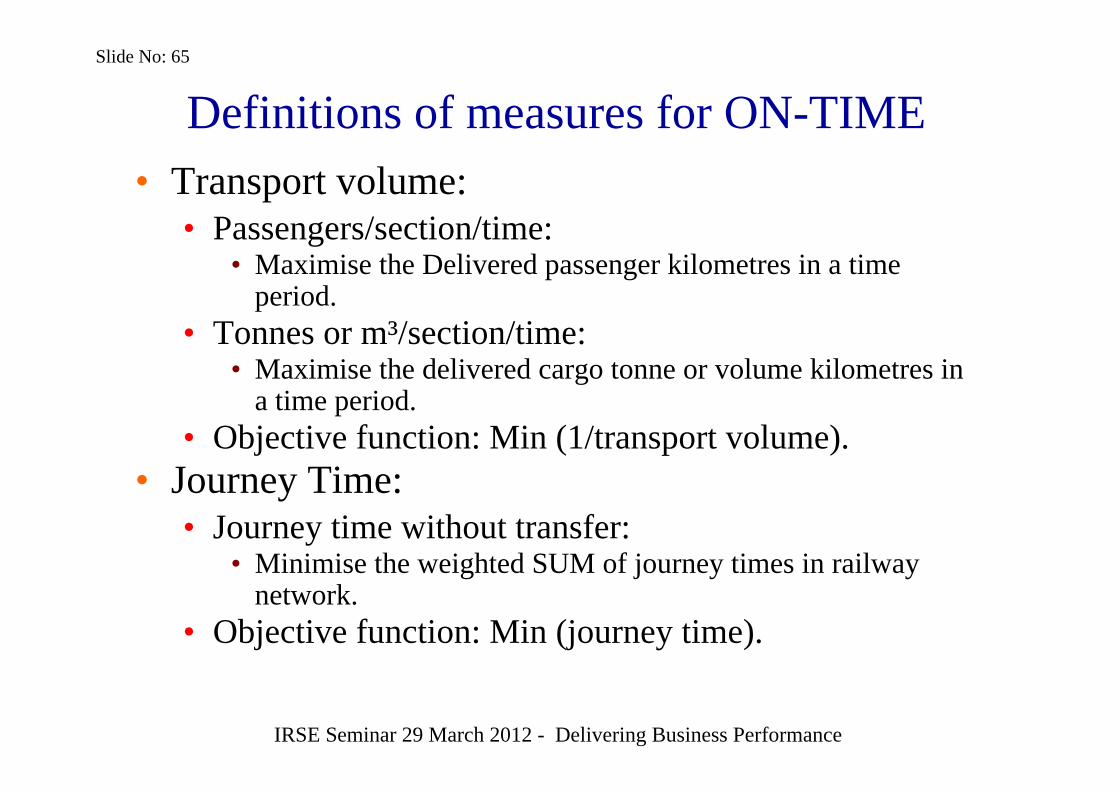
Definitions of measures for ON-TIME• Transport volume:
• Passengers/section/time:• Maximise the Delivered passenger kilometres in a time
period.• Tonnes or m³/section/time:
• Maximise the delivered cargo tonne or volume kilometres in a time period.
• Objective function: Min (1/transport volume).• Journey Time:
• Journey time without transfer:• Minimise the weighted SUM of journey times in railway
network.• Objective function: Min (journey time).
Slide No: 66
IRSE Seminar 29 March 2012 - Delivering Business Performance
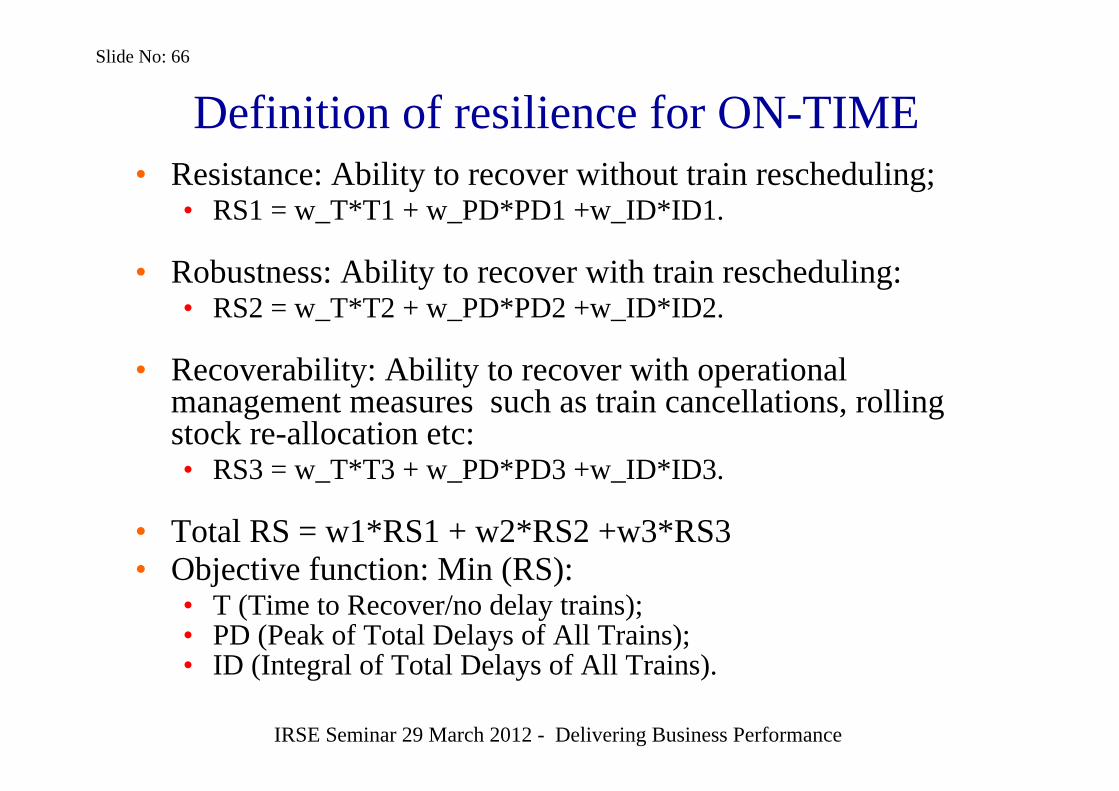
Definition of resilience for ON-TIME• Resistance: Ability to recover without train rescheduling;
• RS1 = w_T*T1 + w_PD*PD1 +w_ID*ID1.
• Robustness: Ability to recover with train rescheduling:• RS2 = w_T*T2 + w_PD*PD2 +w_ID*ID2.
• Recoverability: Ability to recover with operational management measures such as train cancellations, rolling stock re-allocation etc:• RS3 = w_T*T3 + w_PD*PD3 +w_ID*ID3.
• Total RS = w1*RS1 + w2*RS2 +w3*RS3• Objective function: Min (RS):
• T (Time to Recover/no delay trains);• PD (Peak of Total Delays of All Trains);• ID (Integral of Total Delays of All Trains).

Slide No: 67
IRSE Seminar 29 March 2012 - Delivering Business Performance© Charles Watson, 2011
Things are better with a good team!
Slide No: 68
IRSE Seminar 29 March 2012 - Delivering Business Performance
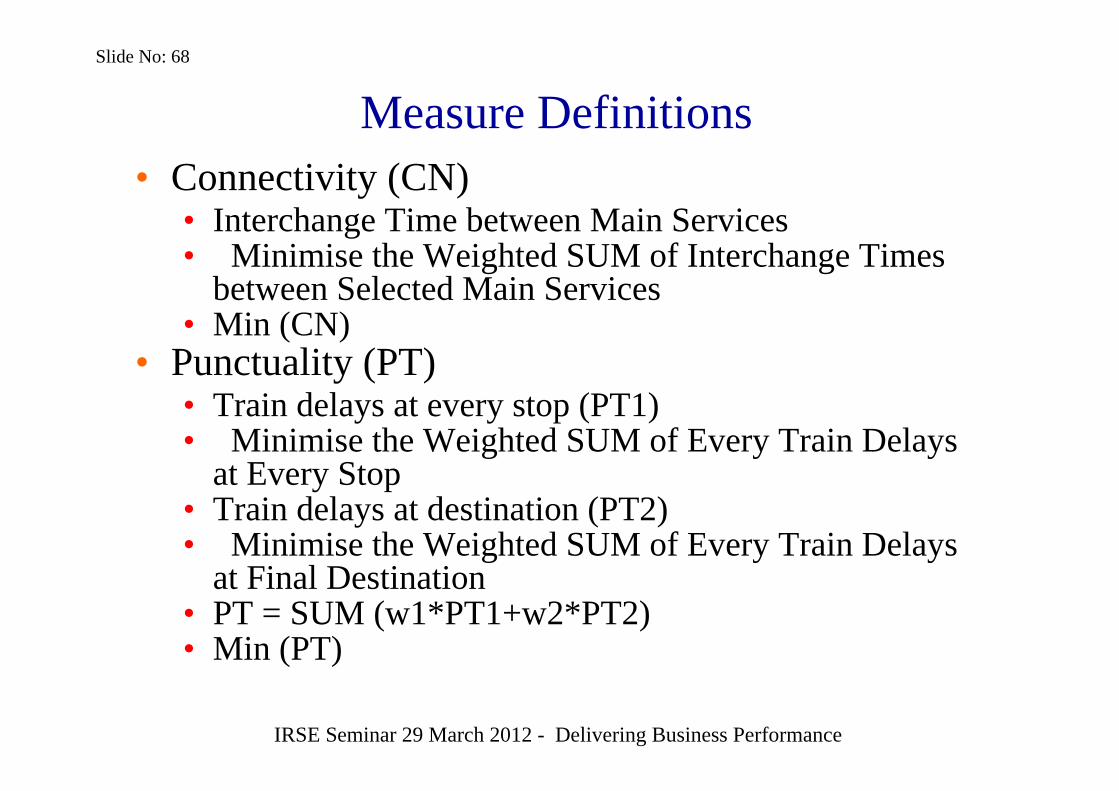
Measure Definitions• Connectivity (CN)
• Interchange Time between Main Services• Minimise the Weighted SUM of Interchange Times
between Selected Main Services • Min (CN)
• Punctuality (PT)• Train delays at every stop (PT1)• Minimise the Weighted SUM of Every Train Delays
at Every Stop• Train delays at destination (PT2)• Minimise the Weighted SUM of Every Train Delays
at Final Destination• PT = SUM (w1*PT1+w2*PT2)• Min (PT)