capacity analysis reports (synchro) - clark tcc and studies/northridge... · hcm signalized...
TRANSCRIPT
Appendix D
Capacity Analysis Reports (Synchro)

HCM Signalized Intersection Capacity Analysis
11: Home Road & SR 4 12/27/2011
Northridge Sub-Area Study 7:00 am 6/9/2011 AM Peak Existing Synchro 7 - Report
Page 1
Movement EBL EBT EBR WBL WBT WBR NBL NBT NBR SBL SBT SBR
Lane Configurations
Volume (vph) 20 77 10 21 100 162 14 110 14 267 313 41
Ideal Flow (vphpl) 1900 1900 1900 1900 1900 1900 1900 1900 1900 1900 1900 1900
Grade (%) 0% 3% 5% 0%
Total Lost time (s) 4.0 4.0 4.0 4.0 4.0 4.0 4.0 4.0
Lane Util. Factor 1.00 1.00 1.00 1.00 1.00 0.95 1.00 0.95
Frt 1.00 0.98 1.00 0.91 1.00 0.98 1.00 0.98
Flt Protected 0.95 1.00 0.95 1.00 0.95 1.00 0.95 1.00
Satd. Flow (prot) 1770 1831 1726 1648 1645 3232 1752 3443
Flt Permitted 0.55 1.00 0.69 1.00 0.52 1.00 0.66 1.00
Satd. Flow (perm) 1018 1831 1261 1648 899 3232 1226 3443
Peak-hour factor, PHF 0.90 0.90 0.90 0.90 0.90 0.90 0.90 0.90 0.90 0.90 0.90 0.90
Adj. Flow (vph) 22 86 11 23 111 180 16 122 16 297 348 46
RTOR Reduction (vph) 0 0 0 0 0 0 0 0 0 0 0 0
Lane Group Flow (vph) 22 97 0 23 291 0 16 138 0 297 394 0
Heavy Vehicles (%) 2% 2% 2% 3% 3% 3% 7% 7% 7% 3% 3% 3%
Turn Type Perm Perm Perm Perm
Protected Phases 4 8 2 6
Permitted Phases 4 8 2 6
Actuated Green, G (s) 11.9 11.9 11.9 11.9 15.1 15.1 15.1 15.1
Effective Green, g (s) 13.9 13.9 13.9 13.9 17.1 17.1 17.1 17.1
Actuated g/C Ratio 0.36 0.36 0.36 0.36 0.44 0.44 0.44 0.44
Clearance Time (s) 6.0 6.0 6.0 6.0 6.0 6.0 6.0 6.0
Vehicle Extension (s) 3.0 3.0 3.0 3.0 3.0 3.0 3.0 3.0
Lane Grp Cap (vph) 363 653 449 587 394 1417 538 1510
v/s Ratio Prot 0.05 c0.18 0.04 0.11
v/s Ratio Perm 0.02 0.02 0.02 c0.24
v/c Ratio 0.06 0.15 0.05 0.50 0.04 0.10 0.55 0.26
Uniform Delay, d1 8.3 8.5 8.2 9.8 6.3 6.4 8.1 6.9
Progression Factor 1.00 1.00 1.00 1.00 1.00 1.00 1.00 1.00
Incremental Delay, d2 0.1 0.1 0.0 0.7 0.2 0.1 4.0 0.4
Delay (s) 8.3 8.6 8.3 10.5 6.5 6.6 12.2 7.4
Level of Service A A A B A A B A
Approach Delay (s) 8.6 10.3 6.5 9.4
Approach LOS A B A A
Intersection Summary
HCM Average Control Delay 9.2 HCM Level of Service A
HCM Volume to Capacity ratio 0.53
Actuated Cycle Length (s) 39.0 Sum of lost time (s) 8.0
Intersection Capacity Utilization 44.9% ICU Level of Service A
Analysis Period (min) 15
c Critical Lane Group

HCM Signalized Intersection Capacity Analysis
38: Woeber Mustard Mfg & Urbana 12/27/2011
Northridge Sub-Area Study 7:00 am 6/9/2011 AM Peak Existing Synchro 7 - Report
Page 9
Movement EBL EBT EBR WBL WBT WBR NBL NBT NBR SBL SBT SBR
Lane Configurations
Volume (vph) 0 0 2 243 0 34 7 208 45 47 305 1
Ideal Flow (vphpl) 1900 1900 1900 1900 1900 1900 1900 1900 1900 1900 1900 1900
Lane Width 10 10 12 10 10 12 12 12 12 12 12 12
Total Lost time (s) 4.0 4.0 4.0 4.0 4.0 4.0 4.0 4.0
Lane Util. Factor 1.00 1.00 1.00 1.00 0.95 1.00 1.00 0.95
Frt 0.85 1.00 0.85 1.00 1.00 0.85 1.00 1.00
Flt Protected 1.00 0.95 1.00 0.95 1.00 1.00 0.95 1.00
Satd. Flow (prot) 1478 1652 1478 1770 3539 1583 1770 3538
Flt Permitted 1.00 0.76 1.00 0.55 1.00 1.00 0.57 1.00
Satd. Flow (perm) 1478 1315 1478 1019 3539 1583 1059 3538
Peak-hour factor, PHF 0.90 0.90 0.90 0.90 0.90 0.90 0.90 0.90 0.90 0.90 0.90 0.90
Adj. Flow (vph) 0 0 2 270 0 38 8 231 50 52 339 1
RTOR Reduction (vph) 0 0 0 0 0 0 0 0 0 0 0 0
Lane Group Flow (vph) 0 2 0 270 38 0 8 231 50 52 340 0
Turn Type Perm Perm pm+pt Perm pm+pt
Protected Phases 4 8 5 2 1 6
Permitted Phases 4 8 2 2 6
Actuated Green, G (s) 14.9 14.9 14.9 13.3 12.5 12.5 15.3 13.5
Effective Green, g (s) 16.9 16.9 16.9 17.3 14.5 14.5 19.3 15.5
Actuated g/C Ratio 0.36 0.36 0.36 0.37 0.31 0.31 0.41 0.33
Clearance Time (s) 6.0 6.0 6.0 6.0 6.0 6.0 6.0 6.0
Vehicle Extension (s) 3.0 3.0 3.0 3.0 3.0 3.0 3.0 3.0
Lane Grp Cap (vph) 529 471 529 418 1087 486 490 1162
v/s Ratio Prot 0.00 0.03 0.00 0.07 c0.01 c0.10
v/s Ratio Perm c0.21 0.01 0.03 0.03
v/c Ratio 0.00 0.57 0.07 0.02 0.21 0.10 0.11 0.29
Uniform Delay, d1 9.7 12.2 10.0 9.5 12.1 11.7 8.5 11.8
Progression Factor 1.00 1.00 1.00 1.00 1.00 1.00 1.00 1.00
Incremental Delay, d2 0.0 1.7 0.1 0.0 0.1 0.1 0.1 0.1
Delay (s) 9.7 13.9 10.0 9.5 12.2 11.8 8.6 11.9
Level of Service A B B A B B A B
Approach Delay (s) 9.7 13.4 12.1 11.5
Approach LOS A B B B
Intersection Summary
HCM Average Control Delay 12.3 HCM Level of Service B
HCM Volume to Capacity ratio 0.37
Actuated Cycle Length (s) 47.2 Sum of lost time (s) 8.0
Intersection Capacity Utilization 43.6% ICU Level of Service A
Analysis Period (min) 15
c Critical Lane Group
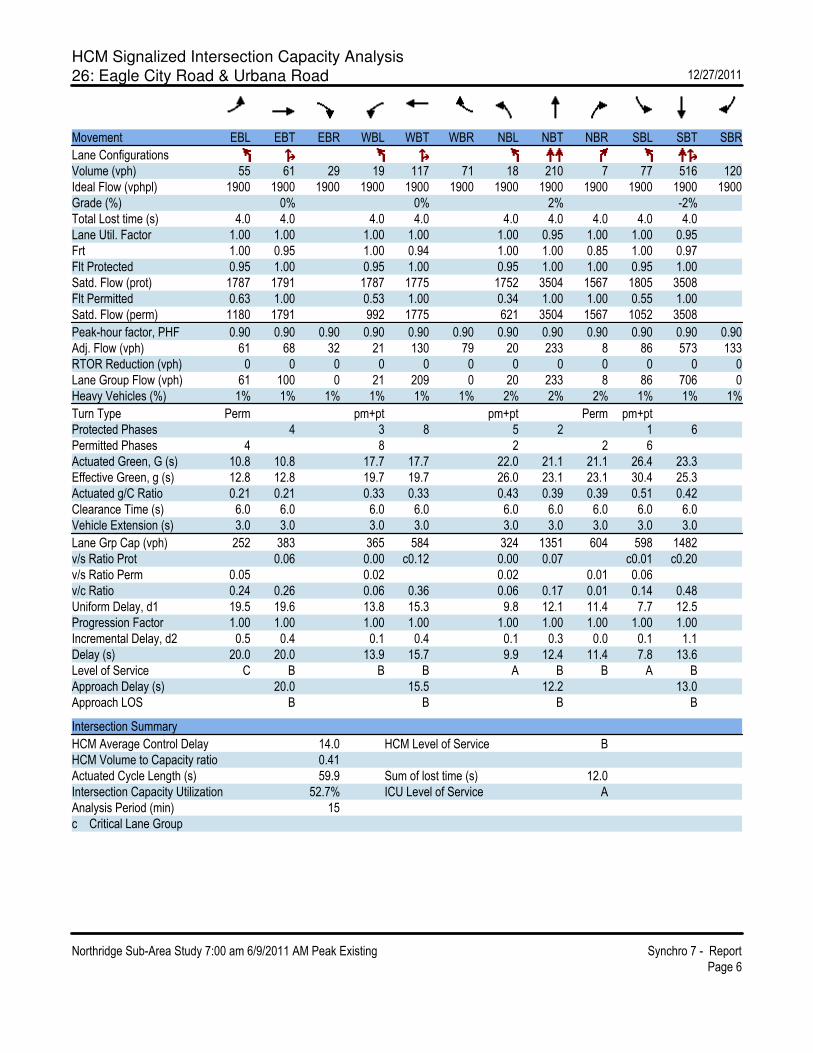
HCM Signalized Intersection Capacity Analysis
26: Eagle City Road & Urbana Road 12/27/2011
Northridge Sub-Area Study 7:00 am 6/9/2011 AM Peak Existing Synchro 7 - Report
Page 6
Movement EBL EBT EBR WBL WBT WBR NBL NBT NBR SBL SBT SBR
Lane Configurations
Volume (vph) 55 61 29 19 117 71 18 210 7 77 516 120
Ideal Flow (vphpl) 1900 1900 1900 1900 1900 1900 1900 1900 1900 1900 1900 1900
Grade (%) 0% 0% 2% -2%
Total Lost time (s) 4.0 4.0 4.0 4.0 4.0 4.0 4.0 4.0 4.0
Lane Util. Factor 1.00 1.00 1.00 1.00 1.00 0.95 1.00 1.00 0.95
Frt 1.00 0.95 1.00 0.94 1.00 1.00 0.85 1.00 0.97
Flt Protected 0.95 1.00 0.95 1.00 0.95 1.00 1.00 0.95 1.00
Satd. Flow (prot) 1787 1791 1787 1775 1752 3504 1567 1805 3508
Flt Permitted 0.63 1.00 0.53 1.00 0.34 1.00 1.00 0.55 1.00
Satd. Flow (perm) 1180 1791 992 1775 621 3504 1567 1052 3508
Peak-hour factor, PHF 0.90 0.90 0.90 0.90 0.90 0.90 0.90 0.90 0.90 0.90 0.90 0.90
Adj. Flow (vph) 61 68 32 21 130 79 20 233 8 86 573 133
RTOR Reduction (vph) 0 0 0 0 0 0 0 0 0 0 0 0
Lane Group Flow (vph) 61 100 0 21 209 0 20 233 8 86 706 0
Heavy Vehicles (%) 1% 1% 1% 1% 1% 1% 2% 2% 2% 1% 1% 1%
Turn Type Perm pm+pt pm+pt Perm pm+pt
Protected Phases 4 3 8 5 2 1 6
Permitted Phases 4 8 2 2 6
Actuated Green, G (s) 10.8 10.8 17.7 17.7 22.0 21.1 21.1 26.4 23.3
Effective Green, g (s) 12.8 12.8 19.7 19.7 26.0 23.1 23.1 30.4 25.3
Actuated g/C Ratio 0.21 0.21 0.33 0.33 0.43 0.39 0.39 0.51 0.42
Clearance Time (s) 6.0 6.0 6.0 6.0 6.0 6.0 6.0 6.0 6.0
Vehicle Extension (s) 3.0 3.0 3.0 3.0 3.0 3.0 3.0 3.0 3.0
Lane Grp Cap (vph) 252 383 365 584 324 1351 604 598 1482
v/s Ratio Prot 0.06 0.00 c0.12 0.00 0.07 c0.01 c0.20
v/s Ratio Perm 0.05 0.02 0.02 0.01 0.06
v/c Ratio 0.24 0.26 0.06 0.36 0.06 0.17 0.01 0.14 0.48
Uniform Delay, d1 19.5 19.6 13.8 15.3 9.8 12.1 11.4 7.7 12.5
Progression Factor 1.00 1.00 1.00 1.00 1.00 1.00 1.00 1.00 1.00
Incremental Delay, d2 0.5 0.4 0.1 0.4 0.1 0.3 0.0 0.1 1.1
Delay (s) 20.0 20.0 13.9 15.7 9.9 12.4 11.4 7.8 13.6
Level of Service C B B B A B B A B
Approach Delay (s) 20.0 15.5 12.2 13.0
Approach LOS B B B B
Intersection Summary
HCM Average Control Delay 14.0 HCM Level of Service B
HCM Volume to Capacity ratio 0.41
Actuated Cycle Length (s) 59.9 Sum of lost time (s) 12.0
Intersection Capacity Utilization 52.7% ICU Level of Service A
Analysis Period (min) 15
c Critical Lane Group

HCM Signalized Intersection Capacity Analysis
19: Villa Road & Middle Urbana Road 12/27/2011
Northridge Sub-Area Study 7:00 am 6/9/2011 AM Peak Existing Synchro 7 - Report
Page 3
Movement EBL EBT EBR WBL WBT WBR NBL NBT NBR SBL SBT SBR
Lane Configurations
Volume (vph) 148 50 60 5 55 16 63 221 4 2 320 155
Ideal Flow (vphpl) 1900 1900 1900 1900 1900 1900 1900 1900 1900 1900 1900 1900
Lane Width 12 10 13 12 10 12 12 12 12 12 12 12
Total Lost time (s) 4.0 4.0 4.0 4.0 4.0 4.0 4.0 4.0
Lane Util. Factor 1.00 1.00 1.00 1.00 1.00 1.00 1.00 1.00
Frt 1.00 1.00 0.85 0.97 1.00 1.00 1.00 0.95
Flt Protected 0.95 1.00 1.00 1.00 0.95 1.00 0.95 1.00
Satd. Flow (prot) 1805 1773 1669 1717 1805 1895 1805 1807
Flt Permitted 0.95 1.00 1.00 1.00 0.23 1.00 0.60 1.00
Satd. Flow (perm) 1805 1773 1669 1717 440 1895 1148 1807
Peak-hour factor, PHF 0.90 0.90 0.90 0.90 0.90 0.90 0.90 0.90 0.90 0.90 0.90 0.90
Adj. Flow (vph) 164 56 67 6 61 18 70 246 4 2 356 172
RTOR Reduction (vph) 0 0 0 0 0 0 0 0 0 0 0 0
Lane Group Flow (vph) 164 56 67 0 85 0 70 250 0 2 528 0
Heavy Vehicles (%) 0% 0% 0% 0% 0% 0% 0% 0% 0% 0% 0% 0%
Turn Type Split Perm Split pm+pt pm+pt
Protected Phases 4 4 8 8 5 2 1 6
Permitted Phases 4 2 6
Actuated Green, G (s) 12.0 12.0 12.0 7.6 39.8 35.2 32.6 31.6
Effective Green, g (s) 14.0 14.0 14.0 9.6 43.8 37.2 36.6 33.6
Actuated g/C Ratio 0.18 0.18 0.18 0.12 0.55 0.47 0.46 0.42
Clearance Time (s) 6.0 6.0 6.0 6.0 6.0 6.0 6.0 6.0
Vehicle Extension (s) 3.0 3.0 3.0 3.0 3.0 3.0 3.0 3.0
Lane Grp Cap (vph) 317 311 293 207 354 883 551 761
v/s Ratio Prot c0.09 0.03 c0.05 c0.02 0.13 0.00 c0.29
v/s Ratio Perm 0.04 0.09 0.00
v/c Ratio 0.52 0.18 0.23 0.41 0.20 0.28 0.00 0.69
Uniform Delay, d1 29.8 28.0 28.3 32.5 10.8 13.1 11.7 18.9
Progression Factor 1.00 1.00 1.00 1.00 1.00 1.00 1.00 1.00
Incremental Delay, d2 1.4 0.3 0.4 1.3 0.3 0.8 0.0 5.2
Delay (s) 31.3 28.3 28.7 33.8 11.1 13.9 11.7 24.1
Level of Service C C C C B B B C
Approach Delay (s) 30.1 33.8 13.3 24.0
Approach LOS C C B C
Intersection Summary
HCM Average Control Delay 23.3 HCM Level of Service C
HCM Volume to Capacity ratio 0.60
Actuated Cycle Length (s) 79.8 Sum of lost time (s) 20.0
Intersection Capacity Utilization 56.2% ICU Level of Service B
Analysis Period (min) 15
c Critical Lane Group

HCM Signalized Intersection Capacity Analysis
41: Emmanuel Way & Middle Urbana Road 12/27/2011
Northridge Sub-Area Study 7:00 am 6/9/2011 AM Peak Existing Synchro 7 - Report
Page 10
Movement WBL WBR NBT NBR SBL SBT
Lane Configurations
Volume (vph) 94 49 210 116 94 320
Ideal Flow (vphpl) 1900 1900 1900 1900 1900 1900
Lane Width 10 10 12 12 10 10
Total Lost time (s) 4.0 4.0 4.0 4.0 4.0
Lane Util. Factor 1.00 1.00 1.00 1.00 1.00
Frt 1.00 0.85 0.95 1.00 1.00
Flt Protected 0.95 1.00 1.00 0.95 1.00
Satd. Flow (prot) 1652 1478 1773 1652 1739
Flt Permitted 0.95 1.00 1.00 0.39 1.00
Satd. Flow (perm) 1652 1478 1773 683 1739
Peak-hour factor, PHF 0.90 0.90 0.90 0.90 0.90 0.90
Adj. Flow (vph) 104 54 233 129 104 356
RTOR Reduction (vph) 0 0 0 0 0 0
Lane Group Flow (vph) 104 54 362 0 104 356
Turn Type Perm pm+pt
Protected Phases 8 2 1 6
Permitted Phases 8 6
Actuated Green, G (s) 6.7 6.7 18.4 28.8 28.8
Effective Green, g (s) 8.7 8.7 20.4 30.8 30.8
Actuated g/C Ratio 0.18 0.18 0.43 0.65 0.65
Clearance Time (s) 6.0 6.0 6.0 6.0 6.0
Vehicle Extension (s) 3.0 3.0 3.0 3.0 3.0
Lane Grp Cap (vph) 303 271 761 573 1128
v/s Ratio Prot c0.06 c0.20 0.02 c0.20
v/s Ratio Perm 0.04 0.09
v/c Ratio 0.34 0.20 0.48 0.18 0.32
Uniform Delay, d1 16.9 16.4 9.7 3.7 3.7
Progression Factor 1.00 1.00 1.00 1.00 1.00
Incremental Delay, d2 0.7 0.4 0.5 0.2 0.2
Delay (s) 17.6 16.8 10.2 3.8 3.9
Level of Service B B B A A
Approach Delay (s) 17.3 10.2 3.8
Approach LOS B B A
Intersection Summary
HCM Average Control Delay 8.4 HCM Level of Service A
HCM Volume to Capacity ratio 0.43
Actuated Cycle Length (s) 47.5 Sum of lost time (s) 12.0
Intersection Capacity Utilization 39.2% ICU Level of Service A
Analysis Period (min) 15
c Critical Lane Group

HCM Signalized Intersection Capacity Analysis
21: SR 334 & Middle Urbana Road 12/27/2011
Northridge Sub-Area Study 7:00 am 6/9/2011 AM Peak Existing Synchro 7 - Report
Page 4
Movement EBL EBT EBR WBL WBT WBR NBL NBT NBR SBL SBT SBR
Lane Configurations
Volume (vph) 78 63 91 16 98 27 73 176 10 19 308 120
Ideal Flow (vphpl) 1900 1900 1900 1900 1900 1900 1900 1900 1900 1900 1900 1900
Total Lost time (s) 4.0 4.0 4.0 4.0 4.0 4.0 4.0 4.0
Lane Util. Factor 1.00 1.00 1.00 1.00 1.00 1.00 1.00 1.00
Frt 1.00 0.91 1.00 0.97 1.00 0.99 1.00 0.96
Flt Protected 0.95 1.00 0.95 1.00 0.95 1.00 0.95 1.00
Satd. Flow (prot) 1703 1634 1656 1687 1770 1848 1770 1785
Flt Permitted 0.67 1.00 0.65 1.00 0.44 1.00 0.63 1.00
Satd. Flow (perm) 1198 1634 1131 1687 818 1848 1170 1785
Peak-hour factor, PHF 0.90 0.90 0.90 0.90 0.90 0.90 0.90 0.90 0.90 0.90 0.90 0.90
Adj. Flow (vph) 87 70 101 18 109 30 81 196 11 21 342 133
RTOR Reduction (vph) 0 0 0 0 0 0 0 0 0 0 0 0
Lane Group Flow (vph) 87 171 0 18 139 0 81 207 0 21 475 0
Heavy Vehicles (%) 6% 6% 6% 9% 9% 9% 2% 2% 2% 2% 2% 2%
Turn Type Perm Perm Perm Perm
Protected Phases 4 8 2 6
Permitted Phases 4 8 2 6
Actuated Green, G (s) 8.0 8.0 8.0 8.0 21.1 21.1 21.1 21.1
Effective Green, g (s) 10.0 10.0 10.0 10.0 23.1 23.1 23.1 23.1
Actuated g/C Ratio 0.24 0.24 0.24 0.24 0.56 0.56 0.56 0.56
Clearance Time (s) 6.0 6.0 6.0 6.0 6.0 6.0 6.0 6.0
Vehicle Extension (s) 3.0 3.0 3.0 3.0 3.0 3.0 3.0 3.0
Lane Grp Cap (vph) 291 398 275 410 460 1039 658 1003
v/s Ratio Prot c0.10 0.08 0.11 c0.27
v/s Ratio Perm 0.07 0.02 0.10 0.02
v/c Ratio 0.30 0.43 0.07 0.34 0.18 0.20 0.03 0.47
Uniform Delay, d1 12.7 13.1 12.0 12.8 4.4 4.4 4.0 5.4
Progression Factor 1.00 1.00 1.00 1.00 1.00 1.00 1.00 1.00
Incremental Delay, d2 0.6 0.7 0.1 0.5 0.8 0.4 0.1 1.6
Delay (s) 13.3 13.9 12.1 13.3 5.2 4.9 4.1 7.0
Level of Service B B B B A A A A
Approach Delay (s) 13.7 13.2 5.0 6.9
Approach LOS B B A A
Intersection Summary
HCM Average Control Delay 8.7 HCM Level of Service A
HCM Volume to Capacity ratio 0.46
Actuated Cycle Length (s) 41.1 Sum of lost time (s) 8.0
Intersection Capacity Utilization 57.4% ICU Level of Service B
Analysis Period (min) 15
c Critical Lane Group

HCM Signalized Intersection Capacity Analysis
22: Moorefield Road & Middle Urbana Road 12/27/2011
Northridge Sub-Area Study 7:00 am 6/9/2011 AM Peak Existing Synchro 7 - Report
Page 5
Movement EBL EBT EBR WBL WBT WBR NBL NBT NBR SBL SBT SBR
Lane Configurations
Volume (vph) 25 113 76 76 122 20 49 47 47 25 116 27
Ideal Flow (vphpl) 1900 1900 1900 1900 1900 1900 1900 1900 1900 1900 1900 1900
Lane Width 12 12 12 12 12 12 12 11 12 12 11 12
Total Lost time (s) 4.0 4.0 4.0 4.0 4.0
Lane Util. Factor 1.00 1.00 1.00 1.00 1.00
Frt 1.00 0.85 0.99 0.96 0.98
Flt Protected 0.99 1.00 0.98 0.98 0.99
Satd. Flow (prot) 1864 1599 1826 1726 1784
Flt Permitted 0.91 1.00 0.83 0.86 0.95
Satd. Flow (perm) 1709 1599 1551 1517 1703
Peak-hour factor, PHF 0.90 0.90 0.90 0.90 0.90 0.90 0.90 0.90 0.90 0.90 0.90 0.90
Adj. Flow (vph) 28 126 84 84 136 22 54 52 52 28 129 30
RTOR Reduction (vph) 0 0 0 0 0 0 0 0 0 0 0 0
Lane Group Flow (vph) 0 154 84 0 242 0 0 158 0 0 187 0
Heavy Vehicles (%) 1% 1% 1% 1% 1% 1% 0% 0% 0% 0% 0% 0%
Turn Type Perm Perm Perm Perm Perm
Protected Phases 4 8 2 6
Permitted Phases 4 4 8 2 6
Actuated Green, G (s) 11.3 11.3 11.3 18.1 18.1
Effective Green, g (s) 13.3 13.3 13.3 20.1 20.1
Actuated g/C Ratio 0.32 0.32 0.32 0.49 0.49
Clearance Time (s) 6.0 6.0 6.0 6.0 6.0
Vehicle Extension (s) 3.0 3.0 3.0 3.0 3.0
Lane Grp Cap (vph) 549 514 498 737 827
v/s Ratio Prot
v/s Ratio Perm 0.09 0.05 c0.16 0.10 c0.11
v/c Ratio 0.28 0.16 0.49 0.21 0.23
Uniform Delay, d1 10.5 10.1 11.3 6.1 6.2
Progression Factor 1.00 1.00 1.00 1.00 1.00
Incremental Delay, d2 0.3 0.2 0.7 0.7 0.6
Delay (s) 10.8 10.2 12.0 6.8 6.8
Level of Service B B B A A
Approach Delay (s) 10.6 12.0 6.8 6.8
Approach LOS B B A A
Intersection Summary
HCM Average Control Delay 9.4 HCM Level of Service A
HCM Volume to Capacity ratio 0.33
Actuated Cycle Length (s) 41.4 Sum of lost time (s) 8.0
Intersection Capacity Utilization 41.0% ICU Level of Service A
Analysis Period (min) 15
c Critical Lane Group

HCM Signalized Intersection Capacity Analysis
44: Providence & Derr Road 12/27/2011
Northridge Sub-Area Study 7:00 am 6/9/2011 AM Peak Existing Synchro 7 - Report
Page 11
Movement WBL WBR NBT NBR SBL SBT
Lane Configurations
Volume (vph) 103 44 257 16 17 439
Ideal Flow (vphpl) 1900 1900 1900 1900 1900 1900
Lane Width 16 12 11 11 11 11
Total Lost time (s) 4.0 4.0 4.0 4.0
Lane Util. Factor 1.00 0.95 1.00 0.95
Frt 0.96 0.99 1.00 1.00
Flt Protected 0.97 1.00 0.95 1.00
Satd. Flow (prot) 1957 3391 1711 3421
Flt Permitted 0.97 1.00 0.57 1.00
Satd. Flow (perm) 1957 3391 1020 3421
Peak-hour factor, PHF 0.90 0.90 0.90 0.90 0.90 0.90
Adj. Flow (vph) 114 49 286 18 19 488
RTOR Reduction (vph) 0 0 0 0 0 0
Lane Group Flow (vph) 163 0 304 0 19 488
Turn Type Perm
Protected Phases 8 2 6
Permitted Phases 6
Actuated Green, G (s) 6.0 7.0 7.0 7.0
Effective Green, g (s) 8.0 9.0 9.0 9.0
Actuated g/C Ratio 0.32 0.36 0.36 0.36
Clearance Time (s) 6.0 6.0 6.0 6.0
Vehicle Extension (s) 3.0 3.0 3.0 3.0
Lane Grp Cap (vph) 626 1221 367 1232
v/s Ratio Prot c0.08 0.09 c0.14
v/s Ratio Perm 0.02
v/c Ratio 0.26 0.25 0.05 0.40
Uniform Delay, d1 6.3 5.6 5.2 6.0
Progression Factor 1.00 1.00 1.00 1.00
Incremental Delay, d2 0.2 0.1 0.1 0.2
Delay (s) 6.5 5.7 5.3 6.2
Level of Service A A A A
Approach Delay (s) 6.5 5.7 6.1
Approach LOS A A A
Intersection Summary
HCM Average Control Delay 6.1 HCM Level of Service A
HCM Volume to Capacity ratio 0.33
Actuated Cycle Length (s) 25.0 Sum of lost time (s) 8.0
Intersection Capacity Utilization 29.2% ICU Level of Service A
Analysis Period (min) 15
c Critical Lane Group

HCM Signalized Intersection Capacity Analysis
27: Villa Road & Derr Road 12/27/2011
Northridge Sub-Area Study 7:00 am 6/9/2011 AM Peak Existing Synchro 7 - Report
Page 7
Movement EBL EBT EBR WBL WBT WBR NBL NBT NBR SBL SBT SBR
Lane Configurations
Volume (vph) 29 100 71 62 250 31 88 55 48 70 208 92
Ideal Flow (vphpl) 1900 1900 1900 1900 1900 1900 1900 1900 1900 1900 1900 1900
Lane Width 10 12 12 12 12 12 11 12 11 12 12 12
Total Lost time (s) 4.0 4.0 4.0 4.0 4.0 4.0 4.0 4.0 4.0
Lane Util. Factor 1.00 0.95 1.00 1.00 1.00 1.00 1.00 1.00 1.00
Frt 1.00 0.94 1.00 0.98 1.00 1.00 0.85 1.00 0.95
Flt Protected 0.95 1.00 0.95 1.00 0.95 1.00 1.00 0.95 1.00
Satd. Flow (prot) 1685 3385 1805 1869 1745 1900 1561 1805 1813
Flt Permitted 0.31 1.00 0.63 1.00 0.42 1.00 1.00 0.72 1.00
Satd. Flow (perm) 550 3385 1201 1869 772 1900 1561 1363 1813
Peak-hour factor, PHF 0.90 0.90 0.90 0.90 0.90 0.90 0.90 0.90 0.90 0.90 0.90 0.90
Adj. Flow (vph) 32 111 79 69 278 34 98 61 53 78 231 102
RTOR Reduction (vph) 0 0 0 0 0 0 0 0 0 0 0 0
Lane Group Flow (vph) 32 190 0 69 312 0 98 61 53 78 333 0
Heavy Vehicles (%) 0% 0% 0% 0% 0% 0% 0% 0% 0% 0% 0% 0%
Turn Type pm+pt pm+pt pm+pt Perm pm+pt
Protected Phases 7 4 3 8 5 2 1 6
Permitted Phases 4 8 2 2 6
Actuated Green, G (s) 12.9 10.9 22.1 15.5 26.5 22.0 22.0 26.5 22.0
Effective Green, g (s) 16.9 12.9 25.5 17.5 30.5 24.0 24.0 30.5 24.0
Actuated g/C Ratio 0.25 0.19 0.38 0.26 0.45 0.35 0.35 0.45 0.35
Clearance Time (s) 6.0 6.0 6.0 6.0 6.0 6.0 6.0 6.0 6.0
Vehicle Extension (s) 3.0 3.0 3.0 3.0 3.0 3.0 3.0 3.0 3.0
Lane Grp Cap (vph) 203 642 527 481 439 671 551 654 640
v/s Ratio Prot 0.01 0.06 c0.02 c0.17 c0.02 0.03 0.01 c0.18
v/s Ratio Perm 0.03 0.03 0.08 0.03 0.04
v/c Ratio 0.16 0.30 0.13 0.65 0.22 0.09 0.10 0.12 0.52
Uniform Delay, d1 25.2 23.7 14.1 22.5 11.2 14.7 14.7 10.8 17.4
Progression Factor 1.00 1.00 1.00 1.00 1.00 1.00 1.00 1.00 1.00
Incremental Delay, d2 0.4 0.3 0.1 3.0 0.3 0.3 0.3 0.1 3.0
Delay (s) 25.6 23.9 14.2 25.5 11.5 15.0 15.1 10.9 20.4
Level of Service C C B C B B B B C
Approach Delay (s) 24.1 23.5 13.4 18.6
Approach LOS C C B B
Intersection Summary
HCM Average Control Delay 20.2 HCM Level of Service C
HCM Volume to Capacity ratio 0.47
Actuated Cycle Length (s) 68.0 Sum of lost time (s) 12.0
Intersection Capacity Utilization 54.9% ICU Level of Service A
Analysis Period (min) 15
c Critical Lane Group

HCM Signalized Intersection Capacity Analysis
28: SR 334 & Derr Road 12/27/2011
Northridge Sub-Area Study 7:00 am 6/9/2011 AM Peak Existing Synchro 7 - Report
Page 8
Movement EBL EBT EBR WBL WBT WBR NBL NBT NBR SBL SBT SBR
Lane Configurations
Volume (vph) 55 173 41 21 259 5 68 105 37 15 286 212
Ideal Flow (vphpl) 1900 1900 1900 1900 1900 1900 1900 1900 1900 1900 1900 1900
Grade (%) 0% 0% -2% -2%
Total Lost time (s) 4.0 4.0 4.0 4.0 4.0 4.0 4.0 4.0 4.0
Lane Util. Factor 1.00 1.00 1.00 1.00 1.00 1.00 1.00 1.00 1.00
Frt 1.00 0.97 1.00 1.00 1.00 0.96 1.00 1.00 0.85
Flt Protected 0.95 1.00 0.95 1.00 0.95 1.00 0.95 1.00 1.00
Satd. Flow (prot) 1736 1774 1671 1754 1787 1808 1805 1900 1615
Flt Permitted 0.57 1.00 0.61 1.00 0.55 1.00 0.66 1.00 1.00
Satd. Flow (perm) 1034 1774 1074 1754 1031 1808 1248 1900 1615
Peak-hour factor, PHF 0.90 0.90 0.90 0.90 0.90 0.90 0.90 0.90 0.90 0.90 0.90 0.90
Adj. Flow (vph) 61 192 46 23 288 6 76 117 41 17 318 236
RTOR Reduction (vph) 0 0 0 0 0 0 0 0 0 0 0 0
Lane Group Flow (vph) 61 238 0 23 294 0 76 158 0 17 318 236
Heavy Vehicles (%) 4% 4% 4% 8% 8% 8% 2% 2% 2% 1% 1% 1%
Turn Type Perm Perm Perm Perm Perm
Protected Phases 4 8 2 6
Permitted Phases 4 8 2 6 6
Actuated Green, G (s) 10.9 10.9 10.9 10.9 12.1 12.1 12.1 12.1 12.1
Effective Green, g (s) 12.9 12.9 12.9 12.9 14.1 14.1 14.1 14.1 14.1
Actuated g/C Ratio 0.37 0.37 0.37 0.37 0.40 0.40 0.40 0.40 0.40
Clearance Time (s) 6.0 6.0 6.0 6.0 6.0 6.0 6.0 6.0 6.0
Vehicle Extension (s) 3.0 3.0 3.0 3.0 3.0 3.0 3.0 3.0 3.0
Lane Grp Cap (vph) 381 654 396 646 415 728 503 765 651
v/s Ratio Prot 0.13 c0.17 0.09 c0.17
v/s Ratio Perm 0.06 0.02 0.07 0.01 0.15
v/c Ratio 0.16 0.36 0.06 0.46 0.18 0.22 0.03 0.42 0.36
Uniform Delay, d1 7.4 8.1 7.1 8.4 6.7 6.8 6.3 7.5 7.3
Progression Factor 1.00 1.00 1.00 1.00 1.00 1.00 1.00 1.00 1.00
Incremental Delay, d2 0.2 0.3 0.1 0.5 1.0 0.7 0.1 1.7 1.6
Delay (s) 7.6 8.4 7.2 8.9 7.7 7.5 6.5 9.2 8.9
Level of Service A A A A A A A A A
Approach Delay (s) 8.2 8.8 7.6 9.0
Approach LOS A A A A
Intersection Summary
HCM Average Control Delay 8.5 HCM Level of Service A
HCM Volume to Capacity ratio 0.43
Actuated Cycle Length (s) 35.0 Sum of lost time (s) 8.0
Intersection Capacity Utilization 54.0% ICU Level of Service A
Analysis Period (min) 15
c Critical Lane Group

HCM Unsignalized Intersection Capacity Analysis
3: SR 334 WB Off Ramp & Urbana Road 12/27/2011
Northridge Sub-Area Study 7:00 am 6/9/2011 AM Peak Existing Synchro 7 - Report
Page 1
Movement WBL WBR NBT NBR SBL SBT
Lane Configurations
Volume (veh/h) 154 17 292 0 0 521
Sign Control Stop Free Free
Grade -4% 2% -2%
Peak Hour Factor 0.90 0.90 0.90 0.90 0.90 0.90
Hourly flow rate (vph) 171 19 324 0 0 579
Pedestrians
Lane Width (ft)
Walking Speed (ft/s)
Percent Blockage
Right turn flare (veh)
Median type None None
Median storage veh)
Upstream signal (ft)
pX, platoon unblocked
vC, conflicting volume 614 162 324
vC1, stage 1 conf vol
vC2, stage 2 conf vol
vCu, unblocked vol 614 162 324
tC, single (s) 6.8 6.9 4.1
tC, 2 stage (s)
tF (s) 3.5 3.3 2.2
p0 queue free % 60 98 100
cM capacity (veh/h) 424 854 1232
Direction, Lane # WB 1 NB 1 NB 2 SB 1 SB 2
Volume Total 190 162 162 289 289
Volume Left 171 0 0 0 0
Volume Right 19 0 0 0 0
cSH 447 1700 1700 1700 1700
Volume to Capacity 0.43 0.10 0.10 0.17 0.17
Queue Length 95th (ft) 52 0 0 0 0
Control Delay (s) 18.9 0.0 0.0 0.0 0.0
Lane LOS C
Approach Delay (s) 18.9 0.0 0.0
Approach LOS C
Intersection Summary
Average Delay 3.3
Intersection Capacity Utilization 30.6% ICU Level of Service A
Analysis Period (min) 15

HCM Unsignalized Intersection Capacity Analysis
6: SR 334 EB On Ramp & Urbana Road 12/27/2011
Northridge Sub-Area Study 7:00 am 6/9/2011 AM Peak Existing Synchro 7 - Report
Page 2
Movement WBL WBR NBT NBR SBL SBT
Lane Configurations
Volume (veh/h) 0 0 307 60 11 670
Sign Control Stop Free Free
Grade 0% 2% 0%
Peak Hour Factor 0.90 0.90 0.90 0.90 0.90 0.90
Hourly flow rate (vph) 0 0 341 67 12 744
Pedestrians
Lane Width (ft)
Walking Speed (ft/s)
Percent Blockage
Right turn flare (veh)
Median type None None
Median storage veh)
Upstream signal (ft)
pX, platoon unblocked
vC, conflicting volume 738 171 341
vC1, stage 1 conf vol
vC2, stage 2 conf vol
vCu, unblocked vol 738 171 341
tC, single (s) 6.8 6.9 4.1
tC, 2 stage (s)
tF (s) 3.5 3.3 2.2
p0 queue free % 100 100 99
cM capacity (veh/h) 350 843 1215
Direction, Lane # NB 1 NB 2 NB 3 SB 1 SB 2 SB 3
Volume Total 171 171 67 12 372 372
Volume Left 0 0 0 12 0 0
Volume Right 0 0 67 0 0 0
cSH 1700 1700 1700 1215 1700 1700
Volume to Capacity 0.10 0.10 0.04 0.01 0.22 0.22
Queue Length 95th (ft) 0 0 0 1 0 0
Control Delay (s) 0.0 0.0 0.0 8.0 0.0 0.0
Lane LOS A
Approach Delay (s) 0.0 0.1
Approach LOS
Intersection Summary
Average Delay 0.1
Intersection Capacity Utilization 22.0% ICU Level of Service A
Analysis Period (min) 15

HCM Unsignalized Intersection Capacity Analysis
14: Urbana Road & SR 334 WB On Ramp 12/27/2011
Northridge Sub-Area Study 7:00 am 6/9/2011 AM Peak Existing Synchro 7 - Report
Page 4
Movement NBT NBR SBL SBT SWL SWR
Lane Configurations
Volume (veh/h) 292 115 0 675 0 0
Sign Control Free Free Stop
Grade 0% 0% 0%
Peak Hour Factor 0.90 0.90 0.90 0.90 0.90 0.90
Hourly flow rate (vph) 324 128 0 750 0 0
Pedestrians
Lane Width (ft)
Walking Speed (ft/s)
Percent Blockage
Right turn flare (veh)
Median type None None
Median storage veh)
Upstream signal (ft)
pX, platoon unblocked
vC, conflicting volume 452 699 162
vC1, stage 1 conf vol
vC2, stage 2 conf vol
vCu, unblocked vol 452 699 162
tC, single (s) 4.1 6.8 6.9
tC, 2 stage (s)
tF (s) 2.2 3.5 3.3
p0 queue free % 100 100 100
cM capacity (veh/h) 1105 374 854
Direction, Lane # NB 1 NB 2 NB 3 SB 1 SB 2
Volume Total 162 162 128 375 375
Volume Left 0 0 0 0 0
Volume Right 0 0 128 0 0
cSH 1700 1700 1700 1700 1700
Volume to Capacity 0.10 0.10 0.08 0.22 0.22
Queue Length 95th (ft) 0 0 0 0 0
Control Delay (s) 0.0 0.0 0.0 0.0 0.0
Lane LOS
Approach Delay (s) 0.0 0.0
Approach LOS
Intersection Summary
Average Delay 0.0
Intersection Capacity Utilization 30.6% ICU Level of Service A
Analysis Period (min) 15

HCM Unsignalized Intersection Capacity Analysis
20: Middle Urbana Road & SR 4 12/27/2011
Northridge Sub-Area Study 7:00 am 6/9/2011 AM Peak Existing Synchro 7 - Report
Page 6
Movement EBL EBR NBL NBT SBT SBR
Lane Configurations
Volume (veh/h) 2 355 197 101 283 1
Sign Control Stop Free Free
Grade 0% 0% 0%
Peak Hour Factor 0.90 0.90 0.90 0.90 0.90 0.90
Hourly flow rate (vph) 2 394 219 112 314 1
Pedestrians
Lane Width (ft)
Walking Speed (ft/s)
Percent Blockage
Right turn flare (veh)
Median type None None
Median storage veh)
Upstream signal (ft)
pX, platoon unblocked
vC, conflicting volume 865 315 316
vC1, stage 1 conf vol
vC2, stage 2 conf vol
vCu, unblocked vol 865 315 316
tC, single (s) 6.4 6.2 4.1
tC, 2 stage (s)
tF (s) 3.5 3.3 2.2
p0 queue free % 99 45 82
cM capacity (veh/h) 266 723 1233
Direction, Lane # EB 1 NB 1 SB 1
Volume Total 397 331 316
Volume Left 2 219 0
Volume Right 394 0 1
cSH 716 1233 1700
Volume to Capacity 0.55 0.18 0.19
Queue Length 95th (ft) 86 16 0
Control Delay (s) 16.1 6.2 0.0
Lane LOS C A
Approach Delay (s) 16.1 6.2 0.0
Approach LOS C
Intersection Summary
Average Delay 8.1
Intersection Capacity Utilization 63.3% ICU Level of Service B
Analysis Period (min) 15

HCM Unsignalized Intersection Capacity Analysis
13: Villa Road & SR 4 12/27/2011
Northridge Sub-Area Study 7:00 am 6/9/2011 AM Peak Existing Synchro 7 - Report
Page 3
Movement EBL EBR NBL NBT SBT SBR
Lane Configurations
Volume (veh/h) 32 15 11 115 231 67
Sign Control Stop Free Free
Grade 0% 0% 0%
Peak Hour Factor 0.90 0.90 0.90 0.90 0.90 0.90
Hourly flow rate (vph) 36 17 12 128 257 74
Pedestrians
Lane Width (ft)
Walking Speed (ft/s)
Percent Blockage
Right turn flare (veh)
Median type None None
Median storage veh)
Upstream signal (ft)
pX, platoon unblocked
vC, conflicting volume 446 294 331
vC1, stage 1 conf vol
vC2, stage 2 conf vol
vCu, unblocked vol 446 294 331
tC, single (s) 6.4 6.2 4.1
tC, 2 stage (s)
tF (s) 3.5 3.3 2.2
p0 queue free % 94 98 99
cM capacity (veh/h) 564 745 1223
Direction, Lane # EB 1 NB 1 SB 1
Volume Total 52 140 331
Volume Left 36 12 0
Volume Right 17 0 74
cSH 612 1223 1700
Volume to Capacity 0.09 0.01 0.19
Queue Length 95th (ft) 7 1 0
Control Delay (s) 11.4 0.8 0.0
Lane LOS B A
Approach Delay (s) 11.4 0.8 0.0
Approach LOS B
Intersection Summary
Average Delay 1.3
Intersection Capacity Utilization 26.2% ICU Level of Service A
Analysis Period (min) 15

HCM Unsignalized Intersection Capacity Analysis
15: SR 334 & SR 4 12/27/2011
Northridge Sub-Area Study 7:00 am 6/9/2011 AM Peak Existing Synchro 7 - Report
Page 5
Movement SEL SER NEL NET SWT SWR
Lane Configurations
Volume (veh/h) 57 25 42 64 172 112
Sign Control Stop Free Free
Grade 0% 0% 0%
Peak Hour Factor 0.90 0.90 0.90 0.90 0.90 0.90
Hourly flow rate (vph) 63 28 47 71 191 124
Pedestrians
Lane Width (ft)
Walking Speed (ft/s)
Percent Blockage
Right turn flare (veh)
Median type None None
Median storage veh)
Upstream signal (ft)
pX, platoon unblocked
vC, conflicting volume 418 253 191
vC1, stage 1 conf vol
vC2, stage 2 conf vol
vCu, unblocked vol 418 253 191
tC, single (s) 6.5 6.3 4.1
tC, 2 stage (s)
tF (s) 3.6 3.4 2.2
p0 queue free % 89 96 97
cM capacity (veh/h) 554 762 1371
Direction, Lane # SE 1 NE 1 SW 1
Volume Total 91 118 316
Volume Left 63 47 0
Volume Right 28 0 124
cSH 604 1371 1700
Volume to Capacity 0.15 0.03 0.19
Queue Length 95th (ft) 13 3 0
Control Delay (s) 12.0 3.2 0.0
Lane LOS B A
Approach Delay (s) 12.0 3.2 0.0
Approach LOS B
Intersection Summary
Average Delay 2.8
Intersection Capacity Utilization 36.3% ICU Level of Service A
Analysis Period (min) 15
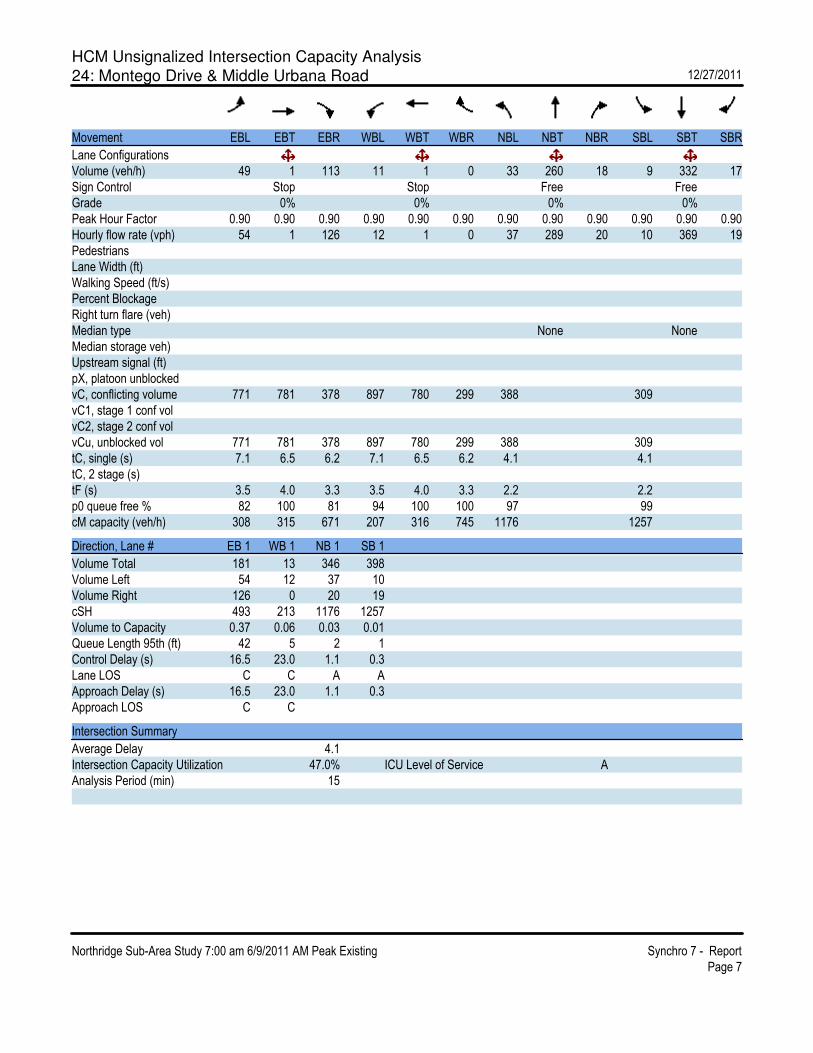
HCM Unsignalized Intersection Capacity Analysis
24: Montego Drive & Middle Urbana Road 12/27/2011
Northridge Sub-Area Study 7:00 am 6/9/2011 AM Peak Existing Synchro 7 - Report
Page 7
Movement EBL EBT EBR WBL WBT WBR NBL NBT NBR SBL SBT SBR
Lane Configurations
Volume (veh/h) 49 1 113 11 1 0 33 260 18 9 332 17
Sign Control Stop Stop Free Free
Grade 0% 0% 0% 0%
Peak Hour Factor 0.90 0.90 0.90 0.90 0.90 0.90 0.90 0.90 0.90 0.90 0.90 0.90
Hourly flow rate (vph) 54 1 126 12 1 0 37 289 20 10 369 19
Pedestrians
Lane Width (ft)
Walking Speed (ft/s)
Percent Blockage
Right turn flare (veh)
Median type None None
Median storage veh)
Upstream signal (ft)
pX, platoon unblocked
vC, conflicting volume 771 781 378 897 780 299 388 309
vC1, stage 1 conf vol
vC2, stage 2 conf vol
vCu, unblocked vol 771 781 378 897 780 299 388 309
tC, single (s) 7.1 6.5 6.2 7.1 6.5 6.2 4.1 4.1
tC, 2 stage (s)
tF (s) 3.5 4.0 3.3 3.5 4.0 3.3 2.2 2.2
p0 queue free % 82 100 81 94 100 100 97 99
cM capacity (veh/h) 308 315 671 207 316 745 1176 1257
Direction, Lane # EB 1 WB 1 NB 1 SB 1
Volume Total 181 13 346 398
Volume Left 54 12 37 10
Volume Right 126 0 20 19
cSH 493 213 1176 1257
Volume to Capacity 0.37 0.06 0.03 0.01
Queue Length 95th (ft) 42 5 2 1
Control Delay (s) 16.5 23.0 1.1 0.3
Lane LOS C C A A
Approach Delay (s) 16.5 23.0 1.1 0.3
Approach LOS C C
Intersection Summary
Average Delay 4.1
Intersection Capacity Utilization 47.0% ICU Level of Service A
Analysis Period (min) 15

HCM Unsignalized Intersection Capacity Analysis
30: Moorefield Road & Derr Road 12/27/2011
Northridge Sub-Area Study 7:00 am 6/9/2011 AM Peak Existing Synchro 7 - Report
Page 8
Movement EBT EBR WBL WBT NBL NBR
Lane Configurations
Sign Control Stop Stop Stop
Volume (vph) 72 24 72 239 34 52
Peak Hour Factor 0.90 0.90 0.90 0.90 0.90 0.90
Hourly flow rate (vph) 80 27 80 266 38 58
Direction, Lane # EB 1 WB 1 NB 1
Volume Total (vph) 107 346 96
Volume Left (vph) 0 80 38
Volume Right (vph) 27 0 58
Hadj (s) -0.15 0.05 -0.28
Departure Headway (s) 4.4 4.3 4.6
Degree Utilization, x 0.13 0.41 0.12
Capacity (veh/h) 794 813 713
Control Delay (s) 8.0 10.3 8.3
Approach Delay (s) 8.0 10.3 8.3
Approach LOS A B A
Intersection Summary
Delay 9.5
HCM Level of Service A
Intersection Capacity Utilization 35.0% ICU Level of Service A
Analysis Period (min) 15

HCM Unsignalized Intersection Capacity Analysis
31: Montego Drive & Derr Road 12/27/2011
Northridge Sub-Area Study 7:00 am 6/9/2011 AM Peak Existing Synchro 7 - Report
Page 9
Movement WBL WBR NBT NBR SBL SBT
Lane Configurations
Volume (veh/h) 216 8 105 57 7 258
Sign Control Stop Free Free
Grade 0% 0% 0%
Peak Hour Factor 0.90 0.90 0.90 0.90 0.90 0.90
Hourly flow rate (vph) 240 9 117 63 8 287
Pedestrians
Lane Width (ft)
Walking Speed (ft/s)
Percent Blockage
Right turn flare (veh)
Median type None None
Median storage veh)
Upstream signal (ft)
pX, platoon unblocked
vC, conflicting volume 451 148 180
vC1, stage 1 conf vol
vC2, stage 2 conf vol
vCu, unblocked vol 451 148 180
tC, single (s) 6.4 6.2 4.1
tC, 2 stage (s)
tF (s) 3.5 3.3 2.2
p0 queue free % 58 99 99
cM capacity (veh/h) 567 904 1408
Direction, Lane # WB 1 NB 1 SB 1
Volume Total 249 180 294
Volume Left 240 0 8
Volume Right 9 63 0
cSH 575 1700 1408
Volume to Capacity 0.43 0.11 0.01
Queue Length 95th (ft) 54 0 0
Control Delay (s) 16.0 0.0 0.2
Lane LOS C A
Approach Delay (s) 16.0 0.0 0.2
Approach LOS C
Intersection Summary
Average Delay 5.6
Intersection Capacity Utilization 38.3% ICU Level of Service A
Analysis Period (min) 15

HCM Unsignalized Intersection Capacity Analysis
39: Urbana Road & SR 334 EB Off Ramp 12/27/2011
Northridge Sub-Area Study 7:00 am 6/9/2011 AM Peak Existing Synchro 7 - Report
Page 10
Movement NBT NBR SBL SBT NWL NWR
Lane Configurations
Volume (veh/h) 307 0 0 675 0 100
Sign Control Free Free Yield
Grade 0% 0% 0%
Peak Hour Factor 0.90 0.90 0.90 0.90 0.90 0.90
Hourly flow rate (vph) 341 0 0 750 0 111
Pedestrians
Lane Width (ft)
Walking Speed (ft/s)
Percent Blockage
Right turn flare (veh)
Median type None None
Median storage veh)
Upstream signal (ft)
pX, platoon unblocked
vC, conflicting volume 341 716 171
vC1, stage 1 conf vol
vC2, stage 2 conf vol
vCu, unblocked vol 341 716 171
tC, single (s) 4.1 6.8 6.9
tC, 2 stage (s)
tF (s) 2.2 3.5 3.3
p0 queue free % 100 100 87
cM capacity (veh/h) 1215 365 843
Direction, Lane # NB 1 NB 2 SB 1 SB 2 NW 1
Volume Total 171 171 375 375 111
Volume Left 0 0 0 0 0
Volume Right 0 0 0 0 111
cSH 1700 1700 1700 1700 843
Volume to Capacity 0.10 0.10 0.22 0.22 0.13
Queue Length 95th (ft) 0 0 0 0 11
Control Delay (s) 0.0 0.0 0.0 0.0 9.9
Lane LOS A
Approach Delay (s) 0.0 0.0 9.9
Approach LOS A
Intersection Summary
Average Delay 0.9
Intersection Capacity Utilization 22.0% ICU Level of Service A
Analysis Period (min) 15

HCM Signalized Intersection Capacity Analysis
11: Home Road & SR 4 12/27/2011
Northridge Sub-Area Study 5:00 pm 6/9/2011 PM Existing Synchro 7 - Report
Page 1
Movement EBL EBT EBR WBL WBT WBR NBL NBT NBR SBL SBT SBR
Lane Configurations
Volume (vph) 26 93 10 14 206 154 18 175 20 213 267 53
Ideal Flow (vphpl) 1900 1900 1900 1900 1900 1900 1900 1900 1900 1900 1900 1900
Grade (%) 0% 3% 5% 0%
Total Lost time (s) 4.0 4.0 4.0 4.0 4.0 4.0 4.0 4.0
Lane Util. Factor 1.00 1.00 1.00 1.00 1.00 0.95 1.00 0.95
Frt 1.00 0.99 1.00 0.94 1.00 0.98 1.00 0.98
Flt Protected 0.95 1.00 0.95 1.00 0.95 1.00 0.95 1.00
Satd. Flow (prot) 1770 1836 1726 1700 1645 3239 1752 3418
Flt Permitted 0.43 1.00 0.68 1.00 0.54 1.00 0.62 1.00
Satd. Flow (perm) 807 1836 1242 1700 933 3239 1137 3418
Peak-hour factor, PHF 0.90 0.90 0.90 0.90 0.90 0.90 0.90 0.90 0.90 0.90 0.90 0.90
Adj. Flow (vph) 29 103 11 16 229 171 20 194 22 237 297 59
RTOR Reduction (vph) 0 0 0 0 0 0 0 0 0 0 0 0
Lane Group Flow (vph) 29 114 0 16 400 0 20 216 0 237 356 0
Heavy Vehicles (%) 2% 2% 2% 3% 3% 3% 7% 7% 7% 3% 3% 3%
Turn Type Perm Perm Perm Perm
Protected Phases 4 8 2 6
Permitted Phases 4 8 2 6
Actuated Green, G (s) 14.5 14.5 14.5 14.5 14.2 14.2 14.2 14.2
Effective Green, g (s) 16.5 16.5 16.5 16.5 16.2 16.2 16.2 16.2
Actuated g/C Ratio 0.41 0.41 0.41 0.41 0.40 0.40 0.40 0.40
Clearance Time (s) 6.0 6.0 6.0 6.0 6.0 6.0 6.0 6.0
Vehicle Extension (s) 3.0 3.0 3.0 3.0 3.0 3.0 3.0 3.0
Lane Grp Cap (vph) 327 744 504 689 371 1289 453 1360
v/s Ratio Prot 0.06 c0.24 0.07 0.10
v/s Ratio Perm 0.04 0.01 0.02 c0.21
v/c Ratio 0.09 0.15 0.03 0.58 0.05 0.17 0.52 0.26
Uniform Delay, d1 7.5 7.7 7.3 9.4 7.5 7.9 9.3 8.2
Progression Factor 1.00 1.00 1.00 1.00 1.00 1.00 1.00 1.00
Incremental Delay, d2 0.1 0.1 0.0 1.3 0.3 0.3 4.3 0.5
Delay (s) 7.6 7.8 7.3 10.7 7.8 8.2 13.6 8.7
Level of Service A A A B A A B A
Approach Delay (s) 7.7 10.5 8.2 10.7
Approach LOS A B A B
Intersection Summary
HCM Average Control Delay 9.9 HCM Level of Service A
HCM Volume to Capacity ratio 0.55
Actuated Cycle Length (s) 40.7 Sum of lost time (s) 8.0
Intersection Capacity Utilization 49.2% ICU Level of Service A
Analysis Period (min) 15
c Critical Lane Group

HCM Signalized Intersection Capacity Analysis
19: Villa Road & Middle Urbana Road 12/27/2011
Northridge Sub-Area Study 5:00 pm 6/9/2011 PM Existing Synchro 7 - Report
Page 3
Movement EBL EBT EBR WBL WBT WBR NBL NBT NBR SBL SBT SBR
Lane Configurations
Volume (vph) 133 95 112 6 66 11 82 329 3 2 69 129
Ideal Flow (vphpl) 1900 1900 1900 1900 1900 1900 1900 1900 1900 1900 1900 1900
Lane Width 12 10 13 12 10 12 12 12 12 12 12 12
Total Lost time (s) 4.0 4.0 4.0 4.0 4.0 4.0 4.0 4.0
Lane Util. Factor 1.00 1.00 1.00 1.00 1.00 1.00 1.00 1.00
Frt 1.00 1.00 0.85 0.98 1.00 1.00 1.00 0.90
Flt Protected 0.95 1.00 1.00 1.00 0.95 1.00 0.95 1.00
Satd. Flow (prot) 1805 1773 1669 1736 1805 1898 1805 1715
Flt Permitted 0.52 1.00 1.00 0.97 0.53 1.00 0.51 1.00
Satd. Flow (perm) 994 1773 1669 1685 1011 1898 973 1715
Peak-hour factor, PHF 0.90 0.90 0.90 0.90 0.90 0.90 0.90 0.90 0.90 0.90 0.90 0.90
Adj. Flow (vph) 148 106 124 7 73 12 91 366 3 2 77 143
RTOR Reduction (vph) 0 0 0 0 0 0 0 0 0 0 0 0
Lane Group Flow (vph) 148 106 124 0 92 0 91 369 0 2 220 0
Heavy Vehicles (%) 0% 0% 0% 0% 0% 0% 0% 0% 0% 0% 0% 0%
Turn Type pm+pt Perm pm+pt pm+pt pm+pt
Protected Phases 7 4 3 8 5 2 1 6
Permitted Phases 4 4 8 2 6
Actuated Green, G (s) 17.3 17.3 17.3 6.9 34.3 29.9 27.7 26.6
Effective Green, g (s) 19.3 19.3 19.3 8.9 38.3 31.9 31.7 28.6
Actuated g/C Ratio 0.29 0.29 0.29 0.13 0.58 0.48 0.48 0.43
Clearance Time (s) 6.0 6.0 6.0 6.0 6.0 6.0 6.0 6.0
Vehicle Extension (s) 3.0 3.0 3.0 3.0 3.0 3.0 3.0 3.0
Lane Grp Cap (vph) 368 516 486 226 661 913 504 740
v/s Ratio Prot c0.04 0.06 c0.01 c0.19 0.00 0.13
v/s Ratio Perm c0.08 0.07 0.05 0.07 0.00
v/c Ratio 0.40 0.21 0.26 0.41 0.14 0.40 0.00 0.30
Uniform Delay, d1 18.5 17.7 18.0 26.3 6.4 11.1 9.1 12.3
Progression Factor 1.00 1.00 1.00 1.00 1.00 1.00 1.00 1.00
Incremental Delay, d2 0.7 0.2 0.3 1.2 0.1 1.3 0.0 1.0
Delay (s) 19.2 17.9 18.3 27.5 6.5 12.4 9.1 13.3
Level of Service B B B C A B A B
Approach Delay (s) 18.5 27.5 11.2 13.3
Approach LOS B C B B
Intersection Summary
HCM Average Control Delay 15.3 HCM Level of Service B
HCM Volume to Capacity ratio 0.39
Actuated Cycle Length (s) 66.3 Sum of lost time (s) 12.0
Intersection Capacity Utilization 46.5% ICU Level of Service A
Analysis Period (min) 15
c Critical Lane Group
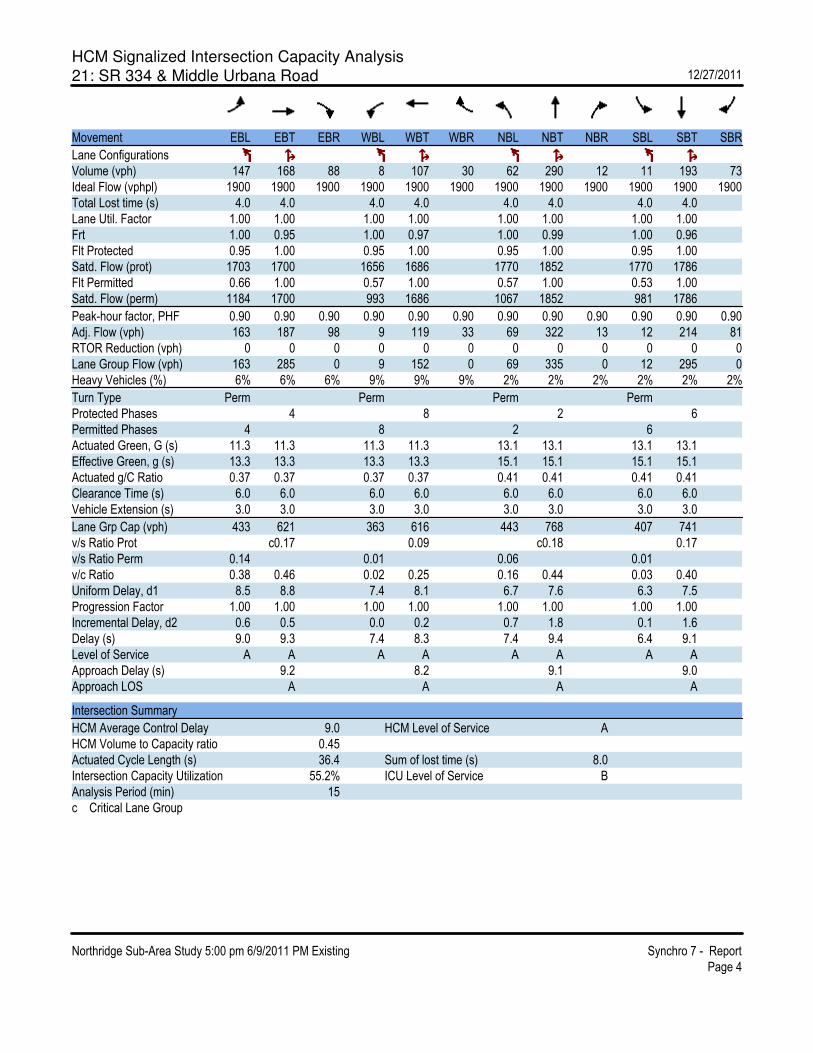
HCM Signalized Intersection Capacity Analysis
21: SR 334 & Middle Urbana Road 12/27/2011
Northridge Sub-Area Study 5:00 pm 6/9/2011 PM Existing Synchro 7 - Report
Page 4
Movement EBL EBT EBR WBL WBT WBR NBL NBT NBR SBL SBT SBR
Lane Configurations
Volume (vph) 147 168 88 8 107 30 62 290 12 11 193 73
Ideal Flow (vphpl) 1900 1900 1900 1900 1900 1900 1900 1900 1900 1900 1900 1900
Total Lost time (s) 4.0 4.0 4.0 4.0 4.0 4.0 4.0 4.0
Lane Util. Factor 1.00 1.00 1.00 1.00 1.00 1.00 1.00 1.00
Frt 1.00 0.95 1.00 0.97 1.00 0.99 1.00 0.96
Flt Protected 0.95 1.00 0.95 1.00 0.95 1.00 0.95 1.00
Satd. Flow (prot) 1703 1700 1656 1686 1770 1852 1770 1786
Flt Permitted 0.66 1.00 0.57 1.00 0.57 1.00 0.53 1.00
Satd. Flow (perm) 1184 1700 993 1686 1067 1852 981 1786
Peak-hour factor, PHF 0.90 0.90 0.90 0.90 0.90 0.90 0.90 0.90 0.90 0.90 0.90 0.90
Adj. Flow (vph) 163 187 98 9 119 33 69 322 13 12 214 81
RTOR Reduction (vph) 0 0 0 0 0 0 0 0 0 0 0 0
Lane Group Flow (vph) 163 285 0 9 152 0 69 335 0 12 295 0
Heavy Vehicles (%) 6% 6% 6% 9% 9% 9% 2% 2% 2% 2% 2% 2%
Turn Type Perm Perm Perm Perm
Protected Phases 4 8 2 6
Permitted Phases 4 8 2 6
Actuated Green, G (s) 11.3 11.3 11.3 11.3 13.1 13.1 13.1 13.1
Effective Green, g (s) 13.3 13.3 13.3 13.3 15.1 15.1 15.1 15.1
Actuated g/C Ratio 0.37 0.37 0.37 0.37 0.41 0.41 0.41 0.41
Clearance Time (s) 6.0 6.0 6.0 6.0 6.0 6.0 6.0 6.0
Vehicle Extension (s) 3.0 3.0 3.0 3.0 3.0 3.0 3.0 3.0
Lane Grp Cap (vph) 433 621 363 616 443 768 407 741
v/s Ratio Prot c0.17 0.09 c0.18 0.17
v/s Ratio Perm 0.14 0.01 0.06 0.01
v/c Ratio 0.38 0.46 0.02 0.25 0.16 0.44 0.03 0.40
Uniform Delay, d1 8.5 8.8 7.4 8.1 6.7 7.6 6.3 7.5
Progression Factor 1.00 1.00 1.00 1.00 1.00 1.00 1.00 1.00
Incremental Delay, d2 0.6 0.5 0.0 0.2 0.7 1.8 0.1 1.6
Delay (s) 9.0 9.3 7.4 8.3 7.4 9.4 6.4 9.1
Level of Service A A A A A A A A
Approach Delay (s) 9.2 8.2 9.1 9.0
Approach LOS A A A A
Intersection Summary
HCM Average Control Delay 9.0 HCM Level of Service A
HCM Volume to Capacity ratio 0.45
Actuated Cycle Length (s) 36.4 Sum of lost time (s) 8.0
Intersection Capacity Utilization 55.2% ICU Level of Service B
Analysis Period (min) 15
c Critical Lane Group

HCM Signalized Intersection Capacity Analysis
22: Moorefield Road & Middle Urbana Road 12/27/2011
Northridge Sub-Area Study 5:00 pm 6/9/2011 PM Existing Synchro 7 - Report
Page 5
Movement EBL EBT EBR WBL WBT WBR NBL NBT NBR SBL SBT SBR
Lane Configurations
Volume (vph) 29 97 35 42 102 18 51 77 39 11 75 44
Ideal Flow (vphpl) 1900 1900 1900 1900 1900 1900 1900 1900 1900 1900 1900 1900
Lane Width 12 12 12 12 12 12 12 11 12 12 11 12
Total Lost time (s) 4.0 4.0 4.0 4.0 4.0
Lane Util. Factor 1.00 1.00 1.00 1.00 1.00
Frt 1.00 0.85 0.98 0.97 0.95
Flt Protected 0.99 1.00 0.99 0.98 1.00
Satd. Flow (prot) 1860 1599 1829 1752 1745
Flt Permitted 0.88 1.00 0.87 0.88 0.97
Satd. Flow (perm) 1656 1599 1613 1560 1697
Peak-hour factor, PHF 0.90 0.90 0.90 0.90 0.90 0.90 0.90 0.90 0.90 0.90 0.90 0.90
Adj. Flow (vph) 32 108 39 47 113 20 57 86 43 12 83 49
RTOR Reduction (vph) 0 0 0 0 0 0 0 0 0 0 0 0
Lane Group Flow (vph) 0 140 39 0 180 0 0 186 0 0 144 0
Heavy Vehicles (%) 1% 1% 1% 1% 1% 1% 0% 0% 0% 0% 0% 0%
Turn Type Perm Perm Perm Perm Perm
Protected Phases 4 8 2 6
Permitted Phases 4 4 8 2 6
Actuated Green, G (s) 7.1 7.1 7.1 12.0 12.0
Effective Green, g (s) 9.1 9.1 9.1 14.0 14.0
Actuated g/C Ratio 0.29 0.29 0.29 0.45 0.45
Clearance Time (s) 6.0 6.0 6.0 6.0 6.0
Vehicle Extension (s) 3.0 3.0 3.0 3.0 3.0
Lane Grp Cap (vph) 485 468 472 702 764
v/s Ratio Prot
v/s Ratio Perm 0.08 0.02 c0.11 c0.12 0.08
v/c Ratio 0.29 0.08 0.38 0.26 0.19
Uniform Delay, d1 8.5 8.0 8.8 5.3 5.1
Progression Factor 1.00 1.00 1.00 1.00 1.00
Incremental Delay, d2 0.3 0.1 0.5 0.9 0.5
Delay (s) 8.8 8.1 9.3 6.3 5.7
Level of Service A A A A A
Approach Delay (s) 8.7 9.3 6.3 5.7
Approach LOS A A A A
Intersection Summary
HCM Average Control Delay 7.6 HCM Level of Service A
HCM Volume to Capacity ratio 0.31
Actuated Cycle Length (s) 31.1 Sum of lost time (s) 8.0
Intersection Capacity Utilization 38.0% ICU Level of Service A
Analysis Period (min) 15
c Critical Lane Group
HCM Signalized Intersection Capacity Analysis
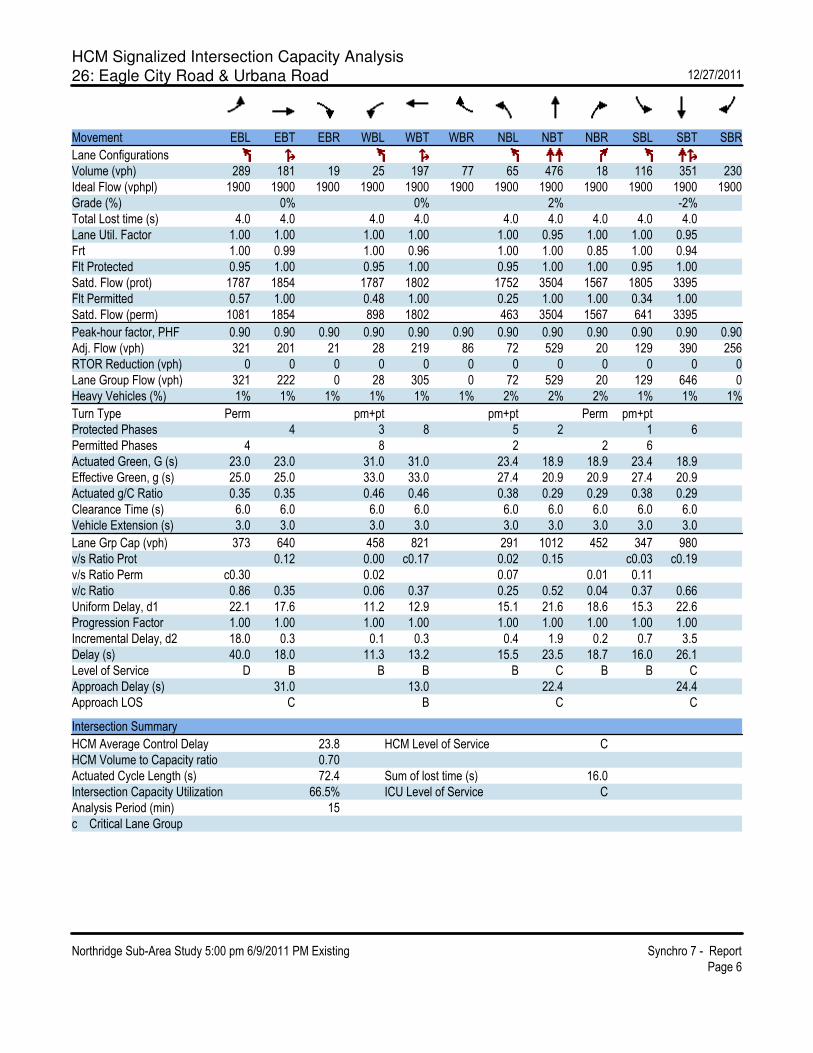
26: Eagle City Road & Urbana Road 12/27/2011
Northridge Sub-Area Study 5:00 pm 6/9/2011 PM Existing Synchro 7 - Report
Page 6
Movement EBL EBT EBR WBL WBT WBR NBL NBT NBR SBL SBT SBR
Lane Configurations
Volume (vph) 289 181 19 25 197 77 65 476 18 116 351 230
Ideal Flow (vphpl) 1900 1900 1900 1900 1900 1900 1900 1900 1900 1900 1900 1900
Grade (%) 0% 0% 2% -2%
Total Lost time (s) 4.0 4.0 4.0 4.0 4.0 4.0 4.0 4.0 4.0
Lane Util. Factor 1.00 1.00 1.00 1.00 1.00 0.95 1.00 1.00 0.95
Frt 1.00 0.99 1.00 0.96 1.00 1.00 0.85 1.00 0.94
Flt Protected 0.95 1.00 0.95 1.00 0.95 1.00 1.00 0.95 1.00
Satd. Flow (prot) 1787 1854 1787 1802 1752 3504 1567 1805 3395
Flt Permitted 0.57 1.00 0.48 1.00 0.25 1.00 1.00 0.34 1.00
Satd. Flow (perm) 1081 1854 898 1802 463 3504 1567 641 3395
Peak-hour factor, PHF 0.90 0.90 0.90 0.90 0.90 0.90 0.90 0.90 0.90 0.90 0.90 0.90
Adj. Flow (vph) 321 201 21 28 219 86 72 529 20 129 390 256
RTOR Reduction (vph) 0 0 0 0 0 0 0 0 0 0 0 0
Lane Group Flow (vph) 321 222 0 28 305 0 72 529 20 129 646 0
Heavy Vehicles (%) 1% 1% 1% 1% 1% 1% 2% 2% 2% 1% 1% 1%
Turn Type Perm pm+pt pm+pt Perm pm+pt
Protected Phases 4 3 8 5 2 1 6
Permitted Phases 4 8 2 2 6
Actuated Green, G (s) 23.0 23.0 31.0 31.0 23.4 18.9 18.9 23.4 18.9
Effective Green, g (s) 25.0 25.0 33.0 33.0 27.4 20.9 20.9 27.4 20.9
Actuated g/C Ratio 0.35 0.35 0.46 0.46 0.38 0.29 0.29 0.38 0.29
Clearance Time (s) 6.0 6.0 6.0 6.0 6.0 6.0 6.0 6.0 6.0
Vehicle Extension (s) 3.0 3.0 3.0 3.0 3.0 3.0 3.0 3.0 3.0
Lane Grp Cap (vph) 373 640 458 821 291 1012 452 347 980
v/s Ratio Prot 0.12 0.00 c0.17 0.02 0.15 c0.03 c0.19
v/s Ratio Perm c0.30 0.02 0.07 0.01 0.11
v/c Ratio 0.86 0.35 0.06 0.37 0.25 0.52 0.04 0.37 0.66
Uniform Delay, d1 22.1 17.6 11.2 12.9 15.1 21.6 18.6 15.3 22.6
Progression Factor 1.00 1.00 1.00 1.00 1.00 1.00 1.00 1.00 1.00
Incremental Delay, d2 18.0 0.3 0.1 0.3 0.4 1.9 0.2 0.7 3.5
Delay (s) 40.0 18.0 11.3 13.2 15.5 23.5 18.7 16.0 26.1
Level of Service D B B B B C B B C
Approach Delay (s) 31.0 13.0 22.4 24.4
Approach LOS C B C C
Intersection Summary
HCM Average Control Delay 23.8 HCM Level of Service C
HCM Volume to Capacity ratio 0.70
Actuated Cycle Length (s) 72.4 Sum of lost time (s) 16.0
Intersection Capacity Utilization 66.5% ICU Level of Service C
Analysis Period (min) 15
c Critical Lane Group

HCM Signalized Intersection Capacity Analysis
27: Villa Road & Derr Road 12/27/2011
Northridge Sub-Area Study 5:00 pm 6/9/2011 PM Existing Synchro 7 - Report
Page 7
Movement EBL EBT EBR WBL WBT WBR NBL NBT NBR SBL SBT SBR
Lane Configurations
Volume (vph) 111 192 97 107 315 56 144 134 100 59 170 71
Ideal Flow (vphpl) 1900 1900 1900 1900 1900 1900 1900 1900 1900 1900 1900 1900
Lane Width 10 12 12 12 12 12 11 12 11 12 12 12
Total Lost time (s) 4.0 4.0 4.0 4.0 4.0 4.0 4.0 4.0 4.0
Lane Util. Factor 1.00 0.95 1.00 1.00 1.00 1.00 1.00 1.00 1.00
Frt 1.00 0.95 1.00 0.98 1.00 1.00 0.85 1.00 0.96
Flt Protected 0.95 1.00 0.95 1.00 0.95 1.00 1.00 0.95 1.00
Satd. Flow (prot) 1685 3428 1805 1857 1745 1900 1561 1805 1816
Flt Permitted 0.26 1.00 0.51 1.00 0.45 1.00 1.00 0.66 1.00
Satd. Flow (perm) 458 3428 960 1857 820 1900 1561 1258 1816
Peak-hour factor, PHF 0.90 0.90 0.90 0.90 0.90 0.90 0.90 0.90 0.90 0.90 0.90 0.90
Adj. Flow (vph) 123 213 108 119 350 62 160 149 111 66 189 79
RTOR Reduction (vph) 0 0 0 0 0 0 0 0 0 0 0 0
Lane Group Flow (vph) 123 321 0 119 412 0 160 149 111 66 268 0
Heavy Vehicles (%) 0% 0% 0% 0% 0% 0% 0% 0% 0% 0% 0% 0%
Turn Type pm+pt pm+pt pm+pt Perm pm+pt
Protected Phases 7 4 3 8 5 2 1 6
Permitted Phases 4 8 2 2 6
Actuated Green, G (s) 18.0 13.5 28.4 18.7 25.6 21.2 21.2 23.4 20.1
Effective Green, g (s) 22.0 15.5 31.2 20.7 29.6 23.2 23.2 27.4 22.1
Actuated g/C Ratio 0.31 0.22 0.44 0.29 0.41 0.32 0.32 0.38 0.31
Clearance Time (s) 6.0 6.0 6.0 6.0 6.0 6.0 6.0 6.0 6.0
Vehicle Extension (s) 3.0 3.0 3.0 3.0 3.0 3.0 3.0 3.0 3.0
Lane Grp Cap (vph) 252 741 556 536 421 615 505 521 560
v/s Ratio Prot c0.04 0.09 0.03 c0.22 c0.03 0.08 0.01 c0.15
v/s Ratio Perm 0.11 0.06 0.12 0.07 0.04
v/c Ratio 0.49 0.43 0.21 0.77 0.38 0.24 0.22 0.13 0.48
Uniform Delay, d1 27.7 24.3 14.1 23.3 13.9 17.8 17.7 14.2 20.1
Progression Factor 1.00 1.00 1.00 1.00 1.00 1.00 1.00 1.00 1.00
Incremental Delay, d2 1.5 0.4 0.2 6.6 0.6 0.9 1.0 0.1 2.9
Delay (s) 29.2 24.7 14.3 29.9 14.5 18.7 18.7 14.3 23.0
Level of Service C C B C B B B B C
Approach Delay (s) 26.0 26.4 17.1 21.3
Approach LOS C C B C
Intersection Summary
HCM Average Control Delay 23.0 HCM Level of Service C
HCM Volume to Capacity ratio 0.58
Actuated Cycle Length (s) 71.7 Sum of lost time (s) 16.0
Intersection Capacity Utilization 60.7% ICU Level of Service B
Analysis Period (min) 15
c Critical Lane Group

HCM Signalized Intersection Capacity Analysis
28: SR 334 & Derr Road 12/27/2011
Northridge Sub-Area Study 5:00 pm 6/9/2011 PM Existing Synchro 7 - Report
Page 8
Movement EBL EBT EBR WBL WBT WBR NBL NBT NBR SBL SBT SBR
Lane Configurations
Volume (vph) 283 376 67 23 214 14 74 363 25 5 249 105
Ideal Flow (vphpl) 1900 1900 1900 1900 1900 1900 1900 1900 1900 1900 1900 1900
Grade (%) 0% 0% -2% -2%
Total Lost time (s) 4.0 4.0 4.0 4.0 4.0 4.0 4.0 4.0 4.0
Lane Util. Factor 1.00 1.00 1.00 1.00 1.00 1.00 1.00 1.00 1.00
Frt 1.00 0.98 1.00 0.99 1.00 0.99 1.00 1.00 0.85
Flt Protected 0.95 1.00 0.95 1.00 0.95 1.00 0.95 1.00 1.00
Satd. Flow (prot) 1736 1786 1671 1743 1787 1863 1805 1900 1615
Flt Permitted 0.58 1.00 0.34 1.00 0.55 1.00 0.37 1.00 1.00
Satd. Flow (perm) 1067 1786 594 1743 1029 1863 711 1900 1615
Peak-hour factor, PHF 0.90 0.90 0.90 0.90 0.90 0.90 0.90 0.90 0.90 0.90 0.90 0.90
Adj. Flow (vph) 314 418 74 26 238 16 82 403 28 6 277 117
RTOR Reduction (vph) 0 0 0 0 0 0 0 0 0 0 0 0
Lane Group Flow (vph) 314 492 0 26 254 0 82 431 0 6 277 117
Heavy Vehicles (%) 4% 4% 4% 8% 8% 8% 2% 2% 2% 1% 1% 1%
Turn Type Perm Perm Perm Perm Perm
Protected Phases 4 8 2 6
Permitted Phases 4 8 2 6 6
Actuated Green, G (s) 20.0 20.0 20.0 20.0 18.3 18.3 18.3 18.3 18.3
Effective Green, g (s) 22.0 22.0 22.0 22.0 20.3 20.3 20.3 20.3 20.3
Actuated g/C Ratio 0.44 0.44 0.44 0.44 0.40 0.40 0.40 0.40 0.40
Clearance Time (s) 6.0 6.0 6.0 6.0 6.0 6.0 6.0 6.0 6.0
Vehicle Extension (s) 3.0 3.0 3.0 3.0 3.0 3.0 3.0 3.0 3.0
Lane Grp Cap (vph) 467 781 260 762 415 752 287 767 652
v/s Ratio Prot 0.28 0.15 c0.23 0.15
v/s Ratio Perm c0.29 0.04 0.08 0.01 0.07
v/c Ratio 0.67 0.63 0.10 0.33 0.20 0.57 0.02 0.36 0.18
Uniform Delay, d1 11.3 11.0 8.3 9.3 9.7 11.6 9.0 10.5 9.6
Progression Factor 1.00 1.00 1.00 1.00 1.00 1.00 1.00 1.00 1.00
Incremental Delay, d2 3.8 1.6 0.2 0.3 1.1 3.2 0.1 1.3 0.6
Delay (s) 15.1 12.6 8.5 9.6 10.8 14.8 9.2 11.8 10.2
Level of Service B B A A B B A B B
Approach Delay (s) 13.6 9.5 14.2 11.3
Approach LOS B A B B
Intersection Summary
HCM Average Control Delay 12.7 HCM Level of Service B
HCM Volume to Capacity ratio 0.63
Actuated Cycle Length (s) 50.3 Sum of lost time (s) 8.0
Intersection Capacity Utilization 69.5% ICU Level of Service C
Analysis Period (min) 15
c Critical Lane Group

HCM Signalized Intersection Capacity Analysis
41: Emmanuel Way & Middle Urbana Road 12/27/2011
Northridge Sub-Area Study 5:00 pm 6/9/2011 PM Existing Synchro 7 - Report
Page 9
Movement WBL WBR NBT NBR SBL SBT
Lane Configurations
Volume (vph) 43 32 356 21 17 292
Ideal Flow (vphpl) 1900 1900 1900 1900 1900 1900
Lane Width 10 10 12 12 10 10
Total Lost time (s) 4.0 4.0 4.0 4.0 4.0
Lane Util. Factor 1.00 1.00 1.00 1.00 1.00
Frt 1.00 0.85 0.99 1.00 1.00
Flt Protected 0.95 1.00 1.00 0.95 1.00
Satd. Flow (prot) 1652 1478 1849 1652 1739
Flt Permitted 0.95 1.00 1.00 0.43 1.00
Satd. Flow (perm) 1652 1478 1849 756 1739
Peak-hour factor, PHF 0.90 0.90 0.90 0.90 0.90 0.90
Adj. Flow (vph) 48 36 396 23 19 324
RTOR Reduction (vph) 0 0 0 0 0 0
Lane Group Flow (vph) 48 36 419 0 19 324
Turn Type Perm pm+pt
Protected Phases 8 2 1 6
Permitted Phases 8 6
Actuated Green, G (s) 4.6 4.6 34.6 41.4 41.4
Effective Green, g (s) 6.6 6.6 36.6 43.4 43.4
Actuated g/C Ratio 0.11 0.11 0.63 0.75 0.75
Clearance Time (s) 6.0 6.0 6.0 6.0 6.0
Vehicle Extension (s) 3.0 3.0 3.0 3.0 3.0
Lane Grp Cap (vph) 188 168 1167 609 1301
v/s Ratio Prot c0.03 c0.23 0.00 c0.19
v/s Ratio Perm 0.02 0.02
v/c Ratio 0.26 0.21 0.36 0.03 0.25
Uniform Delay, d1 23.5 23.3 5.1 2.2 2.3
Progression Factor 1.00 1.00 1.00 1.00 1.00
Incremental Delay, d2 0.7 0.6 0.9 0.0 0.5
Delay (s) 24.2 24.0 6.0 2.3 2.7
Level of Service C C A A A
Approach Delay (s) 24.1 6.0 2.7
Approach LOS C A A
Intersection Summary
HCM Average Control Delay 6.4 HCM Level of Service A
HCM Volume to Capacity ratio 0.35
Actuated Cycle Length (s) 58.0 Sum of lost time (s) 12.0
Intersection Capacity Utilization 31.7% ICU Level of Service A
Analysis Period (min) 15
c Critical Lane Group

HCM Signalized Intersection Capacity Analysis
44: Providence & Derr Road 12/27/2011
Northridge Sub-Area Study 5:00 pm 6/9/2011 PM Existing Synchro 7 - Report
Page 10
Movement WBL WBR NBT NBR SBL SBT
Lane Configurations
Volume (vph) 60 79 574 73 79 471
Ideal Flow (vphpl) 1900 1900 1900 1900 1900 1900
Lane Width 16 12 11 11 11 11
Total Lost time (s) 4.0 4.0 4.0 4.0
Lane Util. Factor 1.00 0.95 1.00 0.95
Frt 0.92 0.98 1.00 1.00
Flt Protected 0.98 1.00 0.95 1.00
Satd. Flow (prot) 1908 3363 1711 3421
Flt Permitted 0.98 1.00 0.37 1.00
Satd. Flow (perm) 1908 3363 665 3421
Peak-hour factor, PHF 0.90 0.90 0.90 0.90 0.90 0.90
Adj. Flow (vph) 67 88 638 81 88 523
RTOR Reduction (vph) 0 0 0 0 0 0
Lane Group Flow (vph) 155 0 719 0 88 523
Turn Type Perm
Protected Phases 8 2 6
Permitted Phases 6
Actuated Green, G (s) 7.3 23.4 23.4 23.4
Effective Green, g (s) 9.3 25.4 25.4 25.4
Actuated g/C Ratio 0.22 0.59 0.59 0.59
Clearance Time (s) 6.0 6.0 6.0 6.0
Vehicle Extension (s) 3.0 3.0 3.0 3.0
Lane Grp Cap (vph) 416 2000 396 2035
v/s Ratio Prot c0.08 c0.21 0.15
v/s Ratio Perm 0.13
v/c Ratio 0.37 0.36 0.22 0.26
Uniform Delay, d1 14.2 4.5 4.0 4.1
Progression Factor 1.00 1.00 1.00 1.00
Incremental Delay, d2 0.6 0.5 1.3 0.3
Delay (s) 14.8 5.0 5.3 4.4
Level of Service B A A A
Approach Delay (s) 14.8 5.0 4.6
Approach LOS B A A
Intersection Summary
HCM Average Control Delay 5.8 HCM Level of Service A
HCM Volume to Capacity ratio 0.36
Actuated Cycle Length (s) 42.7 Sum of lost time (s) 8.0
Intersection Capacity Utilization 42.2% ICU Level of Service A
Analysis Period (min) 15
c Critical Lane Group
HCM Signalized Intersection Capacity Analysis
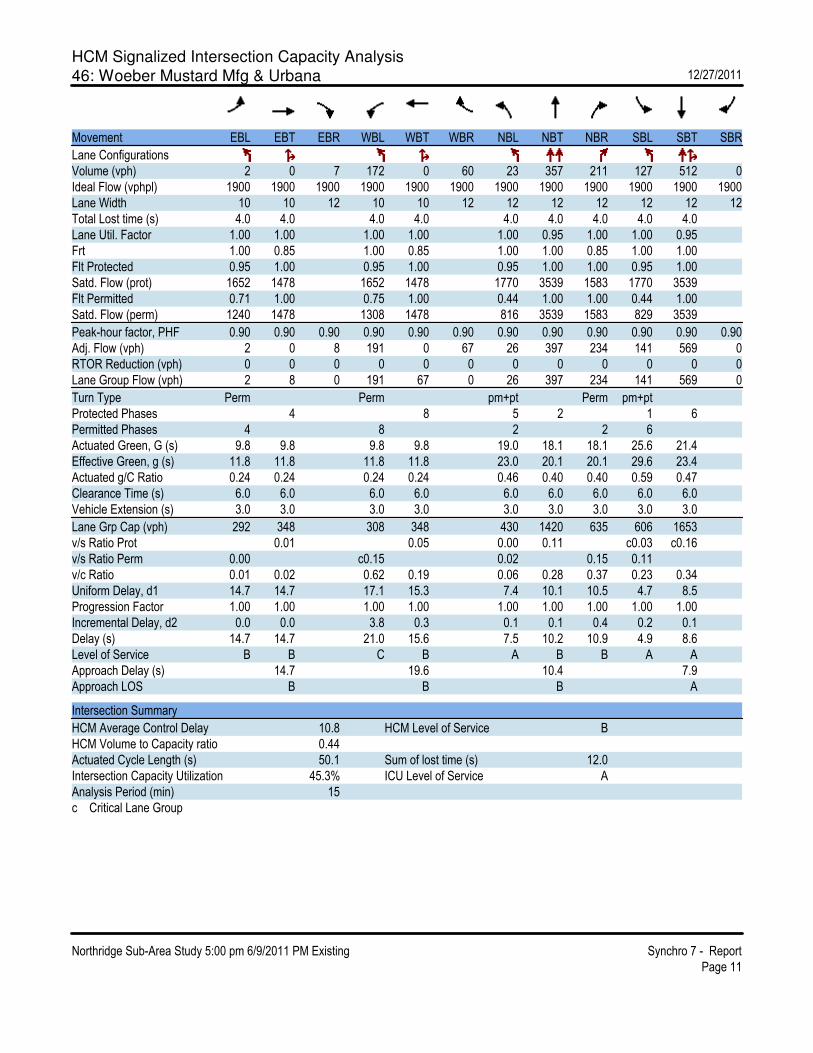
46: Woeber Mustard Mfg & Urbana 12/27/2011
Northridge Sub-Area Study 5:00 pm 6/9/2011 PM Existing Synchro 7 - Report
Page 11
Movement EBL EBT EBR WBL WBT WBR NBL NBT NBR SBL SBT SBR
Lane Configurations
Volume (vph) 2 0 7 172 0 60 23 357 211 127 512 0
Ideal Flow (vphpl) 1900 1900 1900 1900 1900 1900 1900 1900 1900 1900 1900 1900
Lane Width 10 10 12 10 10 12 12 12 12 12 12 12
Total Lost time (s) 4.0 4.0 4.0 4.0 4.0 4.0 4.0 4.0 4.0
Lane Util. Factor 1.00 1.00 1.00 1.00 1.00 0.95 1.00 1.00 0.95
Frt 1.00 0.85 1.00 0.85 1.00 1.00 0.85 1.00 1.00
Flt Protected 0.95 1.00 0.95 1.00 0.95 1.00 1.00 0.95 1.00
Satd. Flow (prot) 1652 1478 1652 1478 1770 3539 1583 1770 3539
Flt Permitted 0.71 1.00 0.75 1.00 0.44 1.00 1.00 0.44 1.00
Satd. Flow (perm) 1240 1478 1308 1478 816 3539 1583 829 3539
Peak-hour factor, PHF 0.90 0.90 0.90 0.90 0.90 0.90 0.90 0.90 0.90 0.90 0.90 0.90
Adj. Flow (vph) 2 0 8 191 0 67 26 397 234 141 569 0
RTOR Reduction (vph) 0 0 0 0 0 0 0 0 0 0 0 0
Lane Group Flow (vph) 2 8 0 191 67 0 26 397 234 141 569 0
Turn Type Perm Perm pm+pt Perm pm+pt
Protected Phases 4 8 5 2 1 6
Permitted Phases 4 8 2 2 6
Actuated Green, G (s) 9.8 9.8 9.8 9.8 19.0 18.1 18.1 25.6 21.4
Effective Green, g (s) 11.8 11.8 11.8 11.8 23.0 20.1 20.1 29.6 23.4
Actuated g/C Ratio 0.24 0.24 0.24 0.24 0.46 0.40 0.40 0.59 0.47
Clearance Time (s) 6.0 6.0 6.0 6.0 6.0 6.0 6.0 6.0 6.0
Vehicle Extension (s) 3.0 3.0 3.0 3.0 3.0 3.0 3.0 3.0 3.0
Lane Grp Cap (vph) 292 348 308 348 430 1420 635 606 1653
v/s Ratio Prot 0.01 0.05 0.00 0.11 c0.03 c0.16
v/s Ratio Perm 0.00 c0.15 0.02 0.15 0.11
v/c Ratio 0.01 0.02 0.62 0.19 0.06 0.28 0.37 0.23 0.34
Uniform Delay, d1 14.7 14.7 17.1 15.3 7.4 10.1 10.5 4.7 8.5
Progression Factor 1.00 1.00 1.00 1.00 1.00 1.00 1.00 1.00 1.00
Incremental Delay, d2 0.0 0.0 3.8 0.3 0.1 0.1 0.4 0.2 0.1
Delay (s) 14.7 14.7 21.0 15.6 7.5 10.2 10.9 4.9 8.6
Level of Service B B C B A B B A A
Approach Delay (s) 14.7 19.6 10.4 7.9
Approach LOS B B B A
Intersection Summary
HCM Average Control Delay 10.8 HCM Level of Service B
HCM Volume to Capacity ratio 0.44
Actuated Cycle Length (s) 50.1 Sum of lost time (s) 12.0
Intersection Capacity Utilization 45.3% ICU Level of Service A
Analysis Period (min) 15
c Critical Lane Group

HCM Unsignalized Intersection Capacity Analysis
3: SR 334 WB Off Ramp & Urbana Road 12/27/2011
Northridge Sub-Area Study 5:00 pm 6/9/2011 PM Existing Synchro 7 - Report
Page 1
Movement WBL WBR NBT NBR SBL SBT
Lane Configurations
Volume (veh/h) 114 11 627 0 0 453
Sign Control Stop Free Free
Grade -4% 2% -2%
Peak Hour Factor 0.90 0.90 0.90 0.90 0.90 0.90
Hourly flow rate (vph) 127 12 697 0 0 503
Pedestrians
Lane Width (ft)
Walking Speed (ft/s)
Percent Blockage
Right turn flare (veh)
Median type None None
Median storage veh)
Upstream signal (ft)
pX, platoon unblocked
vC, conflicting volume 948 348 697
vC1, stage 1 conf vol
vC2, stage 2 conf vol
vCu, unblocked vol 948 348 697
tC, single (s) 6.8 6.9 4.1
tC, 2 stage (s)
tF (s) 3.5 3.3 2.2
p0 queue free % 51 98 100
cM capacity (veh/h) 259 648 895
Direction, Lane # WB 1 NB 1 NB 2 SB 1 SB 2
Volume Total 139 348 348 252 252
Volume Left 127 0 0 0 0
Volume Right 12 0 0 0 0
cSH 274 1700 1700 1700 1700
Volume to Capacity 0.51 0.20 0.20 0.15 0.15
Queue Length 95th (ft) 67 0 0 0 0
Control Delay (s) 30.9 0.0 0.0 0.0 0.0
Lane LOS D
Approach Delay (s) 30.9 0.0 0.0
Approach LOS D
Intersection Summary
Average Delay 3.2
Intersection Capacity Utilization 31.0% ICU Level of Service A
Analysis Period (min) 15

HCM Unsignalized Intersection Capacity Analysis
6: SR 334 EB On Ramp & Urbana Road 12/27/2011
Northridge Sub-Area Study 5:00 pm 6/9/2011 PM Existing Synchro 7 - Report
Page 2
Movement WBL WBR NBT NBR SBL SBT
Lane Configurations
Volume (veh/h) 0 0 570 192 23 556
Sign Control Stop Free Free
Grade 0% 2% 0%
Peak Hour Factor 0.90 0.90 0.90 0.90 0.90 0.90
Hourly flow rate (vph) 0 0 633 213 26 618
Pedestrians
Lane Width (ft)
Walking Speed (ft/s)
Percent Blockage
Right turn flare (veh)
Median type None None
Median storage veh)
Upstream signal (ft)
pX, platoon unblocked
vC, conflicting volume 993 317 633
vC1, stage 1 conf vol
vC2, stage 2 conf vol
vCu, unblocked vol 993 317 633
tC, single (s) 6.8 6.9 4.1
tC, 2 stage (s)
tF (s) 3.5 3.3 2.2
p0 queue free % 100 100 97
cM capacity (veh/h) 236 679 946
Direction, Lane # NB 1 NB 2 NB 3 SB 1 SB 2 SB 3
Volume Total 317 317 213 26 309 309
Volume Left 0 0 0 26 0 0
Volume Right 0 0 213 0 0 0
cSH 1700 1700 1700 946 1700 1700
Volume to Capacity 0.19 0.19 0.13 0.03 0.18 0.18
Queue Length 95th (ft) 0 0 0 2 0 0
Control Delay (s) 0.0 0.0 0.0 8.9 0.0 0.0
Lane LOS A
Approach Delay (s) 0.0 0.4
Approach LOS
Intersection Summary
Average Delay 0.2
Intersection Capacity Utilization 28.6% ICU Level of Service A
Analysis Period (min) 15

HCM Unsignalized Intersection Capacity Analysis
14: Urbana Road & SR 334 WB On Ramp 12/27/2011
Northridge Sub-Area Study 5:00 pm 6/9/2011 PM Existing Synchro 7 - Report
Page 4
Movement NBT NBR SBL SBT SWL SWR
Lane Configurations
Volume (veh/h) 627 43 0 567 0 0
Sign Control Free Free Stop
Grade 0% 0% 0%
Peak Hour Factor 0.90 0.90 0.90 0.90 0.90 0.90
Hourly flow rate (vph) 697 48 0 630 0 0
Pedestrians
Lane Width (ft)
Walking Speed (ft/s)
Percent Blockage
Right turn flare (veh)
Median type None None
Median storage veh)
Upstream signal (ft)
pX, platoon unblocked
vC, conflicting volume 744 1012 348
vC1, stage 1 conf vol
vC2, stage 2 conf vol
vCu, unblocked vol 744 1012 348
tC, single (s) 4.1 6.8 6.9
tC, 2 stage (s)
tF (s) 2.2 3.5 3.3
p0 queue free % 100 100 100
cM capacity (veh/h) 859 236 648
Direction, Lane # NB 1 NB 2 NB 3 SB 1 SB 2
Volume Total 348 348 48 315 315
Volume Left 0 0 0 0 0
Volume Right 0 0 48 0 0
cSH 1700 1700 1700 1700 1700
Volume to Capacity 0.20 0.20 0.03 0.19 0.19
Queue Length 95th (ft) 0 0 0 0 0
Control Delay (s) 0.0 0.0 0.0 0.0 0.0
Lane LOS
Approach Delay (s) 0.0 0.0
Approach LOS
Intersection Summary
Average Delay 0.0
Intersection Capacity Utilization 31.0% ICU Level of Service A
Analysis Period (min) 15

HCM Unsignalized Intersection Capacity Analysis
13: Villa Road & SR 4 12/27/2011
Northridge Sub-Area Study 5:00 pm 6/9/2011 PM Existing Synchro 7 - Report
Page 3
Movement EBL EBR NBL NBR SWL SWR
Lane Configurations
Volume (veh/h) 67 24 22 240 156 55
Sign Control Stop Free Free
Grade 0% 0% 0%
Peak Hour Factor 0.90 0.90 0.90 0.90 0.90 0.90
Hourly flow rate (vph) 74 27 24 267 173 61
Pedestrians
Lane Width (ft)
Walking Speed (ft/s)
Percent Blockage
Right turn flare (veh)
Median type None None
Median storage veh)
Upstream signal (ft)
pX, platoon unblocked
vC, conflicting volume 519 204 234
vC1, stage 1 conf vol
vC2, stage 2 conf vol
vCu, unblocked vol 519 204 234
tC, single (s) 6.4 6.2 4.1
tC, 2 stage (s)
tF (s) 3.5 3.3 2.2
p0 queue free % 85 97 98
cM capacity (veh/h) 507 837 1327
Direction, Lane # EB 1 NB 1 SW 1
Volume Total 101 267 234
Volume Left 74 0 0
Volume Right 27 0 61
cSH 566 1700 1700
Volume to Capacity 0.18 0.16 0.14
Queue Length 95th (ft) 16 0 0
Control Delay (s) 12.7 0.0 0.0
Lane LOS B
Approach Delay (s) 12.7 Err 0.0
Approach LOS B
Intersection Summary
Average Delay Err
Intersection Capacity Utilization Err% ICU Level of Service H
Analysis Period (min) 15
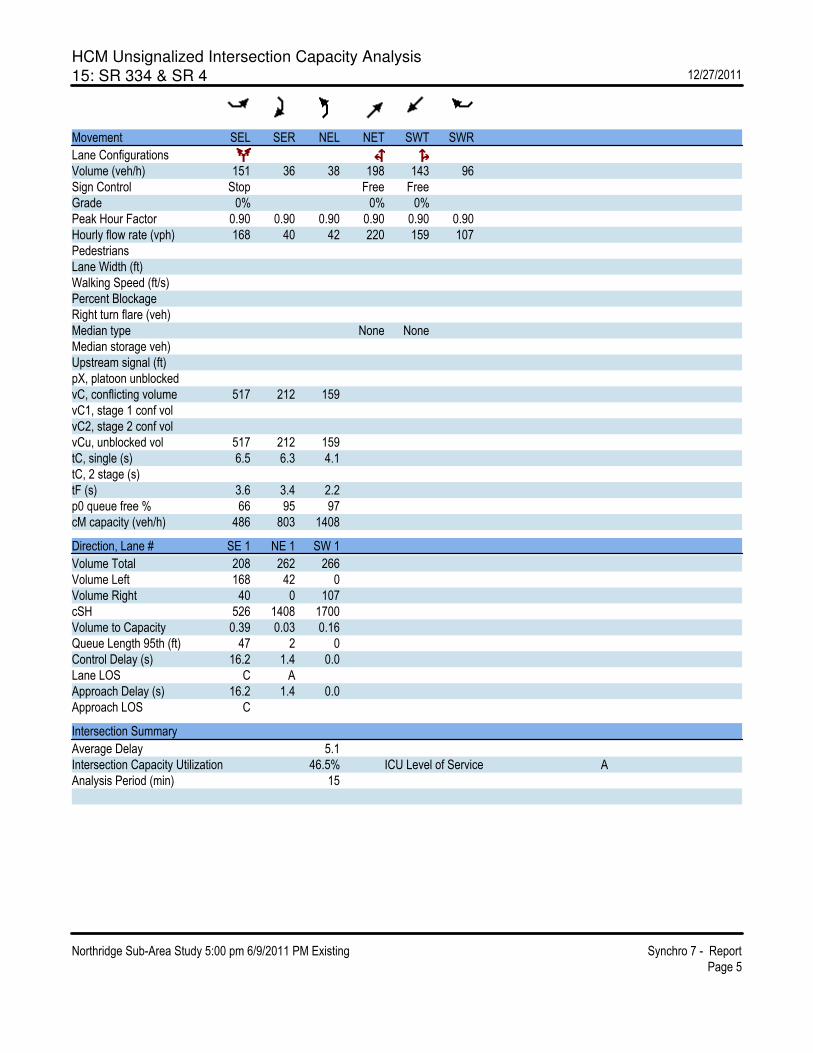
HCM Unsignalized Intersection Capacity Analysis
15: SR 334 & SR 4 12/27/2011
Northridge Sub-Area Study 5:00 pm 6/9/2011 PM Existing Synchro 7 - Report
Page 5
Movement SEL SER NEL NET SWT SWR
Lane Configurations
Volume (veh/h) 151 36 38 198 143 96
Sign Control Stop Free Free
Grade 0% 0% 0%
Peak Hour Factor 0.90 0.90 0.90 0.90 0.90 0.90
Hourly flow rate (vph) 168 40 42 220 159 107
Pedestrians
Lane Width (ft)
Walking Speed (ft/s)
Percent Blockage
Right turn flare (veh)
Median type None None
Median storage veh)
Upstream signal (ft)
pX, platoon unblocked
vC, conflicting volume 517 212 159
vC1, stage 1 conf vol
vC2, stage 2 conf vol
vCu, unblocked vol 517 212 159
tC, single (s) 6.5 6.3 4.1
tC, 2 stage (s)
tF (s) 3.6 3.4 2.2
p0 queue free % 66 95 97
cM capacity (veh/h) 486 803 1408
Direction, Lane # SE 1 NE 1 SW 1
Volume Total 208 262 266
Volume Left 168 42 0
Volume Right 40 0 107
cSH 526 1408 1700
Volume to Capacity 0.39 0.03 0.16
Queue Length 95th (ft) 47 2 0
Control Delay (s) 16.2 1.4 0.0
Lane LOS C A
Approach Delay (s) 16.2 1.4 0.0
Approach LOS C
Intersection Summary
Average Delay 5.1
Intersection Capacity Utilization 46.5% ICU Level of Service A
Analysis Period (min) 15

HCM Unsignalized Intersection Capacity Analysis
20: Middle Urbana Road & SR 4 12/27/2011
Northridge Sub-Area Study 5:00 pm 6/9/2011 PM Existing Synchro 7 - Report
Page 6
Movement EBL EBR NBL NBT SBT SBR
Lane Configurations
Volume (veh/h) 9 211 272 229 194 10
Sign Control Stop Free Free
Grade 0% 0% 0%
Peak Hour Factor 0.90 0.90 0.90 0.90 0.90 0.90
Hourly flow rate (vph) 10 234 302 254 216 11
Pedestrians
Lane Width (ft)
Walking Speed (ft/s)
Percent Blockage
Right turn flare (veh)
Median type None None
Median storage veh)
Upstream signal (ft)
pX, platoon unblocked
vC, conflicting volume 1080 221 227
vC1, stage 1 conf vol
vC2, stage 2 conf vol
vCu, unblocked vol 1080 221 227
tC, single (s) 6.4 6.2 4.1
tC, 2 stage (s)
tF (s) 3.5 3.3 2.2
p0 queue free % 95 71 77
cM capacity (veh/h) 186 816 1330
Direction, Lane # EB 1 NB 1 SB 1
Volume Total 244 557 227
Volume Left 10 302 0
Volume Right 234 0 11
cSH 717 1330 1700
Volume to Capacity 0.34 0.23 0.13
Queue Length 95th (ft) 38 22 0
Control Delay (s) 12.6 5.7 0.0
Lane LOS B A
Approach Delay (s) 12.6 5.7 0.0
Approach LOS B
Intersection Summary
Average Delay 6.1
Intersection Capacity Utilization 61.5% ICU Level of Service B
Analysis Period (min) 15

HCM Unsignalized Intersection Capacity Analysis
24: Montego Drive & Middle Urbana Road 12/27/2011
Northridge Sub-Area Study 5:00 pm 6/9/2011 PM Existing Synchro 7 - Report
Page 7
Movement EBL EBT EBR WBL WBT WBR NBL NBT NBR SBL SBT SBR
Lane Configurations
Volume (veh/h) 8 1 68 27 6 7 87 297 18 5 218 21
Sign Control Stop Stop Free Free
Grade 0% 0% 0% 0%
Peak Hour Factor 0.90 0.90 0.90 0.90 0.90 0.90 0.90 0.90 0.90 0.90 0.90 0.90
Hourly flow rate (vph) 9 1 76 30 7 8 97 330 20 6 242 23
Pedestrians
Lane Width (ft)
Walking Speed (ft/s)
Percent Blockage
Right turn flare (veh)
Median type None None
Median storage veh)
Upstream signal (ft)
pX, platoon unblocked
vC, conflicting volume 809 808 254 874 810 340 266 350
vC1, stage 1 conf vol
vC2, stage 2 conf vol
vCu, unblocked vol 809 808 254 874 810 340 266 350
tC, single (s) 7.1 6.5 6.2 7.1 6.5 6.2 4.1 4.1
tC, 2 stage (s)
tF (s) 3.5 4.0 3.3 3.5 4.0 3.3 2.2 2.2
p0 queue free % 97 100 90 87 98 99 93 100
cM capacity (veh/h) 274 291 787 231 291 707 1304 1214
Direction, Lane # EB 1 WB 1 NB 1 SB 1
Volume Total 86 44 447 271
Volume Left 9 30 97 6
Volume Right 76 8 20 23
cSH 647 271 1304 1214
Volume to Capacity 0.13 0.16 0.07 0.00
Queue Length 95th (ft) 11 14 6 0
Control Delay (s) 11.4 20.9 2.3 0.2
Lane LOS B C A A
Approach Delay (s) 11.4 20.9 2.3 0.2
Approach LOS B C
Intersection Summary
Average Delay 3.5
Intersection Capacity Utilization 53.5% ICU Level of Service A
Analysis Period (min) 15

HCM Unsignalized Intersection Capacity Analysis
30: Moorefield Road & Derr Road 12/27/2011
Northridge Sub-Area Study 5:00 pm 6/9/2011 PM Existing Synchro 7 - Report
Page 8
Movement EBT EBR WBL WBT NBL NBR
Lane Configurations
Sign Control Stop Stop Stop
Volume (vph) 207 36 76 130 39 122
Peak Hour Factor 0.90 0.90 0.90 0.90 0.90 0.90
Hourly flow rate (vph) 230 40 84 144 43 136
Direction, Lane # EB 1 WB 1 NB 1
Volume Total (vph) 270 229 179
Volume Left (vph) 0 84 43
Volume Right (vph) 40 0 136
Hadj (s) -0.09 0.07 -0.41
Departure Headway (s) 4.5 4.7 4.6
Degree Utilization, x 0.34 0.30 0.23
Capacity (veh/h) 753 723 711
Control Delay (s) 9.9 9.8 9.0
Approach Delay (s) 9.9 9.8 9.0
Approach LOS A A A
Intersection Summary
Delay 9.6
HCM Level of Service A
Intersection Capacity Utilization 43.8% ICU Level of Service A
Analysis Period (min) 15

HCM Unsignalized Intersection Capacity Analysis
31: Montego Drive & Derr Road 12/27/2011
Northridge Sub-Area Study 5:00 pm 6/9/2011 PM Existing Synchro 7 - Report
Page 9
Movement WBL WBR NBT NBR SBL SBT
Lane Configurations
Volume (veh/h) 102 10 289 179 13 172
Sign Control Stop Free Free
Grade 0% 0% 0%
Peak Hour Factor 0.90 0.90 0.90 0.90 0.90 0.90
Hourly flow rate (vph) 113 11 321 199 14 191
Pedestrians
Lane Width (ft)
Walking Speed (ft/s)
Percent Blockage
Right turn flare (veh)
Median type None None
Median storage veh)
Upstream signal (ft)
pX, platoon unblocked
vC, conflicting volume 641 421 520
vC1, stage 1 conf vol
vC2, stage 2 conf vol
vCu, unblocked vol 641 421 520
tC, single (s) 6.4 6.2 4.1
tC, 2 stage (s)
tF (s) 3.5 3.3 2.2
p0 queue free % 74 98 99
cM capacity (veh/h) 436 637 1056
Direction, Lane # WB 1 NB 1 SB 1
Volume Total 124 520 206
Volume Left 113 0 14
Volume Right 11 199 0
cSH 449 1700 1056
Volume to Capacity 0.28 0.31 0.01
Queue Length 95th (ft) 28 0 1
Control Delay (s) 16.1 0.0 0.7
Lane LOS C A
Approach Delay (s) 16.1 0.0 0.7
Approach LOS C
Intersection Summary
Average Delay 2.5
Intersection Capacity Utilization 39.1% ICU Level of Service A
Analysis Period (min) 15
HCM Unsignalized Intersection Capacity Analysis
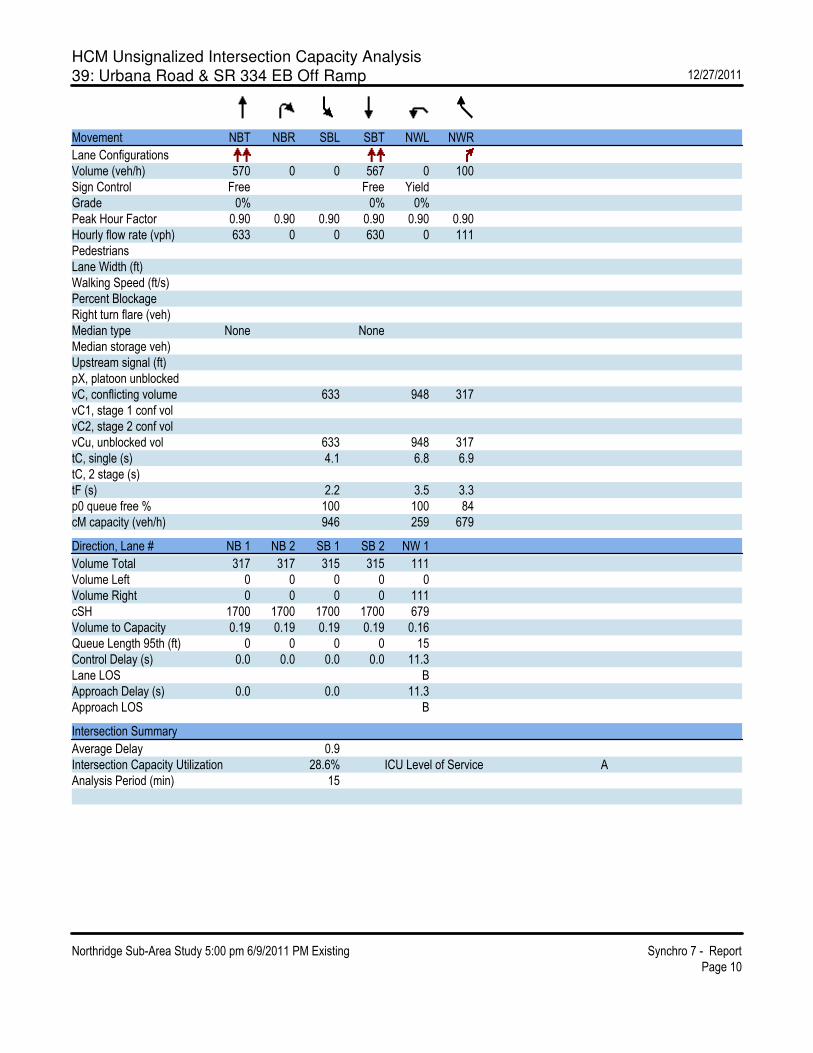
39: Urbana Road & SR 334 EB Off Ramp 12/27/2011
Northridge Sub-Area Study 5:00 pm 6/9/2011 PM Existing Synchro 7 - Report
Page 10
Movement NBT NBR SBL SBT NWL NWR
Lane Configurations
Volume (veh/h) 570 0 0 567 0 100
Sign Control Free Free Yield
Grade 0% 0% 0%
Peak Hour Factor 0.90 0.90 0.90 0.90 0.90 0.90
Hourly flow rate (vph) 633 0 0 630 0 111
Pedestrians
Lane Width (ft)
Walking Speed (ft/s)
Percent Blockage
Right turn flare (veh)
Median type None None
Median storage veh)
Upstream signal (ft)
pX, platoon unblocked
vC, conflicting volume 633 948 317
vC1, stage 1 conf vol
vC2, stage 2 conf vol
vCu, unblocked vol 633 948 317
tC, single (s) 4.1 6.8 6.9
tC, 2 stage (s)
tF (s) 2.2 3.5 3.3
p0 queue free % 100 100 84
cM capacity (veh/h) 946 259 679
Direction, Lane # NB 1 NB 2 SB 1 SB 2 NW 1
Volume Total 317 317 315 315 111
Volume Left 0 0 0 0 0
Volume Right 0 0 0 0 111
cSH 1700 1700 1700 1700 679
Volume to Capacity 0.19 0.19 0.19 0.19 0.16
Queue Length 95th (ft) 0 0 0 0 15
Control Delay (s) 0.0 0.0 0.0 0.0 11.3
Lane LOS B
Approach Delay (s) 0.0 0.0 11.3
Approach LOS B
Intersection Summary
Average Delay 0.9
Intersection Capacity Utilization 28.6% ICU Level of Service A
Analysis Period (min) 15

HCM Signalized Intersection Capacity Analysis
11: Home Road & SR 4 12/27/2011
CLA-Northridge Sub-Area Study 7:00 am 5/27/2011 2035 No Build Synchro 7 - Report
EMH, LJB Inc. Page 1
Movement EBL EBT EBR WBL WBT WBR NBL NBT NBR SBL SBT SBR
Lane Configurations
Volume (vph) 20 100 10 20 110 210 20 170 20 380 410 60
Ideal Flow (vphpl) 1900 1900 1900 1900 1900 1900 1900 1900 1900 1900 1900 1900
Grade (%) 0% 3% 5% 0%
Total Lost time (s) 4.0 4.0 4.0 4.0 4.0 4.0 4.0 4.0
Lane Util. Factor 1.00 1.00 1.00 1.00 1.00 0.95 1.00 0.95
Frt 1.00 0.99 1.00 0.90 1.00 0.98 1.00 0.98
Flt Protected 0.95 1.00 0.95 1.00 0.95 1.00 0.95 1.00
Satd. Flow (prot) 1770 1838 1726 1638 1645 3238 1752 3438
Flt Permitted 0.43 1.00 0.68 1.00 0.45 1.00 0.62 1.00
Satd. Flow (perm) 807 1838 1233 1638 773 3238 1143 3438
Peak-hour factor, PHF 0.90 0.90 0.90 0.90 0.90 0.90 0.90 0.90 0.90 0.90 0.90 0.90
Adj. Flow (vph) 22 111 11 22 122 233 22 189 22 422 456 67
RTOR Reduction (vph) 0 0 0 0 0 0 0 0 0 0 0 0
Lane Group Flow (vph) 22 122 0 22 355 0 22 211 0 422 523 0
Heavy Vehicles (%) 2% 2% 2% 3% 3% 3% 7% 7% 7% 3% 3% 3%
Turn Type Perm Perm Perm Perm
Protected Phases 4 8 2 6
Permitted Phases 4 8 2 6
Actuated Green, G (s) 15.4 15.4 15.4 15.4 21.2 21.2 21.2 21.2
Effective Green, g (s) 17.4 17.4 17.4 17.4 23.2 23.2 23.2 23.2
Actuated g/C Ratio 0.36 0.36 0.36 0.36 0.48 0.48 0.48 0.48
Clearance Time (s) 6.0 6.0 6.0 6.0 6.0 6.0 6.0 6.0
Vehicle Extension (s) 3.0 3.0 3.0 3.0 3.0 3.0 3.0 3.0
Lane Grp Cap (vph) 289 658 441 586 369 1546 546 1641
v/s Ratio Prot 0.07 c0.22 0.07 0.15
v/s Ratio Perm 0.03 0.02 0.03 c0.37
v/c Ratio 0.08 0.19 0.05 0.61 0.06 0.14 0.77 0.32
Uniform Delay, d1 10.3 10.7 10.2 12.8 6.8 7.1 10.5 7.8
Progression Factor 1.00 1.00 1.00 1.00 1.00 1.00 1.00 1.00
Incremental Delay, d2 0.1 0.1 0.0 1.8 0.3 0.2 10.2 0.5
Delay (s) 10.4 10.9 10.2 14.6 7.1 7.3 20.7 8.3
Level of Service B B B B A A C A
Approach Delay (s) 10.8 14.3 7.3 13.9
Approach LOS B B A B
Intersection Summary
HCM Average Control Delay 12.8 HCM Level of Service B
HCM Volume to Capacity ratio 0.70
Actuated Cycle Length (s) 48.6 Sum of lost time (s) 8.0
Intersection Capacity Utilization 55.6% ICU Level of Service B
Analysis Period (min) 15
c Critical Lane Group

HCM Signalized Intersection Capacity Analysis
19: Villa Road & Middle Urbana Road 12/27/2011
CLA-Northridge Sub-Area Study 7:00 am 5/27/2011 2035 No Build Synchro 7 - Report
EMH, LJB Inc. Page 3
Movement EBL EBT EBR WBL WBT WBR NBL NBT NBR SBL SBT SBR
Lane Configurations
Volume (vph) 200 70 70 10 90 60 60 310 20 10 400 200
Ideal Flow (vphpl) 1900 1900 1900 1900 1900 1900 1900 1900 1900 1900 1900 1900
Lane Width 12 10 13 12 10 12 12 12 12 12 12 12
Total Lost time (s) 4.0 4.0 4.0 4.0 4.0 4.0 4.0 4.0
Lane Util. Factor 1.00 1.00 1.00 1.00 1.00 1.00 1.00 1.00
Frt 1.00 1.00 0.85 0.95 1.00 0.99 1.00 0.95
Flt Protected 0.95 1.00 1.00 1.00 0.95 1.00 0.95 1.00
Satd. Flow (prot) 1805 1773 1669 1678 1805 1883 1805 1805
Flt Permitted 0.38 1.00 1.00 0.98 0.13 1.00 0.49 1.00
Satd. Flow (perm) 730 1773 1669 1651 252 1883 934 1805
Peak-hour factor, PHF 0.90 0.90 0.90 0.90 0.90 0.90 0.90 0.90 0.90 0.90 0.90 0.90
Adj. Flow (vph) 222 78 78 11 100 67 67 344 22 11 444 222
RTOR Reduction (vph) 0 0 0 0 0 0 0 0 0 0 0 0
Lane Group Flow (vph) 222 78 78 0 178 0 67 366 0 11 666 0
Heavy Vehicles (%) 0% 0% 0% 0% 0% 0% 0% 0% 0% 0% 0% 0%
Turn Type pm+pt Perm Perm pm+pt pm+pt
Protected Phases 7 4 8 5 2 1 6
Permitted Phases 4 4 8 2 6
Actuated Green, G (s) 25.7 25.7 25.7 13.6 42.0 37.4 35.0 33.9
Effective Green, g (s) 27.7 27.7 27.7 15.6 46.0 39.4 39.0 35.9
Actuated g/C Ratio 0.34 0.34 0.34 0.19 0.56 0.48 0.47 0.44
Clearance Time (s) 6.0 6.0 6.0 6.0 6.0 6.0 6.0 6.0
Vehicle Extension (s) 3.0 3.0 3.0 3.0 3.0 3.0 3.0 3.0
Lane Grp Cap (vph) 352 597 562 313 266 903 476 788
v/s Ratio Prot c0.06 0.04 c0.02 0.19 0.00 c0.37
v/s Ratio Perm c0.15 0.05 0.11 0.12 0.01
v/c Ratio 0.63 0.13 0.14 0.57 0.25 0.41 0.02 0.85
Uniform Delay, d1 21.5 18.9 19.0 30.2 13.0 13.8 11.5 20.7
Progression Factor 1.00 1.00 1.00 1.00 1.00 1.00 1.00 1.00
Incremental Delay, d2 3.7 0.1 0.1 2.4 0.5 1.4 0.0 10.8
Delay (s) 25.2 19.0 19.1 32.6 13.5 15.2 11.5 31.5
Level of Service C B B C B B B C
Approach Delay (s) 22.6 32.6 14.9 31.1
Approach LOS C C B C
Intersection Summary
HCM Average Control Delay 25.2 HCM Level of Service C
HCM Volume to Capacity ratio 0.74
Actuated Cycle Length (s) 82.2 Sum of lost time (s) 16.0
Intersection Capacity Utilization 71.6% ICU Level of Service C
Analysis Period (min) 15
c Critical Lane Group

HCM Signalized Intersection Capacity Analysis
21: SR 334 & Middle Urbana Road 12/27/2011
CLA-Northridge Sub-Area Study 7:00 am 5/27/2011 2035 No Build Synchro 7 - Report
EMH, LJB Inc. Page 4
Movement EBL EBT EBR WBL WBT WBR NBL NBT NBR SBL SBT SBR
Lane Configurations
Volume (vph) 90 80 170 30 130 30 120 220 10 20 380 130
Ideal Flow (vphpl) 1900 1900 1900 1900 1900 1900 1900 1900 1900 1900 1900 1900
Total Lost time (s) 4.0 4.0 4.0 4.0 4.0 4.0 4.0 4.0
Lane Util. Factor 1.00 1.00 1.00 1.00 1.00 1.00 1.00 1.00
Frt 1.00 0.90 1.00 0.97 1.00 0.99 1.00 0.96
Flt Protected 0.95 1.00 0.95 1.00 0.95 1.00 0.95 1.00
Satd. Flow (prot) 1703 1629 1770 1811 1770 1851 1770 1792
Flt Permitted 0.65 1.00 0.53 1.00 0.32 1.00 0.60 1.00
Satd. Flow (perm) 1157 1629 997 1811 591 1851 1120 1792
Peak-hour factor, PHF 0.90 0.90 0.90 0.90 0.90 0.90 0.90 0.90 0.90 0.90 0.90 0.90
Adj. Flow (vph) 100 89 189 33 144 33 133 244 11 22 422 144
RTOR Reduction (vph) 0 0 0 0 0 0 0 0 0 0 0 0
Lane Group Flow (vph) 100 278 0 33 177 0 133 255 0 22 566 0
Heavy Vehicles (%) 6% 2% 6% 2% 2% 2% 2% 2% 2% 2% 2% 2%
Turn Type Perm Perm Perm Perm
Protected Phases 4 8 2 6
Permitted Phases 4 8 2 6
Actuated Green, G (s) 12.4 12.4 12.4 12.4 19.1 19.1 19.1 19.1
Effective Green, g (s) 14.4 14.4 14.4 14.4 21.1 21.1 21.1 21.1
Actuated g/C Ratio 0.33 0.33 0.33 0.33 0.49 0.49 0.49 0.49
Clearance Time (s) 6.0 6.0 6.0 6.0 6.0 6.0 6.0 6.0
Vehicle Extension (s) 3.0 3.0 3.0 3.0 3.0 3.0 3.0 3.0
Lane Grp Cap (vph) 383 539 330 600 287 898 543 869
v/s Ratio Prot c0.17 0.10 0.14 c0.32
v/s Ratio Perm 0.09 0.03 0.22 0.02
v/c Ratio 0.26 0.52 0.10 0.29 0.46 0.28 0.04 0.65
Uniform Delay, d1 10.7 11.7 10.1 10.8 7.4 6.7 5.9 8.4
Progression Factor 1.00 1.00 1.00 1.00 1.00 1.00 1.00 1.00
Incremental Delay, d2 0.4 0.8 0.1 0.3 5.3 0.8 0.1 3.8
Delay (s) 11.0 12.6 10.2 11.1 12.7 7.5 6.0 12.2
Level of Service B B B B B A A B
Approach Delay (s) 12.2 10.9 9.3 12.0
Approach LOS B B A B
Intersection Summary
HCM Average Control Delay 11.2 HCM Level of Service B
HCM Volume to Capacity ratio 0.60
Actuated Cycle Length (s) 43.5 Sum of lost time (s) 8.0
Intersection Capacity Utilization 68.4% ICU Level of Service C
Analysis Period (min) 15
c Critical Lane Group
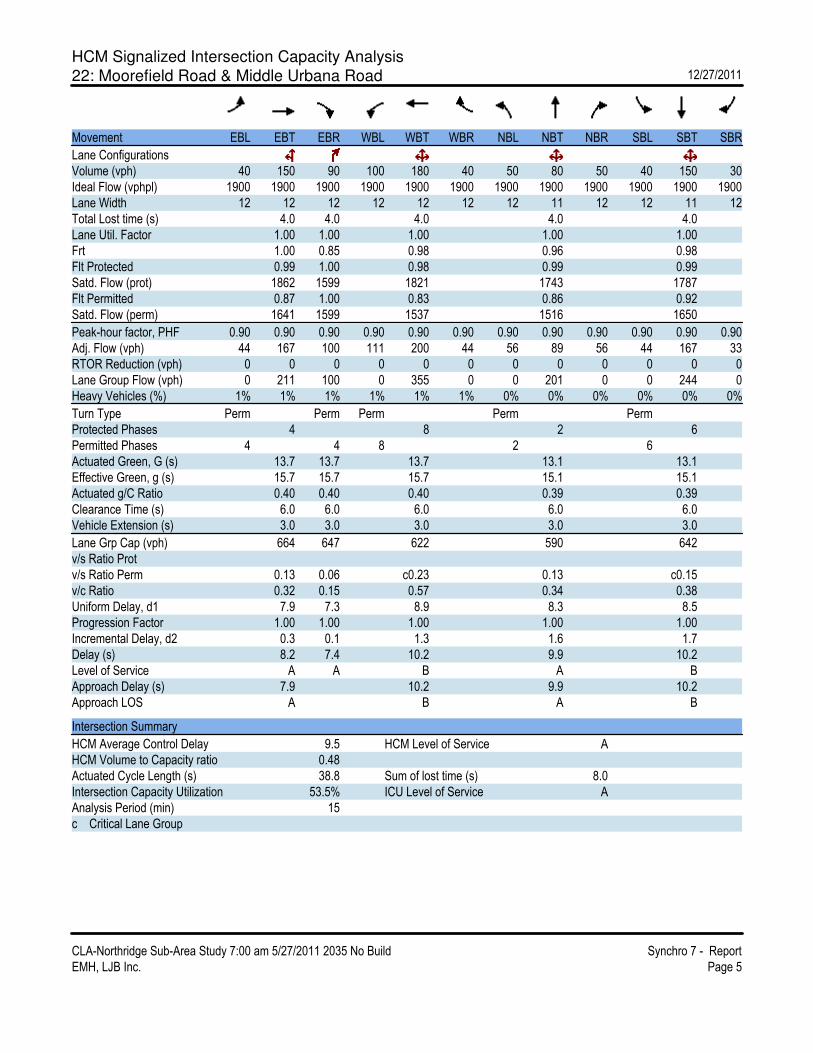
HCM Signalized Intersection Capacity Analysis
22: Moorefield Road & Middle Urbana Road 12/27/2011
CLA-Northridge Sub-Area Study 7:00 am 5/27/2011 2035 No Build Synchro 7 - Report
EMH, LJB Inc. Page 5
Movement EBL EBT EBR WBL WBT WBR NBL NBT NBR SBL SBT SBR
Lane Configurations
Volume (vph) 40 150 90 100 180 40 50 80 50 40 150 30
Ideal Flow (vphpl) 1900 1900 1900 1900 1900 1900 1900 1900 1900 1900 1900 1900
Lane Width 12 12 12 12 12 12 12 11 12 12 11 12
Total Lost time (s) 4.0 4.0 4.0 4.0 4.0
Lane Util. Factor 1.00 1.00 1.00 1.00 1.00
Frt 1.00 0.85 0.98 0.96 0.98
Flt Protected 0.99 1.00 0.98 0.99 0.99
Satd. Flow (prot) 1862 1599 1821 1743 1787
Flt Permitted 0.87 1.00 0.83 0.86 0.92
Satd. Flow (perm) 1641 1599 1537 1516 1650
Peak-hour factor, PHF 0.90 0.90 0.90 0.90 0.90 0.90 0.90 0.90 0.90 0.90 0.90 0.90
Adj. Flow (vph) 44 167 100 111 200 44 56 89 56 44 167 33
RTOR Reduction (vph) 0 0 0 0 0 0 0 0 0 0 0 0
Lane Group Flow (vph) 0 211 100 0 355 0 0 201 0 0 244 0
Heavy Vehicles (%) 1% 1% 1% 1% 1% 1% 0% 0% 0% 0% 0% 0%
Turn Type Perm Perm Perm Perm Perm
Protected Phases 4 8 2 6
Permitted Phases 4 4 8 2 6
Actuated Green, G (s) 13.7 13.7 13.7 13.1 13.1
Effective Green, g (s) 15.7 15.7 15.7 15.1 15.1
Actuated g/C Ratio 0.40 0.40 0.40 0.39 0.39
Clearance Time (s) 6.0 6.0 6.0 6.0 6.0
Vehicle Extension (s) 3.0 3.0 3.0 3.0 3.0
Lane Grp Cap (vph) 664 647 622 590 642
v/s Ratio Prot
v/s Ratio Perm 0.13 0.06 c0.23 0.13 c0.15
v/c Ratio 0.32 0.15 0.57 0.34 0.38
Uniform Delay, d1 7.9 7.3 8.9 8.3 8.5
Progression Factor 1.00 1.00 1.00 1.00 1.00
Incremental Delay, d2 0.3 0.1 1.3 1.6 1.7
Delay (s) 8.2 7.4 10.2 9.9 10.2
Level of Service A A B A B
Approach Delay (s) 7.9 10.2 9.9 10.2
Approach LOS A B A B
Intersection Summary
HCM Average Control Delay 9.5 HCM Level of Service A
HCM Volume to Capacity ratio 0.48
Actuated Cycle Length (s) 38.8 Sum of lost time (s) 8.0
Intersection Capacity Utilization 53.5% ICU Level of Service A
Analysis Period (min) 15
c Critical Lane Group

HCM Signalized Intersection Capacity Analysis
26: Eagle City Road & Urbana Road 12/27/2011
CLA-Northridge Sub-Area Study 7:00 am 5/27/2011 2035 No Build Synchro 7 - Report
EMH, LJB Inc. Page 6
Movement EBL EBT EBR WBL WBT WBR NBL NBT NBR SBL SBT SBR
Lane Configurations
Volume (vph) 50 70 30 20 140 80 20 230 10 100 670 180
Ideal Flow (vphpl) 1900 1900 1900 1900 1900 1900 1900 1900 1900 1900 1900 1900
Grade (%) 0% 0% 2% -2%
Total Lost time (s) 4.0 4.0 4.0 4.0 4.0 4.0 4.0 4.0 4.0
Lane Util. Factor 1.00 1.00 1.00 1.00 1.00 0.95 1.00 1.00 0.95
Frt 1.00 0.96 1.00 0.95 1.00 1.00 0.85 1.00 0.97
Flt Protected 0.95 1.00 0.95 1.00 0.95 1.00 1.00 0.95 1.00
Satd. Flow (prot) 1787 1797 1787 1779 1752 3504 1567 1805 3495
Flt Permitted 0.61 1.00 0.53 1.00 0.23 1.00 1.00 0.52 1.00
Satd. Flow (perm) 1141 1797 996 1779 419 3504 1567 985 3495
Peak-hour factor, PHF 0.90 0.90 0.90 0.90 0.90 0.90 0.90 0.90 0.90 0.90 0.90 0.90
Adj. Flow (vph) 56 78 33 22 156 89 22 256 11 111 744 200
RTOR Reduction (vph) 0 0 0 0 0 0 0 0 0 0 0 0
Lane Group Flow (vph) 56 111 0 22 245 0 22 256 11 111 944 0
Heavy Vehicles (%) 1% 1% 1% 1% 1% 1% 2% 2% 2% 1% 1% 1%
Turn Type Perm pm+pt pm+pt Perm pm+pt
Protected Phases 4 3 8 5 2 1 6
Permitted Phases 4 8 2 2 6
Actuated Green, G (s) 11.6 11.6 18.6 18.6 23.2 22.2 22.2 30.2 25.7
Effective Green, g (s) 13.6 13.6 20.6 20.6 27.2 24.2 24.2 34.2 27.7
Actuated g/C Ratio 0.21 0.21 0.33 0.33 0.43 0.38 0.38 0.54 0.44
Clearance Time (s) 6.0 6.0 6.0 6.0 6.0 6.0 6.0 6.0 6.0
Vehicle Extension (s) 3.0 3.0 3.0 3.0 3.0 3.0 3.0 3.0 3.0
Lane Grp Cap (vph) 245 386 362 579 243 1340 599 616 1529
v/s Ratio Prot 0.06 0.00 c0.14 0.00 0.07 c0.02 c0.27
v/s Ratio Perm 0.05 0.02 0.03 0.01 0.08
v/c Ratio 0.23 0.29 0.06 0.42 0.09 0.19 0.02 0.18 0.62
Uniform Delay, d1 20.5 20.8 14.7 16.7 10.7 13.0 12.2 7.2 13.7
Progression Factor 1.00 1.00 1.00 1.00 1.00 1.00 1.00 1.00 1.00
Incremental Delay, d2 0.5 0.4 0.1 0.5 0.2 0.3 0.1 0.1 1.9
Delay (s) 21.0 21.2 14.8 17.2 10.9 13.3 12.2 7.4 15.6
Level of Service C C B B B B B A B
Approach Delay (s) 21.1 17.0 13.1 14.7
Approach LOS C B B B
Intersection Summary
HCM Average Control Delay 15.4 HCM Level of Service B
HCM Volume to Capacity ratio 0.52
Actuated Cycle Length (s) 63.3 Sum of lost time (s) 12.0
Intersection Capacity Utilization 60.7% ICU Level of Service B
Analysis Period (min) 15
c Critical Lane Group

HCM Signalized Intersection Capacity Analysis
27: Villa Road & Derr Road 12/27/2011
CLA-Northridge Sub-Area Study 7:00 am 5/27/2011 2035 No Build Synchro 7 - Report
EMH, LJB Inc. Page 7
Movement EBL EBT EBR WBL WBT WBR NBL NBT NBR SBL SBT SBR
Lane Configurations
Volume (vph) 30 130 70 100 290 30 100 70 70 80 250 110
Ideal Flow (vphpl) 1900 1900 1900 1900 1900 1900 1900 1900 1900 1900 1900 1900
Lane Width 10 12 12 12 12 12 11 12 11 12 12 12
Total Lost time (s) 4.0 4.0 4.0 4.0 4.0 4.0 4.0 4.0 4.0
Lane Util. Factor 1.00 0.95 1.00 1.00 1.00 1.00 1.00 1.00 1.00
Frt 1.00 0.95 1.00 0.99 1.00 1.00 0.85 1.00 0.95
Flt Protected 0.95 1.00 0.95 1.00 0.95 1.00 1.00 0.95 1.00
Satd. Flow (prot) 1685 3420 1805 1874 1745 1900 1561 1805 1813
Flt Permitted 0.32 1.00 0.61 1.00 0.32 1.00 1.00 0.71 1.00
Satd. Flow (perm) 563 3420 1165 1874 580 1900 1561 1342 1813
Peak-hour factor, PHF 0.90 0.90 0.90 0.90 0.90 0.90 0.90 0.90 0.90 0.90 0.90 0.90
Adj. Flow (vph) 33 144 78 111 322 33 111 78 78 89 278 122
RTOR Reduction (vph) 0 0 0 0 0 0 0 0 0 0 0 0
Lane Group Flow (vph) 33 222 0 111 355 0 111 78 78 89 400 0
Heavy Vehicles (%) 0% 0% 0% 0% 0% 0% 0% 0% 0% 0% 0% 0%
Turn Type pm+pt pm+pt pm+pt Perm pm+pt
Protected Phases 7 4 3 8 5 2 1 6
Permitted Phases 4 8 2 2 6
Actuated Green, G (s) 12.7 10.6 25.8 17.7 25.4 21.0 21.0 25.4 21.0
Effective Green, g (s) 16.7 12.6 27.8 19.7 29.4 23.0 23.0 29.4 23.0
Actuated g/C Ratio 0.24 0.18 0.40 0.28 0.42 0.33 0.33 0.42 0.33
Clearance Time (s) 6.0 6.0 6.0 6.0 6.0 6.0 6.0 6.0 6.0
Vehicle Extension (s) 3.0 3.0 3.0 3.0 3.0 3.0 3.0 3.0 3.0
Lane Grp Cap (vph) 202 623 572 533 354 632 519 613 603
v/s Ratio Prot 0.01 0.06 c0.03 c0.19 c0.03 0.04 0.01 c0.22
v/s Ratio Perm 0.03 0.05 0.10 0.05 0.05
v/c Ratio 0.16 0.36 0.19 0.67 0.31 0.12 0.15 0.15 0.66
Uniform Delay, d1 27.1 24.8 13.7 21.8 12.9 16.1 16.2 12.0 19.8
Progression Factor 1.00 1.00 1.00 1.00 1.00 1.00 1.00 1.00 1.00
Incremental Delay, d2 0.4 0.4 0.2 3.1 0.5 0.4 0.6 0.1 5.7
Delay (s) 27.5 25.1 13.9 25.0 13.4 16.5 16.8 12.1 25.5
Level of Service C C B C B B B B C
Approach Delay (s) 25.4 22.3 15.3 23.0
Approach LOS C C B C
Intersection Summary
HCM Average Control Delay 21.8 HCM Level of Service C
HCM Volume to Capacity ratio 0.55
Actuated Cycle Length (s) 69.2 Sum of lost time (s) 12.0
Intersection Capacity Utilization 60.8% ICU Level of Service B
Analysis Period (min) 15
c Critical Lane Group

HCM Signalized Intersection Capacity Analysis
28: SR 334 & Derr Road 12/27/2011
CLA-Northridge Sub-Area Study 7:00 am 5/27/2011 2035 No Build Synchro 7 - Report
EMH, LJB Inc. Page 8
Movement EBL EBT EBR WBL WBT WBR NBL NBT NBR SBL SBT SBR
Lane Configurations
Volume (vph) 80 250 50 20 340 10 80 120 50 30 320 250
Ideal Flow (vphpl) 1900 1900 1900 1900 1900 1900 1900 1900 1900 1900 1900 1900
Grade (%) 0% 0% -2% -2%
Total Lost time (s) 4.0 4.0 4.0 4.0 4.0 4.0 4.0 4.0 4.0
Lane Util. Factor 1.00 1.00 1.00 1.00 1.00 1.00 1.00 1.00 1.00
Frt 1.00 0.97 1.00 1.00 1.00 0.96 1.00 1.00 0.85
Flt Protected 0.95 1.00 0.95 1.00 0.95 1.00 0.95 1.00 1.00
Satd. Flow (prot) 1736 1781 1671 1752 1787 1798 1805 1900 1615
Flt Permitted 0.44 1.00 0.51 1.00 0.48 1.00 0.64 1.00 1.00
Satd. Flow (perm) 810 1781 892 1752 910 1798 1213 1900 1615
Peak-hour factor, PHF 0.90 0.90 0.90 0.90 0.90 0.90 0.90 0.90 0.90 0.90 0.90 0.90
Adj. Flow (vph) 89 278 56 22 378 11 89 133 56 33 356 278
RTOR Reduction (vph) 0 0 0 0 0 0 0 0 0 0 0 0
Lane Group Flow (vph) 89 334 0 22 389 0 89 189 0 33 356 278
Heavy Vehicles (%) 4% 4% 4% 8% 8% 8% 2% 2% 2% 1% 1% 1%
Turn Type Perm Perm Perm Perm Perm
Protected Phases 4 8 2 6
Permitted Phases 4 8 2 6 6
Actuated Green, G (s) 13.9 13.9 13.9 13.9 14.1 14.1 14.1 14.1 14.1
Effective Green, g (s) 15.9 15.9 15.9 15.9 16.1 16.1 16.1 16.1 16.1
Actuated g/C Ratio 0.40 0.40 0.40 0.40 0.40 0.40 0.40 0.40 0.40
Clearance Time (s) 6.0 6.0 6.0 6.0 6.0 6.0 6.0 6.0 6.0
Vehicle Extension (s) 3.0 3.0 3.0 3.0 3.0 3.0 3.0 3.0 3.0
Lane Grp Cap (vph) 322 708 355 696 366 724 488 765 650
v/s Ratio Prot 0.19 c0.22 0.11 c0.19
v/s Ratio Perm 0.11 0.02 0.10 0.03 0.17
v/c Ratio 0.28 0.47 0.06 0.56 0.24 0.26 0.07 0.47 0.43
Uniform Delay, d1 8.2 8.9 7.4 9.3 7.9 8.0 7.3 8.8 8.6
Progression Factor 1.00 1.00 1.00 1.00 1.00 1.00 1.00 1.00 1.00
Incremental Delay, d2 0.5 0.5 0.1 1.0 1.6 0.9 0.3 2.0 2.1
Delay (s) 8.6 9.4 7.5 10.3 9.5 8.9 7.6 10.8 10.7
Level of Service A A A B A A A B B
Approach Delay (s) 9.3 10.2 9.1 10.6
Approach LOS A B A B
Intersection Summary
HCM Average Control Delay 9.9 HCM Level of Service A
HCM Volume to Capacity ratio 0.51
Actuated Cycle Length (s) 40.0 Sum of lost time (s) 8.0
Intersection Capacity Utilization 60.3% ICU Level of Service B
Analysis Period (min) 15
c Critical Lane Group

HCM Signalized Intersection Capacity Analysis
38: Woeber Mustard Mfg & Urbana 12/27/2011
CLA-Northridge Sub-Area Study 7:00 am 5/27/2011 2035 No Build Synchro 7 - Report
EMH, LJB Inc. Page 9
Movement EBL EBT EBR WBL WBT WBR NBL NBT NBR SBL SBT SBR
Lane Configurations
Volume (vph) 0 0 2 243 0 34 7 208 45 47 305 1
Ideal Flow (vphpl) 1900 1900 1900 1900 1900 1900 1900 1900 1900 1900 1900 1900
Lane Width 10 10 12 10 10 12 12 12 12 12 12 12
Total Lost time (s) 4.0 4.0 4.0 4.0 4.0 4.0 4.0 4.0
Lane Util. Factor 1.00 1.00 1.00 1.00 0.95 1.00 1.00 0.95
Frt 0.85 1.00 0.85 1.00 1.00 0.85 1.00 1.00
Flt Protected 1.00 0.95 1.00 0.95 1.00 1.00 0.95 1.00
Satd. Flow (prot) 1478 1652 1478 1770 3539 1583 1770 3538
Flt Permitted 1.00 0.76 1.00 0.55 1.00 1.00 0.57 1.00
Satd. Flow (perm) 1478 1315 1478 1019 3539 1583 1059 3538
Peak-hour factor, PHF 0.90 0.90 0.90 0.90 0.90 0.90 0.90 0.90 0.90 0.90 0.90 0.90
Adj. Flow (vph) 0 0 2 270 0 38 8 231 50 52 339 1
RTOR Reduction (vph) 0 0 0 0 0 0 0 0 0 0 0 0
Lane Group Flow (vph) 0 2 0 270 38 0 8 231 50 52 340 0
Turn Type Perm Perm pm+pt Perm pm+pt
Protected Phases 4 8 5 2 1 6
Permitted Phases 4 8 2 2 6
Actuated Green, G (s) 14.9 14.9 14.9 13.3 12.5 12.5 15.3 13.5
Effective Green, g (s) 16.9 16.9 16.9 17.3 14.5 14.5 19.3 15.5
Actuated g/C Ratio 0.36 0.36 0.36 0.37 0.31 0.31 0.41 0.33
Clearance Time (s) 6.0 6.0 6.0 6.0 6.0 6.0 6.0 6.0
Vehicle Extension (s) 3.0 3.0 3.0 3.0 3.0 3.0 3.0 3.0
Lane Grp Cap (vph) 529 471 529 418 1087 486 490 1162
v/s Ratio Prot 0.00 0.03 0.00 0.07 c0.01 c0.10
v/s Ratio Perm c0.21 0.01 0.03 0.03
v/c Ratio 0.00 0.57 0.07 0.02 0.21 0.10 0.11 0.29
Uniform Delay, d1 9.7 12.2 10.0 9.5 12.1 11.7 8.5 11.8
Progression Factor 1.00 1.00 1.00 1.00 1.00 1.00 1.00 1.00
Incremental Delay, d2 0.0 1.7 0.1 0.0 0.1 0.1 0.1 0.1
Delay (s) 9.7 13.9 10.0 9.5 12.2 11.8 8.6 11.9
Level of Service A B B A B B A B
Approach Delay (s) 9.7 13.4 12.1 11.5
Approach LOS A B B B
Intersection Summary
HCM Average Control Delay 12.3 HCM Level of Service B
HCM Volume to Capacity ratio 0.37
Actuated Cycle Length (s) 47.2 Sum of lost time (s) 8.0
Intersection Capacity Utilization 43.6% ICU Level of Service A
Analysis Period (min) 15
c Critical Lane Group

HCM Signalized Intersection Capacity Analysis
41: Emmanuel Way & Middle Urbana Road 12/27/2011
CLA-Northridge Sub-Area Study 7:00 am 5/27/2011 2035 No Build Synchro 7 - Report
EMH, LJB Inc. Page 10
Movement WBL WBR NBT NBR SBL SBT
Lane Configurations
Volume (vph) 170 90 270 240 200 370
Ideal Flow (vphpl) 1900 1900 1900 1900 1900 1900
Lane Width 10 10 12 12 10 10
Total Lost time (s) 4.0 4.0 4.0 4.0 4.0
Lane Util. Factor 1.00 1.00 1.00 1.00 1.00
Frt 1.00 0.85 0.94 1.00 1.00
Flt Protected 0.95 1.00 1.00 0.95 1.00
Satd. Flow (prot) 1652 1478 1744 1652 1739
Flt Permitted 0.95 1.00 1.00 0.22 1.00
Satd. Flow (perm) 1652 1478 1744 389 1739
Peak-hour factor, PHF 0.90 0.90 0.90 0.90 0.90 0.90
Adj. Flow (vph) 189 100 300 267 222 411
RTOR Reduction (vph) 0 0 0 0 0 0
Lane Group Flow (vph) 189 100 567 0 222 411
Turn Type Perm pm+pt
Protected Phases 8 2 1 6
Permitted Phases 8 6
Actuated Green, G (s) 12.1 12.1 25.1 37.1 37.1
Effective Green, g (s) 14.1 14.1 27.1 39.1 39.1
Actuated g/C Ratio 0.23 0.23 0.44 0.64 0.64
Clearance Time (s) 6.0 6.0 6.0 6.0 6.0
Vehicle Extension (s) 3.0 3.0 3.0 3.0 3.0
Lane Grp Cap (vph) 381 341 772 414 1111
v/s Ratio Prot c0.11 c0.33 c0.07 0.24
v/s Ratio Perm 0.07 0.27
v/c Ratio 0.50 0.29 0.73 0.54 0.37
Uniform Delay, d1 20.5 19.4 14.1 7.4 5.2
Progression Factor 1.00 1.00 1.00 1.00 1.00
Incremental Delay, d2 1.0 0.5 6.1 1.3 0.9
Delay (s) 21.5 19.9 20.2 8.8 6.2
Level of Service C B C A A
Approach Delay (s) 20.9 20.2 7.1
Approach LOS C C A
Intersection Summary
HCM Average Control Delay 14.8 HCM Level of Service B
HCM Volume to Capacity ratio 0.64
Actuated Cycle Length (s) 61.2 Sum of lost time (s) 12.0
Intersection Capacity Utilization 59.4% ICU Level of Service B
Analysis Period (min) 15
c Critical Lane Group

HCM Signalized Intersection Capacity Analysis
44: Providence & Derr Road 12/27/2011
CLA-Northridge Sub-Area Study 7:00 am 5/27/2011 2035 No Build Synchro 7 - Report
EMH, LJB Inc. Page 11
Movement WBL WBR NBT NBR SBL SBT
Lane Configurations
Volume (vph) 120 60 290 20 20 520
Ideal Flow (vphpl) 1900 1900 1900 1900 1900 1900
Lane Width 16 12 11 11 11 11
Total Lost time (s) 4.0 4.0 4.0 4.0
Lane Util. Factor 1.00 0.95 1.00 0.95
Frt 0.95 0.99 1.00 1.00
Flt Protected 0.97 1.00 0.95 1.00
Satd. Flow (prot) 1951 3388 1711 3421
Flt Permitted 0.97 1.00 0.55 1.00
Satd. Flow (perm) 1951 3388 982 3421
Peak-hour factor, PHF 0.90 0.90 0.90 0.90 0.90 0.90
Adj. Flow (vph) 133 67 322 22 22 578
RTOR Reduction (vph) 0 0 0 0 0 0
Lane Group Flow (vph) 200 0 344 0 22 578
Turn Type Perm
Protected Phases 8 2 6
Permitted Phases 6
Actuated Green, G (s) 6.8 11.5 11.5 11.5
Effective Green, g (s) 8.8 13.5 13.5 13.5
Actuated g/C Ratio 0.29 0.45 0.45 0.45
Clearance Time (s) 6.0 6.0 6.0 6.0
Vehicle Extension (s) 3.0 3.0 3.0 3.0
Lane Grp Cap (vph) 567 1510 438 1524
v/s Ratio Prot c0.10 0.10 c0.17
v/s Ratio Perm 0.02
v/c Ratio 0.35 0.23 0.05 0.38
Uniform Delay, d1 8.5 5.2 4.8 5.6
Progression Factor 1.00 1.00 1.00 1.00
Incremental Delay, d2 0.4 0.1 0.0 0.2
Delay (s) 8.9 5.3 4.8 5.8
Level of Service A A A A
Approach Delay (s) 8.9 5.3 5.7
Approach LOS A A A
Intersection Summary
HCM Average Control Delay 6.1 HCM Level of Service A
HCM Volume to Capacity ratio 0.37
Actuated Cycle Length (s) 30.3 Sum of lost time (s) 8.0
Intersection Capacity Utilization 33.6% ICU Level of Service A
Analysis Period (min) 15
c Critical Lane Group

HCM Unsignalized Intersection Capacity Analysis
3: SR 334 WB Off Ramp & Urbana Road 12/27/2011
CLA-Northridge Sub-Area Study 7:00 am 5/27/2011 2035 No Build Synchro 7 - Report
EMH, LJB Inc. Page 1
Movement WBL WBR NBT NBR SBL SBT
Lane Configurations
Volume (veh/h) 170 20 280 0 0 690
Sign Control Stop Free Free
Grade -4% 2% -2%
Peak Hour Factor 0.90 0.90 0.90 0.90 0.90 0.90
Hourly flow rate (vph) 189 22 311 0 0 767
Pedestrians
Lane Width (ft)
Walking Speed (ft/s)
Percent Blockage
Right turn flare (veh)
Median type None None
Median storage veh)
Upstream signal (ft)
pX, platoon unblocked
vC, conflicting volume 694 156 311
vC1, stage 1 conf vol
vC2, stage 2 conf vol
vCu, unblocked vol 694 156 311
tC, single (s) 6.8 6.9 4.1
tC, 2 stage (s)
tF (s) 3.5 3.3 2.2
p0 queue free % 50 97 100
cM capacity (veh/h) 377 863 1246
Direction, Lane # WB 1 NB 1 NB 2 SB 1 SB 2
Volume Total 211 156 156 383 383
Volume Left 189 0 0 0 0
Volume Right 22 0 0 0 0
cSH 401 1700 1700 1700 1700
Volume to Capacity 0.53 0.09 0.09 0.23 0.23
Queue Length 95th (ft) 74 0 0 0 0
Control Delay (s) 23.5 0.0 0.0 0.0 0.0
Lane LOS C
Approach Delay (s) 23.5 0.0 0.0
Approach LOS C
Intersection Summary
Average Delay 3.9
Intersection Capacity Utilization 36.4% ICU Level of Service A
Analysis Period (min) 15
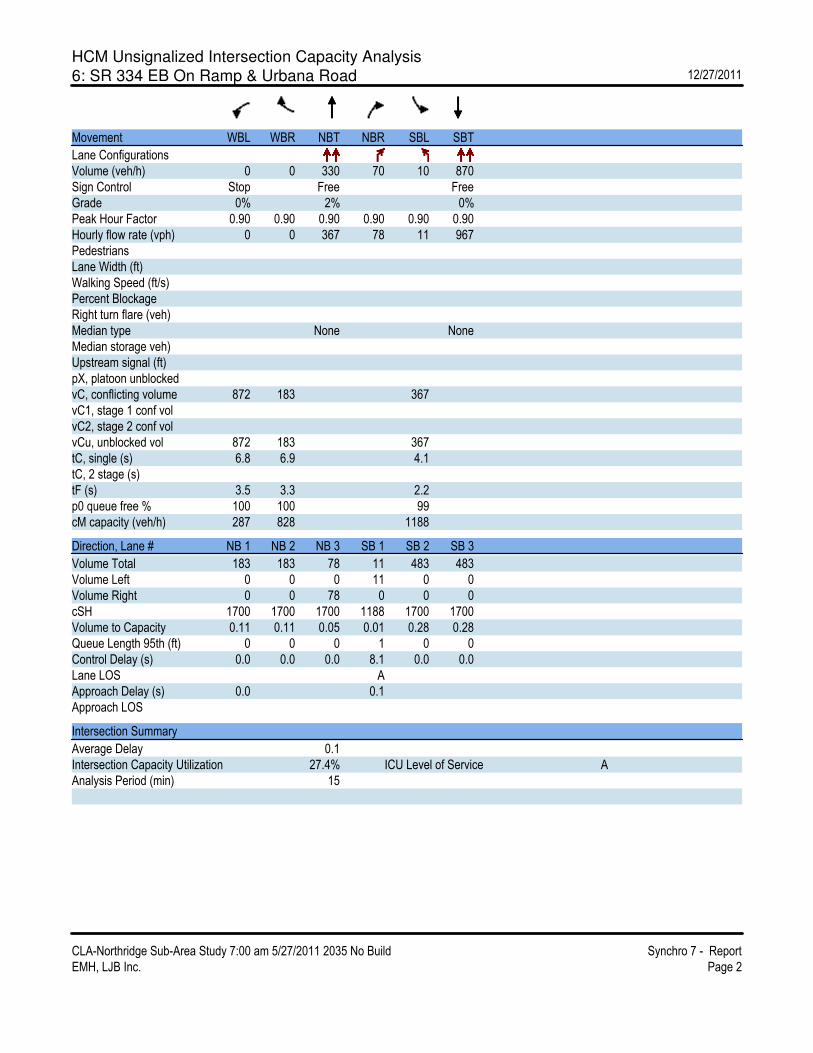
HCM Unsignalized Intersection Capacity Analysis
6: SR 334 EB On Ramp & Urbana Road 12/27/2011
CLA-Northridge Sub-Area Study 7:00 am 5/27/2011 2035 No Build Synchro 7 - Report
EMH, LJB Inc. Page 2
Movement WBL WBR NBT NBR SBL SBT
Lane Configurations
Volume (veh/h) 0 0 330 70 10 870
Sign Control Stop Free Free
Grade 0% 2% 0%
Peak Hour Factor 0.90 0.90 0.90 0.90 0.90 0.90
Hourly flow rate (vph) 0 0 367 78 11 967
Pedestrians
Lane Width (ft)
Walking Speed (ft/s)
Percent Blockage
Right turn flare (veh)
Median type None None
Median storage veh)
Upstream signal (ft)
pX, platoon unblocked
vC, conflicting volume 872 183 367
vC1, stage 1 conf vol
vC2, stage 2 conf vol
vCu, unblocked vol 872 183 367
tC, single (s) 6.8 6.9 4.1
tC, 2 stage (s)
tF (s) 3.5 3.3 2.2
p0 queue free % 100 100 99
cM capacity (veh/h) 287 828 1188
Direction, Lane # NB 1 NB 2 NB 3 SB 1 SB 2 SB 3
Volume Total 183 183 78 11 483 483
Volume Left 0 0 0 11 0 0
Volume Right 0 0 78 0 0 0
cSH 1700 1700 1700 1188 1700 1700
Volume to Capacity 0.11 0.11 0.05 0.01 0.28 0.28
Queue Length 95th (ft) 0 0 0 1 0 0
Control Delay (s) 0.0 0.0 0.0 8.1 0.0 0.0
Lane LOS A
Approach Delay (s) 0.0 0.1
Approach LOS
Intersection Summary
Average Delay 0.1
Intersection Capacity Utilization 27.4% ICU Level of Service A
Analysis Period (min) 15

HCM Unsignalized Intersection Capacity Analysis
13: Villa Road & SR 4 12/27/2011
CLA-Northridge Sub-Area Study 7:00 am 5/27/2011 2035 No Build Synchro 7 - Report
EMH, LJB Inc. Page 3
Movement EBL EBR NBL NBT SBT SBR
Lane Configurations
Volume (veh/h) 50 60 20 140 330 90
Sign Control Stop Free Free
Grade 0% 0% 0%
Peak Hour Factor 0.90 0.90 0.90 0.90 0.90 0.90
Hourly flow rate (vph) 56 67 22 156 367 100
Pedestrians
Lane Width (ft)
Walking Speed (ft/s)
Percent Blockage
Right turn flare (veh)
Median type None None
Median storage veh)
Upstream signal (ft)
pX, platoon unblocked
vC, conflicting volume 617 417 467
vC1, stage 1 conf vol
vC2, stage 2 conf vol
vCu, unblocked vol 617 417 467
tC, single (s) 6.4 6.2 4.1
tC, 2 stage (s)
tF (s) 3.5 3.3 2.2
p0 queue free % 87 90 98
cM capacity (veh/h) 444 636 1090
Direction, Lane # EB 1 NB 1 SB 1
Volume Total 122 178 467
Volume Left 56 22 0
Volume Right 67 0 100
cSH 532 1090 1700
Volume to Capacity 0.23 0.02 0.27
Queue Length 95th (ft) 22 2 0
Control Delay (s) 13.8 1.2 0.0
Lane LOS B A
Approach Delay (s) 13.8 1.2 0.0
Approach LOS B
Intersection Summary
Average Delay 2.5
Intersection Capacity Utilization 37.3% ICU Level of Service A
Analysis Period (min) 15

HCM Unsignalized Intersection Capacity Analysis
14: Urbana Road & SR 334 WB On Ramp 12/27/2011
CLA-Northridge Sub-Area Study 7:00 am 5/27/2011 2035 No Build Synchro 7 - Report
EMH, LJB Inc. Page 4
Movement NBT NBR SBL SBT SWL SWR
Lane Configurations
Volume (veh/h) 280 160 0 870 0 0
Sign Control Free Free Stop
Grade 0% 0% 0%
Peak Hour Factor 0.90 0.90 0.90 0.90 0.90 0.90
Hourly flow rate (vph) 311 178 0 967 0 0
Pedestrians
Lane Width (ft)
Walking Speed (ft/s)
Percent Blockage
Right turn flare (veh)
Median type None None
Median storage veh)
Upstream signal (ft)
pX, platoon unblocked
vC, conflicting volume 489 794 156
vC1, stage 1 conf vol
vC2, stage 2 conf vol
vCu, unblocked vol 489 794 156
tC, single (s) 4.1 6.8 6.9
tC, 2 stage (s)
tF (s) 2.2 3.5 3.3
p0 queue free % 100 100 100
cM capacity (veh/h) 1071 325 862
Direction, Lane # NB 1 NB 2 NB 3 SB 1 SB 2
Volume Total 156 156 178 483 483
Volume Left 0 0 0 0 0
Volume Right 0 0 178 0 0
cSH 1700 1700 1700 1700 1700
Volume to Capacity 0.09 0.09 0.10 0.28 0.28
Queue Length 95th (ft) 0 0 0 0 0
Control Delay (s) 0.0 0.0 0.0 0.0 0.0
Lane LOS
Approach Delay (s) 0.0 0.0
Approach LOS
Intersection Summary
Average Delay 0.0
Intersection Capacity Utilization 36.4% ICU Level of Service A
Analysis Period (min) 15

HCM Unsignalized Intersection Capacity Analysis
15: SR 334 & SR 4 12/27/2011
CLA-Northridge Sub-Area Study 7:00 am 5/27/2011 2035 No Build Synchro 7 - Report
EMH, LJB Inc. Page 5
Movement SEL SER NEL NET SWT SWR
Lane Configurations
Volume (veh/h) 80 30 50 80 210 150
Sign Control Stop Free Free
Grade 0% 0% 0%
Peak Hour Factor 0.90 0.90 0.90 0.90 0.90 0.90
Hourly flow rate (vph) 89 33 56 89 233 167
Pedestrians
Lane Width (ft)
Walking Speed (ft/s)
Percent Blockage
Right turn flare (veh)
Median type None None
Median storage veh)
Upstream signal (ft)
pX, platoon unblocked
vC, conflicting volume 517 317 233
vC1, stage 1 conf vol
vC2, stage 2 conf vol
vCu, unblocked vol 517 317 233
tC, single (s) 6.4 6.2 4.1
tC, 2 stage (s)
tF (s) 3.5 3.3 2.2
p0 queue free % 82 95 96
cM capacity (veh/h) 497 724 1334
Direction, Lane # SE 1 NE 1 SW 1
Volume Total 122 144 400
Volume Left 89 56 0
Volume Right 33 0 167
cSH 544 1334 1700
Volume to Capacity 0.22 0.04 0.24
Queue Length 95th (ft) 21 3 0
Control Delay (s) 13.5 3.2 0.0
Lane LOS B A
Approach Delay (s) 13.5 3.2 0.0
Approach LOS B
Intersection Summary
Average Delay 3.2
Intersection Capacity Utilization 43.5% ICU Level of Service A
Analysis Period (min) 15

HCM Unsignalized Intersection Capacity Analysis
20: Middle Urbana Road & SR 4 12/27/2011
CLA-Northridge Sub-Area Study 7:00 am 5/27/2011 2035 No Build Synchro 7 - Report
EMH, LJB Inc. Page 6
Movement EBL EBR NBL NBT SBT SBR
Lane Configurations
Volume (veh/h) 10 410 270 140 420 10
Sign Control Stop Free Free
Grade 0% 0% 0%
Peak Hour Factor 0.90 0.90 0.90 0.90 0.90 0.90
Hourly flow rate (vph) 11 456 300 156 467 11
Pedestrians
Lane Width (ft)
Walking Speed (ft/s)
Percent Blockage
Right turn flare (veh)
Median type None None
Median storage veh)
Upstream signal (ft)
pX, platoon unblocked
vC, conflicting volume 1228 472 478
vC1, stage 1 conf vol
vC2, stage 2 conf vol
vCu, unblocked vol 1228 472 478
tC, single (s) 6.4 6.2 4.1
tC, 2 stage (s)
tF (s) 3.5 3.3 2.2
p0 queue free % 92 23 72
cM capacity (veh/h) 141 590 1074
Direction, Lane # EB 1 NB 1 SB 1
Volume Total 467 456 478
Volume Left 11 300 0
Volume Right 456 0 11
cSH 548 1074 1700
Volume to Capacity 0.85 0.28 0.28
Queue Length 95th (ft) 227 29 0
Control Delay (s) 38.4 7.4 0.0
Lane LOS E A
Approach Delay (s) 38.4 7.4 0.0
Approach LOS E
Intersection Summary
Average Delay 15.2
Intersection Capacity Utilization 81.0% ICU Level of Service D
Analysis Period (min) 15

HCM Unsignalized Intersection Capacity Analysis
24: Montego Drive & Middle Urbana Road 12/27/2011
CLA-Northridge Sub-Area Study 7:00 am 5/27/2011 2035 No Build Synchro 7 - Report
EMH, LJB Inc. Page 7
Movement EBL EBT EBR WBL WBT WBR NBL NBT NBR SBL SBT SBR
Lane Configurations
Volume (veh/h) 50 10 140 10 10 10 40 300 20 10 400 20
Sign Control Stop Stop Free Free
Grade 0% 0% 0% 0%
Peak Hour Factor 0.90 0.90 0.90 0.90 0.90 0.90 0.90 0.90 0.90 0.90 0.90 0.90
Hourly flow rate (vph) 56 11 156 11 11 11 44 333 22 11 444 22
Pedestrians
Lane Width (ft)
Walking Speed (ft/s)
Percent Blockage
Right turn flare (veh)
Median type None None
Median storage veh)
Upstream signal (ft)
pX, platoon unblocked
vC, conflicting volume 928 922 456 1072 922 344 467 356
vC1, stage 1 conf vol
vC2, stage 2 conf vol
vCu, unblocked vol 928 922 456 1072 922 344 467 356
tC, single (s) 7.1 6.5 6.2 7.1 6.5 6.2 4.1 4.1
tC, 2 stage (s)
tF (s) 3.5 4.0 3.3 3.5 4.0 3.3 2.2 2.2
p0 queue free % 76 96 74 92 96 98 96 99
cM capacity (veh/h) 229 258 607 138 259 703 1100 1209
Direction, Lane # EB 1 WB 1 NB 1 SB 1
Volume Total 222 33 400 478
Volume Left 56 11 44 11
Volume Right 156 11 22 22
cSH 410 240 1100 1209
Volume to Capacity 0.54 0.14 0.04 0.01
Queue Length 95th (ft) 78 12 3 1
Control Delay (s) 23.7 22.4 1.3 0.3
Lane LOS C C A A
Approach Delay (s) 23.7 22.4 1.3 0.3
Approach LOS C C
Intersection Summary
Average Delay 5.9
Intersection Capacity Utilization 58.8% ICU Level of Service B
Analysis Period (min) 15

HCM Unsignalized Intersection Capacity Analysis
30: Moorefield Road & Derr Road 12/27/2011
CLA-Northridge Sub-Area Study 7:00 am 5/27/2011 2035 No Build Synchro 7 - Report
EMH, LJB Inc. Page 8
Movement EBT EBR WBL WBT NBL NBR
Lane Configurations
Sign Control Stop Stop Stop
Volume (vph) 70 30 90 310 30 70
Peak Hour Factor 0.90 0.90 0.90 0.90 0.90 0.90
Hourly flow rate (vph) 78 33 100 344 33 78
Direction, Lane # EB 1 WB 1 NB 1
Volume Total (vph) 111 444 111
Volume Left (vph) 0 100 33
Volume Right (vph) 33 0 78
Hadj (s) -0.18 0.04 -0.36
Departure Headway (s) 4.5 4.4 4.8
Degree Utilization, x 0.14 0.54 0.15
Capacity (veh/h) 766 805 679
Control Delay (s) 8.2 12.3 8.6
Approach Delay (s) 8.2 12.3 8.6
Approach LOS A B A
Intersection Summary
Delay 11.0
HCM Level of Service B
Intersection Capacity Utilization 40.6% ICU Level of Service A
Analysis Period (min) 15

HCM Unsignalized Intersection Capacity Analysis
31: Montego Drive & Derr Road 12/27/2011
CLA-Northridge Sub-Area Study 7:00 am 5/27/2011 2035 No Build Synchro 7 - Report
EMH, LJB Inc. Page 9
Movement WBL WBR NBT NBR SBL SBT
Lane Configurations
Volume (veh/h) 230 10 140 60 10 320
Sign Control Stop Free Free
Grade 0% 0% 0%
Peak Hour Factor 0.90 0.90 0.90 0.90 0.90 0.90
Hourly flow rate (vph) 256 11 156 67 11 356
Pedestrians
Lane Width (ft)
Walking Speed (ft/s)
Percent Blockage
Right turn flare (veh)
Median type None None
Median storage veh)
Upstream signal (ft)
pX, platoon unblocked
vC, conflicting volume 567 189 222
vC1, stage 1 conf vol
vC2, stage 2 conf vol
vCu, unblocked vol 567 189 222
tC, single (s) 6.4 6.2 4.1
tC, 2 stage (s)
tF (s) 3.5 3.3 2.2
p0 queue free % 47 99 99
cM capacity (veh/h) 485 858 1359
Direction, Lane # WB 1 NB 1 SB 1
Volume Total 267 222 367
Volume Left 256 0 11
Volume Right 11 67 0
cSH 493 1700 1359
Volume to Capacity 0.54 0.13 0.01
Queue Length 95th (ft) 79 0 1
Control Delay (s) 20.5 0.0 0.3
Lane LOS C A
Approach Delay (s) 20.5 0.0 0.3
Approach LOS C
Intersection Summary
Average Delay 6.5
Intersection Capacity Utilization 44.9% ICU Level of Service A
Analysis Period (min) 15

HCM Unsignalized Intersection Capacity Analysis
39: Urbana Road & SR 334 EB Off Ramp 12/27/2011
CLA-Northridge Sub-Area Study 7:00 am 5/27/2011 2035 No Build Synchro 7 - Report
EMH, LJB Inc. Page 10
Movement NBT NBR SBL SBT NWL NWR
Lane Configurations
Volume (veh/h) 330 0 0 870 0 90
Sign Control Free Free Yield
Grade 0% 0% 0%
Peak Hour Factor 0.90 0.90 0.90 0.90 0.90 0.90
Hourly flow rate (vph) 367 0 0 967 0 100
Pedestrians
Lane Width (ft)
Walking Speed (ft/s)
Percent Blockage
Right turn flare (veh)
Median type None None
Median storage veh)
Upstream signal (ft)
pX, platoon unblocked
vC, conflicting volume 367 850 183
vC1, stage 1 conf vol
vC2, stage 2 conf vol
vCu, unblocked vol 367 850 183
tC, single (s) 4.1 6.8 6.9
tC, 2 stage (s)
tF (s) 2.2 3.5 3.3
p0 queue free % 100 100 88
cM capacity (veh/h) 1188 300 828
Direction, Lane # NB 1 NB 2 SB 1 SB 2 NW 1
Volume Total 183 183 483 483 100
Volume Left 0 0 0 0 0
Volume Right 0 0 0 0 100
cSH 1700 1700 1700 1700 828
Volume to Capacity 0.11 0.11 0.28 0.28 0.12
Queue Length 95th (ft) 0 0 0 0 10
Control Delay (s) 0.0 0.0 0.0 0.0 9.9
Lane LOS A
Approach Delay (s) 0.0 0.0 9.9
Approach LOS A
Intersection Summary
Average Delay 0.7
Intersection Capacity Utilization 27.4% ICU Level of Service A
Analysis Period (min) 15

HCM Signalized Intersection Capacity Analysis
11: Home Road & SR 4 12/27/2011
CLA-Northridge Sub-Area Study 5:00 pm 5/27/2011 2035 No Build Synchro 7 - Report
EMH, LJB Inc. Page 1
Movement EBL EBT EBR WBL WBT WBR NBL NBT NBR SBL SBT SBR
Lane Configurations
Volume (vph) 40 110 10 20 240 240 20 240 20 300 360 80
Ideal Flow (vphpl) 1900 1900 1900 1900 1900 1900 1900 1900 1900 1900 1900 1900
Grade (%) 0% 3% 5% 0%
Total Lost time (s) 4.0 4.0 4.0 4.0 4.0 4.0 4.0 4.0
Lane Util. Factor 1.00 1.00 1.00 1.00 1.00 0.95 1.00 0.95
Frt 1.00 0.99 1.00 0.93 1.00 0.99 1.00 0.97
Flt Protected 0.95 1.00 0.95 1.00 0.95 1.00 0.95 1.00
Satd. Flow (prot) 1770 1840 1726 1681 1645 3252 1752 3409
Flt Permitted 0.28 1.00 0.67 1.00 0.45 1.00 0.57 1.00
Satd. Flow (perm) 523 1840 1221 1681 778 3252 1060 3409
Peak-hour factor, PHF 0.90 0.90 0.90 0.90 0.90 0.90 0.90 0.90 0.90 0.90 0.90 0.90
Adj. Flow (vph) 44 122 11 22 267 267 22 267 22 333 400 89
RTOR Reduction (vph) 0 0 0 0 0 0 0 0 0 0 0 0
Lane Group Flow (vph) 44 133 0 22 534 0 22 289 0 333 489 0
Heavy Vehicles (%) 2% 2% 2% 3% 3% 3% 7% 7% 7% 3% 3% 3%
Turn Type Perm Perm Perm Perm
Protected Phases 4 8 2 6
Permitted Phases 4 8 2 6
Actuated Green, G (s) 21.1 21.1 21.1 21.1 21.2 21.2 21.2 21.2
Effective Green, g (s) 23.1 23.1 23.1 23.1 23.2 23.2 23.2 23.2
Actuated g/C Ratio 0.43 0.43 0.43 0.43 0.43 0.43 0.43 0.43
Clearance Time (s) 6.0 6.0 6.0 6.0 6.0 6.0 6.0 6.0
Vehicle Extension (s) 3.0 3.0 3.0 3.0 3.0 3.0 3.0 3.0
Lane Grp Cap (vph) 222 783 519 715 332 1389 453 1457
v/s Ratio Prot 0.07 c0.32 0.09 0.14
v/s Ratio Perm 0.08 0.02 0.03 c0.31
v/c Ratio 0.20 0.17 0.04 0.75 0.07 0.21 0.74 0.34
Uniform Delay, d1 9.8 9.7 9.1 13.1 9.2 9.8 13.0 10.4
Progression Factor 1.00 1.00 1.00 1.00 1.00 1.00 1.00 1.00
Incremental Delay, d2 0.4 0.1 0.0 4.3 0.4 0.3 10.2 0.6
Delay (s) 10.2 9.8 9.2 17.4 9.6 10.1 23.1 11.0
Level of Service B A A B A B C B
Approach Delay (s) 9.9 17.1 10.1 15.9
Approach LOS A B B B
Intersection Summary
HCM Average Control Delay 14.7 HCM Level of Service B
HCM Volume to Capacity ratio 0.74
Actuated Cycle Length (s) 54.3 Sum of lost time (s) 8.0
Intersection Capacity Utilization 67.1% ICU Level of Service C
Analysis Period (min) 15
c Critical Lane Group

HCM Signalized Intersection Capacity Analysis
19: Villa Road & Middle Urbana Road 12/27/2011
CLA-Northridge Sub-Area Study 5:00 pm 5/27/2011 2035 No Build Synchro 7 - Report
EMH, LJB Inc. Page 3
Movement EBL EBT EBR WBL WBT WBR NBL NBT NBR SBL SBT SBR
Lane Configurations
Volume (vph) 200 140 130 10 80 30 90 460 10 20 120 210
Ideal Flow (vphpl) 1900 1900 1900 1900 1900 1900 1900 1900 1900 1900 1900 1900
Lane Width 12 10 13 12 10 12 12 12 12 12 12 12
Total Lost time (s) 4.0 4.0 4.0 4.0 4.0 4.0 4.0 4.0
Lane Util. Factor 1.00 1.00 1.00 1.00 1.00 1.00 1.00 1.00
Frt 1.00 1.00 0.85 0.97 1.00 1.00 1.00 0.90
Flt Protected 0.95 1.00 1.00 1.00 0.95 1.00 0.95 1.00
Satd. Flow (prot) 1805 1773 1669 1707 1805 1894 1805 1719
Flt Permitted 0.45 1.00 1.00 0.96 0.35 1.00 0.31 1.00
Satd. Flow (perm) 856 1773 1669 1647 662 1894 597 1719
Peak-hour factor, PHF 0.90 0.90 0.90 0.90 0.90 0.90 0.90 0.90 0.90 0.90 0.90 0.90
Adj. Flow (vph) 222 156 144 11 89 33 100 511 11 22 133 233
RTOR Reduction (vph) 0 0 0 0 0 0 0 0 0 0 0 0
Lane Group Flow (vph) 222 156 144 0 133 0 100 522 0 22 366 0
Heavy Vehicles (%) 0% 0% 0% 0% 0% 0% 0% 0% 0% 0% 0% 0%
Turn Type pm+pt Perm Perm pm+pt pm+pt
Protected Phases 7 4 8 5 2 1 6
Permitted Phases 4 4 8 2 6
Actuated Green, G (s) 20.9 20.9 20.9 8.3 30.1 25.7 23.3 22.3
Effective Green, g (s) 22.9 22.9 22.9 10.3 34.1 27.7 27.3 24.3
Actuated g/C Ratio 0.35 0.35 0.35 0.16 0.52 0.42 0.42 0.37
Clearance Time (s) 6.0 6.0 6.0 6.0 6.0 6.0 6.0 6.0
Vehicle Extension (s) 3.0 3.0 3.0 3.0 3.0 3.0 3.0 3.0
Lane Grp Cap (vph) 423 619 583 259 456 800 304 637
v/s Ratio Prot c0.07 0.09 c0.02 c0.28 0.00 0.21
v/s Ratio Perm c0.11 0.09 0.08 0.09 0.03
v/c Ratio 0.52 0.25 0.25 0.51 0.22 0.65 0.07 0.57
Uniform Delay, d1 16.4 15.2 15.2 25.4 8.8 15.1 11.8 16.5
Progression Factor 1.00 1.00 1.00 1.00 1.00 1.00 1.00 1.00
Incremental Delay, d2 1.2 0.2 0.2 1.7 0.2 4.1 0.1 3.7
Delay (s) 17.6 15.5 15.4 27.1 9.1 19.2 11.9 20.3
Level of Service B B B C A B B C
Approach Delay (s) 16.4 27.1 17.6 19.8
Approach LOS B C B B
Intersection Summary
HCM Average Control Delay 18.5 HCM Level of Service B
HCM Volume to Capacity ratio 0.57
Actuated Cycle Length (s) 65.6 Sum of lost time (s) 12.0
Intersection Capacity Utilization 57.6% ICU Level of Service B
Analysis Period (min) 15
c Critical Lane Group

HCM Signalized Intersection Capacity Analysis
21: SR 334 & Middle Urbana Road 12/27/2011
CLA-Northridge Sub-Area Study 5:00 pm 5/27/2011 2035 No Build Synchro 7 - Report
EMH, LJB Inc. Page 4
Movement EBL EBT EBR WBL WBT WBR NBL NBT NBR SBL SBT SBR
Lane Configurations
Volume (vph) 210 190 150 20 130 40 130 370 30 20 250 80
Ideal Flow (vphpl) 1900 1900 1900 1900 1900 1900 1900 1900 1900 1900 1900 1900
Total Lost time (s) 4.0 4.0 4.0 4.0 4.0 4.0 4.0 4.0
Lane Util. Factor 1.00 1.00 1.00 1.00 1.00 1.00 1.00 1.00
Frt 1.00 0.93 1.00 0.96 1.00 0.99 1.00 0.96
Flt Protected 0.95 1.00 0.95 1.00 0.95 1.00 0.95 1.00
Satd. Flow (prot) 1703 1674 1656 1682 1770 1842 1770 1795
Flt Permitted 0.64 1.00 0.43 1.00 0.47 1.00 0.39 1.00
Satd. Flow (perm) 1146 1674 753 1682 880 1842 734 1795
Peak-hour factor, PHF 0.90 0.90 0.90 0.90 0.90 0.90 0.90 0.90 0.90 0.90 0.90 0.90
Adj. Flow (vph) 233 211 167 22 144 44 144 411 33 22 278 89
RTOR Reduction (vph) 0 0 0 0 0 0 0 0 0 0 0 0
Lane Group Flow (vph) 233 378 0 22 188 0 144 444 0 22 367 0
Heavy Vehicles (%) 6% 6% 6% 9% 9% 9% 2% 2% 2% 2% 2% 2%
Turn Type Perm Perm Perm Perm
Protected Phases 4 8 2 6
Permitted Phases 4 8 2 6
Actuated Green, G (s) 15.8 15.8 15.8 15.8 18.2 18.2 18.2 18.2
Effective Green, g (s) 17.8 17.8 17.8 17.8 20.2 20.2 20.2 20.2
Actuated g/C Ratio 0.39 0.39 0.39 0.39 0.44 0.44 0.44 0.44
Clearance Time (s) 6.0 6.0 6.0 6.0 6.0 6.0 6.0 6.0
Vehicle Extension (s) 3.0 3.0 3.0 3.0 3.0 3.0 3.0 3.0
Lane Grp Cap (vph) 443 648 291 651 386 809 322 788
v/s Ratio Prot c0.23 0.11 c0.24 0.20
v/s Ratio Perm 0.20 0.03 0.16 0.03
v/c Ratio 0.53 0.58 0.08 0.29 0.37 0.55 0.07 0.47
Uniform Delay, d1 10.9 11.2 8.9 9.7 8.7 9.5 7.5 9.1
Progression Factor 1.00 1.00 1.00 1.00 1.00 1.00 1.00 1.00
Incremental Delay, d2 1.1 1.3 0.1 0.2 2.7 2.7 0.4 2.0
Delay (s) 12.0 12.5 9.0 10.0 11.4 12.2 7.9 11.1
Level of Service B B A A B B A B
Approach Delay (s) 12.3 9.9 12.0 10.9
Approach LOS B A B B
Intersection Summary
HCM Average Control Delay 11.6 HCM Level of Service B
HCM Volume to Capacity ratio 0.57
Actuated Cycle Length (s) 46.0 Sum of lost time (s) 8.0
Intersection Capacity Utilization 65.5% ICU Level of Service C
Analysis Period (min) 15
c Critical Lane Group

HCM Signalized Intersection Capacity Analysis
22: Moorefield Road & Middle Urbana Road 12/27/2011
CLA-Northridge Sub-Area Study 5:00 pm 5/27/2011 2035 No Build Synchro 7 - Report
EMH, LJB Inc. Page 5
Movement EBL EBT EBR WBL WBT WBR NBL NBT NBR SBL SBT SBR
Lane Configurations
Volume (vph) 30 120 40 50 140 30 60 120 80 20 110 50
Ideal Flow (vphpl) 1900 1900 1900 1900 1900 1900 1900 1900 1900 1900 1900 1900
Lane Width 12 12 12 12 12 12 12 11 12 12 11 12
Total Lost time (s) 4.0 4.0 4.0 4.0 4.0
Lane Util. Factor 1.00 1.00 1.00 1.00 1.00
Frt 1.00 0.85 0.98 0.96 0.96
Flt Protected 0.99 1.00 0.99 0.99 0.99
Satd. Flow (prot) 1863 1599 1826 1740 1758
Flt Permitted 0.90 1.00 0.88 0.88 0.94
Satd. Flow (perm) 1695 1599 1624 1555 1665
Peak-hour factor, PHF 0.90 0.90 0.90 0.90 0.90 0.90 0.90 0.90 0.90 0.90 0.90 0.90
Adj. Flow (vph) 33 133 44 56 156 33 67 133 89 22 122 56
RTOR Reduction (vph) 0 0 0 0 0 0 0 0 0 0 0 0
Lane Group Flow (vph) 0 166 44 0 245 0 0 289 0 0 200 0
Heavy Vehicles (%) 1% 1% 1% 1% 1% 1% 0% 0% 0% 0% 0% 0%
Turn Type Perm Perm Perm Perm Perm
Protected Phases 4 8 2 6
Permitted Phases 4 4 8 2 6
Actuated Green, G (s) 7.8 7.8 7.8 11.4 11.4
Effective Green, g (s) 9.8 9.8 9.8 13.4 13.4
Actuated g/C Ratio 0.31 0.31 0.31 0.43 0.43
Clearance Time (s) 6.0 6.0 6.0 6.0 6.0
Vehicle Extension (s) 3.0 3.0 3.0 3.0 3.0
Lane Grp Cap (vph) 532 502 510 668 715
v/s Ratio Prot
v/s Ratio Perm 0.10 0.03 c0.15 c0.19 0.12
v/c Ratio 0.31 0.09 0.48 0.43 0.28
Uniform Delay, d1 8.1 7.5 8.6 6.2 5.8
Progression Factor 1.00 1.00 1.00 1.00 1.00
Incremental Delay, d2 0.3 0.1 0.7 2.0 1.0
Delay (s) 8.5 7.6 9.4 8.3 6.7
Level of Service A A A A A
Approach Delay (s) 8.3 9.4 8.3 6.7
Approach LOS A A A A
Intersection Summary
HCM Average Control Delay 8.2 HCM Level of Service A
HCM Volume to Capacity ratio 0.45
Actuated Cycle Length (s) 31.2 Sum of lost time (s) 8.0
Intersection Capacity Utilization 51.2% ICU Level of Service A
Analysis Period (min) 15
c Critical Lane Group
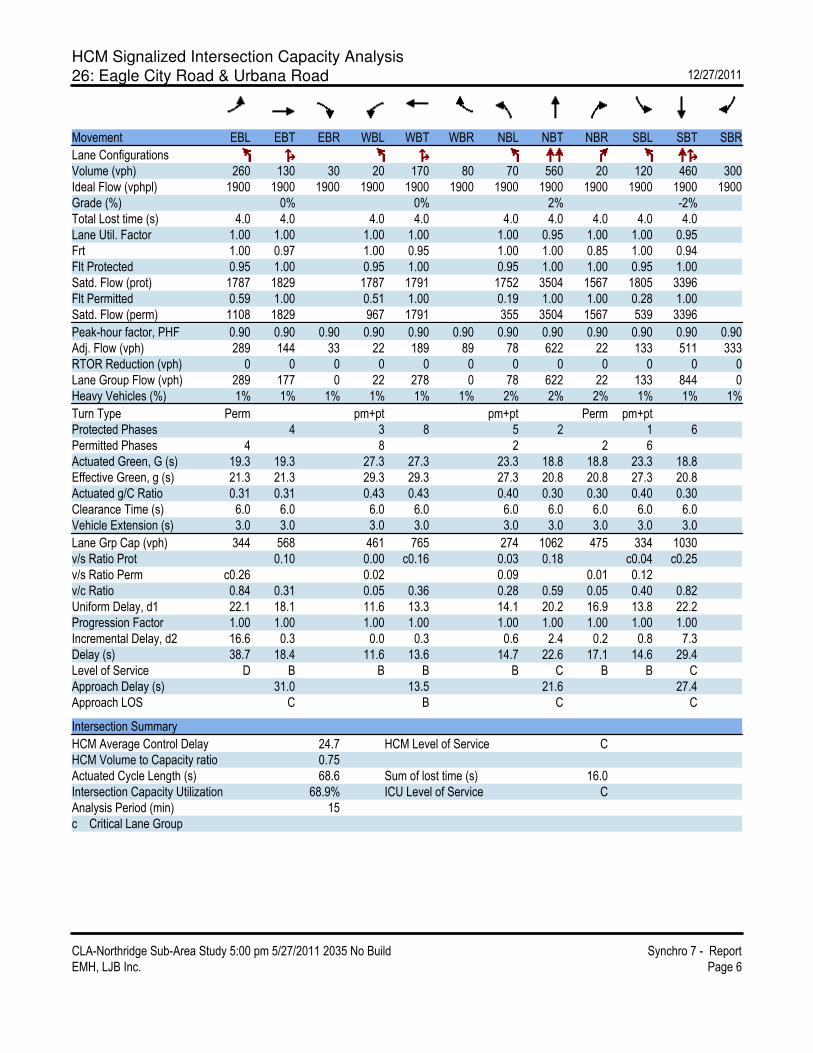
HCM Signalized Intersection Capacity Analysis
26: Eagle City Road & Urbana Road 12/27/2011
CLA-Northridge Sub-Area Study 5:00 pm 5/27/2011 2035 No Build Synchro 7 - Report
EMH, LJB Inc. Page 6
Movement EBL EBT EBR WBL WBT WBR NBL NBT NBR SBL SBT SBR
Lane Configurations
Volume (vph) 260 130 30 20 170 80 70 560 20 120 460 300
Ideal Flow (vphpl) 1900 1900 1900 1900 1900 1900 1900 1900 1900 1900 1900 1900
Grade (%) 0% 0% 2% -2%
Total Lost time (s) 4.0 4.0 4.0 4.0 4.0 4.0 4.0 4.0 4.0
Lane Util. Factor 1.00 1.00 1.00 1.00 1.00 0.95 1.00 1.00 0.95
Frt 1.00 0.97 1.00 0.95 1.00 1.00 0.85 1.00 0.94
Flt Protected 0.95 1.00 0.95 1.00 0.95 1.00 1.00 0.95 1.00
Satd. Flow (prot) 1787 1829 1787 1791 1752 3504 1567 1805 3396
Flt Permitted 0.59 1.00 0.51 1.00 0.19 1.00 1.00 0.28 1.00
Satd. Flow (perm) 1108 1829 967 1791 355 3504 1567 539 3396
Peak-hour factor, PHF 0.90 0.90 0.90 0.90 0.90 0.90 0.90 0.90 0.90 0.90 0.90 0.90
Adj. Flow (vph) 289 144 33 22 189 89 78 622 22 133 511 333
RTOR Reduction (vph) 0 0 0 0 0 0 0 0 0 0 0 0
Lane Group Flow (vph) 289 177 0 22 278 0 78 622 22 133 844 0
Heavy Vehicles (%) 1% 1% 1% 1% 1% 1% 2% 2% 2% 1% 1% 1%
Turn Type Perm pm+pt pm+pt Perm pm+pt
Protected Phases 4 3 8 5 2 1 6
Permitted Phases 4 8 2 2 6
Actuated Green, G (s) 19.3 19.3 27.3 27.3 23.3 18.8 18.8 23.3 18.8
Effective Green, g (s) 21.3 21.3 29.3 29.3 27.3 20.8 20.8 27.3 20.8
Actuated g/C Ratio 0.31 0.31 0.43 0.43 0.40 0.30 0.30 0.40 0.30
Clearance Time (s) 6.0 6.0 6.0 6.0 6.0 6.0 6.0 6.0 6.0
Vehicle Extension (s) 3.0 3.0 3.0 3.0 3.0 3.0 3.0 3.0 3.0
Lane Grp Cap (vph) 344 568 461 765 274 1062 475 334 1030
v/s Ratio Prot 0.10 0.00 c0.16 0.03 0.18 c0.04 c0.25
v/s Ratio Perm c0.26 0.02 0.09 0.01 0.12
v/c Ratio 0.84 0.31 0.05 0.36 0.28 0.59 0.05 0.40 0.82
Uniform Delay, d1 22.1 18.1 11.6 13.3 14.1 20.2 16.9 13.8 22.2
Progression Factor 1.00 1.00 1.00 1.00 1.00 1.00 1.00 1.00 1.00
Incremental Delay, d2 16.6 0.3 0.0 0.3 0.6 2.4 0.2 0.8 7.3
Delay (s) 38.7 18.4 11.6 13.6 14.7 22.6 17.1 14.6 29.4
Level of Service D B B B B C B B C
Approach Delay (s) 31.0 13.5 21.6 27.4
Approach LOS C B C C
Intersection Summary
HCM Average Control Delay 24.7 HCM Level of Service C
HCM Volume to Capacity ratio 0.75
Actuated Cycle Length (s) 68.6 Sum of lost time (s) 16.0
Intersection Capacity Utilization 68.9% ICU Level of Service C
Analysis Period (min) 15
c Critical Lane Group

HCM Signalized Intersection Capacity Analysis
27: Villa Road & Derr Road 12/27/2011
CLA-Northridge Sub-Area Study 5:00 pm 5/27/2011 2035 No Build Synchro 7 - Report
EMH, LJB Inc. Page 7
Movement EBL EBT EBR WBL WBT WBR NBL NBT NBR SBL SBT SBR
Lane Configurations
Volume (vph) 140 200 90 160 350 60 140 160 140 70 200 80
Ideal Flow (vphpl) 1900 1900 1900 1900 1900 1900 1900 1900 1900 1900 1900 1900
Lane Width 10 12 12 12 12 12 11 12 11 12 12 12
Total Lost time (s) 4.0 4.0 4.0 4.0 4.0 4.0 4.0 4.0 4.0
Lane Util. Factor 1.00 0.95 1.00 1.00 1.00 1.00 1.00 1.00 1.00
Frt 1.00 0.95 1.00 0.98 1.00 1.00 0.85 1.00 0.96
Flt Protected 0.95 1.00 0.95 1.00 0.95 1.00 1.00 0.95 1.00
Satd. Flow (prot) 1685 3442 1805 1858 1745 1900 1561 1805 1818
Flt Permitted 0.28 1.00 0.49 1.00 0.35 1.00 1.00 0.63 1.00
Satd. Flow (perm) 500 3442 922 1858 652 1900 1561 1198 1818
Peak-hour factor, PHF 0.90 0.90 0.90 0.90 0.90 0.90 0.90 0.90 0.90 0.90 0.90 0.90
Adj. Flow (vph) 156 222 100 178 389 67 156 178 156 78 222 89
RTOR Reduction (vph) 0 0 0 0 0 0 0 0 0 0 0 0
Lane Group Flow (vph) 156 322 0 178 456 0 156 178 156 78 311 0
Heavy Vehicles (%) 0% 0% 0% 0% 0% 0% 0% 0% 0% 0% 0% 0%
Turn Type pm+pt pm+pt pm+pt Perm pm+pt
Protected Phases 7 4 3 8 5 2 1 6
Permitted Phases 4 8 2 2 6
Actuated Green, G (s) 18.2 12.2 31.9 19.9 26.6 20.6 20.6 24.0 19.3
Effective Green, g (s) 22.2 14.2 33.9 21.9 30.6 22.6 22.6 28.0 21.3
Actuated g/C Ratio 0.30 0.19 0.45 0.29 0.41 0.30 0.30 0.37 0.28
Clearance Time (s) 6.0 6.0 6.0 6.0 6.0 6.0 6.0 6.0 6.0
Vehicle Extension (s) 3.0 3.0 3.0 3.0 3.0 3.0 3.0 3.0 3.0
Lane Grp Cap (vph) 274 650 600 541 382 571 469 500 515
v/s Ratio Prot c0.06 0.09 0.06 c0.25 c0.04 0.09 0.01 c0.17
v/s Ratio Perm 0.11 0.07 0.12 0.10 0.04
v/c Ratio 0.57 0.50 0.30 0.84 0.41 0.31 0.33 0.16 0.60
Uniform Delay, d1 28.6 27.3 15.2 25.0 15.1 20.3 20.4 15.5 23.3
Progression Factor 1.00 1.00 1.00 1.00 1.00 1.00 1.00 1.00 1.00
Incremental Delay, d2 2.7 0.6 0.3 11.4 0.7 1.4 1.9 0.1 5.2
Delay (s) 31.3 27.9 15.5 36.5 15.8 21.7 22.3 15.6 28.5
Level of Service C C B D B C C B C
Approach Delay (s) 29.0 30.6 20.0 25.9
Approach LOS C C C C
Intersection Summary
HCM Average Control Delay 26.7 HCM Level of Service C
HCM Volume to Capacity ratio 0.66
Actuated Cycle Length (s) 75.2 Sum of lost time (s) 16.0
Intersection Capacity Utilization 66.3% ICU Level of Service C
Analysis Period (min) 15
c Critical Lane Group

HCM Signalized Intersection Capacity Analysis
28: SR 334 & Derr Road 12/27/2011
CLA-Northridge Sub-Area Study 5:00 pm 5/27/2011 2035 No Build Synchro 7 - Report
EMH, LJB Inc. Page 8
Movement EBL EBT EBR WBL WBT WBR NBL NBT NBR SBL SBT SBR
Lane Configurations
Volume (vph) 320 500 90 30 300 20 90 420 40 10 270 110
Ideal Flow (vphpl) 1900 1900 1900 1900 1900 1900 1900 1900 1900 1900 1900 1900
Grade (%) 0% 0% -2% -2%
Total Lost time (s) 4.0 4.0 4.0 4.0 4.0 4.0 4.0 4.0 4.0
Lane Util. Factor 1.00 1.00 1.00 1.00 1.00 1.00 1.00 1.00 1.00
Frt 1.00 0.98 1.00 0.99 1.00 0.99 1.00 1.00 0.85
Flt Protected 0.95 1.00 0.95 1.00 0.95 1.00 0.95 1.00 1.00
Satd. Flow (prot) 1736 1785 1671 1743 1787 1857 1805 1900 1615
Flt Permitted 0.48 1.00 0.22 1.00 0.50 1.00 0.25 1.00 1.00
Satd. Flow (perm) 885 1785 386 1743 932 1857 482 1900 1615
Peak-hour factor, PHF 0.90 0.90 0.90 0.90 0.90 0.90 0.90 0.90 0.90 0.90 0.90 0.90
Adj. Flow (vph) 356 556 100 33 333 22 100 467 44 11 300 122
RTOR Reduction (vph) 0 0 0 0 0 0 0 0 0 0 0 0
Lane Group Flow (vph) 356 656 0 33 355 0 100 511 0 11 300 122
Heavy Vehicles (%) 4% 4% 4% 8% 8% 8% 2% 2% 2% 1% 1% 1%
Turn Type Perm Perm Perm Perm Perm
Protected Phases 4 8 2 6
Permitted Phases 4 8 2 6 6
Actuated Green, G (s) 25.0 25.0 25.0 25.0 19.2 19.2 19.2 19.2 19.2
Effective Green, g (s) 27.0 27.0 27.0 27.0 21.2 21.2 21.2 21.2 21.2
Actuated g/C Ratio 0.48 0.48 0.48 0.48 0.38 0.38 0.38 0.38 0.38
Clearance Time (s) 6.0 6.0 6.0 6.0 6.0 6.0 6.0 6.0 6.0
Vehicle Extension (s) 3.0 3.0 3.0 3.0 3.0 3.0 3.0 3.0 3.0
Lane Grp Cap (vph) 425 858 185 837 352 701 182 717 609
v/s Ratio Prot 0.37 0.20 c0.28 0.16
v/s Ratio Perm c0.40 0.09 0.11 0.02 0.08
v/c Ratio 0.84 0.76 0.18 0.42 0.28 0.73 0.06 0.42 0.20
Uniform Delay, d1 12.7 12.0 8.3 9.5 12.2 15.0 11.2 12.9 11.8
Progression Factor 1.00 1.00 1.00 1.00 1.00 1.00 1.00 1.00 1.00
Incremental Delay, d2 13.4 4.1 0.5 0.3 2.0 6.6 0.6 1.8 0.7
Delay (s) 26.1 16.1 8.8 9.9 14.2 21.6 11.8 14.7 12.5
Level of Service C B A A B C B B B
Approach Delay (s) 19.6 9.8 20.4 14.0
Approach LOS B A C B
Intersection Summary
HCM Average Control Delay 17.3 HCM Level of Service B
HCM Volume to Capacity ratio 0.79
Actuated Cycle Length (s) 56.2 Sum of lost time (s) 8.0
Intersection Capacity Utilization 81.3% ICU Level of Service D
Analysis Period (min) 15
c Critical Lane Group

HCM Signalized Intersection Capacity Analysis
41: Emmanuel Way & Middle Urbana Road 12/27/2011
CLA-Northridge Sub-Area Study 5:00 pm 5/27/2011 2035 No Build Synchro 7 - Report
EMH, LJB Inc. Page 9
Movement WBL WBR NBT NBR SBL SBT
Lane Configurations
Volume (vph) 190 130 430 130 80 360
Ideal Flow (vphpl) 1900 1900 1900 1900 1900 1900
Lane Width 10 10 12 12 10 10
Total Lost time (s) 4.0 4.0 4.0 4.0 4.0
Lane Util. Factor 1.00 1.00 1.00 1.00 1.00
Frt 1.00 0.85 0.97 1.00 1.00
Flt Protected 0.95 1.00 1.00 0.95 1.00
Satd. Flow (prot) 1652 1478 1805 1652 1739
Flt Permitted 0.95 1.00 1.00 0.19 1.00
Satd. Flow (perm) 1652 1478 1805 338 1739
Peak-hour factor, PHF 0.90 0.90 0.90 0.90 0.90 0.90
Adj. Flow (vph) 211 144 478 144 89 400
RTOR Reduction (vph) 0 0 0 0 0 0
Lane Group Flow (vph) 211 144 622 0 89 400
Turn Type Perm pm+pt
Protected Phases 8 2 1 6
Permitted Phases 8 6
Actuated Green, G (s) 12.4 12.4 24.5 33.7 33.7
Effective Green, g (s) 14.4 14.4 26.5 35.7 35.7
Actuated g/C Ratio 0.25 0.25 0.46 0.61 0.61
Clearance Time (s) 6.0 6.0 6.0 6.0 6.0
Vehicle Extension (s) 3.0 3.0 3.0 3.0 3.0
Lane Grp Cap (vph) 409 366 823 325 1069
v/s Ratio Prot c0.13 c0.34 0.02 c0.23
v/s Ratio Perm 0.10 0.14
v/c Ratio 0.52 0.39 0.76 0.27 0.37
Uniform Delay, d1 18.8 18.2 13.1 7.3 5.6
Progression Factor 1.00 1.00 1.00 1.00 1.00
Incremental Delay, d2 1.1 0.7 6.4 0.5 1.0
Delay (s) 19.9 18.9 19.5 7.7 6.6
Level of Service B B B A A
Approach Delay (s) 19.5 19.5 6.8
Approach LOS B B A
Intersection Summary
HCM Average Control Delay 15.3 HCM Level of Service B
HCM Volume to Capacity ratio 0.65
Actuated Cycle Length (s) 58.1 Sum of lost time (s) 12.0
Intersection Capacity Utilization 55.5% ICU Level of Service B
Analysis Period (min) 15
c Critical Lane Group

HCM Signalized Intersection Capacity Analysis
44: Providence & Derr Road 12/27/2011
CLA-Northridge Sub-Area Study 5:00 pm 5/27/2011 2035 No Build Synchro 7 - Report
EMH, LJB Inc. Page 10
Movement WBL WBR NBT NBR SBL SBT
Lane Configurations
Volume (vph) 110 70 660 100 100 530
Ideal Flow (vphpl) 1900 1900 1900 1900 1900 1900
Lane Width 16 12 11 11 11 11
Total Lost time (s) 4.0 4.0 4.0 4.0
Lane Util. Factor 1.00 0.95 1.00 0.95
Frt 0.95 0.98 1.00 1.00
Flt Protected 0.97 1.00 0.95 1.00
Satd. Flow (prot) 1941 3354 1711 3421
Flt Permitted 0.97 1.00 0.31 1.00
Satd. Flow (perm) 1941 3354 554 3421
Peak-hour factor, PHF 0.90 0.90 0.90 0.90 0.90 0.90
Adj. Flow (vph) 122 78 733 111 111 589
RTOR Reduction (vph) 0 0 0 0 0 0
Lane Group Flow (vph) 200 0 844 0 111 589
Turn Type Perm
Protected Phases 8 2 6
Permitted Phases 6
Actuated Green, G (s) 7.3 18.7 18.7 18.7
Effective Green, g (s) 9.3 20.7 20.7 20.7
Actuated g/C Ratio 0.24 0.54 0.54 0.54
Clearance Time (s) 6.0 6.0 6.0 6.0
Vehicle Extension (s) 3.0 3.0 3.0 3.0
Lane Grp Cap (vph) 475 1827 302 1864
v/s Ratio Prot c0.10 c0.25 0.17
v/s Ratio Perm 0.20
v/c Ratio 0.42 0.46 0.37 0.32
Uniform Delay, d1 12.1 5.3 4.9 4.8
Progression Factor 1.00 1.00 1.00 1.00
Incremental Delay, d2 0.6 0.2 0.8 0.1
Delay (s) 12.7 5.4 5.7 4.9
Level of Service B A A A
Approach Delay (s) 12.7 5.4 5.0
Approach LOS B A A
Intersection Summary
HCM Average Control Delay 6.1 HCM Level of Service A
HCM Volume to Capacity ratio 0.45
Actuated Cycle Length (s) 38.0 Sum of lost time (s) 8.0
Intersection Capacity Utilization 47.6% ICU Level of Service A
Analysis Period (min) 15
c Critical Lane Group

HCM Signalized Intersection Capacity Analysis
46: Woeber Mustard Mfg & Urbana 12/27/2011
CLA-Northridge Sub-Area Study 5:00 pm 5/27/2011 2035 No Build Synchro 7 - Report
EMH, LJB Inc. Page 11
Movement EBL EBT EBR WBL WBT WBR NBL NBT NBR SBL SBT SBR
Lane Configurations
Volume (vph) 2 0 7 172 0 60 23 357 211 127 512 0
Ideal Flow (vphpl) 1900 1900 1900 1900 1900 1900 1900 1900 1900 1900 1900 1900
Lane Width 10 10 12 10 10 12 12 12 12 12 12 12
Total Lost time (s) 4.0 4.0 4.0 4.0 4.0 4.0 4.0 4.0 4.0
Lane Util. Factor 1.00 1.00 1.00 1.00 1.00 0.95 1.00 1.00 0.95
Frt 1.00 0.85 1.00 0.85 1.00 1.00 0.85 1.00 1.00
Flt Protected 0.95 1.00 0.95 1.00 0.95 1.00 1.00 0.95 1.00
Satd. Flow (prot) 1652 1478 1652 1478 1770 3539 1583 1770 3539
Flt Permitted 0.71 1.00 0.75 1.00 0.44 1.00 1.00 0.44 1.00
Satd. Flow (perm) 1240 1478 1308 1478 816 3539 1583 829 3539
Peak-hour factor, PHF 0.90 0.90 0.90 0.90 0.90 0.90 0.90 0.90 0.90 0.90 0.90 0.90
Adj. Flow (vph) 2 0 8 191 0 67 26 397 234 141 569 0
RTOR Reduction (vph) 0 0 0 0 0 0 0 0 0 0 0 0
Lane Group Flow (vph) 2 8 0 191 67 0 26 397 234 141 569 0
Turn Type Perm Perm pm+pt Perm pm+pt
Protected Phases 4 8 5 2 1 6
Permitted Phases 4 8 2 2 6
Actuated Green, G (s) 9.8 9.8 9.8 9.8 19.0 18.1 18.1 25.6 21.4
Effective Green, g (s) 11.8 11.8 11.8 11.8 23.0 20.1 20.1 29.6 23.4
Actuated g/C Ratio 0.24 0.24 0.24 0.24 0.46 0.40 0.40 0.59 0.47
Clearance Time (s) 6.0 6.0 6.0 6.0 6.0 6.0 6.0 6.0 6.0
Vehicle Extension (s) 3.0 3.0 3.0 3.0 3.0 3.0 3.0 3.0 3.0
Lane Grp Cap (vph) 292 348 308 348 430 1420 635 606 1653
v/s Ratio Prot 0.01 0.05 0.00 0.11 c0.03 c0.16
v/s Ratio Perm 0.00 c0.15 0.02 0.15 0.11
v/c Ratio 0.01 0.02 0.62 0.19 0.06 0.28 0.37 0.23 0.34
Uniform Delay, d1 14.7 14.7 17.1 15.3 7.4 10.1 10.5 4.7 8.5
Progression Factor 1.00 1.00 1.00 1.00 1.00 1.00 1.00 1.00 1.00
Incremental Delay, d2 0.0 0.0 3.8 0.3 0.1 0.1 0.4 0.2 0.1
Delay (s) 14.7 14.7 21.0 15.6 7.5 10.2 10.9 4.9 8.6
Level of Service B B C B A B B A A
Approach Delay (s) 14.7 19.6 10.4 7.9
Approach LOS B B B A
Intersection Summary
HCM Average Control Delay 10.8 HCM Level of Service B
HCM Volume to Capacity ratio 0.44
Actuated Cycle Length (s) 50.1 Sum of lost time (s) 12.0
Intersection Capacity Utilization 45.3% ICU Level of Service A
Analysis Period (min) 15
c Critical Lane Group

HCM Unsignalized Intersection Capacity Analysis
3: SR 334 WB Off Ramp & Urbana Road 12/27/2011
CLA-Northridge Sub-Area Study 5:00 pm 5/27/2011 2035 No Build Synchro 7 - Report
EMH, LJB Inc. Page 1
Movement WBL WBR NBT NBR SBL SBT
Lane Configurations
Volume (veh/h) 140 10 540 0 0 660
Sign Control Stop Free Free
Grade -4% 2% -2%
Peak Hour Factor 0.90 0.90 0.90 0.90 0.90 0.90
Hourly flow rate (vph) 156 11 600 0 0 733
Pedestrians
Lane Width (ft)
Walking Speed (ft/s)
Percent Blockage
Right turn flare (veh)
Median type None None
Median storage veh)
Upstream signal (ft)
pX, platoon unblocked
vC, conflicting volume 967 300 600
vC1, stage 1 conf vol
vC2, stage 2 conf vol
vCu, unblocked vol 967 300 600
tC, single (s) 6.8 6.9 4.1
tC, 2 stage (s)
tF (s) 3.5 3.3 2.2
p0 queue free % 38 98 100
cM capacity (veh/h) 252 696 973
Direction, Lane # WB 1 NB 1 NB 2 SB 1 SB 2
Volume Total 167 300 300 367 367
Volume Left 156 0 0 0 0
Volume Right 11 0 0 0 0
cSH 264 1700 1700 1700 1700
Volume to Capacity 0.63 0.18 0.18 0.22 0.22
Queue Length 95th (ft) 97 0 0 0 0
Control Delay (s) 39.5 0.0 0.0 0.0 0.0
Lane LOS E
Approach Delay (s) 39.5 0.0 0.0
Approach LOS E
Intersection Summary
Average Delay 4.4
Intersection Capacity Utilization 33.3% ICU Level of Service A
Analysis Period (min) 15

HCM Unsignalized Intersection Capacity Analysis
6: SR 334 EB On Ramp & Urbana Road 12/27/2011
CLA-Northridge Sub-Area Study 5:00 pm 5/27/2011 2035 No Build Synchro 7 - Report
EMH, LJB Inc. Page 2
Movement WBL WBR NBT NBR SBL SBT
Lane Configurations
Volume (veh/h) 0 0 610 140 20 660
Sign Control Stop Free Free
Grade 0% 2% 0%
Peak Hour Factor 0.90 0.90 0.90 0.90 0.90 0.90
Hourly flow rate (vph) 0 0 678 156 22 733
Pedestrians
Lane Width (ft)
Walking Speed (ft/s)
Percent Blockage
Right turn flare (veh)
Median type None None
Median storage veh)
Upstream signal (ft)
pX, platoon unblocked
vC, conflicting volume 1089 339 678
vC1, stage 1 conf vol
vC2, stage 2 conf vol
vCu, unblocked vol 1089 339 678
tC, single (s) 6.8 6.9 4.1
tC, 2 stage (s)
tF (s) 3.5 3.3 2.2
p0 queue free % 100 100 98
cM capacity (veh/h) 205 657 910
Direction, Lane # NB 1 NB 2 NB 3 SB 1 SB 2 SB 3
Volume Total 339 339 156 22 367 367
Volume Left 0 0 0 22 0 0
Volume Right 0 0 156 0 0 0
cSH 1700 1700 1700 910 1700 1700
Volume to Capacity 0.20 0.20 0.09 0.02 0.22 0.22
Queue Length 95th (ft) 0 0 0 2 0 0
Control Delay (s) 0.0 0.0 0.0 9.1 0.0 0.0
Lane LOS A
Approach Delay (s) 0.0 0.3
Approach LOS
Intersection Summary
Average Delay 0.1
Intersection Capacity Utilization 30.3% ICU Level of Service A
Analysis Period (min) 15

HCM Unsignalized Intersection Capacity Analysis
13: Villa Road & SR 4 12/27/2011
CLA-Northridge Sub-Area Study 5:00 pm 5/27/2011 2035 No Build Synchro 7 - Report
EMH, LJB Inc. Page 3
Movement EBL EBR NBL NBT SBT SBR
Lane Configurations
Volume (veh/h) 90 50 70 330 220 70
Sign Control Stop Free Free
Grade 0% 0% 0%
Peak Hour Factor 0.90 0.90 0.90 0.90 0.90 0.90
Hourly flow rate (vph) 100 56 78 367 244 78
Pedestrians
Lane Width (ft)
Walking Speed (ft/s)
Percent Blockage
Right turn flare (veh)
Median type None None
Median storage veh)
Upstream signal (ft)
pX, platoon unblocked
vC, conflicting volume 806 283 322
vC1, stage 1 conf vol
vC2, stage 2 conf vol
vCu, unblocked vol 806 283 322
tC, single (s) 6.4 6.2 4.1
tC, 2 stage (s)
tF (s) 3.5 3.3 2.2
p0 queue free % 70 93 94
cM capacity (veh/h) 329 756 1232
Direction, Lane # EB 1 NB 1 SB 1
Volume Total 156 444 322
Volume Left 100 78 0
Volume Right 56 0 78
cSH 412 1232 1700
Volume to Capacity 0.38 0.06 0.19
Queue Length 95th (ft) 43 5 0
Control Delay (s) 18.9 2.0 0.0
Lane LOS C A
Approach Delay (s) 18.9 2.0 0.0
Approach LOS C
Intersection Summary
Average Delay 4.1
Intersection Capacity Utilization 55.1% ICU Level of Service B
Analysis Period (min) 15

HCM Unsignalized Intersection Capacity Analysis
14: Urbana Road & SR 334 WB On Ramp 12/27/2011
CLA-Northridge Sub-Area Study 5:00 pm 5/27/2011 2035 No Build Synchro 7 - Report
EMH, LJB Inc. Page 4
Movement NBT NBR SBL SBT SWL SWR
Lane Configurations
Volume (veh/h) 660 60 0 660 0 0
Sign Control Free Free Stop
Grade 0% 0% 0%
Peak Hour Factor 0.90 0.90 0.90 0.90 0.90 0.90
Hourly flow rate (vph) 733 67 0 733 0 0
Pedestrians
Lane Width (ft)
Walking Speed (ft/s)
Percent Blockage
Right turn flare (veh)
Median type None None
Median storage veh)
Upstream signal (ft)
pX, platoon unblocked
vC, conflicting volume 800 1100 367
vC1, stage 1 conf vol
vC2, stage 2 conf vol
vCu, unblocked vol 800 1100 367
tC, single (s) 4.1 6.8 6.9
tC, 2 stage (s)
tF (s) 2.2 3.5 3.3
p0 queue free % 100 100 100
cM capacity (veh/h) 819 206 630
Direction, Lane # NB 1 NB 2 NB 3 SB 1 SB 2
Volume Total 367 367 67 367 367
Volume Left 0 0 0 0 0
Volume Right 0 0 67 0 0
cSH 1700 1700 1700 1700 1700
Volume to Capacity 0.22 0.22 0.04 0.22 0.22
Queue Length 95th (ft) 0 0 0 0 0
Control Delay (s) 0.0 0.0 0.0 0.0 0.0
Lane LOS
Approach Delay (s) 0.0 0.0
Approach LOS
Intersection Summary
Average Delay 0.0
Intersection Capacity Utilization 33.3% ICU Level of Service A
Analysis Period (min) 15

HCM Unsignalized Intersection Capacity Analysis
15: SR 334 & SR 4 12/27/2011
CLA-Northridge Sub-Area Study 5:00 pm 5/27/2011 2035 No Build Synchro 7 - Report
EMH, LJB Inc. Page 5
Movement SEL SER NEL NET SWT SWR
Lane Configurations
Volume (veh/h) 190 40 50 240 180 130
Sign Control Stop Free Free
Grade 0% 0% 0%
Peak Hour Factor 0.90 0.90 0.90 0.90 0.90 0.90
Hourly flow rate (vph) 211 44 56 267 200 144
Pedestrians
Lane Width (ft)
Walking Speed (ft/s)
Percent Blockage
Right turn flare (veh)
Median type None None
Median storage veh)
Upstream signal (ft)
pX, platoon unblocked
vC, conflicting volume 650 272 200
vC1, stage 1 conf vol
vC2, stage 2 conf vol
vCu, unblocked vol 650 272 200
tC, single (s) 6.5 6.3 4.1
tC, 2 stage (s)
tF (s) 3.6 3.4 2.2
p0 queue free % 47 94 96
cM capacity (veh/h) 401 743 1360
Direction, Lane # SE 1 NE 1 SW 1
Volume Total 256 322 344
Volume Left 211 56 0
Volume Right 44 0 144
cSH 436 1360 1700
Volume to Capacity 0.59 0.04 0.20
Queue Length 95th (ft) 91 3 0
Control Delay (s) 24.3 1.6 0.0
Lane LOS C A
Approach Delay (s) 24.3 1.6 0.0
Approach LOS C
Intersection Summary
Average Delay 7.3
Intersection Capacity Utilization 55.8% ICU Level of Service B
Analysis Period (min) 15

HCM Unsignalized Intersection Capacity Analysis
20: Middle Urbana Road & SR 4 12/27/2011
CLA-Northridge Sub-Area Study 5:00 pm 5/27/2011 2035 No Build Synchro 7 - Report
EMH, LJB Inc. Page 6
Movement EBL EBR NBL NBT SBT SBR
Lane Configurations
Volume (veh/h) 10 300 380 350 280 10
Sign Control Stop Free Free
Grade 0% 0% 0%
Peak Hour Factor 0.90 0.90 0.90 0.90 0.90 0.90
Hourly flow rate (vph) 11 333 422 389 311 11
Pedestrians
Lane Width (ft)
Walking Speed (ft/s)
Percent Blockage
Right turn flare (veh)
Median type None None
Median storage veh)
Upstream signal (ft)
pX, platoon unblocked
vC, conflicting volume 1550 317 322
vC1, stage 1 conf vol
vC2, stage 2 conf vol
vCu, unblocked vol 1550 317 322
tC, single (s) 6.4 6.2 4.1
tC, 2 stage (s)
tF (s) 3.5 3.3 2.2
p0 queue free % 86 54 66
cM capacity (veh/h) 82 722 1226
Direction, Lane # EB 1 NB 1 SB 1
Volume Total 344 811 322
Volume Left 11 422 0
Volume Right 333 0 11
cSH 576 1226 1700
Volume to Capacity 0.60 0.34 0.19
Queue Length 95th (ft) 98 39 0
Control Delay (s) 20.1 7.0 0.0
Lane LOS C A
Approach Delay (s) 20.1 7.0 0.0
Approach LOS C
Intersection Summary
Average Delay 8.5
Intersection Capacity Utilization 83.9% ICU Level of Service E
Analysis Period (min) 15

HCM Unsignalized Intersection Capacity Analysis
24: Montego Drive & Middle Urbana Road 12/27/2011
CLA-Northridge Sub-Area Study 5:00 pm 5/27/2011 2035 No Build Synchro 7 - Report
EMH, LJB Inc. Page 7
Movement EBL EBT EBR WBL WBT WBR NBL NBT NBR SBL SBT SBR
Lane Configurations
Volume (veh/h) 10 10 80 30 10 10 110 420 20 10 260 20
Sign Control Stop Stop Free Free
Grade 0% 0% 0% 0%
Peak Hour Factor 0.90 0.90 0.90 0.90 0.90 0.90 0.90 0.90 0.90 0.90 0.90 0.90
Hourly flow rate (vph) 11 11 89 33 11 11 122 467 22 11 289 22
Pedestrians
Lane Width (ft)
Walking Speed (ft/s)
Percent Blockage
Right turn flare (veh)
Median type None None
Median storage veh)
Upstream signal (ft)
pX, platoon unblocked
vC, conflicting volume 1061 1056 300 1139 1056 478 311 489
vC1, stage 1 conf vol
vC2, stage 2 conf vol
vCu, unblocked vol 1061 1056 300 1139 1056 478 311 489
tC, single (s) 7.1 6.5 6.2 7.1 6.5 6.2 4.1 4.1
tC, 2 stage (s)
tF (s) 3.5 4.0 3.3 3.5 4.0 3.3 2.2 2.2
p0 queue free % 94 95 88 76 95 98 90 99
cM capacity (veh/h) 175 202 742 139 203 592 1255 1079
Direction, Lane # EB 1 WB 1 NB 1 SB 1
Volume Total 111 56 611 322
Volume Left 11 33 122 11
Volume Right 89 11 22 22
cSH 466 178 1255 1079
Volume to Capacity 0.24 0.31 0.10 0.01
Queue Length 95th (ft) 23 31 8 1
Control Delay (s) 15.1 34.2 2.5 0.4
Lane LOS C D A A
Approach Delay (s) 15.1 34.2 2.5 0.4
Approach LOS C D
Intersection Summary
Average Delay 4.8
Intersection Capacity Utilization 64.3% ICU Level of Service C
Analysis Period (min) 15

HCM Unsignalized Intersection Capacity Analysis
30: Moorefield Road & Derr Road 12/27/2011
CLA-Northridge Sub-Area Study 5:00 pm 5/27/2011 2035 No Build Synchro 7 - Report
EMH, LJB Inc. Page 8
Movement EBT EBR WBL WBT NBL NBR
Lane Configurations
Sign Control Stop Stop Stop
Volume (vph) 200 40 80 160 40 170
Peak Hour Factor 0.90 0.90 0.90 0.90 0.90 0.90
Hourly flow rate (vph) 222 44 89 178 44 189
Direction, Lane # EB 1 WB 1 NB 1
Volume Total (vph) 267 267 233
Volume Left (vph) 0 89 44
Volume Right (vph) 44 0 189
Hadj (s) -0.10 0.07 -0.45
Departure Headway (s) 4.7 4.9 4.7
Degree Utilization, x 0.35 0.36 0.31
Capacity (veh/h) 717 698 703
Control Delay (s) 10.3 10.6 9.8
Approach Delay (s) 10.3 10.6 9.8
Approach LOS B B A
Intersection Summary
Delay 10.3
HCM Level of Service B
Intersection Capacity Utilization 48.5% ICU Level of Service A
Analysis Period (min) 15

HCM Unsignalized Intersection Capacity Analysis
31: Montego Drive & Derr Road 12/27/2011
CLA-Northridge Sub-Area Study 5:00 pm 5/27/2011 2035 No Build Synchro 7 - Report
EMH, LJB Inc. Page 9
Movement WBL WBR NBT NBR SBL SBT
Lane Configurations
Volume (veh/h) 110 10 360 190 10 200
Sign Control Stop Free Free
Grade 0% 0% 0%
Peak Hour Factor 0.90 0.90 0.90 0.90 0.90 0.90
Hourly flow rate (vph) 122 11 400 211 11 222
Pedestrians
Lane Width (ft)
Walking Speed (ft/s)
Percent Blockage
Right turn flare (veh)
Median type None None
Median storage veh)
Upstream signal (ft)
pX, platoon unblocked
vC, conflicting volume 750 506 611
vC1, stage 1 conf vol
vC2, stage 2 conf vol
vCu, unblocked vol 750 506 611
tC, single (s) 6.4 6.2 4.1
tC, 2 stage (s)
tF (s) 3.5 3.3 2.2
p0 queue free % 68 98 99
cM capacity (veh/h) 378 571 978
Direction, Lane # WB 1 NB 1 SB 1
Volume Total 133 611 233
Volume Left 122 0 11
Volume Right 11 211 0
cSH 389 1700 978
Volume to Capacity 0.34 0.36 0.01
Queue Length 95th (ft) 37 0 1
Control Delay (s) 19.0 0.0 0.5
Lane LOS C A
Approach Delay (s) 19.0 0.0 0.5
Approach LOS C
Intersection Summary
Average Delay 2.7
Intersection Capacity Utilization 43.9% ICU Level of Service A
Analysis Period (min) 15

HCM Unsignalized Intersection Capacity Analysis
39: Urbana Road & SR 334 EB Off Ramp 12/27/2011
CLA-Northridge Sub-Area Study 5:00 pm 5/27/2011 2035 No Build Synchro 7 - Report
EMH, LJB Inc. Page 10
Movement NBT NBR SBL SBT NWL NWR
Lane Configurations
Volume (veh/h) 610 0 0 660 0 110
Sign Control Free Free Yield
Grade 0% 0% 0%
Peak Hour Factor 0.90 0.90 0.90 0.90 0.90 0.90
Hourly flow rate (vph) 678 0 0 733 0 122
Pedestrians
Lane Width (ft)
Walking Speed (ft/s)
Percent Blockage
Right turn flare (veh)
Median type None None
Median storage veh)
Upstream signal (ft)
pX, platoon unblocked
vC, conflicting volume 678 1044 339
vC1, stage 1 conf vol
vC2, stage 2 conf vol
vCu, unblocked vol 678 1044 339
tC, single (s) 4.1 6.8 6.9
tC, 2 stage (s)
tF (s) 2.2 3.5 3.3
p0 queue free % 100 100 81
cM capacity (veh/h) 910 224 657
Direction, Lane # NB 1 NB 2 SB 1 SB 2 NW 1
Volume Total 339 339 367 367 122
Volume Left 0 0 0 0 0
Volume Right 0 0 0 0 122
cSH 1700 1700 1700 1700 657
Volume to Capacity 0.20 0.20 0.22 0.22 0.19
Queue Length 95th (ft) 0 0 0 0 17
Control Delay (s) 0.0 0.0 0.0 0.0 11.7
Lane LOS B
Approach Delay (s) 0.0 0.0 11.7
Approach LOS B
Intersection Summary
Average Delay 0.9
Intersection Capacity Utilization 30.3% ICU Level of Service A
Analysis Period (min) 15