canvas program - · pdf filedisclosures and disclaimers cjb has attended advisory boards,...
TRANSCRIPT

Cliff Bailey
Aston University, Birmingham, UK
2017
CANVAS ProgramIndependent commentary

Disclosures and disclaimers
CJB has attended advisory boards, undertaken ad hoc consultancy,
received research and travel support, and delivered continuing medical
education sponsored by several pharmaceutical companies. These
include educational activities sponsored in whole or part by Janssen.
CJB has served as an expert witness to FDA, EMA and other medicines
regulators. Comments or opinions herein are those of CJB and do not
represent any organisation.
CJB is not an employee, board member, stockholder or shareholder of
any pharmaceutical company.
Clifford J Bailey

Photography prohibited
The ADA prohibits photography in session rooms
Please do not take photos during this presentation
Overview
CANVAS Program. Independent commentary
• Background• Design• Statistical analysis• Conduct• Interpretation • Limitations• Implications for clinical practice

• Pre-specified analysis of CV events in phase 2/3 studies- adjudicated CV mortality, MI, stroke, and can include hospitalization for ACS,
urgent revascularization and possibly other endpoints.
• Post-marketing trial- to definitely show upper 95% is <1.3
FDA, Food and Drug Administration; CV, cardiovascular; ACS, acute coronary syndrome; CI, confidence interval; MI, myocardial infarction; RR, risk ratio.U.S. Department of Health and Human Services, Food and Drug Administration, Center for Drug Evaluation and Research (CDER),, December 2008
FDA, Guidance for Industry, 2008Include type 2 diabetes patients at higher risk of CV events
0 .5 1 1.3 1.5 1.8 2.0Lower risk
RR (95% CI)
Higher risk
Post-marketing: confirm upper 95% CI <1.3
CANVAS Program. Background

CANVAS (start 2009) CANVAS-R (start 2014)1o end point 3 pt MACE (CV death, NF MI, NF stroke) Progression of albuminuria*
2o end point Fasting insulin secretion, Progression of albuminuria Effectiveness of lowering blood glucose (in sub-studies with other diabetes agents)
Composite of CV death or hospitalization for heart failureDeath from CV Causes
Other endpoint 3 pt MACE (CV death, NF MI, NF stroke)
Inclusion N=4,330, T2DM, HbA1c 7 -10.5% N=5,812, T2DM, HbA1c 7-10.5%
CV status >30 yrs, history of CV disease, or >50 yrs, >2 risk factors for CV disease**
>30 yrs, history of CV disease, or >50 yrs, >2 risk factors for CV disease**
Amended CANVAS was originally designed for up to 9 years. As per FDA post-marketing requirements for canagliflozin, the study's last subject last visit will now occur when enough MACE events (ie, CV death, nonfatal myocardial infarction, nonfatal stroke) are accumulated between the CANVAS and CANVAS-R studies.
https://clinicaltrials.gov/ct2/show/NCT01989754https://clinicaltrials.gov/ct2/show/NCT01032629
* number who develop micro- or macro-albuminuria if baseline normoalbuminuria OR number who develop macro-albuminuria if baseline micro-albuminuria, with urinary albumin/creatinine ratio (ACR) increase > 30% from baseline.** diabetes >10 yrs, SBP >140 mmHg while on >1 antihypertensive agents, current smoker, micro- or macroalbuminuria, HDL-C <1 mmol/L.MACE, major adverse cardiac events; NF non-fatal, MI myocardial infarction
CANVAS and CANVAS-R. DesignBoth Randomized, Double-Blind, Placebo-Controlled in T2DM. Canagliflozin 100 or 300 mg/d. Time to event

CANVAS (start 2009) CANVAS-R (start 2014)1o end point 3 pt MACE (CV death, NF MI, NF stroke) Progression of albuminuria*
2o end point Fasting insulin secretion, Progression of albuminuria Effectiveness of lowering blood glucose (in sub-studies with other diabetes agents)
Composite of CV death or hospitalization for heart failureDeath from CV Causes
Other endpoint 3 pt MACE (CV death, NF MI, NF stroke)
Inclusion N=4,330, T2DM, HbA1c 7 -10.5% N=5,812, T2DM, HbA1c 7-10.5%
CV status >30 yrs, history of CV disease, or >50 yrs, >2 risk factors for CV disease**
>30 yrs, history of CV disease, or >50 yrs, >2 risk factors for CV disease**
Amended CANVAS was originally designed for up to 9 years. As per FDA post-marketing requirements for canagliflozin, the study's last subject last visit will now occur when enough MACE events (ie, CV death, nonfatal myocardial infarction, nonfatal stroke) are accumulated between the CANVAS and CANVAS-R studies.
https://clinicaltrials.gov/ct2/show/NCT01989754https://clinicaltrials.gov/ct2/show/NCT01032629
* number who develop micro- or macro-albuminuria if baseline normoalbuminuria OR number who develop macro-albuminuria if baseline micro-albuminuria, with urinary albumin/creatinine ratio (ACR) increase > 30% from baseline.** diabetes >10 yrs, SBP >140 mmHg while on >1 antihypertensive agents, current smoker, micro- or macroalbuminuria, HDL-C <1 mmol/L.MACE, major adverse cardiac events; NF non-fatal, MI myocardial infarction
3 pt MACE (CV death, NF MI, NF stroke)
CANVAS and CANVAS-R. DesignBoth Randomized, Double-Blind, Placebo-Controlled in T2DM. Canagliflozin 100 or 300 mg/d. Time to event

CANVAS and CANVAS-R. Design
CANVAS (start 2009) CANVAS-R (start 2014)1o end point 3 pt MACE (CV death, NF MI, NF stroke) Progression of albuminuria*
2o end point Fasting insulin secretion, Progression of albuminuria Effectiveness of lowering blood glucose (in sub-studies with other diabetes agents)
Composite of CV death or hospitalization for heart failureDeath from CV Causes
Other endpoint 3 pt MACE (CV death, NF MI, NF stroke)
Inclusion N=4,330, T2DM, HbA1c 7 -10.5% N=5,812, T2DM, HbA1c 7-10.5%
CV status >30 yrs, history of CV disease, or >50 yrs, >2 risk factors for CV disease**
>30 yrs, history of CV disease, or >50 yrs, >2 risk factors for CV disease**
Amended CANVAS was originally designed for up to 9 years. As per FDA post-marketing requirements for canagliflozin, the study's last subject last visit will now occur when enough MACE events (ie, CV death, nonfatal myocardial infarction, nonfatal stroke) are accumulated between the CANVAS and CANVAS-R studies.
https://clinicaltrials.gov/ct2/show/NCT01989754https://clinicaltrials.gov/ct2/show/NCT01032629
Both Randomized, Double-Blind, Placebo-Controlled in T2DM. Canagliflozin 100 or 300 mg/d. Time to event
* number who develop micro- or macro-albuminuria if baseline normoalbuminuria OR number who develop macro-albuminuria if baseline micro-albuminuria, with urinary albumin/creatinine ratio (ACR) increase > 30% from baseline.** diabetes >10 yrs, SBP >140 mmHg while on >1 antihypertensive agents, current smoker, micro- or macroalbuminuria, HDL-C <1 mmol/L.MACE, major adverse cardiac events; NF non-fatal, MI myocardial infarction
3 pt MACE (CV death, NF MI, NF stroke)

CANVAS Program. Statistical analysis
Neal et al, Diabetes Obesity Metabolism 2017, DOM 10.1111/dom.12924. Submitted 2 Jan 2017, Accepted 23 Feb 2017.
Modified statistical analysis planwith input by FDA
Purpose• Maximise opportunity for new discoveries from the data
Actual changes• Integrate datasets of CANVAS and CANVAS-R• Include more efficacy and safety parameters• Additional sequential testing (includes original)
Avoid bias• Worse case imputation of missing data• Interim unblinded data (2012) are small proportion of total
Extra CV & renal outcomesDKA, fractures, amputations
Interim analysis in 2012

CANVAS Program. Conduct
Conduct categories based on World Health Organization WHO Technical Report Series, No. 850, 1995, Annex 3 Guidelines for good clinical practice (GCP) for trials on pharmaceutical products
Features of a well conducted clinical trial
Feature Success
Population - appropriate
Recruitment – any biases
Power – event driven
Retention
Monitoring/documentation
Adherence
Adjudication of events
Data handling

Trial → EMPA-REG CANVAS ELIXA LEADER SUSTAIN SAVOR EXAMINE TECOS
Baseline Empagliflozin Canagliflozin Lixisenatide Liraglutide Semaglutide Saxagliptin Alogliptin Sitagliptin
n 7,020 10,142 6,068 9,340 3,297 16,492 5,400 14,671
Age (yr) 63 63.3 60 64.3 64.6 65 61 66
Diabetes (yr) 57%>10y 13.5 9.3 12.8 13.9 10 7.2 9.4
BMI (kg/m2) 30.6 32.0 30.1 32.5 32.8 31 29 29
Insulin (%) 48 50 39 44 58 41 30 23
HbA1c (%) 8.1 8.2 7.7 8.7 8.7 8.0 8.0 7.3
Prior CV disease (%) 99 65 100 ~81 ~83 78 100 100
Types of priorCV disease
MI, CHD, CVD, PVD
MI, CHD, CVD, PVD
ACS <180 days
>50y + CV disease* or CKD or >60y + >1 CV risk factor
>40y + CV dis (CHD, CVD, PVD) or >55y + >1 CV risk factor
ACS <90 days
CHD, CVD,PVD
Hypertension (%) 94 89.9 76.4 92 92.8 81 83 86
Follow-up (yr) 3.1 3.6 2.1 3.8 2.1 2.1 1.5 2.8
Test agent or placebo given as add-on to usual care, aiming for glycaemic equipoise
CV outcome trials: different populations
* CV disease in Leader and Sustain included CHD, CVD, PVD and HF. ACS, acute coronary syndrome; CHD, coronary heart disease; CVD, cerebrovascular disease; PVD, peripheral vascular disease; CKD, chronic kidney disease >stage 3; HF, chronic heart failure - NYHA class II or III; MI, myocardial infarction. Follow-up is median except CANVAS which is mean. Scirica BM, et al. New Engl J Med 2013;369:1317-1326; White WB, et al. N Engl J Med 2013;369:1327-1335; Bethel et al. 2015; Zinman et al. Cardiovasc Diabetol 2014;13:102-110. Pfeffer et al, N Engl J Med 2015; 373:2247-2257. Marso et al, N Engl J Med 2016; 375: 311-322; Marso et al, N Engl J Med, 2016, 375: 1834-44.
SGLT-2 inhibitors GLP-1 receptor agonists DPP-4 inhibitors
Baseline characteristics of type 2 diabetes populations

Trial → EMPA-REG CANVAS ELIXA LEADER SUSTAIN SAVOR EXAMINE TECOS
Baseline Empagliflozin Canagliflozin Lixisenatide Liraglutide Semaglutide Saxagliptin Alogliptin Sitagliptin
n 7,020 10,142 6,068 9,340 3,297 16,492 5,400 14,671
Age (yr) 63 63.3 60 64.3 64.6 65 61 66
Diabetes (yr) 57%>10y 13.5 9.3 12.8 13.9 10 7.2 9.4
BMI (kg/m2) 30.6 32.0 30.1 32.5 32.8 31 29 29
Insulin (%) 48 50 39 44 58 41 30 23
HbA1c (%) 8.1 8.2 7.7 8.7 8.7 8.0 8.0 7.3
Prior CV disease (%) 99 65 100 ~81 ~83 78 100 100
Types of priorCV disease
MI, CHD, CVD, PVD
MI, CHD, CVD, PVD
ACS <180 days
>50y + CV disease* or CKD or >60y + >1 CV risk factor
>40y + CV dis (CHD, CVD, PVD) or >55y + >1 CV risk factor
ACS <90 days
CHD, CVD,PVD
Hypertension (%) 94 89.9 76.4 92 92.8 81 83 86
Follow-up (yr) 3.1 3.6 2.1 3.8 2.1 2.1 1.5 2.8
Test agent or placebo given as add-on to usual care, aiming for glycaemic equipoise
CV outcome trials: different populations
SGLT-2 inhibitors GLP-1 receptor agonists DPP-4 inhibitors
Baseline characteristics of type 2 diabetes populations
* CV disease in Leader and Sustain included CHD, CVD, PVD and HF. ACS, acute coronary syndrome; CHD, coronary heart disease; CVD, cerebrovascular disease; PVD, peripheral vascular disease; CKD, chronic kidney disease >stage 3; HF, chronic heart failure - NYHA class II or III; MI, myocardial infarction. Follow-up is median except CANVAS which is mean. Scirica BM, et al. New Engl J Med 2013;369:1317-1326; White WB, et al. N Engl J Med 2013;369:1327-1335; Bethel et al. 2015; Zinman et al. Cardiovasc Diabetol 2014;13:102-110. Pfeffer et al, N Engl J Med 2015; 373:2247-2257. Marso et al, N Engl J Med 2016; 375: 311-322; Marso et al, N Engl J Med, 2016, 375: 1834-44.

Trial → EMPA-REG CANVAS ELIXA LEADER SUSTAIN SAVOR EXAMINE TECOS
Baseline Empagliflozin Canagliflozin Lixisenatide Liraglutide Semaglutide Saxagliptin Alogliptin Sitagliptin
n 7,020 10,142 6,068 9,340 3,297 16,492 5,400 14,671
Age (yr) 63 63.3 60 64.3 64.6 65 61 66
Diabetes (yr) 57%>10y 13.5 9.3 12.8 13.9 10 7.2 9.4
BMI (kg/m2) 30.6 32.0 30.1 32.5 32.8 31 29 29
Insulin (%) 48 50 39 44 58 41 30 23
HbA1c (%) 8.1 8.2 7.7 8.7 8.7 8.0 8.0 7.3
Prior CV disease (%) 99 65 100 ~81 ~83 78 100 100
Types of priorCV disease
MI, CHD, CVD, PVD
MI, CHD, CVD, PVD
ACS <180 days
>50y + CV disease* or CKD or >60y + >1 CV risk factor
>40y + CV dis (CHD, CVD, PVD) or >55y + >1 CV risk factor
ACS <90 days
CHD, CVD,PVD
Hypertension (%) 94 89.9 76.4 92 92.8 81 83 86
Follow-up (yr) 3.1 3.6 2.1 3.8 2.1 2.1 1.5 2.8
Test agent or placebo given as add-on to usual care, aiming for glycaemic equipoise
CV outcome trials: different populations
SGLT-2 inhibitors GLP-1 receptor agonists DPP-4 inhibitors
Baseline characteristics of type 2 diabetes populations
65% prior CV disease
* CV disease in Leader and Sustain included CHD, CVD, PVD and HF. ACS, acute coronary syndrome; CHD, coronary heart disease; CVD, cerebrovascular disease; PVD, peripheral vascular disease; CKD, chronic kidney disease >stage 3; HF, chronic heart failure - NYHA class II or III; MI, myocardial infarction. Follow-up is median except CANVAS which is mean. Scirica BM, et al. New Engl J Med 2013;369:1317-1326; White WB, et al. N Engl J Med 2013;369:1327-1335; Bethel et al. 2015; Zinman et al. Cardiovasc Diabetol 2014;13:102-110. Pfeffer et al, N Engl J Med 2015; 373:2247-2257. Marso et al, N Engl J Med 2016; 375: 311-322; Marso et al, N Engl J Med, 2016, 375: 1834-44.

Trial → EMPA-REG CANVAS ELIXA LEADER SUSTAIN SAVOR EXAMINE TECOS
Empagliflozin Canagliflozin Lixisenatide Liraglutide Semaglutide Saxagliptin Alogliptin Sitagliptin
3pt MACE 0.86*0,74, 0.99
1.020.89,1.17
0.87*0.78. 0.97
0.74*0.58, 0.95
1.00.89, 1.08
0.96Upper <1.16
0.98^0.89, 1.08
CV death 0.62*0.49, 0.77
0.980,78, 1.22
0.78*0.66, 0.93
0.980.65. 1.48
1.030.87, 1.22
0.790.60, 1.04
1.030.89, 1.19
Non-fatal MI 0.870.70, 1.09
1.03+
0.87, 1.22
0.880.75, 1.03
0.740.51, 1.08
0.950.80, 1.12
1.080.88, 1.33
0.95+
0.81, 1.11
Non-fatal stroke 1.240.92, 1.67
1.12+
0.79, 1.58
0.890.72, 1.11
0.61*0.38, 0.99
1.110.88, 1.39
0.910.55, 1.50
0.97+
0.89, 1.08
Hospitalized HF 0.65*0.50, 0.85
0.960.75, 1.23
0.870.73, 1.05
1.110.77, 1.61
1.27*1.07, 1.51
1.070.78, 1.15
1.000.83, 1.20
All cause death 0.68*0.57, 0.82
0.940.78, 1.13
0.85*0.74, 0.97
1.050.74, 1.50
1.110.96, 1.27
0.880.71, 1.09
1.010.90, 1.14
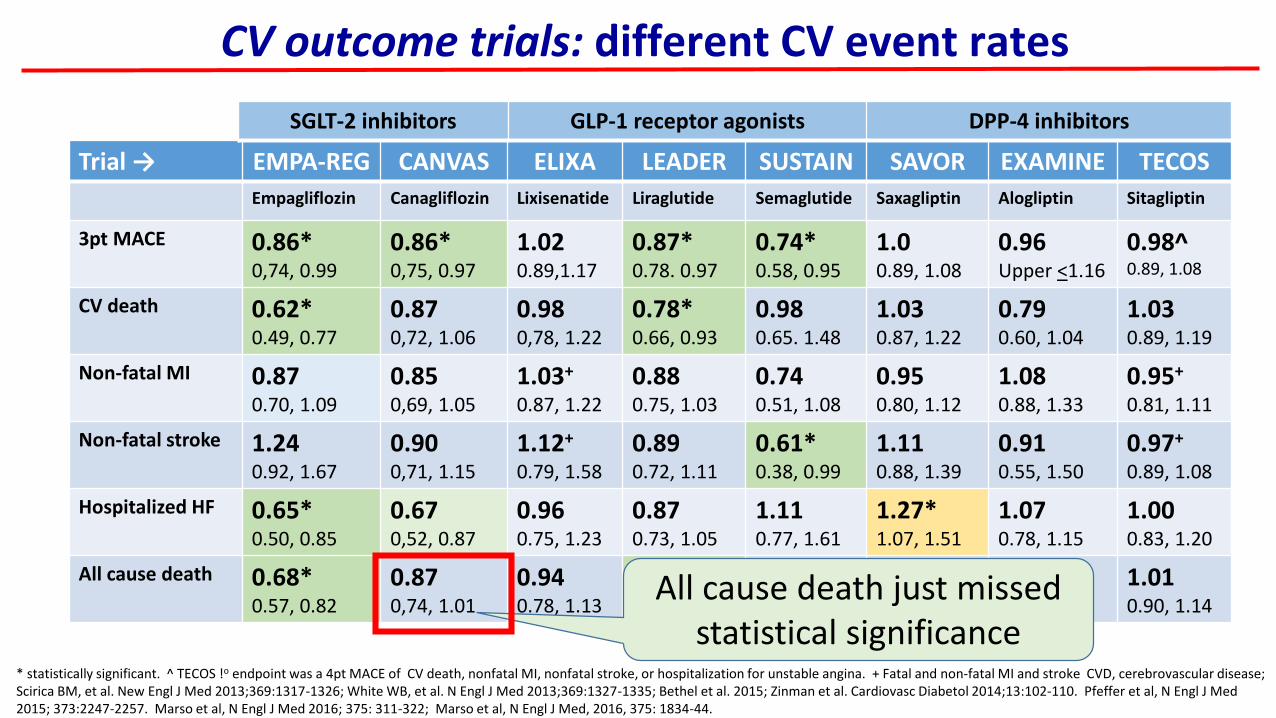
CV outcome trials: different CV event rates
* statistically significant. ^ TECOS !o endpoint was a 4pt MACE of CV death, nonfatal MI, nonfatal stroke, or hospitalization for unstable angina. + Fatal and non-fatal MI and stroke CVD, cerebrovascular disease; Scirica BM, et al. New Engl J Med 2013;369:1317-1326; White WB, et al. N Engl J Med 2013;369:1327-1335; Bethel et al. 2015; Zinman et al. Cardiovasc Diabetol 2014;13:102-110. Pfeffer et al, N Engl J Med 2015; 373:2247-2257. Marso et al, N Engl J Med 2016; 375: 311-322; Marso et al, N Engl J Med, 2016, 375: 1834-44.
SGLT-2 inhibitors GLP-1 receptor agonists DPP-4 inhibitors

Trial → EMPA-REG CANVAS ELIXA LEADER SUSTAIN SAVOR EXAMINE TECOS
Empagliflozin Canagliflozin Lixisenatide Liraglutide Semaglutide Saxagliptin Alogliptin Sitagliptin
3pt MACE 0.86*0,74, 0.99
1.020.89,1.17
0.87*0.78. 0.97
0.74*0.58, 0.95
1.00.89, 1.08
0.96Upper <1.16
0.98^0.89, 1.08
CV death 0.62*0.49, 0.77
0.980,78, 1.22
0.78*0.66, 0.93
0.980.65. 1.48
1.030.87, 1.22
0.790.60, 1.04
1.030.89, 1.19
Non-fatal MI 0.870.70, 1.09
1.03+
0.87, 1.22
0.880.75, 1.03
0.740.51, 1.08
0.950.80, 1.12
1.080.88, 1.33
0.95+
0.81, 1.11
Non-fatal stroke 1.240.92, 1.67
1.12+
0.79, 1.58
0.890.72, 1.11
0.61*0.38, 0.99
1.110.88, 1.39
0.910.55, 1.50
0.97+
0.89, 1.08
Hospitalized HF 0.65*0.50, 0.85
0.960.75, 1.23
0.870.73, 1.05
1.110.77, 1.61
1.27*1.07, 1.51
1.070.78, 1.15
1.000.83, 1.20
All cause death 0.68*0.57, 0.82
0.940.78, 1.13
0.85*0.74, 0.97
1.050.74, 1.50
1.110.96, 1.27
0.880.71, 1.09
1.010.90, 1.14
* statistically significant. ^ TECOS !o endpoint was a 4pt MACE of CV death, nonfatal MI, nonfatal stroke, or hospitalization for unstable angina. + Fatal and non-fatal MI and stroke CVD, cerebrovascular disease; Scirica BM, et al. New Engl J Med 2013;369:1317-1326; White WB, et al. N Engl J Med 2013;369:1327-1335; Bethel et al. 2015; Zinman et al. Cardiovasc Diabetol 2014;13:102-110. Pfeffer et al, N Engl J Med 2015; 373:2247-2257. Marso et al, N Engl J Med 2016; 375: 311-322; Marso et al, N Engl J Med, 2016, 375: 1834-44.
SGLT-2 inhibitors GLP-1 receptor agonists DPP-4 inhibitors
CV outcome trials: different CV event rates

Trial → EMPA-REG CANVAS ELIXA LEADER SUSTAIN SAVOR EXAMINE TECOS
Empagliflozin Canagliflozin Lixisenatide Liraglutide Semaglutide Saxagliptin Alogliptin Sitagliptin
3pt MACE 0.86*0,74, 0.99
0.86*0,75, 0.97
1.020.89,1.17
0.87*0.78. 0.97
0.74*0.58, 0.95
1.00.89, 1.08
0.96Upper <1.16
0.98^0.89, 1.08
CV death 0.62*0.49, 0.77
0.870,72, 1.06
0.980,78, 1.22
0.78*0.66, 0.93
0.980.65. 1.48
1.030.87, 1.22
0.790.60, 1.04
1.030.89, 1.19
Non-fatal MI 0.870.70, 1.09
0.850,69, 1.05
1.03+
0.87, 1.22
0.880.75, 1.03
0.740.51, 1.08
0.950.80, 1.12
1.080.88, 1.33
0.95+
0.81, 1.11
Non-fatal stroke 1.240.92, 1.67
0.900,71, 1.15
1.12+
0.79, 1.58
0.890.72, 1.11
0.61*0.38, 0.99
1.110.88, 1.39
0.910.55, 1.50
0.97+
0.89, 1.08
Hospitalized HF 0.65*0.50, 0.85
0.670,52, 0.87
0.960.75, 1.23
0.870.73, 1.05
1.110.77, 1.61
1.27*1.07, 1.51
1.070.78, 1.15
1.000.83, 1.20
All cause death 0.68*0.57, 0.82
0.870,74, 1.01
0.940.78, 1.13
0.85*0.74, 0.97
1.050.74, 1.50
1.110.96, 1.27
0.880.71, 1.09
1.010.90, 1.14
* statistically significant. ^ TECOS !o endpoint was a 4pt MACE of CV death, nonfatal MI, nonfatal stroke, or hospitalization for unstable angina. + Fatal and non-fatal MI and stroke CVD, cerebrovascular disease; Scirica BM, et al. New Engl J Med 2013;369:1317-1326; White WB, et al. N Engl J Med 2013;369:1327-1335; Bethel et al. 2015; Zinman et al. Cardiovasc Diabetol 2014;13:102-110. Pfeffer et al, N Engl J Med 2015; 373:2247-2257. Marso et al, N Engl J Med 2016; 375: 311-322; Marso et al, N Engl J Med, 2016, 375: 1834-44.
SGLT-2 inhibitors GLP-1 receptor agonists DPP-4 inhibitors
CV outcome trials: different CV event rates
All cause death just missed statistical significance

1o in 490/4687 (10.5%) in Empa gps vs 282/2333 (12.1%) in Pbo, HR 0.86; 95% CI 0.74 to 0.99; P = 0.04. N/S differences in MI or stroke, but Empalowered rates of CV deaths (3.7%, vs. 5.9%; RRR 38%), hospitalization for HF (2.7% vs 4.1%, RRR 35%), and death from any cause (5.7% vs 8.3%, RRR 32%).
N=7020, T2DM with CV disease, RDBPC design, Empa 10 or 25 mg/d added to standard care for median 3.1 yrs. Age 63 yrs, Wt ~86 kg. 1o endpoint = 3pt MACE, composite of CV death, fatal and non-fatal MI and stroke
Zinman et al, N Engl J Med 2015; 373:2117-2128
Primary outcome Death from CV causes
Death from any cause Hospitalisation for heart failure
EMPA-REG: Empagliflozin CV outcomes
Primary outcome
Death from any cause
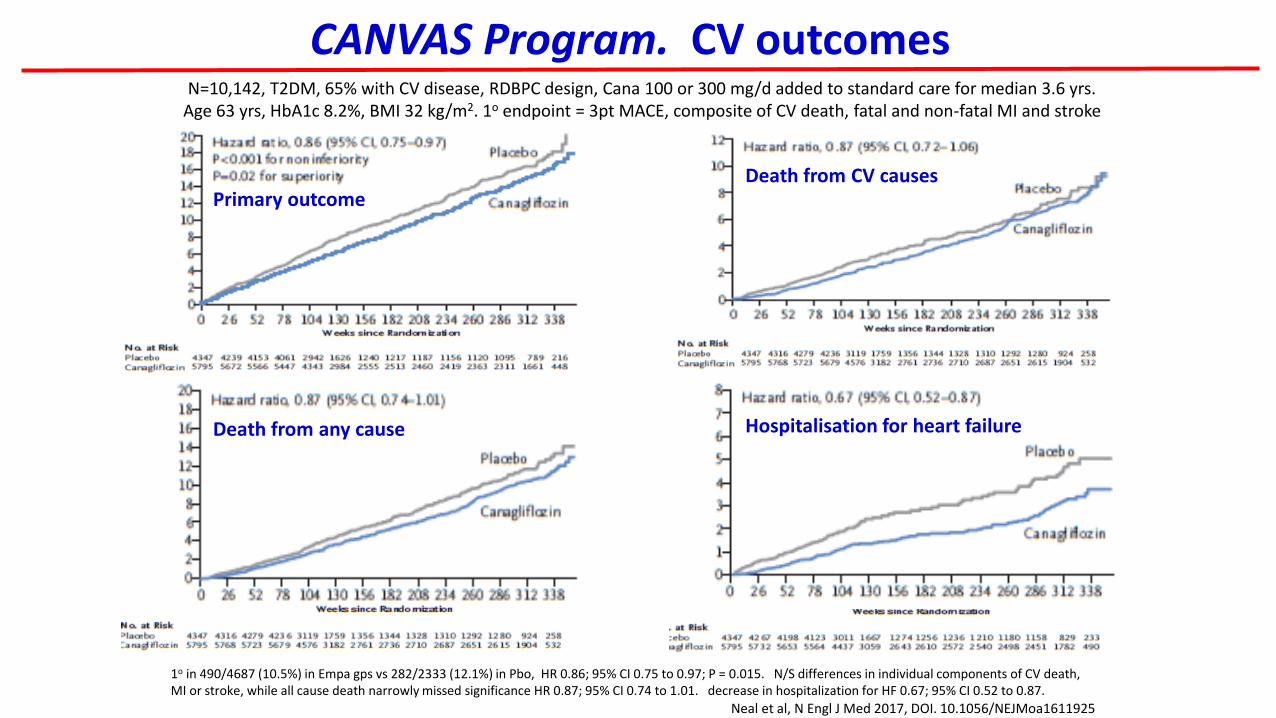
CANVAS Program. CV outcomes
Hospitalisation for heart failure
1o in 490/4687 (10.5%) in Empa gps vs 282/2333 (12.1%) in Pbo, HR 0.86; 95% CI 0.75 to 0.97; P = 0.015. N/S differences in individual components of CV death,MI or stroke, while all cause death narrowly missed significance HR 0.87; 95% CI 0.74 to 1.01. decrease in hospitalization for HF 0.67; 95% CI 0.52 to 0.87.
N=10,142, T2DM, 65% with CV disease, RDBPC design, Cana 100 or 300 mg/d added to standard care for median 3.6 yrs. Age 63 yrs, HbA1c 8.2%, BMI 32 kg/m2. 1o endpoint = 3pt MACE, composite of CV death, fatal and non-fatal MI and stroke
Death from CV causes
Neal et al, N Engl J Med 2017, DOI. 10.1056/NEJMoa1611925

Onset of primary CV composite endpoint
Zinman et al, N Engl J Med 2015; 373:2117-2128
EMPA-REG Primary outcome
EMPA-REG vs CANVAS: CV outcomes
Different rates of onset of primary CV composite endpoint• Differences in prior CVD 99% vs 65% ?• Agent specific differences ?• Differences in placebo arm ?
Neal et al, N Engl J Med 2017, on-line. DOI. 10.1056/NEJMoa1611925
CANVAS Primary outcome

Differences in stroke during and after SGLT2 inhibitor
Zinman et al, Stroke. 2017;48:online. DOI: 10.1161/STROKEAHA.116.015756. Neal et al, N Engl J Med 2017, on-line. DOI. 10.1056/NEJMoa1611925
18 patients in empagliflozin group had stroke >90 days after last intake of drug (versus 3 on placebo). Analysis during treatment or ≤90 days after last dose
HR 1.08 (0.81–1.45; P=0.60). Patients with the largest increases in hematocrit or largest decreases in systolic blood pressure did nothave an increased risk of stroke
HR 1.18 (0.89–1.56; P=0.26)
EMPA-REG vs CANVAS: Stroke
EMPA-REG. Stroke
Empagliflozin
Canagliflozin
Placebo
Placebo
CANVAS. StrokeHR 0.90 (0.71–1.15)

Trial → EMPA-REG CANVAS
eGFR ml/min/1.73m2 74 76
Microalbuminuria (%) 29 22.7
Macroalbuminuria (%) 11 7.6
New or worse nephropathy
0.61*0.53, 0.70 0.73
0.67, 0.79Progression to macroalbuminuria
0.62*0.54, 0.72
Renal composite 40% ↓ eGFR, dialysis/transplant, renal death
0.600.47, 0.77
Regression of albuminuria
1.701.51, 1.91
UTI 18.0 vs 18.1 % 40 vs 37 per 1000 pt yrs
Follow-up (yr) 3.1 3.6
CV outcome trials: renal outcome data
Microalbuminuria: albumin 30-300 mg/day; 30-300 ug albumin/mg creatinine; albumin/creatinine ratio (ACR) >2.5-25 mg/mmol (M), >3.5-35 mg/mmol (F).Renal composite was 40% reduction in eGFR, need for renal-replacement therapy, or renal death. Progression of albuminuria was defined as more than a 30% increase in albuminuria and a change from either normoalbuminuria to microalbuminuria or macroalbuminuria or from microalbuminuria to macroalbuminuria.. UTI, urinary tract infection, Empa 18.0% vs Pbo 18.1, Cana 40 vs Pbo 37 per 1000 patient yrs. Follow up Empa median, Canvas mean.
Renal protectionespecially in CANVAS-R
Bas
elin
eC
om
ple
tio
n
Wanner et al, N Engl J Med 2016, 375:323-334; Neal et al, N Engl J Med 2017, on-line. DOI. 10.1056/NEJMoa1611925

Trial → EMPA-REG CANVAS
eGFR ml/min/1.73m2 74 76
Microalbuminuria (%) 29 22.7
Macroalbuminuria (%) 11 7.6
New or worse nephropathy
0.61*0.53, 0.70 0.73
0.67, 0.79Progression to macroalbuminuria
0.62*0.54, 0.72
Renal composite 40% ↓ eGFR, dialysis/transplant, renal death
0.600.47, 0.77
Regression of albuminuria
1.701.51, 1.91
UTI 18.0 vs 18.1 % 40 vs 37 per 1000 pt yrs
Follow-up (yr) 3.1 3.6
CV outcome trials: renal outcome data
Wanner et al, N Engl J Med 2016, 375:323-334; Neal et al, N Engl J Med 2017, on-line. DOI. 10.1056/NEJMoa1611925
Renal protectionespecially in CANVAS-R
Reversing renal decline
Bas
elin
eC
om
ple
tio
n
Microalbuminuria: albumin 30-300 mg/day; 30-300 ug albumin/mg creatinine; albumin/creatinine ratio (ACR) >2.5-25 mg/mmol (M), >3.5-35 mg/mmol (F).Renal composite was 40% reduction in eGFR, need for renal-replacement therapy, or renal death. Progression of albuminuria was defined as more than a 30% increase in albuminuria and a change from either normoalbuminuria to microalbuminuria or macroalbuminuria or from microalbuminuria to macroalbuminuria.. UTI, urinary tract infection, Empa 18.0% vs Pbo 18.1, Cana 40 vs Pbo 37 per 1000 patient yrs. Follow up Empa median, Canvas mean.

CANVAS
Canagliflozin Placebo HR (95% CI)
Events per 1000 patient yrs
Female genital
mycotic l infection68.8 17.5
4.37 (2.78-6.88)
Volume depletion 26.0 18.51.44
(1.09-1.90)
DKA (adjudicated)(n = 18/10,134)
0.6* 0.32.33
(0.76-7.17)
Bone fractures 15.4 11.9 1.26 (1.04–1.52)
- Fractures in CANVAS- Fractures in CANVAS-R
1.55 (1.21–1.97)
0.86 (0.62–1.19)
Amputations 6.3 3.4 1.97(1.41-2.75)
*5 patients reporting diabetic ketoacidosis (all on canagliflozin) identified as having autoimmune diabetes (positive GADA and mIAA or a reported history of T1DM
CV outcome trials: adverse events
Neal et al, N Engl J Med 2017, on-line. DOI. 10.1056/NEJMoa1611925
Some type 1 diabetes patients?

CANVAS
Canagliflozin Placebo HR (95% CI)
Events per 1000 patient yrs
Female genital
mycotic l infection68.8 17.5
4.37 (2.78-6.88)
Volume depletion 26.0 18.51.44
(1.09-1.90)
DKA (adjudicated)(n = 18/10,134)
0.6* 0.32.33
(0.76-7.17)
Bone fractures 15.4 11.9 1.26 (1.04–1.52)
- Fractures in CANVAS- Fractures in CANVAS-R
1.55 (1.21–1.97)
0.86 (0.62–1.19)
Amputations 6.3 3.4 1.97(1.41-2.75)
*5 patients reporting diabetic ketoacidosis (all on canagliflozin) identified as having autoimmune diabetes (positive GADA and mIAA or a reported history of T1DM)
CV outcome trials: adverse events
Bone fractures heterogeneity
Neal et al, N Engl J Med 2017, on-line. DOI. 10.1056/NEJMoa1611925

CANVAS
Canagliflozin Placebo HR (95% CI)
Events per 1000 patient yrs
Female genital
mycotic l infection68.8 17.5
4.37 (2.78-6.88)
Volume depletion 26.0 18.51.44
(1.09-1.90)
DKA (adjudicated)(n = 18/10,134)
0.6* 0.32.33
(0.76-7.17)
Bone fractures 15.4 11.9 1.26 (1.04–1.52)
- Fractures in CANVAS- Fractures in CANVAS-R
1.55 (1.21–1.97)
0.86 (0.62–1.19)
Amputations 6.3 3.4 1.97(1.41-2.75)
*5 patients reporting diabetic ketoacidosis (all on canagliflozin) identified as having autoimmune diabetes (positive GADA and mIAA or a reported history of T1DM)
CV outcome trials: adverse events
71% toe & metatarsal
Neal et al, N Engl J Med 2017, on-line. DOI. 10.1056/NEJMoa1611925
Mainly if• Prior amputation• Peripheral vasc dis

CANVAS Program. Limitations
Limitations: standard for these types of studiesas noted by authors
• Moderate number of events for some outcomes
— eg for end-stage kidney disease
• Limited number of participants with established kidney disease
• Interim analysis data of CANVAS included
• Integration of two separate populations
• Changes in glycaemic control between groups
• Variable use of other glucose-lowering agents in placebo group
Neal et al, N Engl J Med 2017, on-line. DOI. 10.1056/NEJMoa1611925

CANVAS Program. Unanswerable questions
Even large prospective randomised double-blinded placebo-controlled studies are difficult to interpret
How much is
• a class effect ?
• specific to the agent ?
• population heterogeneity ?
• noise in the data ?

CVD-REAL. Hospitalization for heart failure or deathType 2 diabetes patients in countries using different SGLT2 inhibitors
N=154,523 starting an SGLT2 inhibitor vs 154, 523 propensity-matched starting another oral glucose-lowering agent
P-value for SGLT2i vs oGLD: <0.001
Kosiborod et al, American College of Cardiology 2017 and Circulation on-line
Hospitalization for heart failure or all-cause death
SGLT, sodium-glucose co-transporter; oGLD, oral glucose-lowering drug

Summary
CANVAS Program. Independent commentary
• FDA criteria 1o endpoint achieved• MACE Superiority• Individual CV events ?↓ risk of CV death, MI, stroke, HHF • Other benefits Renal protection• Risks Amputation, fracture?• Mechanisms Rapid, several likely contributors • Clinical practice Probably CV/renal class benefits
(1o prevention and 2o intervention benefits)
MACE, major adverse cardiac events: MI, myocardial infarction, stroke, HHF, hospitalization for heart failure.

Thank you