cantonment - ud-hp.inud-hp.in/pdf/27_12_2017_2017.pdf · cantonment national workshop boards delhi...
TRANSCRIPT
1
KPMG.com/in
…from 4th January, 2018
National WorkshopCantonment
Boards Delhi Cantt I 14th Dec 2017
2
Swachh Survekshan-2018:
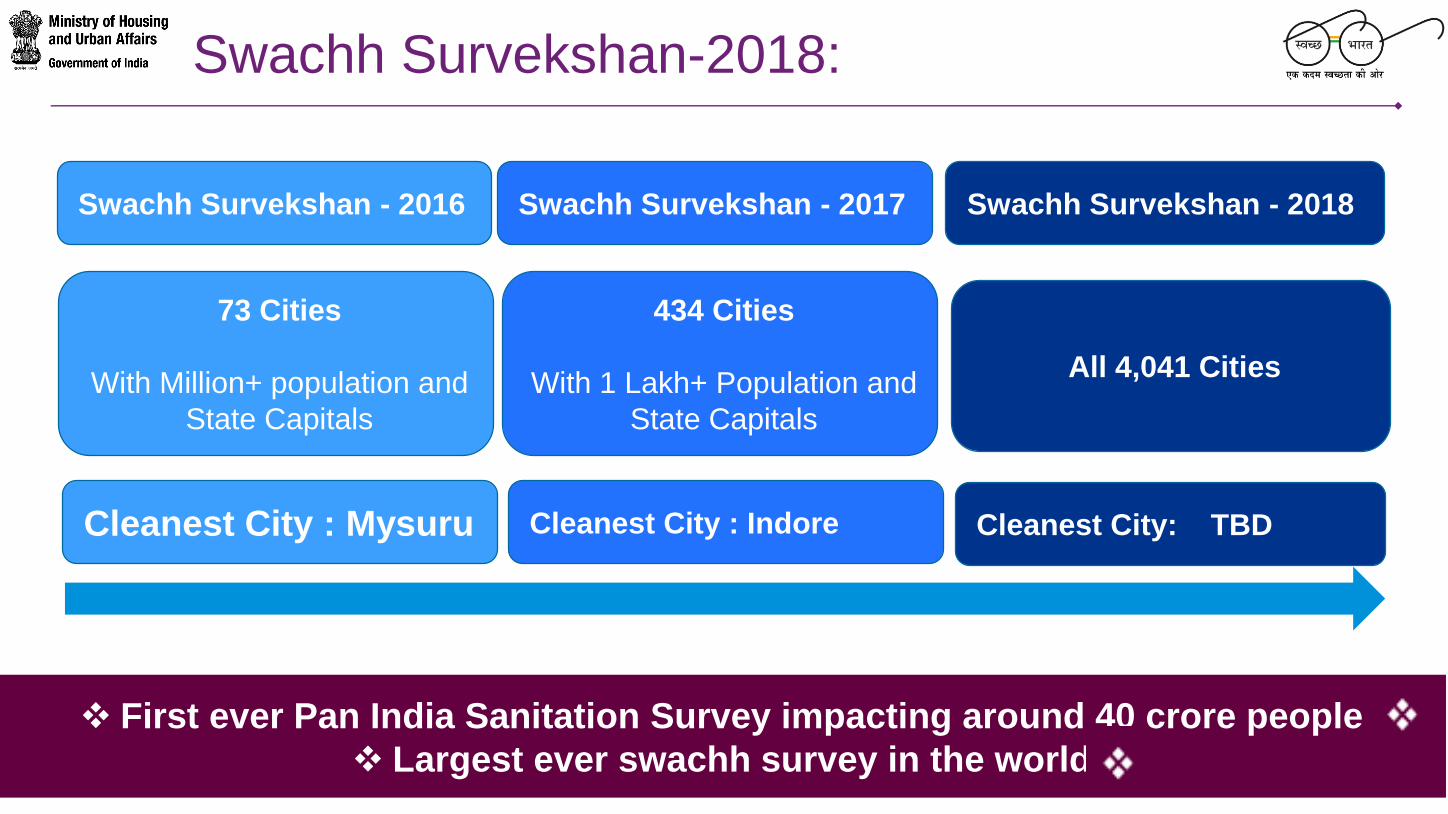
Swachh Survekshan - 2016 Swachh Survekshan - 2017 Swachh Survekshan - 2018
73 Cities
With Million+ population and
State Capitals
434 Cities
With 1 Lakh+ Population and
State Capitals
All 4,041 Cities
Cleanest City : Mysuru Cleanest City : Indore Cleanest City: TBD
First ever Pan India Sanitation Survey impacting around 40 crore people
Largest ever swachh survey in the world

3
Highlight of Swachh Survekshan-2018:
500 cities with >1 Lakh population and State/UT Capitals to
have All India Ranking
3,541 cities with <1 Lakh population to have
State and Zonal Ranking
ZonesAll India
Ranking
State/Zonal
RankingTotal
North 117 945 1,062
East 115 367 482
North East 12 164 176
South 114 1,050 1,164
West 142 1,015 1,157
Total 500 3,541 4,041
4
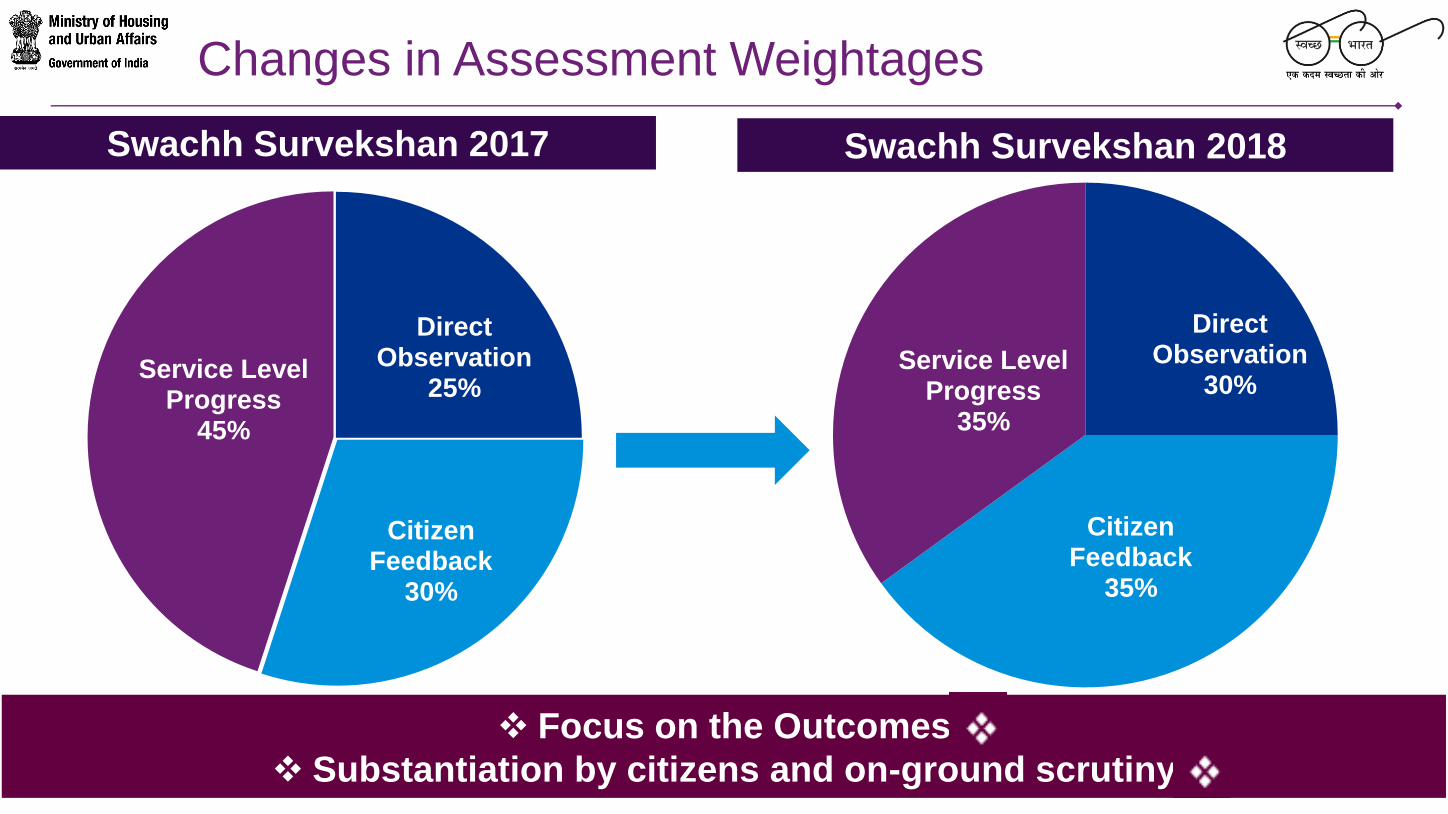
Changes in Assessment Weightages
Swachh Survekshan 2017 Swachh Survekshan 2018
Direct Observation
25%
Citizen Feedback
30%
Service Level Progress
45%
Direct Observation
30%
Citizen Feedback
35%
Service Level Progress
35%
Focus on the Outcomes
Substantiation by citizens and on-ground scrutiny

5
Changes in Component Weightages
Collection & Transportation
30%
Processing & Disposal
25%
ODF30%
IEC5%
CB5%
5%
Swachh Survekshan 2017 Swachh Survekshan 2018
Collection & Transportation
40%
Processing & Disposal
20%
ODF30%
IEC5%
CB5%
Solid Waste Management
Innovation
Solid Waste Management
Focus on Processing and Innovation
6
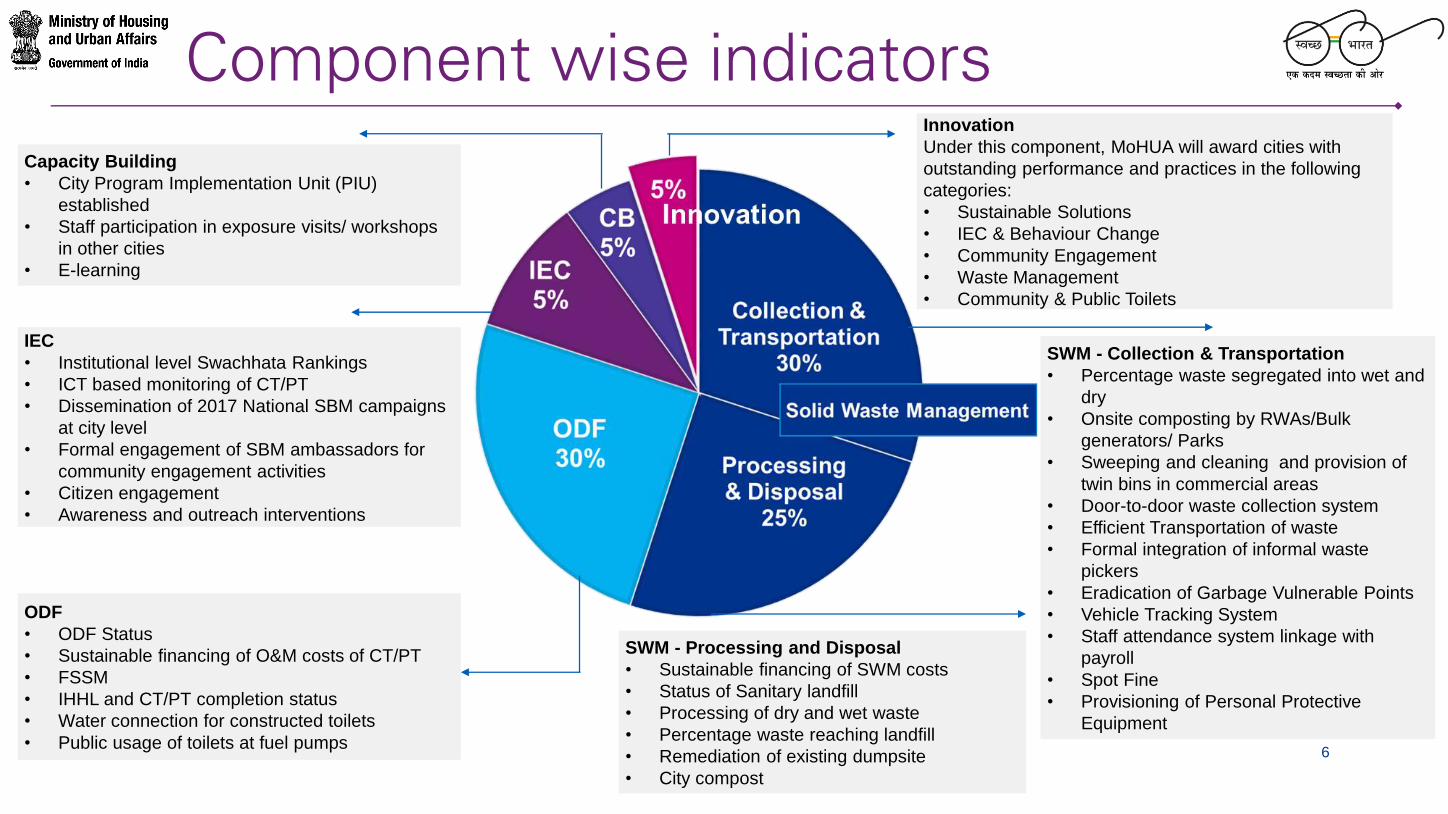
Component wise indicators
Innovation
Capacity Building
• City Program Implementation Unit (PIU)
established
• Staff participation in exposure visits/ workshops
in other cities
• E-learning
IEC
• Institutional level Swachhata Rankings
• ICT based monitoring of CT/PT
• Dissemination of 2017 National SBM campaigns
at city level
• Formal engagement of SBM ambassadors for
community engagement activities
• Citizen engagement
• Awareness and outreach interventions
ODF
• ODF Status
• Sustainable financing of O&M costs of CT/PT
• FSSM
• IHHL and CT/PT completion status
• Water connection for constructed toilets
• Public usage of toilets at fuel pumps
Innovation
Under this component, MoHUA will award cities with
outstanding performance and practices in the following
categories:
• Sustainable Solutions
• IEC & Behaviour Change
• Community Engagement
• Waste Management
• Community & Public Toilets
SWM - Collection & Transportation
• Percentage waste segregated into wet and
dry
• Onsite composting by RWAs/Bulk
generators/ Parks
• Sweeping and cleaning and provision of
twin bins in commercial areas
• Door-to-door waste collection system
• Efficient Transportation of waste
• Formal integration of informal waste
pickers
• Eradication of Garbage Vulnerable Points
• Vehicle Tracking System
• Staff attendance system linkage with
payroll
• Spot Fine
• Provisioning of Personal Protective
Equipment
SWM - Processing and Disposal
• Sustainable financing of SWM costs
• Status of Sanitary landfill
• Processing of dry and wet waste
• Percentage waste reaching landfill
• Remediation of existing dumpsite
• City compost

7
KPMG.com/in
Sustainability: A New Thrust
• Water Connection with all
constructed Toilets
• Liquid Waste Management
• O&M of Community/Public Toilets to
be self-sustaining through user
charges, advt. and commercial
activities
Treatment &
Septage Disposal
8
KPMG.com/in
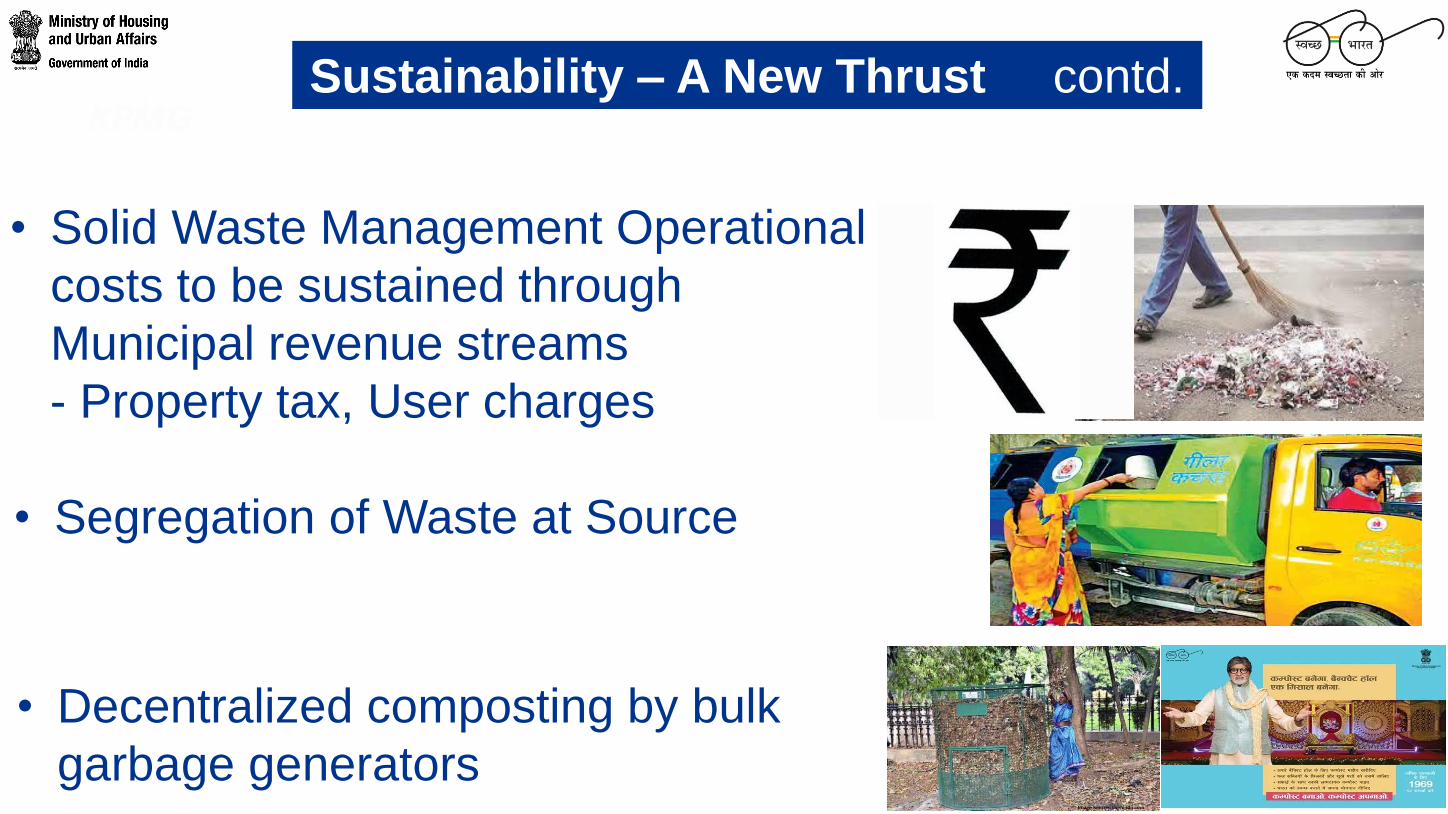
• Solid Waste Management Operational
costs to be sustained through
Municipal revenue streams
- Property tax, User charges
• Segregation of Waste at Source
• Decentralized composting by bulk
garbage generators
Sustainability – A New Thrust contd.
9
KPMG.com/in
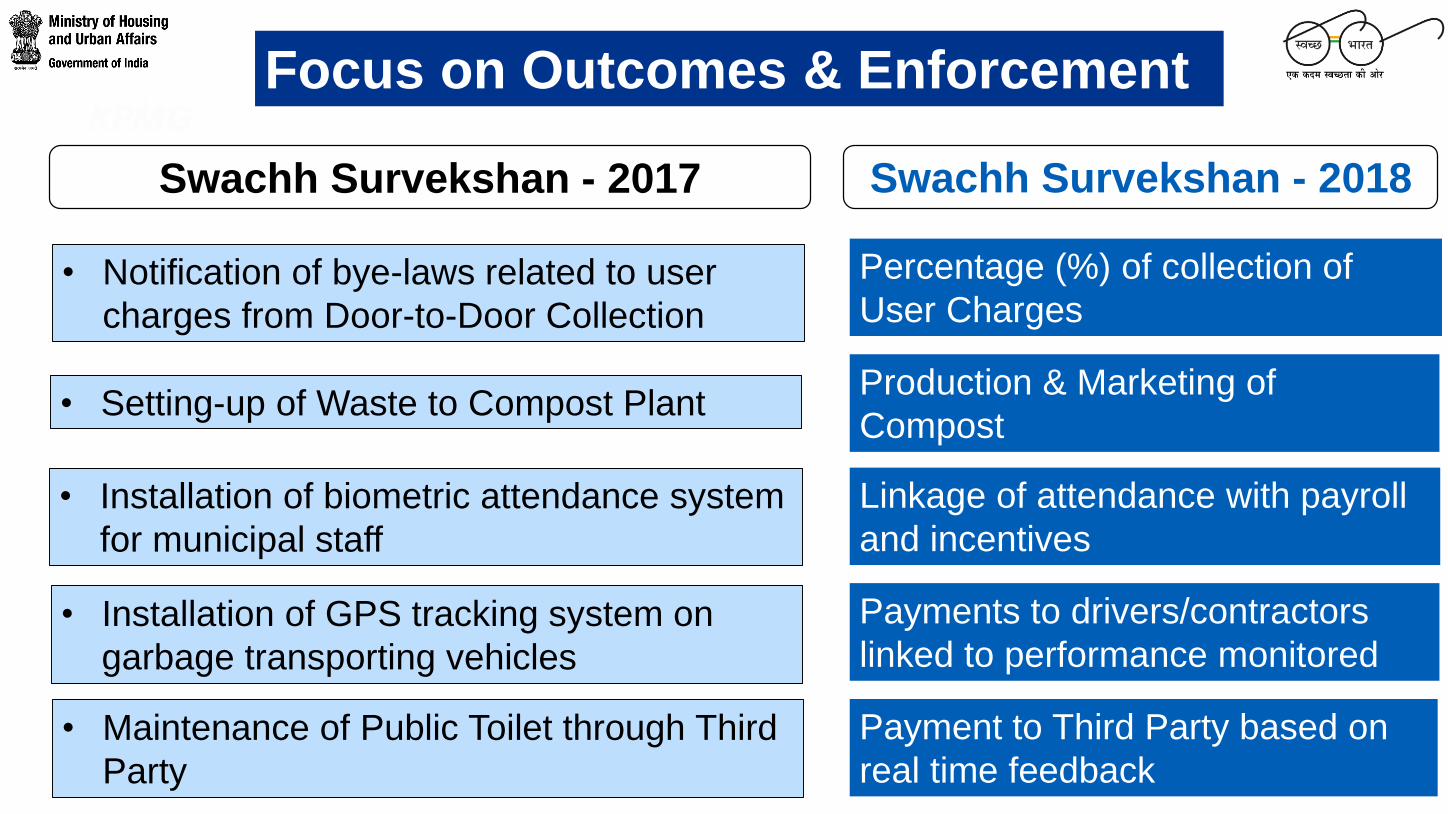
Percentage (%) of collection of
User Charges
Focus on Outcomes & Enforcement
• Setting-up of Waste to Compost Plant
• Installation of biometric attendance system
for municipal staff
• Installation of GPS tracking system on
garbage transporting vehicles
• Maintenance of Public Toilet through Third
Party
• Notification of bye-laws related to user
charges from Door-to-Door Collection
Production & Marketing of
Compost
Linkage of attendance with payroll
and incentives
Payments to drivers/contractors
linked to performance monitored
Payment to Third Party based on
real time feedback
Swachh Survekshan - 2017 Swachh Survekshan - 2018
10
KPMG.com/in
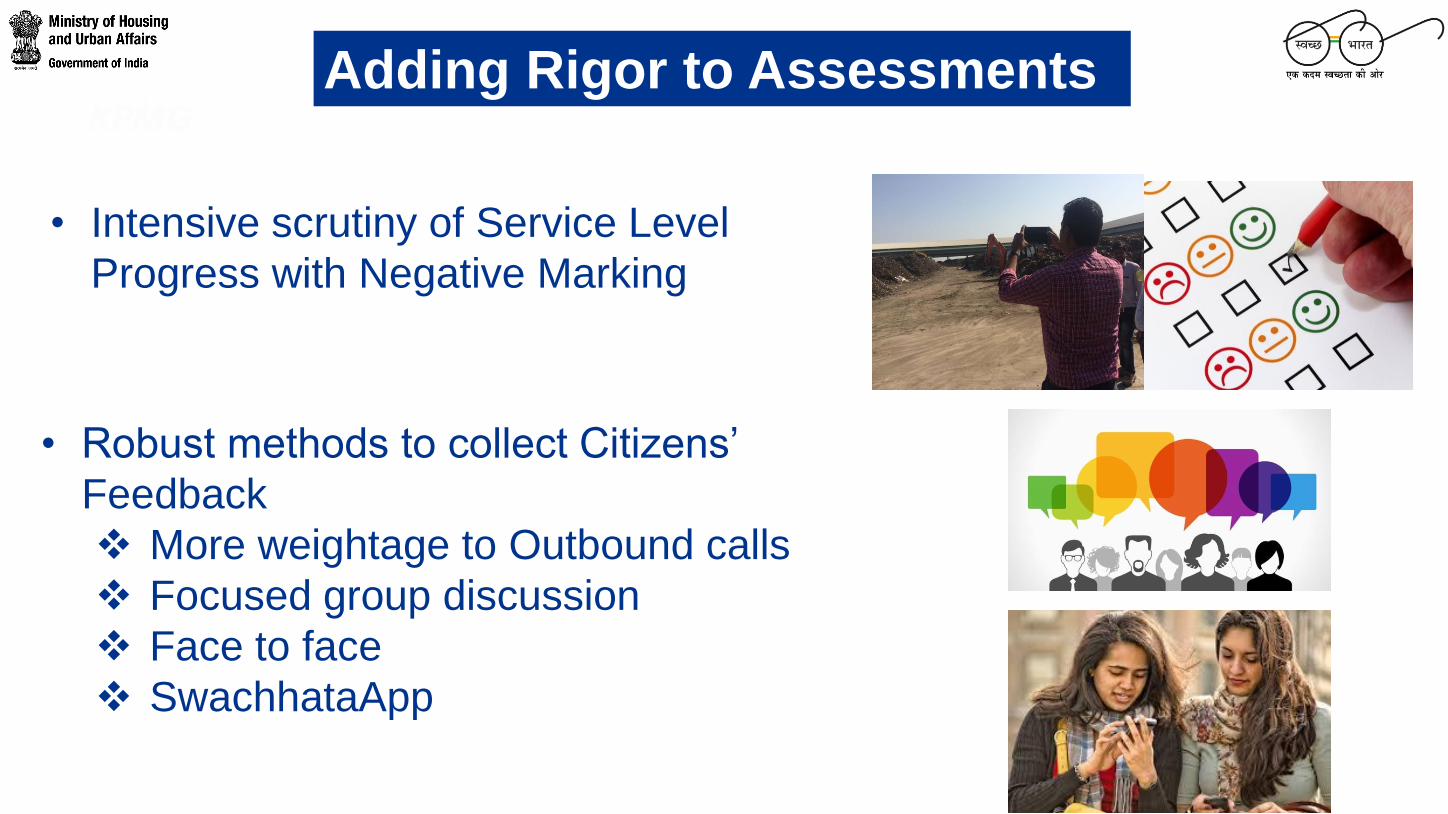
• Intensive scrutiny of Service Level
Progress with Negative Marking
• Robust methods to collect Citizens’
Feedback
More weightage to Outbound calls
Focused group discussion
Face to face
SwachhataApp
Adding Rigor to Assessments

Direct Observation
30%
Citizen Feedback
35%
Municipal Documentatio
n35%
1400 Marks / 4000
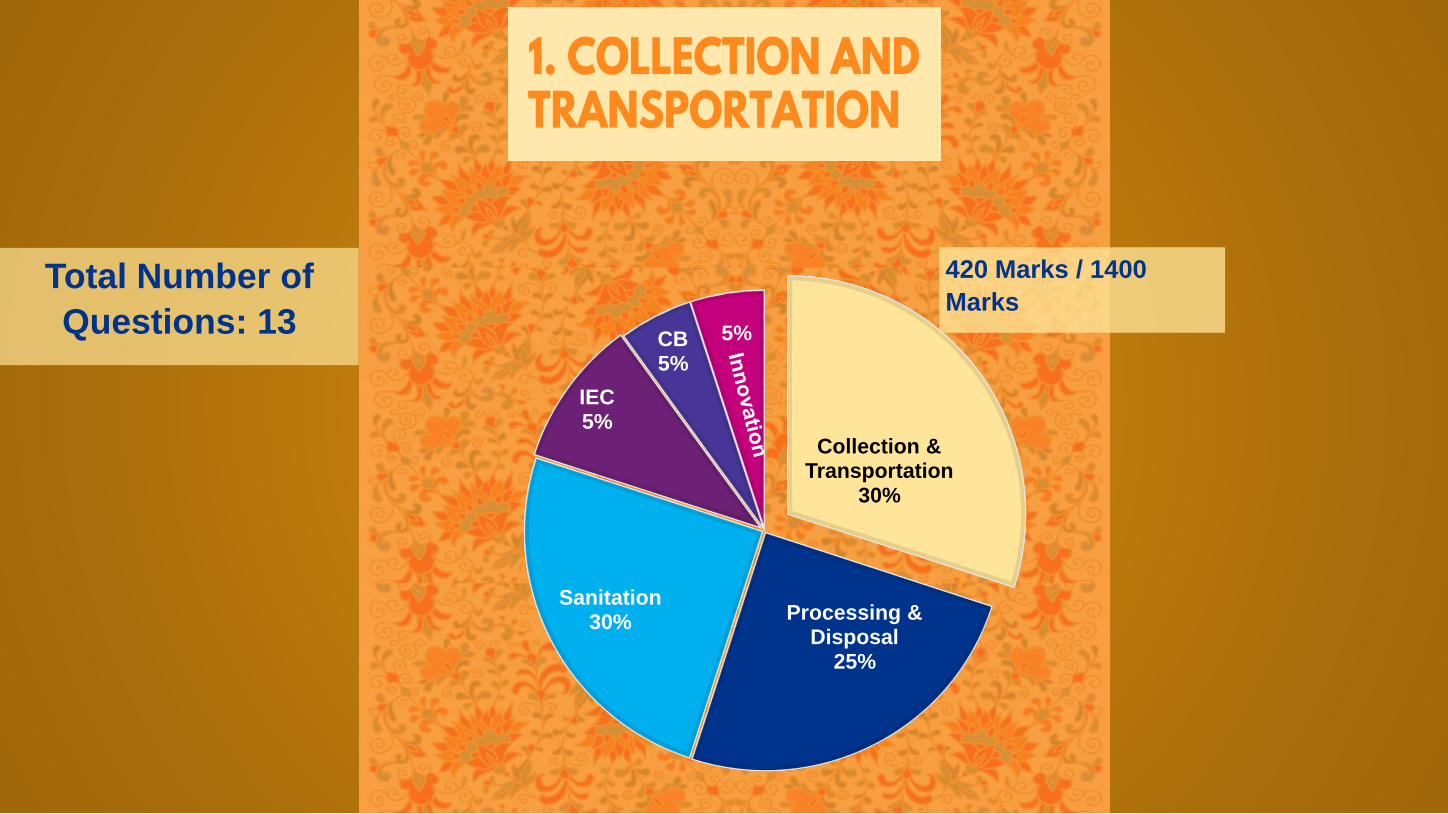
Total Number of
Questions: 13
Collection & Transportation
30%
Processing & Disposal
25%
Sanitation30%
IEC5%
CB5%
5%
420 Marks / 1400
Marks
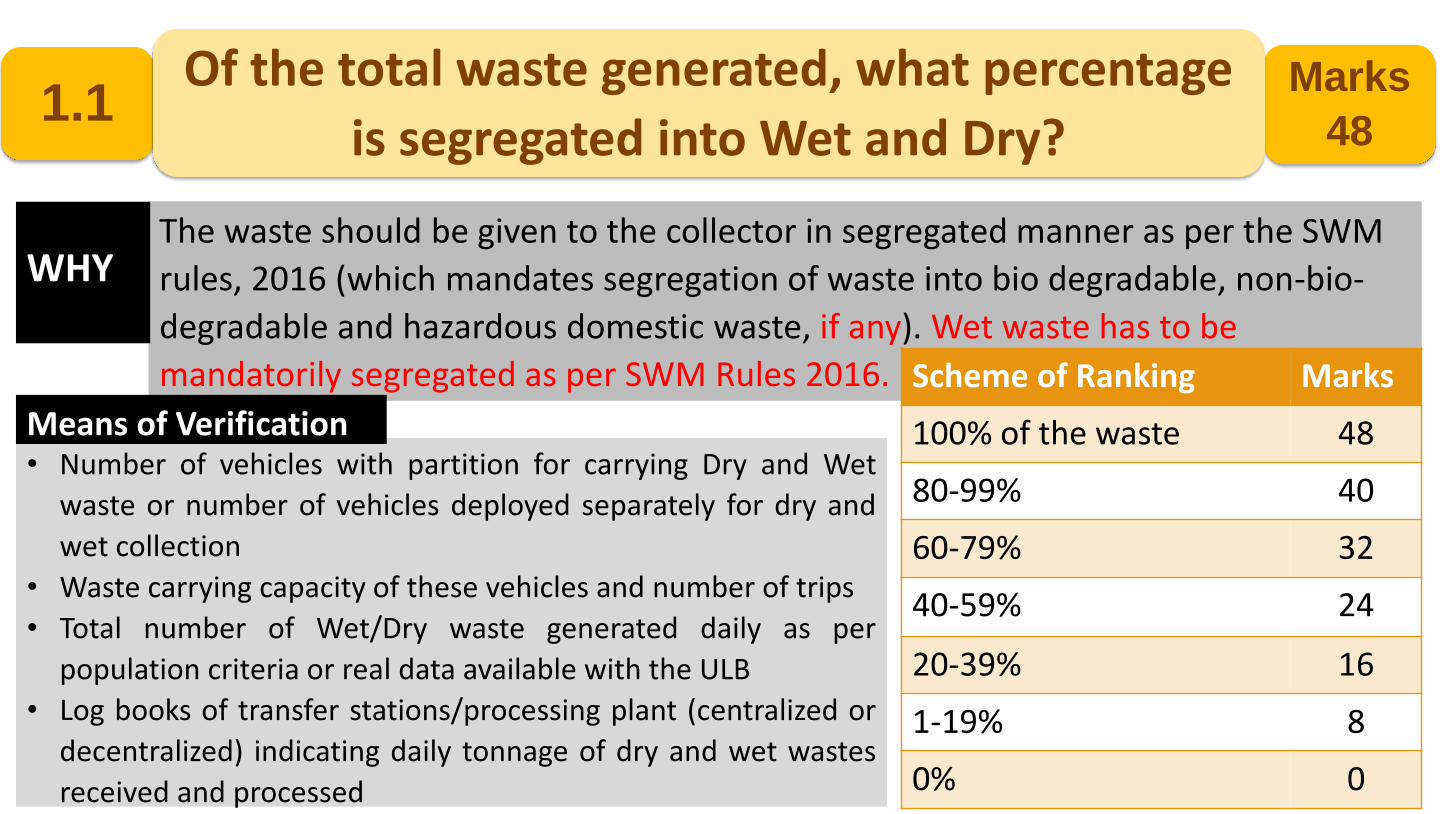
1.1Marks
48
Of the total waste generated, what percentage
is segregated into Wet and Dry?
The waste should be given to the collector in segregated manner as per the SWM
rules, 2016 (which mandates segregation of waste into bio degradable, non-bio-
degradable and hazardous domestic waste, if any). Wet waste has to be
mandatorily segregated as per SWM Rules 2016.
• Number of vehicles with partition for carrying Dry and Wet
waste or number of vehicles deployed separately for dry and
wet collection
• Waste carrying capacity of these vehicles and number of trips
• Total number of Wet/Dry waste generated daily as per
population criteria or real data available with the ULB
• Log books of transfer stations/processing plant (centralized or
decentralized) indicating daily tonnage of dry and wet wastes
received and processed
WHY
Means of Verification
Scheme of Ranking Marks
100% of the waste 48
80-99% 40
60-79% 32
40-59% 24
20-39% 16
1-19% 8
0% 0

Action Items
• Awareness drives regarding waste segregation in residential areas, commercial areas, etc.
• All waste pickers should be trained to collect dry and wet waste separately
• All waste collection and transportation trucks/ vehicles to be compartmentalized to ensure collection and transportation of segregated waste
• Data regarding amount of segregated waste collected and transported to be recorded daily
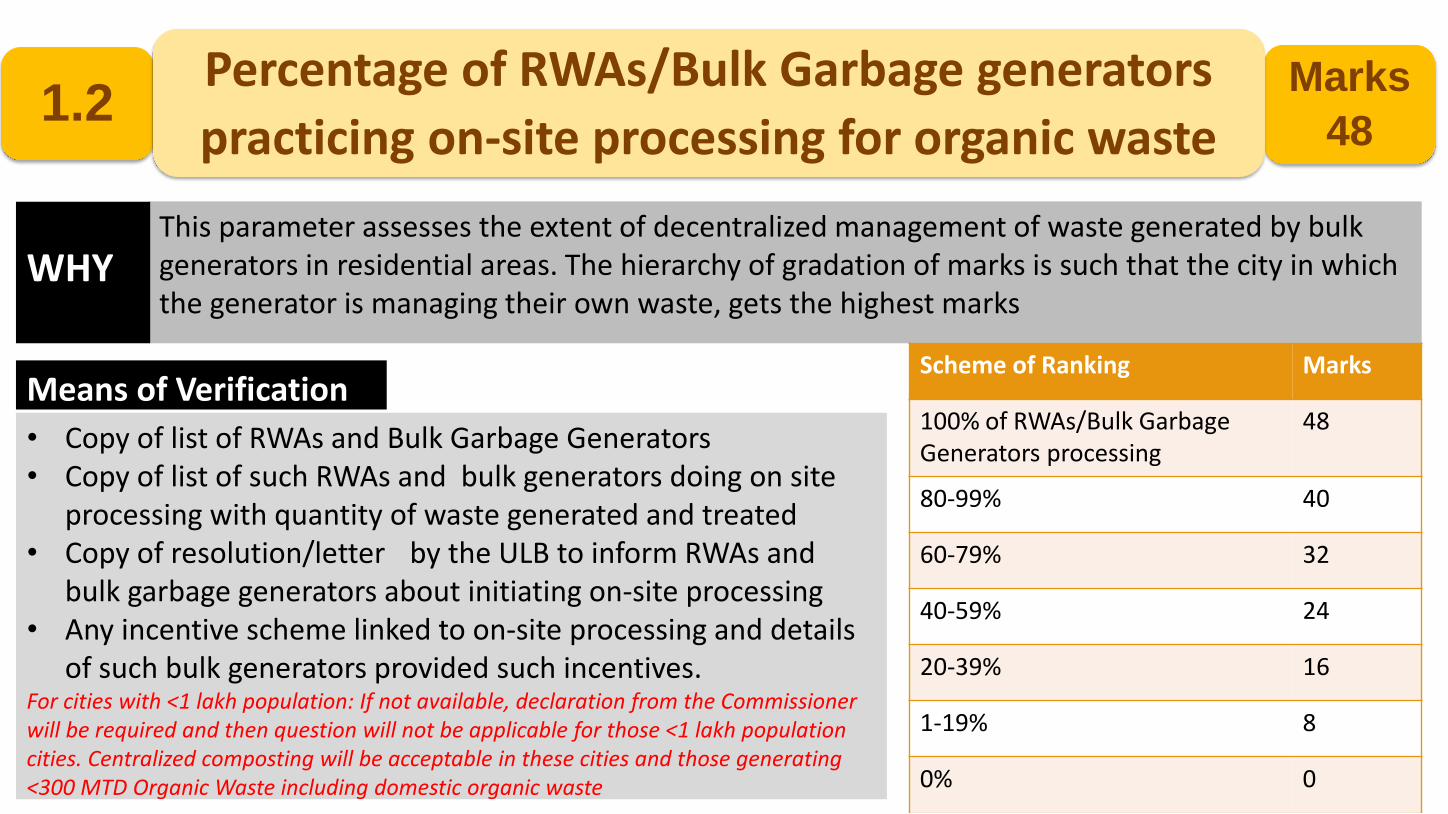
1.2Marks
48
Percentage of RWAs/Bulk Garbage generators
practicing on-site processing for organic waste
This parameter assesses the extent of decentralized management of waste generated by bulk generators in residential areas. The hierarchy of gradation of marks is such that the city in which the generator is managing their own waste, gets the highest marks
• Copy of list of RWAs and Bulk Garbage Generators• Copy of list of such RWAs and bulk generators doing on site
processing with quantity of waste generated and treated• Copy of resolution/letter by the ULB to inform RWAs and
bulk garbage generators about initiating on-site processing• Any incentive scheme linked to on-site processing and details
of such bulk generators provided such incentives.For cities with <1 lakh population: If not available, declaration from the Commissioner will be required and then question will not be applicable for those <1 lakh population cities. Centralized composting will be acceptable in these cities and those generating <300 MTD Organic Waste including domestic organic waste
WHY
Means of VerificationScheme of Ranking Marks
100% of RWAs/Bulk Garbage Generators processing
48
80-99% 40
60-79% 32
40-59% 24
20-39% 16
1-19% 8
0% 0
Action Items
• Stakeholder consultation with RWAs/ Bulk Generators to create awareness regarding waste segregation
• Launch incentive scheme/ competition to encourage RWAs/Bulk Generators to implement waste segregation
• Felicitate efforts of RWAs/Bulk Generators who have adopted the practice
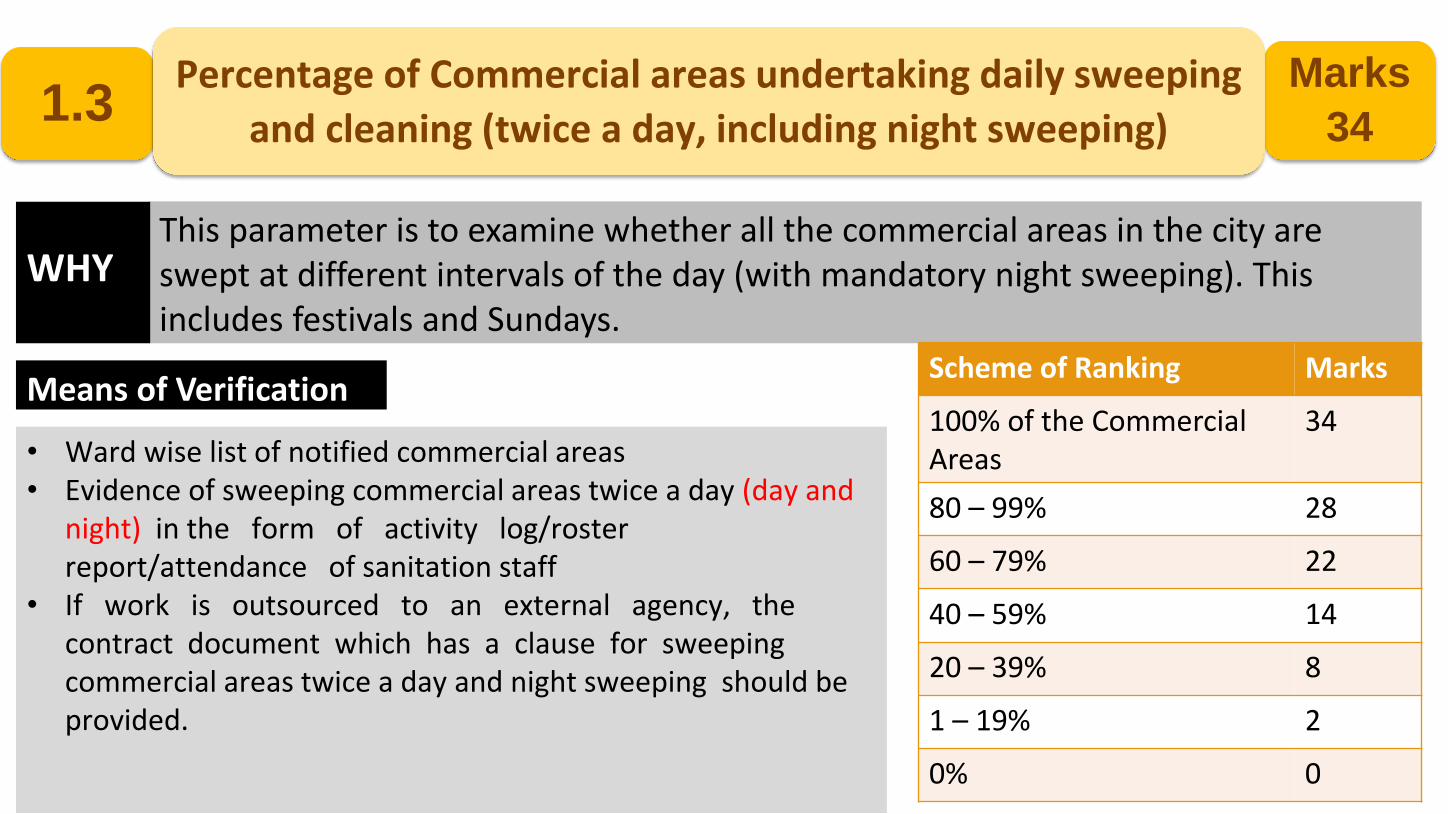
1.3Marks
34
Percentage of Commercial areas undertaking daily sweeping
and cleaning (twice a day, including night sweeping)
This parameter is to examine whether all the commercial areas in the city are swept at different intervals of the day (with mandatory night sweeping). This includes festivals and Sundays.
• Ward wise list of notified commercial areas• Evidence of sweeping commercial areas twice a day (day and
night) in the form of activity log/roster report/attendance of sanitation staff
• If work is outsourced to an external agency, the contract document which has a clause for sweeping commercial areas twice a day and night sweeping should be provided.
WHY
Means of VerificationScheme of Ranking Marks
100% of the Commercial Areas
34
80 – 99% 28
60 – 79% 22
40 – 59% 14
20 – 39% 8
1 – 19% 2
0% 0
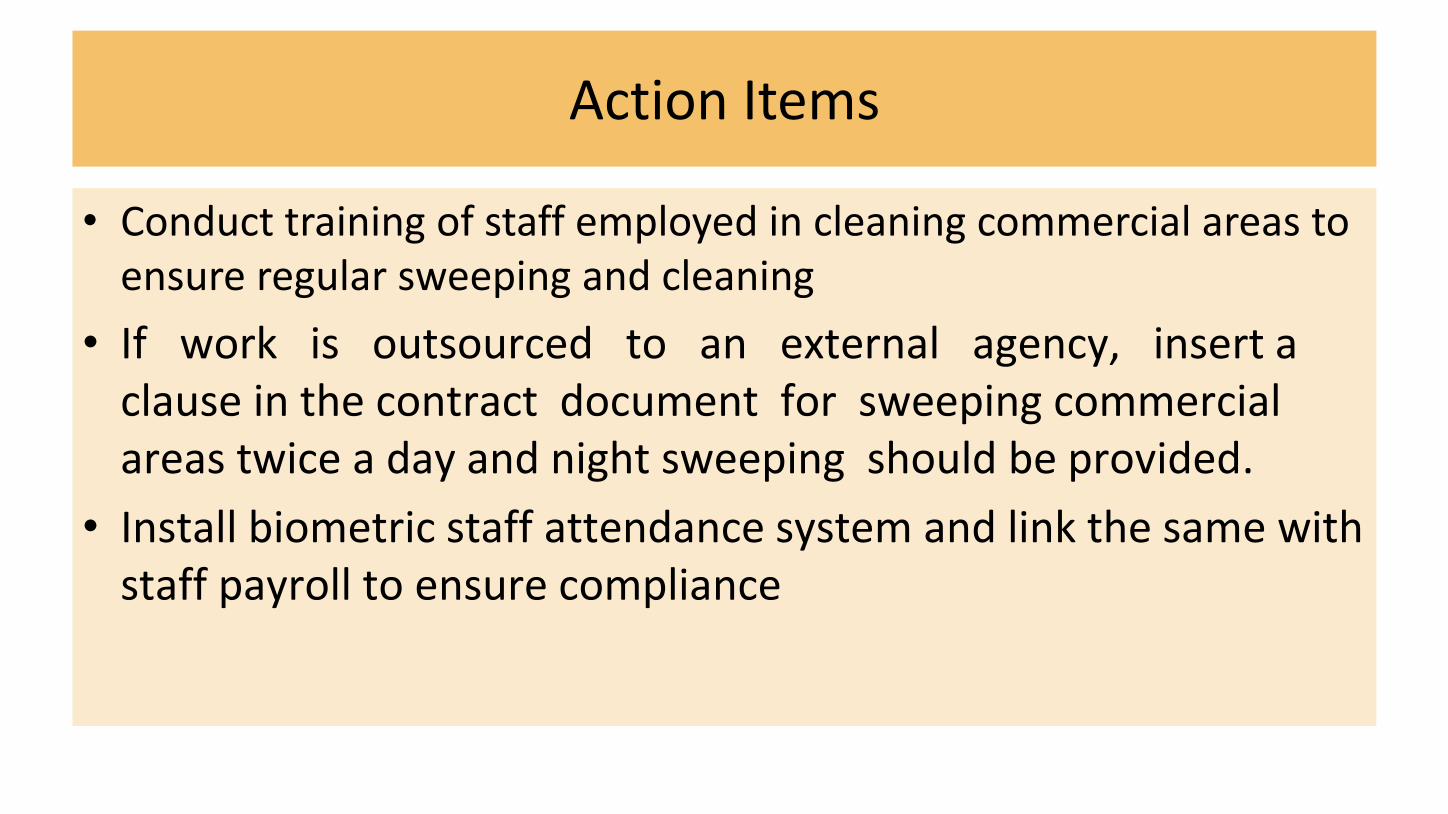
Action Items
• Conduct training of staff employed in cleaning commercial areas to ensure regular sweeping and cleaning
• If work is outsourced to an external agency, insert a clause in the contract document for sweeping commercial areas twice a day and night sweeping should be provided.
• Install biometric staff attendance system and link the same with staff payroll to ensure compliance
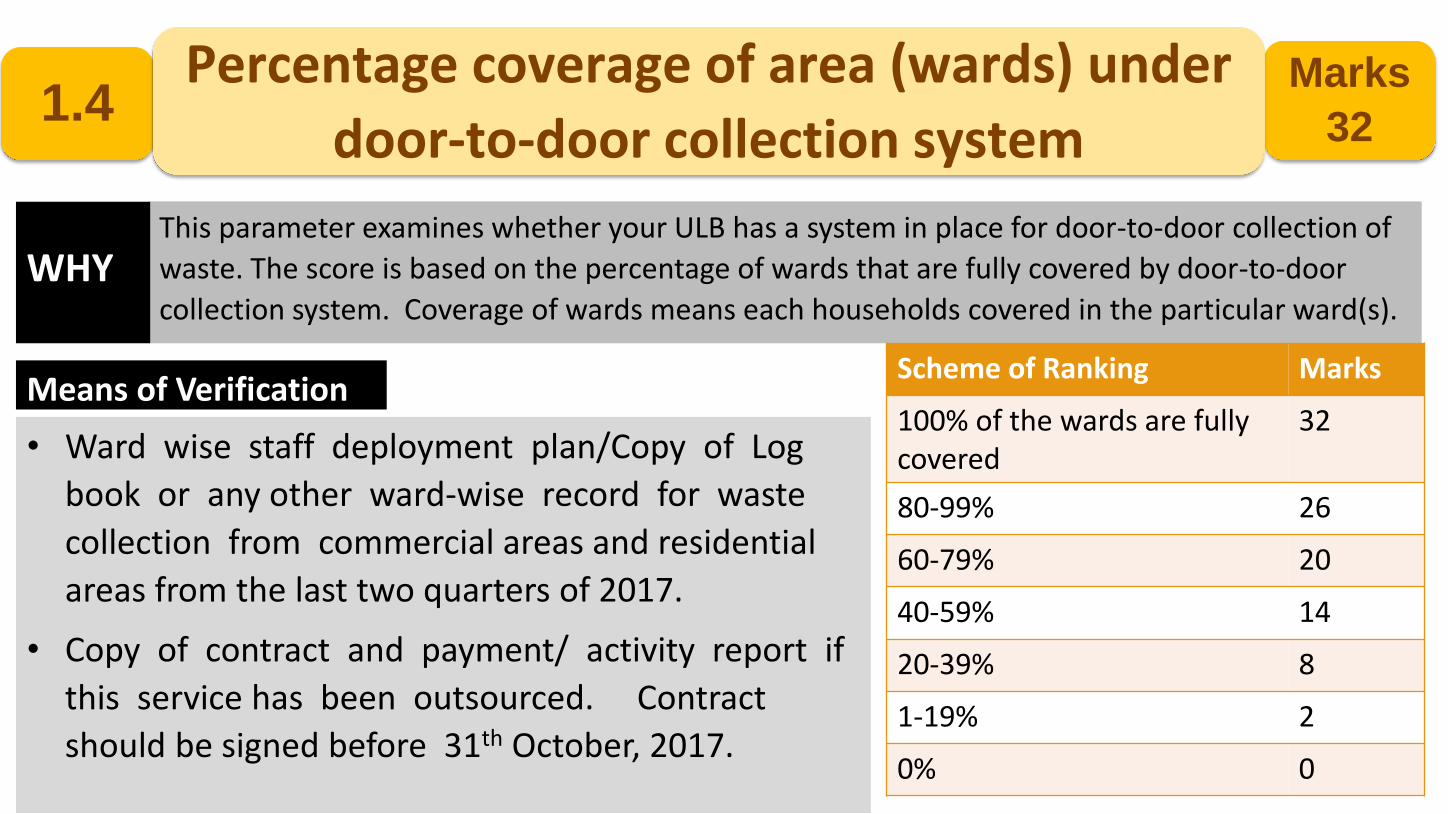
1.4Marks
32
Percentage coverage of area (wards) under
door-to-door collection system
This parameter examines whether your ULB has a system in place for door-to-door collection of
waste. The score is based on the percentage of wards that are fully covered by door-to-door
collection system. Coverage of wards means each households covered in the particular ward(s).
• Ward wise staff deployment plan/Copy of Log
book or any other ward-wise record for waste
collection from commercial areas and residential
areas from the last two quarters of 2017.
• Copy of contract and payment/ activity report if
this service has been outsourced. Contract
should be signed before 31th October, 2017.
WHY
Means of VerificationScheme of Ranking Marks
100% of the wards are fully covered
32
80-99% 26
60-79% 20
40-59% 14
20-39% 8
1-19% 2
0% 0

Action Items
• Ensure adequate manpower (integrating informal waste pickers, outsourcing, etc.) and equipment provisions
• Installation of GPS/RFID system on waste collection trucks/vehicles to ensure proper route is being followed and all households are being covered under the door-to-door system
• Felicitation of best performing waste collection trucks/vehicle drivers
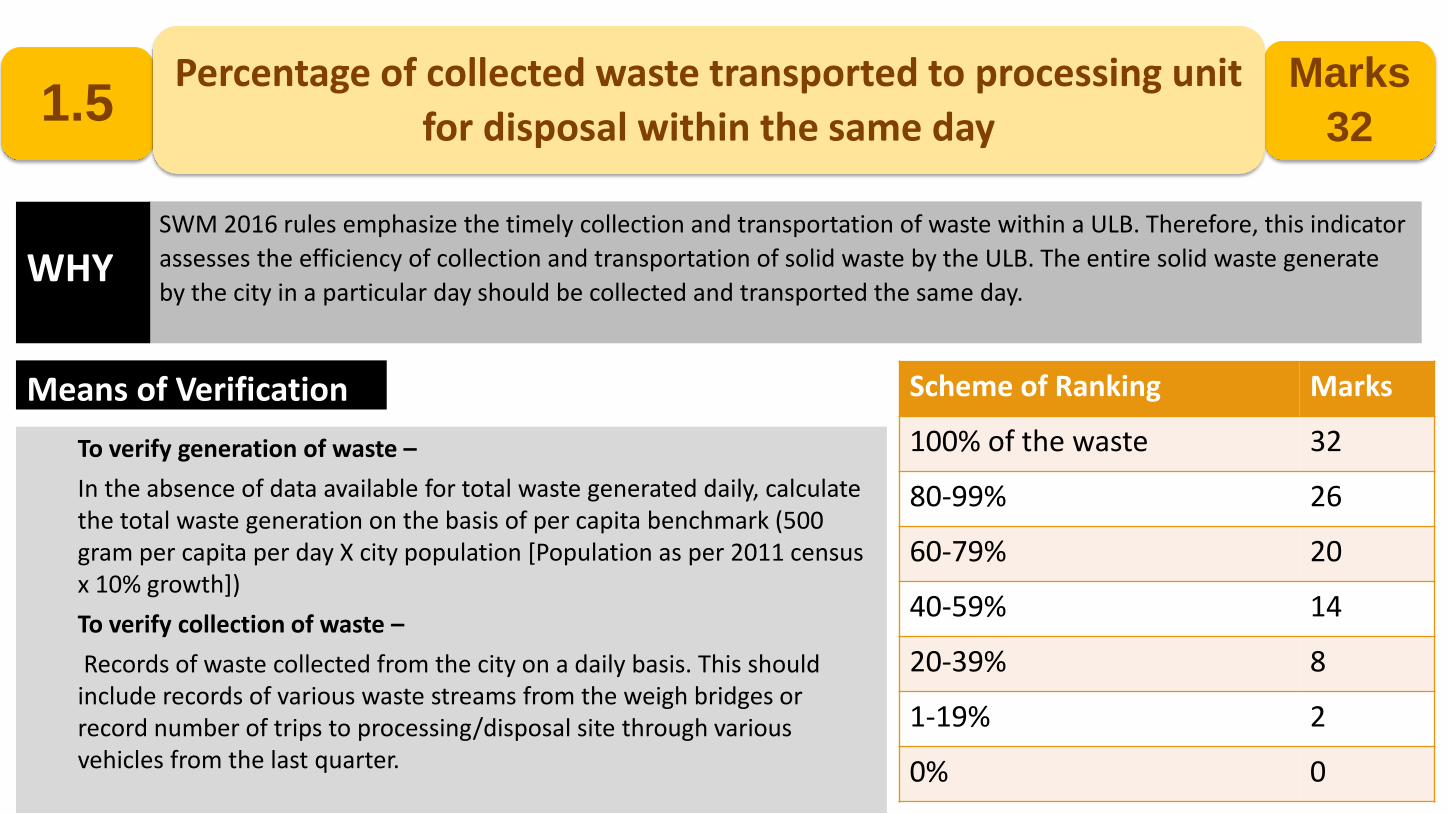
1.5Marks
32
Percentage of collected waste transported to processing unit
for disposal within the same day
SWM 2016 rules emphasize the timely collection and transportation of waste within a ULB. Therefore, this indicator
assesses the efficiency of collection and transportation of solid waste by the ULB. The entire solid waste generate
by the city in a particular day should be collected and transported the same day.
To verify generation of waste –
In the absence of data available for total waste generated daily, calculate the total waste generation on the basis of per capita benchmark (500 gram per capita per day X city population [Population as per 2011 census x 10% growth])
To verify collection of waste –
Records of waste collected from the city on a daily basis. This should include records of various waste streams from the weigh bridges or record number of trips to processing/disposal site through various vehicles from the last quarter.
WHY
Means of Verification Scheme of Ranking Marks
100% of the waste 32
80-99% 26
60-79% 20
40-59% 14
20-39% 8
1-19% 2
0% 0
Action Items
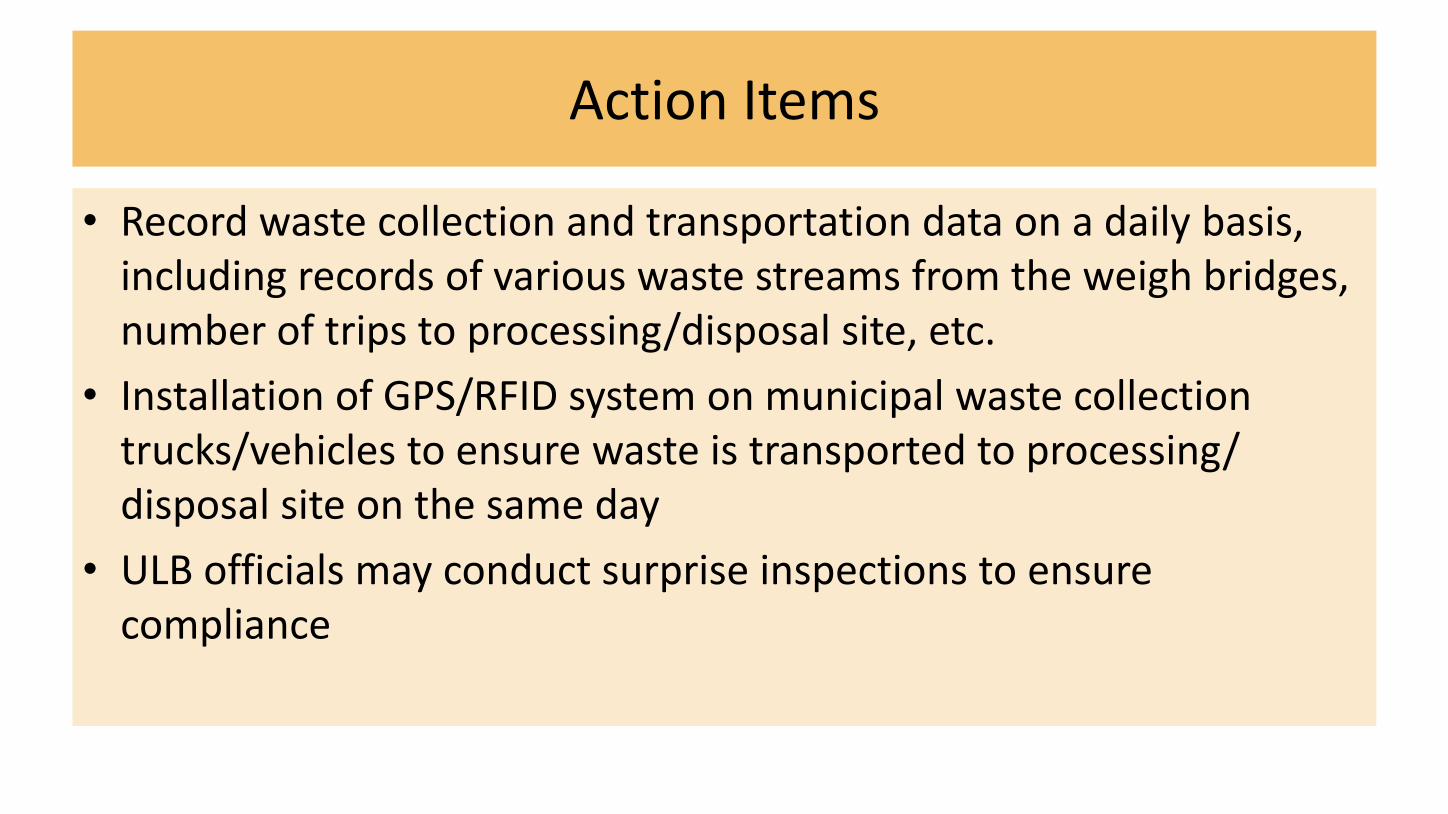
• Record waste collection and transportation data on a daily basis, including records of various waste streams from the weigh bridges, number of trips to processing/disposal site, etc.
• Installation of GPS/RFID system on municipal waste collection trucks/vehicles to ensure waste is transported to processing/ disposal site on the same day
• ULB officials may conduct surprise inspections to ensure compliance

1.6Marks
32
Percentage of Informal Waste Pickers formally integrated into Solid
Waste Management (SWM) in the city (as per SWM 2016 rules)
Formally engaging the self-employed waste pickers / waste collectors and other urban poor (informal economy) plays a key role in strengthening door-to-door-collection (DTDC) of waste. This indicator would assess to what extent ULB has engaged Informal Waste Pickers to manage SWM. Informal waste pickers not only include rag pickers but also NGOs, SHGs, volunteering agencies and other individuals, etc.
• Copy of survey report of on-field assessment or any study for identification of waste pickers in the city
• Ward-wise List of waste pickers with the ID numbers issued to them
• Copy of contract, if waste pickers have been integrated with an outsourced form OR Copy of contract with SHGs (Self Help Groups) that have enrolled informal waste pickers in their groups
• List of ward allocations by waste pickers
WHY
Means of VerificationScheme of Ranking Marks
100% Informal Waste Pickers
32
80-99% 26
60-79% 20
40-59% 14
20-39% 8
1-19% 2
0% 0
Action Items
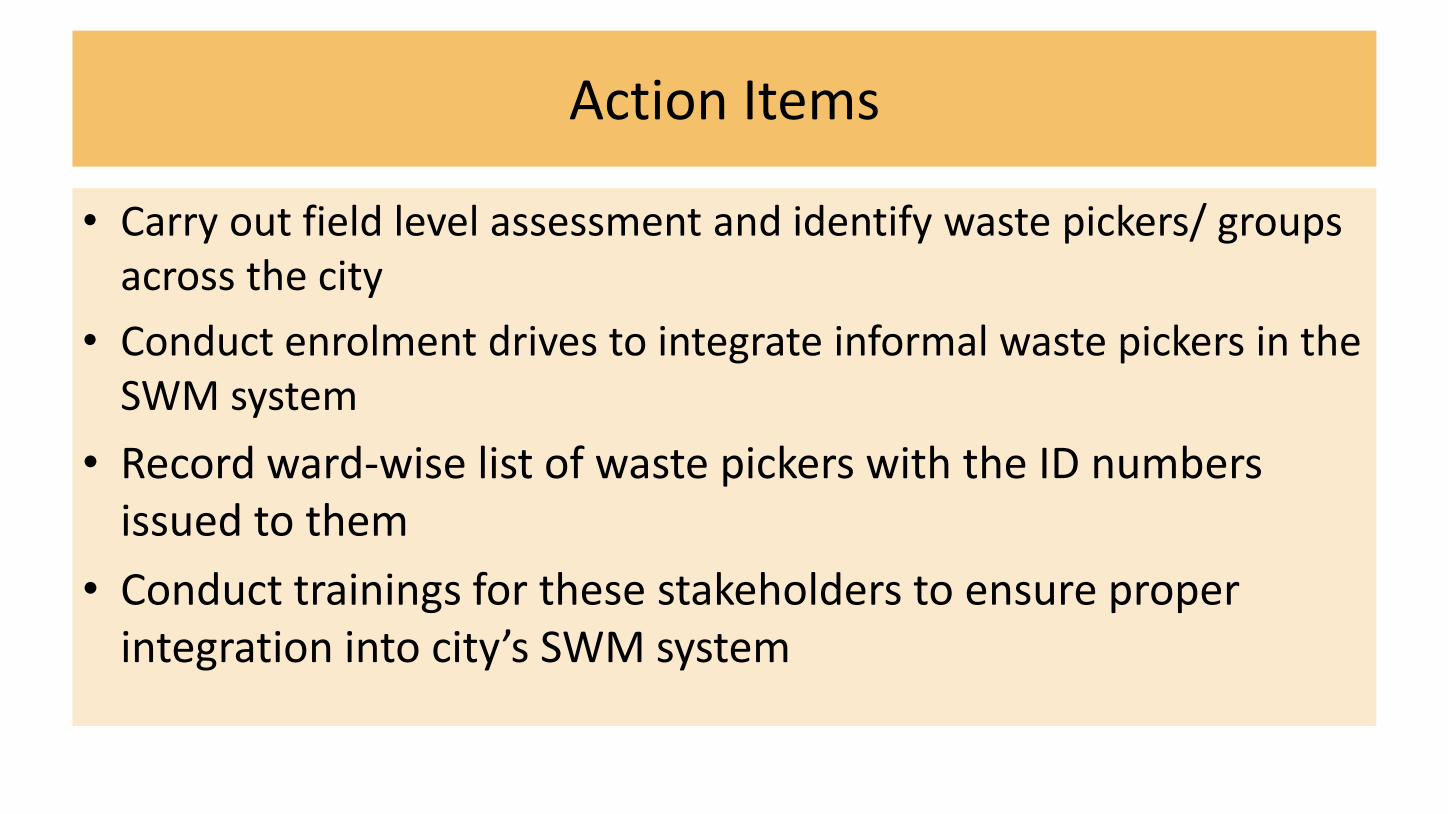
• Carry out field level assessment and identify waste pickers/ groups across the city
• Conduct enrolment drives to integrate informal waste pickers in the SWM system
• Record ward-wise list of waste pickers with the ID numbers issued to them
• Conduct trainings for these stakeholders to ensure proper integration into city’s SWM system
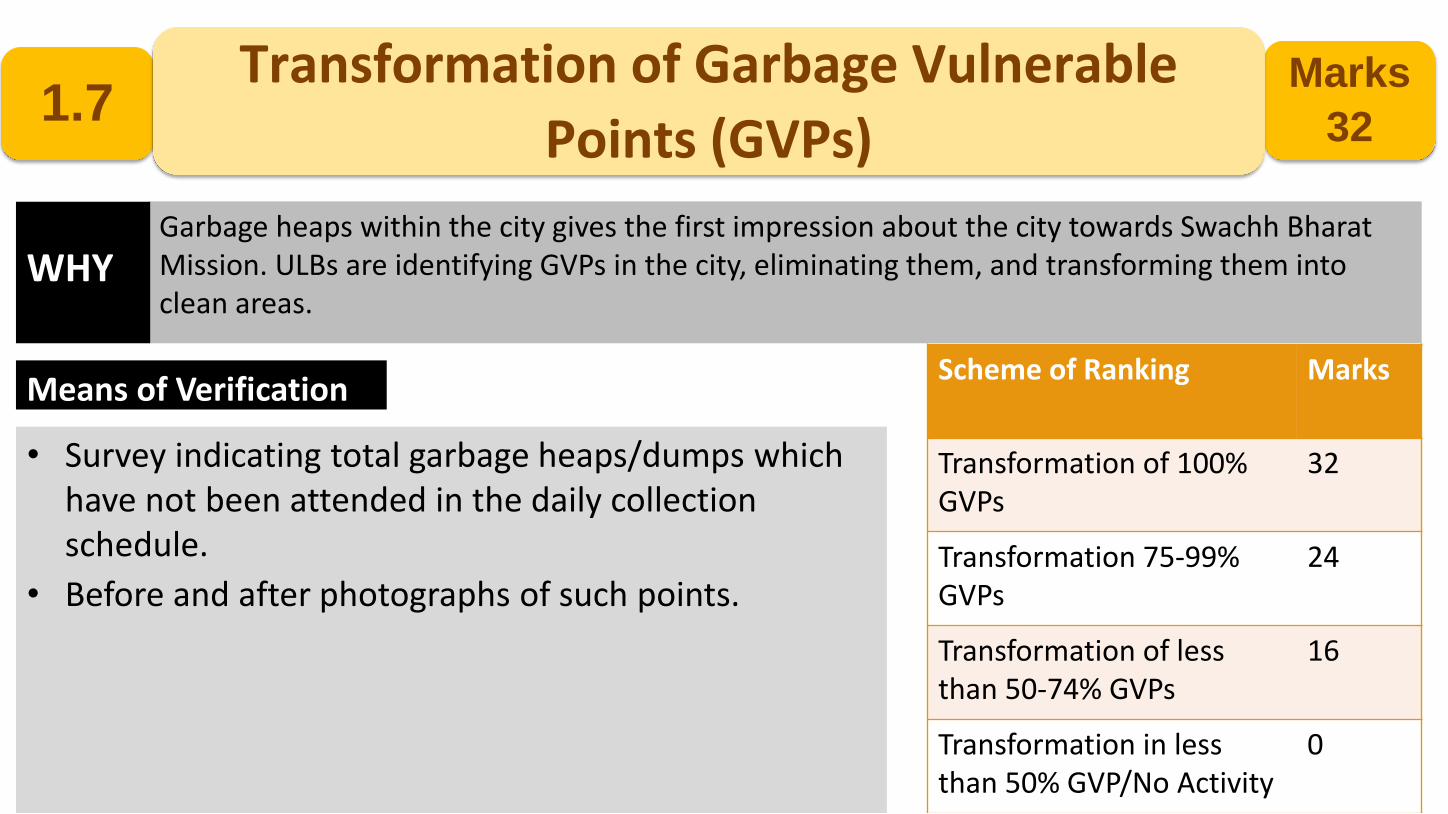
1.7Marks
32
Transformation of Garbage Vulnerable
Points (GVPs)
Garbage heaps within the city gives the first impression about the city towards Swachh Bharat Mission. ULBs are identifying GVPs in the city, eliminating them, and transforming them into clean areas.
• Survey indicating total garbage heaps/dumps which have not been attended in the daily collection schedule.
• Before and after photographs of such points.
WHY
Means of VerificationScheme of Ranking Marks
Transformation of 100% GVPs
32
Transformation 75-99% GVPs
24
Transformation of less than 50-74% GVPs
16
Transformation in less than 50% GVP/No Activity
0

Action Items
• Carry out field level assessment to identify Garbage Vulnerable Points (GVPs) across the city (utilize Swachhata App and other city level grievance redressal systems)
• Involve citizens to conduct cleanliness and beautification drives at these points
• Conduct regular monitoring of these areas to ensure sustained results
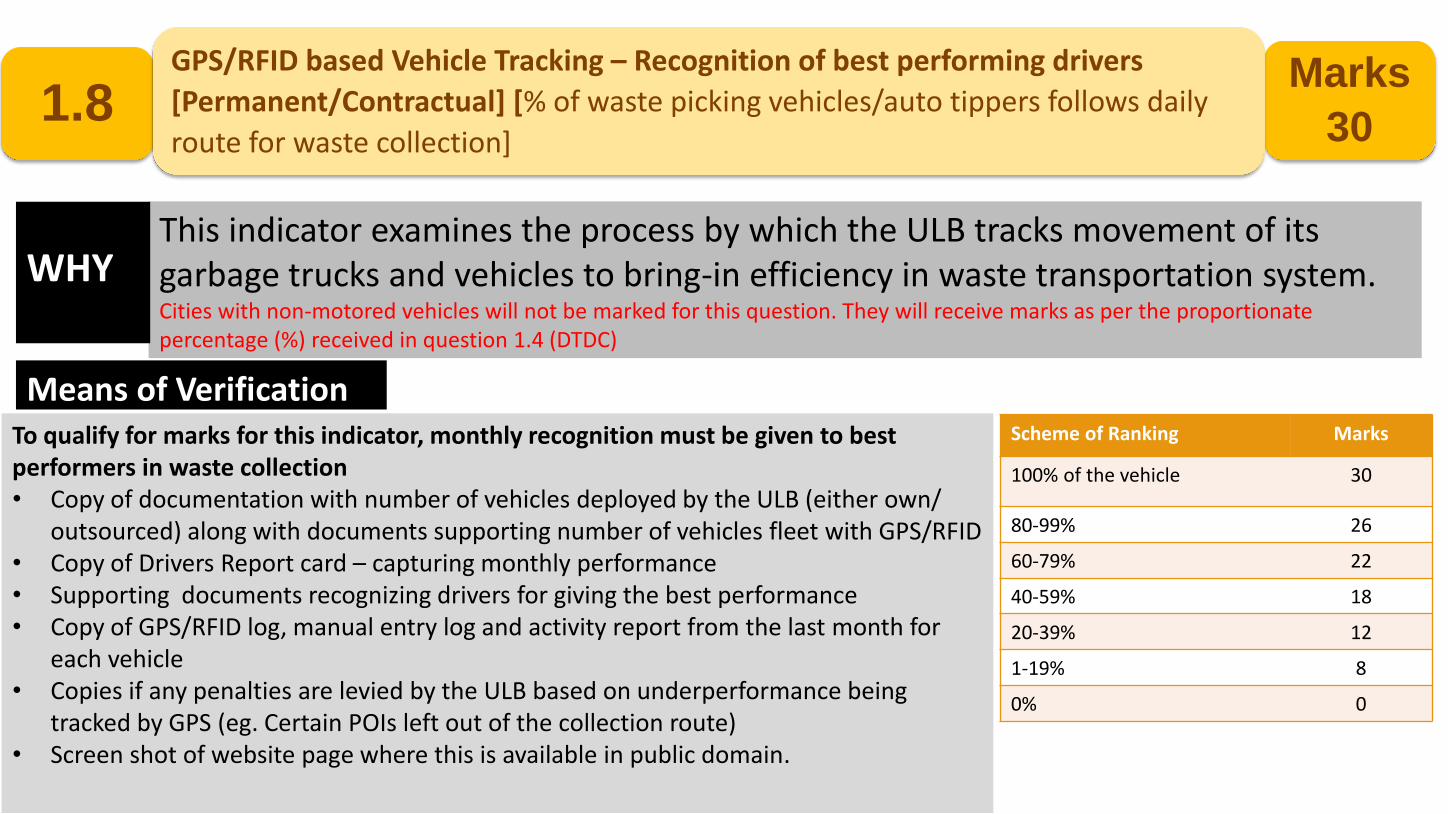
1.8Marks
30
GPS/RFID based Vehicle Tracking – Recognition of best performing drivers
[Permanent/Contractual] [% of waste picking vehicles/auto tippers follows daily
route for waste collection]
This indicator examines the process by which the ULB tracks movement of its garbage trucks and vehicles to bring-in efficiency in waste transportation system. Cities with non-motored vehicles will not be marked for this question. They will receive marks as per the proportionate percentage (%) received in question 1.4 (DTDC)
To qualify for marks for this indicator, monthly recognition must be given to best performers in waste collection• Copy of documentation with number of vehicles deployed by the ULB (either own/
outsourced) along with documents supporting number of vehicles fleet with GPS/RFID• Copy of Drivers Report card – capturing monthly performance• Supporting documents recognizing drivers for giving the best performance • Copy of GPS/RFID log, manual entry log and activity report from the last month for
each vehicle• Copies if any penalties are levied by the ULB based on underperformance being
tracked by GPS (eg. Certain POIs left out of the collection route)• Screen shot of website page where this is available in public domain.
WHY
Means of VerificationScheme of Ranking Marks
100% of the vehicle 30
80-99% 26
60-79% 22
40-59% 18
20-39% 12
1-19% 8
0% 0

Action Items
• Carry out an assessment of total municipal waste collection/ transportation vehicles
• Procurement of GPS/RFID systems as per requirement• ULB should record
– monthly performance of each vehicle in the form of a Drivers Report card– GPS/RFID log, manual entry log and activity report from the last month for
each vehicle– any penalties are levied by the ULB based on underperformance being
tracked by GPS (eg. Certain POIs left out of the collection route)• Route map and driver details should be provided to the households and also
available in public domain
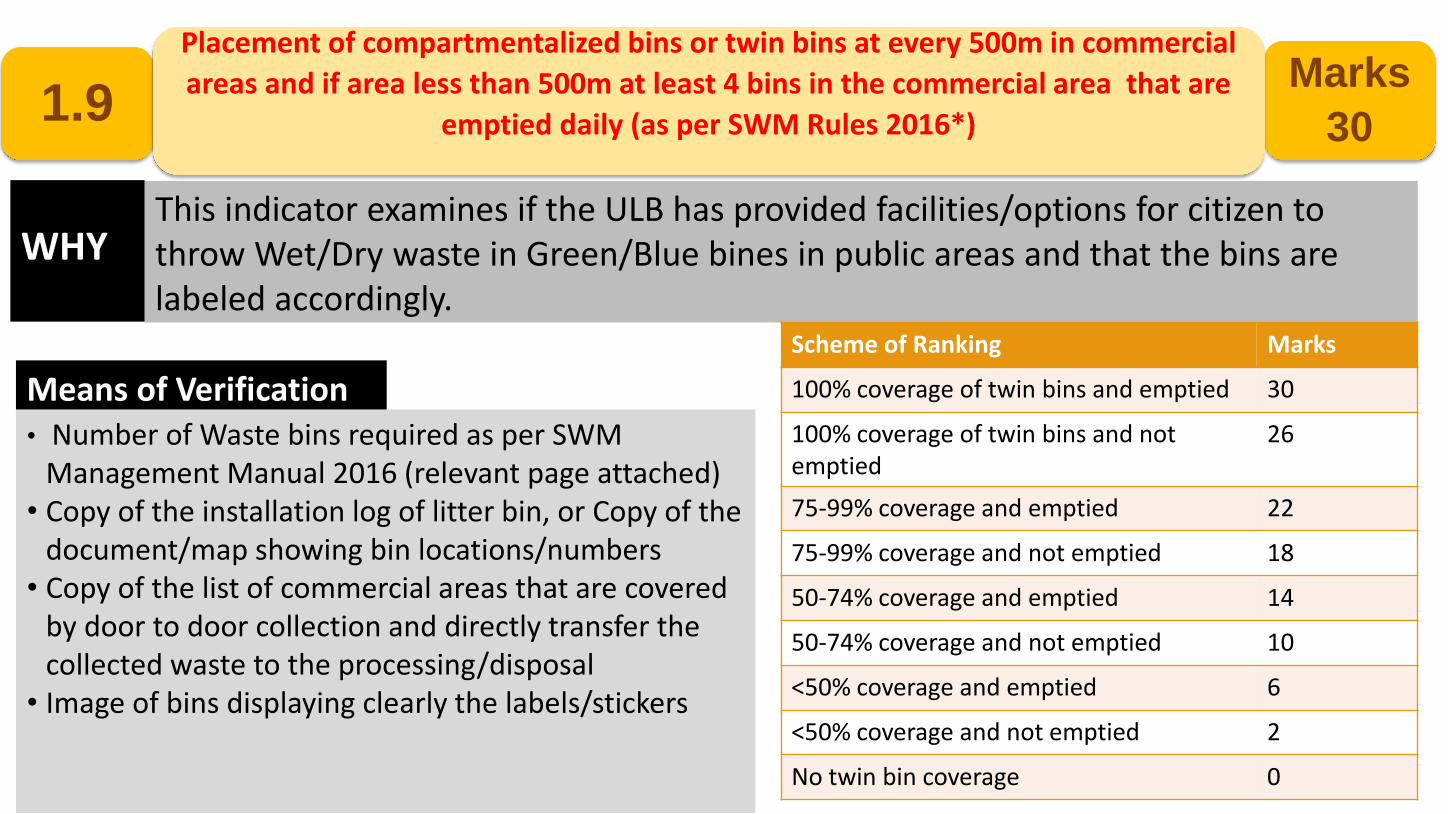
1.9Marks
30
Placement of compartmentalized bins or twin bins at every 500m in commercial
areas and if area less than 500m at least 4 bins in the commercial area that are
emptied daily (as per SWM Rules 2016*)
This indicator examines if the ULB has provided facilities/options for citizen to throw Wet/Dry waste in Green/Blue bines in public areas and that the bins are labeled accordingly.
• Number of Waste bins required as per SWM Management Manual 2016 (relevant page attached)
• Copy of the installation log of litter bin, or Copy of the document/map showing bin locations/numbers
• Copy of the list of commercial areas that are covered by door to door collection and directly transfer the collected waste to the processing/disposal
• Image of bins displaying clearly the labels/stickers
WHY
Means of Verification
Scheme of Ranking Marks
100% coverage of twin bins and emptied 30
100% coverage of twin bins and not emptied
26
75-99% coverage and emptied 22
75-99% coverage and not emptied 18
50-74% coverage and emptied 14
50-74% coverage and not emptied 10
<50% coverage and emptied 6
<50% coverage and not emptied 2
No twin bin coverage 0
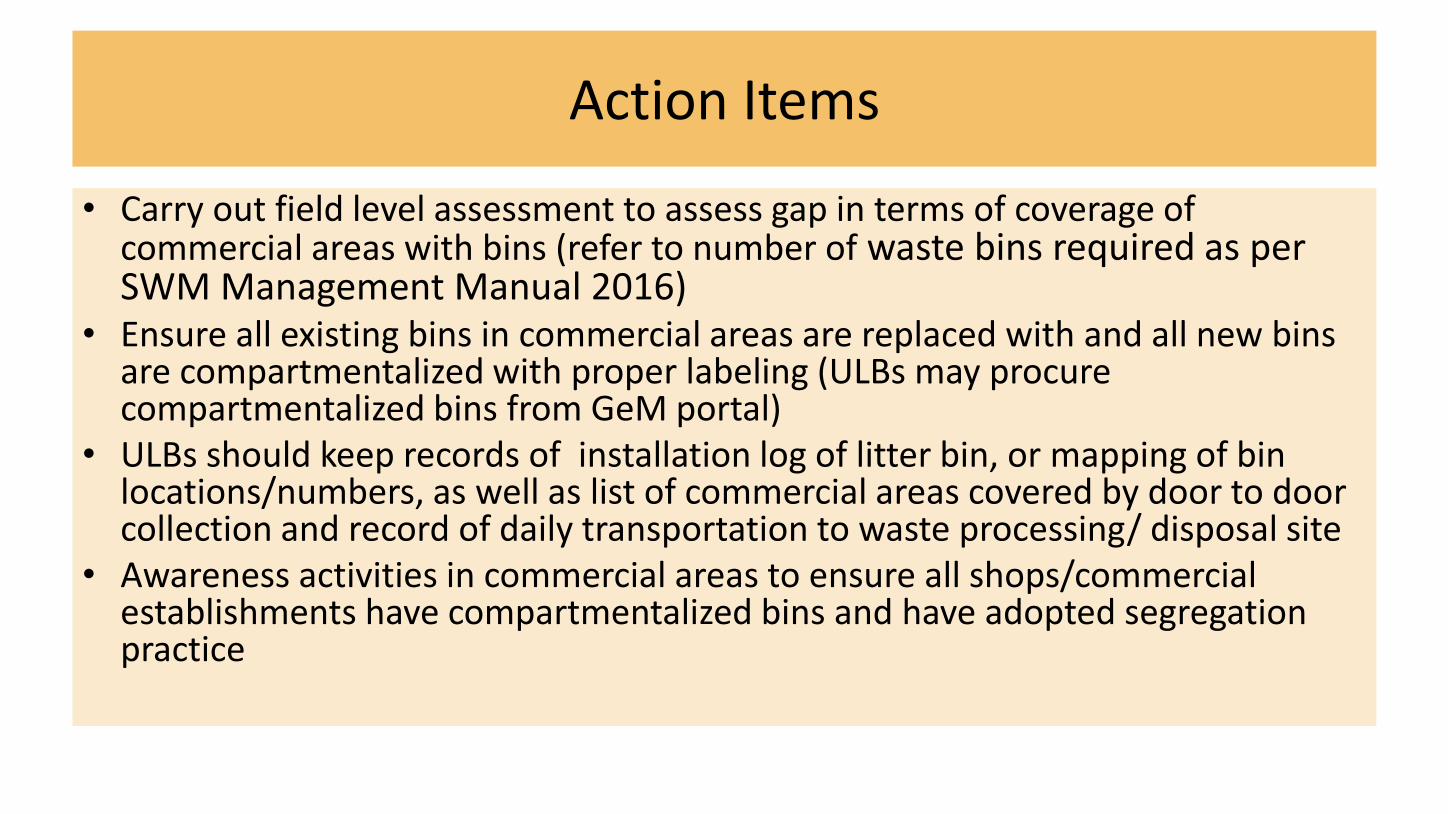
Action Items
• Carry out field level assessment to assess gap in terms of coverage of commercial areas with bins (refer to number of waste bins required as per SWM Management Manual 2016)
• Ensure all existing bins in commercial areas are replaced with and all new bins are compartmentalized with proper labeling (ULBs may procure compartmentalized bins from GeM portal)
• ULBs should keep records of installation log of litter bin, or mapping of bin locations/numbers, as well as list of commercial areas covered by door to door collection and record of daily transportation to waste processing/ disposal site
• Awareness activities in commercial areas to ensure all shops/commercial establishments have compartmentalized bins and have adopted segregation practice

1.10Marks
28
Whether ICT based staff attendance system
linked with payroll is in place
This indicator analyses whether Swachh Bharat Mission (SBM) staff payroll is linked with ICT based system in your
ULB. For contractual staff, similar criteria be followed by releasing the monthly salary basis the attendance
registered in the ICT based attendance system. This will encourage all staff (regular or contractual) to mark their
attendance through ICT based attendance system
ICT system generated staff attendance report for
two months prior to the survey and Copy of
payroll/payout for two months that can be
verified with the attendance
WHY
Means of Verification Scheme of Ranking Marks
ICT based system in place and connected to payroll
28
ICT based system in placeand 100% of staff are using the system
14
ICT based attendance system not in place/not used by 100% attendance
0
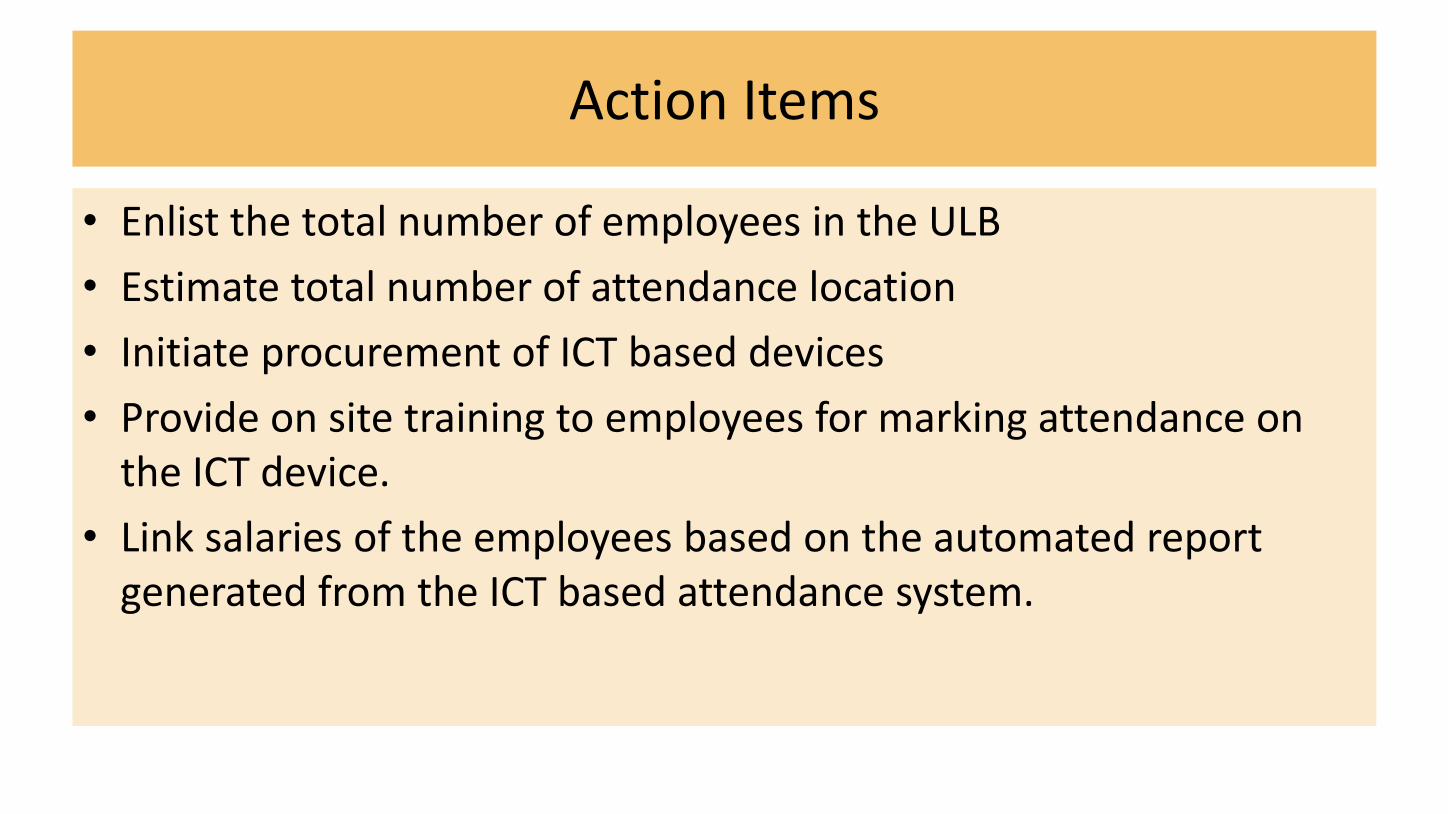
Action Items
• Enlist the total number of employees in the ULB
• Estimate total number of attendance location
• Initiate procurement of ICT based devices
• Provide on site training to employees for marking attendance on the ICT device.
• Link salaries of the employees based on the automated report generated from the ICT based attendance system.

1.11Marks
28Spot Fine –Notification issued and fine collected
The indicator assesses regulatory and penal measures put in place by the ULB to check littering/open defecation/urination.
• To qualify the minimum number of fine collections in the city must be no less than the sum of OD + Litter + Urination spots.
• List of OD, Litter and Urination spots. This will be cross-checked through independent observation
• Copy of notification of spot for littering• Copy of fines collected post release of spot fine notification• Copy of chalaan/receipt books for collecting fines
WHY
Means of Verification Scheme of Ranking Marks
Byelaws in place and enforced
28
Byelaws in place but not enforced
14
No byelaws 0
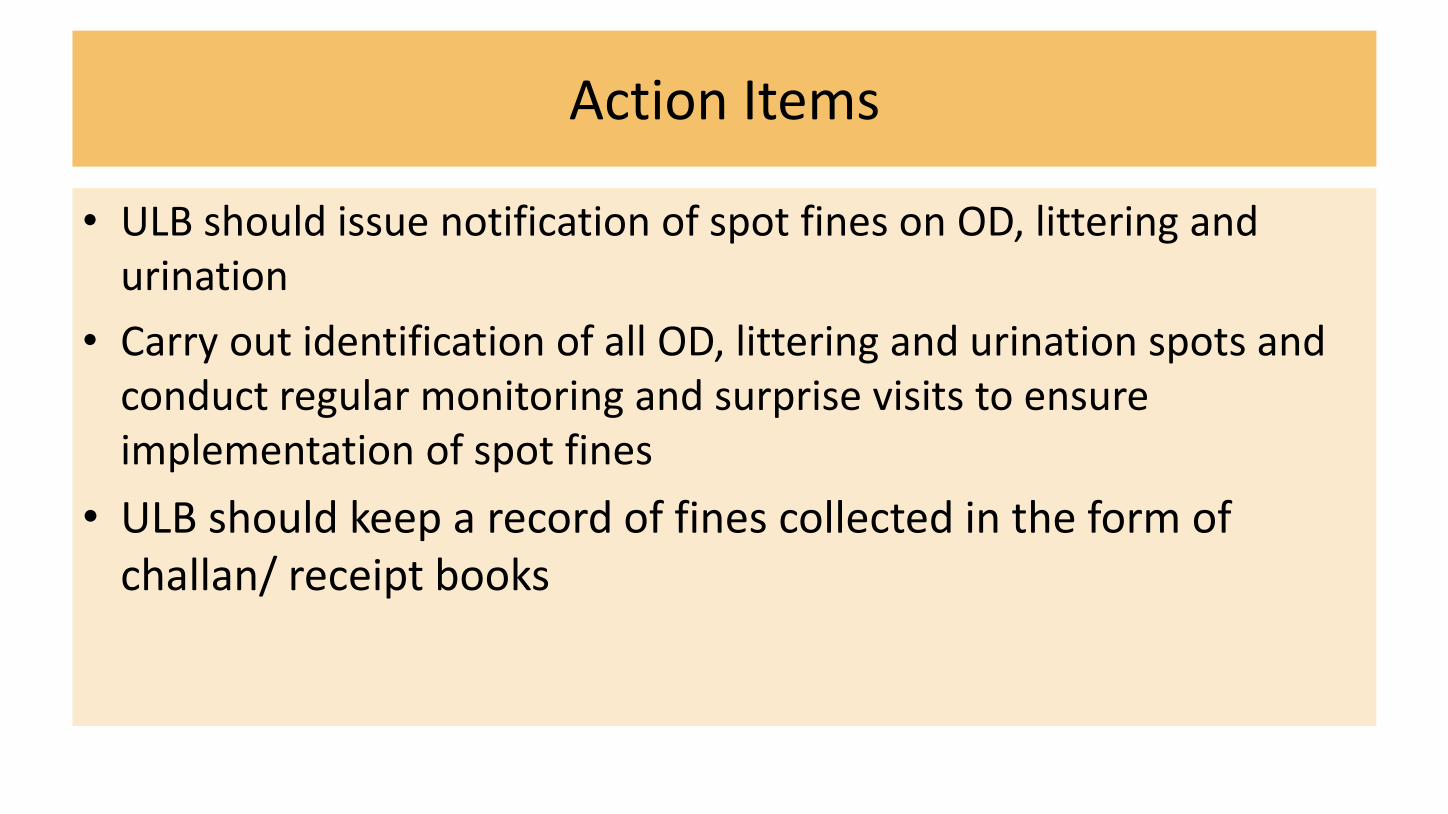
Action Items
• ULB should issue notification of spot fines on OD, littering and urination
• Carry out identification of all OD, littering and urination spots and conduct regular monitoring and surprise visits to ensure implementation of spot fines
• ULB should keep a record of fines collected in the form of challan/ receipt books
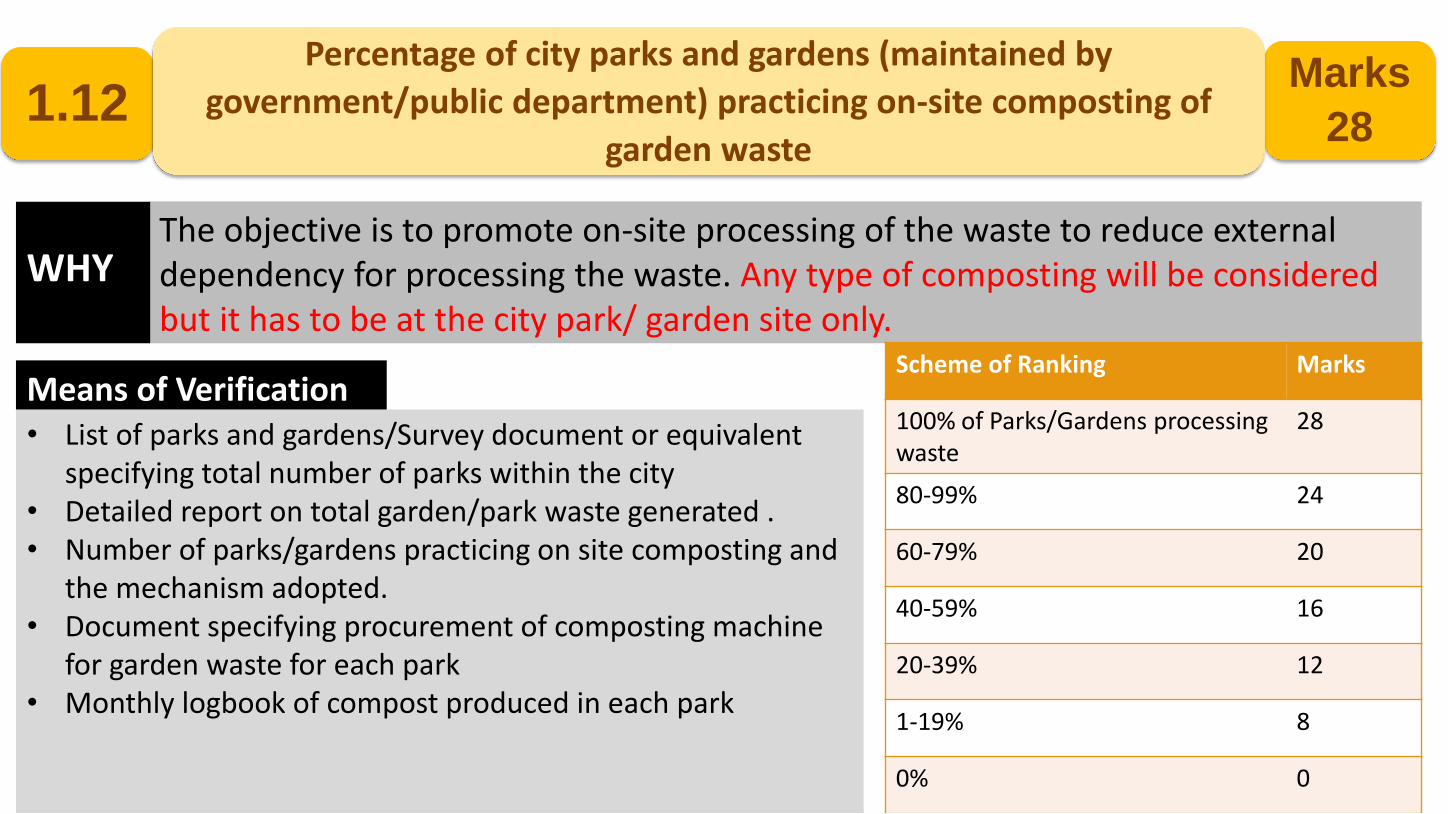
1.12Marks
28
Percentage of city parks and gardens (maintained by
government/public department) practicing on-site composting of
garden waste
The objective is to promote on-site processing of the waste to reduce external dependency for processing the waste. Any type of composting will be considered but it has to be at the city park/ garden site only.
• List of parks and gardens/Survey document or equivalent specifying total number of parks within the city
• Detailed report on total garden/park waste generated .• Number of parks/gardens practicing on site composting and
the mechanism adopted.• Document specifying procurement of composting machine
for garden waste for each park• Monthly logbook of compost produced in each park
WHY
Means of VerificationScheme of Ranking Marks
100% of Parks/Gardens processing waste
28
80-99% 24
60-79% 20
40-59% 16
20-39% 12
1-19% 8
0% 0

Action Items
• Carry out an assessment of all parks and gardens in the city and record following data:– Details of garden/park waste generated– Number of parks/gardens practicing on site composting and the mechanism
adopted.– Document specifying procurement of composting machine for garden waste for
each park– Monthly logbook of compost produced in each park
• Procurement of composting machine may be done through the GeMportal
• Compost produced may be used in the parks/ gardens or sold (community marketplace, etc.)

1.13Marks
18
Provision of personal protection equipment (including uniform,
fluorescent jacket, hand gloves, raincoats, appropriate foot wear and
masks) to all workers handling solid waste and the same are used by
the workforce
MSW 2016 mandates provision of protective equipment(PPE) to all workers involved in handling solid waste.
• Document indicating total staff deployed for handling solid waste
• Copy of procurement mechanism for personal protection equipment
• Evidence of personal protective equipment handed over to workers
• Pictorial evidence of personal protective equipment being used by the workers on daily basis.
WHY
Means of VerificationScheme of Ranking Marks
All personal protection equipment provided and used
18
All personal protection equipment provided but not used
14
Some personal protection equipment provided and used
10
Some personal protection equipment provided and not used
6
No personal protection equipment provided
0
Action Items
• ULB should carry out an assessment of existing provisioning of PPE
• ULB to ensure standardization of PPE (including uniform,fluorescent jacket, hand gloves, raincoats, appropriate foot wearand masks) provided to SWM staff
• Surprise checks to ensure SWM staff are using PPE in dailyoperations
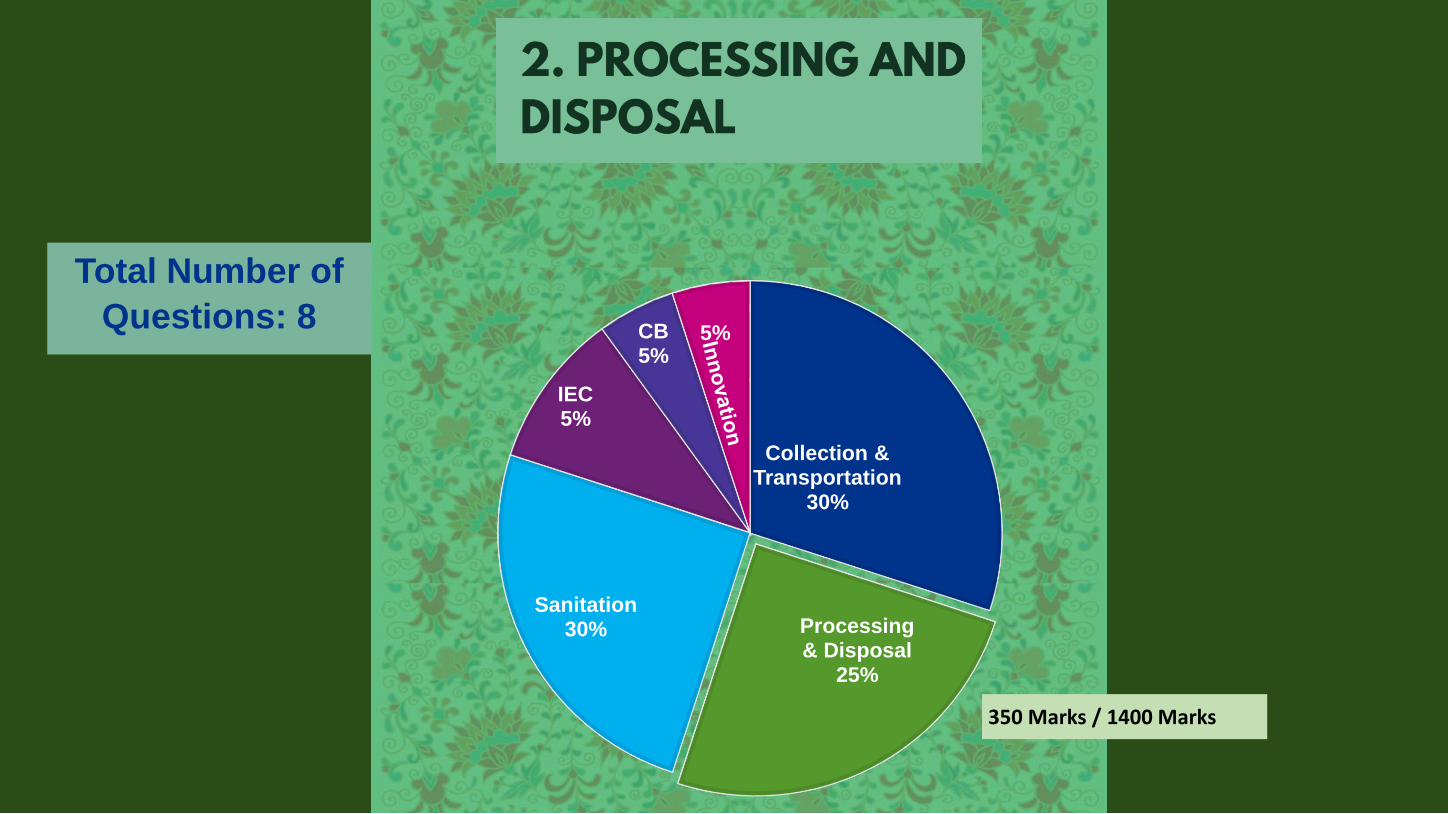
Total Number of
Questions: 8
Collection & Transportation
30%
Processing & Disposal
25%
Sanitation30%
IEC5%
CB5%
5%
350 Marks / 1400 Marks

To make the SWM system financially sustainable
•Amount of property tax collected•Total number of households and the user charges per each for solid waste management
•Total operational cost of SWM activities in the ULB e.g. collection costs, salaries, equipment and capital costs, transportation costs, processing costs
WHY
Means of Verification
2.1What percentage of the operational cost of Solid Waste
Management is covered by Property Tax and User Charges?Marks
60
Scheme of Ranking Marks
100% of the cost 60
80 – 99% 50
60 – 79% 40
40 – 59% 30
20 – 39% 20
1 – 19% 10
0% 0
Action Items
• Carry out an assessment of the amount of SWM costs (e.g.collection costs, salaries, equipment and capital costs, transportation
costs, processing costs) covered by property tax and user chargescollected in the city and identify funding gap, if any.
• Ensure implementation of user charges for SWM
• Develop additional funding mechanisms/models to make SWMfinancially sustainable
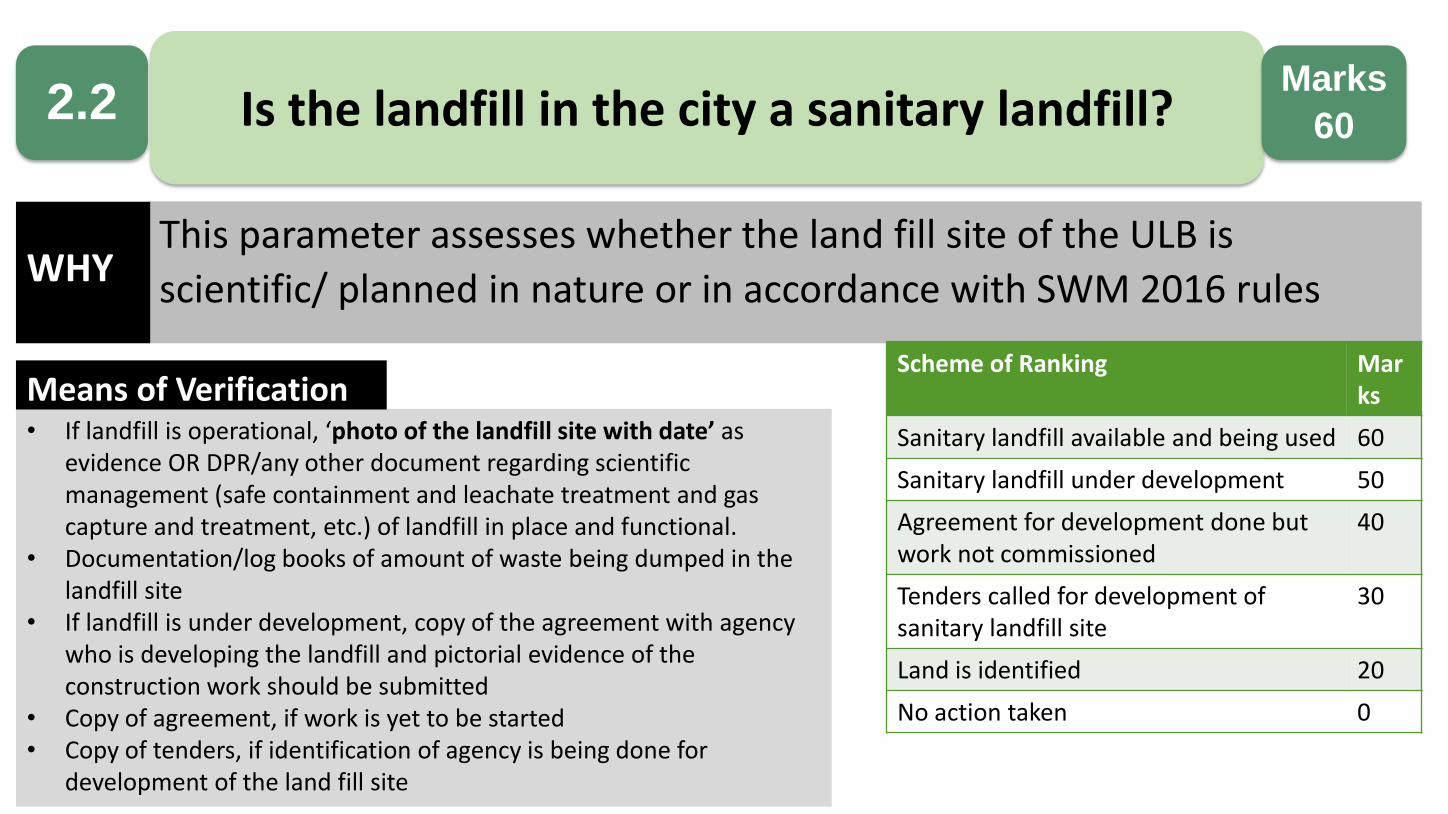
This parameter assesses whether the land fill site of the ULB is
scientific/ planned in nature or in accordance with SWM 2016 rules
• If landfill is operational, ‘photo of the landfill site with date’ as evidence OR DPR/any other document regarding scientific management (safe containment and leachate treatment and gas capture and treatment, etc.) of landfill in place and functional.
• Documentation/log books of amount of waste being dumped in the landfill site
• If landfill is under development, copy of the agreement with agency who is developing the landfill and pictorial evidence of the construction work should be submitted
• Copy of agreement, if work is yet to be started• Copy of tenders, if identification of agency is being done for
development of the land fill site
WHY
Means of Verification
2.2 Is the landfill in the city a sanitary landfill?Marks
60
Scheme of Ranking Marks
Sanitary landfill available and being used 60
Sanitary landfill under development 50
Agreement for development done but work not commissioned
40
Tenders called for development of sanitary landfill site
30
Land is identified 20
No action taken 0
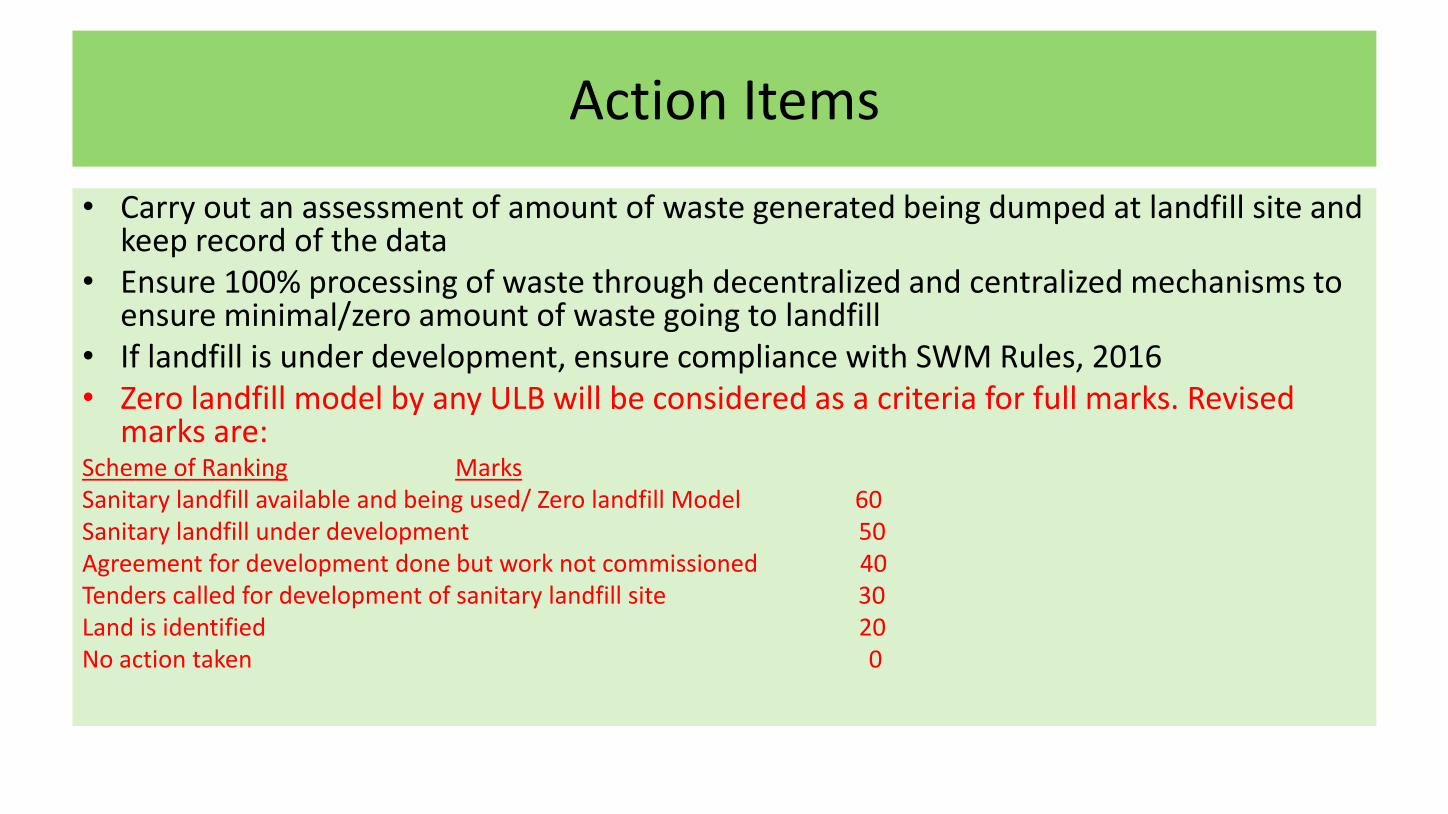
Action Items
• Carry out an assessment of amount of waste generated being dumped at landfill site and keep record of the data
• Ensure 100% processing of waste through decentralized and centralized mechanisms to ensure minimal/zero amount of waste going to landfill
• If landfill is under development, ensure compliance with SWM Rules, 2016 • Zero landfill model by any ULB will be considered as a criteria for full marks. Revised
marks are:Scheme of Ranking MarksSanitary landfill available and being used/ Zero landfill Model 60Sanitary landfill under development 50Agreement for development done but work not commissioned 40Tenders called for development of sanitary landfill site 30Land is identified 20No action taken 0

This indicator assesses the extent of decentralized and centralized management of wet waste generated
• Total Wet Waste generated daily as using per capita criteria• Total number of decentralized waste processing units in the
city – Waste processing capacity and Waste processed per day (including RWAs and Bulk Generators)
• Evidence of centralized waste processing facility in the city. Total waste processed per day
• Waste processing capacity to be taken for only functional processing units
WHY
Means of Verification
2.3Percentage of Wet Waste treated either by
decentralized or centralized processing
Marks
50
Scheme of Ranking Marks
100% of the waste 50
80 – 99% 40
60 – 79% 30
40 – 59% 20
20 – 39% 10
1 – 19% 5
0% 0

Action Items
• Carry out an assessment of amount of wet waste generated in the city and resultant amount that is currently processed
• Develop plan to ensure 100% processing of wet waste through decentralized (on-site composting) or centralized processing facility

This indicator assesses the extent of dry waste being diverted for
recycling or RDF and WtE plants.
• SWM DPR or action plan indicating quantity of segregated collection of waste.
• Survey report indicating total ragpickers in the and dry waste collection centers in the city
• Evidence of WtE and RDF facility in the city. Total waste processed per day
• Evidence of contract with external vendors that process dry waste
• Evidence of reuse of dry waste (e.g. plastics) in road construction
WHY
Means of Verification
2.4Percentage of Dry Waste collected/ treated by either
decentralized or centralized processing
Marks
50
Scheme of Ranking Marks
100% of the waste 50
80 – 99% 40
60 – 79% 30
40 – 59% 20
20 – 39% 10
1 – 19% 5
0% 0
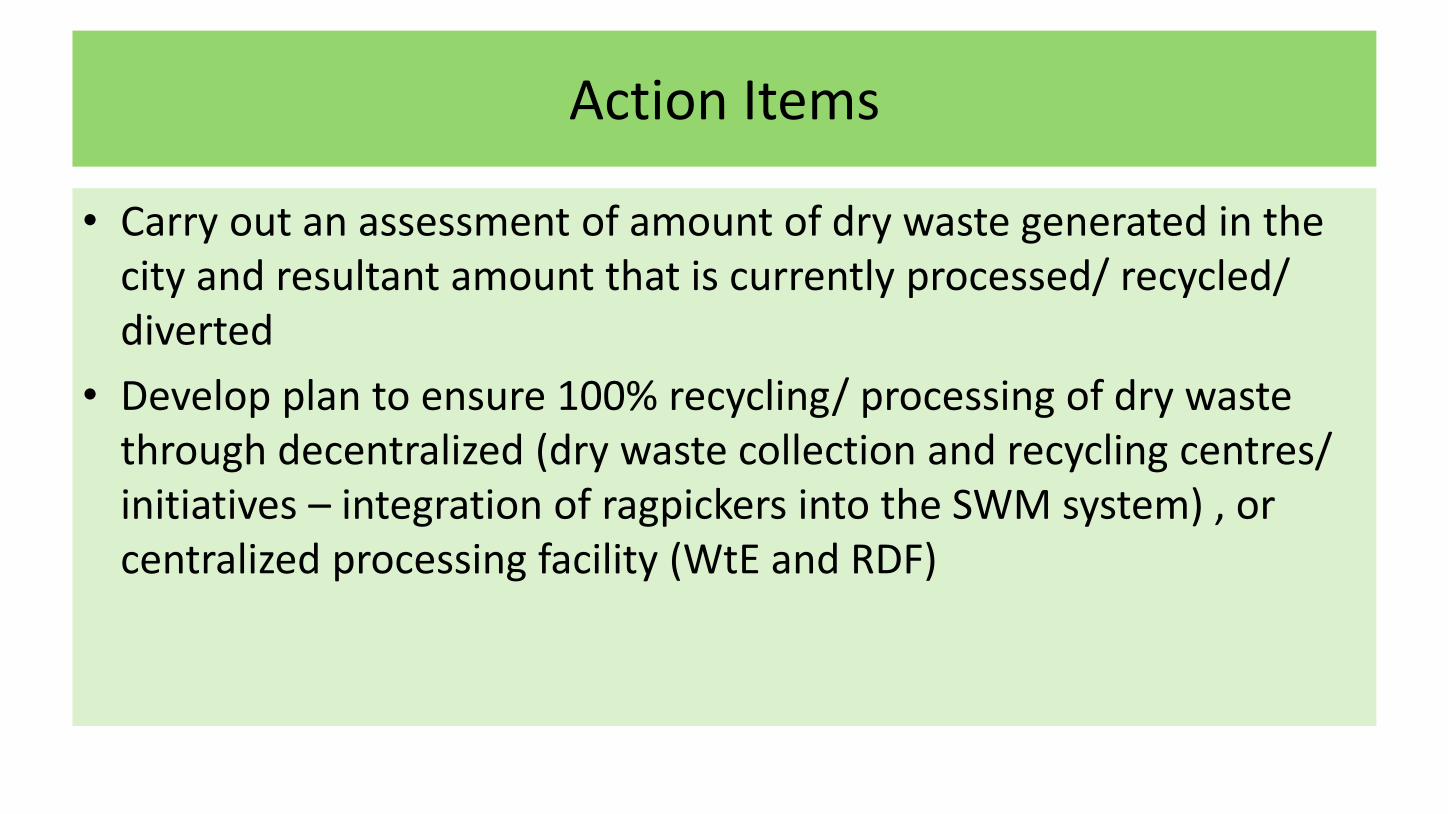
Action Items
• Carry out an assessment of amount of dry waste generated in the city and resultant amount that is currently processed/ recycled/ diverted
• Develop plan to ensure 100% recycling/ processing of dry waste through decentralized (dry waste collection and recycling centres/ initiatives – integration of ragpickers into the SWM system) , or centralized processing facility (WtE and RDF)
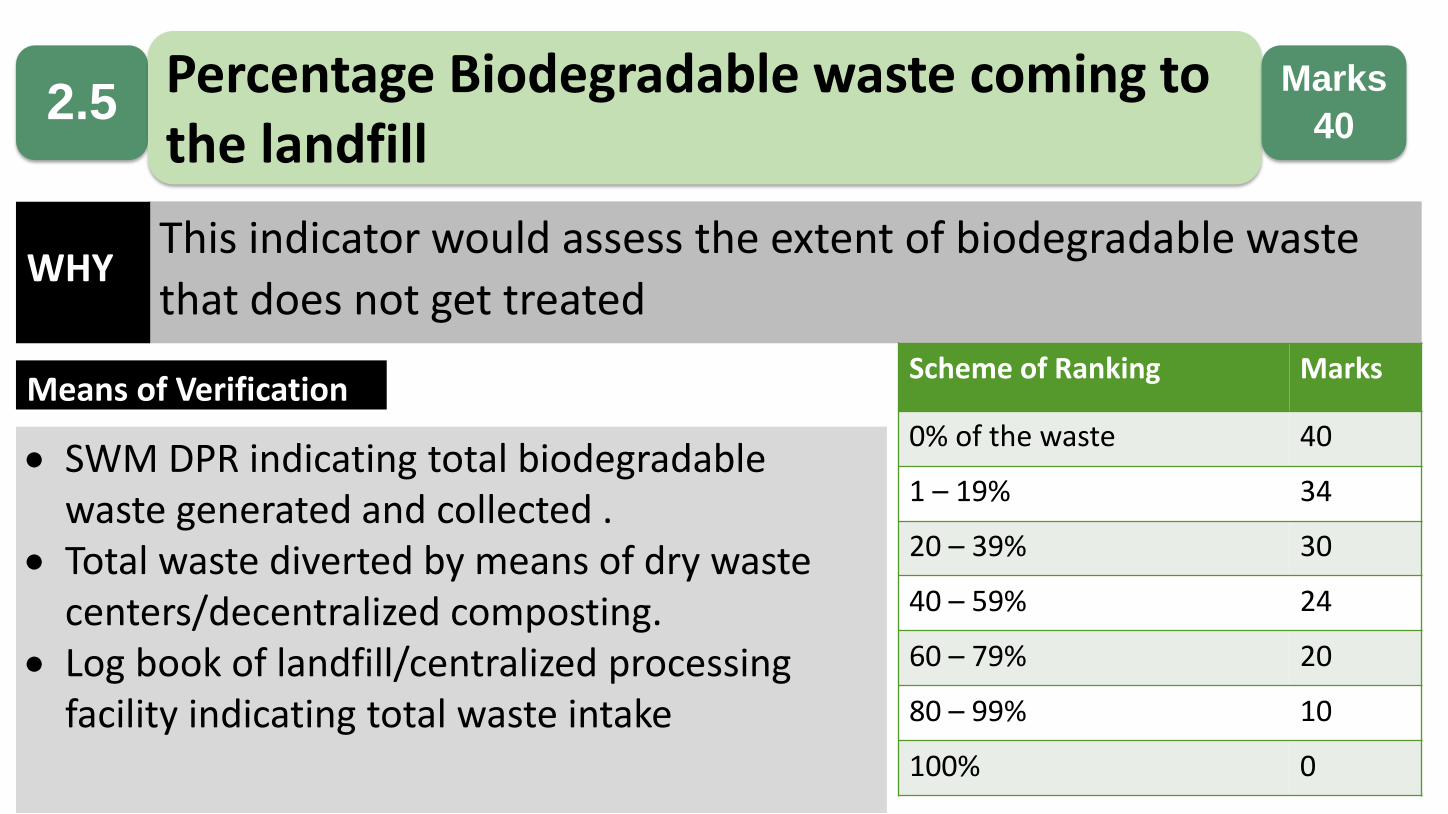
This indicator would assess the extent of biodegradable waste
that does not get treated
SWM DPR indicating total biodegradable waste generated and collected .
Total waste diverted by means of dry waste centers/decentralized composting.
Log book of landfill/centralized processing facility indicating total waste intake
WHY
Means of Verification
2.5Percentage Biodegradable waste coming to the landfill
Marks
40
Scheme of Ranking Marks
0% of the waste 40
1 – 19% 34
20 – 39% 30
40 – 59% 24
60 – 79% 20
80 – 99% 10
100% 0

Action Items
• Estimate total waste generated by the city
• Enlist total waste processed de-centrally
• Maintain log books at transfer station, processing plant and landfill site
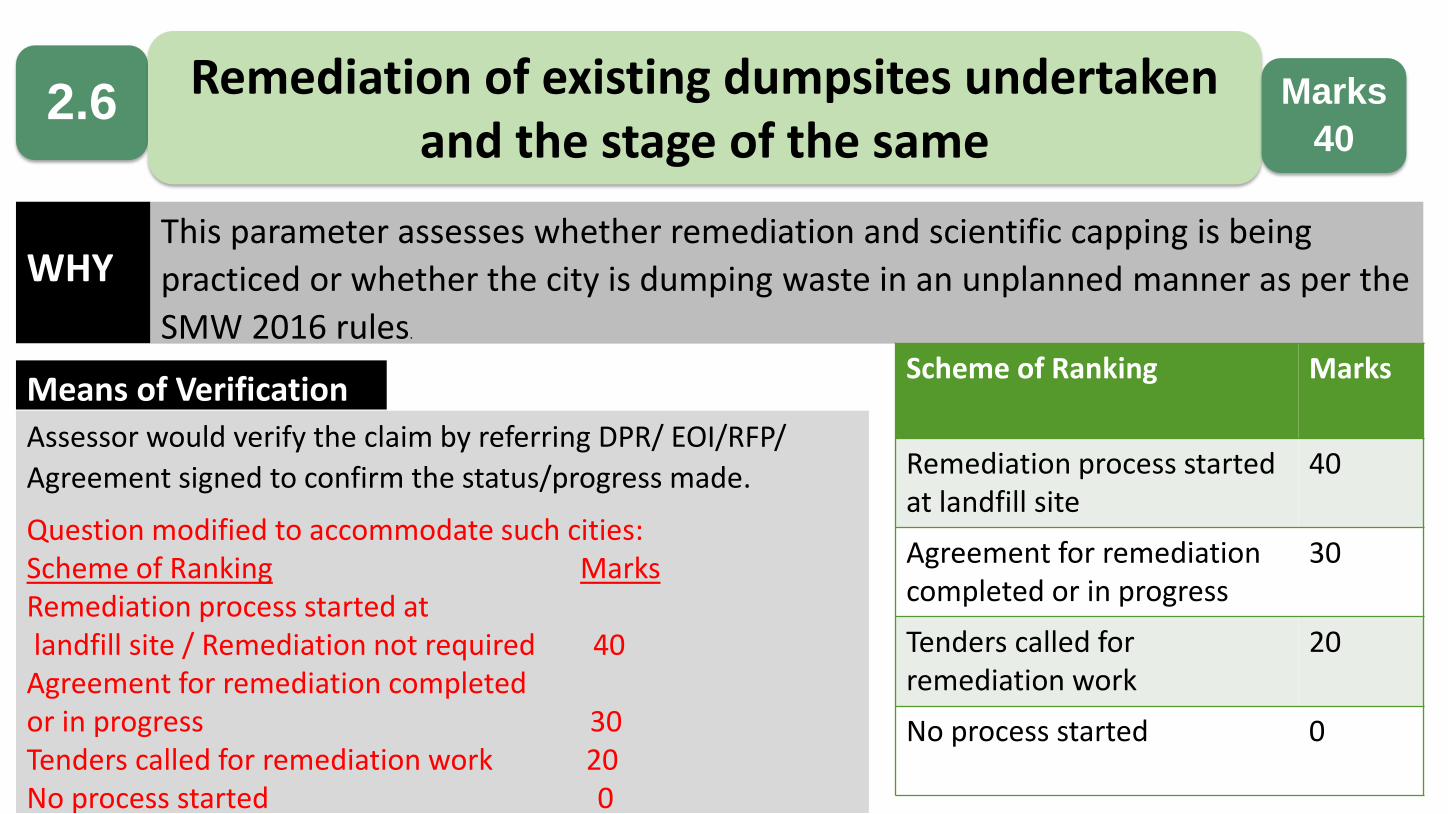
This parameter assesses whether remediation and scientific capping is being
practiced or whether the city is dumping waste in an unplanned manner as per the
SMW 2016 rules.
Assessor would verify the claim by referring DPR/ EOI/RFP/
Agreement signed to confirm the status/progress made.
Question modified to accommodate such cities:Scheme of Ranking MarksRemediation process started atlandfill site / Remediation not required 40 Agreement for remediation completed or in progress 30Tenders called for remediation work 20No process started 0
WHY
Means of Verification
2.6Remediation of existing dumpsites undertaken
and the stage of the sameMarks
40
Scheme of Ranking Marks
Remediation process started at landfill site
40
Agreement for remediationcompleted or in progress
30
Tenders called for remediation work
20
No process started 0

Action Items
• Carry out an assessment of amount of waste disposed in an unplannedmanner and develop a plan for remediation and scientific capping ofexisting dumpsite

This Indicator tracks whether compost manufacturer(s) functioning
towards production and marketing of city compost
• Details of compost manufacturers (including ULB manufacturer)
• Production details by compost manufacturers• Sales logbooks by compost manufacturers for the
last two quarters of 2017 (this can also include sales to city parks by the ULB manufacturers)
WHY
Means of Verification
2.7Sale of City compost/ Self consumption (As a % of production) in the last one quarter of 2017 as logged into the mFMS portal.
Marks
30
Scheme of Ranking Marks
More than 90% production sold
30
More than 80% production sold
20
More than 50% 10
Less than 50% 0
Action Items
– ULB should keep record of functional compost manufacturers in the city along with production and sales details.
– ULB should ensure production is being entered on the mFMS portal

This Indicator tracks whether compost manufacturer(s) functioning
towards production and marketing of city compost
• List of compost manufacturers within the ULB
• Production details of each compost manufacturer within the ULB
WHY
Means of Verification
2.8 Has the designated compost manufacturer(s) in the city registered on the mFMS portal and are they logging production details?
Marks
20
Scheme of Ranking Marks
All of the plants are registered and logging production
20
Not all of the plants are registered and logging production
0

Action Items
• Encourage compost manufacturers to register on mFMS portal and log production and sales details on a regular basis

Total Number of Questions: 11
Collection & Transportation
30%
Processing & Disposal
25%
Sanitation30%
IEC10%
CB5%
5%
420 Marks / 1400 Marks
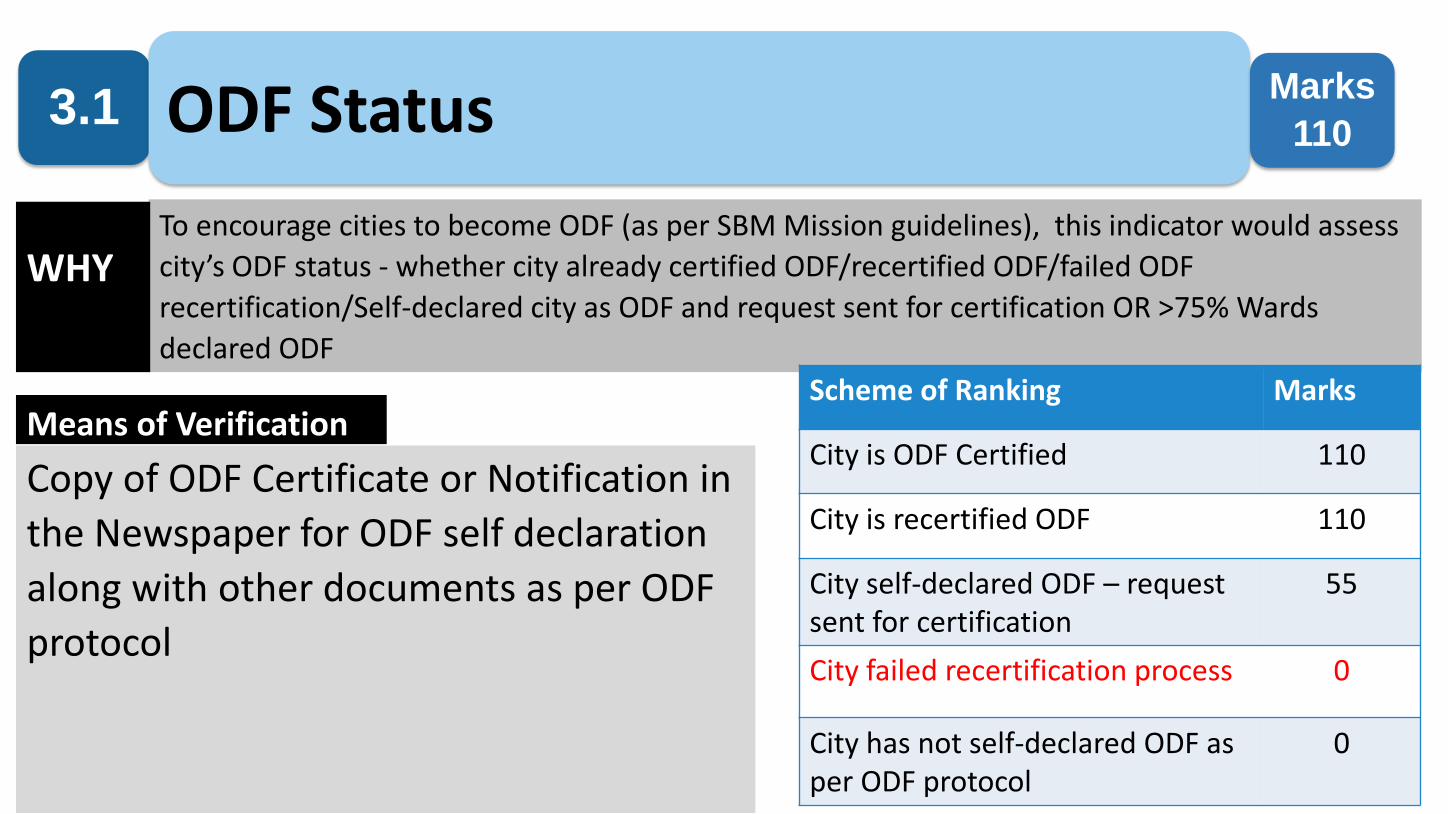
To encourage cities to become ODF (as per SBM Mission guidelines), this indicator would assess
city’s ODF status - whether city already certified ODF/recertified ODF/failed ODF
recertification/Self-declared city as ODF and request sent for certification OR >75% Wards
declared ODF
Copy of ODF Certificate or Notification in
the Newspaper for ODF self declaration
along with other documents as per ODF
protocol
WHY
Means of Verification
3.1 ODF Status Marks
110
Scheme of Ranking Marks
City is ODF Certified 110
City is recertified ODF 110
City self-declared ODF – request sent for certification
55
City failed recertification process 0
City has not self-declared ODF as per ODF protocol
0
Action Items
• Map the fixed and floating population of the city (current status and Census both) and ascertaining the number of CTs and/or PTs to be constructed to cater to the same; expedite construction of the gap of CTs and PTs
• Map the number of households as well as the number of these households that have space for IHHLs but do not have the same; involve ward councilors and/or other community leaders in convincing owners of these households to apply for and construct IHHLs
• Building bye-laws to be adopted, with adequate toilet facilities specified within
• Awareness programs for SHGs, school children, slum inhabitants, urban village dwellers etc., regarding the harmful effects of open defecation
• Regular ODF triggering drives at OD spots and within/among communities prone to indulging in open defecation (including but not limited to slums)
• Ensure upkeep and maintenance of CTs/PTs to allow them to be user-friendly
• Campaign for behaviour change with regard to responsible usage of public toilets, along the lines of Swachh Shauchalaya campaign

Functional and properly maintained Community/Public Toilets are critical to their regular usage.
To sustain CT/PTs, ULBs need to focus on the revenue streams that can support the operation &
maintenance cost of the CT/PT. ULBs have created innovative models to ensure regular income
by monetizing the land (CTPT) viz. Outdoor Media/ATM/Any commercial outlet, as well as user
charges.
• Number of seats/latrines available
• Operation and Maintenance charges/User charges
• Types of monetization strategies and revenue from
each (e.g. SHGs/NGOs collecting user charges)
• Documents supporting revenue collected for
supporting O&M cost
WHY
Means of Verification
3.2Community/Public Toilets(CT/PTs) – What percentage of the Operation and Maintenance Cost has been covered by revenue streams?
Marks
56
Scheme of Ranking Marks
100% of the cost 56
80 – 99% 46
60 – 79% 36
40 – 59% 26
20 – 39% 16
1 – 19% 6
0% 0
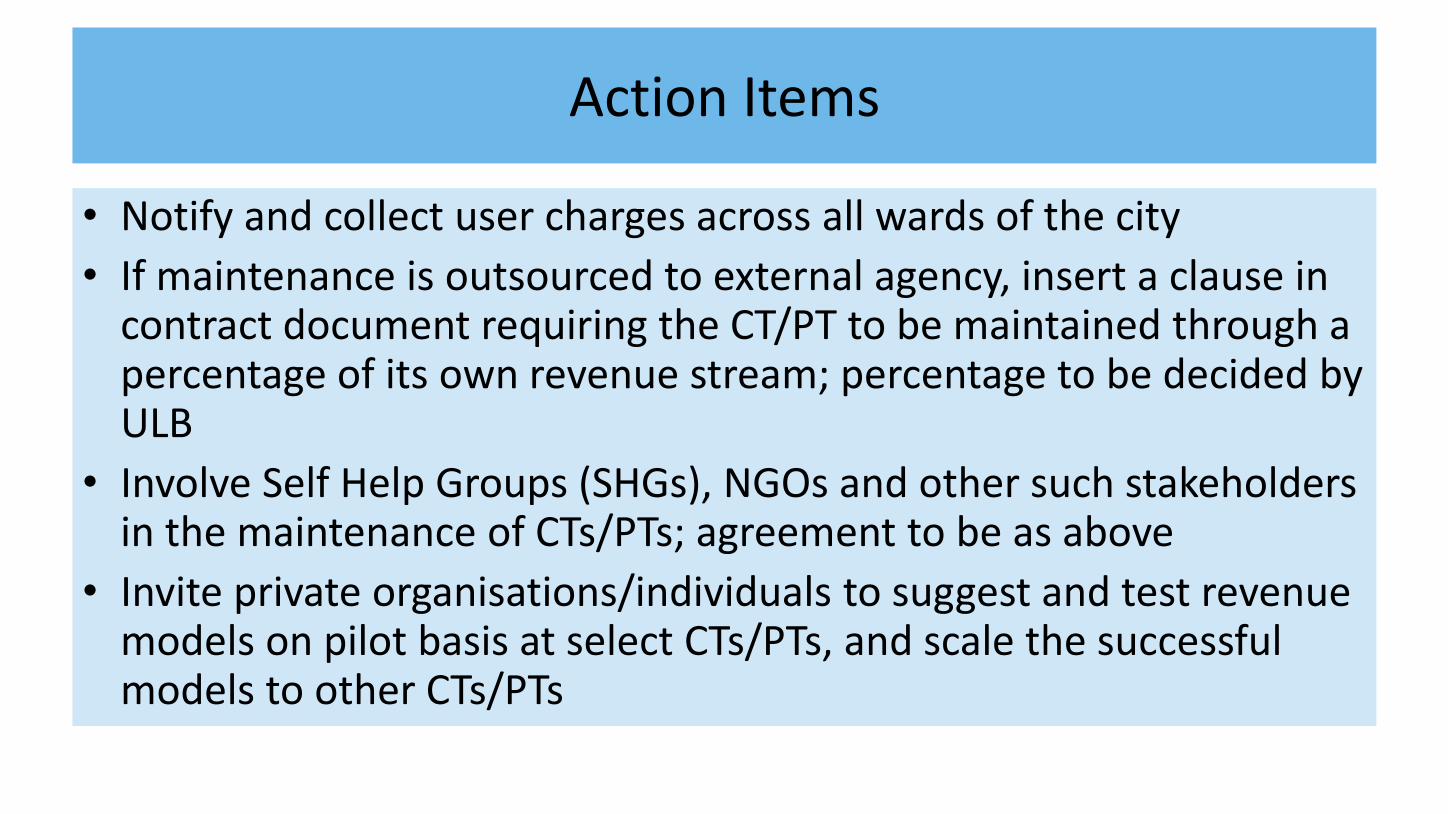
Action Items
• Notify and collect user charges across all wards of the city
• If maintenance is outsourced to external agency, insert a clause in contract document requiring the CT/PT to be maintained through a percentage of its own revenue stream; percentage to be decided by ULB
• Involve Self Help Groups (SHGs), NGOs and other such stakeholders in the maintenance of CTs/PTs; agreement to be as above
• Invite private organisations/individuals to suggest and test revenue models on pilot basis at select CTs/PTs, and scale the successful models to other CTs/PTs
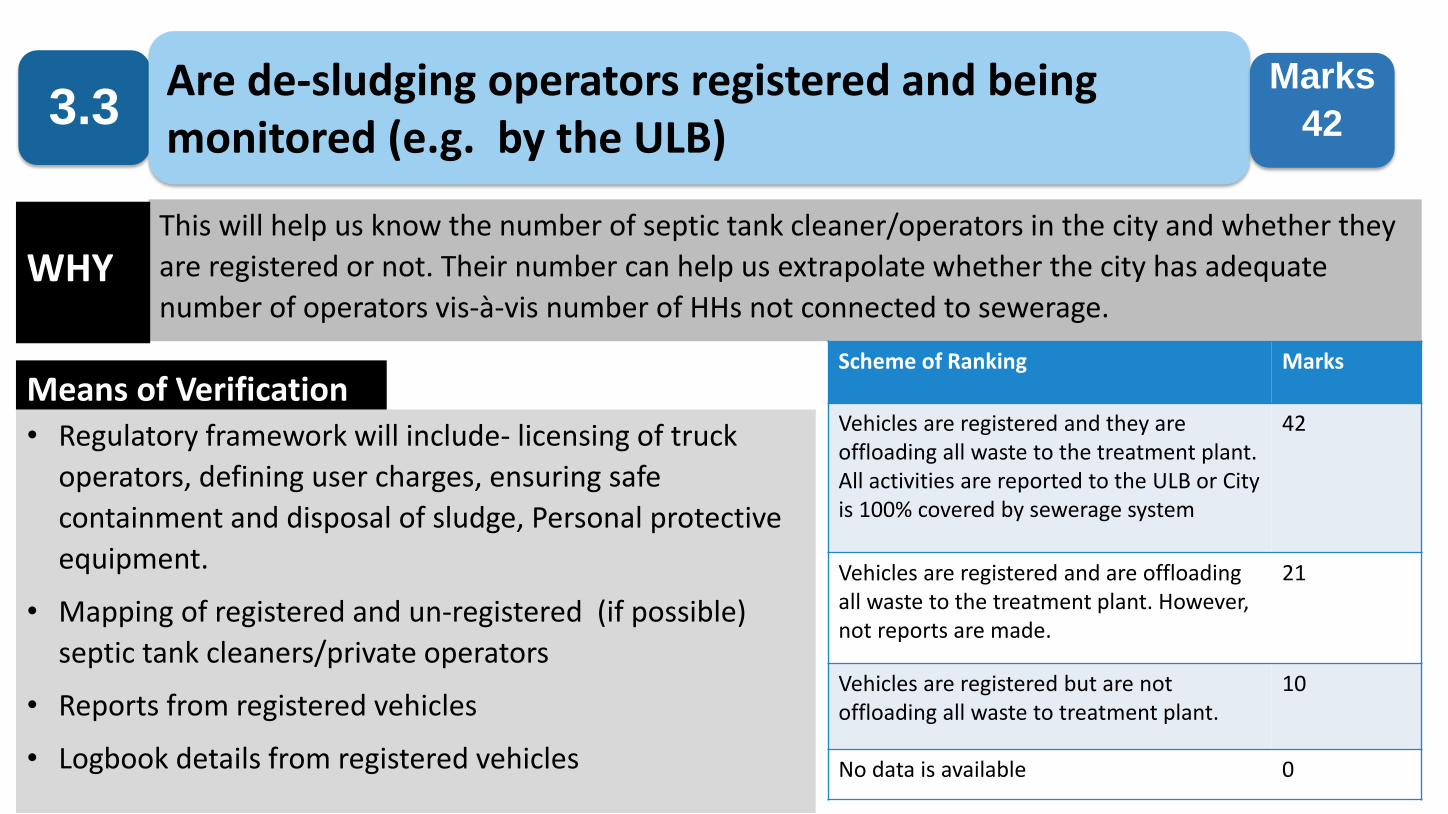
This will help us know the number of septic tank cleaner/operators in the city and whether they
are registered or not. Their number can help us extrapolate whether the city has adequate
number of operators vis-à-vis number of HHs not connected to sewerage.
• Regulatory framework will include- licensing of truck
operators, defining user charges, ensuring safe
containment and disposal of sludge, Personal protective
equipment.
• Mapping of registered and un-registered (if possible)
septic tank cleaners/private operators
• Reports from registered vehicles
• Logbook details from registered vehicles
WHY
Means of Verification
3.3Are de-sludging operators registered and being monitored (e.g. by the ULB)
Marks
42
Scheme of Ranking Marks
Vehicles are registered and they are offloading all waste to the treatment plant. All activities are reported to the ULB or City is 100% covered by sewerage system
42
Vehicles are registered and are offloading all waste to the treatment plant. However, not reports are made.
21
Vehicles are registered but are not offloading all waste to treatment plant.
10
No data is available 0
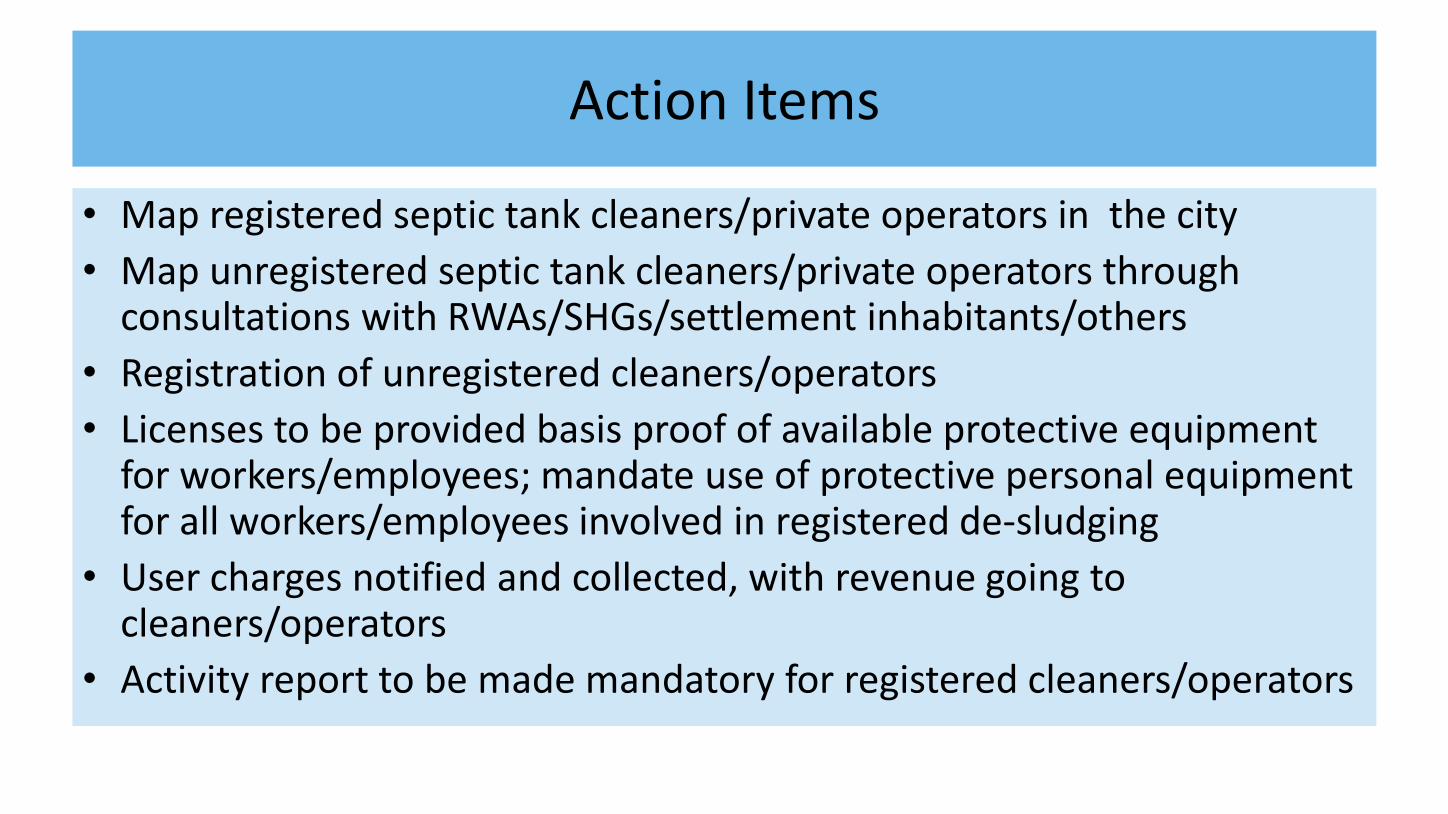
Action Items
• Map registered septic tank cleaners/private operators in the city
• Map unregistered septic tank cleaners/private operators through consultations with RWAs/SHGs/settlement inhabitants/others
• Registration of unregistered cleaners/operators
• Licenses to be provided basis proof of available protective equipment for workers/employees; mandate use of protective personal equipment for all workers/employees involved in registered de-sludging
• User charges notified and collected, with revenue going to cleaners/operators
• Activity report to be made mandatory for registered cleaners/operators

This indicator would assess city’s infrastructure towards liquid waste management within the
city. Definition of within city means within <100 kms of city boundary.
• Detail of working/functional STPs in the city
• Detail about Treatment of Sewage treated
per day versus capacity to treat per day (in
MLD)
• Location of the STPs and the distance from
the city
WHY
Means of Verification
3.4Does your city have liquid waste processing infrastructure (FSTP or STP with co-treatment facility or septage)?
Marks
42
Scheme of Ranking Marks
Yes, within city 42
Yes but outside city 21
No infrastructure available.
0
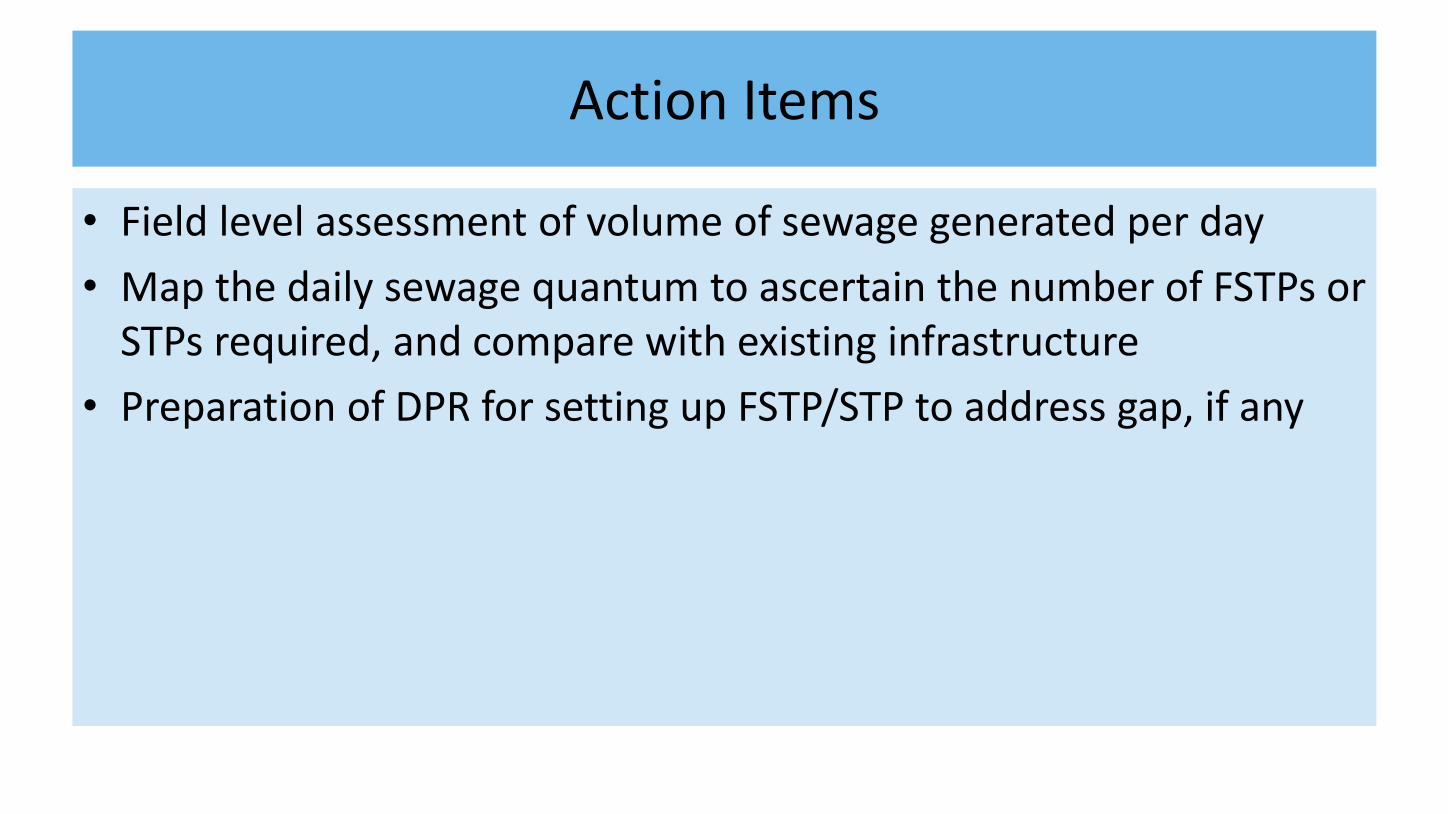
Action Items
• Field level assessment of volume of sewage generated per day
• Map the daily sewage quantum to ascertain the number of FSTPs or STPs required, and compare with existing infrastructure
• Preparation of DPR for setting up FSTP/STP to address gap, if any
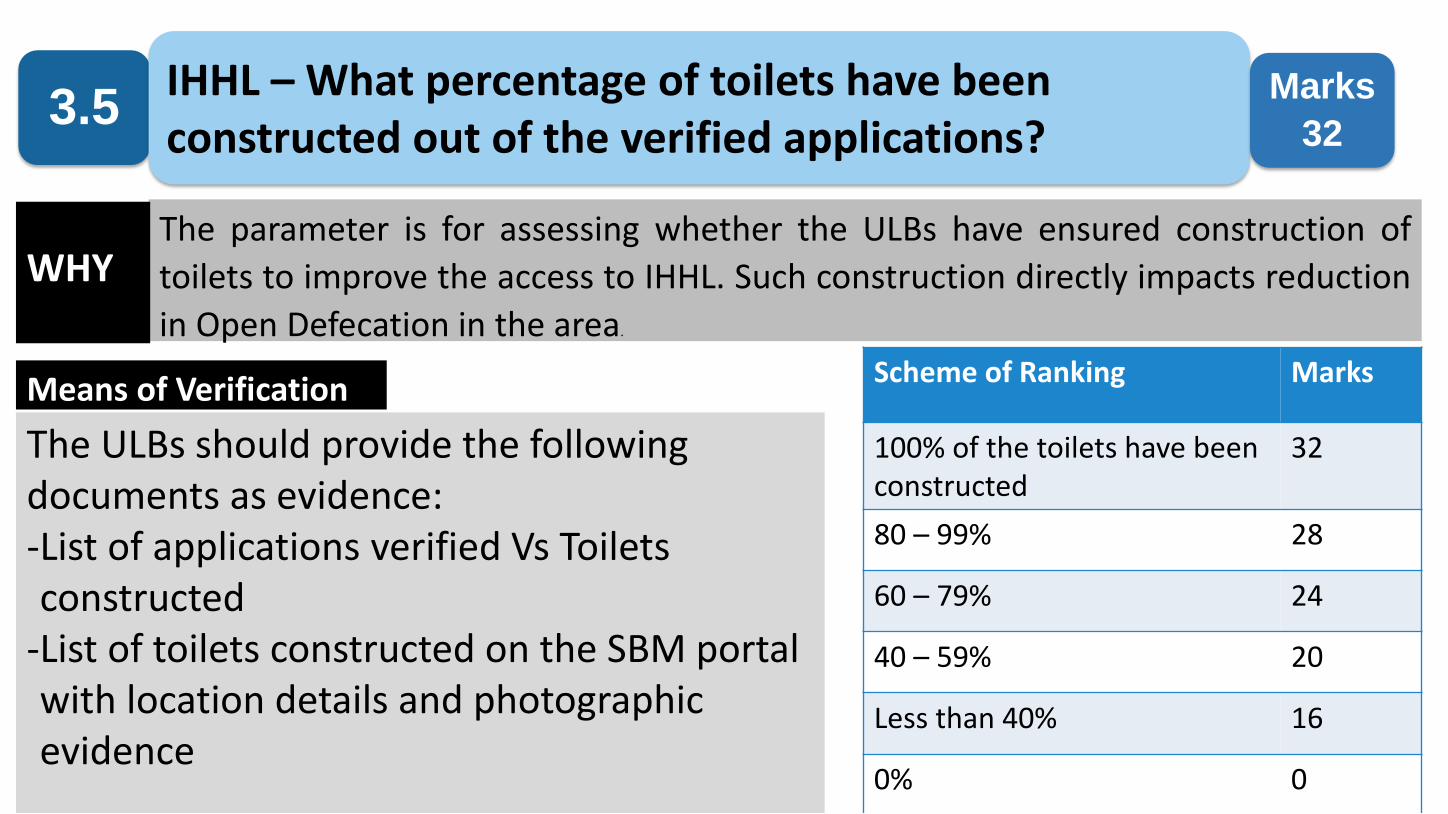
The parameter is for assessing whether the ULBs have ensured construction of
toilets to improve the access to IHHL. Such construction directly impacts reduction
in Open Defecation in the area.
The ULBs should provide the following documents as evidence:-List of applications verified Vs Toilets constructed
-List of toilets constructed on the SBM portal with location details and photographic evidence
WHY
Means of Verification
3.5IHHL – What percentage of toilets have been constructed out of the verified applications?
Marks
32
Scheme of Ranking Marks
100% of the toilets have been constructed
32
80 – 99% 28
60 – 79% 24
40 – 59% 20
Less than 40% 16
0% 0
Action Items
- ULBs should ensure IHHL data accuracy on the SBM portal
- All IHHL applications should be validated by the ward level employee of the ULB
- Beneficiaries should be monitored frequently towards construction progress
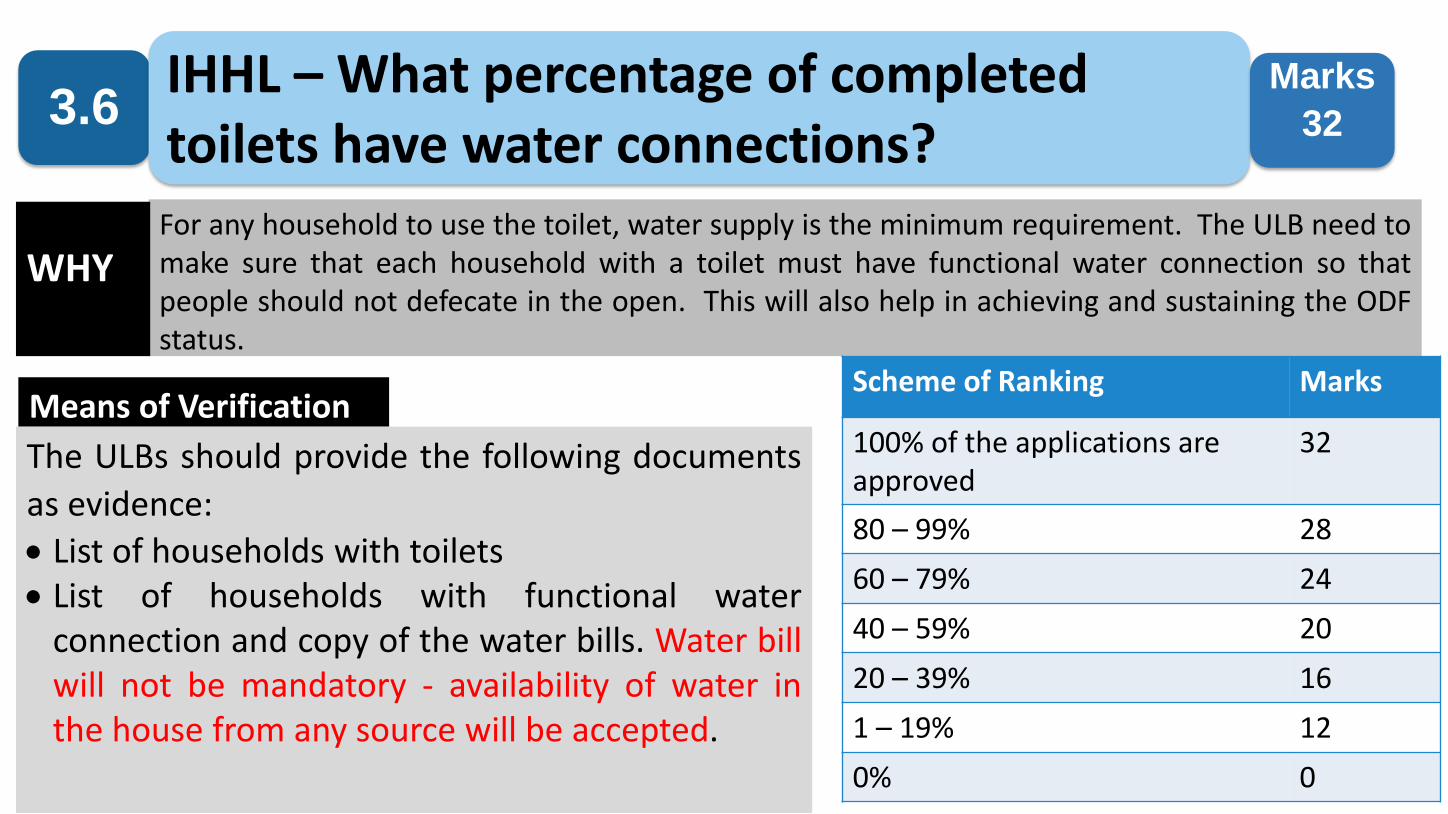
For any household to use the toilet, water supply is the minimum requirement. The ULB need tomake sure that each household with a toilet must have functional water connection so thatpeople should not defecate in the open. This will also help in achieving and sustaining the ODFstatus.
The ULBs should provide the following documents
as evidence:
List of households with toilets List of households with functional water
connection and copy of the water bills. Water billwill not be mandatory - availability of water inthe house from any source will be accepted.
WHY
Means of Verification
3.6IHHL – What percentage of completed toilets have water connections?
Marks
32
Scheme of Ranking Marks
100% of the applications are approved
32
80 – 99% 28
60 – 79% 24
40 – 59% 20
20 – 39% 16
1 – 19% 12
0% 0
Action Items
• Field level assessment to map the number of HHs with toilets, and the number of IHHLs with water connection
• Improve ease of applying for water connection, including for Unauthorized / Regularised colonies, Approved colonies, Resettlement colonies / Urban Villages, as provided under the rules
• Conduct camps (jointly with local water authority, if separate) in wards/localities to encourage citizens to apply for water connection

The parameter is for assessing whether the ULBs have updated the information regarding the
number of applications for individual toilets that are received, on the SBM portal. ULBs should
answer ‘yes’ only if they have updated the information to date.
ULBs should provide the following documents as evidence:-List of applications for IHHL,-List of applications uploaded on SBM portal
WHY
Means of Verification
3.7IHHL – Percentage of applications that have been uploaded on the SBM portal?
Marks
22
Scheme of Ranking Marks
100% of the applications 22
80 – 99% 18
60 – 79% 14
40 – 59% 10
Less than 40% 6
0% 0

Action Items
• Allocate clear responsibility to particular municipal staff for uploading and updating IHHL application data on SBM portal
• Data to be uploaded/updated on regular basis

The parameter is for assessing whether the ULBs have updated the information
regarding the number of application for individual toilets verified, on the SBM
portal. ULBs should answer ‘yes’ only if they have updated the information to date.
The ULBs should provide the following documents as evidence:-List of applications verified,-List of applications verified and updated on the SBM portal
WHY
Means of Verification
3.8IHHL – What percentage of applications have been verified on the SBM portal?
Marks
22
Scheme of Ranking Marks
100% of the applications are approved
22
80 – 99% 18
60 – 79% 14
40 – 59% 10
Less than 40% 6
0% 0
Action Items
• Allocate clear responsibility to particular municipal staff for uploading and updating IHHL application data on SBM portal
• Data to be uploaded/updated on regular basis
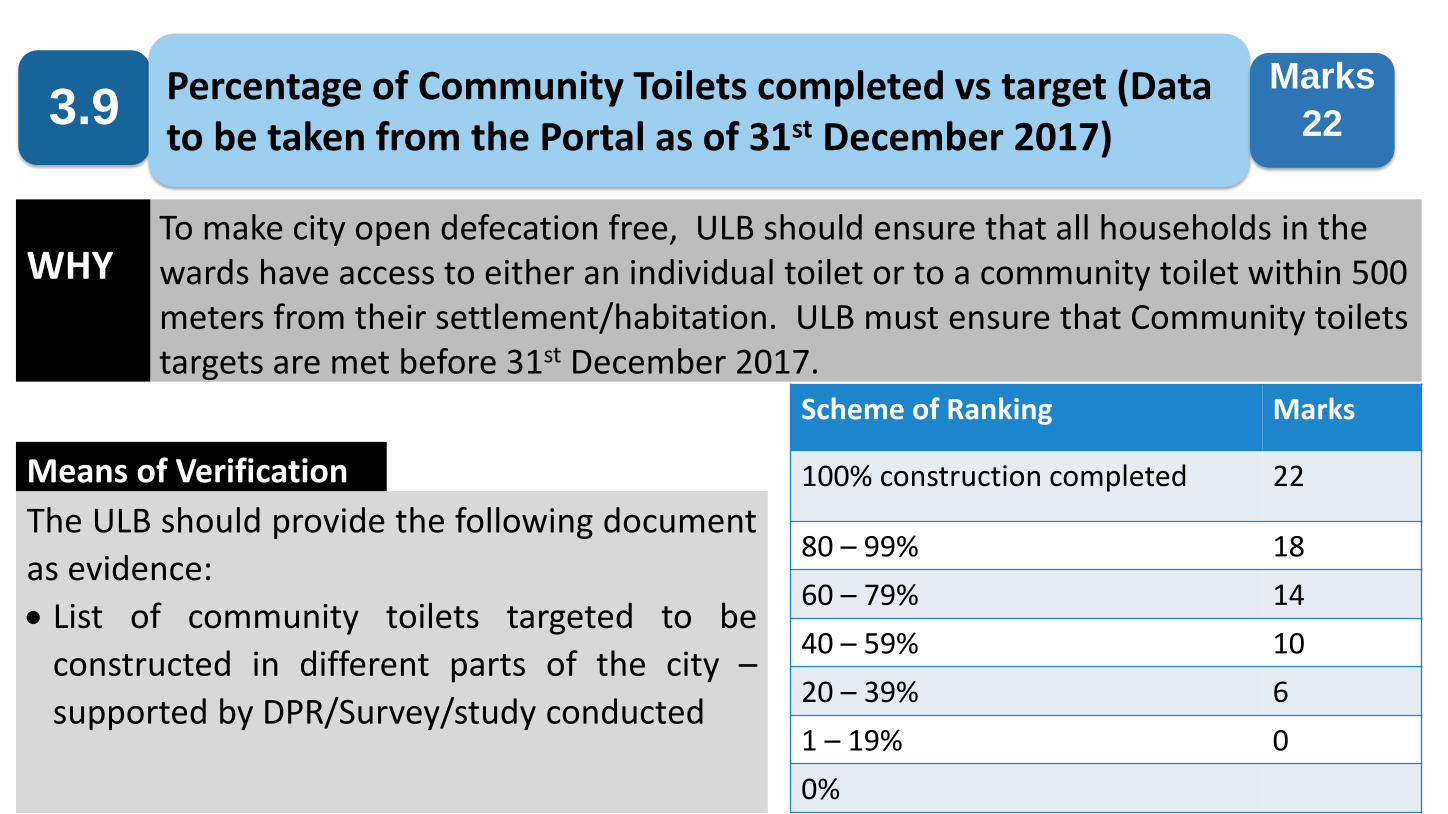
To make city open defecation free, ULB should ensure that all households in the wards have access to either an individual toilet or to a community toilet within 500 meters from their settlement/habitation. ULB must ensure that Community toilets targets are met before 31st December 2017.
The ULB should provide the following document
as evidence:
List of community toilets targeted to be
constructed in different parts of the city –
supported by DPR/Survey/study conducted
WHY
Means of Verification
3.9Percentage of Community Toilets completed vs target (Data to be taken from the Portal as of 31st December 2017)
Marks
22
Scheme of Ranking Marks
100% construction completed 22
80 – 99% 18
60 – 79% 14
40 – 59% 10
20 – 39% 6
1 – 19% 0
0%
Action Items
• Field level assessment of all communities and whether they have toilet facilities available
• Estimate the number of CTs required to be constructed
• Engage with representatives of target communities to prepare plan for constructing CTs (as per target and requirement, both)
• Provide support to communities, such as connecting with private contractors for CT construction, or parties that may be contracted for maintenance of the toilets
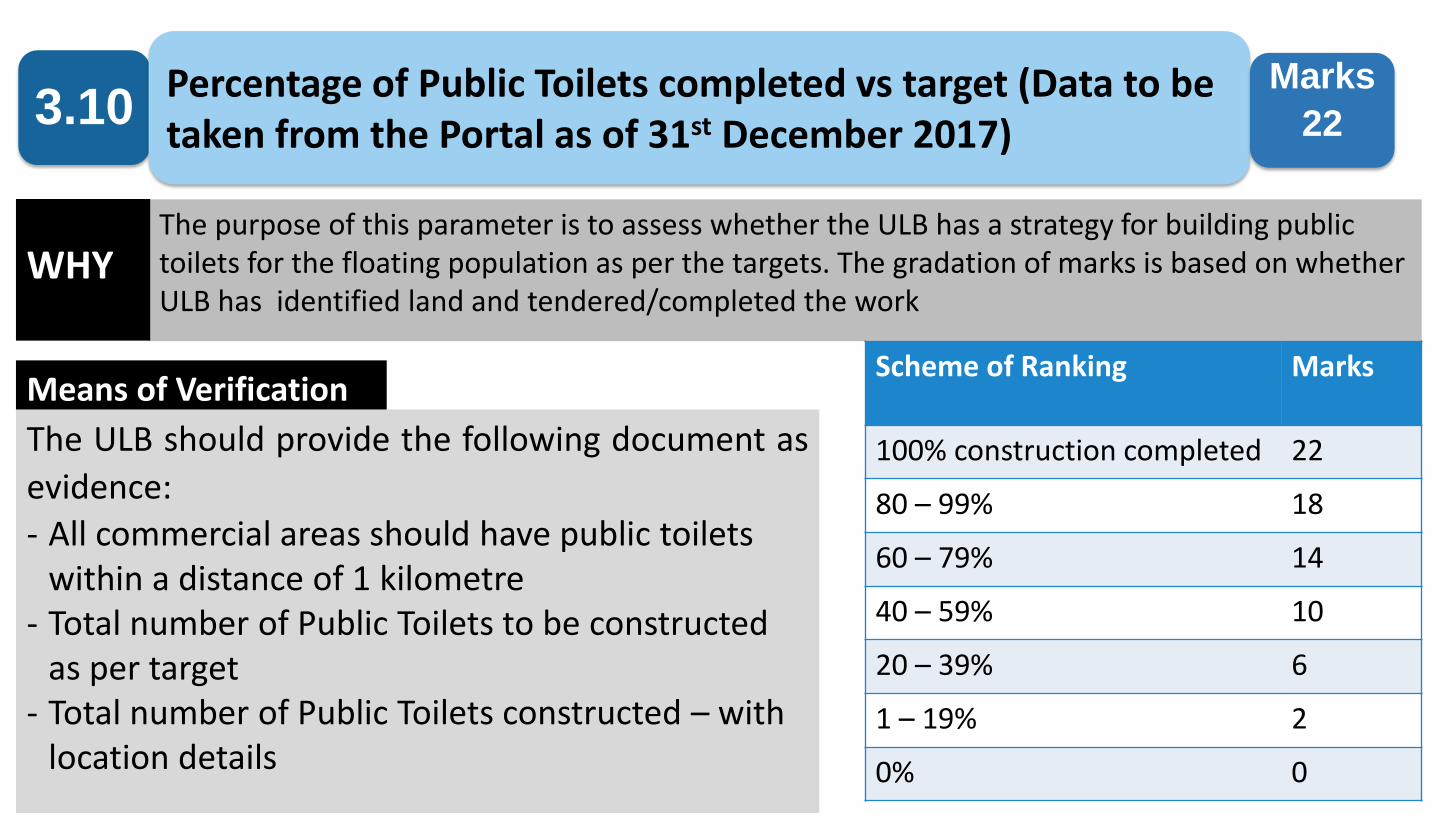
The purpose of this parameter is to assess whether the ULB has a strategy for building public toilets for the floating population as per the targets. The gradation of marks is based on whether ULB has identified land and tendered/completed the work
The ULB should provide the following document as
evidence:
- All commercial areas should have public toilets within a distance of 1 kilometre
- Total number of Public Toilets to be constructed as per target
- Total number of Public Toilets constructed – with location details
WHY
Means of Verification
3.10Percentage of Public Toilets completed vs target (Data to be taken from the Portal as of 31st December 2017)
Marks
22
Scheme of Ranking Marks
100% construction completed 22
80 – 99% 18
60 – 79% 14
40 – 59% 10
20 – 39% 6
1 – 19% 2
0% 0
Action Items
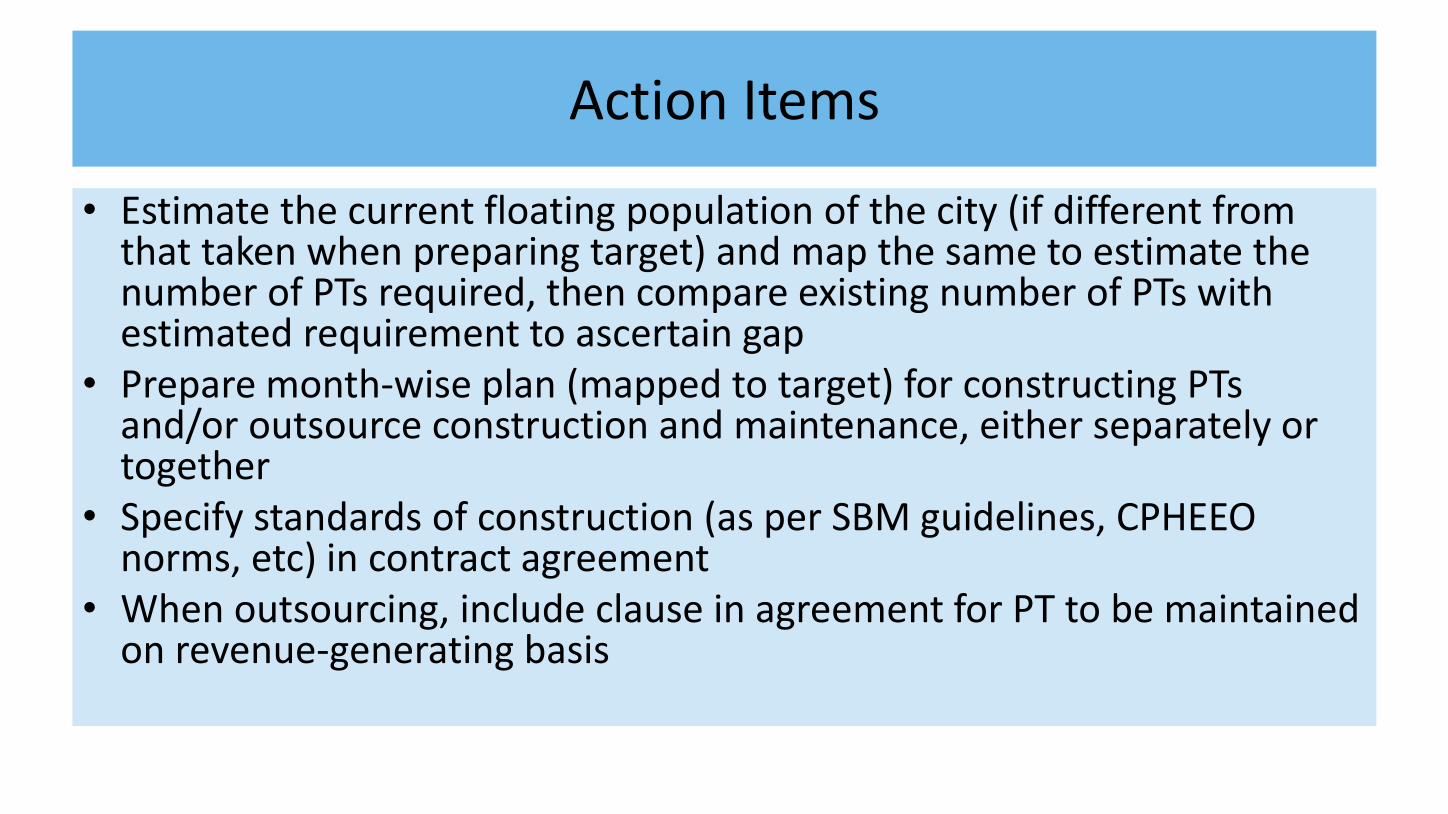
• Estimate the current floating population of the city (if different from that taken when preparing target) and map the same to estimate the number of PTs required, then compare existing number of PTs with estimated requirement to ascertain gap
• Prepare month-wise plan (mapped to target) for constructing PTs and/or outsource construction and maintenance, either separately or together
• Specify standards of construction (as per SBM guidelines, CPHEEO norms, etc) in contract agreement
• When outsourcing, include clause in agreement for PT to be maintained on revenue-generating basis
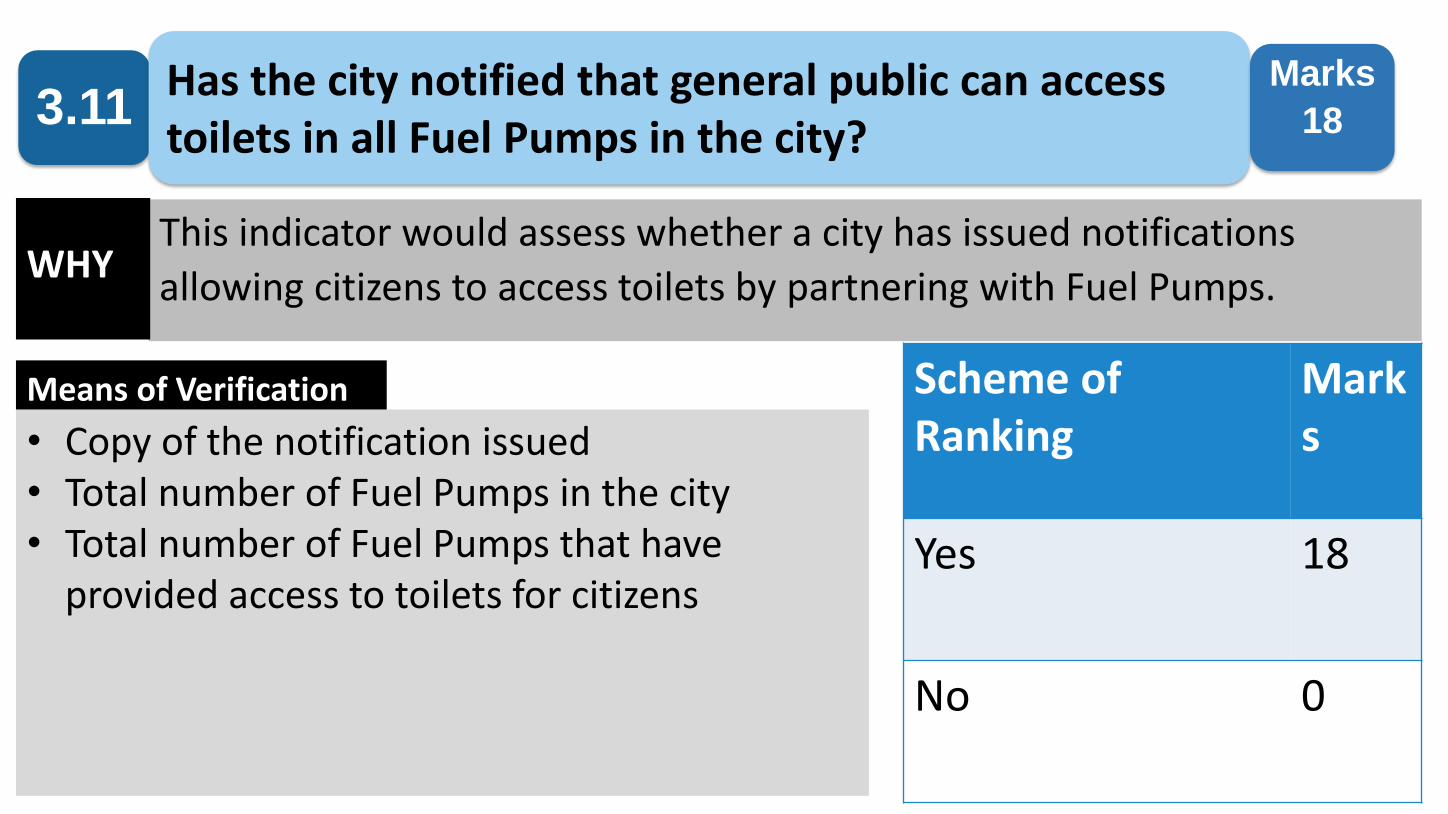
This indicator would assess whether a city has issued notifications
allowing citizens to access toilets by partnering with Fuel Pumps.
• Copy of the notification issued• Total number of Fuel Pumps in the city• Total number of Fuel Pumps that have
provided access to toilets for citizens
WHY
Means of Verification
3.11Has the city notified that general public can access toilets in all Fuel Pumps in the city?
Marks
18
Scheme of Ranking
Marks
Yes 18
No 0
Action Items
• Prepare notification and share with all fuel station owners /ward councillors/RWAs/others to be displayed and disseminated
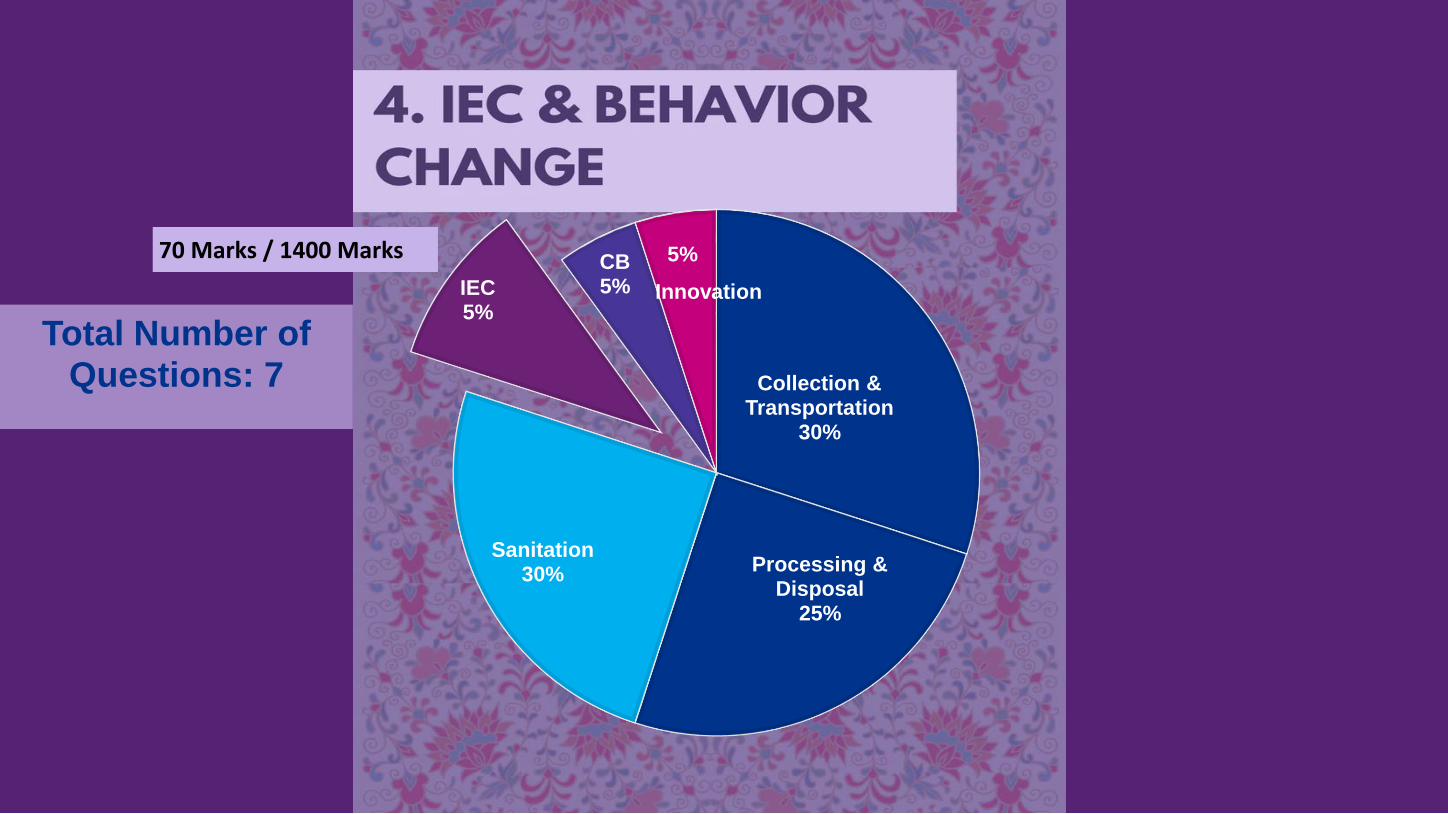
Total Number of Questions: 7 Collection &
Transportation30%
Processing & Disposal
25%
Sanitation30%
IEC5%
CB5%
5%70 Marks / 1400 Marks
Innovation
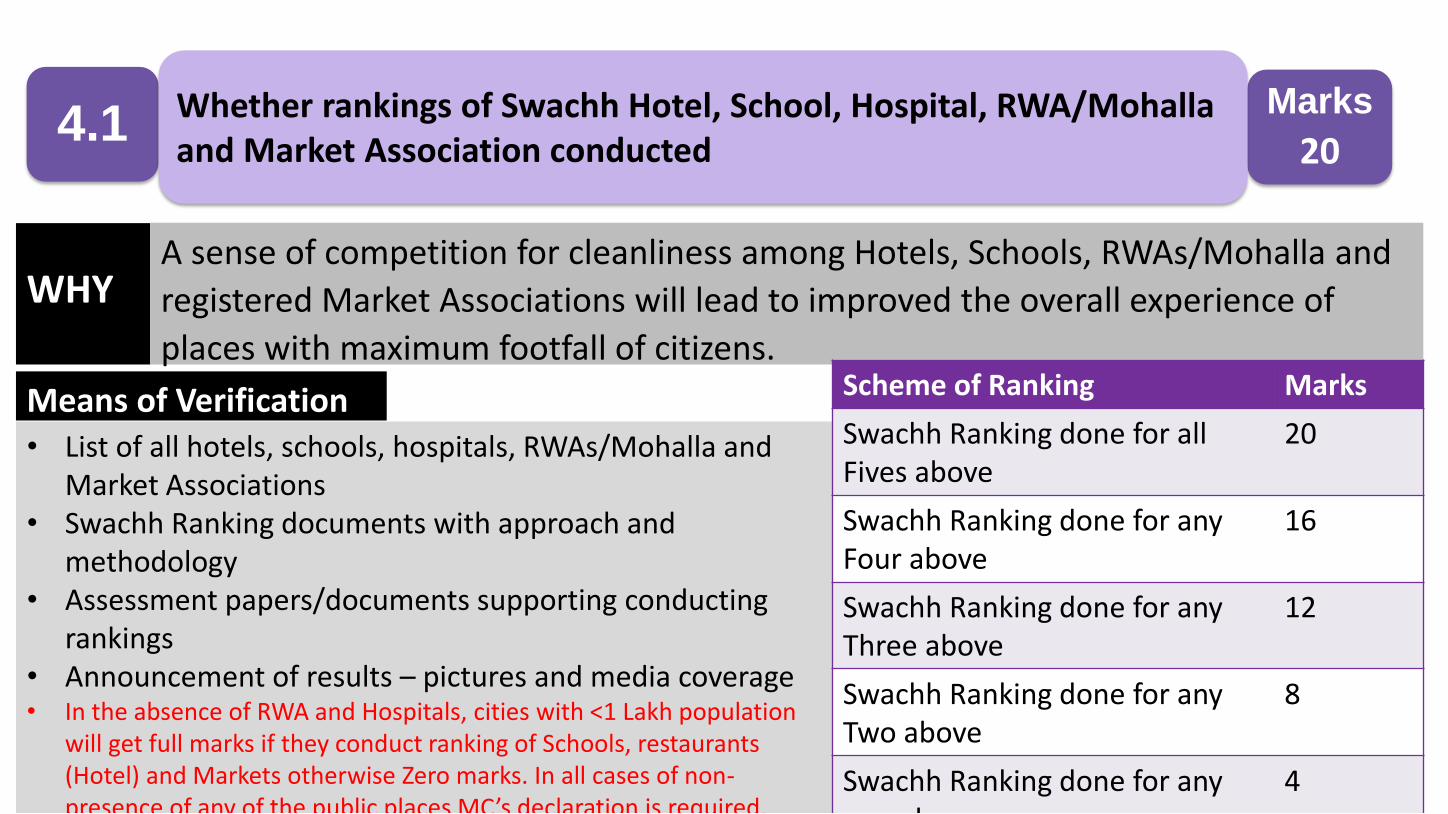
4.1Marks
20Whether rankings of Swachh Hotel, School, Hospital, RWA/Mohallaand Market Association conducted
WHYA sense of competition for cleanliness among Hotels, Schools, RWAs/Mohalla and
registered Market Associations will lead to improved the overall experience of
places with maximum footfall of citizens.
Means of Verification• List of all hotels, schools, hospitals, RWAs/Mohalla and
Market Associations• Swachh Ranking documents with approach and
methodology• Assessment papers/documents supporting conducting
rankings• Announcement of results – pictures and media coverage• In the absence of RWA and Hospitals, cities with <1 Lakh population
will get full marks if they conduct ranking of Schools, restaurants (Hotel) and Markets otherwise Zero marks. In all cases of non-presence of any of the public places MC’s declaration is required.
Scheme of Ranking Marks
Swachh Ranking done for all Fives above
20
Swachh Ranking done for any Four above
16
Swachh Ranking done for any Three above
12
Swachh Ranking done for any Two above
8
Swachh Ranking done for any one above
4

Action Items
• Conduct survey to ascertain the number of hospitals, hotels, schools, RWAs and market associations in the city
• Based on Swachh SOPs for Hotels, Schools, RWAs, etc. prepared by the ministry (available on SBM portal), define clear parameters and prepare structured questionnaire OR contract agency for the same
• Contract agency for conducting Swachh assessment of the different types of institutions
• Felicitate the top rank holders emerging from the assessment
• Publish results in local newspapers, on local TV and radio channels

4.2Marks
16ICT Based Monitoring of Community and Public Toilets
WHYQuality and functionality is very critical for the usage of Public Toilet. This indicator examines whether a
ULB provide citizens a platform to locate toilets and give feedback about the functionality of the toilet,
through an ICT mechanism such as the Google Toilet Locator OR Feedback Monitoring System (Wall-
Mounted). Means of Verification• List of all CT/PTs• To be tracked/monitored through Google server at the backend by the survey
agency• To be tracked/verified through server at the backend (ULB/Service Provider) by
the survey agency. • Review of feedback received (for latest two months) post installation of the
device• Documentation support of Google Toilet Locator• Contract supporting procurement/installation of feedback system.• Cities with <1 Lakh population may opt for feedback through google toilet locator
or ‘any other form of feedback’ – Feedback box/register etc. Revised marks are as below for cities <1 lakh population
Scheme of Ranking Marks100% toilets have ICT based systems 16 Less than 100% / Manual monitoring 12
O% toilets ICT monitored/ No manual monitoring 0
Scheme of Ranking Marks
100% toilets have both ICT based systems
16
60-99% have both ICT based systems 12
100% toilets have one ICT based system 8
60-99% have one ICT based system 6
60-99% have no ICT based system 4
All toilets have no ICT based systems 0

Action Items
• Toilet locator on Google Maps - Follow the checklist given in Annexure 2 of D.O. No. 17/5/2017 – SBM I (available on the SBM portal), for geotagging of CTs and PTs and allowing them to be located on Google Maps
• Obtain reports on utilization from survey agency/Google server
• Feedback Monitoring – Contract TCIL/BSNL/ITIL for installing feedback systems in public/community toilets (Details available on D.O. No. 16/4/2017 – SBM I on the SBM portal)
• Utilise feedback reports for informing agreements with concessionaires/other parties maintaining toilets
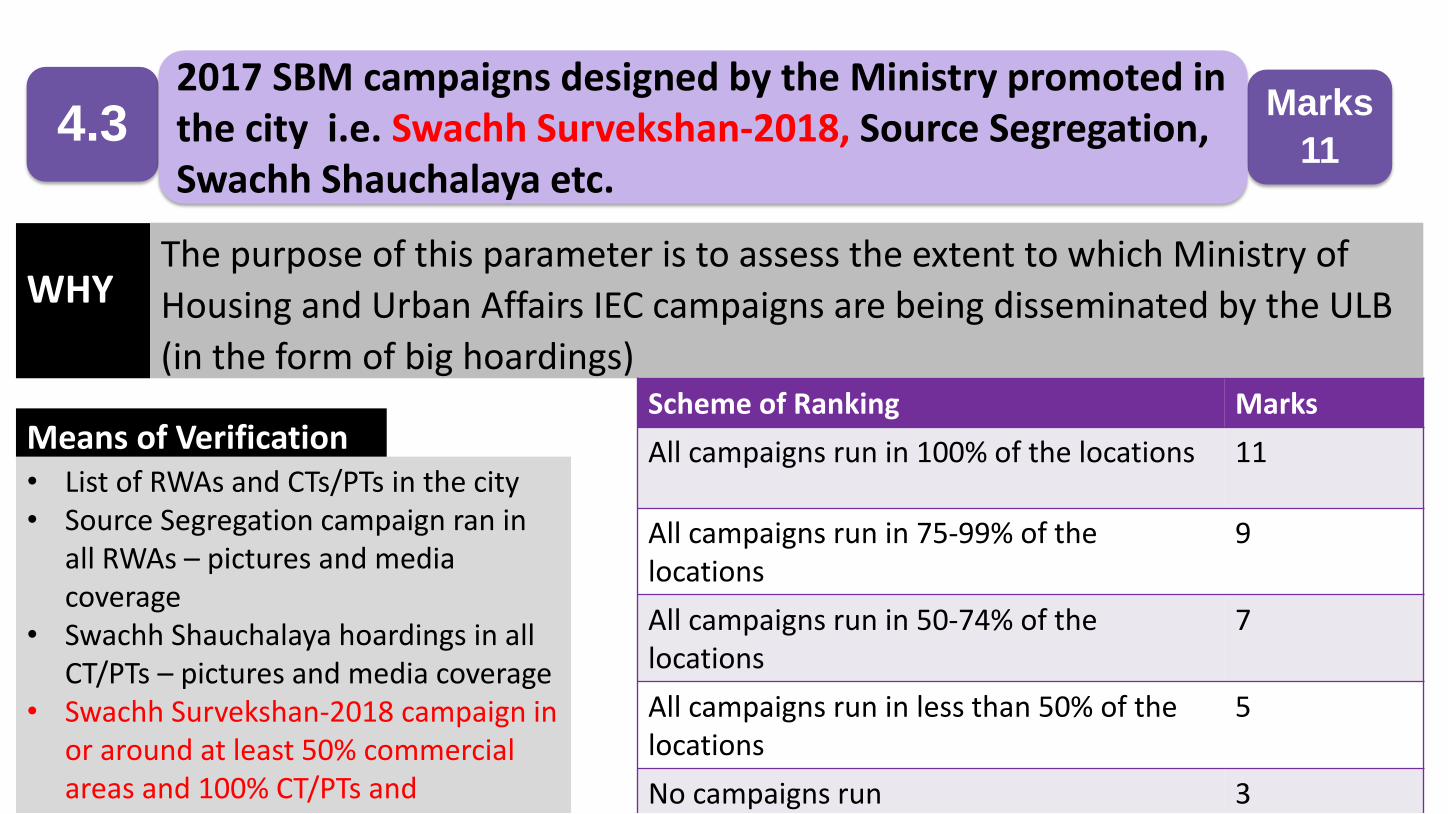
4.3Marks
11
2017 SBM campaigns designed by the Ministry promoted in the city i.e. Swachh Survekshan-2018, Source Segregation, Swachh Shauchalaya etc.
WHYThe purpose of this parameter is to assess the extent to which Ministry of
Housing and Urban Affairs IEC campaigns are being disseminated by the ULB
(in the form of big hoardings)
Means of Verification• List of RWAs and CTs/PTs in the city• Source Segregation campaign ran in
all RWAs – pictures and media coverage
• Swachh Shauchalaya hoardings in all CT/PTs – pictures and media coverage
• Swachh Survekshan-2018 campaign in or around at least 50% commercial areas and 100% CT/PTs and
Scheme of Ranking Marks
All campaigns run in 100% of the locations 11
All campaigns run in 75-99% of the locations
9
All campaigns run in 50-74% of the locations
7
All campaigns run in less than 50% of the locations
5
No campaigns run 3

Action Items
• Print and distribute campaign posters to all RWAs, requesting them to display prominently within premises and to share pictures of the same with ULB
• Print and display Swachh Shauchalaya posters at all CTs and PTs
• Swachh Survekshan-2018 posters/hoardings at all CTs, PTs and at 50% Commercial areas
• Capture pictures of displayed poster/hoarding

4.4Marks
6
SBM Brand Ambassadors - formally engaged for community engagement activities
WHYAs Swachh Bharat Mission is envisaged as a Jan-Andolan, involvement of all
sections of the city is vital for the achieving the mission objective. This parameter
would assess the involvement of SBM Brand Ambassadors with the ULB.
Means of Verification• Total number of Brand Ambassadors engaged by the ULB• Any religious leader/Doctor/prominent personality of the city,
who is willing to engage and drive citizens can be qualified as Brand Ambassador
• Evidence of activities undertaken by the ULBs in collaboration with the Brand Ambassadors – Media Clippings of last two quarters or photographic evidence
• Minimum 1 activity / month between August – December 2017• Independent activities undertaken by the Brand Ambassadors ,if
any
Scheme of Ranking Marks
100% Brand Ambassadors conducted monthly SBM related activities
6
75-99% Brand Ambassadors conducted monthly SBM related activities
4
50-74% Brand Ambassadors conducted monthly SBM related activities
2
No activities undertaken 0
Action Items
• Engage with Brand Ambassadors regularly to keep their interest in the mission constant
• Prepare month-wise activities/initiatives that can involve the ambassadors, keeping them in consultation
• Take monthly update from ambassadors on any independent activities related to SBM they may have been involved in

4.5Marks
6
Quarterly meetings held with RWAs, Religious Leaders, SHGs, to ensure messaging and activities for source segregation and decentralized composting
WHYAs Swachh Bharat Mission is envisaged as a Jan-Andolan, involvement of all sections of the city is
vital for achieving the mission objective. This parameter would assess the involvement of RWAs,
religious leaders and SHGs towards BCC for source segregation and decentralized
compostingMeans of Verification
• Document indicating total number of RWAs, Religious Leaders, SHGs that have agreed to collaborate with the ULB for promoting source segregation and decentralized composting
• Minutes of the Meetings held with above mentioned stakeholders and outcomes of previous meeting
Scheme of Ranking Marks
Quarterly meetings are held with all stakeholders
6
Quarterly meetings are held with some stakeholders
4
Irregular meetings are held 2
No meetings are held 0

Action Items
• Contact all RWAs, Religious Leaders, SHGs and obtain assent regarding their disseminating the message of segregation and decentralization and conducting related activities
• Engage with the RWAs, Religious Leaders, SHGs that have assented to convey uniform messaging on the two initiatives and prepare indicative list of activities that may be undertaken by them
• Felicitate RWAs, Religious Leader and Communities, SHGs that positively transform behaviour and efforts

4.6Marks
6Swachhata Committees functioning in all schools
WHYThis parameter assesses the extent of cleanliness related activities and focus of
schools in the city on cleanliness and hygiene within the premises.
Means of Verification
• Document indicating total number of schools in the city.
• Documentary evidence indicating formation of Swachhata Committee in the school
• Evidence of activities undertaken by the Swachhata Committee towards cleanliness and hygiene in the school premises.
Scheme of Ranking Marks
Swachhata Committee functioning in 100% schools
6
Swachhata Committee functioning in 75% - 99% schools
4
Swachhata Committee functioning in 50% - 75% schools
2
Swachhata Committee functioning in <50% schools
0
Action Items
• Engage with school Principals about the need to form SwachhataCommittees, for both school cleanliness & hygiene and creating awareness among students
• Prepare indicative roles and responsibilities of a model Committee (President, and other members) and share with all schools
• Conduct a monthly cleanliness audit of all schools through municipal staff/contracted agency, evaluating them by mapping whether the responsibilities of a model Committee are being undertaken regularly
• Felicitate and recognize (through local print media) schools doing well on the audit
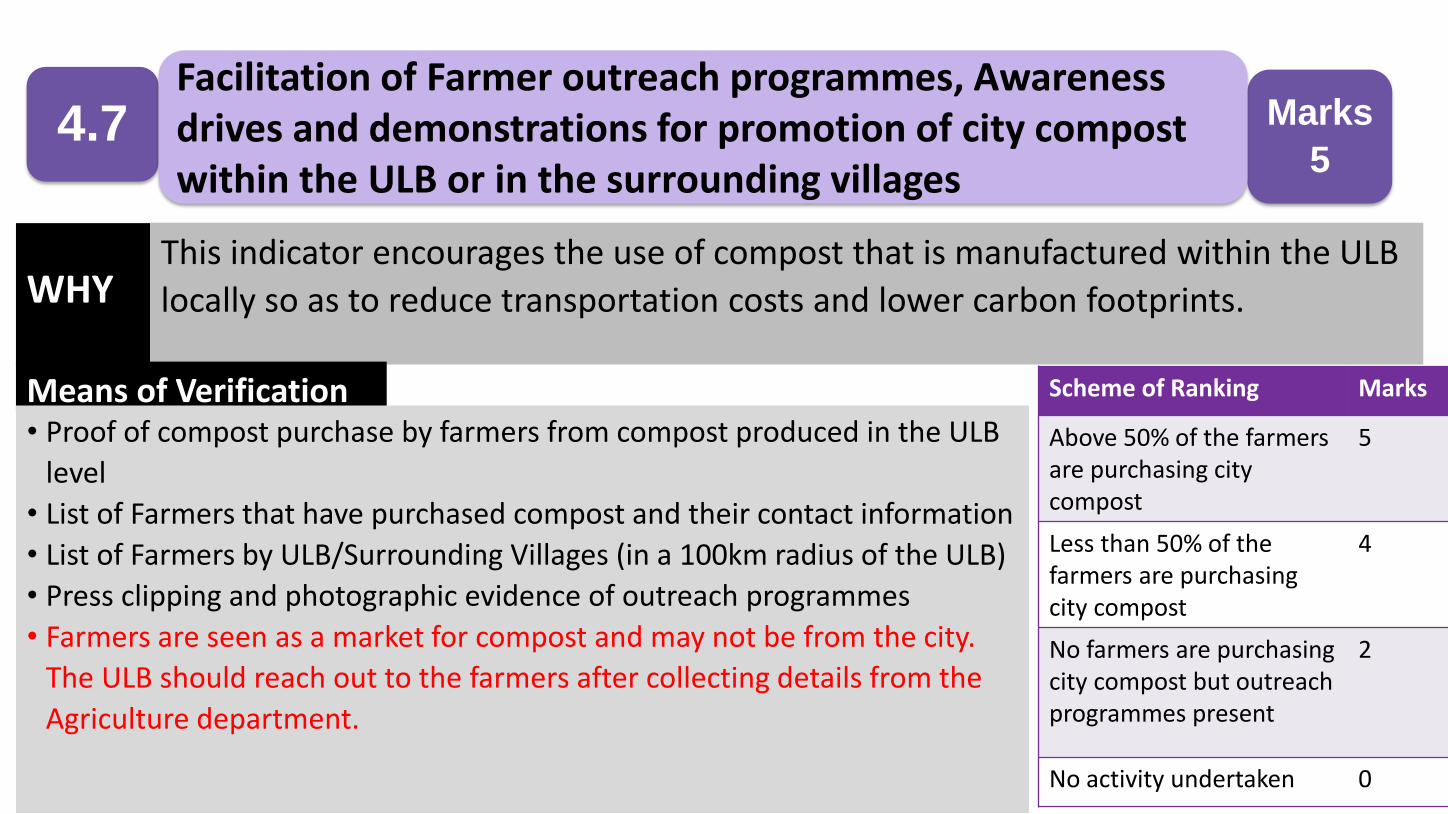
4.7 Marks
5
Facilitation of Farmer outreach programmes, Awareness drives and demonstrations for promotion of city compost within the ULB or in the surrounding villages
WHYThis indicator encourages the use of compost that is manufactured within the ULB
locally so as to reduce transportation costs and lower carbon footprints.
Means of Verification• Proof of compost purchase by farmers from compost produced in the ULB
level
• List of Farmers that have purchased compost and their contact information
• List of Farmers by ULB/Surrounding Villages (in a 100km radius of the ULB)
• Press clipping and photographic evidence of outreach programmes
• Farmers are seen as a market for compost and may not be from the city.
The ULB should reach out to the farmers after collecting details from the
Agriculture department.
Scheme of Ranking Marks
Above 50% of the farmers are purchasing city compost
5
Less than 50% of the farmers are purchasing city compost
4
No farmers are purchasing city compost but outreach programmes present
2
No activity undertaken 0
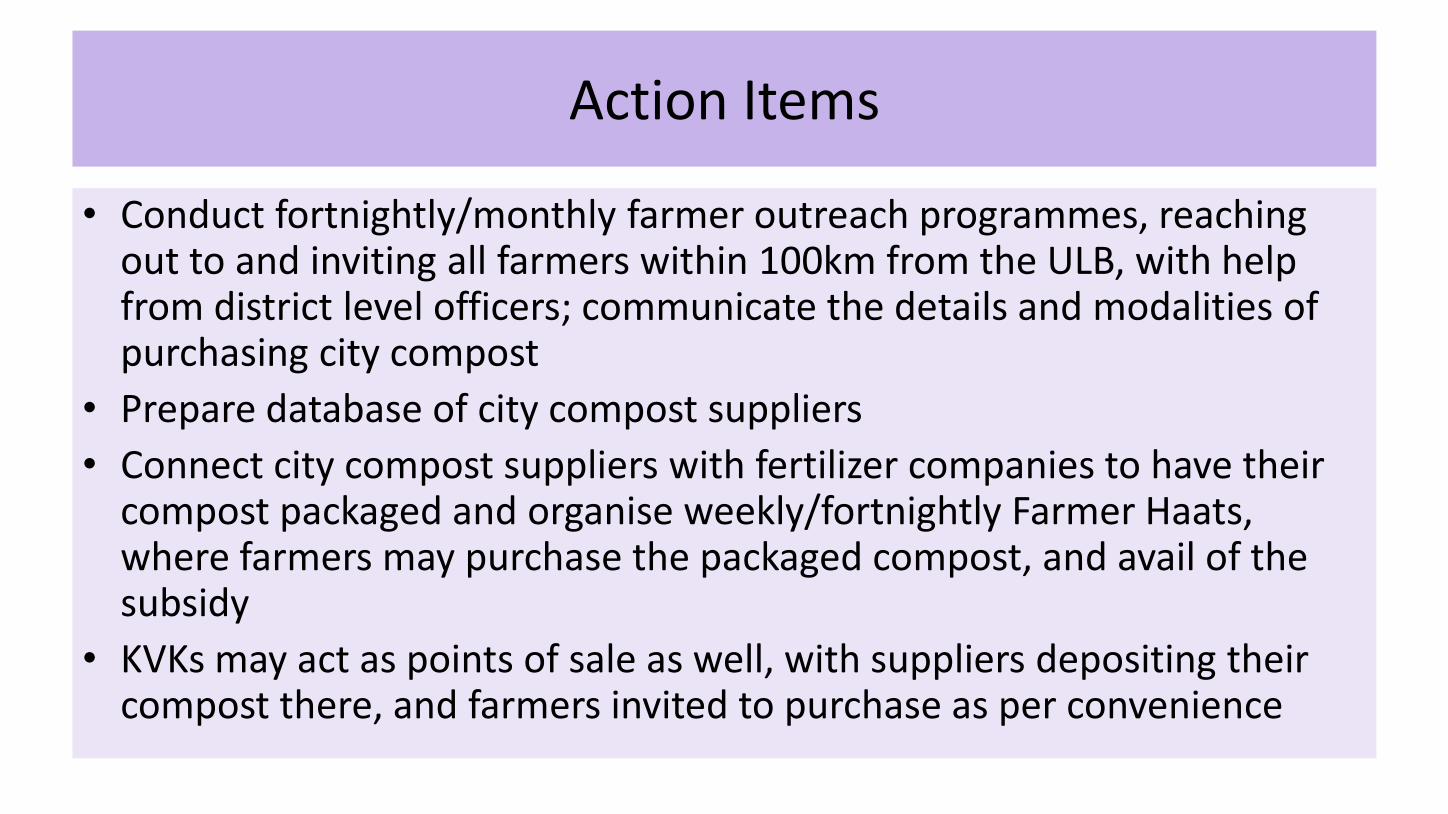
Action Items
• Conduct fortnightly/monthly farmer outreach programmes, reaching out to and inviting all farmers within 100km from the ULB, with help from district level officers; communicate the details and modalities of purchasing city compost
• Prepare database of city compost suppliers
• Connect city compost suppliers with fertilizer companies to have their compost packaged and organise weekly/fortnightly Farmer Haats, where farmers may purchase the packaged compost, and avail of the subsidy
• KVKs may act as points of sale as well, with suppliers depositing their compost there, and farmers invited to purchase as per convenience
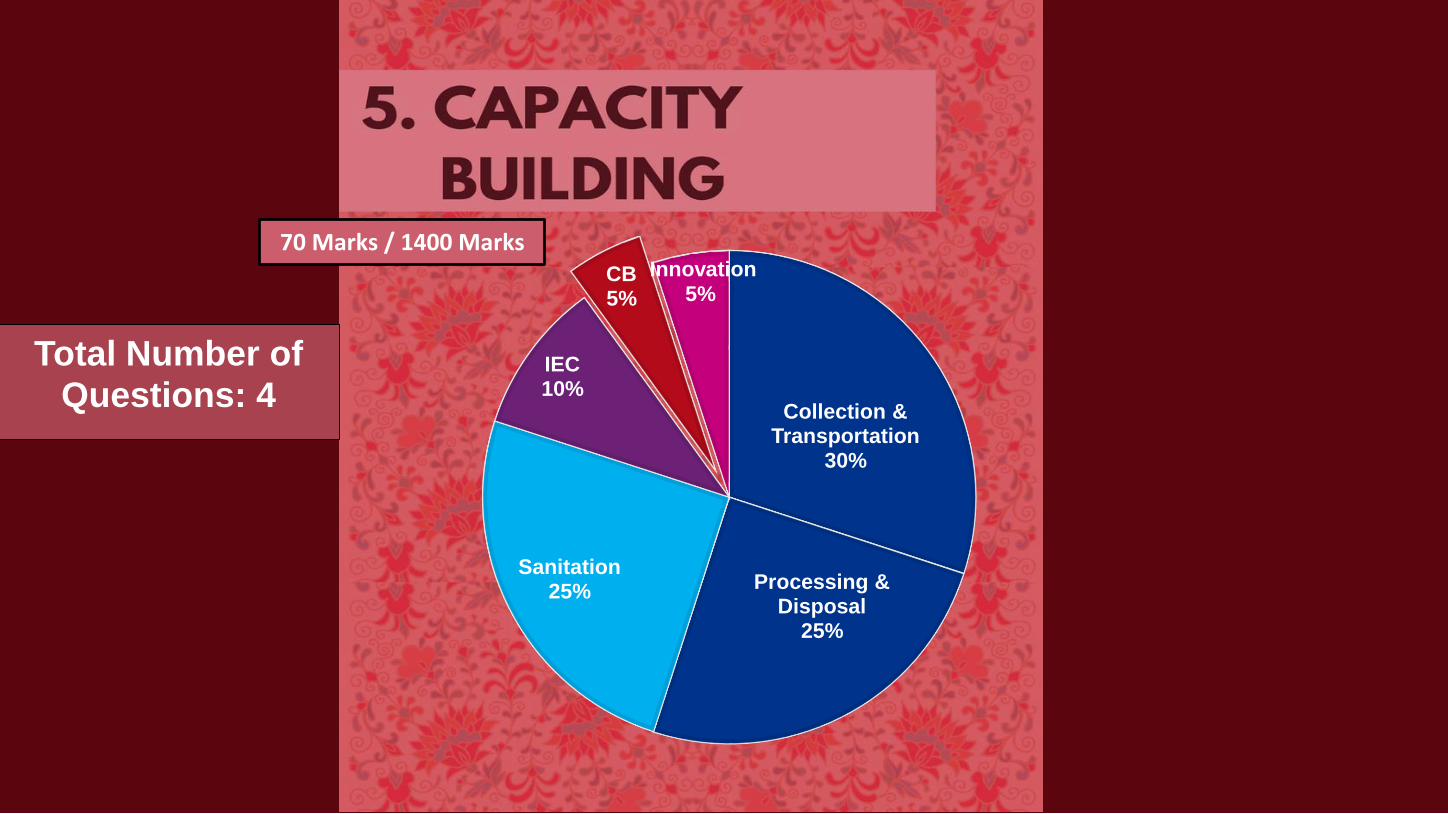
Total Number of Questions: 4
Collection & Transportation
30%
Processing & Disposal
25%
Sanitation25%
IEC10%
CB5% 5%
70 Marks / 1400 MarksInnovation
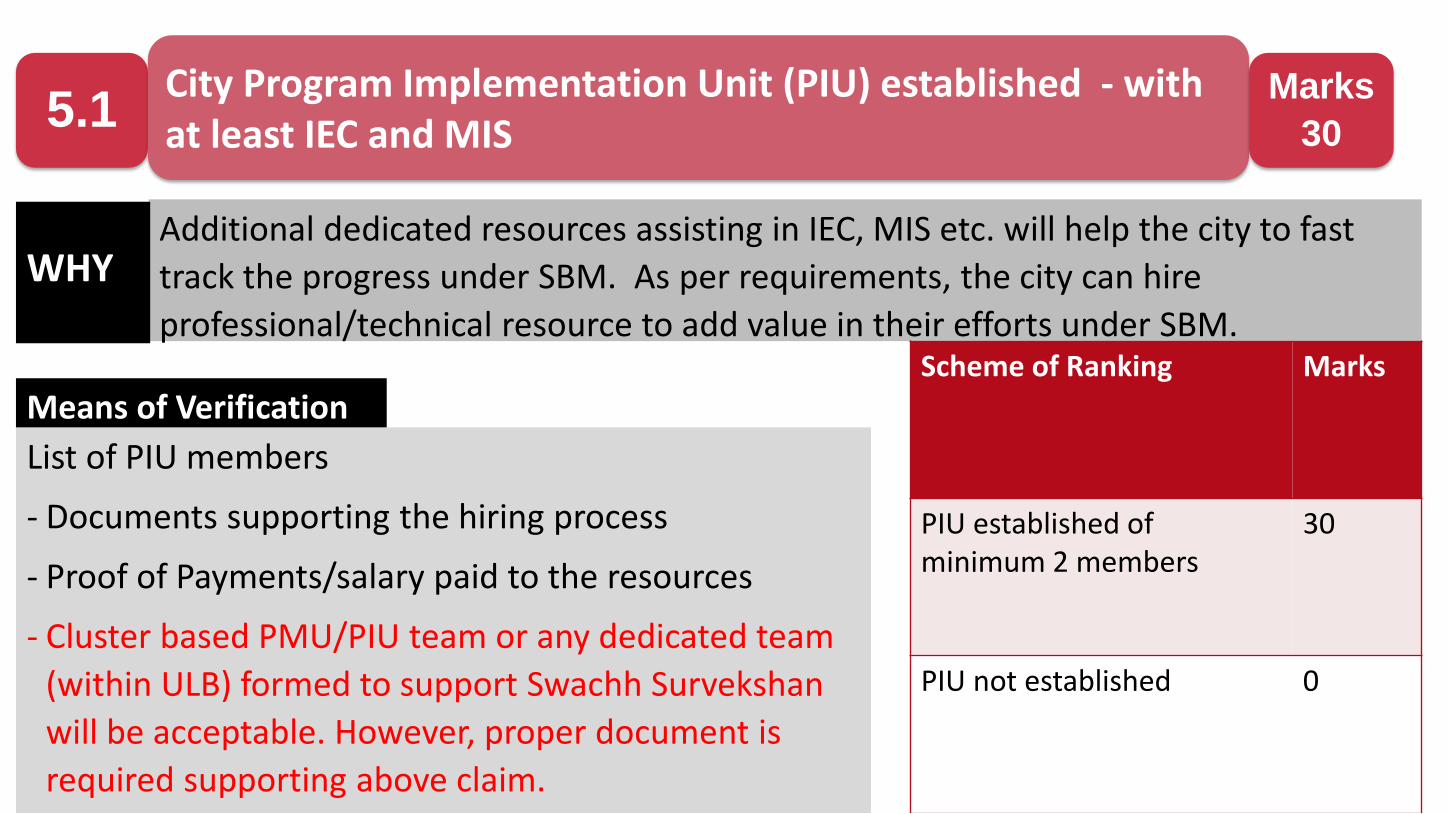
Additional dedicated resources assisting in IEC, MIS etc. will help the city to fast
track the progress under SBM. As per requirements, the city can hire
professional/technical resource to add value in their efforts under SBM.
List of PIU members
- Documents supporting the hiring process
- Proof of Payments/salary paid to the resources
- Cluster based PMU/PIU team or any dedicated team
(within ULB) formed to support Swachh Survekshan
will be acceptable. However, proper document is
required supporting above claim.
WHY
Means of Verification
5.1City Program Implementation Unit (PIU) established - with at least IEC and MIS
Marks
30
Scheme of Ranking Marks
PIU established of minimum 2 members
30
PIU not established 0

Action Items
• Ascertain the need for focused IEC initiatives and MIS solutions to support with SBM implementation
• Map the need with existing staff capabilities as well as the time that staff members can give to SBM activities daily/weekly/monthly
• Basis the mapping, if required, hire additional resources under SBM, according to the process defined
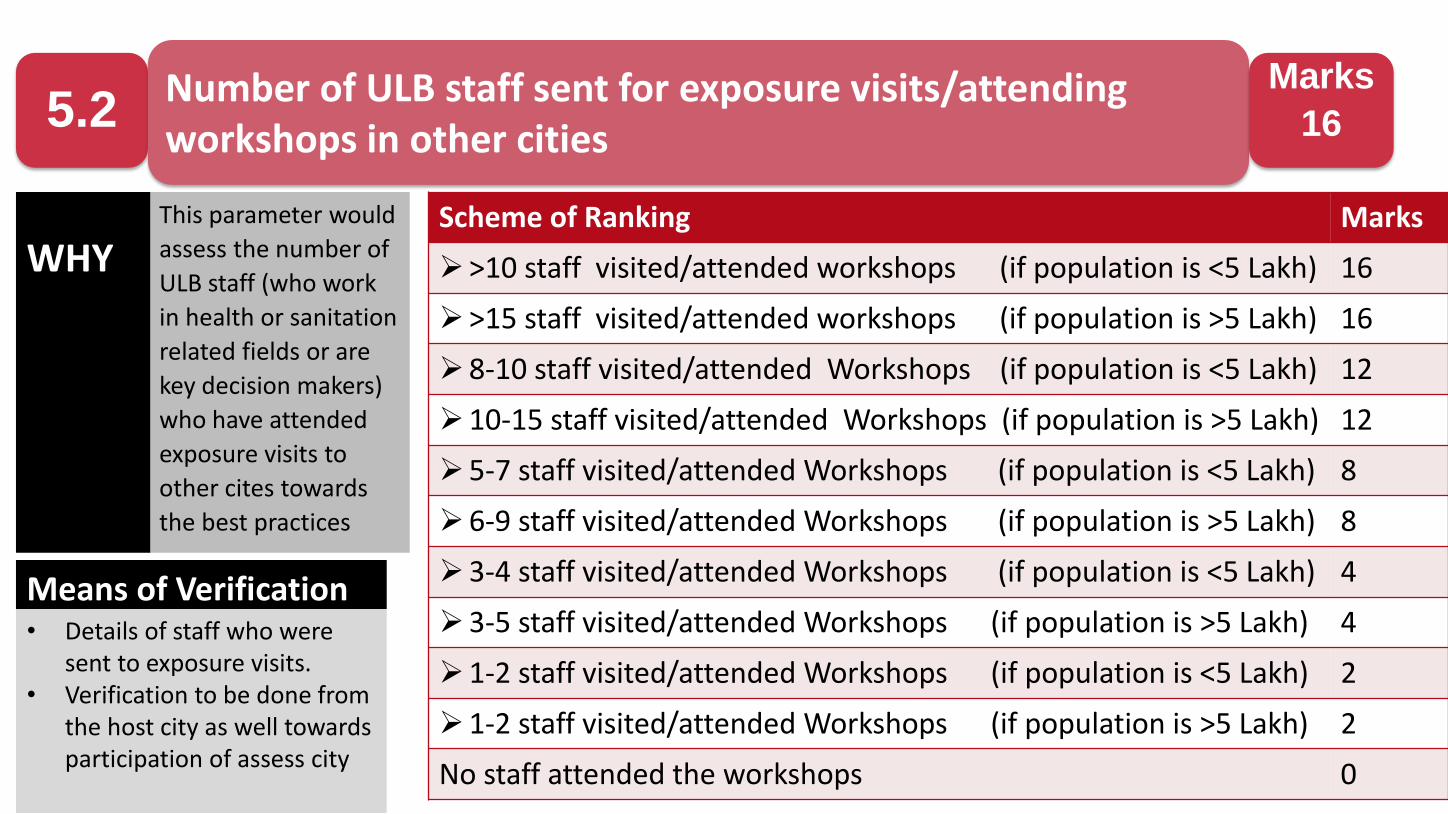
This parameter would
assess the number of
ULB staff (who work
in health or sanitation
related fields or are
key decision makers)
who have attended
exposure visits to
other cites towards
the best practices
• Details of staff who were sent to exposure visits.
• Verification to be done from the host city as well towards participation of assess city
WHY
Means of Verification
5.2Number of ULB staff sent for exposure visits/attending workshops in other cities
Marks
16
Scheme of Ranking Marks
>10 staff visited/attended workshops (if population is <5 Lakh) 16
>15 staff visited/attended workshops (if population is >5 Lakh) 16
8-10 staff visited/attended Workshops (if population is <5 Lakh) 12
10-15 staff visited/attended Workshops (if population is >5 Lakh) 12
5-7 staff visited/attended Workshops (if population is <5 Lakh) 8
6-9 staff visited/attended Workshops (if population is >5 Lakh) 8
3-4 staff visited/attended Workshops (if population is <5 Lakh) 4
3-5 staff visited/attended Workshops (if population is >5 Lakh) 4
1-2 staff visited/attended Workshops (if population is <5 Lakh) 2
1-2 staff visited/attended Workshops (if population is >5 Lakh) 2
No staff attended the workshops 0
Action Items
• Keep track of mails regarding capacity building exposure workshops, whether sent by national or state mission directorate
• Assess the capabilities of staff members for implementing SBM, and whether there are gaps under any components (for example, knowledge of C&D waste management)
• Basis the calendar of workshops as well as the required training, develop a plan for staff members to attend particular workshops
• Share nominations with host cities for every workshop
• Utilise SBM capacity building funds for travel and lodging of participating staff

This parameter assesses the ULB staff on capacity building initiatives undertaken by the ULBs.
The staff is required to undergo video tutorials on the portal followed by a set of questions that
need to answered in order to be certified.
• Course wise list of employees
who have completed the
elearning courses to be verified
by the assessor from data
available with the MoUD
• List of staff - Sanitary Inspector
and above.
WHY
Means of Verification
5.3eLearning Platform – Number of certifications undergone by ULB staff on the e-courses platform on SBM portal (Sanitary Inspector and Above)
Marks
12
Scheme of Ranking Marks
100% of the staff completed at lease 10 courses* 12
75 – 99% of the staff completed at lease 10 courses*
8
50 – 79% of the staff completed at lease 10 courses*
4
Less than 50% of the staff completed at lease 10 courses*
2
No staff is certified of the staff completed at lease 10 courses*
0
Action Items
• List all staff at these levels engaged in SBM activities in ULB, alongwith their roles and responsibilities for SBM
• Use the Ready Reckoner on eLearning portal to map roles to courses, depending on daily responsibilities and gap in knowledge
• Communicate the requirements with staff, and conduct weekly checks
• Track the total number of courses completed, per staff member and overall (revise the requirements accordingly, if needed)
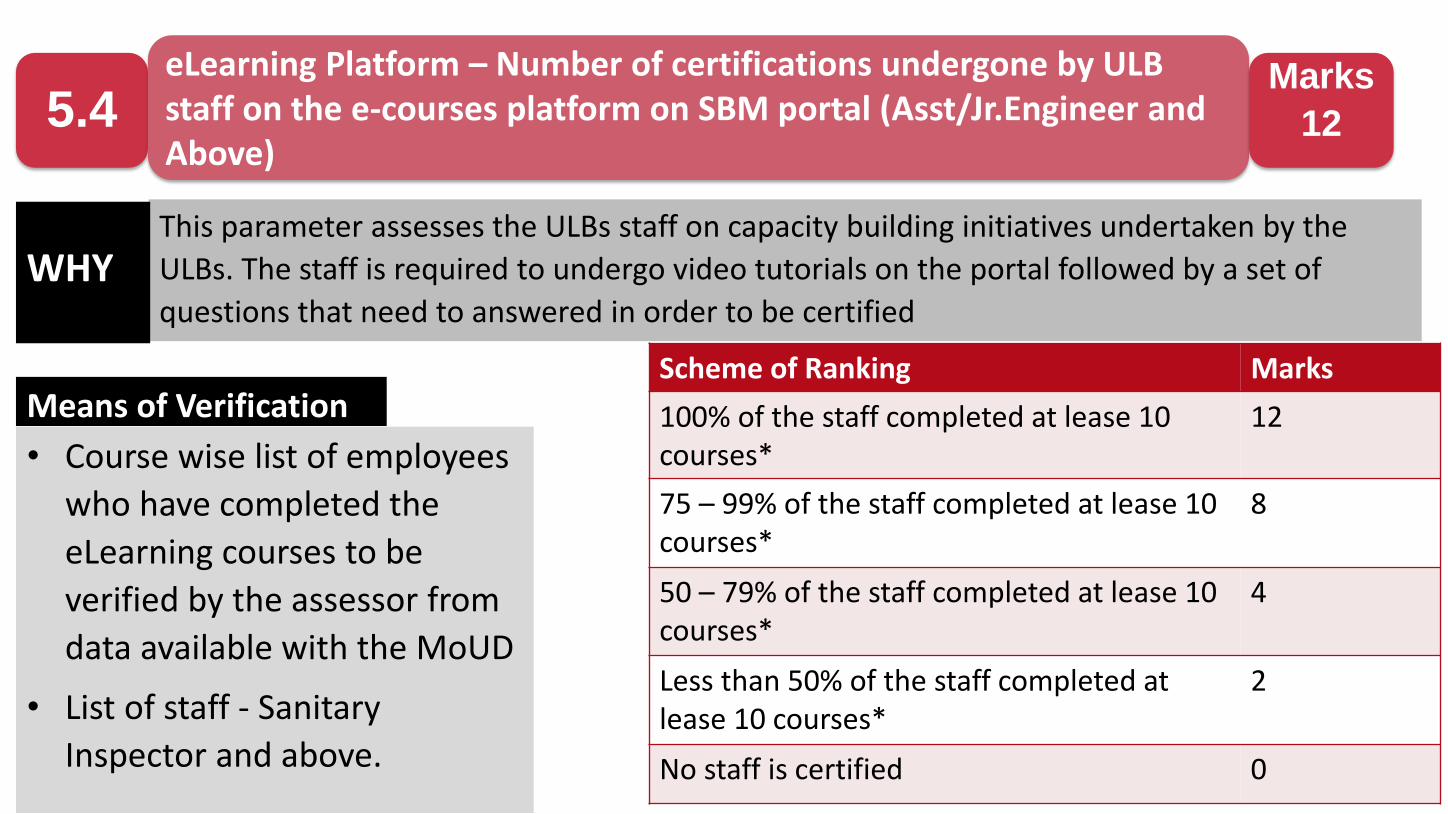
This parameter assesses the ULBs staff on capacity building initiatives undertaken by the
ULBs. The staff is required to undergo video tutorials on the portal followed by a set of
questions that need to answered in order to be certified
• Course wise list of employees
who have completed the
eLearning courses to be
verified by the assessor from
data available with the MoUD
• List of staff - Sanitary
Inspector and above.
WHY
Means of Verification
5.4eLearning Platform – Number of certifications undergone by ULB staff on the e-courses platform on SBM portal (Asst/Jr.Engineer and Above)
Marks
12
Scheme of Ranking Marks
100% of the staff completed at lease 10 courses*
12
75 – 99% of the staff completed at lease 10 courses*
8
50 – 79% of the staff completed at lease 10 courses*
4
Less than 50% of the staff completed at lease 10 courses*
2
No staff is certified 0

Action Items
• List all staff at these levels engaged in SBM activities in ULB, alongwith their roles and responsibilities for SBM
• Use the Ready Reckoner on eLearning portal to map roles to courses, depending on daily responsibilities and gap in knowledge
• Communicate the requirements with staff, and conduct weekly checks
• Track the total number of courses completed, per staff member and overall (revise the requirements accordingly, if needed)

Collection & Transportation
30%
Processing & Disposal
25%
Sanitation
30%
IEC5%
CB5%
5%
70 Marks / 1400 Marks
Innovation
Innovation
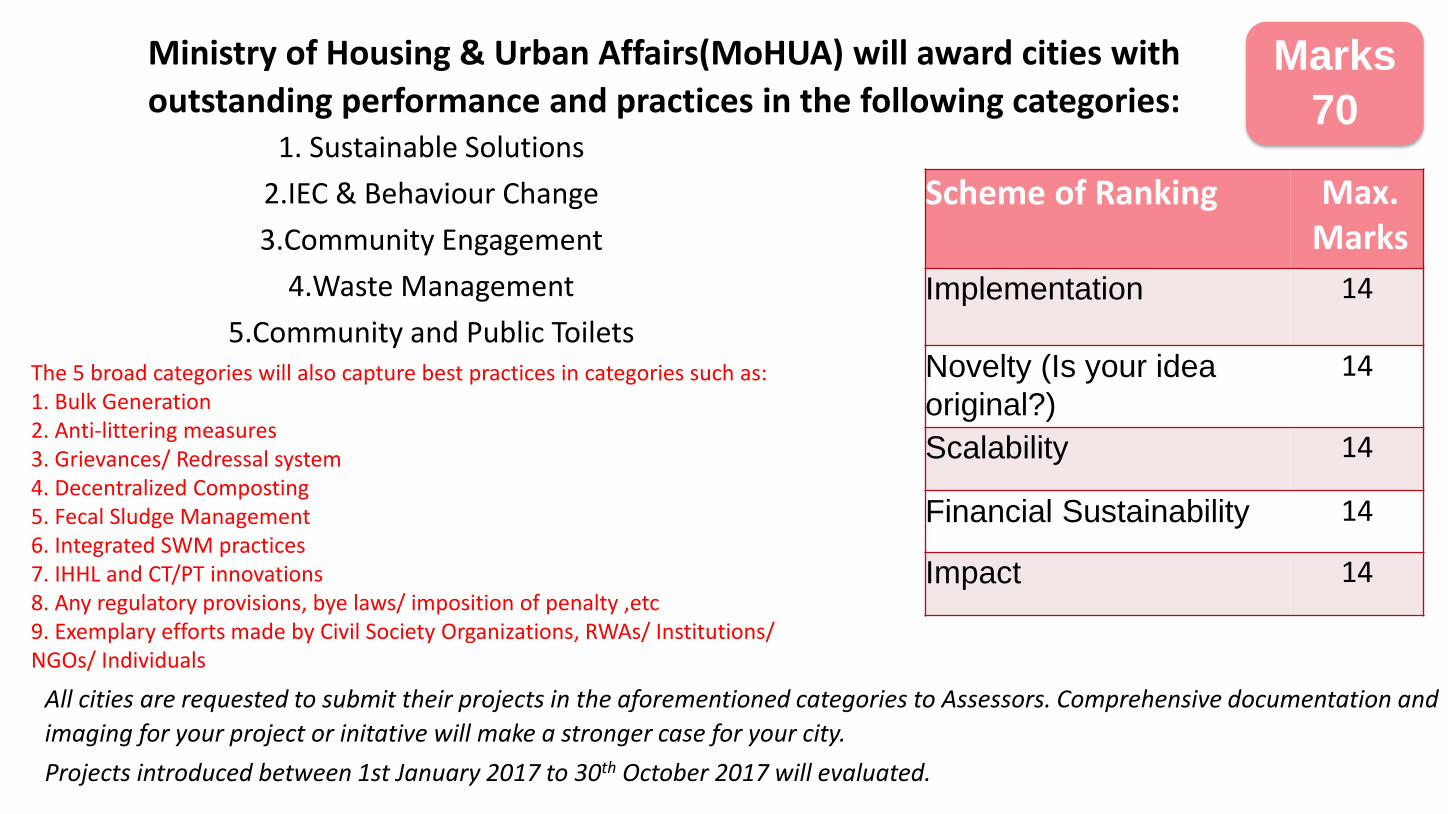
1. Sustainable Solutions
2.IEC & Behaviour Change
3.Community Engagement
4.Waste Management
5.Community and Public ToiletsThe 5 broad categories will also capture best practices in categories such as: 1. Bulk Generation2. Anti-littering measures3. Grievances/ Redressal system4. Decentralized Composting5. Fecal Sludge Management6. Integrated SWM practices7. IHHL and CT/PT innovations8. Any regulatory provisions, bye laws/ imposition of penalty ,etc9. Exemplary efforts made by Civil Society Organizations, RWAs/ Institutions/ NGOs/ Individuals
All cities are requested to submit their projects in the aforementioned categories to Assessors. Comprehensive documentation and
imaging for your project or initative will make a stronger case for your city.
Projects introduced between 1st January 2017 to 30th October 2017 will evaluated.
Ministry of Housing & Urban Affairs(MoHUA) will award cities with
outstanding performance and practices in the following categories:
Scheme of Ranking Max.Marks
Implementation 14
Novelty (Is your idea
original?)
14
Scalability 14
Financial Sustainability 14
Impact 14
Marks
70

Quick Action Points for 1355 (33%) marks
Component – 1 and 2
- Collection and Transportation
- Processing and Disposal
1. Transformation of GVP
2. Sale of city compost
3. Informal Waste Pickers
4. Registration on mFMS portal
Component- 3
- Sanitation
1. de-sludging operators registration
2. Notification for Petrol pumps
3. Updated SBM Portal 114 Marks
106 Marks
Service Level Progress
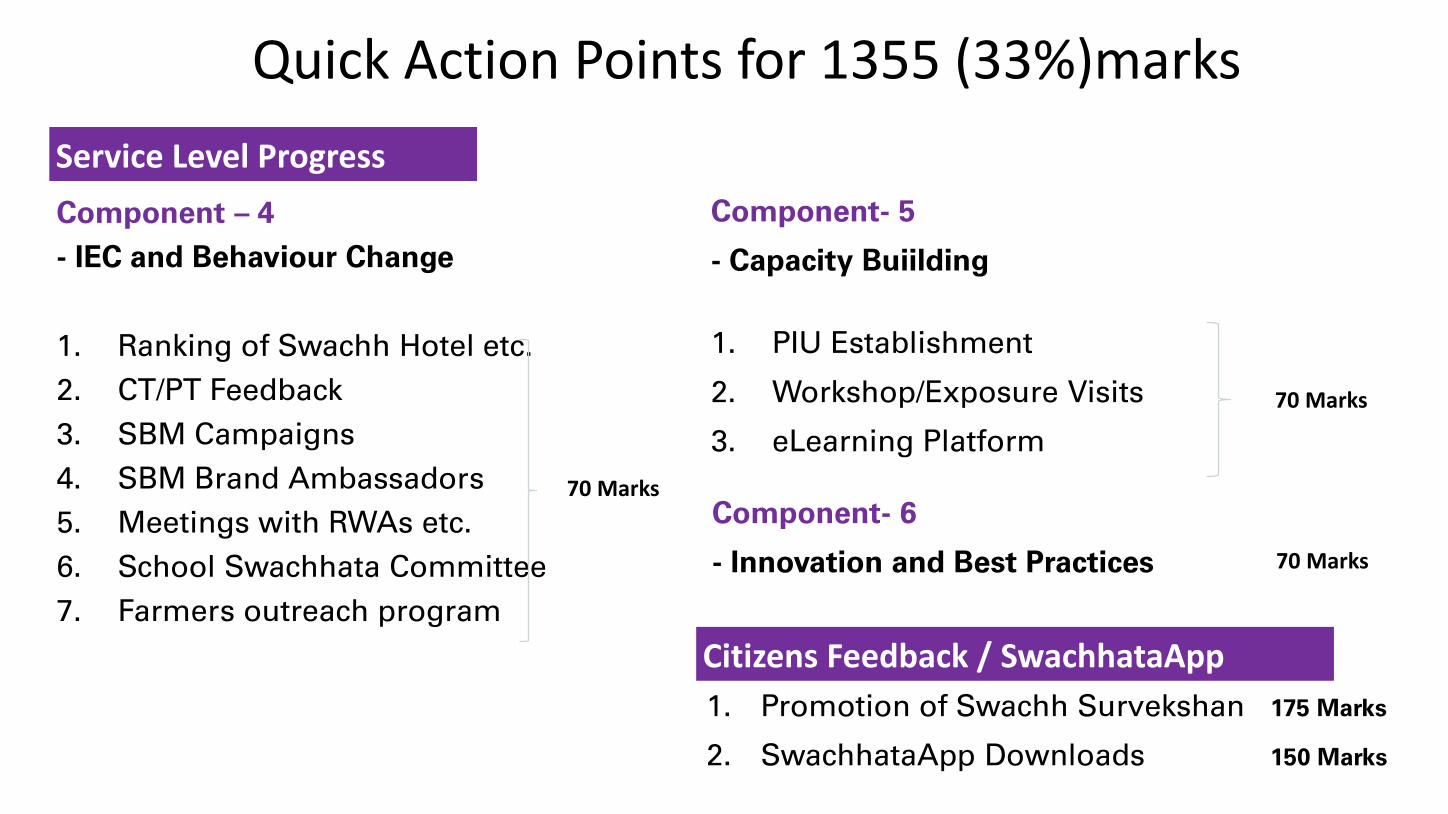
Quick Action Points for 1355 (33%)marks
Component – 4
- IEC and Behaviour Change
1. Ranking of Swachh Hotel etc.
2. CT/PT Feedback
3. SBM Campaigns
4. SBM Brand Ambassadors
5. Meetings with RWAs etc.
6. School Swachhata Committee
7. Farmers outreach program
Component- 5
- Capacity Buiilding
1. PIU Establishment
2. Workshop/Exposure Visits
3. eLearning Platform
70 Marks
70 Marks
Component- 6
- Innovation and Best Practices 70 Marks
1. Promotion of Swachh Survekshan 175 Marks
2. SwachhataApp Downloads 150 Marks
Service Level Progress
Citizens Feedback / SwachhataApp
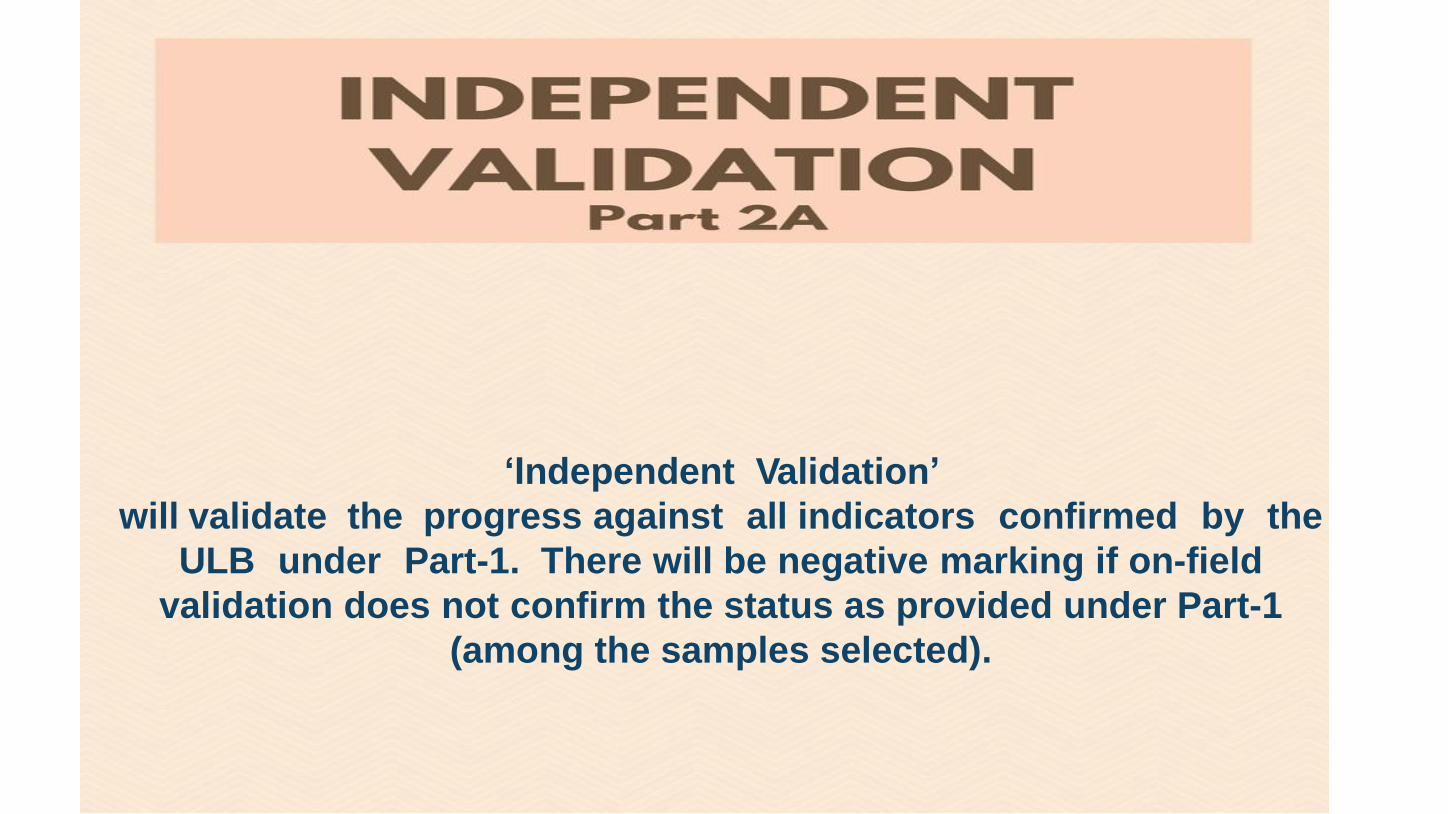
‘Independent Validation’
will validate the progress against all indicators confirmed by the
ULB under Part-1. There will be negative marking if on-field
validation does not confirm the status as provided under Part-1
(among the samples selected).
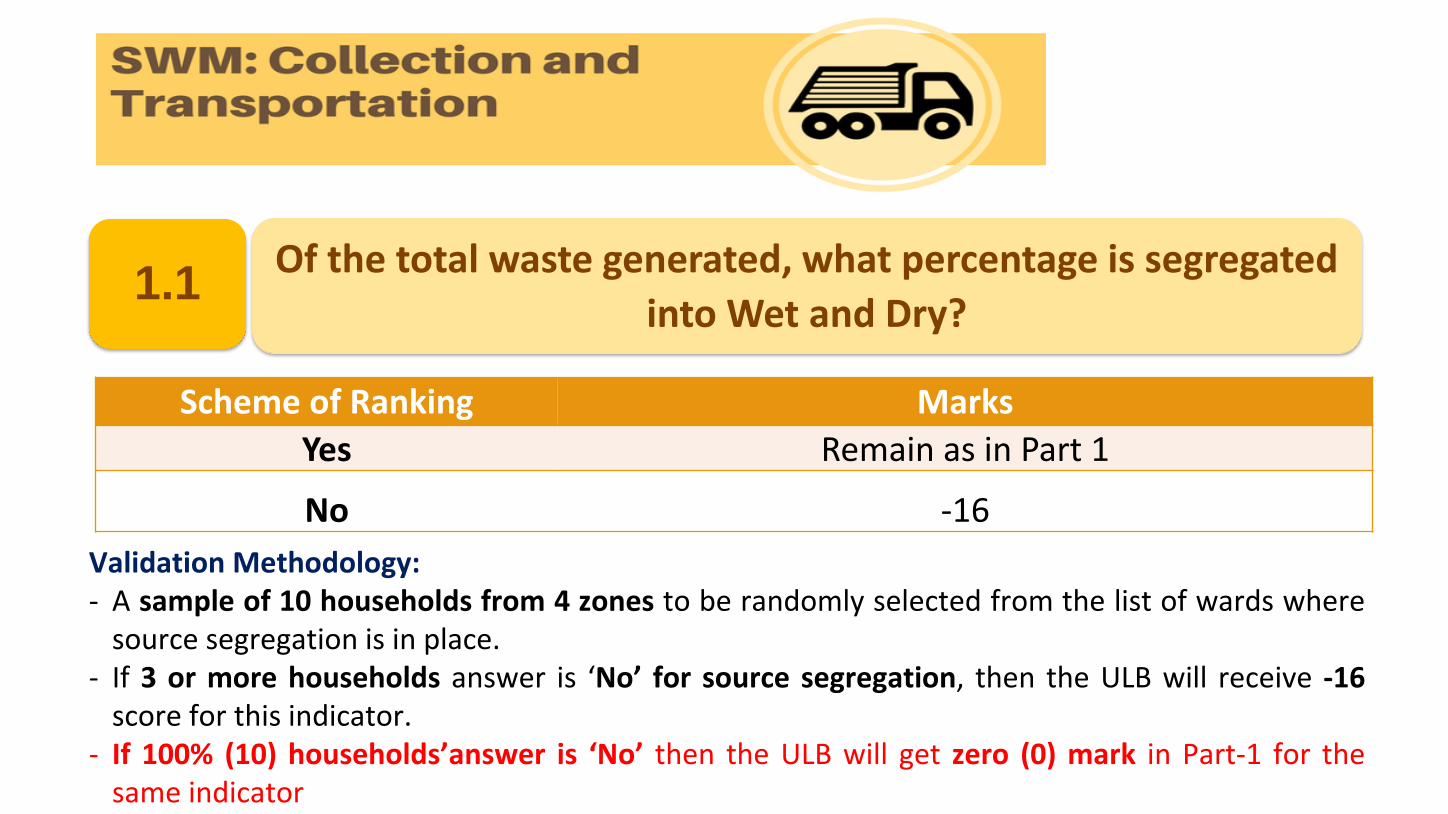
1.1Of the total waste generated, what percentage is segregated
into Wet and Dry?
Scheme of Ranking Marks
Yes Remain as in Part 1
No -16
Validation Methodology:- A sample of 10 households from 4 zones to be randomly selected from the list of wards where
source segregation is in place.- If 3 or more households answer is ‘No’ for source segregation, then the ULB will receive -16
score for this indicator.- If 100% (10) households’answer is ‘No’ then the ULB will get zero (0) mark in Part-1 for the
same indicator

a
1.2
Scheme of Ranking Marks
Yes Remain as in Part 1No -16
Validation Methodology:- A sample of 9 RWAs/Bulk Generators are to be randomly selected from the list
of parks practicing on-site composting. RWAs or Bulk Generator owners are todemonstrate the the practice of composting on site.
- If two or more RWAs/Owners fail to do so, then the ULB will receive -16 scorefor this indicator.
- If 100% (9) RWAs/Bulk Generators’answer is ‘No’ then the ULB will get zero (0)mark in Part-1 for the same indicator
Percentage of RWAs/Bulk Garbage generators practicing on-
site composting for processing organic waste

1.3Percentage of Commercial areas undertaking daily sweeping
and cleaning (twice a day, including night sweeping)
Validation Methodology:A sample of 9 vendors/shopkeepers to be randomly selected from the commercial area from different zones in which daily sweeping occurs.If 2 or more shopkeepers/vendors say ‘No’, then the ULB will receive -11 score for this indicatorIf 100% (9) Shopkeepers/vendors answer is ‘No’ then the ULB will get zero (0) mark in Part-1 for the same indicator
Scheme of Ranking Marks
Yes Remain as in Part 1
No -11

a
1.4
Scheme of Ranking Marks
Yes Remain as in Part 1No -11
Validation Methodology:- A sample of 7 wards (from 4 zones) are to be randomly selected from the list of
wards that are completely serviced by door-to-door collection system. In eachward 2 households are to be randomly asked if their waste is being collected.
- If 3 or more households answer is ‘No’, then the ULB will receive -11 score forthis indicator.
- If 100% (14) households’ answer is ‘No’ then the ULB will get zero (0) mark inPart-1 for the same indicator
Percentage coverage of area (wards) under door-to-door collection
system
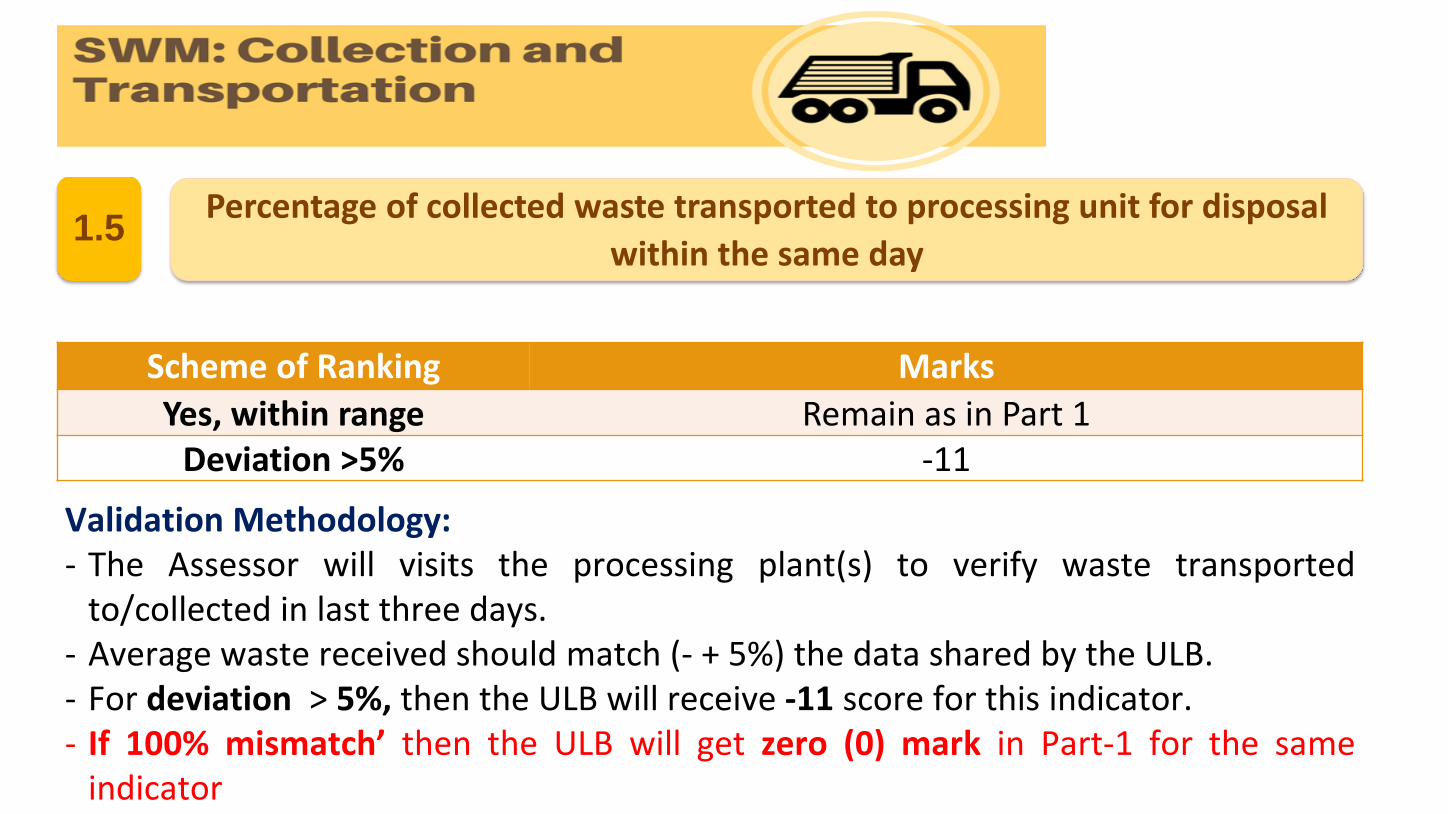
1.5Percentage of collected waste transported to processing unit for disposal
within the same day
Scheme of Ranking Marks
Yes, within range Remain as in Part 1Deviation >5% -11
Validation Methodology:- The Assessor will visits the processing plant(s) to verify waste transported
to/collected in last three days.- Average waste received should match (- + 5%) the data shared by the ULB.- For deviation > 5%, then the ULB will receive -11 score for this indicator.- If 100% mismatch’ then the ULB will get zero (0) mark in Part-1 for the same
indicator
a
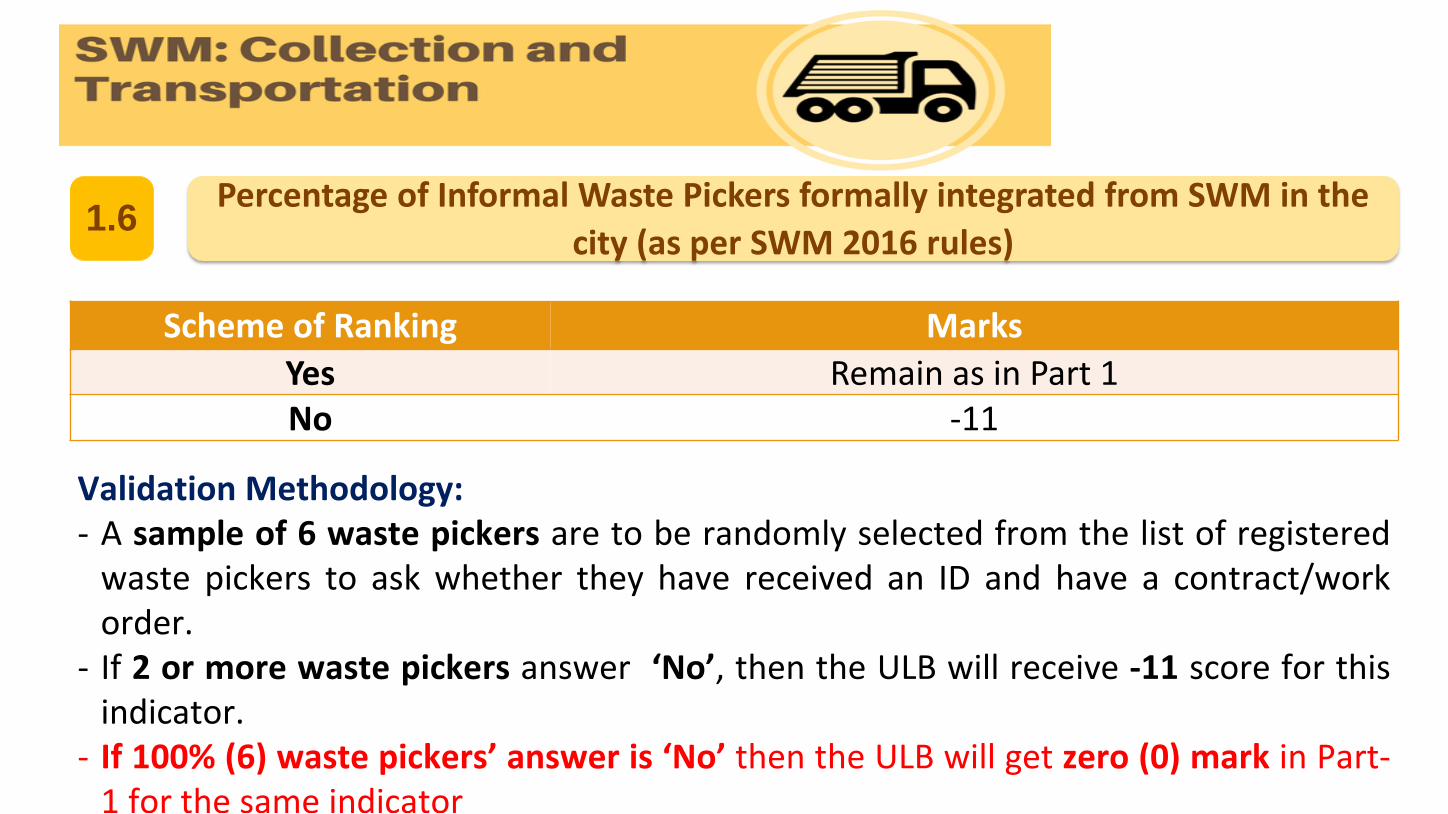
1.6
Scheme of Ranking Marks
Yes Remain as in Part 1No -11
Validation Methodology:- A sample of 6 waste pickers are to be randomly selected from the list of registered
waste pickers to ask whether they have received an ID and have a contract/workorder.
- If 2 or more waste pickers answer ‘No’, then the ULB will receive -11 score for thisindicator.
- If 100% (6) waste pickers’ answer is ‘No’ then the ULB will get zero (0) mark in Part-1 for the same indicator
Percentage of Informal Waste Pickers formally integrated from SWM in the
city (as per SWM 2016 rules)
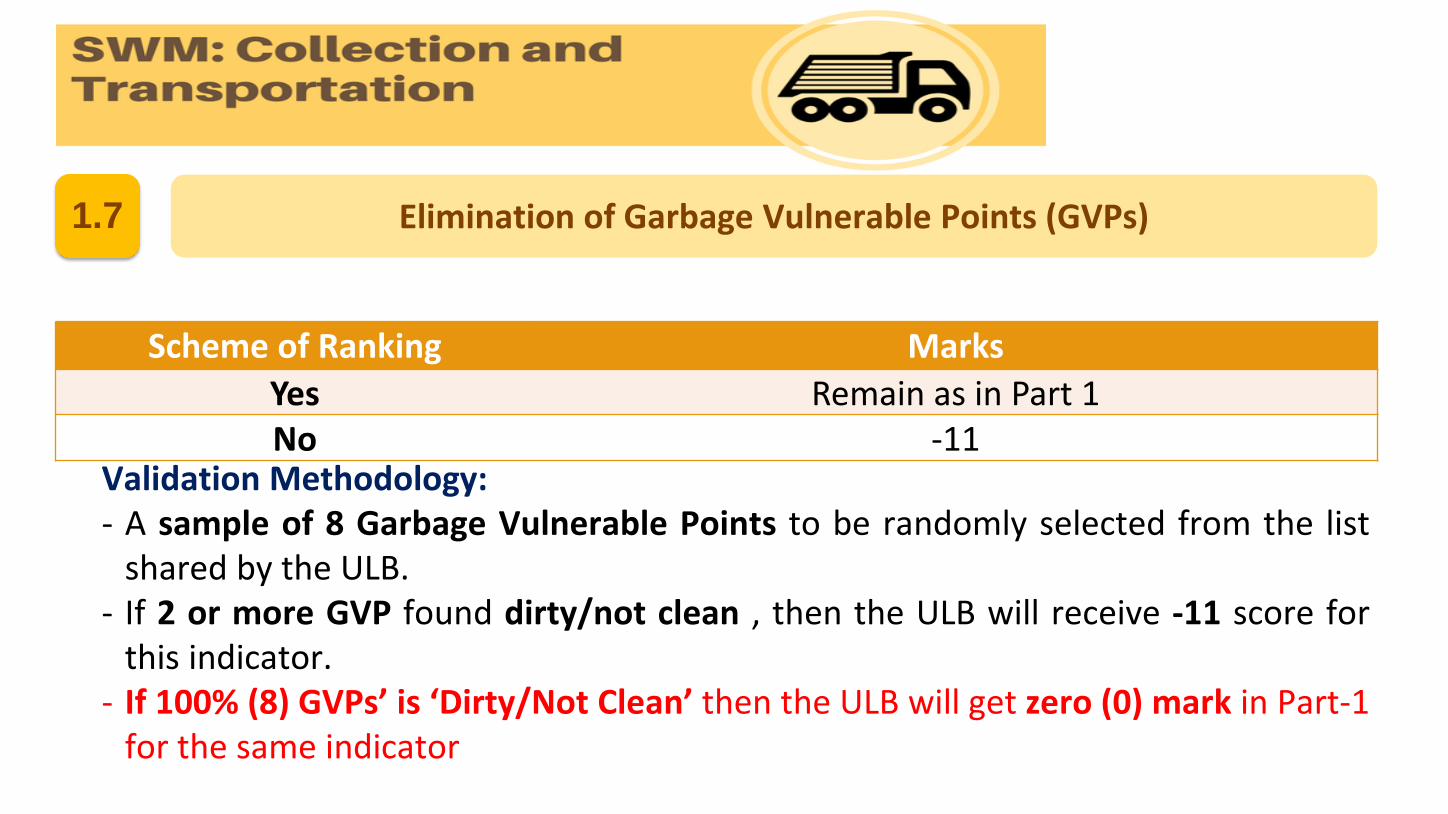
1.7 Elimination of Garbage Vulnerable Points (GVPs)
Scheme of Ranking Marks
Yes Remain as in Part 1No -11
Validation Methodology:- A sample of 8 Garbage Vulnerable Points to be randomly selected from the list
shared by the ULB.- If 2 or more GVP found dirty/not clean , then the ULB will receive -11 score for
this indicator.- If 100% (8) GVPs’ is ‘Dirty/Not Clean’ then the ULB will get zero (0) mark in Part-1
for the same indicator
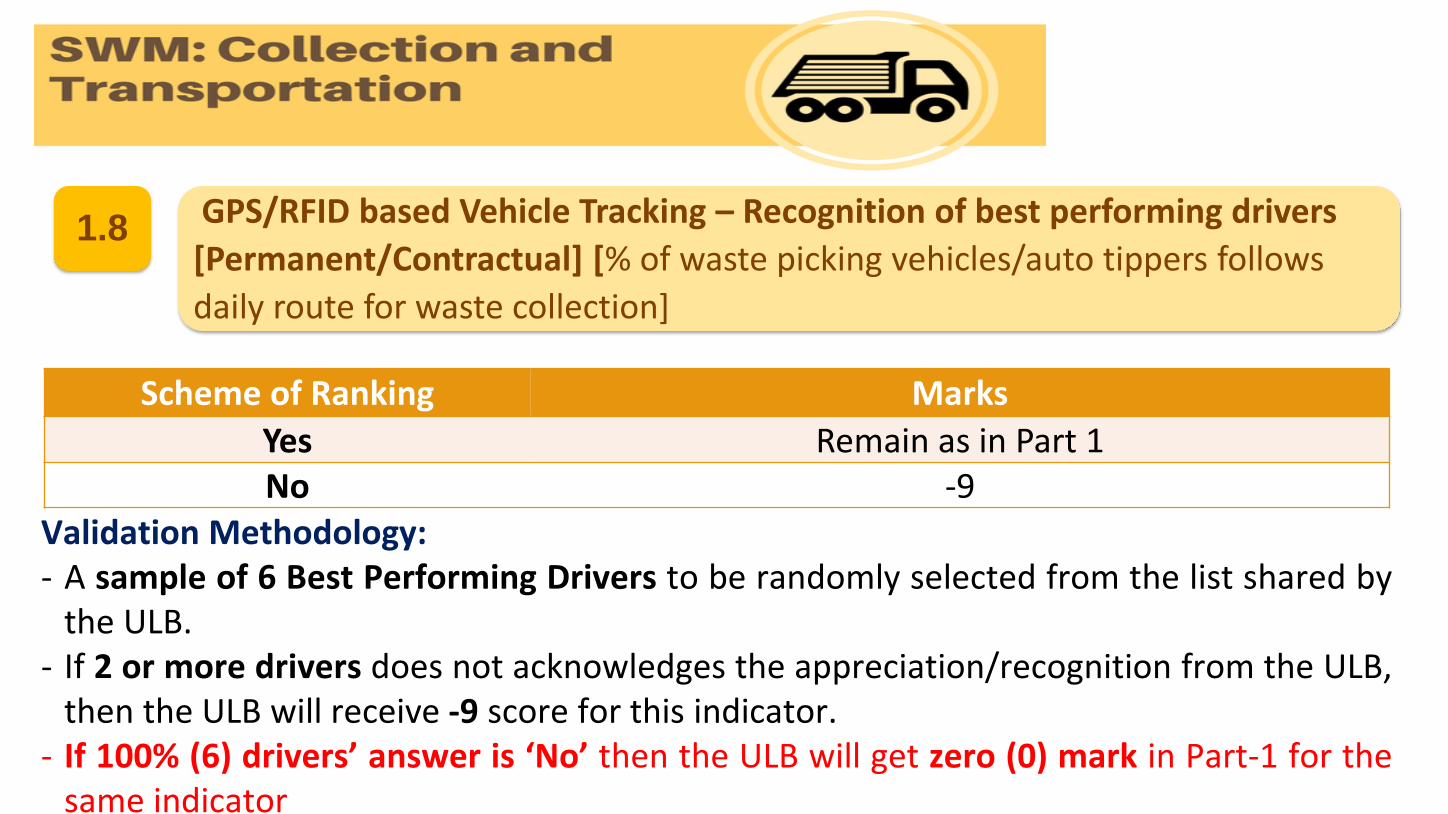
1.8GPS/RFID based Vehicle Tracking – Recognition of best performing drivers
[Permanent/Contractual] [% of waste picking vehicles/auto tippers follows
daily route for waste collection]
Scheme of Ranking Marks
Yes Remain as in Part 1No -9
Validation Methodology:- A sample of 6 Best Performing Drivers to be randomly selected from the list shared by
the ULB.- If 2 or more drivers does not acknowledges the appreciation/recognition from the ULB,
then the ULB will receive -9 score for this indicator.- If 100% (6) drivers’ answer is ‘No’ then the ULB will get zero (0) mark in Part-1 for the
same indicator
a
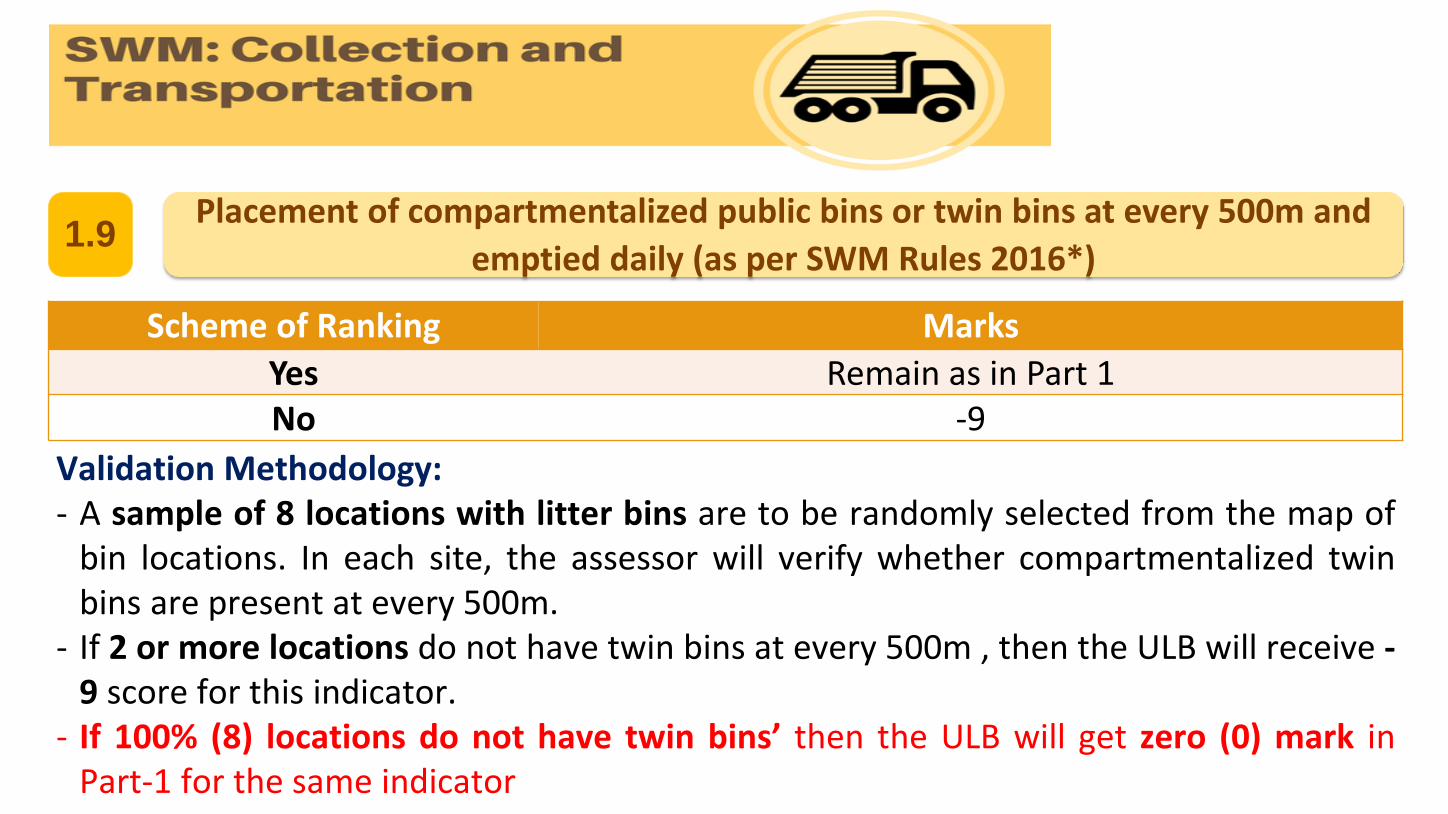
1.9
Scheme of Ranking Marks
Yes Remain as in Part 1No -9
Validation Methodology:- A sample of 8 locations with litter bins are to be randomly selected from the map of
bin locations. In each site, the assessor will verify whether compartmentalized twinbins are present at every 500m.
- If 2 or more locations do not have twin bins at every 500m , then the ULB will receive -9 score for this indicator.
- If 100% (8) locations do not have twin bins’ then the ULB will get zero (0) mark inPart-1 for the same indicator
Placement of compartmentalized public bins or twin bins at every 500m and
emptied daily (as per SWM Rules 2016*)
a
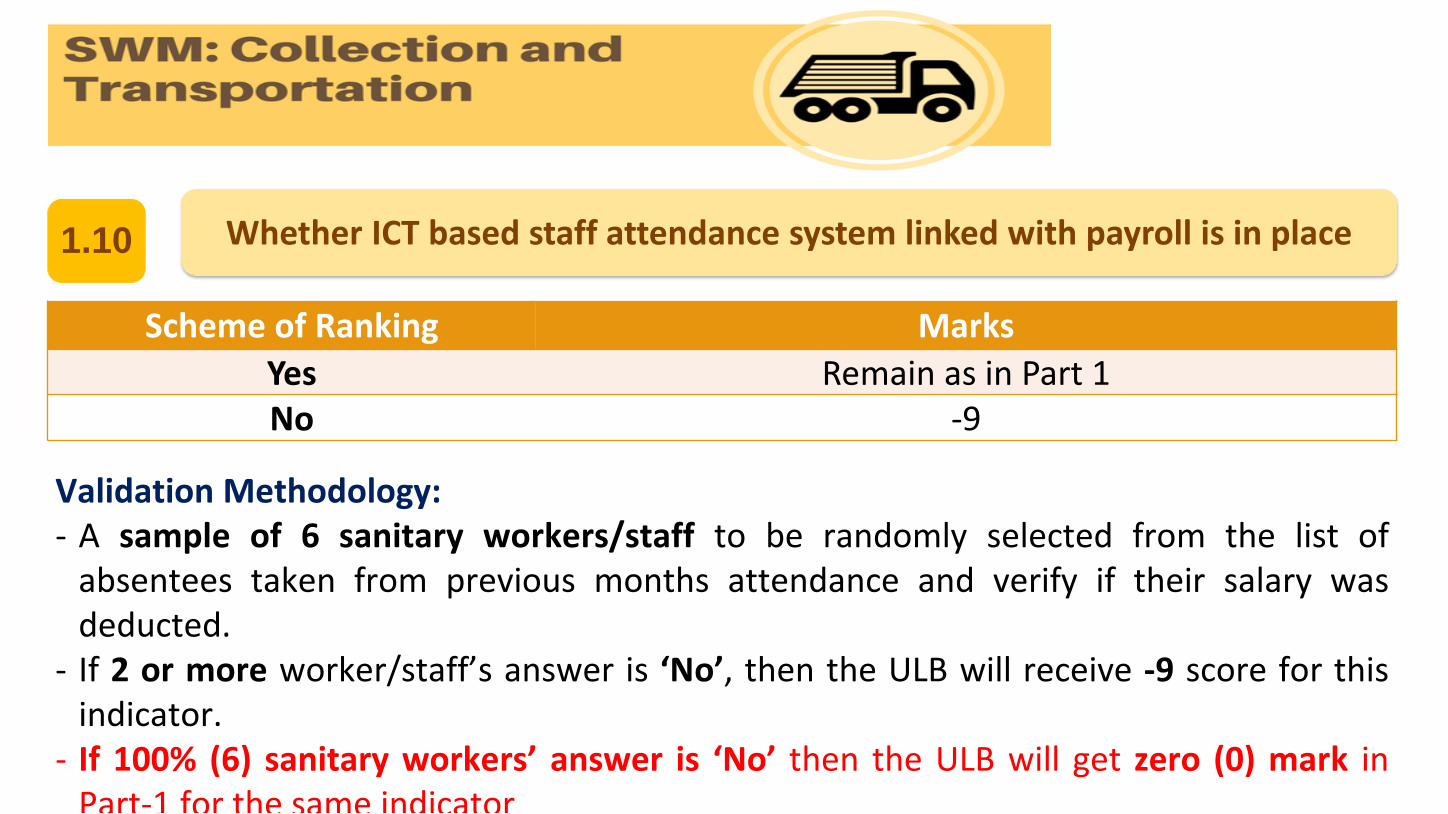
Whether ICT based staff attendance system linked with payroll is in place1.10
Scheme of Ranking Marks
Yes Remain as in Part 1No -9
Validation Methodology:- A sample of 6 sanitary workers/staff to be randomly selected from the list of
absentees taken from previous months attendance and verify if their salary wasdeducted.
- If 2 or more worker/staff’s answer is ‘No’, then the ULB will receive -9 score for thisindicator.
- If 100% (6) sanitary workers’ answer is ‘No’ then the ULB will get zero (0) mark inPart-1 for the same indicator

1.11 removed from Independent validation
Spot Fine –Notification issued and fine collected
Scheme of Ranking Marks
Yes Remain as in Part 1No -9
Validation Methodology:- A sample of 9 Challans/receipts to be randomly selected from the Challan book with
name and contact details of the offender.- If two or more offenders deny the challan/receipt then the ULB will receive -9 score
for this indicator.- If 100% (9) offenders’ answer is ‘No’ then the ULB will get zero (0) mark in Part-1 for
the same indicator

a
1.12
Scheme of Ranking Marks
Yes Remain as in Part 1No -9
Validation Methodology:- A sample of 9 parks and gardens are to be randomly selected from the list of parks
practicing on-site composting. Park officials are to demonstrate the the practice ofcomposting on site.
- If two or more park officials fail to do so, then the ULB will receive -9 score for thisindicator.
- If 100% (9) park officials’ are unable to demonstrate, then the ULB will get zero (0)mark in Part-1 for the same indicator
Percentage of city parks and gardens (maintained by government/public
department) practicing on-site composting of garden waste

a
1.13
Scheme of Ranking Marks
Yes Remain as in Part 1
No -6
Validation Methodology:- A sample of 6 workers are to be randomly selected from the list of all SWM workers. Each
will be checked whether they are wearing personal protection equipment- If two or more workers say ‘No’, then the ULB will receive -6 score for this indicator.- If 100% (6) workers’ answer is ‘No’ then the ULB will get zero (0) mark in Part-1 for the
same indicator
Provision of personal protection equipment (including uniform, fluorescent
jacket, hand gloves, raincoats, appropriate foot wear and masks) to all workers
handling solid waste and the same are used by the workforce
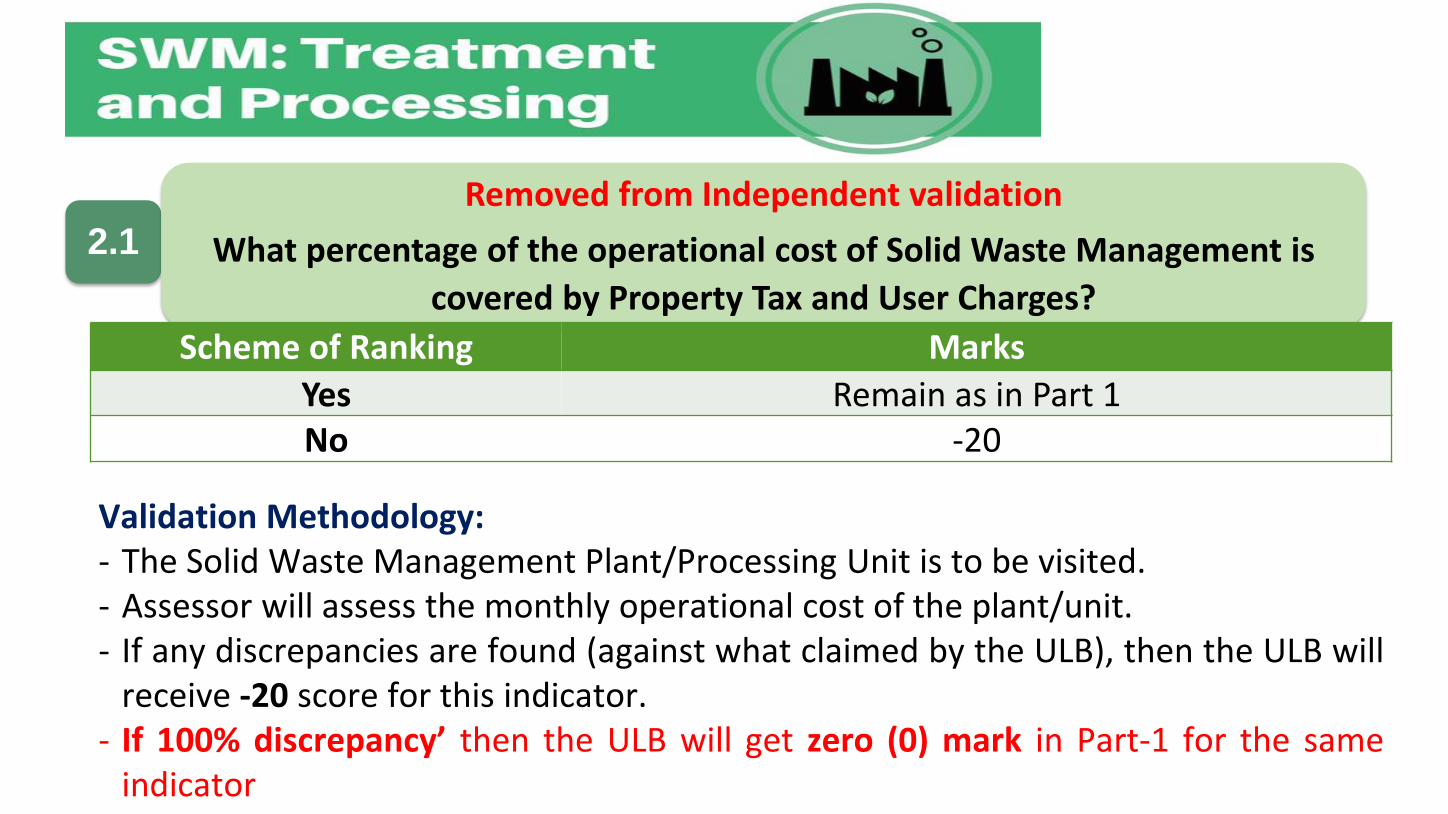
2.1
Removed from Independent validation
What percentage of the operational cost of Solid Waste Management is
covered by Property Tax and User Charges?
Scheme of Ranking Marks
Yes Remain as in Part 1No -20
Validation Methodology:- The Solid Waste Management Plant/Processing Unit is to be visited.- Assessor will assess the monthly operational cost of the plant/unit.- If any discrepancies are found (against what claimed by the ULB), then the ULB will
receive -20 score for this indicator.- If 100% discrepancy’ then the ULB will get zero (0) mark in Part-1 for the same
indicator
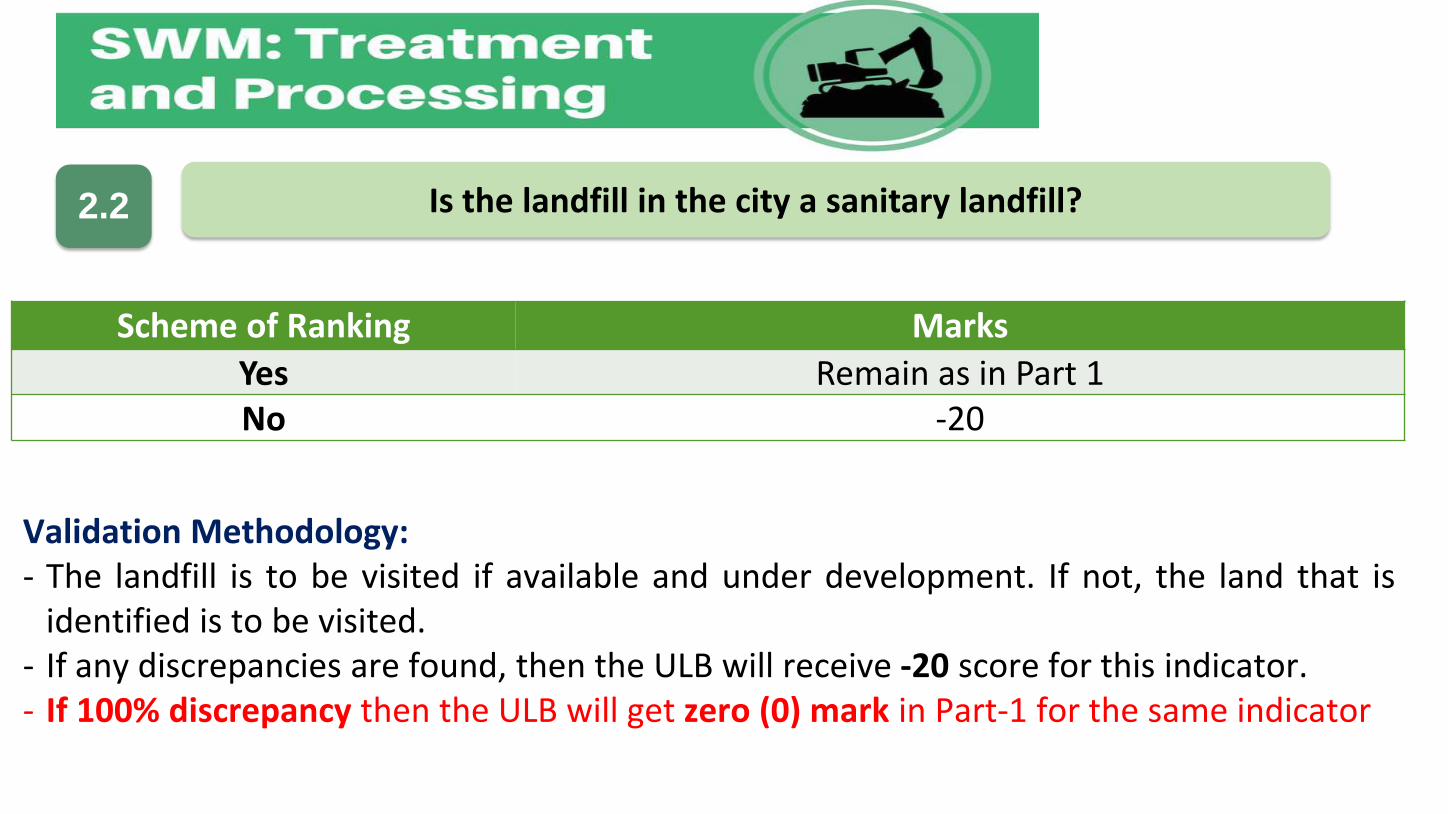
2.2 Is the landfill in the city a sanitary landfill?
Scheme of Ranking Marks
Yes Remain as in Part 1No -20
Validation Methodology:- The landfill is to be visited if available and under development. If not, the land that is
identified is to be visited.- If any discrepancies are found, then the ULB will receive -20 score for this indicator.- If 100% discrepancy then the ULB will get zero (0) mark in Part-1 for the same indicator
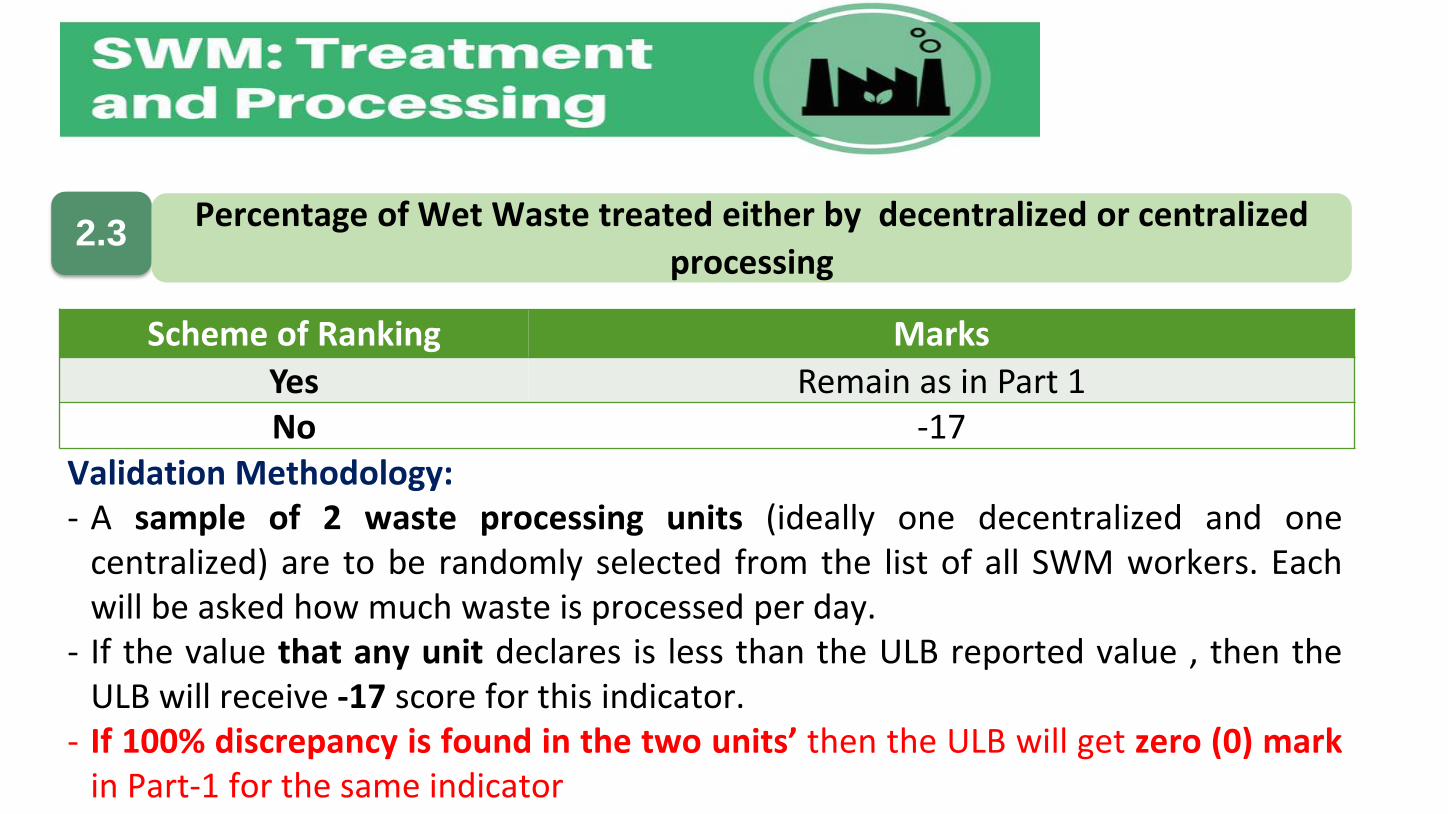
2.3Percentage of Wet Waste treated either by decentralized or centralized
processing
Scheme of Ranking Marks
Yes Remain as in Part 1No -17
Validation Methodology:- A sample of 2 waste processing units (ideally one decentralized and one
centralized) are to be randomly selected from the list of all SWM workers. Eachwill be asked how much waste is processed per day.
- If the value that any unit declares is less than the ULB reported value , then theULB will receive -17 score for this indicator.
- If 100% discrepancy is found in the two units’ then the ULB will get zero (0) markin Part-1 for the same indicator
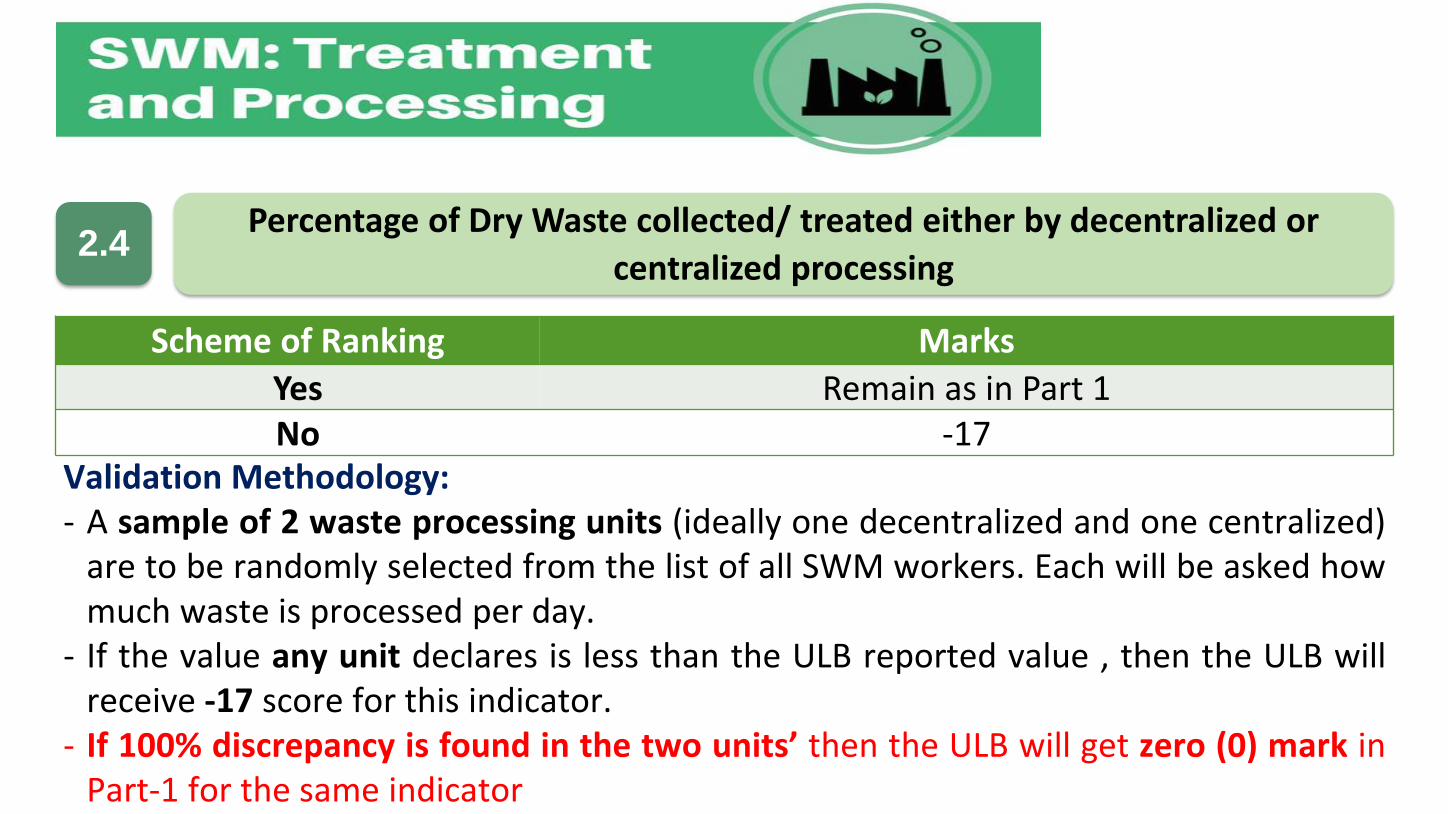
2.4Percentage of Dry Waste collected/ treated either by decentralized or
centralized processing
Scheme of Ranking Marks
Yes Remain as in Part 1No -17
Validation Methodology:- A sample of 2 waste processing units (ideally one decentralized and one centralized)
are to be randomly selected from the list of all SWM workers. Each will be asked howmuch waste is processed per day.
- If the value any unit declares is less than the ULB reported value , then the ULB willreceive -17 score for this indicator.
- If 100% discrepancy is found in the two units’ then the ULB will get zero (0) mark inPart-1 for the same indicator

2.5 Percentage Biodegradable waste coming to the landfill
Scheme of Ranking Marks
Yes Remain as in Part 1No -13
Validation Methodology:- The registered landfill will be visited in the city. The log books will be cross-
checked to see if the values reported are correct and a rough gauge will be madevisually.
- If the biodegradable waste is more than the ULB reported value , then the ULB willreceive -13 score for this indicator.
- If 100% discrepancy is found ’ then the ULB will get zero (0) mark in Part-1 for thesame indicator

2.6 Remediation of existing dumpsites undertaken and the stage of the same
Scheme of Ranking Marks
Yes Remain as in Part 1No -13
Validation Methodology:- The landfill is to be visited if under remediation. If not, agreements or tenders are
to be produced during the in-person visit.- If any discrepancies are found, then the ULB will receive -13 score for this indicator.- If 100% discrepancy is found ’ then the ULB will get zero (0) mark in Part-1 for the
same indicator

2.7
Removed from Independent validation Sale of city compost (as a % of production) in the last two quarters of 2017 as logged into the mFMS portal
Scheme of Ranking Marks
Yes Remain as in Part 1No -10
Validation Methodology:- A sample of 1-3 compost producers are to be randomly selected from the list of all
manufacturers. Each will be asked to show logs for the sales for the past two months.- If the value that any producer declares is less than the value reported by the ULB, then
the ULB will receive -10 score for this indicator.- If 100% (3) discrepancy is found with the compost producers’ then the ULB will get
zero (0) mark in Part-1 for the same indicator
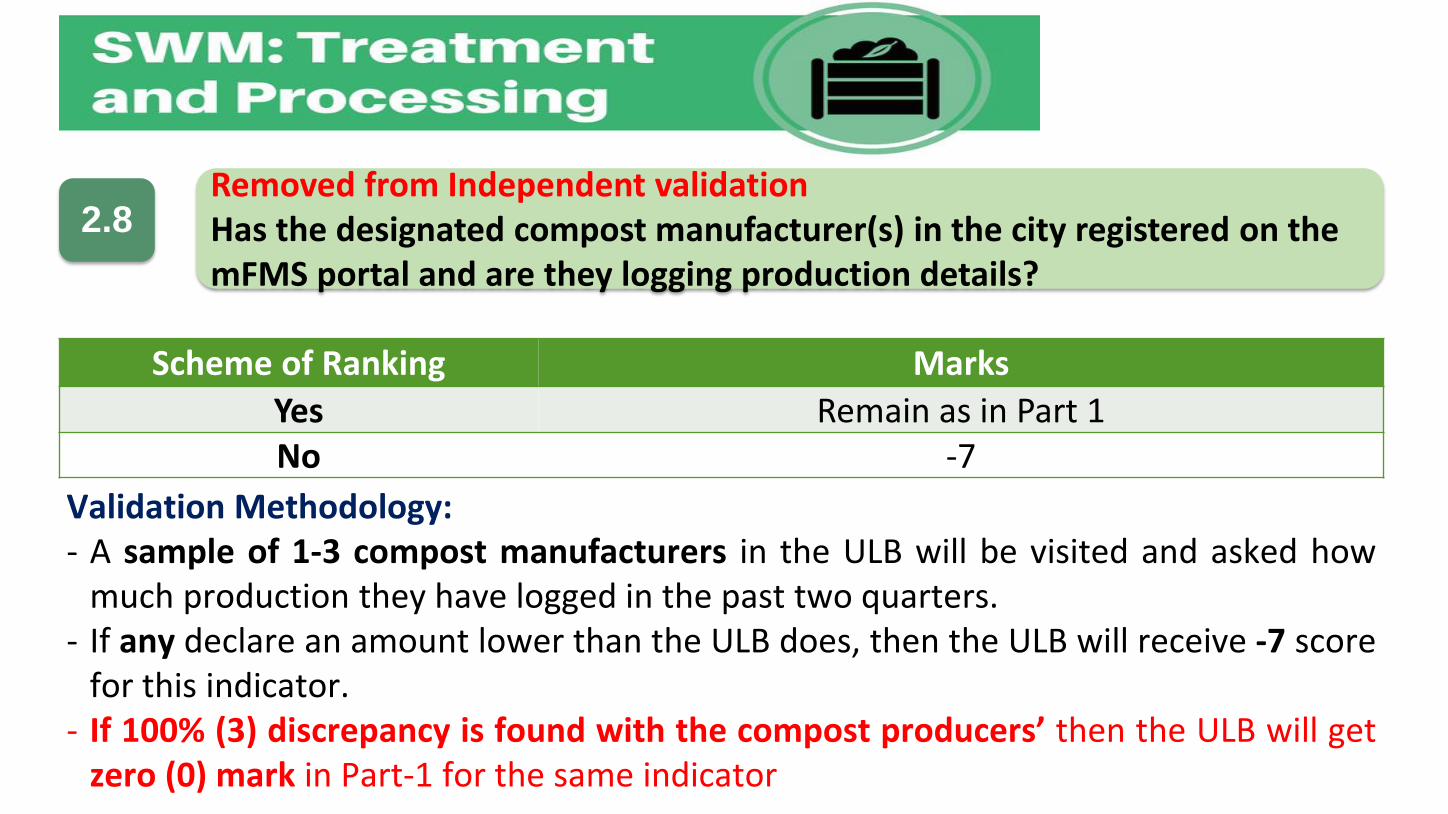
2.8Removed from Independent validationHas the designated compost manufacturer(s) in the city registered on the mFMS portal and are they logging production details?
Scheme of Ranking Marks
Yes Remain as in Part 1No -7
Validation Methodology:- A sample of 1-3 compost manufacturers in the ULB will be visited and asked how
much production they have logged in the past two quarters.- If any declare an amount lower than the ULB does, then the ULB will receive -7 score
for this indicator.- If 100% (3) discrepancy is found with the compost producers’ then the ULB will get
zero (0) mark in Part-1 for the same indicator
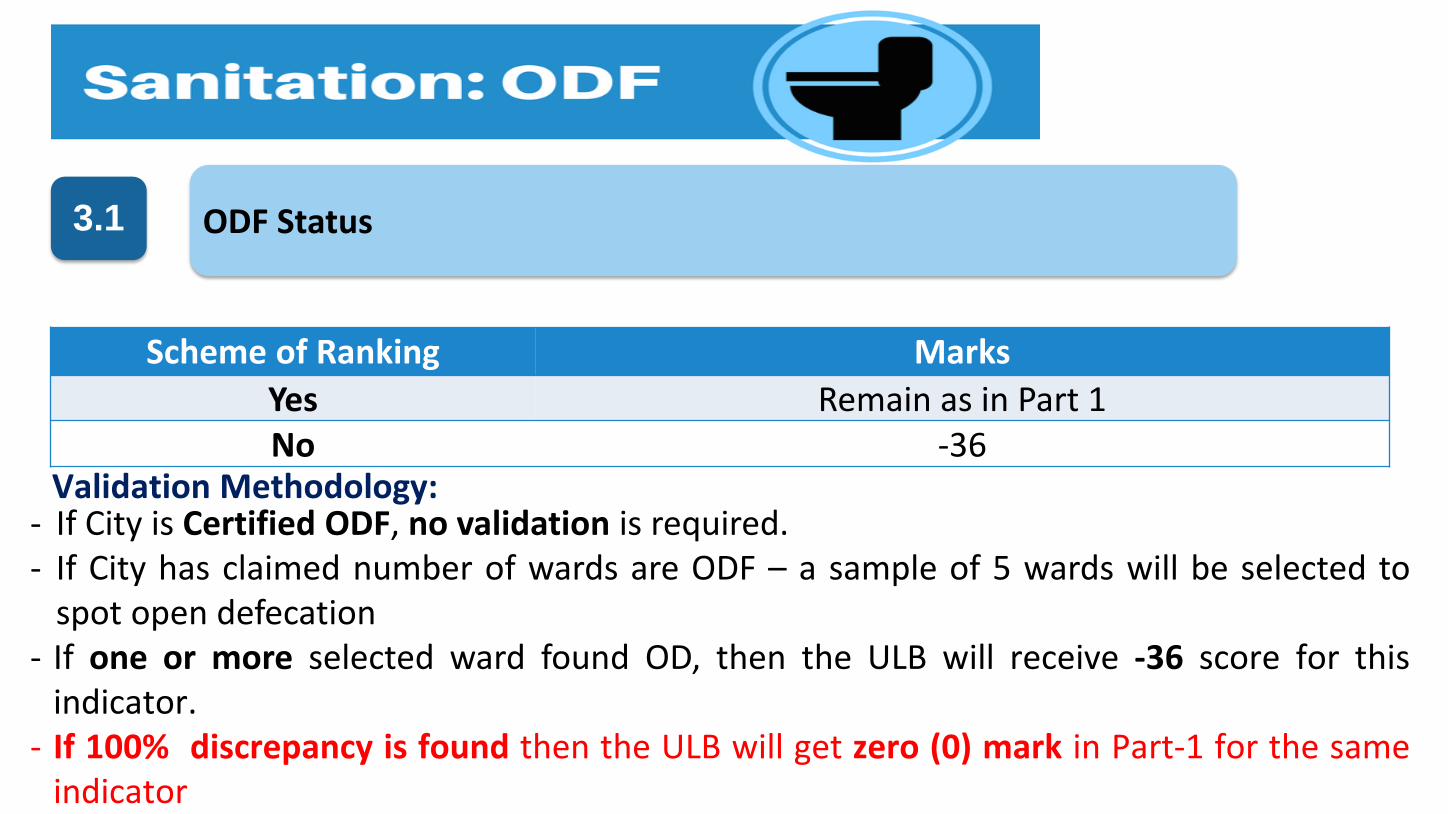
3.1 ODF Status
Scheme of Ranking Marks
Yes Remain as in Part 1No -36
Validation Methodology:- If City is Certified ODF, no validation is required.- If City has claimed number of wards are ODF – a sample of 5 wards will be selected to
spot open defecation- If one or more selected ward found OD, then the ULB will receive -36 score for this
indicator.- If 100% discrepancy is found then the ULB will get zero (0) mark in Part-1 for the same
indicator
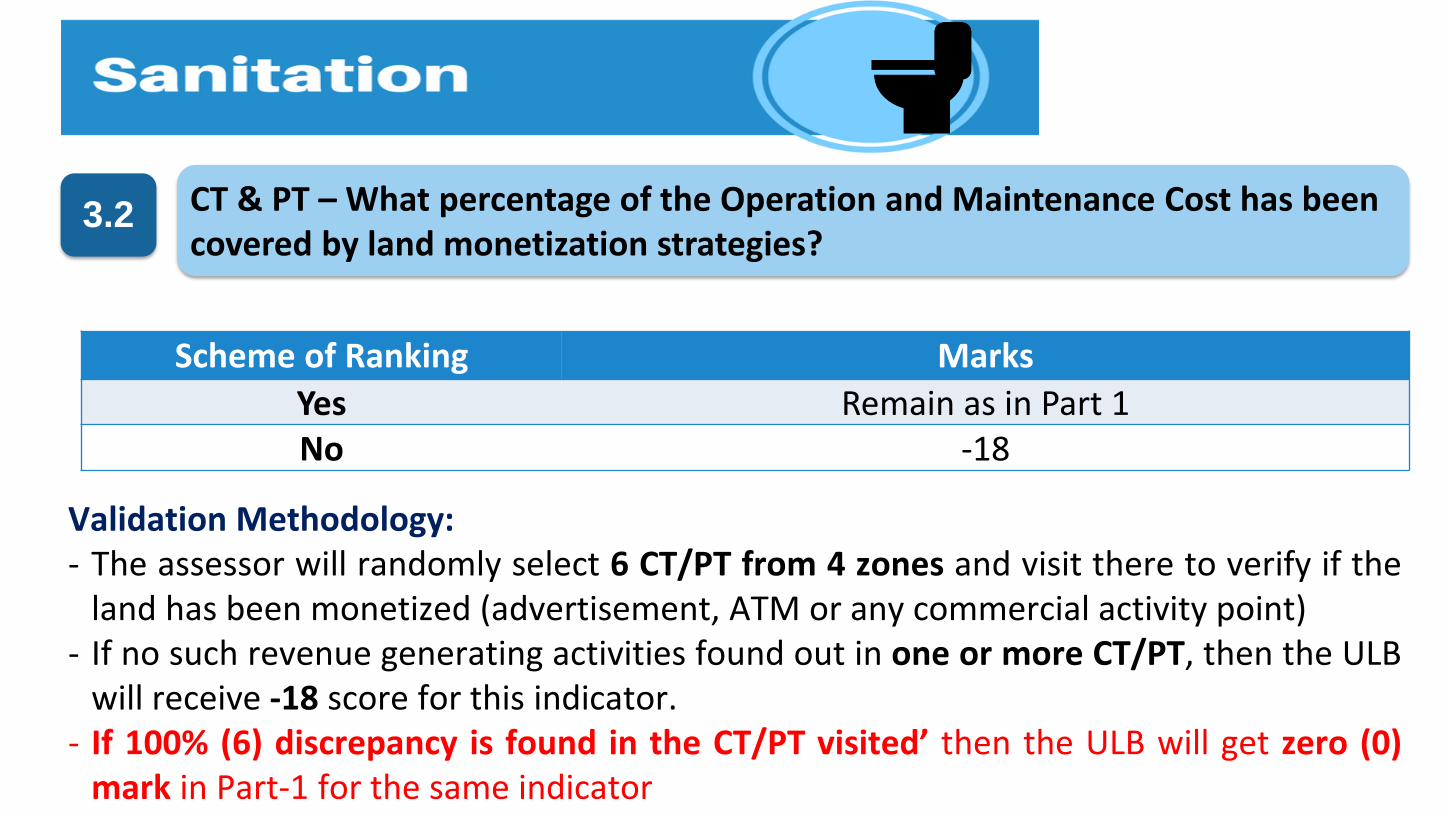
3.2 CT & PT – What percentage of the Operation and Maintenance Cost has been covered by land monetization strategies?
Scheme of Ranking Marks
Yes Remain as in Part 1No -18
Validation Methodology:- The assessor will randomly select 6 CT/PT from 4 zones and visit there to verify if the
land has been monetized (advertisement, ATM or any commercial activity point)- If no such revenue generating activities found out in one or more CT/PT, then the ULB
will receive -18 score for this indicator.- If 100% (6) discrepancy is found in the CT/PT visited’ then the ULB will get zero (0)
mark in Part-1 for the same indicator
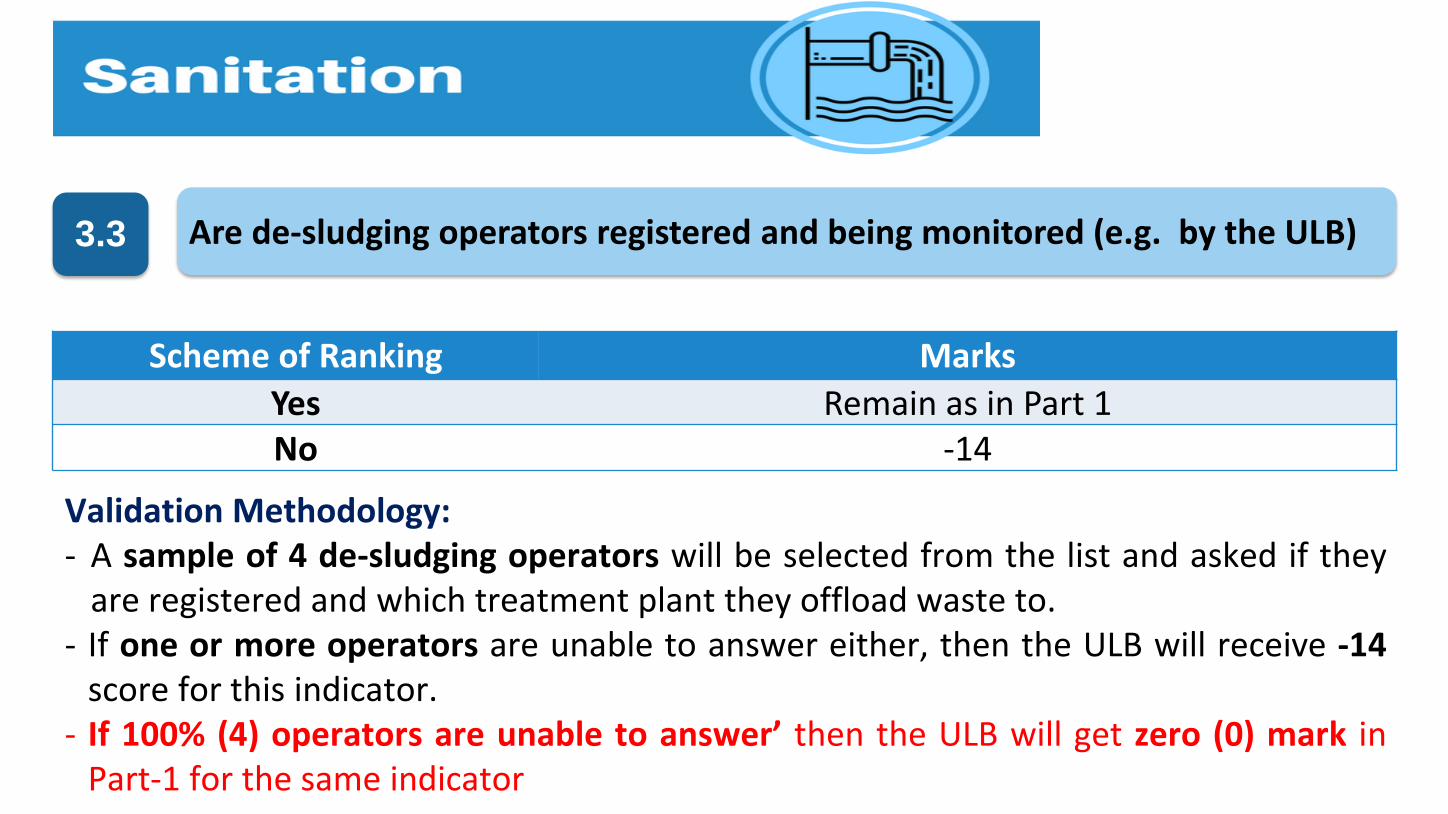
3.3 Are de-sludging operators registered and being monitored (e.g. by the ULB)
Scheme of Ranking Marks
Yes Remain as in Part 1No -14
Validation Methodology:- A sample of 4 de-sludging operators will be selected from the list and asked if they
are registered and which treatment plant they offload waste to.- If one or more operators are unable to answer either, then the ULB will receive -14
score for this indicator.- If 100% (4) operators are unable to answer’ then the ULB will get zero (0) mark in
Part-1 for the same indicator
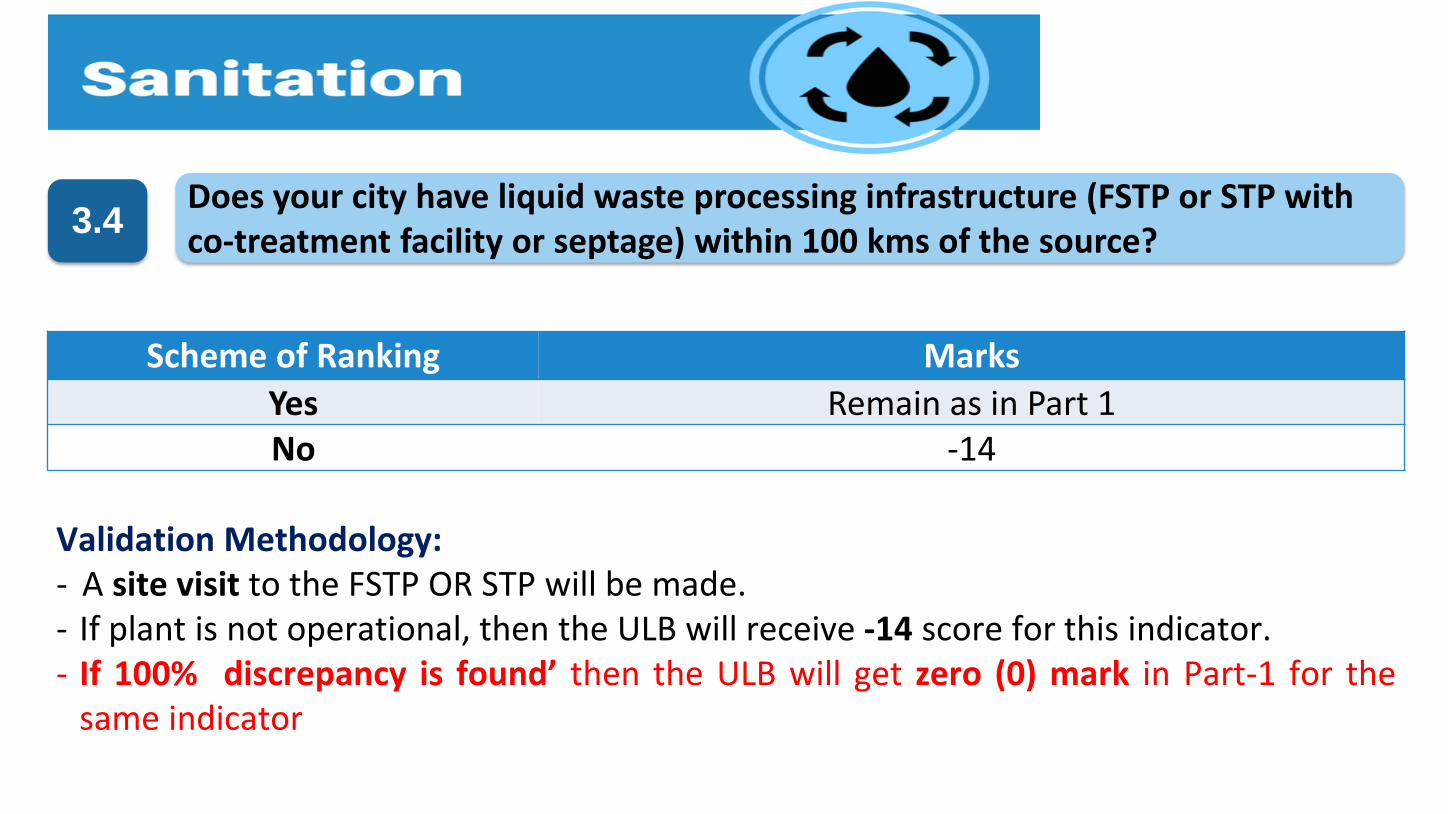
3.4Does your city have liquid waste processing infrastructure (FSTP or STP with co-treatment facility or septage) within 100 kms of the source?
Scheme of Ranking Marks
Yes Remain as in Part 1No -14
Validation Methodology:- A site visit to the FSTP OR STP will be made.- If plant is not operational, then the ULB will receive -14 score for this indicator.- If 100% discrepancy is found’ then the ULB will get zero (0) mark in Part-1 for the
same indicator

3.5IHHL – What percentage of toilets have been constructed out of the verified applications?
Scheme of Ranking Marks
Yes Remain as in Part 1No -11
- Assessor will collect a list of all toilets constructed out of verified applications.- Randomly 6 toilets will be selected from the list for a site visit- If one or more selected toilets are not constructed, then the ULB will receive -11
score for this indicator.- If 100% (6) toilets are not constructed’ then the ULB will get zero (0) mark in Part-1
for the same indicator
Validation Methodology:
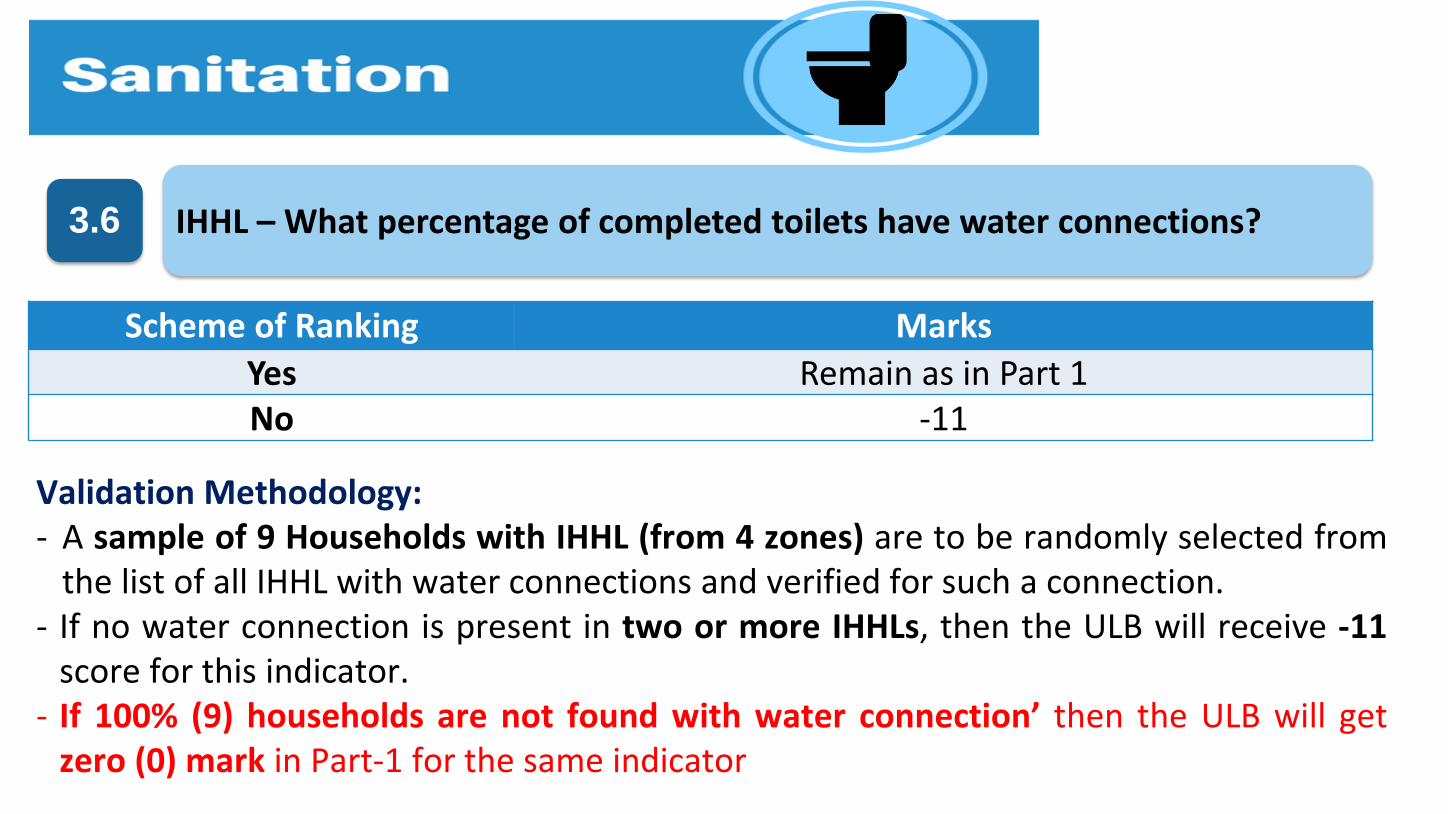
3.6 IHHL – What percentage of completed toilets have water connections?
Scheme of Ranking Marks
Yes Remain as in Part 1No -11
Validation Methodology:- A sample of 9 Households with IHHL (from 4 zones) are to be randomly selected from
the list of all IHHL with water connections and verified for such a connection.- If no water connection is present in two or more IHHLs, then the ULB will receive -11
score for this indicator.- If 100% (9) households are not found with water connection’ then the ULB will get
zero (0) mark in Part-1 for the same indicator
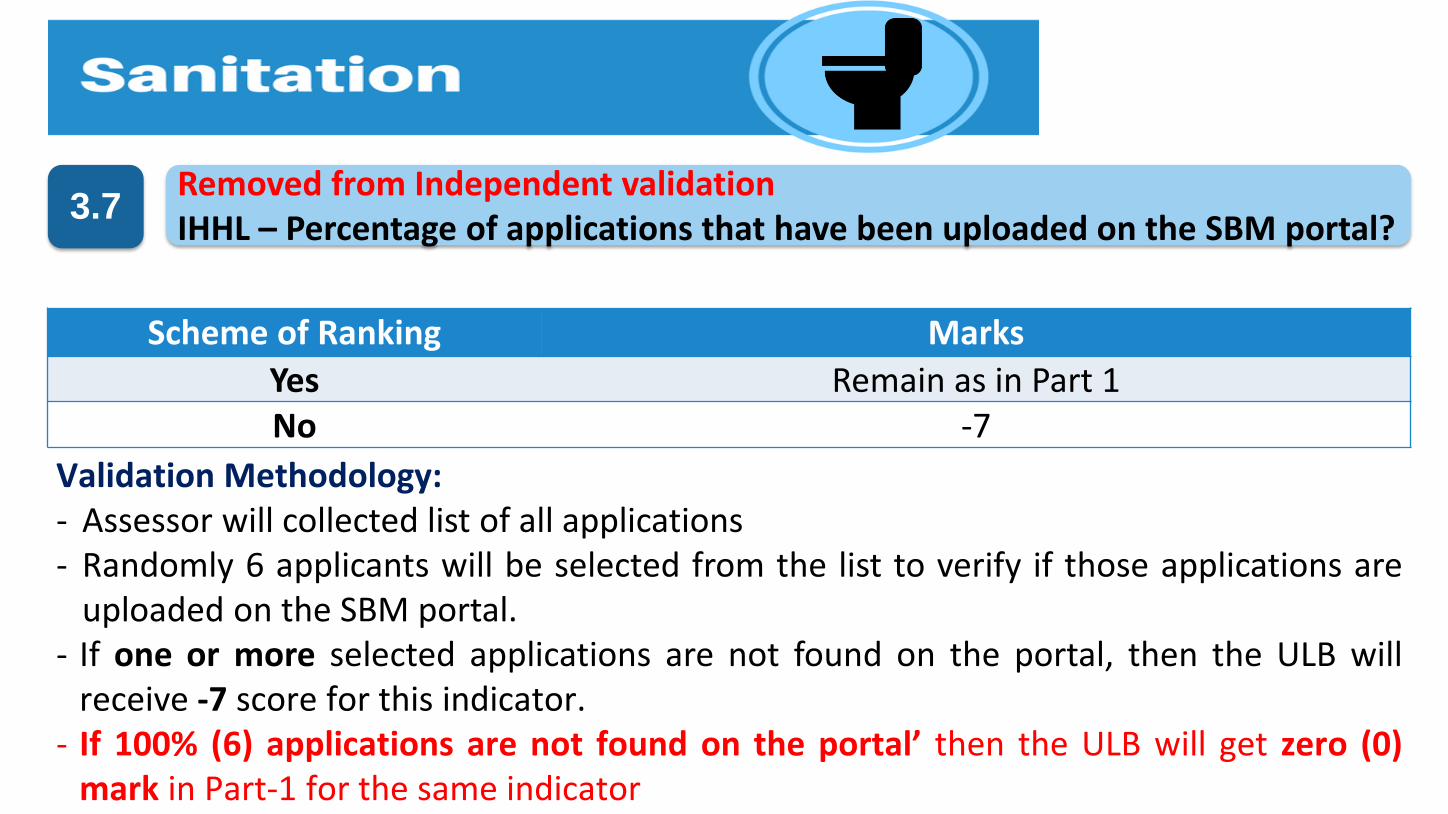
3.7Removed from Independent validationIHHL – Percentage of applications that have been uploaded on the SBM portal?
Scheme of Ranking Marks
Yes Remain as in Part 1No -7
Validation Methodology:- Assessor will collected list of all applications- Randomly 6 applicants will be selected from the list to verify if those applications are
uploaded on the SBM portal.- If one or more selected applications are not found on the portal, then the ULB will
receive -7 score for this indicator.- If 100% (6) applications are not found on the portal’ then the ULB will get zero (0)
mark in Part-1 for the same indicator
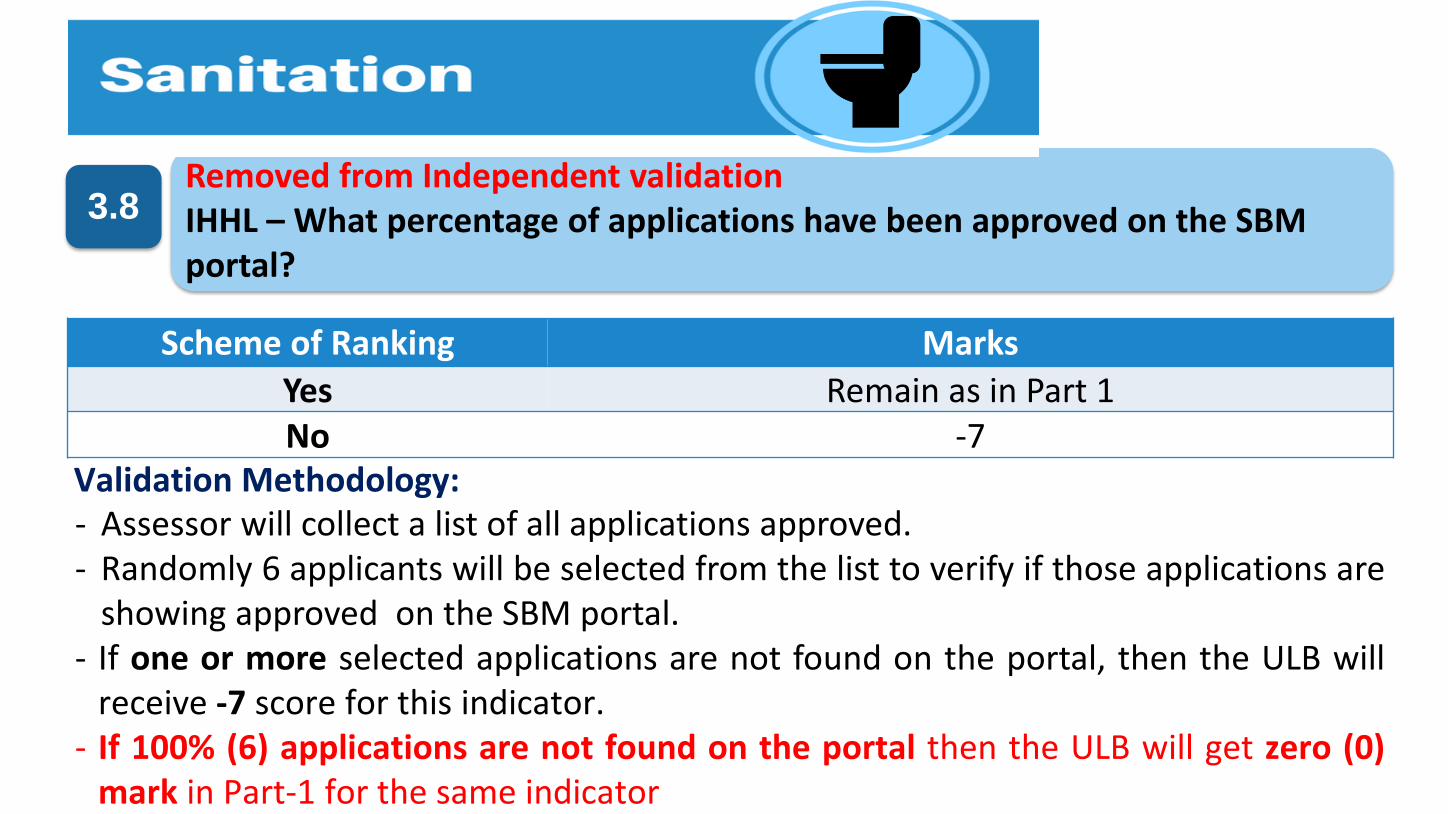
3.8Removed from Independent validationIHHL – What percentage of applications have been approved on the SBM portal?
Scheme of Ranking Marks
Yes Remain as in Part 1No -7
- Assessor will collect a list of all applications approved.- Randomly 6 applicants will be selected from the list to verify if those applications are
showing approved on the SBM portal.- If one or more selected applications are not found on the portal, then the ULB will
receive -7 score for this indicator.- If 100% (6) applications are not found on the portal then the ULB will get zero (0)
mark in Part-1 for the same indicator
Validation Methodology:
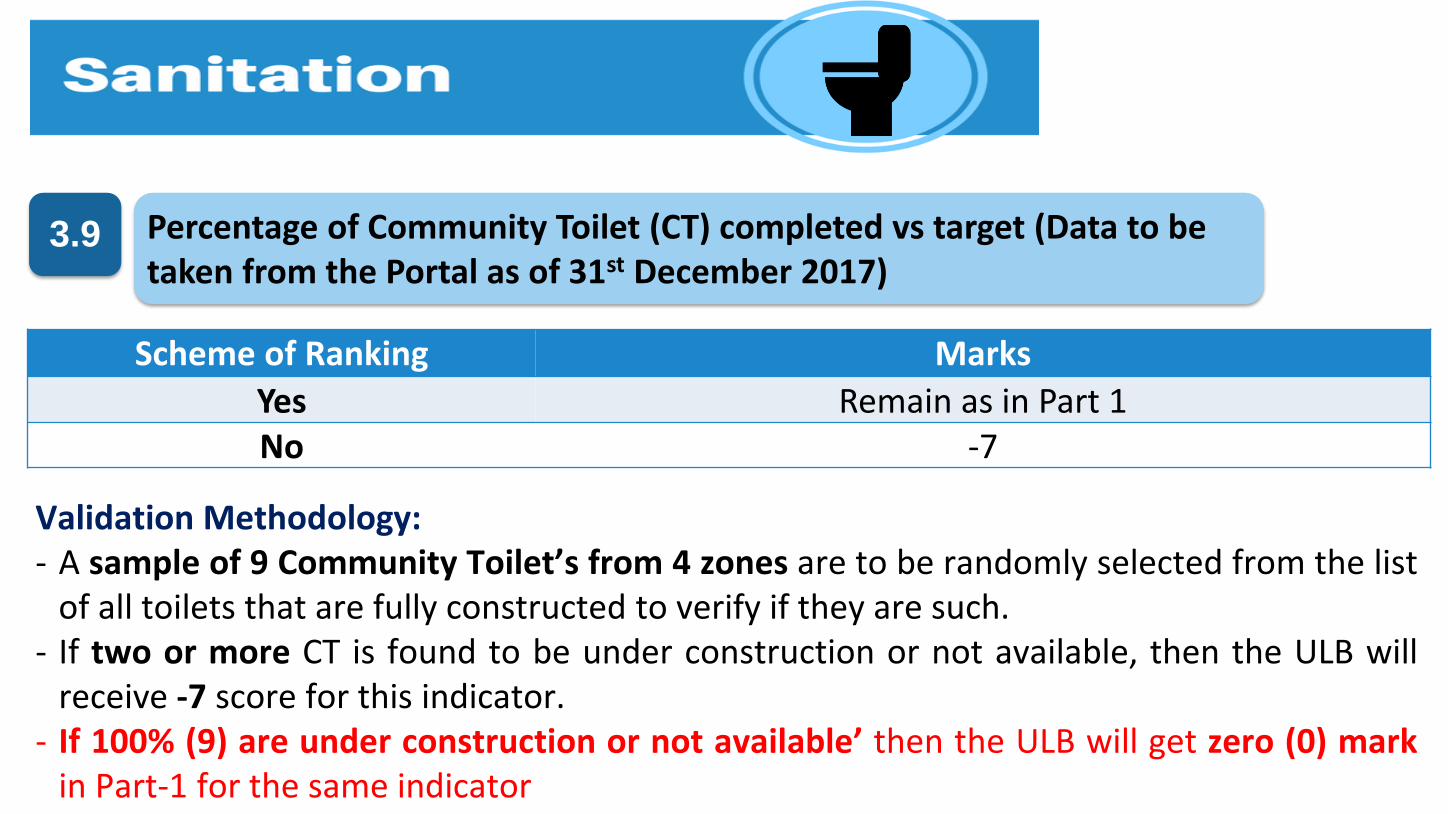
3.9
Scheme of Ranking Marks
Yes Remain as in Part 1No -7
Validation Methodology:- A sample of 9 Community Toilet’s from 4 zones are to be randomly selected from the list
of all toilets that are fully constructed to verify if they are such.- If two or more CT is found to be under construction or not available, then the ULB will
receive -7 score for this indicator.- If 100% (9) are under construction or not available’ then the ULB will get zero (0) mark
in Part-1 for the same indicator
Percentage of Community Toilet (CT) completed vs target (Data to be taken from the Portal as of 31st December 2017)
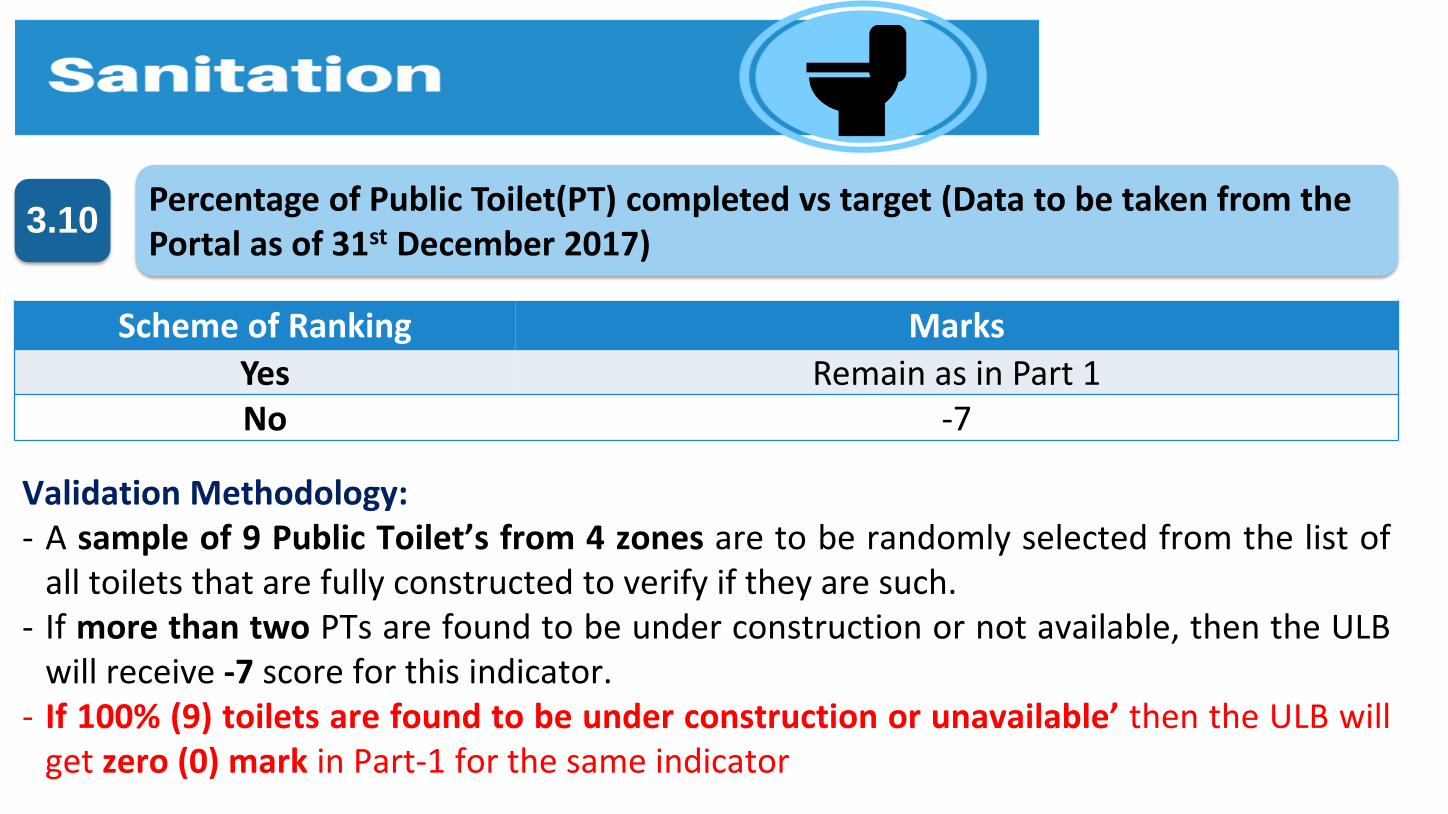
3.10
Scheme of Ranking Marks
Yes Remain as in Part 1No -7
Percentage of Public Toilet(PT) completed vs target (Data to be taken from the Portal as of 31st December 2017)
Validation Methodology:- A sample of 9 Public Toilet’s from 4 zones are to be randomly selected from the list of
all toilets that are fully constructed to verify if they are such.- If more than two PTs are found to be under construction or not available, then the ULB
will receive -7 score for this indicator.- If 100% (9) toilets are found to be under construction or unavailable’ then the ULB will
get zero (0) mark in Part-1 for the same indicator
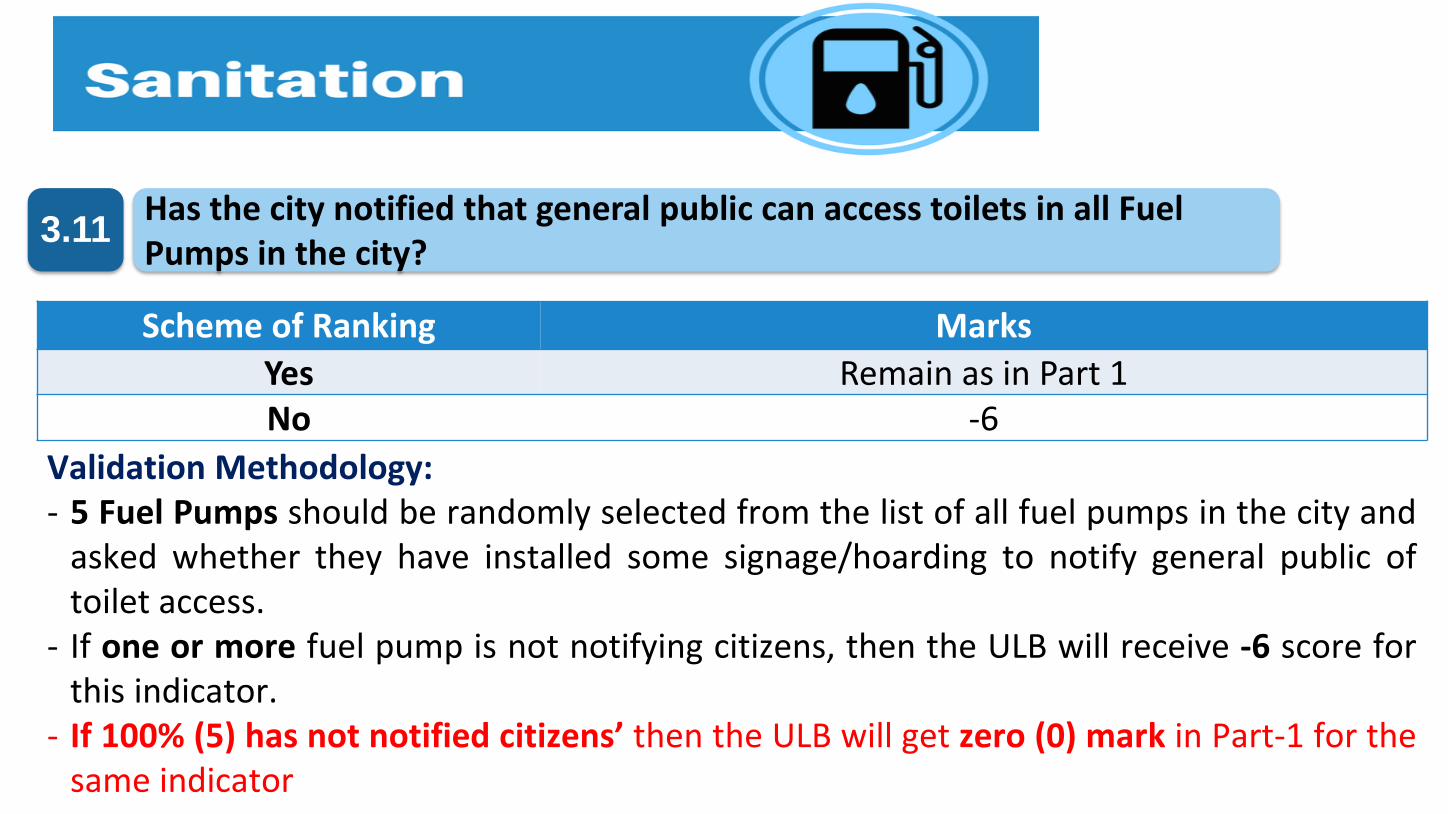
Scheme of Ranking Marks
Yes Remain as in Part 1No -6
Validation Methodology:- 5 Fuel Pumps should be randomly selected from the list of all fuel pumps in the city and
asked whether they have installed some signage/hoarding to notify general public oftoilet access.
- If one or more fuel pump is not notifying citizens, then the ULB will receive -6 score forthis indicator.
- If 100% (5) has not notified citizens’ then the ULB will get zero (0) mark in Part-1 for thesame indicator
3.11Has the city notified that general public can access toilets in all Fuel Pumps in the city?

4.1 Whether rankings of Swachh Hotel, School, Hospital, RWA/Mohalla and Market Association conducted
Scheme of Ranking Marks
Yes Remain as in Part 1No -7
Validation Methodology:- A mixed sample of 8 Hotels/Schools/Hopsitals/RWA and Market Association to
selected to assess if they participated in the ranking- If there is no evidence in two or more locations, then the ULB will receive -7 score for
this indicator.- If 100% (8) no evidence is found at the locations’ then the ULB will get zero (0) mark
in Part-1 for the same indicator
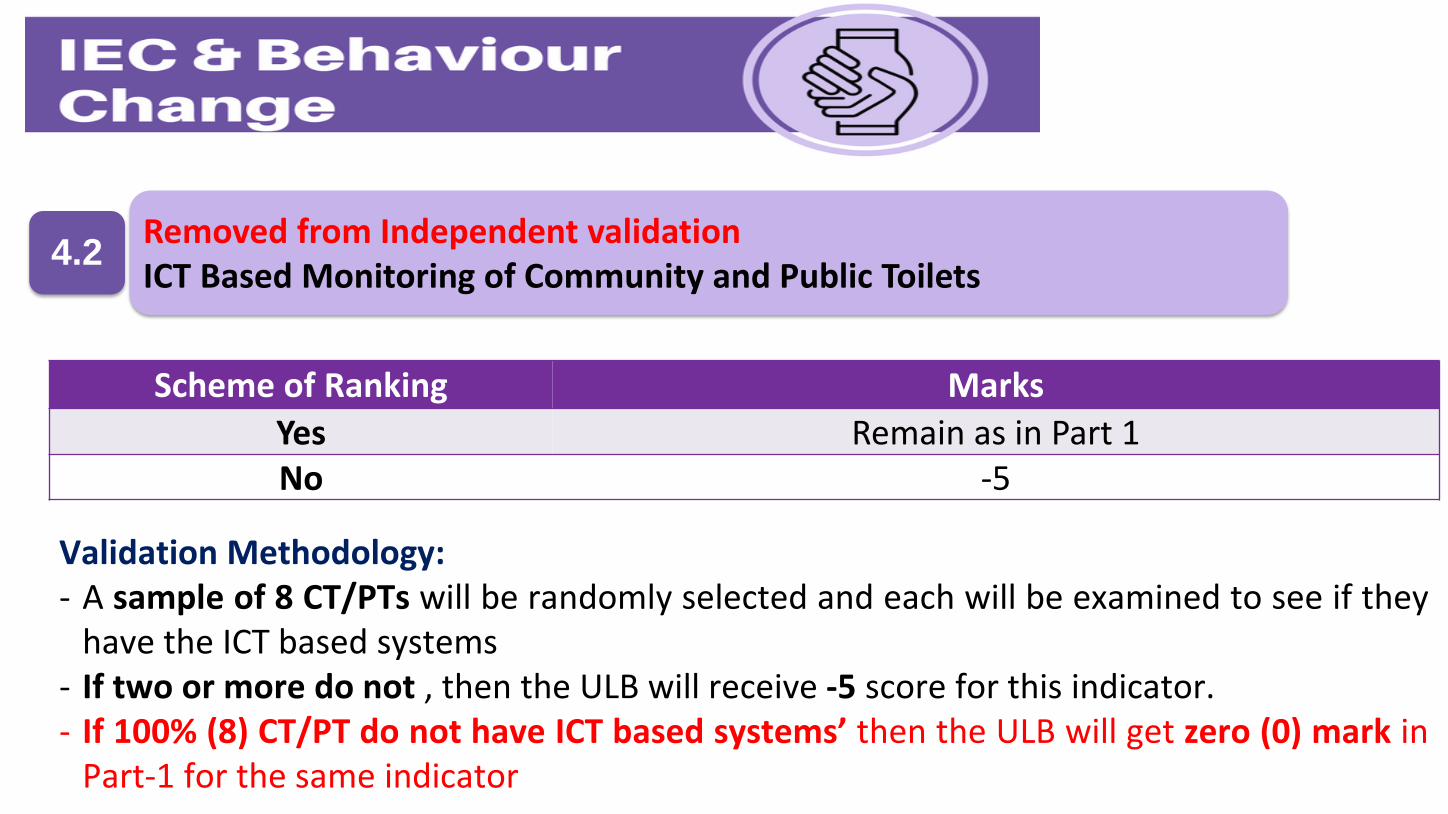
4.2Removed from Independent validationICT Based Monitoring of Community and Public Toilets
Scheme of Ranking Marks
Yes Remain as in Part 1No -5
Validation Methodology:- A sample of 8 CT/PTs will be randomly selected and each will be examined to see if they
have the ICT based systems- If two or more do not , then the ULB will receive -5 score for this indicator.- If 100% (8) CT/PT do not have ICT based systems’ then the ULB will get zero (0) mark in
Part-1 for the same indicator

4.32017 SBM campaigns designed by the Ministry promoted in the city i.e. Source Segregation, Swachh Shauchalaya etc.
Scheme of Ranking Marks
Yes Remain as in Part 1No -4
Validation Methodology:- A sample of 10 locations will be randomly selected and each will be examined to see if
there is evidence for SBM campaigns- If there is no evidence in 2 or more locations, then the ULB will receive -4 score for this
indicator.- These 10 locations will be different than locations selected by assessor for
Independent Observation.- If 100% (10) locations do not possess SBM campaigns’ then the ULB will get zero (0)
mark in Part-1 for the same indicator

4.4Removed from Independent validationSBM Brand Ambassadors - formally engaged for community engagement activities
Scheme of Ranking Marks
Yes Remain as in Part 1No -2
Validation Methodology:- 5 brand ambassadors are to be randomly selected and asked which community
engagement activities they have participated in.- If one or more ambassadors provide answers different than ULB documentation, then
the ULB will receive -2 score for this indicator.
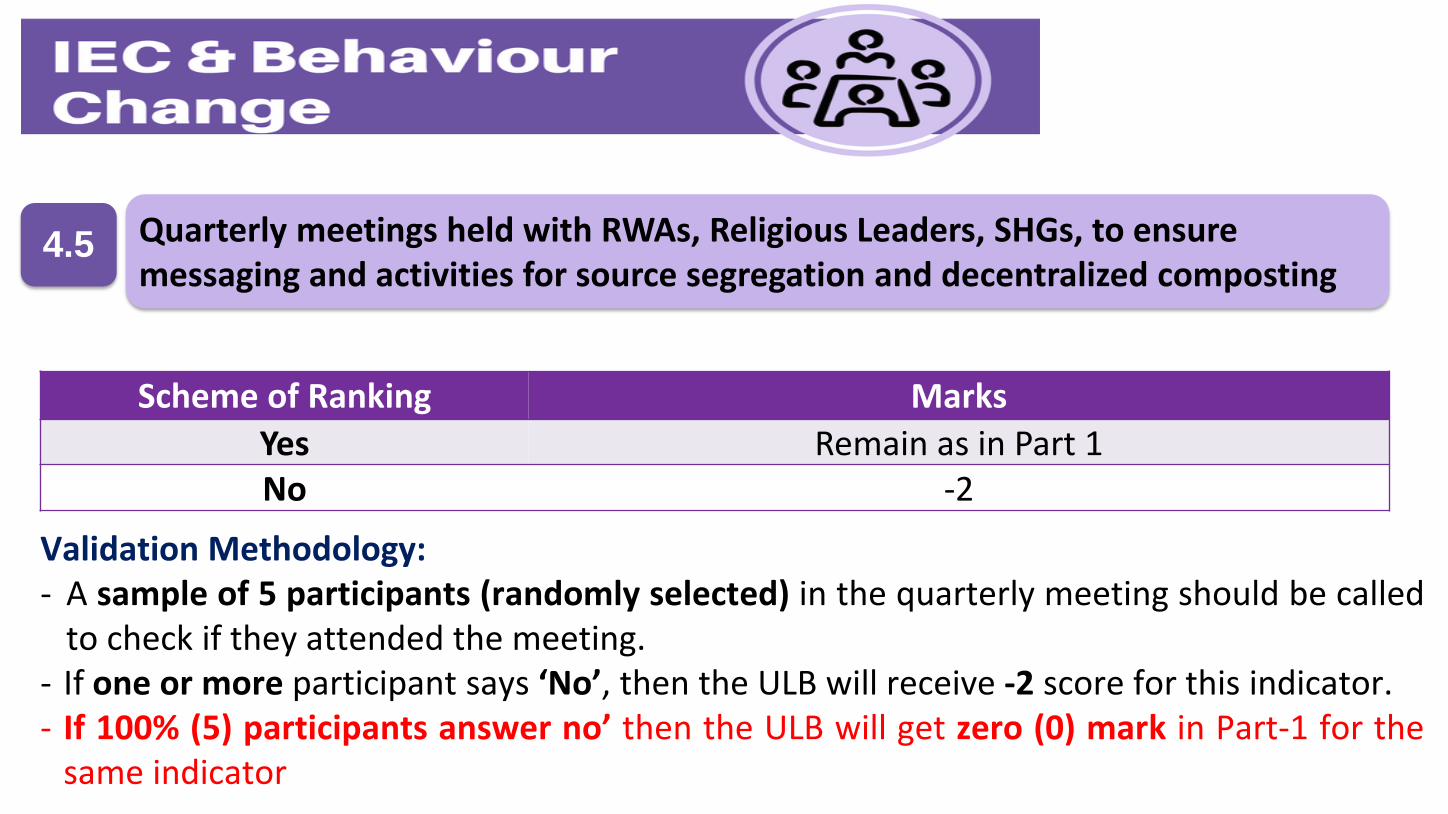
4.5 Quarterly meetings held with RWAs, Religious Leaders, SHGs, to ensure messaging and activities for source segregation and decentralized composting
Scheme of Ranking Marks
Yes Remain as in Part 1No -2
Validation Methodology:- A sample of 5 participants (randomly selected) in the quarterly meeting should be called
to check if they attended the meeting.- If one or more participant says ‘No’, then the ULB will receive -2 score for this indicator.- If 100% (5) participants answer no’ then the ULB will get zero (0) mark in Part-1 for the
same indicator

Scheme of Ranking Marks
Yes Remain as in Part 1No -2
Validation Methodology:- A sample of 8 committees will be randomly selected from 8 schools in 4 zones. The
Assessor will visit these school and will verify whether they are active and whatactivities they have led.
- If there is mismatch from what has been claimed by the ULB by two or morecommittees, then the ULB will receive -2 score for this indicator.
- If 100% (8) are found to be mismatched as claimed’ then the ULB will get zero (0)mark in Part-1 for the same indicator
4.6 Swachhata Committees functioning in all schools
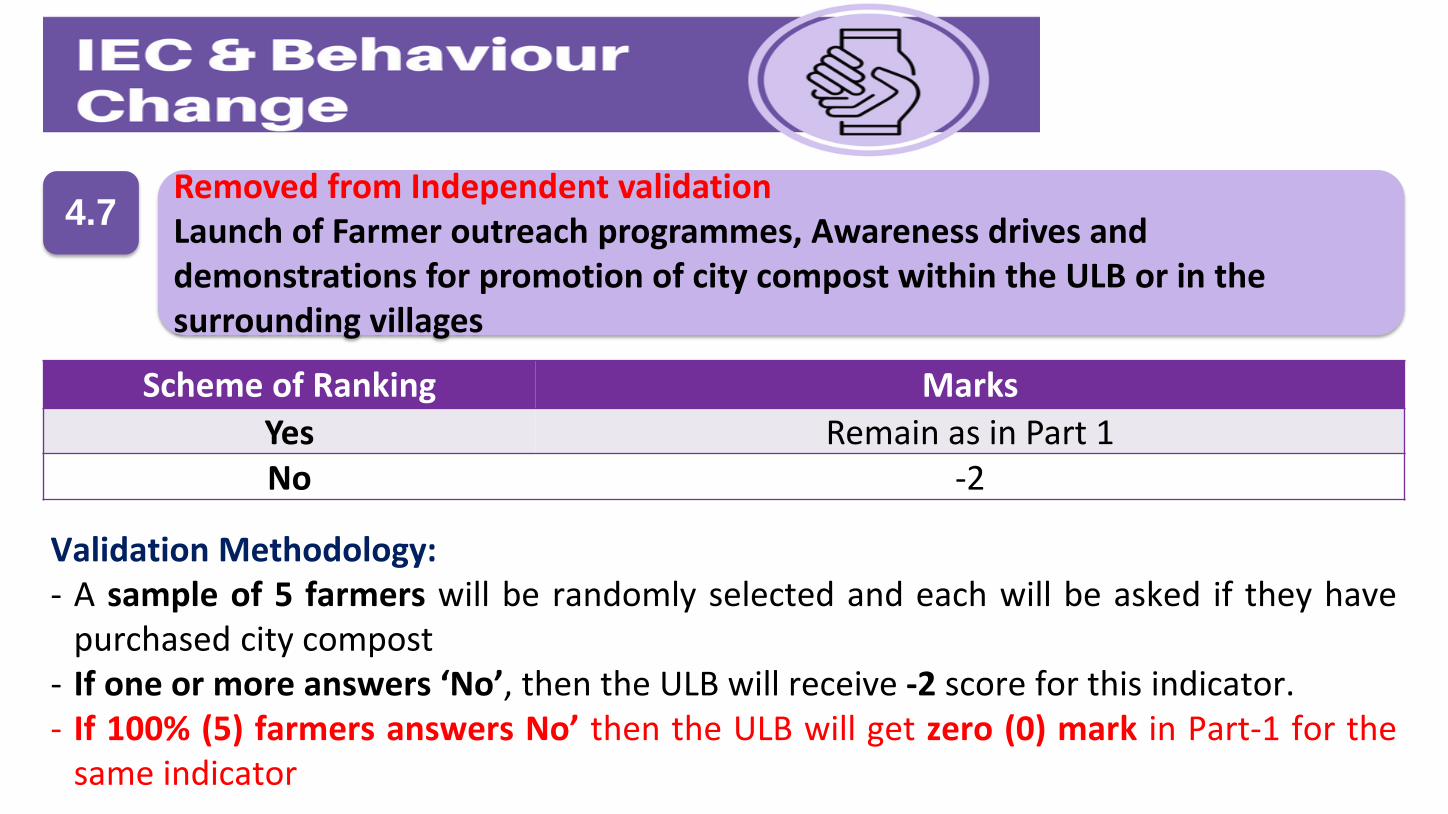
4.7Removed from Independent validationLaunch of Farmer outreach programmes, Awareness drives and demonstrations for promotion of city compost within the ULB or in the surrounding villages
Scheme of Ranking Marks
Yes Remain as in Part 1No -2
Validation Methodology:- A sample of 5 farmers will be randomly selected and each will be asked if they have
purchased city compost- If one or more answers ‘No’, then the ULB will receive -2 score for this indicator.- If 100% (5) farmers answers No’ then the ULB will get zero (0) mark in Part-1 for the
same indicator
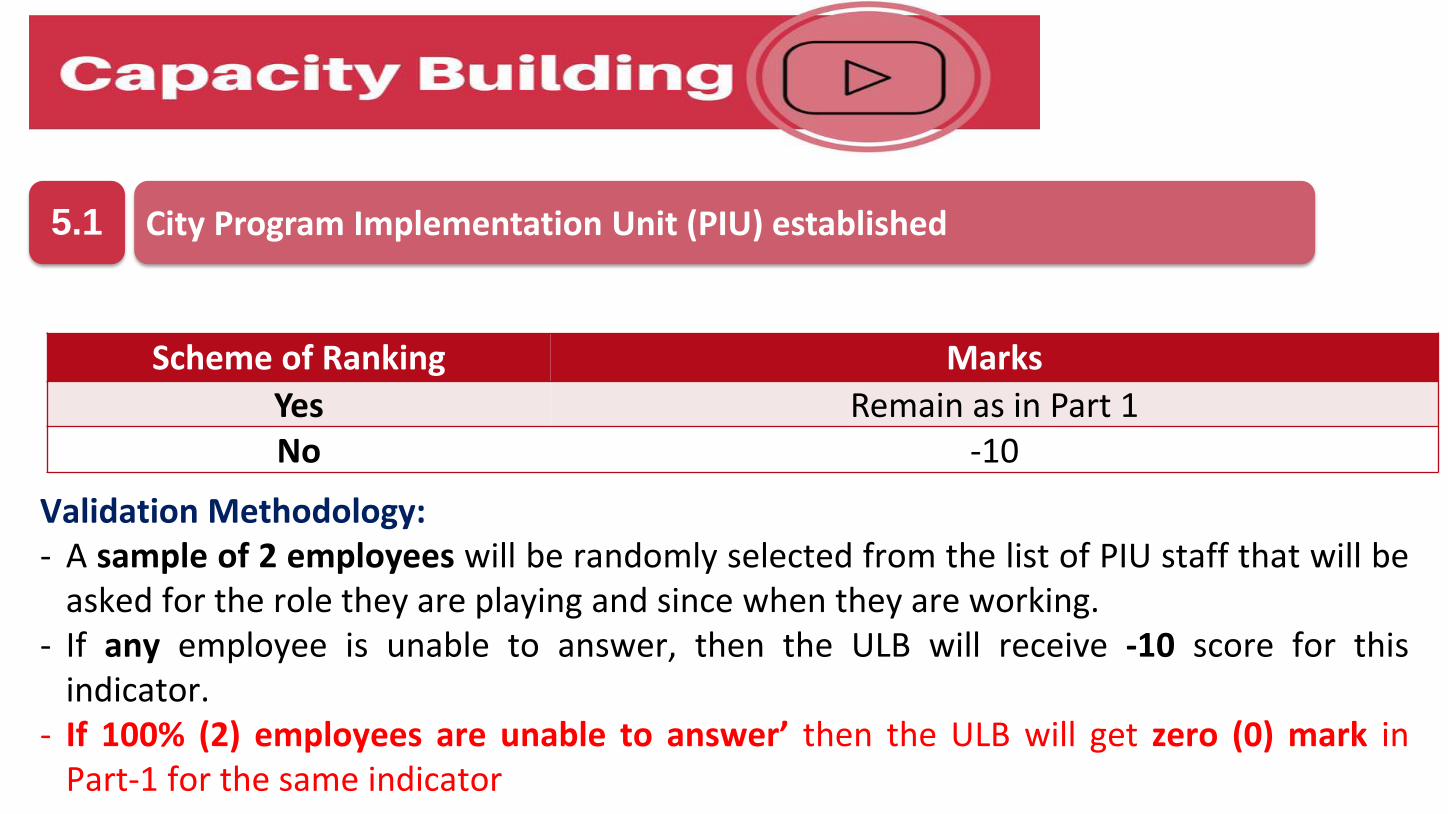
5.1 City Program Implementation Unit (PIU) established
Scheme of Ranking Marks
Yes Remain as in Part 1No -10
Validation Methodology:- A sample of 2 employees will be randomly selected from the list of PIU staff that will be
asked for the role they are playing and since when they are working.- If any employee is unable to answer, then the ULB will receive -10 score for this
indicator.- If 100% (2) employees are unable to answer’ then the ULB will get zero (0) mark in
Part-1 for the same indicator
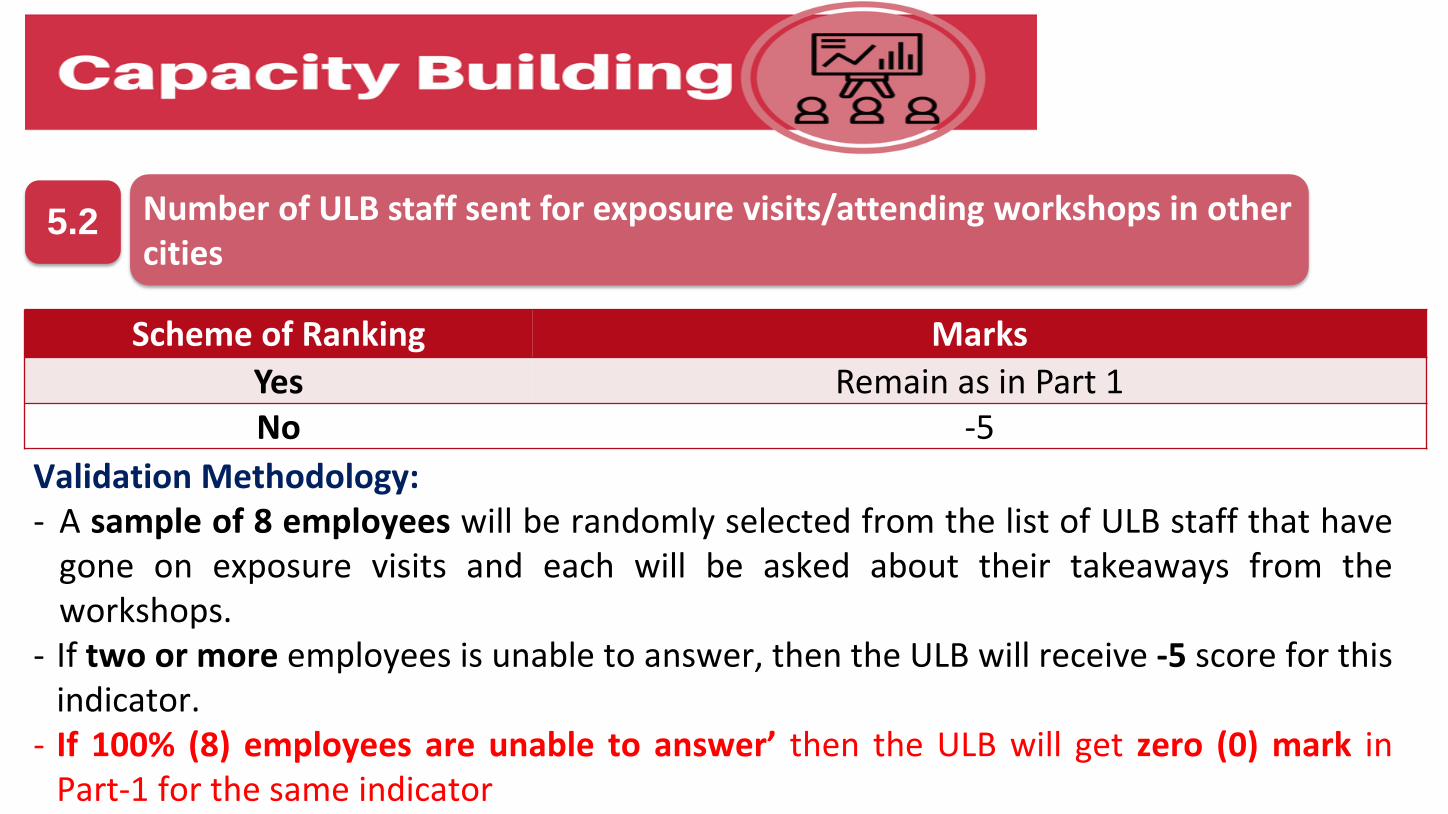
5.2 Number of ULB staff sent for exposure visits/attending workshops in other cities
Scheme of Ranking Marks
Yes Remain as in Part 1No -5
Validation Methodology:- A sample of 8 employees will be randomly selected from the list of ULB staff that have
gone on exposure visits and each will be asked about their takeaways from theworkshops.
- If two or more employees is unable to answer, then the ULB will receive -5 score for thisindicator.
- If 100% (8) employees are unable to answer’ then the ULB will get zero (0) mark inPart-1 for the same indicator
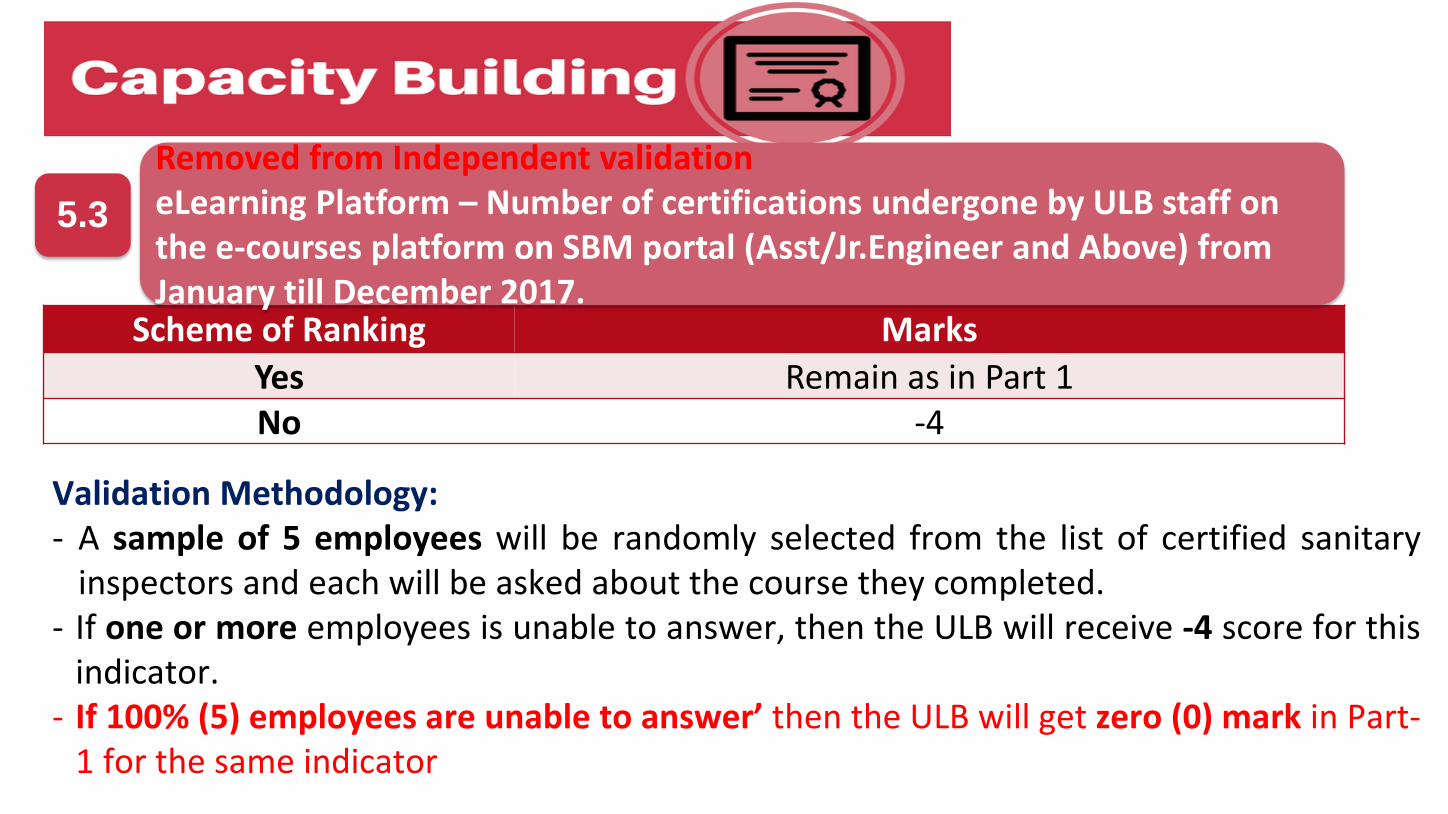
Scheme of Ranking Marks
Yes Remain as in Part 1No -4
5.3
Removed from Independent validationeLearning Platform – Number of certifications undergone by ULB staff on the e-courses platform on SBM portal (Asst/Jr.Engineer and Above) from January till December 2017.
Validation Methodology:- A sample of 5 employees will be randomly selected from the list of certified sanitary
inspectors and each will be asked about the course they completed.- If one or more employees is unable to answer, then the ULB will receive -4 score for this
indicator.- If 100% (5) employees are unable to answer’ then the ULB will get zero (0) mark in Part-
1 for the same indicator
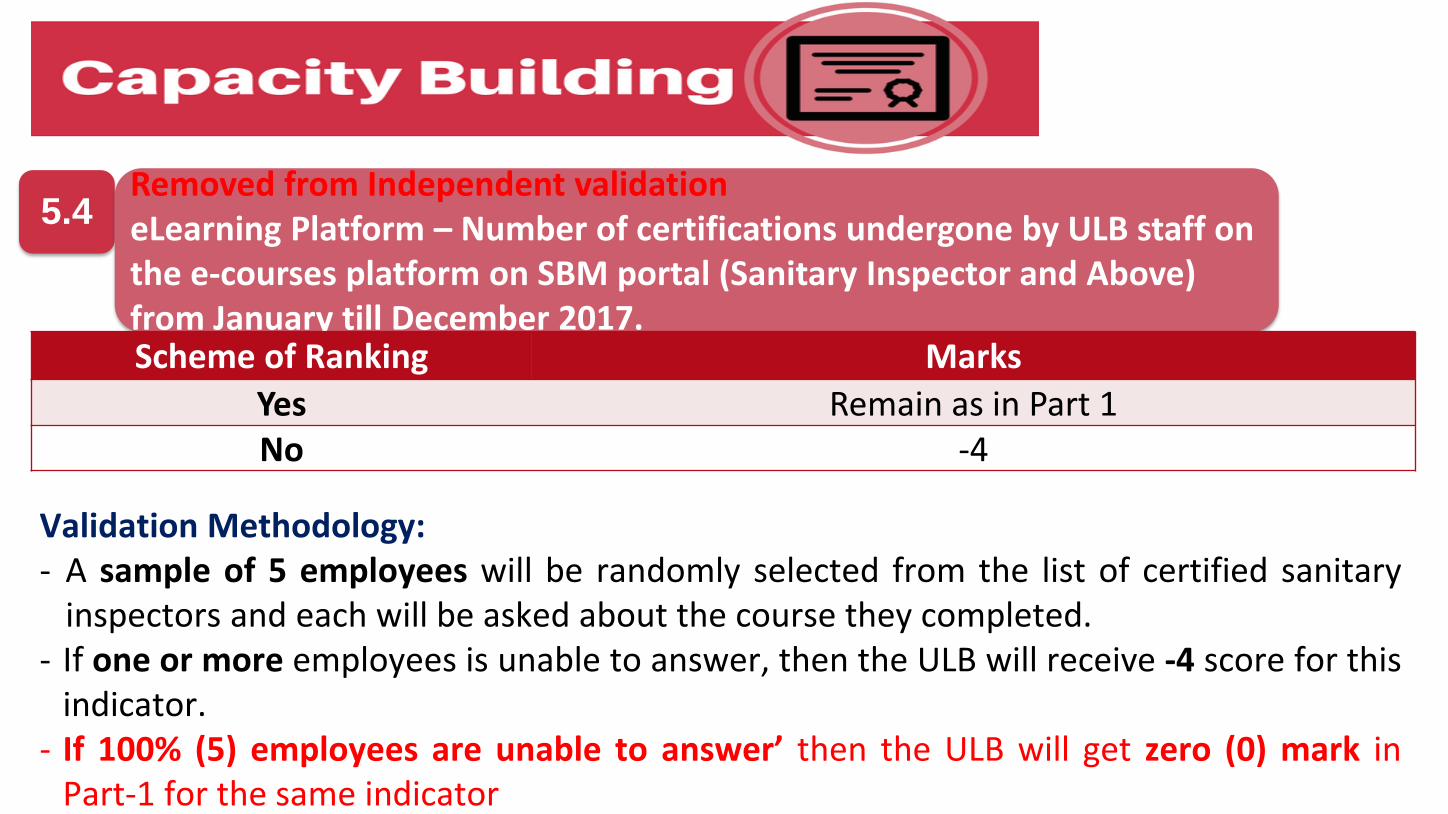
5.4Removed from Independent validationeLearning Platform – Number of certifications undergone by ULB staff on the e-courses platform on SBM portal (Sanitary Inspector and Above) from January till December 2017.Scheme of Ranking Marks
Yes Remain as in Part 1No -4
Validation Methodology:- A sample of 5 employees will be randomly selected from the list of certified sanitary
inspectors and each will be asked about the course they completed.- If one or more employees is unable to answer, then the ULB will receive -4 score for this
indicator.- If 100% (5) employees are unable to answer’ then the ULB will get zero (0) mark in
Part-1 for the same indicator

Direct Observation
30%
Citizen Feedback
40%
Municipal Documentati
on35%
1200 Marks / 4000

Methodology- Assessors will visit 3 residential area in each zone = total 12 residential areas in a city (if population is <5 lacs)- Assessors will visit 6 residential area in each zone = total 24 residential areas in a city (if population is >5 lacs)- Assessors will move around the residential area and observe/assess if the area is 100% clean, not
100% but largely clean or Not clean (<50% area clean)- Assessors will not interact with anyone. It will be purely their assessment of the situation- Assessors will click the pictures to support their observation/assessment
Scheme of Ranking MarksYes, 100% clean (zero waste spot) 50
Yes, but not 100% clean (waste spotted in 1-5 points/locations) 25
Not clean (Waste spotted in >5 points/locations) 0
1. Is the Area Clean?(Residential Areas—Slum/Old City/Unplanned Area/ Planned Area)

Methodology- Assessors will randomly visit 3 CT/PT in each zone = total 12 CT/PT in a city (If population is <5 Lakh)- Assessors will randomly visit 5 CTs/PTs in each zone= total 20 CTs/PTs in a city (if population is >5
Lakh).- Assessors will not interact with anyone. It will be purely their assessment of the situation- Assessors will click the pictures to support their observation/assessment
Scheme of Ranking MarksYes to all 3 70
Yes to any 2 50
Yes to just 1 30
None 0
2. Are Public/Community Toilets gender friendly (Separate section for Men and Women), child friendly and catering well to differently abled people?

Methodology- Assessors will randomly visit 3 CT/PT in each zone = total 12 CT/PT in a city (if population is <5 Lakh)- Assessors will randomly visit 5 CT/PT in each zone = total 20 CT/PT in a city (If population is >5 Lakh)- Assessors will not interact with anyone. It will be purely their assessment of the situation- Assessors will click the pictures to support their observation/ assessment
Scheme of Ranking MarksYes to all 4 90
Yes to any 3 70
Yes to any 2 50
Yes to any 1 30
None of the above 0
Independent Observation –
Community Toilet / Public Toilet (CT/PT)
3. Are Public/Community Toilets well lit (no dark areas), ventilated, connected to water supply/flush and attached to an electricity connection?
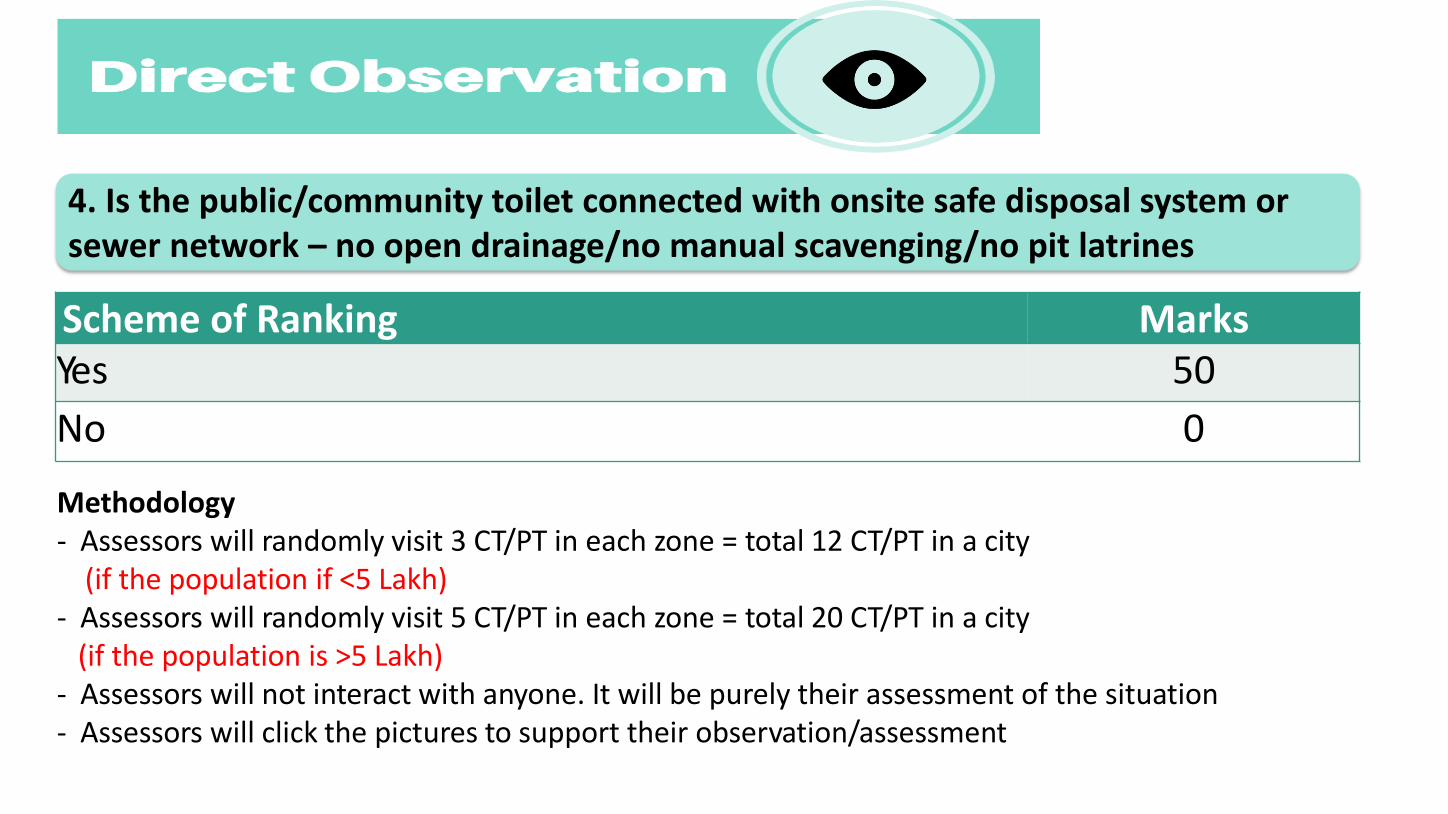
Methodology- Assessors will randomly visit 3 CT/PT in each zone = total 12 CT/PT in a city
(if the population if <5 Lakh)- Assessors will randomly visit 5 CT/PT in each zone = total 20 CT/PT in a city
(if the population is >5 Lakh)- Assessors will not interact with anyone. It will be purely their assessment of the situation- Assessors will click the pictures to support their observation/assessment
Scheme of Ranking MarksYes 50
No 0
Independent Observation –
Community Toilet / Public Toilet (CT/PT)
4. Is the public/community toilet connected with onsite safe disposal system or sewer network – no open drainage/no manual scavenging/no pit latrines
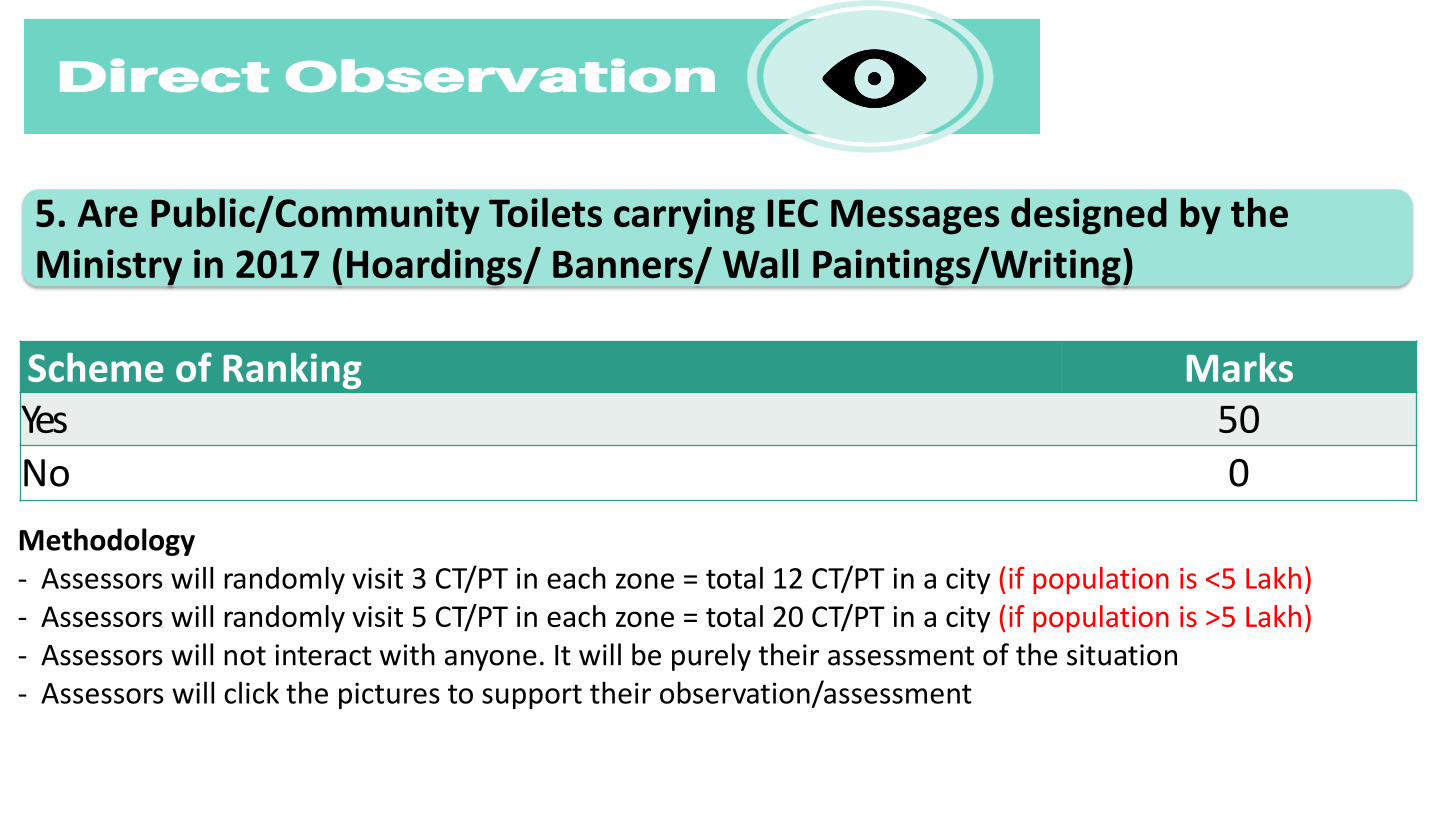
Methodology- Assessors will randomly visit 3 CT/PT in each zone = total 12 CT/PT in a city (if population is <5 Lakh)- Assessors will randomly visit 5 CT/PT in each zone = total 20 CT/PT in a city (if population is >5 Lakh)- Assessors will not interact with anyone. It will be purely their assessment of the situation- Assessors will click the pictures to support their observation/assessment
Scheme of Ranking MarksYes 50
No 0
Independent Observation –
Community Toilet / Public Toilet (CT/PT)
5. Are Public/Community Toilets carrying IEC Messages designed by the Ministry in 2017 (Hoardings/ Banners/ Wall Paintings/Writing)

Methodology- Assessors will visit 2 biggest Commercial Area in each zone = total 8 in a city (if population is < 5 Lakh)- Assessors will visit 4 biggest Commercial Area in each zone = total 16 in a city (if population is < 5 Lakh)- Assessors will not interact with anyone. It will be purely their assessment of the situation- Assessors will click the pictures to support their observation/assessment
Independent Observation –
Commercial Areas
6. Is the Commercial Area Clean?
Scheme of Ranking Marks
Yes, 100% clean(Zero waste spot)
50
Yes, but not 100% clean(waste spotted in 1-5 points/locations)
30
Not clean(Waste spotted in >5 points/locations)
0
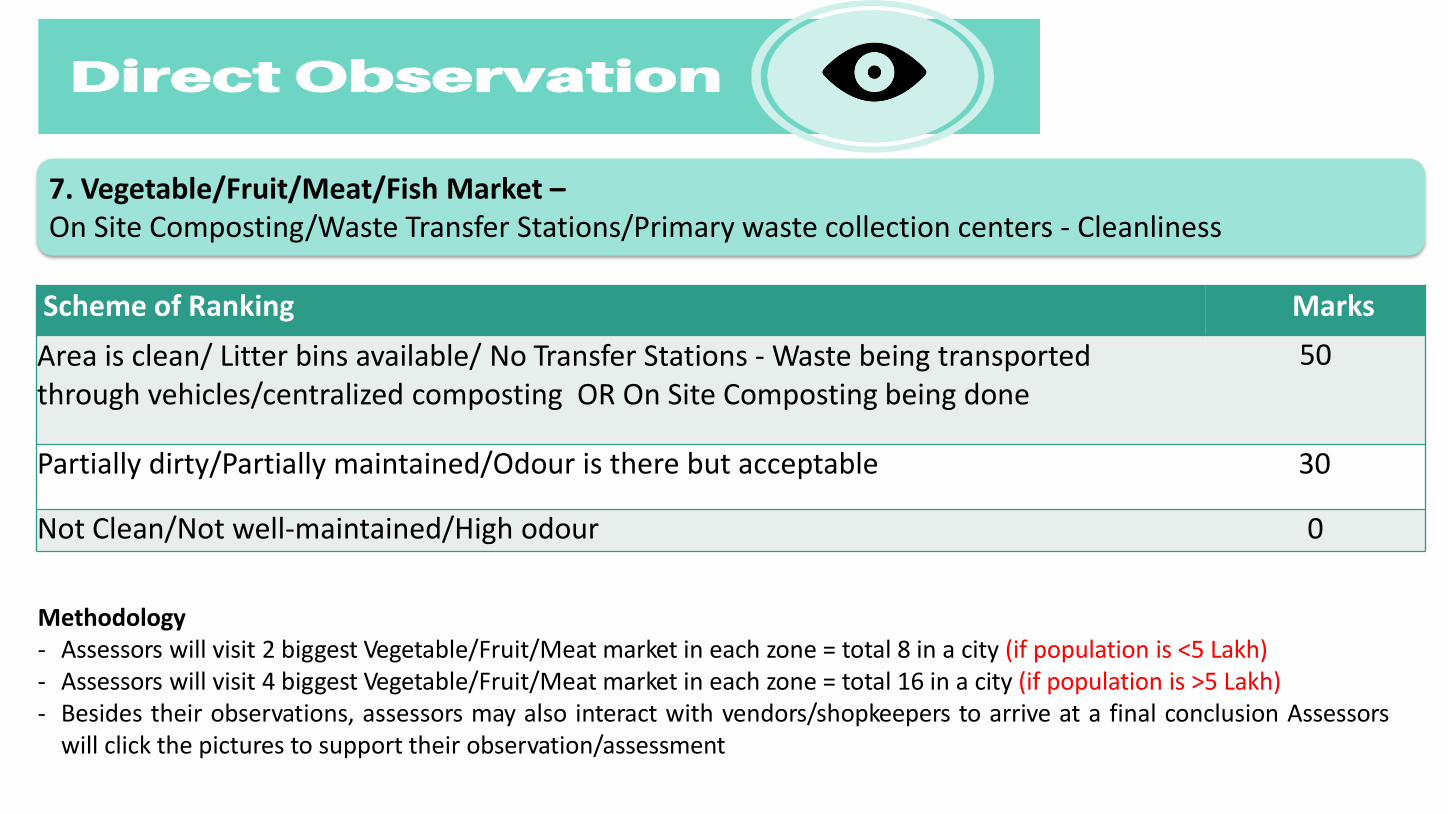
Methodology- Assessors will visit 2 biggest Vegetable/Fruit/Meat market in each zone = total 8 in a city (if population is <5 Lakh)- Assessors will visit 4 biggest Vegetable/Fruit/Meat market in each zone = total 16 in a city (if population is >5 Lakh)- Besides their observations, assessors may also interact with vendors/shopkeepers to arrive at a final conclusion Assessors
will click the pictures to support their observation/assessment
Scheme of Ranking Marks
Area is clean/ Litter bins available/ No Transfer Stations - Waste being transported through vehicles/centralized composting OR On Site Composting being done
50
Partially dirty/Partially maintained/Odour is there but acceptable 30
Not Clean/Not well-maintained/High odour 0
Independent Observation –
Vegetable/Fruit/Meat Market
7. Vegetable/Fruit/Meat/Fish Market –On Site Composting/Waste Transfer Stations/Primary waste collection centers - Cleanliness
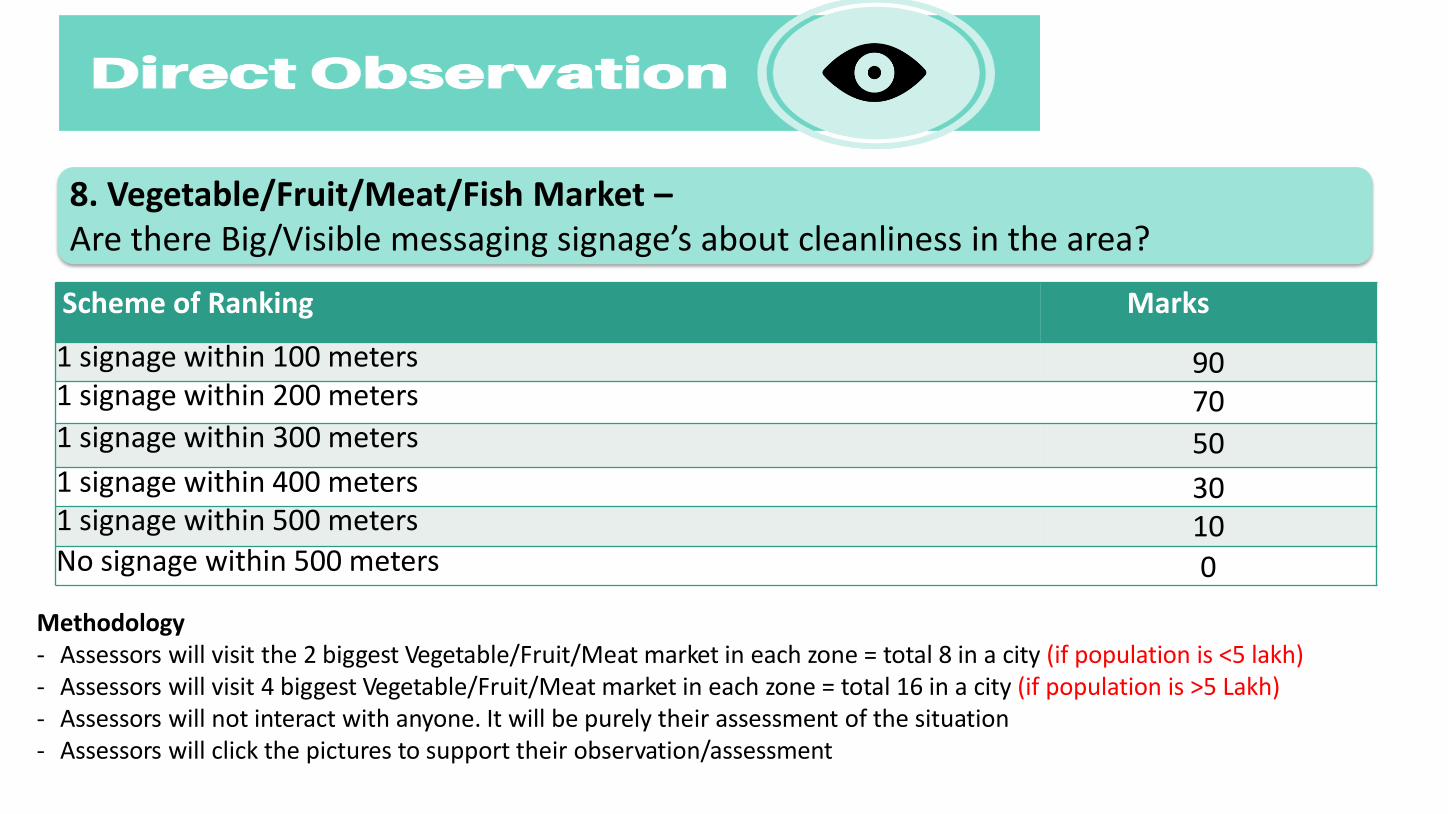
Methodology- Assessors will visit the 2 biggest Vegetable/Fruit/Meat market in each zone = total 8 in a city (if population is <5 lakh)- Assessors will visit 4 biggest Vegetable/Fruit/Meat market in each zone = total 16 in a city (if population is >5 Lakh)- Assessors will not interact with anyone. It will be purely their assessment of the situation- Assessors will click the pictures to support their observation/assessment
Scheme of Ranking Marks
1 signage within 100 meters 901 signage within 200 meters 701 signage within 300 meters 501 signage within 400 meters 301 signage within 500 meters 10No signage within 500 meters 0
Independent Observation –
Vegetable/Fruit/Meat Market
8. Vegetable/Fruit/Meat/Fish Market –Are there Big/Visible messaging signage’s about cleanliness in the area?
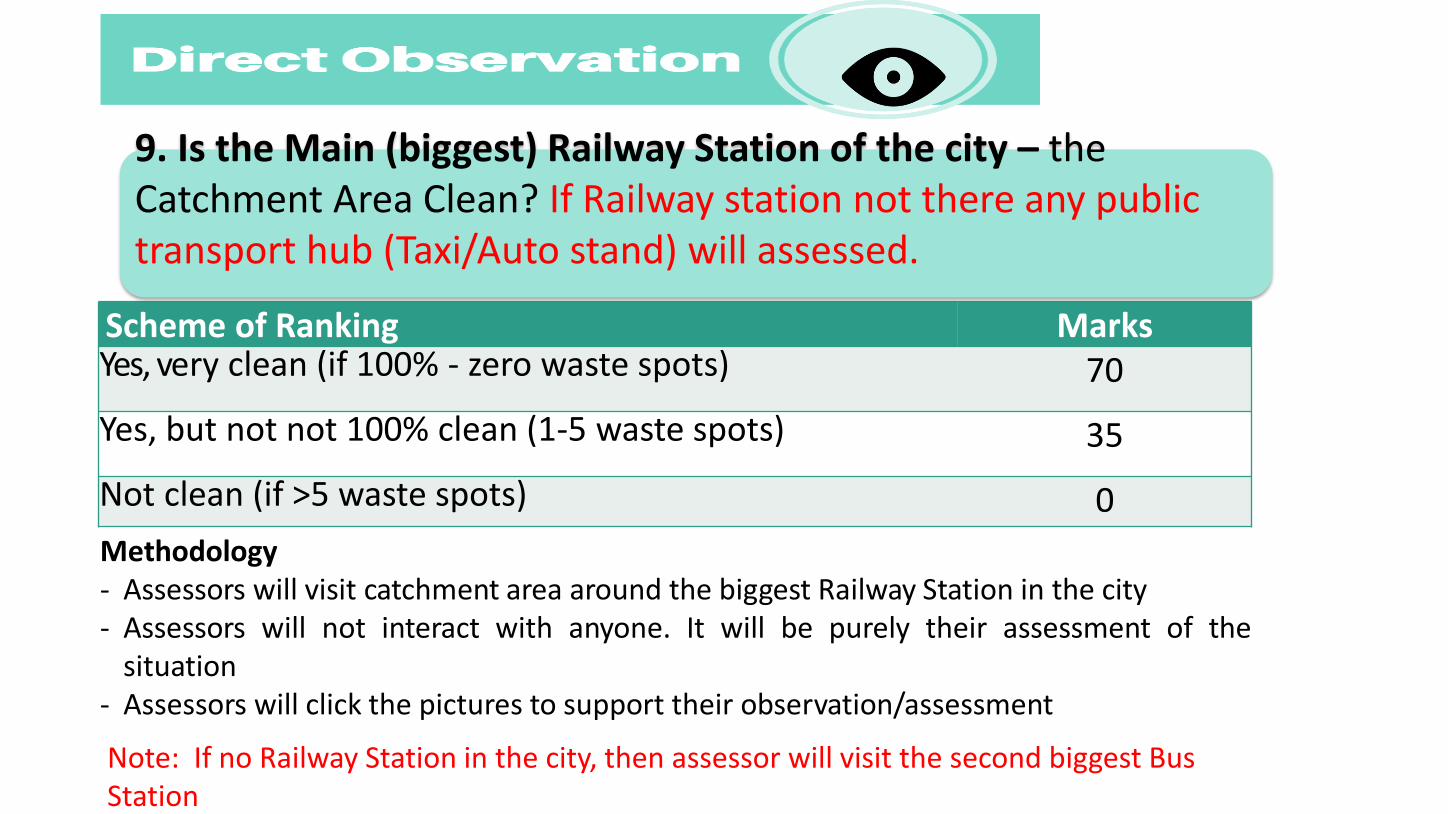
Methodology- Assessors will visit catchment area around the biggest Railway Station in the city- Assessors will not interact with anyone. It will be purely their assessment of the
situation- Assessors will click the pictures to support their observation/assessment
Scheme of Ranking MarksYes, very clean (if 100% - zero waste spots) 70
Yes, but not not 100% clean (1-5 waste spots) 35
Not clean (if >5 waste spots) 0
9. Is the Main (biggest) Railway Station of the city – the Catchment Area Clean? If Railway station not there any public transport hub (Taxi/Auto stand) will assessed.
Note: If no Railway Station in the city, then assessor will visit the second biggest Bus Station
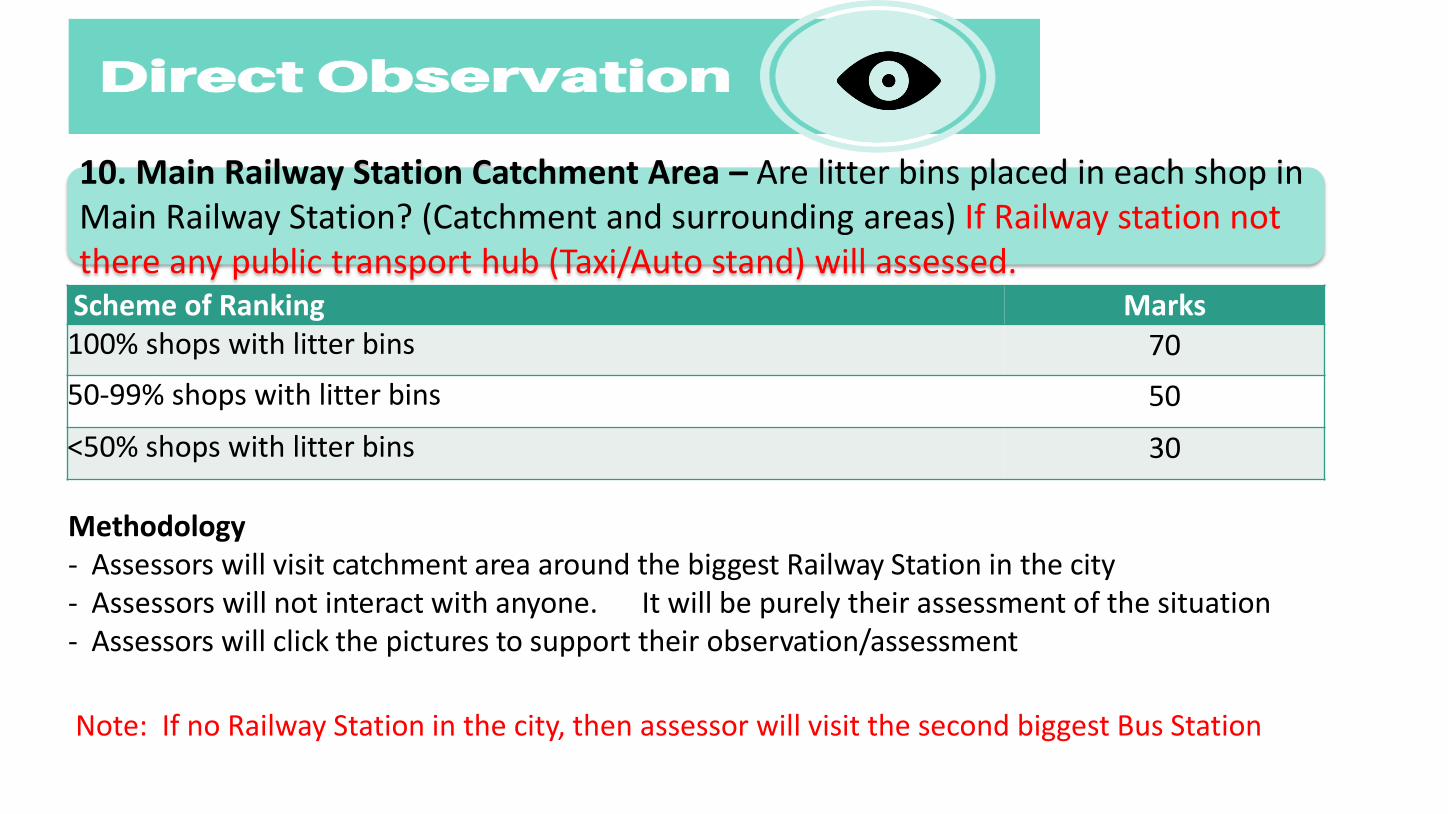
Methodology- Assessors will visit catchment area around the biggest Railway Station in the city- Assessors will not interact with anyone. It will be purely their assessment of the situation- Assessors will click the pictures to support their observation/assessment
Scheme of Ranking Marks100% shops with litter bins 70
50-99% shops with litter bins 50
<50% shops with litter bins 30
10. Main Railway Station Catchment Area – Are litter bins placed in each shop in Main Railway Station? (Catchment and surrounding areas) If Railway station not there any public transport hub (Taxi/Auto stand) will assessed.
Note: If no Railway Station in the city, then assessor will visit the second biggest Bus Station
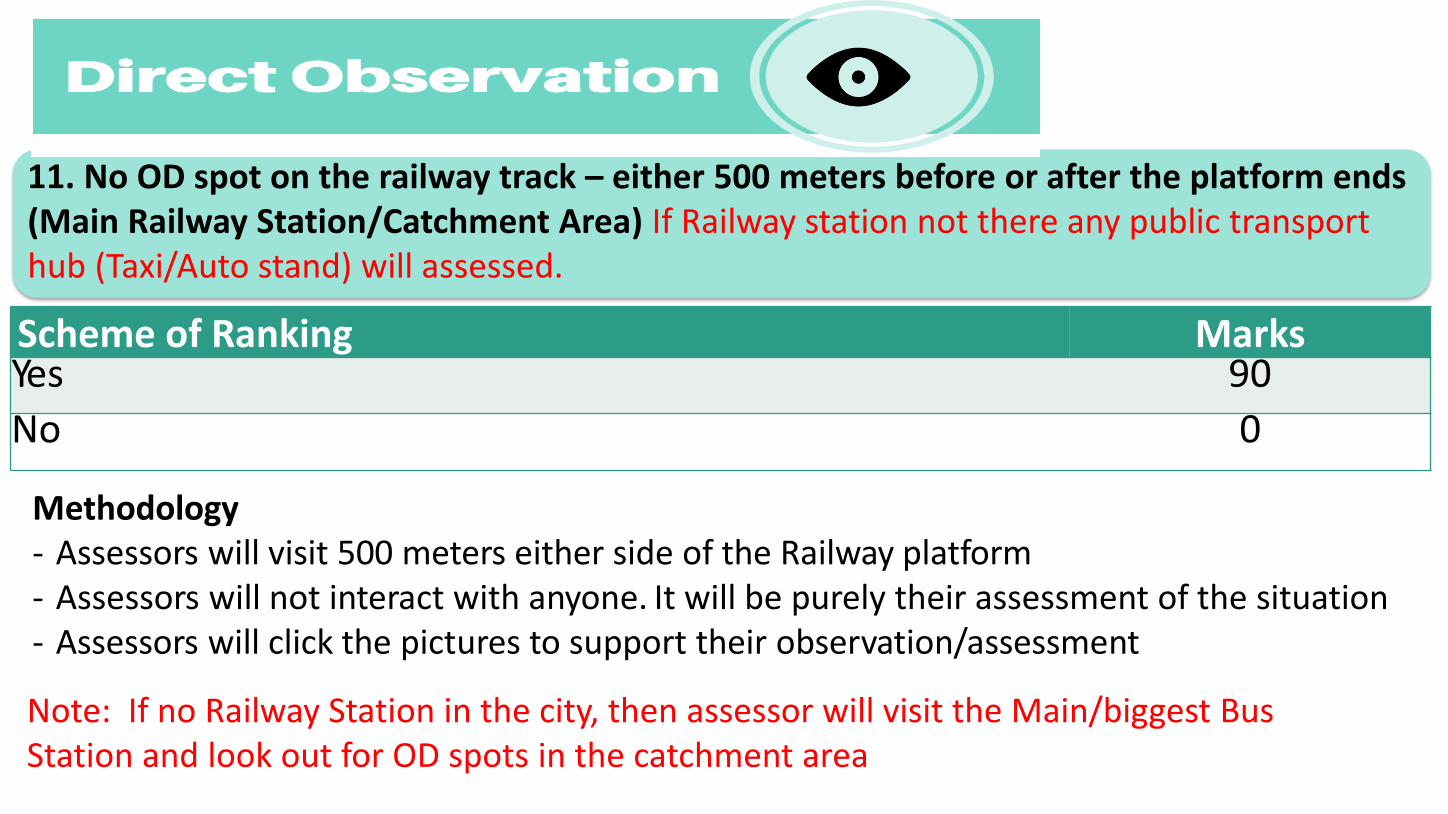
Methodology- Assessors will visit 500 meters either side of the Railway platform- Assessors will not interact with anyone. It will be purely their assessment of the situation- Assessors will click the pictures to support their observation/assessment
Scheme of Ranking MarksYes 90
No 0
11. No OD spot on the railway track – either 500 meters before or after the platform ends (Main Railway Station/Catchment Area) If Railway station not there any public transport hub (Taxi/Auto stand) will assessed.
Note: If no Railway Station in the city, then assessor will visit the Main/biggest Bus Station and look out for OD spots in the catchment area

Methodology- Assessors will visit catchment area around the biggest Bus Station in the city- Assessors will not interact with anyone. It will be purely their assessment of the situation- Assessors will click the pictures to support their observation/assessment
12. Main Bus Station - Is the Catchment Area Clean? If Bus Stand not there any public transport hub (Taxi/Auto stand) will assessed.
Scheme of Ranking MarksYes, very clean (if 100% - zero waste spots) 70Yes, but not not 100% clean (1-5 waste spots) 35Not clean (if >5 waste spots) 0

Methodology- Assessors will visit catchment area around the biggest Bus Station in the city- Assessors will not interact with anyone. It will be purely their assessment of the situation- Assessors will click the pictures to support their observation/assessment
Scheme of Ranking Marks100% shops with litter bins 7050-99% shops with litter bins 50<50% shops with litter bins 30
13. Main Bus Station catchment area - Litter Bins are placed in each shop in the Main Bus Station. If Bus Stand not there any public transport hub (Taxi/Auto stand) will assessed.

Methodology- Assessors will visit Public Toilet in the catchment area around the biggest Bus Station in the city- Assessors will not interact with anyone. It will be purely their assessment of the situation- Assessors will click the pictures to support their observation/assessment
Scheme of Ranking MarksYes to all 3 70Yes to any 2 50Yes to just 1 30None 0
14. Main Bus Station Catchment area - Public Toilet is gender friendly (Separate section for Men and Women), child friendly and caters well to differently abled people. If Bus Stand not there any public transport hub (Taxi/Auto stand) will assessed.
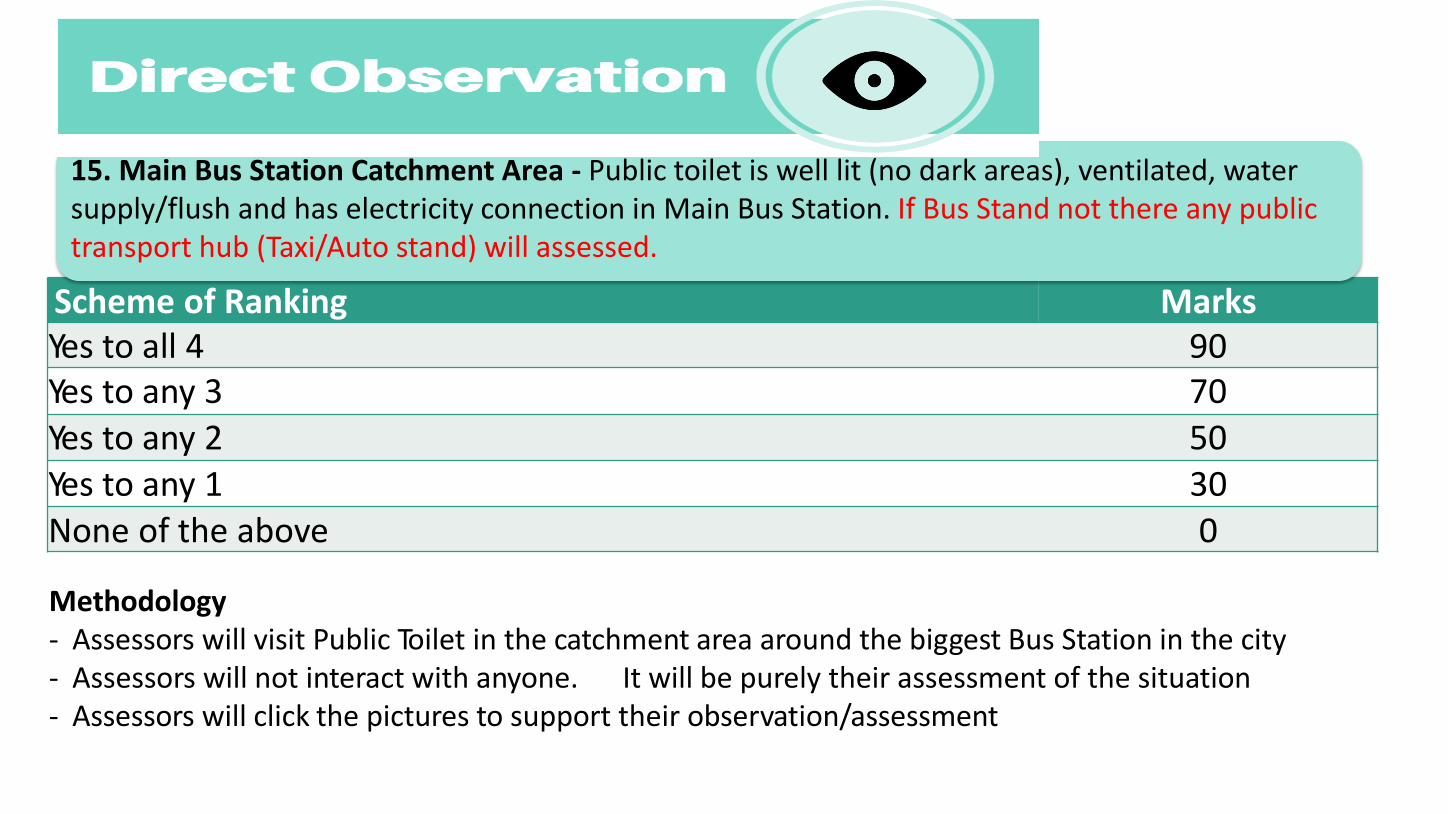
Methodology- Assessors will visit Public Toilet in the catchment area around the biggest Bus Station in the city- Assessors will not interact with anyone. It will be purely their assessment of the situation- Assessors will click the pictures to support their observation/assessment
Scheme of Ranking MarksYes to all 4 90Yes to any 3 70Yes to any 2 50Yes to any 1 30None of the above 0
15. Main Bus Station Catchment Area - Public toilet is well lit (no dark areas), ventilated, water supply/flush and has electricity connection in Main Bus Station. If Bus Stand not there any public transport hub (Taxi/Auto stand) will assessed.

Methodology- Assessors will visit Public Toilet in the catchment area around the biggest Bus Station in the city- Assessors will not interact with anyone. It will be purely their assessment of the situation- Assessors will click the pictures to support their observation/assessment
Scheme of Ranking MarksYes 50No 0
16. Main Bus Station Catchment area - Is the public toilet connected with onsite safe disposal system or sewer network i.e. no open drainage/no manual scavenging/no pit latrines. If Bus Stand not there any public transport hub (Taxi/Auto stand) will assessed.
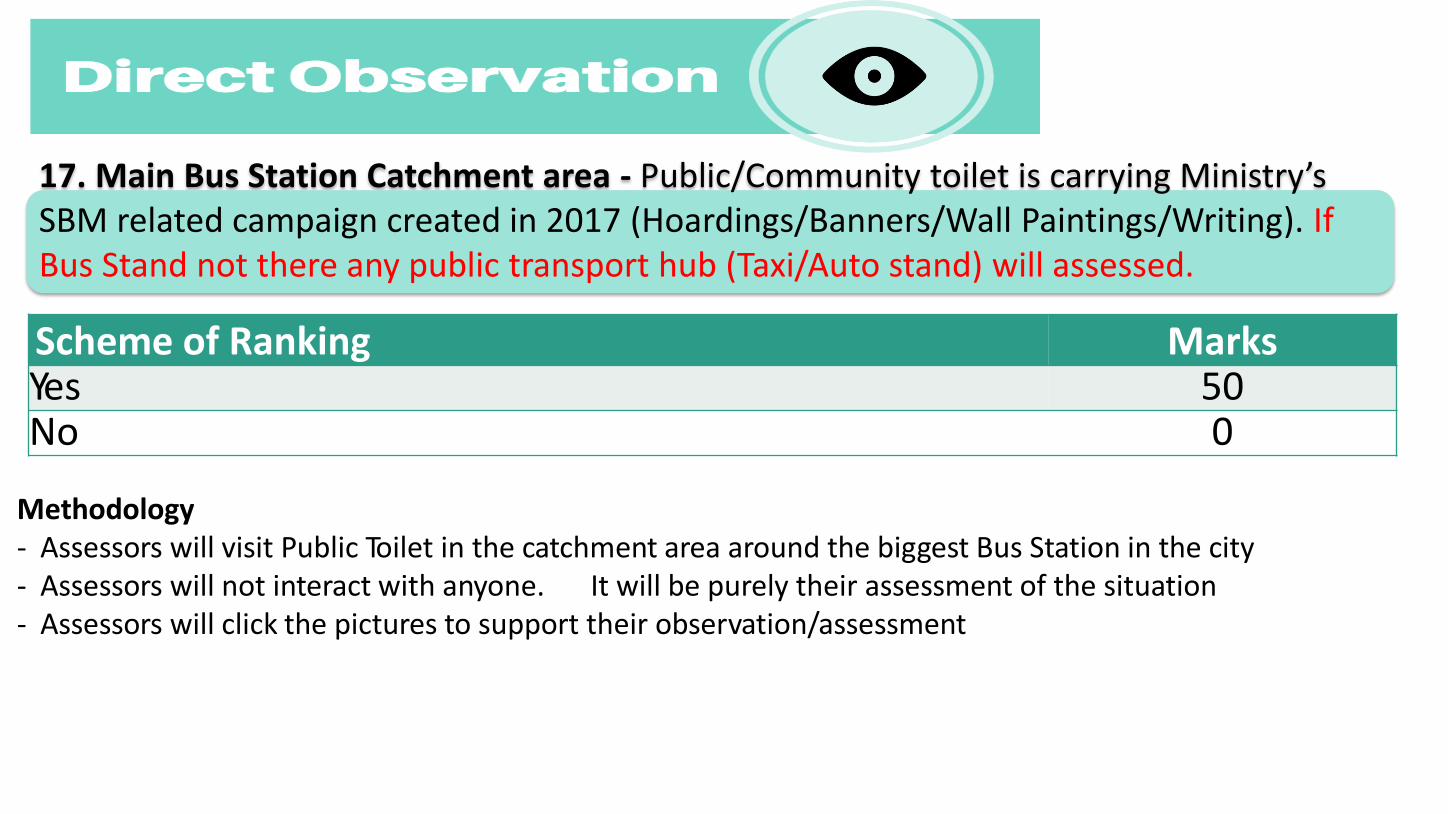
Methodology- Assessors will visit Public Toilet in the catchment area around the biggest Bus Station in the city- Assessors will not interact with anyone. It will be purely their assessment of the situation- Assessors will click the pictures to support their observation/assessment
Scheme of Ranking MarksYes 50No 0
17. Main Bus Station Catchment area - Public/Community toilet is carrying Ministry’s SBM related campaign created in 2017 (Hoardings/Banners/Wall Paintings/Writing). If Bus Stand not there any public transport hub (Taxi/Auto stand) will assessed.
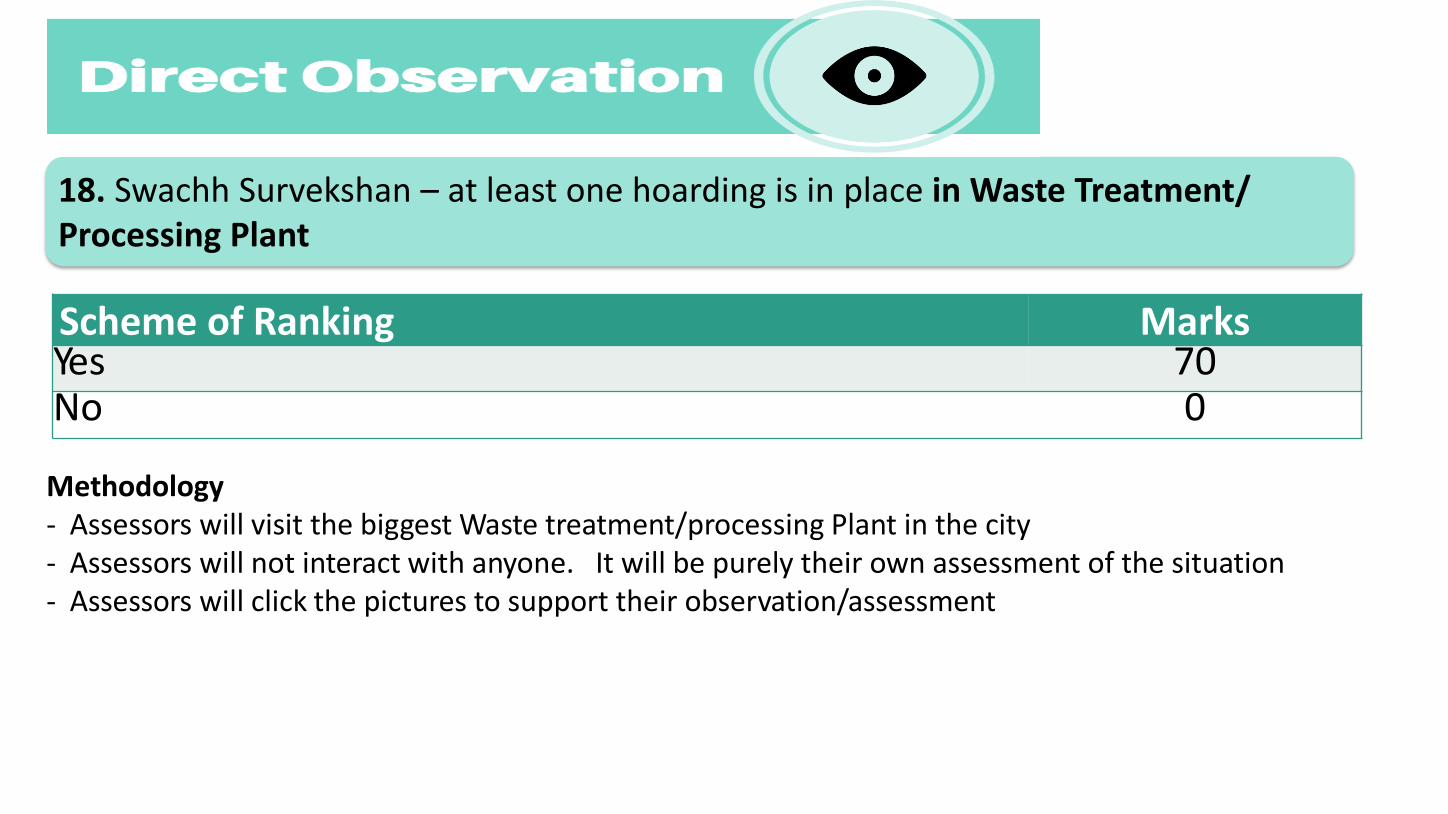
Methodology- Assessors will visit the biggest Waste treatment/processing Plant in the city- Assessors will not interact with anyone. It will be purely their own assessment of the situation- Assessors will click the pictures to support their observation/assessment
Scheme of Ranking MarksYes 70No 0
Independent Observation –
Waste Treatment / Processing Plant
18. Swachh Survekshan – at least one hoarding is in place in Waste Treatment/ Processing Plant
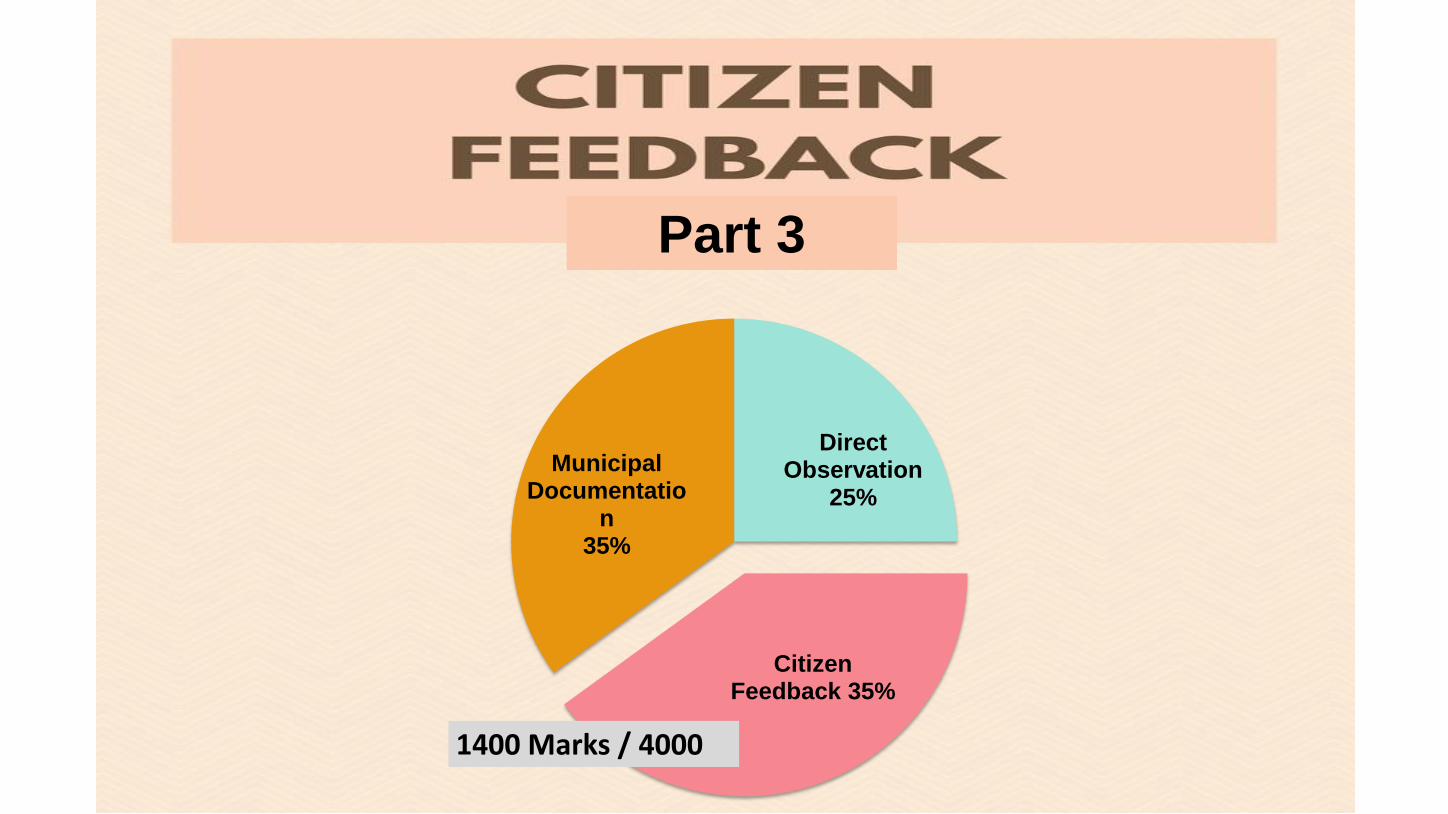
Direct Observation
25%
Citizen Feedback 35%
Municipal Documentatio
n35%
1400 Marks / 4000
Part 3
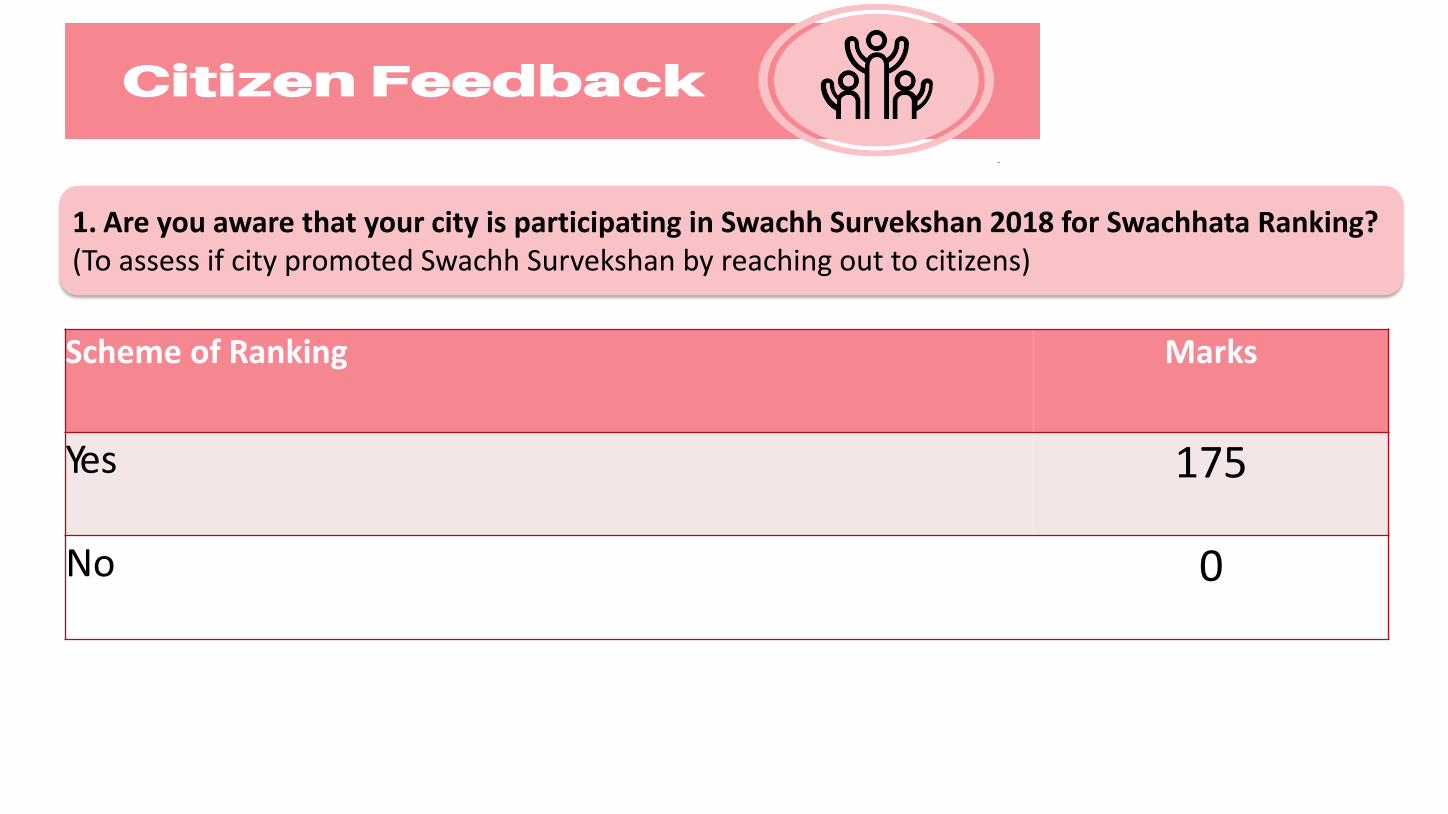
Scheme of Ranking Marks
Yes 175
No 0
1. Are you aware that your city is participating in Swachh Survekshan 2018 for Swachhata Ranking?(To assess if city promoted Swachh Survekshan by reaching out to citizens)
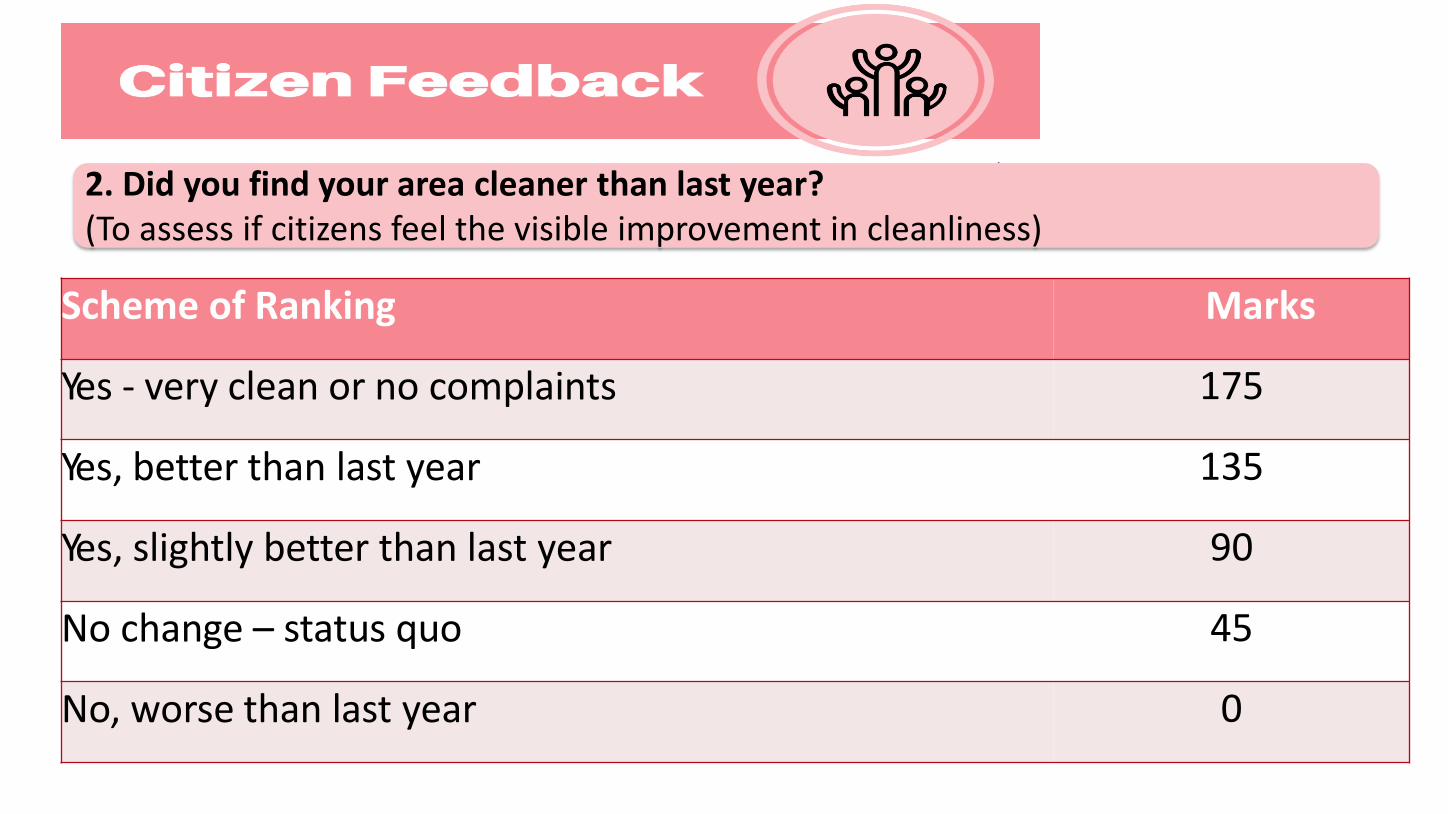
Scheme of Ranking Marks
Yes - very clean or no complaints 175
Yes, better than last year 135
Yes, slightly better than last year 90
No change – status quo 45
No, worse than last year 0
2. Did you find your area cleaner than last year?(To assess if citizens feel the visible improvement in cleanliness)

Scheme of Ranking Marks
Yes, much greater utilization 150
Yes, slightly more 70
Not much 30
Not at all 0
3. This year, have you started utilizing litter bins placed in public areas?(To assess if ULB has placed litter bins in the critical locations – commercial/residential areas)
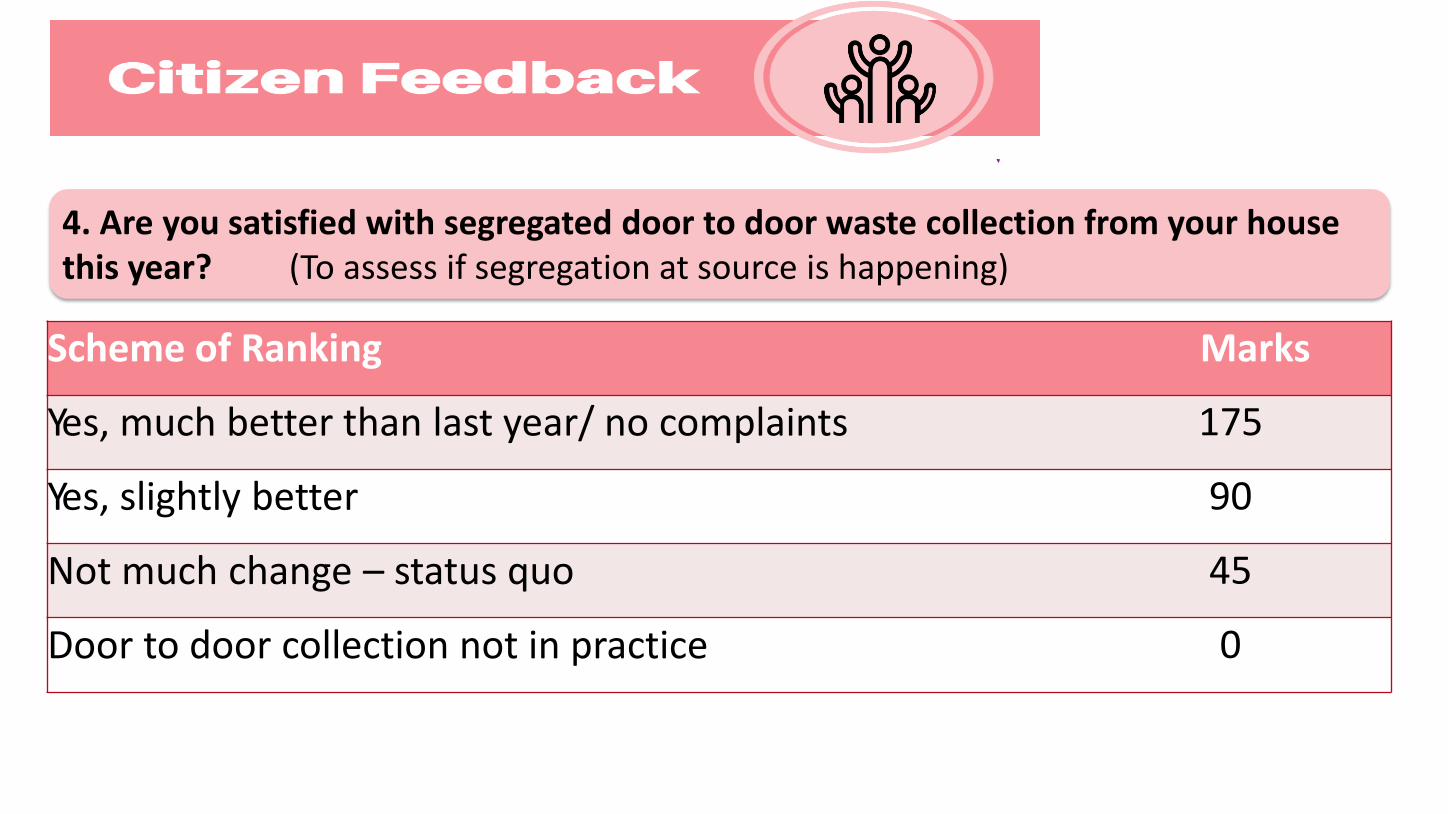
Scheme of Ranking Marks
Yes, much better than last year/ no complaints 175
Yes, slightly better 90
Not much change – status quo 45
Door to door collection not in practice 0
4. Are you satisfied with segregated door to door waste collection from your house this year? (To assess if segregation at source is happening)
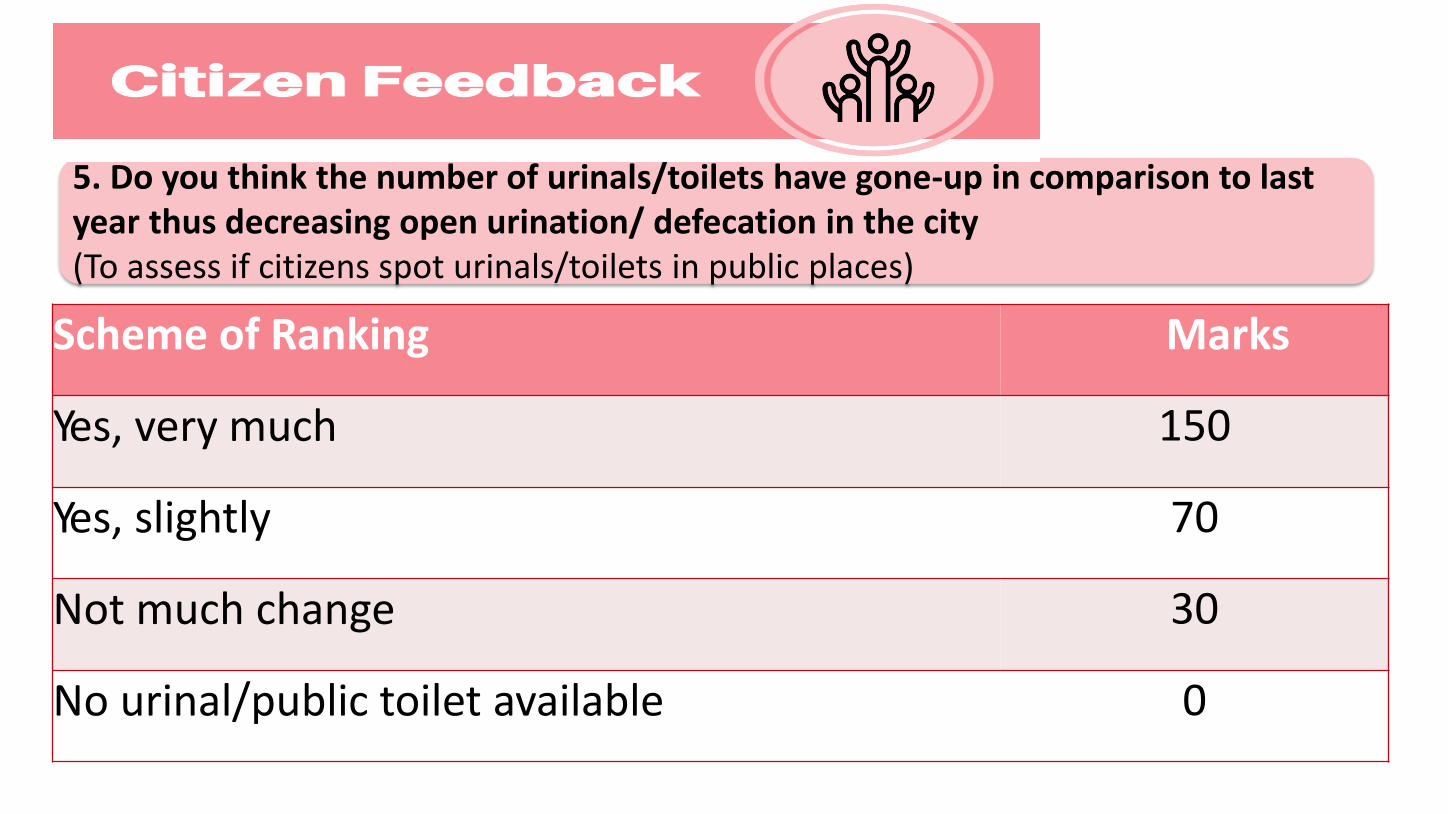
Scheme of Ranking Marks
Yes, very much 150
Yes, slightly 70
Not much change 30
No urinal/public toilet available 0
5. Do you think the number of urinals/toilets have gone-up in comparison to last year thus decreasing open urination/ defecation in the city(To assess if citizens spot urinals/toilets in public places)

Scheme of Ranking Marks
Yes, much better 175
Yes, slightly better 135
Not much improvement 90
Not better – status quo 45
Worst than last year 0
6. Are CT/PTs are now more clean and accessible?(This indicator assesses whether citizens feel comfortable using public conveniences)
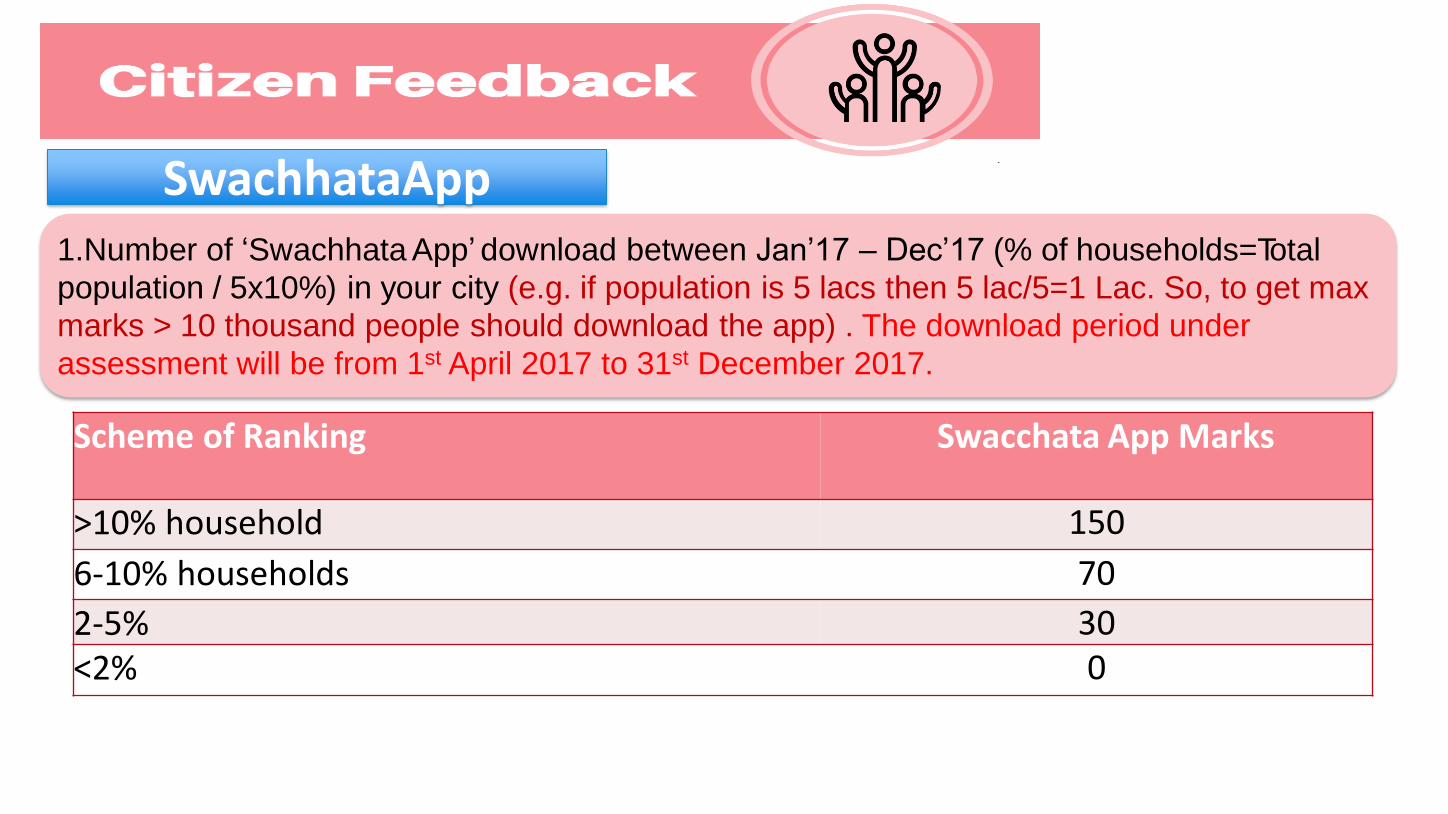
Scheme of Ranking Swacchata App Marks
>10% household 150
6-10% households 70
2-5% 30<2% 0
1.Number of ‘Swachhata App’ download between Jan’17 – Dec’17 (% of households=Total
population / 5x10%) in your city (e.g. if population is 5 lacs then 5 lac/5=1 Lac. So, to get max
marks > 10 thousand people should download the app) . The download period under
assessment will be from 1st April 2017 to 31st December 2017.
SwachhataApp

Scheme of Ranking Marks
100% complaints resolved 150
Between 80-99% 75
Between 60-79% 50Between 40-59% 25<40% 0
2. What percentage of complaints are resolved within SLA (Service Level
Agreement) time frame
SwachhataApp
An additional performance
grade is added, given below-Scheme of Ranking Marks
100% complaints resolved 150
80-99% resolved 125
60-79% resolved 75
40-59% resolved 40
<40% resolved 0

Scheme of Ranking MarksRank 1 to 20 100Rank 21 to 40 80 Rank 41 to 60 60Rank 61 to 80 40Rank 81 or above 20
3. Is your city featured in top-20 cities under ‘Swachhata App’ dynamic
ranking (resolution rate) anytime between April and December 2017
SwachhataApp


KPMG.com/in
…..from 4th January, 2018
Anil Prakash99-718-13666