candles and incense as potential sources of indoor air pollution
TRANSCRIPT

Uni ted States EPA-600/R-01-001Environmental Protect ionAgency January 2001
Research andDevelopment
CANDLES AND INCENSE ASPOTENTIAL SOURCES OFINDOOR AIR POLLUTION:MARKET ANALYSIS ANDLITERATURE REVIEW
Prepared for
Office of Research and Development
Prepared by
National Risk ManagementResearch LaboratoryResearch Triangle Park, NC 27711

FOREWORD
The U. S. Environmental Protection Agency is charged by Congress with pro-tecting the Nation's land, air, and water resources. Under a mandate of nationalenvironmental laws, the Agency strives to formulate and implement actions lead-ing to a compatible balance between human activities and the ability of naturalsystems to support and nurture life. To meet this mandate, EPA's researchprogram is providing data and technical support for solving environmental pro-blems today and building a science knowledge base necessary to manage our eco-logical resources wisely, understand how pollutants affect our health, and pre-vent or reduce environmental risks in the future.
The National Risk Management Research Laboratory is the Agency's center forinvestigation of technological and management approaches for reducing risksfrom threats to human health and the environment. The focus of the Laboratory'sresearch program is on methods for the prevention and control of pollution to air,land, water, and subsurface resources, protection of water quality in public watersystems; remediation of contaminated sites and-groundwater; and prevention andcontrol of indoor air pollution. The goal of this research effort is to catalyzedevelopment and implementation of innovative, cost-effective environmentaltechnologies; develop scientific and engineering information needed by EPA tosupport regulatory and policy decisions; and provide technical support and infor-mation transfer to ensure effective implementation of environmental regulationsand strategies.
This publication has been produced as part of the Laboratory's strategic long-term research plan. It is published and made available by EPA's Office of Re-search and Development to assist the user community and to link researcherswith their clients.
E. Timothy Oppelt, DirectorNational Risk Management Research Laboratory
EPA REVIEW NOTICE
This report has been peer and administratively reviewed by the U.S. EnvironmentalProtection Agency, and approved for publication. Mention of trade names orcommercial products does not constitute endorsement or recommendation for use.
This document is available to the public through the National Technical Information
Service, Springfield, Virginia 22161.

E PA-600/ R-01-001January 2001
CANDLES AND INCENSE AS POTENTIAL
SOURCES OF INDOOR AIR POLLUTION:
MARKET ANALYSIS AND
LITERATURE REVIEW
PREPARED BY:Lynn Knight, Arlene Levin, and Catherine Mendenhall
Eastern Research Group, Inc.110 Hartwell AvenueLexington, MA 02421
EPA Contract 68-D7-0001EPA Project Officer: Zhishi Guo
National Risk Management Research LaboratoryResearch Triangle Park, NC 27711
PREPARED FOR:U.S. Environmental Protection AgencyOffice of Research and Development
Washington, D.C. 20460

ii
Abstract
The report summarizes available information on candles and incense as potential sources of
indoor air pollution. It covers (1) market information and (2) a scientific literature review. The
market information collected focuses on production and sales data, typical uses in the US, and
data on the sources and quantities of imported products. The estimated total sales of candles in
1999 varied between $968 million and $2.3 billion, while imports were $486 million. The US
imports and exports of incense in 1999 were $12.4 and 4.6 million, respectively. The scientific
literature review gathered information regarding the emission of various contaminants generated
when burning candles and incense, as well as the potential health effects associated with
exposure to these contaminants. Burning candles and incense can be sources of particulate
matter. Burning candles with lead core wicks may result in indoor air concentrations of lead
above EPA-recommended thresholds. Exposure to incense smoke has been linked with several
illnesses, and certain brands of incense also contain chemicals suspected of causing skin
irritation.

iii
Table of Contents
Abstract . . . . . . . . . . . . . . . . . . . . . . . . . . . . . . . . . . . . . . . . . . . . . . . . . . . . . . . . . . . . . . . . . . . . . . ii
Tables . . . . . . . . . . . . . . . . . . . . . . . . . . . . . . . . . . . . . . . . . . . . . . . . . . . . . . . . . . . . . . . . . . . . . . . . v
1. Findings . . . . . . . . . . . . . . . . . . . . . . . . . . . . . . . . . . . . . . . . . . . . . . . . . . . . . . . . . . . . . . . . . . . 1
1.A Economic Data on Candle and Incense Production and Sales . . . . . . . . . . . . . . . . . . 1
1.B Potential Indoor Air Quality Impacts of Burning Candles and Incense . . . . . . . . . . . 2
2. Background . . . . . . . . . . . . . . . . . . . . . . . . . . . . . . . . . . . . . . . . . . . . . . . . . . . . . . . . . . . . . . . . . 4
3. Economic Data on Candle and Incense Production and Sales . . . . . . . . . . . . . . . . . . . . . . . . . 5
3.A Candles . . . . . . . . . . . . . . . . . . . . . . . . . . . . . . . . . . . . . . . . . . . . . . . . . . . . . . . . . . . . . 5
Number of Candle Manufacturers . . . . . . . . . . . . . . . . . . . . . . . . . . . . . . . . . . . . . . 6
Sales . . . . . . . . . . . . . . . . . . . . . . . . . . . . . . . . . . . . . . . . . . . . . . . . . . . . . . . . . . . . . 8
Market Trends . . . . . . . . . . . . . . . . . . . . . . . . . . . . . . . . . . . . . . . . . . . . . . . . . . . . 11
Sources of Imported Candles . . . . . . . . . . . . . . . . . . . . . . . . . . . . . . . . . . . . . . . . 13
Product Use in the US . . . . . . . . . . . . . . . . . . . . . . . . . . . . . . . . . . . . . . . . . . . . . . 16
3.B Incense . . . . . . . . . . . . . . . . . . . . . . . . . . . . . . . . . . . . . . . . . . . . . . . . . . . . . . . . . . 16
4. Potential Indoor Air Quality Impacts of Burning Candles and Incense . . . . . . . . . . . . . . . . . 21
4.A Candles . . . . . . . . . . . . . . . . . . . . . . . . . . . . . . . . . . . . . . . . . . . . . . . . . . . . . . . . . . . . 21
Lead Wick Emissions . . . . . . . . . . . . . . . . . . . . . . . . . . . . . . . . . . . . . . . . . . . . . . 22
Other Metals . . . . . . . . . . . . . . . . . . . . . . . . . . . . . . . . . . . . . . . . . . . . . . . . . . . . . 24
Organics . . . . . . . . . . . . . . . . . . . . . . . . . . . . . . . . . . . . . . . . . . . . . . . . . . . . . . . . . 25

iv
Particulate Matter . . . . . . . . . . . . . . . . . . . . . . . . . . . . . . . . . . . . . . . . . . . . . . . . . 28
Candle Soot . . . . . . . . . . . . . . . . . . . . . . . . . . . . . . . . . . . . . . . . . . . . . . . . . . . . . . 30
Conclusion . . . . . . . . . . . . . . . . . . . . . . . . . . . . . . . . . . . . . . . . . . . . . . . . . . . . . . . 32
4.B Incense . . . . . . . . . . . . . . . . . . . . . . . . . . . . . . . . . . . . . . . . . . . . . . . . . . . . . . . . . . . . 33
Carbon Monoxide . . . . . . . . . . . . . . . . . . . . . . . . . . . . . . . . . . . . . . . . . . . . . . . . . 34
Isoprene . . . . . . . . . . . . . . . . . . . . . . . . . . . . . . . . . . . . . . . . . . . . . . . . . . . . . . . . . 35
Benzene . . . . . . . . . . . . . . . . . . . . . . . . . . . . . . . . . . . . . . . . . . . . . . . . . . . . . . . . . 35
Musk Xylene, Musk Ketone, and Musk Ambrette . . . . . . . . . . . . . . . . . . . . . . . . 36
Particulate Matter . . . . . . . . . . . . . . . . . . . . . . . . . . . . . . . . . . . . . . . . . . . . . . . . . . 36
Polyaromatic Hydrocarbons . . . . . . . . . . . . . . . . . . . . . . . . . . . . . . . . . . . . . . . . . . 37
Conclusion . . . . . . . . . . . . . . . . . . . . . . . . . . . . . . . . . . . . . . . . . . . . . . . . . . . . . . . 37
5. References . . . . . . . . . . . . . . . . . . . . . . . . . . . . . . . . . . . . . . . . . . . . . . . . . . . . . . . . . . . . . . . . . 39

v
Tables
Table 1: Total Sales of Candle Companies in 1999 . . . . . . . . . . . . . . . . . . . . . . . . . . . . . . . . . . . 10
Table 2: Percent of Candle Sales by Distribution Channel . . . . . . . . . . . . . . . . . . . . . . . . . . . . . 11
Table 3: 1999 Candle Imports . . . . . . . . . . . . . . . . . . . . . . . . . . . . . . . . . . . . . . . . . . . . . . . . . . . . 14
Table 4: Sources of Imported Candles in 1999 . . . . . . . . . . . . . . . . . . . . . . . . . . . . . . . . . . . . . . 15
Table 5: 1999 Imports of Odoriferous Preparations Which Operate By Burning . . . . . . . . . . . . 19
Table 6: Indoor Air Impacts of Burning Candles . . . . . . . . . . . . . . . . . . . . . . . . . . . . . . . . . . . . . 29

1
1. Findings
The purpose of this report is to collect economic information regarding the production and sales
of candles and incense in the US, including information about imports. A second objective is to
review the scientific literature regarding emission rates and potential human health effects
associated with burning candles and incense. The following is a brief overview of the findings.
1.A ECONOMIC DATA ON CANDLE AND INCENSE PRODUCTION AND SALES
• The Census Bureau reports 107 manufacturing establishments; however, industry
estimates range from 160 to over 200 manufacturers. Many manufacturers are very small.
• Candle sales have been growing rapidly in the last 10 years (10 to 15 percent per year),
fueled by consumer interest in aroma therapy and increased demand for home fragrance
products in general.
• The Census Bureau reports a total value of shipments in 1997 of $968 million; industry
estimates put 1999 sales at $1.3 billion just for scented candles, and up to $2.3 billion for
all candles.
• The top five countries that export candles to the US are China, Taiwan, England, Hong
Kong, and Mexico.

2
• There are no public data on incense manufacturers; private data show at least 26
manufacturers. Limited discussions with some industry representatives indicate that there
are probably many more very small manufacturers.
• The top five countries that export incense to the US are India, China, Thailand, Japan,
and Hong Kong.
1.B POTENTIAL INDOOR AIR QUALITY IMPACTS OF BURNING CANDLES AND INCENSE
• Burning candles containing lead core wicks can result in indoor air concentrations of lead
above EPA-recommended thresholds.
• In the scientific literature we reviewed, zinc and tin were found not to be emitted at
concentrations that would raise concerns when burned indoors.
• One study showed worst-case scenario concentrations of acrolein, formaldehyde, and
acetaldehyde from candle emissions exceeding EPA-recommended thresholds.
• Sooting can occur when combustion conditions are impaired when burning candles.
Scented candles are more likely to produce soot than unscented candles. Sooting can

3
cause property damage by blackening surfaces. We could not identify any studies on
potential human health effects associated with soot from candles.
• Several studies indicated links between exposure to incense smoke and health effects,
including cancers and contact dermatitis. A few studies indicated possible mutagenic and
genotoxic effects.
• Studies that examined the emissions of specific contaminants from incense smoke
indicated that benzene and particulate matter may be emitted at concentrations that could
pose human health risks.

4
2. BACKGROUND
The potential indoor air impacts of burning candles and incense have drawn increased attention
in recent years. For example, candles with lead wicks have been found on the market and have
been shown to emit lead when burned. Sooting associated with burning candles can cause
property damage by blackening walls, ceilings, and carpets. Incense smoke can be a major
source of particulates in indoor air. Emissions from incense may contain contaminants that can
cause a variety of health effects.
EPA is currently testing the emissions from candles and incense to generate data for analyzing
risk management options. To support this effort, this report collects and presents information on
the production and sales of candles and incense, the sources and quantities of imported products,
and the typical product uses in the US. This information will help EPA in assessing the nature
and extent of human exposure. In addition, this report summarizes the results and findings in the
scientific literature regarding the emission rates of the various contaminants generated when
burning candles and incense, as well as the potential health effects associated with exposure to
these contaminants. EPA will use this information to further their research and understanding of
the potential impacts of these sources on indoor air quality.

5
3. ECONOMIC DATA ON CANDLE AND INCENSE PRODUCTION AND
SALES
3.A CANDLES
A variety of candle types are manufactured in the US, including tapers, straight-sided dinner
candles, spirals, column, votives, tealights, wax-filled containers, and novelties. Some are
scented and all come in a wide range of colors. Wax candles contain petroleum wax, vegetable
wax, animal wax, or insect wax as the primary fuel. The wax may contain additives for color,
fragrance, stability, or to modify the burning characteristics.
Gel candles use liquids such as mineral oil, terpene-type chemicals, or modified hydrocarbons as
their primary fuel. These candles also contain chemical agents to increase the viscosity of the
fuel to the point where the candle has a quasi-rigid property.
Candles support one or more combustible wicks. Metal is put in some wick cores to keep the
wick standing straight when the surrounding wax begins to melt. The metal prevents the wick
from falling over and extinguishing itself as soon as the wax fails to support it. Many companies
use a braided wick, which consists of three smaller wicks wound together to provide some
stiffness.
Lead was commonly used as a core material until 1974 when the US candle manufacturing
industry voluntarily agreed to discontinue use of lead in wicks. There are, however, still candles

on the market that contain lead wick cores. Most of these are imported. Zinc is commonly used
as an alternative metal core for the wicks, since it provides the desired amount of stiffness, burns
off readily with the rest of the wick, and the airborne particles from zinc wicks are considered
safer.1
Scented candles have grown in popularity and are widely used. The majority of candle
manufacturers offer scented candles. Seventy-five percent of the manufacturers who are
members of the National Candle Association (NCA) listed fragranced candles among the types of
candles they produce. Forty percent say they manufacture citronella candles (NCA, 1999).
Citronella is an insect repellant.
Number of Candle Manufacturers
The candle industry is a relatively small industry and does not have an abundance of publicly
available data. The 1997 Economic Census published by the US Census Bureau reports 107
manufacturing establishments with a primary North American Industry Classification System
(NAICS) product classification code of 3399995, defined as “candles, including tapers” (US
Census Bureau, 1999). These establishments collectively employed 8,536 workers. The Census
Bureau has very limited data available since the industry is identified at the 7-digit level.
ERG conducted an online search of the Thomas Register of American Manufacturers. This
1Telephone communication between Marianne McDermott, Executive Vice President, National CandleAssociation, and Lynn Knight, ERG, August 18, 2000.
6
7
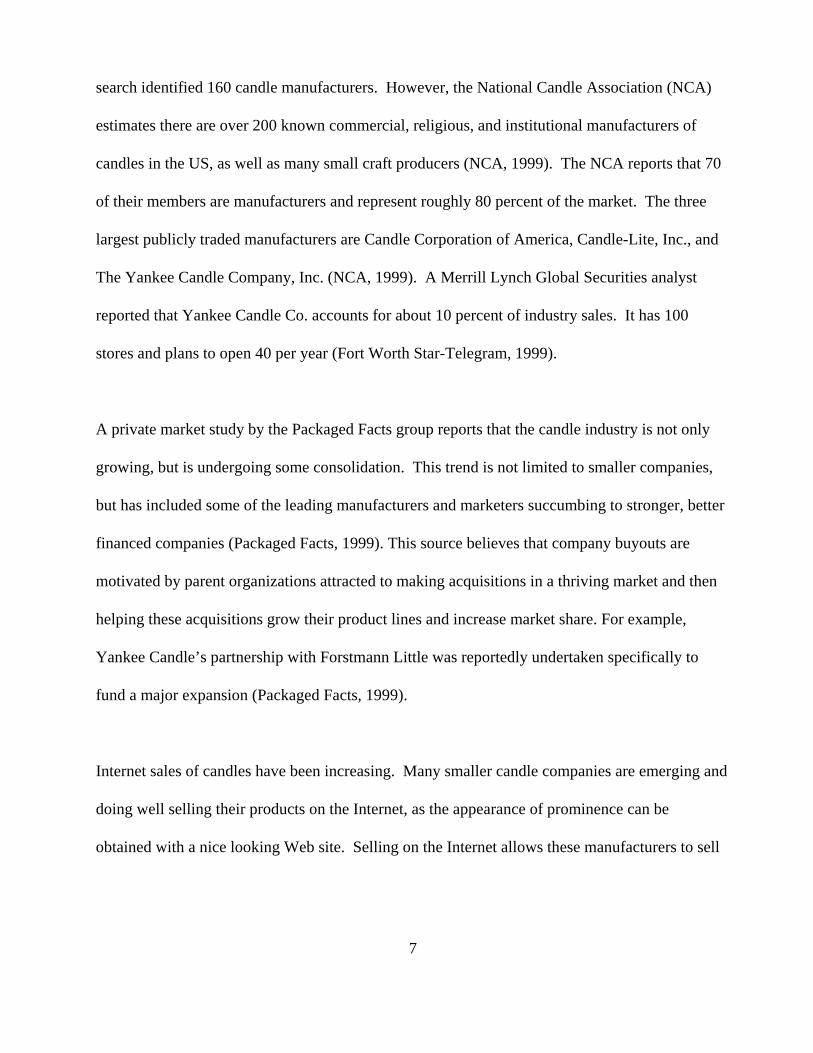
search identified 160 candle manufacturers. However, the National Candle Association (NCA)
estimates there are over 200 known commercial, religious, and institutional manufacturers of
candles in the US, as well as many small craft producers (NCA, 1999). The NCA reports that 70
of their members are manufacturers and represent roughly 80 percent of the market. The three
largest publicly traded manufacturers are Candle Corporation of America, Candle-Lite, Inc., and
The Yankee Candle Company, Inc. (NCA, 1999). A Merrill Lynch Global Securities analyst
reported that Yankee Candle Co. accounts for about 10 percent of industry sales. It has 100
stores and plans to open 40 per year (Fort Worth Star-Telegram, 1999).
A private market study by the Packaged Facts group reports that the candle industry is not only
growing, but is undergoing some consolidation. This trend is not limited to smaller companies,
but has included some of the leading manufacturers and marketers succumbing to stronger, better
financed companies (Packaged Facts, 1999). This source believes that company buyouts are
motivated by parent organizations attracted to making acquisitions in a thriving market and then
helping these acquisitions grow their product lines and increase market share. For example,
Yankee Candle’s partnership with Forstmann Little was reportedly undertaken specifically to
fund a major expansion (Packaged Facts, 1999).
Internet sales of candles have been increasing. Many smaller candle companies are emerging and
doing well selling their products on the Internet, as the appearance of prominence can be
obtained with a nice looking Web site. Selling on the Internet allows these manufacturers to sell

8
candles at a reasonable price, since they can pass on savings accrued by avoiding middlemen,
slotting fees paid to retailers, and advertising costs (Packaged Facts, 1999).
There have been many types of new entrants to the growing candle market. Market research
analysts believe that new marketers are attracted to this burgeoning market because candles are
relatively simple to make, color, and fragrance, and novelty designs easily attract the buyer’s
attention (Packaged Facts, 1999). The scented candles market has seen a lot of cross-category
encroachment, as fashion designers, perfume manufacturers, and specialty chain marketers
introduce their own lines of candles. For example, upscale retailers, such as The Gap, Pottery
Barn, Pier One, and the Bombay Company, are marketing scented candles under their own
trademark. SC Johnson, too, began selling candles fragranced with many of Glade’s air freshener
trademark scents (Packaged Facts, 1999). Meanwhile, dedicated candle outlets, like Yankee
Candle, White Barn Candle Company, and Illuminations, are expanding throughout the US
(Packaged Facts, 1999).
Sales
The 1997 Economic Census reports a total value of shipments for candle manufacturers of
$968.3 million. Companies with shipments of $100,000 or more accounted for 98 percent of
shipments, or $951 million. In 1992, shipments for these larger companies were $366 million.
The value of shipments increased more than 2.5 times over this 5-year period.

The NCA states that the US candle consumer retail sales for 1999 are reported at $2.3 billion, not
including candle accessories. NCA further reports that sales of all candles (unscented, scented,
and for institutional and religious uses) have been growing 10 to15 percent a year since 19902
(NCA, 1999). The Packaged Facts report claims that the growth of scented candles alone is close
to 22 percent per year. This same report estimates that scented candles represent 55 percent of the
$2.4 billion total home fragrance market, or $1.3 billion in scented candle sales. Another source,
The Freedonia Group, estimated that 1999 candle sales were $1.17 billion.3
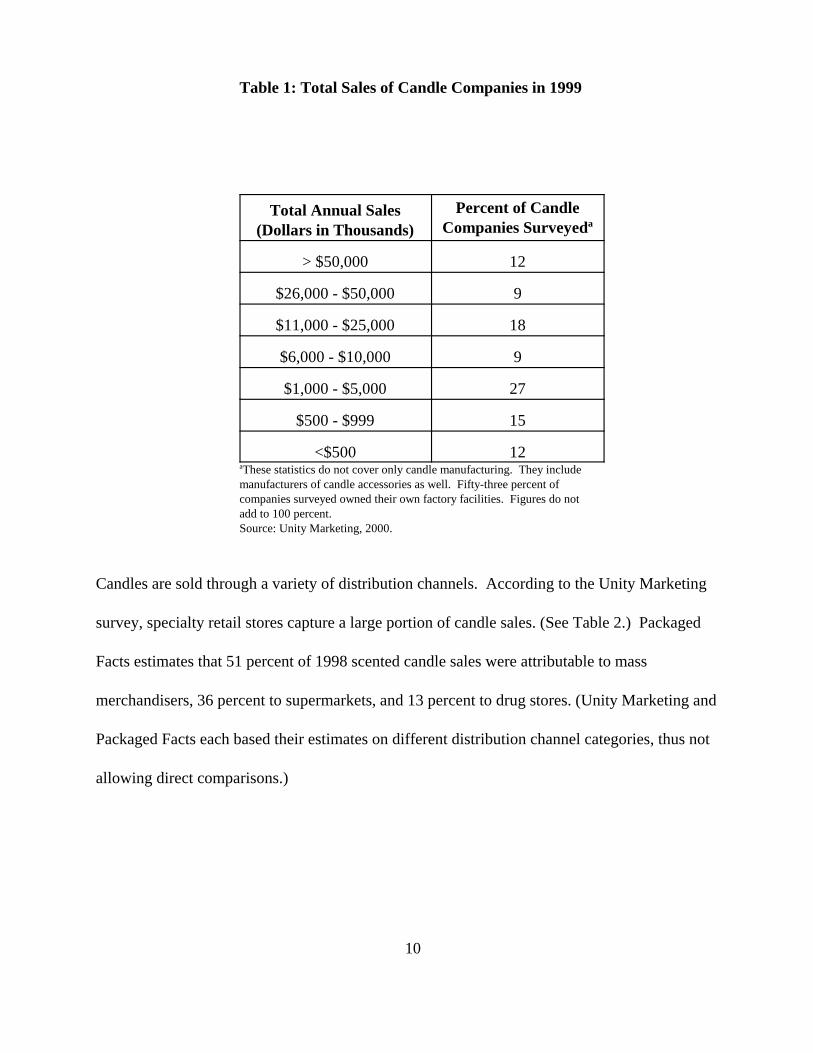
Unity Marketing, another private marketing research firm, conducts annual surveys among gift
manufacturers who produce and market candles and candle accessories. The most recent survey,
which had 37 respondents, was conducted in 2000 and covered 1999 sales. The survey results
showed an upward trend in total annual sales for 1999, with average company sales among
respondents up 39 percent from $10 million in 1997 to $14 million in 2000. In 1999, 39 percent
of companies surveyed reported annual sales of more than $10 million as compared with only 27
percent in 1997. (See Table 1.)
2 The source of these estimates is not disclosed in the NCA publication.3 This figure was interpreted from the Freedonia Group’s prediction that sales would increase 8.1 percent annually to reach $1.6 billion in 2003.
9
10
Total Annual Sales(Dollars in Thousands)
Percent of CandleCompanies Surveyeda
> $50,000 12
$26,000 - $50,000 9
$11,000 - $25,000 18
$6,000 - $10,000 9
$1,000 - $5,000 27
$500 - $999 15
<$500 12aThese statistics do not cover only candle manufacturing. They include manufacturers of candle accessories as well. Fifty-three percent of companies surveyed owned their own factory facilities. Figures do not add to 100 percent.Source: Unity Marketing, 2000.
Table 1: Total Sales of Candle Companies in 1999
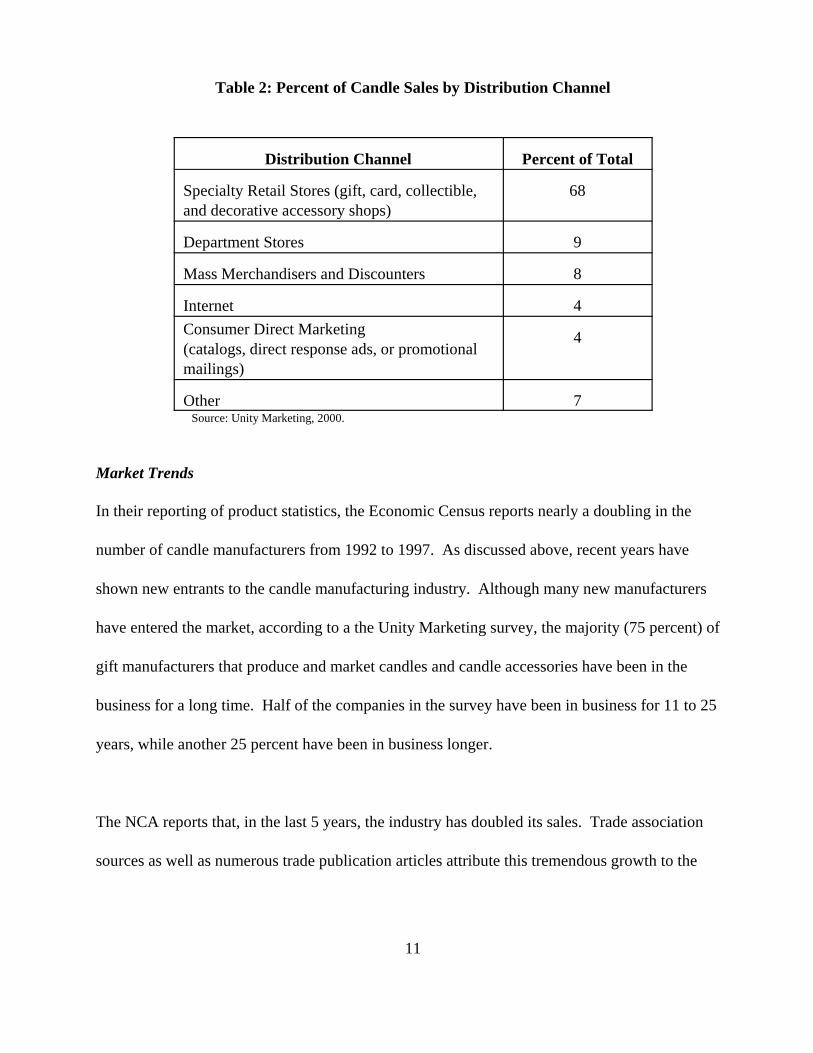
Candles are sold through a variety of distribution channels. According to the Unity Marketing
survey, specialty retail stores capture a large portion of candle sales. (See Table 2.) Packaged
Facts estimates that 51 percent of 1998 scented candle sales were attributable to mass
merchandisers, 36 percent to supermarkets, and 13 percent to drug stores. (Unity Marketing and
Packaged Facts each based their estimates on different distribution channel categories, thus not
allowing direct comparisons.)
11
Distribution Channel Percent of Total
Specialty Retail Stores (gift, card, collectible,and decorative accessory shops)
68
Department Stores 9
Mass Merchandisers and Discounters 8
Internet 4
Consumer Direct Marketing(catalogs, direct response ads, or promotionalmailings)
4
Other 7Source: Unity Marketing, 2000.
Table 2: Percent of Candle Sales by Distribution Channel
Market Trends
In their reporting of product statistics, the Economic Census reports nearly a doubling in the
number of candle manufacturers from 1992 to 1997. As discussed above, recent years have
shown new entrants to the candle manufacturing industry. Although many new manufacturers
have entered the market, according to a the Unity Marketing survey, the majority (75 percent) of
gift manufacturers that produce and market candles and candle accessories have been in the
business for a long time. Half of the companies in the survey have been in business for 11 to 25
years, while another 25 percent have been in business longer.
The NCA reports that, in the last 5 years, the industry has doubled its sales. Trade association
sources as well as numerous trade publication articles attribute this tremendous growth to the

12
rapid increase in sales of aroma therapy and other scented candles. A supermarket trade
publication reported that in 1999, candles were generating annual sales increases of around 20
percent (Supermarket News, 1999). The same publication states that retailers and suppliers
attribute the upswing in sales to the fact that consumers view candles as a relatively cheap and
accessible fashion accessory for the home for special events or seasonal decoration, or just as an
accessible means of augmenting the atmosphere within the home.
Shipments of candles are forecast by the Freedonia Group, a private research firm, to expand 8.1
percent per year reaching $1.6 billion in 2003 (The Freedonia Group, Inc., 1999). They predict
that, in addition to the mature market for ceremonial and utilitarian lighting applications,
introduction of numerous fashion-driven, upscale offerings and mood-enhancing scented
varieties, will spur gains; as will the increasing market presence of candle-only stores.
Supermarkets, drug store chains, and upscale department stores have all expanded their candle
offerings, including displays in multiple departments, such as air-freshener, body/bath sections,
and health and beauty products displays.
The Freedonia Group report predicts that the pace of growth will slow from the double-digit
increases of the earlier decade, due to increased competition from imports and some loss of
consumer interest. This is in contrast to the Packaged Facts report that observes that, even
though the trade press has previously reported that the popularity of candles and potpourri
usually alternates on a 5-year cycle, candles are continuing to sell beyond that cycle and are

13
showing no signs of slowing down.
Another business publication reports that candles are the largest growing segment in the giftware
market. Sales have been buoyed by the introduction of high-fashion candle stands and display
accessories as well as innovations in candle design, shape, color, and fragrances. Longer lasting
scents and unique decorative styles have attracted buyers. Females between the ages of 25 and 54
with household annual incomes over $25,000 are the prime market. Men purchase candles at
about half the rate of women (Business Wire, 1999).
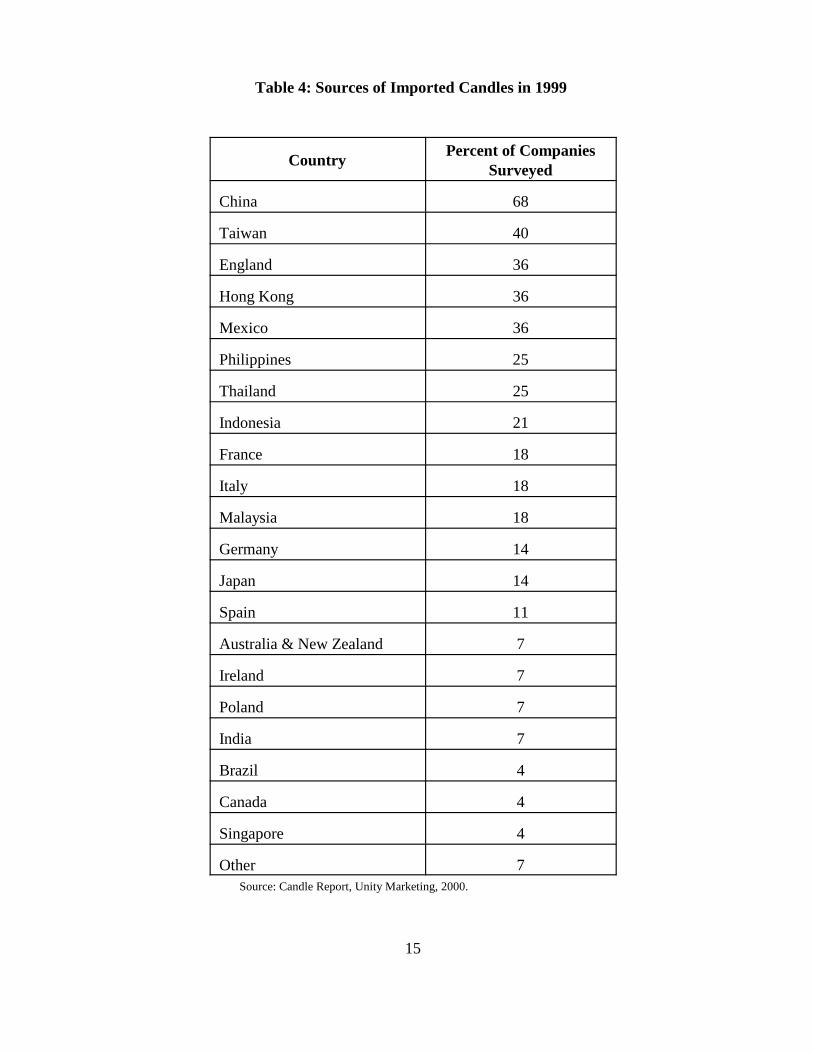
Sources of Imported Candles
The Census Bureau tallies import data from the various ports of entry by originating country.
These data show that in 1999, China, Hong Kong, Mexico, and Canada were the largest suppliers
of candle imports. (See Table 3.) A total of 197.9 million kg of candles valued at $484.2 million
were imported in 1999. The Freedonia Group reports that candle imports more than tripled
between 1993 and 1998.
Unity Marketing investigated the sources of imports when surveying candle manufacturers. (See
Table 4.) This survey showed that 68 percent of companies reported China as the top country
supplying imported candles.

14
Country of Origin Quantity (kg) Percent of Total Custom Value
China 68,922,143 34.8 $131,759,756
Hong Kong 26,506,500 13.4 $53,548,145
Mexico 25,449,253 12.9 $50,868,810
Canada 24,781,312 12.5 $73,683,421
Guatemala 8,529,417 4.3 $55,737,602
Israel 8,395,482 4.2 $19,425,929
Thailand 7,532,504 3.8 $18,439,677
Taiwan 6,876,205 3.5 $17,525,569
Italy 4,722,934 2.4 $13,162,283
El Salvador 2,594,292 1.3 $3,332,61
Macao 2,227,634 1.1 $4,474,057aTable includes data only from countries supplying 1 percent or greater of the total quantity of imports.Source: US Bureau of the Census, 2000.
Table 3: 1999 Candle Importsa
15
CountryPercent of Companies
Surveyed
China 68
Taiwan 40
England 36
Hong Kong 36
Mexico 36
Philippines 25
Thailand 25
Indonesia 21
France 18
Italy 18
Malaysia 18
Germany 14
Japan 14
Spain 11
Australia & New Zealand 7
Ireland 7
Poland 7
India 7
Brazil 4
Canada 4
Singapore 4
Other 7Source: Candle Report, Unity Marketing, 2000.
Table 4: Sources of Imported Candles in 1999

16
Product Use in the US
Candles are purchased for utilitarian, religious, or other institutional purposes, but the majority of
candles, particularly scented candles, are purchased for non-utilitarian home use. Consumers
buying scented candles derive utility from the decorative and aromatic attributes of the candles.
The NCA reports that 7 out of 10 US households use candles, and candle manufacturers’ surveys
show that 96 percent of all candles purchased are bought by women (NCA, 1999).
Some candles are purchased for special events, such as parties, or for seasonal decorations. Thus
candle sales do especially well in parts of the country that experience four seasons. Impulse
buying accounts for a significant portion of purchases on a regular basis because people are
attracted to the scent when they encounter candles while shopping (Supermarket News, 1999).
People encounter candles more often as supermarkets, drug stores, and mass-merchandisers
increase their candle offerings. Candles are sold alongside floral and gift merchandise, as well as
greeting cards. Candles for home decorating and fragrance have broad appeal, crossing all
demographic lines (Supermarket News, 1999). The NCA reports that seasonal (e.g., Christmas
and other holidays) buying accounts for roughly 35 percent of sales (NCA, 1999).
3.B INCENSE
Incense has been used for centuries for ceremonial purposes as well as to fragrance the
environment, conceal undesired ambient odors, or freshen clothing. Most incense is made from a
combination of fragrant gums, resins, woods, and spices. One traditional method of making
incense is to prepare a paste of pulverized botanicals, water, and charcoal and wrap the paste

17
around a bamboo twig. After the twig dries, it is dipped into perfumed essential oils or powders.
Incense is available in sticks, cones, rods, coils, small blocks, wands, and powders (Packaged
Facts, 1999).
The US Census Bureau does not maintain data to the level of detail required to capture incense
manufacturers. Economic data for incense manufacturers are aggregated under NAICS material
code 325998, which is defined as other miscellaneous chemical products, manufacturers of
chemical preparations not elsewhere classified, including essential oils. This category covers
production of all types of essential oils, pyrotechnics, fireworks, drilling muds, and other
industrial preparations, such as foundry and rubber processing supplies. ERG was unable to find
a detailed source of government data covering specifically incense manufacturing and sales.
The Thomas Register of American Manufacturers on-line database lists 26 companies as
manufacturers of incense. After contacting nine of the companies listed, we were able to find
very little additional information about incense manufacturing in the US. One company
representative said that many companies listed as manufacturers may indeed be repackagers who
import incense and repackage it for sale in the US. Another stated that there are many domestic
manufacturers that are very small—possibly single individuals making incense for sale locally.
One manufacturer contacted claimed they had $500,000 in annual sales.
The US Census Bureau data on domestic exports for 1999 show a total value of $4.6 million for
incense. This figure represents total exports worldwide. The highest percentages of exports
18
went to Canada, followed by Mexico, the United Kingdom, and Japan. Quantities (weight) of
exports were not reported.
The Census Bureau also reports data on imports of incense to the US. In 1999, $12.4 million of
incense was imported to the US. The largest percentage of imports came from India, followed by
China, Thailand, and Japan. (See Table 5.)

19
Country of Origin Value of Imports Percent of Total
India $3,308,591 26.7
China $2,290,454 18.5
Thailand $2,178,078 17.6
Japan $1,645,833 13.3
Hong Kong $891,850 7.2
United Kingdom $549,540 4.4
Mexico $507,586 4.1
Othera $459,572 3.7
France $450,941 3.5
Vietnam $126,002 1.0
Total World $12,408,447 100aCountries each supplying less than 1 percent of imports, including Canada, The Netherlands, Belgium, Germany, Italy, Greece, Syria, Israel, Saudi Arabia, Pakistan, Nepal, Burma, Indonesia, Macao, Korea, Taiwan, Australia, Egypt, and Ethiopia.Source: US Census Bureau
Table 5: 1999 Imports of Odoriferous Preparations Which Operate By Burning
Given that $12.4 million worth of incense is imported to the US, and $4.6 million is produced
domestically for export, the US market for incense is at least $17 million, excluding the value of
what is produced domestically for domestic consumption.
Descriptive literature on the incense industry is very limited. Only one article was found despite
a thorough search of market literature databases. This article discussed the incense
manufacturing industry in Japan. It reported that the largest Japanese manufacturer of incense is
Nippon Kodo Co. Ltd., who manufactures more than 2,000 fragrance products made from natural
materials. One-third of its annual turnover is derived from overseas markets, including Europe

20
and the US. Company officials claim they control more than 50 percent of the incense market in
the country. The company has six plants in Japan, one in Taiwan, and one in Hong Kong and
imports its raw materials from Vietnam and Indonesia. This year, the company began
distributing incense in Malaysia to satisfy the increasing demand for environmentally friendly
incense for religious, home fragrance, and anti-stress purposes (Bernama, 2000).

21
4. POTENTIAL INDOOR AIR QUALITY IMPACTS OF BURNING
CANDLES AND INCENSE
4.A CANDLES
When candles are burned, they emit trace amounts of organic chemicals, including acetaldehyde,
formaldehyde, acrolein, and naphthalene (Lau et al., 1997). However, the primary constituent of
public health concern in candle emissions is lead. Metal was originally put in wicks to keep the
wick standing straight when the surrounding wax begins to melt. The metal prevents the wick
from falling over and extinguishing itself as soon as the wax fails to support it. The US candle
manufacturing industry voluntarily agreed to cease production of lead-containing candles in
1974, once it was shown that burning lead-wick candles resulted in increased lead concentrations
in indoor air (Sobel et al., 2000b). Unfortunately, despite the voluntary ban, lead wick candles
can still be found on the market.
According to the National Candle Association (NCA), most US candle manufacturers have
abided by the agreement to cease lead wick production. All of the NCA members have signed
pledges not to use lead wicks in candles they manufacture. In addition, the NCA has sent a letter
to all the candle manufacturers registered with the Thomas Register of American Manufacturers
informing them of the potentially adverse health effects associated with wicks that contain lead
and asking them to sign pledges not to use wicks containing lead in their candles. The NCA has
also sent letters to retailer trade associations to inform them of this issue.
The NCA states that only a small number (one or two) of candle manufacturers make their own

22
wicks. The rest purchase wicks from wick manufacturers. One such manufacturer is Atkins and
Pearce, Inc.; they claim to have stopped making and selling wicks with lead in 1999.
The Candle Product Subcommittee of the American Society of Testing and Materials (ASTM) is
working on voluntary standards for candle content, including labeling standards. It is anticipated
that this standard will address the lead issue. The draft standard was presented at the fall 2000
ASTM meeting.
There have been limited investigations regarding the prevalence and source of candles with lead
wicks. ERG did not find any statistical studies investigating the presence of lead-wick candles in
the US marketplace. However, a handful of studies contain some information about the
occurrence of lead-wick candles in the local study areas. The following discussion and Table 6
present information on lead and other chemicals emitted from candles.
Lead Wick Emissions
In February 2000, the Public Citizen’s Health Research Group conducted a study of the lead
content of candles in the Baltimore-Washington area. They purchased 285 candles from 12
stores, excluding candle-only stores, and tested the wicks for the presence of lead. They found
that nine candles, or 3% of the candles they purchased, contained lead. Total lead content ranged
from approximately 24,000 to 118,000 µg (33 to 85% of the weight of the metal in the candle
wick).

An academic study was conducted on the emissions of lead and zinc from candles with metal-
core wicks (Nriagu and Kim, 2000). For this study, the researchers purchased and tested candles
(found in Michigan stores) that had metal-core wicks. Fourteen brands of candles manufactured
in the US, Mexico, and China were found to contain lead. Emission rates from candles ranged
from 0.52 to 327 µg-lead/hour, resulting in lead levels in air ranging from 0.02 to 13.1 µg/m3.
These concentrations are below the Occupational Safety and Health Administration (OSHA)
Permissible Exposure Limit4 (PEL) of 50 µg/m3, but above the EPA outdoor ambient air quality
standard5 of 1.5 µg/m3. It is important to note that, although the EPA standard was not developed
for use for indoor air comparisons, it is used throughout this report as a conservative comparison
value. OSHA’s PEL values should also be interpreted with some caution for they are
occupational standards not designed for the protection of the general public, children, or sensitive
populations.
Another prominent study, van Alphen (1999), examined emissions and inhalation exposure-
based risks for candles having lead wick cores. The mean emission rate was 770 µg-lead/hour,
with a range of 450 to 1,130 µg-lead/hour. A candle burned for 3 hours at 1,000 µg-lead/hour
in a 50 m3 room with poor ventilation is estimated to yield a 24-hour lead concentration of 9.9
µg/m3, and a peak concentration of 42.1 µg/m3. OSHA’s 50 µg/m3 PEL is not approached in this
4PEL (Permissible Exposure Limit): These OSHA standards were designed to provide health protection for industry employees by regulating exposure to over 300 chemicals. PELs are an 8-hour time weighted average. 5EPA Outdoor Ambient Air Quality Standards: Required by the Clean Air Act, these standards were set forpollutants thought to harm public health and the environment, including the health of "sensitive" populations such as asthmatics, children, and the elderly.
23

24
study, but again, EPA’s outdoor ambient air standard of 1.5 µg/m3 is exceeded.
Sobel et al. (2000a) modeled lead emissions from candles containing lead wicks. After burning
multiple candles in a contained room, 24-hour lead concentrations ranged from 15.2 to 54.0
µg/m3. The candle containing the least amount of lead produced lead concentrations of 30.6
µg/m3 in 3 hours. The maximum concentration of 54 µg/m3 is above the PEL standard of 50
µg/m3 and EPA’s outdoor ambient air quality standard of 1.5 µg/m3.
Other Metals
Zinc
After the ban on lead-containing wicks, candle companies began looking for alternatives that
provided the desired characteristics of the lead wick without the harmful emissions. Many
companies turned to braided wicks, which consist of three smaller wicks wound together to
provide some stiffness. Zinc cores are also commonly used, since the metal provides the desired
amount of stiffness, burns off readily with the rest of the wick, and does not have the same toxic
effects as lead.
Zinc is an essential element for human health. However, inhaling large amounts of zinc (as zinc
dust or fumes from smelting or welding) over a short period of time (acute exposure) can cause
a disease called metal fume fever. Very little is known about the long-term effects of breathing
zinc dust or fumes (Eco-USA.net, 2000).

25
Nriagu and Kim (2000) found the release of zinc from metal-core wicks to be 1.2 to 124
µg/hour, which is too low to be of health concern in indoor air. All nonferrous metals have
traces of lead impurities; for zinc, the maximum lead content is 0.004% (Barker Co., 2000).
The lead emissions from zinc wicks are below the detection level of most test methods (Barker
Co., 2000), though one study found emission rates of 0.014 µg-lead/hour (Ungers and
Associates, 2000).
Tin
Tin is also commonly used as a stiffener for candle wicks. It is considered to be nontoxic
(Chemglobe, 2000). Tin has a maximum lead content of 0.08%, but, like zinc, lead emissions
are below the detection limit when tin wicks are burned (Barker Co., 2000).
Organics
Several organic compounds have been detected in candle emissions. Three articles have
focused specifically on this topic. Lau et al. (1997) measured levels of selected compounds in
candle materials and modeled human exposure to a worst-case scenario of 30 candles burned for
3 hours in a 40 m3 room with realistic air flow conditions. Schwind and Hosseinpour (1994)
analyzed candle materials and the combustion process, and created a worst-case scenario of 30
candles burned for 4 hours in a 50 m3 room with approximately 0.7 L/min air flow. Fine et al.
(1999) also performed a series of emission tests on the combustion of paraffin and beeswax

candles burned in an air chamber with a volume of approximately 0.64 m3 and an air flow rate
of 100 L/min. Results of the studies are presented below and in Table 6.
Acetaldehyde
610-6 excess cancer risk level: This EPA comparison value is the air concentration known to produce an increased risk of 1 in 1,000,000 for cancer.7RfC (Reference Concentration): This EPA health-based comparison value assumes that there is a threshold forcertain toxic effects. The RfC is an estimate (with uncertainty spanning perhaps an order of magnitude) of a daily inhalation exposure of the human population (including sensitive subgroups) that is likely to be without an appreciable risk of deleterious effects during a lifetime. 8STEL (Short-Term Exposure Level): This OSHA standard was designed to limit maximum concentrations ofexposure as averaged over any 15 minute period. This is an occupational standard, not designed for the protection of the general public, children, or sensitive populations.
Acetaldehyde levels for 30 candles burned in an enclosed room for 3 hours were modeled at
0.834 µg/m3 (Lau et al., 1997); this is above the EPA’s 10-6 excess cancer risk level6 of 0.5
µg/m3, but below the EPA inhalation reference concentration (RfC)7 of 9 µg/m3.
Formaldehyde
Formaldehyde levels were measured at 0.190 µg/m3 (Lau et al., 1997) and 17 µg/m3 (Schwind
and Hosseinpour, 1994). Again, these measurements were above the EPA’s 10-6 excess cancer
risk level of 0.08 µg/m3, but below the OSHA PEL maximum of 921.1 µg/m3. Formaldehyde
levels for both studies were far below OSHA’s STEL8 maximum of 2,456.1 µg/m3.
Acrolein
Maximum concentrations of acrolein were measured at 0.073 µg/m3 (Lau et al., 1997) and <1
µg/m3 (Schwind and Hosseinpour, 1994). These levels are above the RfC of 0.02 µg/m3 and
26

27
below the PEL of 250 µg/m3. A cigarette burned in a similar environment produces acrolein
levels of 23 µg/m3 (Lau et al., 1997).
Polychlorodibenzo-p-dioxins/Polychlorodibenzofurans (PCDD/PCDF)
Levels of PCDD/PCDF were measured at 0.038 pg I-TEQ/m3 (Schwind and Hosseinpour,
1994). The TEQ is the toxic equivalency method used to evaluate dioxins. It represents the sum
of the concentrations of the multiple dioxin congeners "adjusted" to account for the toxicity of
each congener relative to the most toxic dioxin, 2,3,7,8-TCDD.
Polyaromatic Hydrocarbons (PAHs)
The amount of PAHs measured in candle emissions and soot differs between studies. Fine et al.
(1999) found that no significant levels of PAHs were detected in the emissions from normal
burning and smoldering candles. In contrast, Huynh et al. (1991) found that soot from wax-light
church candles contained measurable concentrations of PAHs: the study measured 882 µg
benzo[ghi]perylene per gram of candle soot and 163 µg benzo[a]pyrene per gram of candle soot.
However, Huynh et al. did not measure PAH concentrations from candles in air. Wallace
(2000) also concluded that a citronella candle was a source of PAHs in a study of real-time
monitoring of PAHs in an occupied townhouse, but did not quantify the concentration or
emission rate.
Concentrations of benzo[a]pyrene in air due to candle emissions can measure 0.002 µg/m3 (Lau
et al., 1997). This is below the PEL value of 200 µg/m3. Naphthalene maximum concentration
28
levels were measured at 0.04 µg/m3 (Schwind and Hosseinpour, 1994), below the EPA RfC of 3
µg/m3.
Alkanes, Wax Esters, Alkanoic and Alkenoic Acids, Alkenes
Fine et al. (1999) found that the majority of emissions from candles consisted of organic
compounds including alkanes, wax esters, alkanoic and alkenoic acids, and alkenes. Some of
the compounds found were thermally altered products of the unburned wax, while others were
unaltered in the volatilization process. Concentrations of the organic compounds in air were not
calculated.
Particulate Matter
The diameter of candle flame particles have been measured between 20 and 100 nm (Li and
Hopke, 1993) and 100 and 800 nm depending on the mode of burning (Fine et al. 1999).
Neither study calculated maximum concentrations of particles in air. Li and Hopke (1993)
subjected candle flame particles to relative humidity comparable to that in the human respiratory
tract, and found that candle flame particles grew in size. White candles had a 20% larger
growth potential than scented candles.

29
Table 6: Indoor Air Impacts of Burning Candles
Contaminant StudyMaximum
ConcentrationSTEL PEL RfC
10-6 ExcessCancer Risk
Lead Nriagu andKim
3 0.02- 13.1 µg/m NA 350 µg/m NA NA
van Alphen 3 42.1 µg/m
Sobel etal.(2000a)
15.2 to 54.03 µg/m
Zinc Nriagu andKim
1.2-124 µg/hour a NA NA NA NA
Tin NA NA NA NA NA NA
Acetaldehyde Lau et al. 3 0.834 µg/m NA 360,0003µg/m
39 µg/m 30.5 µg/m
Formaldehyde Lau et al. 30.190 µg/m 2,456.13µg/m
921.13µg/m
NA 30.08 µg/m
Schwind andHosseinpour
317 µg/m
Acrolein Lau et al. 30.073 µg/m NA 3250 µg/m 0.023µg/m
NA
Schwind andHosseinpour
3<1 µg/m
PCDD/PCDF Schwind andHosseinpour
0.038 pg I-3TEQ/m
NA NA NA NA
Benzo [a]pyrene
Lau et al. 30.002 µg/m NA 2001
3µg/mNA NA
Naphthalene Schwind andHosseinpour
30.04 µg/m NA 50,0003µg/m
33 µg/m NA
Alkanes, WaxEsters,Alkanoic andAlkenoicAcids,Alkenes
NA NA NA NA NA NA
Particulate NA NA NA NA NA NA
aThis number represents an emission rate, not a concentration. A maximum concentration was not calculated for zinc.

30
Candle Soot
Black Soot Deposition (BSD) is also referred to as ghosting, carbon tracking, carbon tracing,
and dirty house syndrome. Complaints of BSD have risen significantly since 1992 (Krause,
1999).
Black soot is the product of the incomplete combustion of carbon-containing fuels. Complete
combustion would result in a blue flame, and would produce negligible amounts of soot and
carbon monoxide. Until recently, the source for the black soot in homes was unknown.
Through interviews and recent experiments, it is now believed that frequent candle burning is
one of the sources of black soot. The amount of soot produced can vary greatly from candle to
candle. One type of candle can produce as much as 100 times more soot than another type
(Krause, 1999). For example, elemental carbon emission rates varied from <40 to 3,370 µg/g
candle burned in a study of sooting behavior in candles (Fine et al., 1999). The type of soot may
also vary; though primarily composed of elemental carbon, candle soot may include phthalates,
lead, and volatiles such as benzene and toluene (Krause, 1999).
Scented candles are the major source of candle soot deposition. Most candle wax paraffins are
saturated hydrocarbons that are solid at room temperature. Most fragrance oils are unsaturated
hydrocarbons and are liquid at room temperature. The lower the carbon-to-hydrogen ratio, the
less soot is produced by the flame. Therefore, waxes that have more fragrances in them produce

31
more soot. In other words, candles labeled “super scented” and those that are soft to the touch
are more likely to generate soot.
The situation in which a candle is burned can also impact its sooting potential. A small and
stable flame has a lower emission rate than a larger flickering flame with visible black particle
emissions (Vigil, 1998). A forced air flow around the flame can also cause sporadic sooting
behavior (Fine et al., 1999). Thus, candles in glass containers produce more soot because the
container causes unsteady air flow and disturbs the flame shape (Stephen et al., 2000). Candles
that are extinguished by oxygen deprivation, or blowing out the candle, produce more soot than
those extinguished by cutting off the tip of the wick. Cutting the wick eliminates the emissions
produced by a smoldering candle (Stephen et al., 2000).
When soot builds up in air, it eventually deposits onto surfaces due to one of four factors. First,
the particle may randomly collide with a surface. Second, soot particles can be circulated by
passing through home air-conditioning filters. Third, soot can gain enough mass to become
subject to gravity. Homes with BSD often have carpets stained from soot deposition (Vigil,
1998). Finally, the particles are attracted to electrically charged surfaces such as freezers,
vertical plastic blinds, television sets, and computers (Krause, 1999).
32
When soot is airborne, it is subject to inhalation. The particles can potentially penetrate the
deepest areas of the lungs, the lower respiratory tract and alveoli (Krause, 1999). ERG did not
find research literature on the health effects of residential exposure to candle soot.
Conclusion
Candles with lead wicks have the potential to generate indoor airborne lead concentrations of
health concern. It is also possible for consumers to unknowingly purchase candles containing
lead wick cores and repeatedly expose themselves to harmful amounts of lead through regular
candle-burning.
Lead wicks aside, consumers are also exposed to concentrations of organic chemicals in candle
emissions. The European Candle Association (1997) and Schwind and Hosseinpour (1994)
conclude that there is no health hazard associated with candle burning even when a worst-case
scenario of 30 candles burning for 4 hours in a 50 m3 room is assumed. However, burning
several candles exceeded the EPA’s 10-6 increased risk for cancer for acetaldehyde and
formaldehyde, and exceeded the RfC for acrolein. Once again, the RfC and EPA’s 10-6
increased cancer risk guidelines are not designed specifically for indoor air quality issues, so
these conclusions are subject to interpretation.

33
Consumers may also not be aware that the regular burning of candles may result in BSD,
causing damage to their homes. Sooting can be reduced by keeping candle wicks short, drafts to
a minimum, and burning unscented candles.
Additional research may want to focus on gaps in the literature, such as emissions from scented
and multi-colored candles, and maximum concentrations of organics in air produced by sooting
candles.
4.B INCENSE
Several studies found associations between exposure to incense smoke and many illnesses,
including cancer, asthma, and contact dermatitis. Incense burning was found to be a contributing
factor in the occurrence of asthma for Quatar children (Dawod and Hussain, 1995), and coughing
was found to be associated with incense exposure in a study of Taiwanese children (Yang et al.,
1997). Burning incense produces volatile fragrances that, once airborne, can reach exposed skin,
causing dermatitis (Roveri et al., 1998). An elevated risk for leukemia was found in children
whose parents burned incense during pregnancy or while nursing (Lowengart et al., 1987). A
study of childhood brain tumors showed elevated risk for children whose parents burned incense
in the home (Preston-Martin et al., 1982).
From comparing mutagenic potencies of incense, formaldehyde, and acetaldehyde to Salmonella
typhimurium T102, Chang et al. (1997) concluded that incense smoke contains highly active
34
compounds with a higher mutagenic potency than formaldehyde. Sato et al. (1980) and
Rasmussen (1987) have also found that incense smoke is mutagenic to S. typhimurium TA98, TA
100, and TA104. Incense Smoke Condensates (ISCs), the particles released during incense
burning, were found to be mutagenic and/or genotoxic in the Ames test, the SOS chromotest, and
the SCE/CHO assays. The genotoxicity of certain ISCs in mammalian cells was also found to be
higher than particles produced from tobacco smoke condensates (TSCs) (Chen et al., 1990).
Interestingly, one study concluded that burning incense decreases the chances of developing lung
cancer (Liu et al., 1993). However, this study was conducted in China, where societal factors
may have influenced the results of the study. For example, people using incense may be more
well off and therefore have healthier life styles in general (Liu et al., 1993). A few studies
examined emissions of specific contaminants from incense smoke. These results are discussed
below.
Carbon Monoxide
Carbon monoxide inhibits the blood's ability to carry oxygen to body tissues including vital
organs such as the heart and brain. Symptoms of carbon monoxide exposure vary widely based
on exposure level, duration, and the general health and age of an individual. Typical symptoms
include headache, dizziness, and nausea. These 'flu like' symptoms often result in a misdiagnosis
and can cause delayed or misdirected treatment. Contact with high levels of carbon monoxide
can result in unconsciousness and death (EPA, 2000b).
35
Although Löfroth et al. (1991) found that burning incense produced sizeable amounts of carbon
monoxide (220 mg/g incense burned), the authors concluded that it is not likely to exceed EPA
regulatory standards unless the incense is burned in a very small room with very little ventilation.
The standard used for a comparison value in the study was the EPA’s outdoor ambient air quality
standard of 10 mg/m3. This is not necessarily the most appropriate comparison value, especially
since mg/g incense burned, not maximum indoor air concentration, was reported.
Isoprene
Isoprene is a hydrocarbon created and emitted from plants and trees during respiration, and has
also been detected in tobacco smoke and automobile exhaust. Isoprene does have genotoxic
properties (EDF, 2000).
Interestingly, the predominant exposure to isoprene comes from its formation in the human body.
An exhaled breath contains 1-3 mg/m3 of isoprene. Löfroth et al. (1991) concluded that 1.1 mg
isoprene/g incense burned would not result in adverse health effects. Again, maximum indoor air
concentrations were not provided in this study.
Benzene
Löfroth et al. (1991) compared benzene emissions from the food preparation process, cigarette
smoking, and burning incense. The study found that emissions of benzene resulting from
burning an incense cone were 440 µg/g incense burned. Löfroth et al. concluded that this

36
emission level could possibly cause an increase in indoor benzene concentrations above urban air
background levels of 2-20 µg/m3. A maximum indoor benzene concentration was not calculated
in this study, so we cannot justifiably compare Löfroth’s value to the EPA 10-6 excess cancer risk
estimates, reported as a range of 0.13 to 45 µg/m3 (EPA, 2000a).
Musk Xylene, Musk Ketone, and Musk Ambrette
Musk xylene (2,4,6-trinitro-1,3-dimethyl-5-tertiary butyl benzene), musk ketone (3,5-dinitro-2,6-
dimethly-4-tertiary butyl acetophenone), and musk ambrette (2-methoxy-3,5 dinitro-4-methyl-
tertiary butylbenzene) are contained in some types of Chinese incense (Roveri et al., 1998). They
are known for making skin more sensitive to light and causing irritations. When incense is
burned, airborne particles may dissolve in the upper layer of skin and allergic contact dermatitis
may arise. However, toxicity and health data for these chemicals are not available.
Particulate Matter
Burning incense was found to generate large quantities of particulate matter (Mannix et al.,
1996). Mannix et al. estimated the median diameter of particulates in aerosols to be between
0.24 and 0.40 µm, and hypothesize that particles could deposit in the respiratory tract. Mannix et
al. did not perform a chemical characterization of compounds present in the particulate phase, but
recommend that a human exposure scenario be done. Li and Hopke (1993) also found that
incense smoke produced larger particles, in the range of 0.1 to 0.7 µm. Tung et al. (1999) found
that PM10 concentrations in Hong Kong homes were 23% higher with smoking or incense
37
burning– the mean indoor PM10 level for all homes was 78.8 µg/m3, while mean PM10 for
smoking or incense-burning homes was 96.6 µg/m3. This is below the EPA’s national ambient
air quality 24-hour standard of 150 µg/m3, but above the annual standard of 50 µg/m3. Chao et
al. (1998) found that burning incense in a home with poor ventilation could result in a peak
concentration of total suspended particulates (TSPs) of 1,850 µg/m3. In 1987, EPA began using
PM10, particles measuring 10 µm or less in diameter, rather than TSPs as the standard unit of
measure. However, before that time, the standard for outdoor TSPs in the United States was 260
µg/m3 for a 24-hour average and 75 µg/m3 for an annual average. The concentration of
particulates found in Chao et al. (1998) far exceeds 260 µg/m3.
Polyaromatic Hydrocarbons (PAHs)
Reports of PAHs in incense soot have been contradictory. Chang et al. (1997) did not find PAHs
in the vapor extract of incense smoke. However, Koo (1994) determined that PAH levels rose
with incense burning in a study of Hong Kong residences. Incense soot was found to contain
measurable concentrations of fluoranthene, pyrene, benzo[b]fluoranthene, benzo[k]fluoranthene,
benzo[a]pyrene, dibenzo[def,p]chrysene, benzo[ghi]perylene, ideno[1,2,3,-cd]pyrene,
anthanthrene, and coronene (Huynh et al., 1991). Though the study established that the
maximum dust concentration corresponded with the burning of incense, maximum
concentrations of PAHs from incense burning were not calculated.

38
Conclusion
Incense produces particulate matter that can deposit in the respiratory tract, and elevates airborne
concentrations of carbon monoxide and benzene. Incense also contains trace amounts of
chemicals suspected of causing skin irritation, and exposure to incense has been linked with
several illnesses. Incense smoke should be considered a source of indoor pollutants in rooms in
which incense is regularly burned (Cheng and Bechtold, 1995). However, the studies reviewed
measured emissions for only a limited number of incense types and brands; with the large range
of incense manufacturers and importers on the market, other incense types could differ in the
parameters examined.

39
5. REFERENCES
Barker Co. 2000. Wick Safety: The Facts About Zinc and Tin Cored Wicks.
http://www.barkerco.com/wick_safety.htm, accessed September 4, 2000.
Bernama. Nippon Kodo To Market Environmentally Friendly Incense. The Malaysian
National News Agency. June 23, 2000.
Business Wire. 1999. Candles Represent a $2 Billion Segment in the Giftware Market.
January 29, 1999. World Reporter.
Chang HL, Kuo ML, Lin JM. 1997. Mutagenic activity of incense smoke in comparison to
formaldehyde and acetaldehyde in Salmonella typhimurium TA102. Bulletin of
Environmental Contamination and Toxicology, 58:394-401.
Chao CYH, Tung TCW, Burnett J. 1998. Influence of different indoor activities on the
indoor particulate levels in residential buildings. Indoor and Built Environment, 7(2):110-
121.
Chemglobe. 2000. Tin. http://www.vcs.ethz.ch/chemglobe/ptoe/_/50.html, accessed
September 1, 2000.

40
Chen CJ, Wu HY, Chuang YC, Chang AS, Luh KT, Chao HH, Chen KY, Chen SG, Lai GM,
Huang HH, Lee HH. 1990. Epidemiologic characteristics and multiple risk factors of lung
cancer in Taiwan. Anticancer Research, 10(4):971-976.
Cheng YS, Bechtold WE. 1995. Incense smoke: characterization and dynamics in indoor
environments. Aerosol Science and Technology, 23:271-281.
Dawod ST, Hussain AA. 1995. Childhood asthma in Qatar. Annals of Allergy, Asthma, &
Immunology, 75(4):360-4.
Eco-USA.net. 2000. Zinc. http://www.eco-usa.net/toxics/zinc.html, accessed September 6,
2000.
Environmental Defense Fund. Chemical Profile for 2-METHYL-1,3-BUTADIENE (CAS
Number: 78-79-5). http://www.scorecard.org/chemicalprofiles/
summary.tcl?edf_substance_id=78-79-5, accessed September 1, 2000.
EPA 2000a. Integrated Risk Information System (IRIS). Substance file- benzene.
Washington, D.C.: National Center for Environmental Assessment.
http://www.epa.gov/ngispgm3/iris/subst/0276.htm, accessed August 31, 2000.

41
EPA 2000b. Carbon Monoxide (CO). http://www.epa.gov/iaq/co.html, accessed September
6, 2000.
European Candle Association. 1997. Determining and Evaluating the Emissions of
PCDD/PCDF, PAH and Short-Chain Aldehydes in Combustion Gases of Candles.
Oekometric GambH, Bayreuth, Germany.
Fine PM, Cass GR, Simoneit BRT. 1999. Characterization of fine particle emissions from
burning church candles. Environmental Science and Technology, 33:2352-2362.
Fort Worth Star-Telegram. 1999. San Francisco Analyst Predicts Continued Growth for
Candle Industry. November 27, 1999. Knight-Ridder/Tribune Business News.
Huynh CK, Savolainen H, Vu-Duc T, Guillemin M, Iselin F. 1991. Impact of thermal
proofing of a church on its indoor air quality: the combustion of candles and incense as a
source of pollution. Science of the Total Environment, 102:241-251.
Koo, LC. 1994. Carcinogens in the indoor air of Hong Kong homes: levels, sources, and
ventilation effects on 7 polynuclear aromatic hydrocarbons. Environmental Technology,
15(5):401-418.

42
Krause D. 1999. Black soot and candles: new research and case studies. Indoor
Environment ‘99 Proceedings. pp 157-164. IAQ Publications, Inc., Bethesda, MD.
Lau C, Fiedler H, Hutzinger O, Schwind KH, Hosseinpour J. 1997. Levels of selected
organic compounds in materials for candle production and human exposure to candle
emissions. Chemosphere, 34(5-7):1623-1630.
Li W, Hopke PK. 1993. Initial size distributions and hygroscopicity of indoor combustion
aerosol particles. Aerosol Science and Technology, 19(3):305-316.
Liu Q, Sasco AJ, Riboli E, Xuan Hu M. 1993. Indoor air pollution and lung cancer in
Guangzhou, People's Republic of China. American Journal of Epidemiology, 137(2):145-
154.
Löfroth G, Stensman C, and Brandhorst-Satzkorn M. 1991. Indoor sources of mutagenic
aerosol particulate matter: smoking, cooking, and incense burning. Mutation Research, 261:
21-28.
Lowengart RA, Peters JM, Cicioni C, Buckley J, Bernstein L, Preston-Martin S, Rappaport
E. 1987. Childhood leukemia and parents' occupational and home exposures. Journal of the
National Cancer Institute, 79(1):39-46.

43
Mannix RC, Nguyen KP, Tan EW, Ho EE, Phalen RF. 1996. Physical Characterization of
Incense Aerosols. Science of the Total Environment, 193:149-158.
National Candle Association. 1999. 1999-2000 Directory of Members. National Candle
Association, Washington, DC.
Nriagu JO, Kim MJ. 2000. Emissions of lead and zinc from candles with metal-core wicks.
Science of the Total Environment, 250:37-31.
Packaged Facts. 1999. Home Fragrances, The Market (1999). Information Resources, Inc.,
Chicago, IL.
Preston-Martin S, Yu MC, Benton B, Henderson BE. 1982. N-nitroso compounds and
childhood brain tumors: a case-control study. Cancer Research, 42(12):5240-5.
Rasmussen RE. 1987. Mutagenic activity of incense smoke in Salmonella typhimurium.
Bulletin of Environmental Contamination and Toxicology, 38(5):827-833.
Roveri P, Andrisano V, Di Pietra AM, Cavrini V. 1998. GC-MS analysis of incenses for
possible presence of allergenic nitromusks. Journal of Pharmaceutical and Biomedical
Analysis, 17:393-398.

44
Sato S, Makino R, Takahashi Y, Sugimura T, Miyazaki T. 1980. Mutagenicity of smoke
condensates from joss sticks. Mutant Research, 77:31-36.
Schwind and Hosseinpour. 1994. Analysis of Raw-Materials and Candle Combustion
Products. Published by Oekometric GambH, Bayreuth, Germany, for the Association of
German Candle Manufacturers, Inc., Frankfurt, Germany.
Sobel HL, Lurie P, Wolfe SM. 2000a. Letter: lead exposure from candles. Journal of the
American Medical Association, 284(2):180.
Sobel HL, Wolfe SM, Lurie P. 2000b. Petition to the Consumer Product Safety
Commission to Immediately Ban and Recall All Candles With Lead-Containing Wicks,
Candles in Metal Containers That Contain Lead, and Wicks Sold For Candle-Making That
Contain Lead. Public Citizen’s Health Research Group, Washington, DC. February 24, 2000.
www.citizen.org/hrg/publications/1510.htm, accessed June 30, 2000.
Stephen FD, Stineman CH, Jonmarie PW, Kelly DW. Risk Analysis of Candle Emissions.
http://www.litigation.support.ene.com/candle_emissions.htm, accessed November 17, 2000.

45
Supermarket News. Elson, Joel. With Aroma therapy Gaining Acceptance as An Aspect of
Home Fashion, Sales of Scented Candles Are Lighting Up Supermarkets’ Cash Registers.
Supermarket News, p43(1). Fairchild Publications, Inc. February, 8, 1999.
The Freedonia Group, Inc. Waxes to 2003. The Freedonia Group, Inc., Cleveland, OH.
December 1999.
Tung TCW, Chao CYH, Burnett J, Pang SW, Lee RYM. 1999. A territory wide survey on
indoor particulate level in Hong Kong. Building and Environment, 34(2):213-220.
Ungers and Associates. Determination of Lead Releases from Candles with Zinc-Core
Wicks. http://www.barkerco.com/wick_safety.htm, accessed September 1, 2000.
Unity Marketing. 2000. Candle Report: The Market, The Industry, The Trends. Unity
Marketing, Stevens, PA.
US Census Bureau. 1997 Economic Census, Manufacturing, Industry Series. October, 1999.
EC97M-3399R.
van Alphen M. 1999. Emission testing and inhalational exposure-based risk assessment for
candles having Pb metal wick cores. The Science of the Total Environment, 243/244: 53-55.

46
Vigil, F. 1998. Black stains in houses: soot, dust, or ghosts? Home Energy, 15(1):15.
Wallace L. 2000. Real-time monitoring of particles, PAH, and CO in an occupied
townhouse. Applied Occupational Environmental Hygiene, 15(1):39-47.
Yang CY, Chiu JF, Cheng MF, Lin MC. 1997. Effects of indoor environmental factors on
respiratory health of children in a subtropical climate. Environmental Research, 75(1):49-55.