candidate’s declaration
TRANSCRIPT

1 | P a g e
Candidate’s Declaration
We hereby declare that the work, which is being present in this report, entitled “Patient Monitoring System” in partial fulfillment for the award of Degree of “Bachelor of Technology” in department of Biomedical Engineering, Alwar Institute of Engineering and Technology affiliated to, Rajasthan Technical University is a record of my own investigations carried under the Guidance of Mr. Rupesh Singh, Department of Biomedical Engineering, AIET Alwar.
We have not submitted the matter presented in this report any where for the award of any other
Degree.
Guide’s Signature Student’s Signature
Mr. Rupesh Singh (Akshay Raj Dhamija)

2 | P a g e
Preface
The project work that we are assigned at the end of our project course is
meant for solving the line problems we ought to face and to increase our
knowledge. By applying the skills that we have gained during our course,
we had been able to make something with our hands. During our course
sometimes we got eager to know the construction of various equipments.
So we feel it as a golden opportunity for us to make something with our
hands. Thus, we decided to prepare “Patient Monitoring System” project.
While working on the project, we can test our abilities and get through with
the field that we are studying and working.

3 | P a g e
CONTENTS
1. Candidates Declaration ................................................................................... 1
2. Preface ............................................................................................................. 2
3. Project Objective ............................................................................................. 5
4. Abstract of Project ........................................................................................... 5
5. Requirements ................................................................................................... 6
6. Patient Monitoring System ............................................................................. .7
6.1Signal Acquisition and low level Processing.……………...….…..8
6.2Data Acquisition..............................................................................9
7. ECG in Patient Monitoring...........................................................................10
8. Temperature
Sensor............................................................................................................14
9. PPG................................................................................................................17
10. MATLAB......................................................................................................22
11. Program in MATLAB for QRS Detection....................................................24
12. Output for QRS Detection.............................................................................25
13. Program in MATLAB for PPG Detection.....................................................28
14. Output for PPG Detection.............................................................................29

4 | P a g e
LIST OF FIGURES
1. ECG waveform .............................................................................................. 10
2. Pre-processing of ECG .................................................................................. 11
3. Circuit Diagram of ECG ................................................................................ 13
4. Thermistor Resistance Temprature Curve .................................................... 14
5. Circuit of temperature measurment ............................................................... 15
6. Layers of human skin.................................................................................... .17
7. Premature ventricular contraction.................................................................18
8. Venous Pulsation in PPG..............................................................................18
9. Reflective PPG..............................................................................................20
10. Circuit Diagram of PPG................................................................................20
11. Plot of ECG waveform..................................................................................27
12. Plot of PPG waveform...................................................................................29

5 | P a g e
PROJECT OBJECTIVE
Development of a patient monitoring system capable of delivering temperature,
ECG, PPG and heart rate reading to a doctor through a personal computer.
ABSTRACT OF THE PROJECT
Patient Monitoring System (PMS)
A patient monitoring system (PMS) is used today in almost each and every
ICU and OT to interpret available clinical data to help recognize present
complications. It alerts caregivers from potentially life-threatening events. A
PMS involves monitoring, observing and diagnosing various physiological
parameters.
Methodology
This patient monitoring system project would mainly consist of data
acquisition circuits (for picking up needed physiological parameters from the
patient’s body), an analog to digital converter (to convert these parameters
from analog to digital form), a microcontroller (to interface ADC with PC)
and a program in MATLAB for feature extraction.
Parameters Being Studied
ECG
Temperature
PPG
Heart rate
Expected Result
We believe that implementation of this patient monitoring system would
give real time data which would be easily accessible to a doctor through a
personal computer.

6 | P a g e
REQUIREMENTS
Hardware Requirements
S.NO Description Alternative
1. 8051 MICROCONTROLLER NOT AVAILABLE
2. ADC8080 NOT AVAILABLE
3. AD620 NOT AVAILABLE
4. AD844 NOT AVAILABLE
5. LM35 NOT AVAILABLE
6. OPAMP 741 NOT AVAILABLE
7. PC with 2 GB HDD and 256 MB RAM NOT AVAILABLE
Software Requirements
S.No. Description Alternative
1. MATLAB 7.0 NOT AVAILABLE

7 | P a g e
PATIENT MONITORING SYSTEM Patient monitoring and management in critical care environments such as intensive
care units (ICUs) and operating rooms (ORs) involves estimating the status of the
patient, reacting to events that may be life-threatening, and taking actions to bring
the patient to a desired state. This complex process includes the interaction of
physicians and nurses with diverse data (ranging from clinical observations to
laboratory results to online data) provided by bedside medical equipment. New
monitoring devices provide health care professionals with unsurpassed amounts of
information to support decision making.
Ironically, rather than helping these professionals, the amount of information
generated and the way the data is presented may overload their cognitive skills
and lead to erroneous conclusions and inadequate actions. New solutions are
needed to manage and process the continuous flow of information and provide
efficient and reliable decision support tools.
Patient monitoring can be conceptually organized in four layers
(1) The signal level, which acquires and performs low-level processing of raw
data
(2) The validation level, which removes data artefacts
(3) The signal-to-symbol transform level, which maps detected features to
symbols such as normal, low, or high
(4) The inference level, which relies on a computer representation of medical
knowledge to derive possible diagnoses, explanations of events, predictions
about future physiologic states, or to control actions.
In addition to these four layers, medical decision support systems need data
interfaces to other clinical information systems as well as carefully designed user
interfaces to facilitate rapid and accurate situation assessment by care providers.
A number of systems have been developed to address problems faced by clinicians
in critical care environments. These range from low-level signal analysis
applications for detecting specific features in monitored signals to complete
architectures for signal acquisition, processing, interpretation, and decision
support. As always, specificity and generality are conflicting requirements.
Systems developed for specific applications are usually successful in their limited
domain of expertise. However, the lessons and problem solving strategies learned
in one domain are often difficult to generalize. Conversely, generic architectures
aim at providing support for modelling and developing a wide range of
applications. They also strive for flexibility, modularity, and ease of expansion.

8 | P a g e
This generality is often at the expense of expertise and performance in specific
domains.
Signal Acquisition and Low-Level Processing Typical signals found in critical care environments include vital signs (ECG, EEG,
arterial pressure, intracranial pressure, etc.) and information provided by
therapeutic devices, infusion pumps, and drainage devices. Modern monitoring
devices are also capable of providing derived and computed information in
addition to raw data. Heavily instrumented patients frequently have up to 20
medical devices monitoring them, producing up to 100 pieces of clinically relevant
information. These instruments are often stand-alone, and interconnection requires
developing dedicated software in-house, usually with substantial effort. To address
this problem, work is being done on a standard for medical device data
communication in critical care environments called the Medical Information Bus
(MIB). Although much of the standard has been adopted by ANSI, a standard
adhered to by major medical device manufacturers are still lacking. Today, this
absence of interconnectivity remains a major obstacle to the development and
implementation of intelligent monitoring systems.
Current bedside monitors typically provide instantaneous values for the monitored
variables. To complement this information, numerous algorithms have been
proposed to detect features in the signals.
In particular, detection of significant trends has received much attention. Methods
based on median filters and fuzzy logic has also been proposed. More recently,
techniques such as sub-band adaptive filtering, chaos analysis, and wavelet
transform have been investigated. Multivariate and data fusion methods have been
used to reveal interactions between signals and applied to problems such as
ventricular rhythm tracking. Traditional waveform analysis also continues to be
applied to signals such as intracranial pressure and arterial blood pressure.
Interpreting the output of these algorithms and assessing their impact on patient
care is an ongoing task.

9 | P a g e
Data Validation The risk of noise contamination, inadequate wiring, or instrument failure is
significant, especially as the amount of sampled data increases. Unreliable
information can drastically reduce the practitioner’s ability to rapidly assess and
act on monitor data. In addition, false alarms due to erroneous or incomplete data
reduce clinicians’ confidence in the instrumentation resulting in alarms being
disabled or ignored.
Methods relying on data redundancy and correlation (thus assuming some level of
interconnectivity between bedside instruments) as well as contextual information
to eliminate false alarms, validate data, and diagnose malfunctions in the
monitoring equipment have been proposed. Other intelligent alarming systems
focusing on data validation have been implemented in the operating room, and
include rule-based systems for respiratory-circulatory management and for patient
state-dependent data collection and processing. Rule-based systems have been
combined with fuzzy logic and neural networks for false alarm reduction.

10 | P a g e
ECG IN PATIENT MONITORING
The techniques for monitoring the ECG in real time were developed in conjunction
with the concept of the coronary care unit (CCU). Patients were placed in these
specialized hospital units to carefully observe their progress during an acute illness
such as a myocardial infarction or after complex surgical procedures.
As the number of beds increased in these units, it became clear that the highly
trained medical staff could not continually watch a monitor screen, and
computerized techniques were added that monitored the patient’s rhythm. These
programs were not unlike those developed for the ambulatory ECG, and the high-
speed numerical capability of the computer was not taxed by monitoring a single
ECG. The typical CCU would have 8 to 16 beds, and hence the computing power
was taken to its limit by monitoring multiple beds. The modern units have the CPU
distributed within the ECG module at the bedside, along with modules for
measuring many other physiologic parameters. Each bedside monitor would be
interconnected with a high-speed digital line, e.g., Ethernet, to a centralized
computer used primarily to control communications and maintain a patient
database.
The electrocardiogram (ECG) is a technique of recording bioelectric currents
generated by the heart. Clinicians can evaluate the conditions of a patient's heart
from the ECG and perform further diagnosis. ECG records are obtained by
sampling the bioelectric currents sensed by several electrodes, known as leads. A
typical one-cycle ECG tracing is shown in Figure.

11 | P a g e
Fig 1 ECG wave
Generally, the recorded ECG signal is often contaminated by noise and artifacts
that can be within the frequency band of interest and manifest with similar
characteristics as the ECG signal itself. In order to extract useful information from
the noisy ECG signals, you need to process the raw ECG signals.
ECG signal processing can be roughly divided into two stages by functionality:
pre-processing and feature extraction (as shown in Figure 2). The pre-processing
stage removes or suppresses noise from the raw ECG signal and the feature
extraction stage extracts diagnostic information from the ECG signal which will be
done using MATLAB.
Fig 2 Pre-processing of ECG data

12 | P a g e
Pre-processing ECG Signals
Preprocessing ECG signals helps you remove contaminants from the ECG signals.
Broadly speaking, ECG contaminants can be classified into the following
categories:
power line interference
electrode pop or contact noise
patient–electrode motion artifacts
electromyographic (EMG) noise
baseline wandering
Among these noises, the power line interference and the baseline wandering are the
most significant and can strongly affect ECG signal analysis. Except for these two
noises, other noises may be wideband and usually a complex stochastic process
which also distort the ECG signal. The power line interference is narrow-band
noise centered at 50 Hz with a bandwidth of less than 1 Hz. Usually the ECG
signal acquisition hardware can remove the power line interference. However the
baseline wandering and other wideband noises are not easy to be suppressed by
hardware equipments. Instead, the software scheme is more powerful and feasible
for offline ECG signal processing by using MATLAB.

13 | P a g e
Hardware Design of ECG Conditioning Circuit
The designed ECG conditioning circuit as shown in Fig. 3 is based on the use of
the AD844 high speed op amp and AD620 high-accuracy instrumentation
amplifier to sense and amplify detected signals from electrodes. The voltage gain
of signal amplification G can be given by:
Fig 3 circuit of ECG using AD620

14 | P a g e
TEMPRATURE SENSOR
Thermistor, or temperature-sensitive resistor is a type of temperature sensor. Most
thermistors have a negative temperature coefficient (NTC), meaning the resistance
goes up as temperature goes down. Of all passive temperature measurement
sensors, thermistors have the highest sensitivity (resistance change per degree of
temperature change). Thermistors do not have a linear temperature/resistance
curve.
Often, many thermistors in a family will have similar characteristics and identical
temperature/resistance curves. The resistance is given as a ratio (R/R25). An NTC
thermistor with a resistance at 25∞C (R25) of 10K would have a resistance of
28.1K at 0∞C. Similarly, a thermistor with R25 of 5K would have a resistance of
14.050K at 0∞C.
Fig 4 Thermistor resistance/temperature curve
The figure shows this thermistor curve graphically. We can see that the
resistance/temperature curve is not linear. While the data for this thermistor is
given in 10-degree increments, some thermistor tables have five-degree or even
one-degree increments. In some cases, you need to know the temperature between
two points on the table. You can estimate this by using the curve, or you can
calculate the resistance directly. The formula for resistance looks like this:

15 | P a g e
where T is the temperature in degrees Kelvin and A, B, C, and D are constants that
depend on the characteristics of the thermistor. These parameters are supplied by
the thermistor manufacturer.
Fig 5 Temperature sensing circuit
Thermistor circuit
This figure shows a typical circuit that could be used to allow a microprocessor to
measure temperature using a thermistor. A resistor (R1) pulls the thermistor up to a
reference voltage. This is typically the same as the ADC reference, so Vref would
be 5V if the ADC reference were 5V. The thermistor/resistor combination makes a
voltage divider, and the varying thermistor resistance results in a varying voltage at
the junction. The accuracy of this circuit depends on the thermistor tolerance,
resistor tolerance, and reference accuracy.
Self-heating Since a thermistor is a resistor, passing current through it will generate some heat.
The circuit designer must ensure that the pullup resistor is large enough to prevent
excessive self-heating, or the system will end up measuring the thermistor
dissipation instead of the ambient temperature.

16 | P a g e
The amount of self-heating allowed, and, therefore, the size of the limiting resistor,
depends on the measurement accuracy needed. A system that requires an accuracy
of ±5∞C can tolerate more thermistor self-heating than a system that must be
accurate to ±0.1∞C.
Note that the pullup resistor must be calculated to limit self-heating dissipation
over the entire measurement temperature range. For a given resistor, the thermistor
dissipation will change at different temperatures because the thermistor resistance
changes.
17 | P a g e
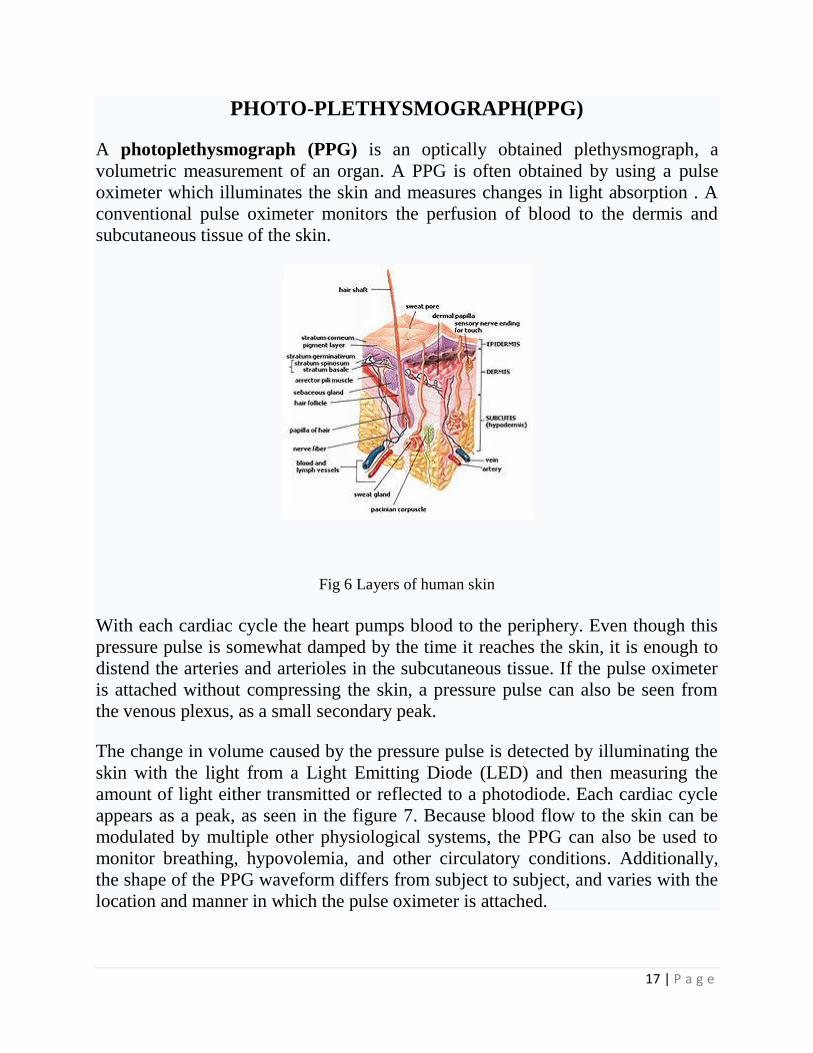
PHOTO-PLETHYSMOGRAPH(PPG)
A photoplethysmograph (PPG) is an optically obtained plethysmograph, a
volumetric measurement of an organ. A PPG is often obtained by using a pulse
oximeter which illuminates the skin and measures changes in light absorption . A
conventional pulse oximeter monitors the perfusion of blood to the dermis and
subcutaneous tissue of the skin.
Fig 6 Layers of human skin
With each cardiac cycle the heart pumps blood to the periphery. Even though this
pressure pulse is somewhat damped by the time it reaches the skin, it is enough to
distend the arteries and arterioles in the subcutaneous tissue. If the pulse oximeter
is attached without compressing the skin, a pressure pulse can also be seen from
the venous plexus, as a small secondary peak.
The change in volume caused by the pressure pulse is detected by illuminating the
skin with the light from a Light Emitting Diode (LED) and then measuring the
amount of light either transmitted or reflected to a photodiode. Each cardiac cycle
appears as a peak, as seen in the figure 7. Because blood flow to the skin can be
modulated by multiple other physiological systems, the PPG can also be used to
monitor breathing, hypovolemia, and other circulatory conditions. Additionally,
the shape of the PPG waveform differs from subject to subject, and varies with the
location and manner in which the pulse oximeter is attached.

18 | P a g e
Sites for measuring PPG
While pulse oximeters are a commonly used medical device the PPG derived from
them is rarely displayed, and is nominally only processed to determine heart rate.
PPGs can be obtained from transmissive absorption (as at the finger tip) or
reflective (as on the forehead).
In outpatient setting pulse oximeters are commonly worn on the finger and ear.
However, in cases of shock, hypothermia, etc. blood flow to the periphery can be
reduced, resulting in a PPG without a discernible cardiac pulse. In this case, a PPG
can be obtained from a pulse oximeter on the head, with the most common sites
being the ear, nasal septum, and forehead.
PPGs can also be obtained from the vagina and esophagus.
Uses
Fig 7 Premature Ventricular Contraction (PVC) can be seen in the PPG just as in the EKG and
the Blood Pressure (BP).
Fig 8 Venous pulsations can be clearly seen in this PPG.

19 | P a g e
Because the skin is so richly per fused, it is relatively easy to detect the pulsatile
component of the cardiac cycle. The DC component of the signal is attributable to
the bulk absorption of the skin tissue, while the AC component is directly
attributable to variation in blood volume in the skin caused by the pressure pulse of
the cardiac cycle.
The height of AC component of the photoplethysmogram is proportional to the
pulse pressure, the difference between the systolic and diastolic pressure in the
arteries. As seen in the figure 7 showing Premature Ventricular Contractions
(PVCs) the PPG pulse for the cardiac cycle with the PVC results in lower
amplitude blood pressure and a PPG. Ventricular Tachycardia and Ventricular
Fibrillation can also be detected.
Respiration effects the cardiac cycle by varying the intrapleural pressure, the
pressure between the thoracic wall and the lungs. Since the heart resides in the
thoracic cavity between the lungs, the partial pressure of inhaling and exhaling
greatly influence the pressure on the vena cava and the filling of the right atrium.
This effect is often referred to as normal sinus arrhythmia.
During inspiration, intrapleural pressure decreases by up to 4 mm Hg which
distends the right atrium, allowing for faster filling from the vena cava, increasing
ventricular preload, and increasing the stroke volume. Conversely during
expiration, the heart is compressed, decreasing cardiac efficiency and reducing
stroke volume. However, the overall net effect of respiration is to act as pump for
the cardiovascular system. When the frequency and depth of respiration increases,
the venous return increase leading to increased cardiac output.

20 | P a g e
Fig 9 Reflective PPG
The yellow region shows the path of the photons (emitted by the source) which reach the detector after scattering and absorption into the various layers of the skin
Fig 10 Circuit Diagram of PPG

21 | P a g e
APPLICATIONS
PPG when used along with another LED of 680nm (red-visible) we get a
Pulse Oximeter.
PPG can be used to find the
PPG can be used as a replacement of ECG for HRV analysis in healthy
subjects.
PPG has several “potential” qualities to be exploited.

22 | P a g e
MATLAB
MATLAB® is a high-performance language for technical computing. It integrates
computation, visualization, and programming in an easy-to-use environment where
problems and solutions are expressed in familiar mathematical notation. Typical
uses include Math and computation Algorithm development Data acquisition
Modeling, simulation, and prototyping Data analysis, exploration, and
visualization Scientific and engineering graphics Application development,
including graphical user interface building
MATLAB is an interactive system whose basic data element is an array that does
not require dimensioning. This allows you to solve many technical computing
problems, especially those with matrix and vector formulations, in a fraction of the
time it would take to write a program in a scalar noninteractive language such as C
or Fortran.
The name MATLAB stands for matrix laboratory. MATLAB was originally
written to provide easy access to matrix software developed by the LINPACK and
EISPACK projects. Today, MATLAB engines incorporate the LAPACK and
BLAS libraries, embedding the state of the art in software for matrix computation.
MATLAB has evolved over a period of years with input from many users. In
university environments, it is the standard instructional tool for introductory and
advanced courses in mathematics, engineering, and science. In industry, MATLAB
is the tool of choice for high-productivity research, development, and analysis.
MATLAB features a family of add-on application-specific solutions called
toolboxes. Very important to most users of MATLAB, toolboxes allow you to
learn and apply specialized technology. Toolboxes are comprehensive collections
of MATLAB functions (M-files) that extend the MATLAB environment to solve
particular classes of problems. Areas in which toolboxes are available include
signal processing, control systems, neural networks, fuzzy logic, wavelets,
simulation, and many others.
The MATLAB System
The MATLAB system consists of five main parts:
1. Development Environment. This is the set of tools and facilities that help
you use MATLAB functions and files. Many of these tools are graphical
user interfaces. It includes the MATLAB desktop and Command Window, a
command history, an editor and debugger, and browsers for viewing help,
the workspace, files, and the search path.

23 | P a g e
2. The MATLAB Mathematical Function Library. This is a vast collection of
computational algorithms ranging from elementary functions, like sum, sine,
cosine, and complex arithmetic, to more sophisticated functions like matrix
inverse, matrix eigenvalues, Bessel functions, and fast Fourier transforms.
3. The MATLAB Language. This is a high-level matrix/array language with
control flow statements, functions, data structures, input/output, and object-
oriented programming features. It allows both "programming in the small" to
rapidly create quick and dirty throw-away programs, and "programming in
the large" to create large and complex application programs.
4. Graphics. MATLAB has extensive facilities for displaying vectors and
matrices as graphs, as well as annotating and printing these graphs. It
includes high-level functions for two-dimensional and three-dimensional
data visualization, image processing, animation, and presentation graphics. It
also includes low-level functions that allow you to fully customize the
appearance of graphics as well as to build complete graphical user interfaces
on your MATLAB applications.
5. The MATLAB Application Program Interface (API). This is a library that
allows you to write C and Fortran programs that interact with MATLAB. It
includes facilities for calling routines from MATLAB (dynamic linking),
calling MATLAB as a computational engine, and for reading and writing
MAT-files.

24 | P a g e
PROGRAM IN MATLAB FOR QRS DETECTION
ecg=load('ecg.txt'); fs=1000; t=(0:length(ecg)-1)/fs; j=1; k=0; l=1; q=0; NN50=0; for i=1:length(ecg) if (ecg(i,1)>3) a(j,1)=ecg(i,1); j=j+1; k=k+1; q=q+1; elseif ((k>=1)&(ecg(i,1)<3)) k=0; j=1; l=l+1; q=0; end end display(peak_values); for i=1:l-2 rr_interval_t(i,1)=(c(i+1,1)-c(i,1))/fs; heart_rate(i,1)=60/rr_interval_t(i,1); rr_interval(i,1)=rr_interval_t(i,1)*fs; if rr_interval(i,1)>50 NN50=NN50+1; end end display(rr_interval_t); display(heart_rate); display('mean heart rate'); display(mean(heart_rate)); SDNN=std(rr_interval_t); display(SDNN); display(NN50);
plot(ecg);

25 | P a g e
OUTPUT IN MATLAB
>> aks
peak_values =
5.6399
6.9742
7.3065
7.0493
6.5167
5.7877
5.4584
5.6033
6.8433
7.2330
7.0575
6.6867
5.7367
5.4468
6.8442
7.1014
6.9580
6.3950
5.6104
5.3207
6.3165
7.1045
6.9714
6.1520
5.4648
5.4211
5.7349
7.2922
7.4747
7.0489
6.0904
5.6433
5.5310
6.4993
7.4823
7.0770
6.7502
6.1478
5.5734
5.3870
6.0428
7.4789
7.3279
6.9281
5.7611
5.2875
5.4828
6.7703
7.4866
7.0227
6.7987
5.7483
5.1663
5.5347
7.0190
7.3325
7.2177
6.8634
6.4102
5.5576
5.3888
5.5136
5.8841
7.2357
7.4439
6.9171
6.6232
5.6821
5.4233
5.7077
7.1173
7.3831
7.0837
6.1099
5.4535
5.4462
5.9903
7.3914
7.5327
7.0047
6.7954
6.5924
6.4273
5.7327
5.2869
5.8389
7.3230
7.4435
6.9601
5.6436
5.2777
6.3507
7.2864
6.6049
5.6082
5.9653
7.5226
6.9345
6.8457
6.7914
6.3940
5.4431
5.4495
5.3937
5.4010
6.7358
rr_interval_t =
0.5410
0.5600
0.5900
0.6330
0.6000
0.5700
0.5640
0.5580
0.5670
0.5790
0.5890
0.5910
0.5760
0.5880
0.5890
0.5960
0.5930
0.5880
0.5770
0.5810
0.5800
0.6050
0.6280
0.5890
0.5840
0.5700
0.5900
0.6080
0.6680
0.6790
0.6260

26 | P a g e
0.6070
0.6140
0.6070
0.6330
0.6430
0.6340
0.6030
0.5870
0.5780
0.5760
0.6050
0.6380
0.6830
0.6210
0.6080
0.6160
0.6210
0.6730
0.6900
0.6650
0.6140
0.5940
0.5870
0.5910
0.6120
0.6660
0.6620
0.6230
0.5980
0.5860
0.5830
0.6110
0.6590
0.7090
0.7420
0.7040
0.6270
0.6070
0.6060
0.6170
0.6540
0.6730
0.6290
0.6120
0.5980
0.6040
0.6250
0.6630
0.6720
0.6660
0.6560
0.6270
0.5980
0.5940
0.5870
0.6190
0.6540
0.6820
0.6220
0.6350
0.6310
0.6580
0.6260
0.6320
0.6280
0.6800
0.6790
0.6720
0.6620
0.6270
0.6070
0.5940
0.5770
0.6090
heart_rate =
110.9057
107.1429
101.6949
94.7867
100.0000
105.2632
106.3830
107.5269
105.8201
103.6269
101.8676
101.5228
104.1667
102.0408
101.8676
100.6711
101.1804
102.0408
103.9861
103.2702
103.4483
99.1736
95.5414
101.8676
102.7397
105.2632
101.6949
98.6842
89.8204
88.3652
95.8466
98.8468
97.7199
98.8468
94.7867
93.3126
94.6372
99.5025
102.2147
103.8062
104.1667
99.1736
94.0439
87.8477
96.6184
98.6842
97.4026
96.6184
89.1530
86.9565
90.2256
97.7199
101.0101
102.2147
101.5228
98.0392
90.0901
90.6344
96.3082
100.3344
102.3891
102.9160
98.1997
91.0470
84.6262
80.8625
85.2273
95.6938
98.8468
99.0099
97.2447
91.7431
89.1530
95.3895
98.0392
100.3344
99.3377
96.0000
90.4977
89.2857
90.0901
91.4634
95.6938
100.3344
101.0101
102.2147
96.9305
91.7431
87.9765
96.4630
94.4882

27 | P a g e
95.0872
91.1854
95.8466
94.9367
95.5414
88.2353
88.3652
89.2857
90.6344
95.6938
98.8468
101.0101
103.9861

28 | P a g e
mean heart rate =
97.2579
SDNN =
0.0378
NN50 =
105
Fig 11 Plot of ECG waveform

29 | P a g e
PROGRAM IN MATLAB FOR PPG DETECTION
ppg=load('SamplePPG.txt'); fs=1000; t=(0:length(ppg)-1)/fs; j=1; k=0; l=1; q=0; for i=1:length(ppg) if (ppg(i,1)>1) a(j,1)=ppg(i,1); j=j+1; k=k+1; q=q+1; elseif ((k>=1)&(ppg(i,1)<1)) k=0; j=1; systolic_peak(l,1)=max(a); l=l+1; q=0; end end display(systolic_peak); plot(ppg);

30 | P a g e
OUTPUT OF PPG IN MATLAB
>> ppg1
systolic_peak =
2.4478
2.3526
2.1909
2.1616
2.1610
2.1338
2.1384
Fig 12 Plot of PPG waveform