cancer prevalence in california counties
TRANSCRIPT

Cancer Prevalence in California Counties

ACKNOWLEDGEMENTS AND DISCLAIMER
The collection of cancer data used in this study was supported by California Department of Public Health as part of the statewide cancer reporting program mandated by the California Health and Safety Code Section 103885; the National Cancer Institute’s Surveillance, Epidemiology and End Results Program under contracts awarded to the Cancer Prevention Institute of California, the University of Southern California, and the Public Health Institute; and the Centers for Disease Control and Prevention’s National Program of Cancer Registries, under agreement awarded to the California Department of Public Health. The ideas and opinions expressed herein are those of the author(s) and endorsement by the State of California, Department of Public Health, the National Cancer Institute, the Centers for Disease Control and Prevention, or their Contractors and Subcontractors is not intended nor should be inferred.
Inquiries regarding the content of this report should be directed to:
California Cancer Reporting and Epidemiologic Surveillance (CalCARES) Program Institute for Population Health Improvement, UC Davis Health 1631 Alhambra Blvd., Suite 200 Sacramento, CA 95816 (916) 731-2500 http://www.ucdmc.ucdavis.edu/iphi/
Cancer Prevalence in California Counties | Page 2
This publication was prepared by the California Cancer Reporting and Epidemiologic Surveillance (CalCARES) Program, Institute for Population Health Improvement, University of California Davis Health
1631 Alhambra Blvd., Suite 200 Sacramento, CA 95816 (916) 731-2500 http://www.ucdmc.ucdavis.edu/iphi/ Suggested citation:
Chen YW, Maguire FB, Morris CR, Parikh-Patel A, Kizer KW. Cancer Prevalence in California
Counties. Sacramento, CA: California Cancer Reporting and Epidemiologic Surveillance Program,
Institute for Population Health Improvement, University of California Davis, January 2017.
Copyright information:
All material in this report is in the public domain and may be reproduced or copied without permission; citation as to source, however, is appreciated. Prepared by:
Yi W. Chen, B.S. CalCARES Program Institute for Population Health Improvement UC Davis Health
Arti Parikh-Patel, Ph.D., M.P.H. Program Director CalCARES Program Institute for Population Health Improvement UC Davis Health
Frances B. Maguire, M.P.H. CalCARES Program Institute for Population Health Improvement UC Davis Health
Cyllene R. Morris, D.V.M., Ph.D. Research Program Director CalCARES Program Institute for Population Health Improvement UC Davis Health
Kenneth W. Kizer, M.D., M.P.H. Distinguished Professor, UC Davis School of Medicine and Betty Irene Moore School of Nursing Director, CalCARES Program and Director, Institute for Population Health Improvement UC Davis Health
Cancer Prevalence in California Counties | Page 3

Table of Contents Introduction ............................................................................................................... 5 Methods .................................................................................................................... 6 Complete Prevalence Counts by Cancer Site ................................................................ 7 Limited Duration Prevalence for Childhood and Adolescent Cancer ............................. 9 Complete Prevalence by Cancer Site and Age Group ................................................. 11 County Socioeconomic Status ................................................................................... 13 Complete Prevalence by Region and County for Selected Cancers ............................. 16
All Sites Combined ........................................................................................ 16
Breast (Female) ... ………………………………………………………………………………………….18
Prostate .. ……………………………………………………………………………………………………..20
Colon and Rectum .. ………………………………………………………………………………………22
Melanoma of the Skin .. ………………………………………………………………………………..24
Thyroid .. …………………………………………………………………………………………………..….26
Uterine Corpus ... …………………………………………………………………………………………..28
Urinary Bladder . ......................................................................................….....30
Non-Hodgkin Lymphoma ... …………………………………………………………………………...32
Lung and Bronchus .. ……………………………………………………………………………………..34
Kidney and Renal Pelvis .. ………………………………………………………………………………36
Leukemia .. …………………………………………………………………………………………………...38
Cervix Uteri .. ………………………………………………………………………………………………..40
Oral Cavity and Pharynx .. ……………………………………………………………………………..42
Testis .. ………………………………………………………………………………………………………….44
Ovary .. ………………………………………………………………………………………………………….46
Hodgkin Lymphoma .. ……………………………………………………………………………………48
Brain and Central Nervous System ... ……………………………………………………………..50
Stomach ... ………………………………………………………………………………………………..…..52
Liver and Intrahepatic Bile Duct .. ………………………………………………………………….54
Larynx ... ………………………………………………………………………………………………………..56
Pancreas .. …………………………………………………………………………………………………….58
Conclusion ... …………………………………………………………………………………………………………….60 References ... ……………………………………………………………………………………………………………61 Appendix A .. …………………………………………………………………………………………………………….63
Cancer Prevalence in California Counties | Page 4
Introduction
Cancer is the term commonly used to refer to a large number of different clinical conditions
which are collectively characterized by an abnormal or uncontrolled division of cells in different
organs or parts of the body that, as a result of the unusual cell growth, harms the body and may
lead to death. Some types of cancer occur commonly (e.g., breast, colon, and prostate cancer),
while others occur rarely (e.g., sarcomas, thymomas, and pheochromocytomas). In the
aggregate, cancer has become a primary reason for people to seek health care and is a leading
cause of death in the United States. In many states, including California beginning in 2014,
cancer is the leading cause of death and one of the overall most expensive health care
conditions to treat. Therefore, knowing the extent of cancer in the population – i.e., its
prevalence - is important.
For this report, cancer prevalence is defined as the number of people in a population on a given
date who have ever had a diagnosis of cancer. This includes new and pre-existing cases whether
or not the persons are disease-free or currently living with cancer. It is an important indicator of
population health since it reflects both the number of people with active disease (cancer) and
the number of persons who have survived having had the disease (i.e., cancer survivors), which
together provides an estimate of the overall burden of cancer on the population. Such
information is important for health services planning and resource allocation purposes, among
other reasons.
The prevalence of cancer, or the total number of persons living with cancer in the population, is
a function of both disease incidence and mortality. A low incidence or a high mortality can
contribute to a low prevalence, while a high incidence or a low mortality can contribute to a
high prevalence. Low cancer mortality may be a consequence of early detection and effective
medical treatments that result in longer survivorship. Incidence also can be influenced by,
among other things, the prevalence of cancer risk factors and cancer screening programs.
Local health officers should find the findings of this report helpful for informing monitoring and
screening efforts and for planning survivorship care. Survivorship care is important because
many cancer survivors have to deal with long-term consequences of treatment, as well as
psychological concerns (e.g., the fear of recurrence).
Overall cancer deaths in the U.S. and California have declined since the early 1990’s due to
improvements in screening and early detection, reduced risk factors (especially the reduced use
of tobacco), and development of more effective treatments resulting in improved survival.1 The
number of people living beyond a cancer diagnosis in the United States was approximately 14.5
million in 2014, and is expected to rise to almost 19 million by 2024.1 This increasing cancer
Cancer Prevalence in California Counties | Page 5

survivorship has contributed to the escalating costs of cancer care in recent decades. The
estimated adjusted annual direct medical spending on cancer care in the U.S. doubled between
1990 and 2010, rising to an estimated $125 billion.2 This figure is projected to reach at least
$158 billion by 2020, and may rise to $207 billion.3 The increased societal burden of cancer
underscores the need for accurate statistics on cancer prevalence.
This report provides cancer prevalence information for California on January 1, 2013, based on
data collected by the California Cancer Registry (CCR). Limited duration prevalence for
childhood and adolescent cancer groups and complete prevalence both by age group and
region/county for twenty-one common cancer sites are presented; these include: female
breast, prostate, colon and rectum, melanoma of the skin, thyroid, corpus and uterus, urinary
bladder, non-Hodgkin lymphoma, lung and bronchus, kidney and renal pelvis, leukemia, cervix
uteri, oral cavity and pharynx, testis, ovary, Hodgkin lymphoma, brain and central nervous
system (CNS), stomach, liver and intrahepatic bile duct (IBD), larynx, and pancreas. The CCR is
California’s population-based cancer surveillance system. Since it was established in 1988, CCR has collected information on tumor characteristics, diagnosis, treatment and patient
demographics for more than four million patients diagnosed with cancer in the state. To the
best of our knowledge, this report is the first comprehensive analysis of cancer prevalence in
California.
Methods
Different cancer prevalence breakdowns are used in this report to describe the burden of
cancer. Overall prevalence by cancer site shows how prevalent each of the cancer sites is.
Prevalence of childhood and adolescent cancer describes survivorship for children and
adolescents diagnosed with each type of cancer. Age group prevalence differences are shown
in the prevalence by site and age groups. Prevalence at the California county level provides
information about the burden of cancer in different parts of the state.
Limited-duration prevalence for childhood and adolescent International Classification of
Childhood Cancer (ICCC) groups was calculated for the period January 1, 1988, to January 1,
2013. It was calculated using the counting method implemented in the SEER*Stat software.
This method calculates the number of people alive at the prevalence date that had a diagnosis
of the disease within a certain time period, which for this report is the full history of the registry
up to January 1, 2013 (i.e., 1988-2013). The limited-duration prevalence method includes a
correction for people lost to follow-up. For each individual lost to follow-up, a probability of
being alive at the prevalence date is estimated from an appropriate survival function.
Complete prevalence was calculated as of January 1, 2013, for twenty-one common cancer
sites. Complete prevalence is an estimate of the number of persons alive on a specified date
Cancer Prevalence in California Counties | Page 6
that had been diagnosed with the given cancer, no matter how long ago that diagnosis was
made. It is calculated by applying the completeness index method to limited-duration
prevalence. The completeness index method is implemented in the COMPREV software. To
create a completeness index from date of diagnosis January 1, 1988, to January 1, 2013, we
selected the mode of “Multi-Select by Groups|Completeness Index Only |Default Parameters
Only” and chose the combination of sites and sex. After the index was created, we merged back
the index to our 25 year limited duration prevalence created by SEER*Stat by site, sex, and age
at prevalence. The final step entailed calculating the complete prevalence by dividing the
completeness index into the limited duration prevalence.
Unless otherwise specified, prevalence calculations include only the first malignant tumor per
person; in situ cancers and second-or-later primary cancers are not included. That is, a person
will not contribute more than one tumor diagnosis to a single prevalence estimate. However,
different tumors for an individual may contribute to separate statistics shown in the results. For
example, if a person has a breast cancer diagnosis in 1988 and a lung cancer diagnosis in 2000,
the breast cancer would contribute to the “All sites” and “Breast” estimates and the lung
cancer would contribute to the “Lung” estimate.
CCR data has more than 95% completed follow up. For those lost cases, we used an observed
survival method to compute the survival using cohorts matched by age (<60, 60-69, 70+), sex,
race, and site.
Results
Complete Prevalence Counts by Cancer Site
The complete cancer prevalence of twenty-one common cancer sites at prevalence date
January 1, 2013, is shown in Figure 1. The numbers shown to the right of each bar are the total
number of prevalent cases for each cancer site. More than 1.4 million children and adults with a
history of one of these cancers were alive in California on January 1, 2013. Female breast,
prostate, and colorectal cancers were the three most prevalent cancers. Female breast cancer
and prostate cancer are the most commonly occurring cancers among women and men,
respectively.4,5 Colorectal is the third most commonly occurring cancer for both sexes.4 High
prevalence reflects the high incidence and relatively good survivorship of these cancers. Lung
and bronchus cancer is the second most common cancer in both men and women but is the
ninth most prevalent. The lower prevalence for this cancer reflects the currently high relative
lethality of the condition and the fact that it is the leading cancer killer in both men and
women.4
Cancer Prevalence in California Counties | Page 7

Figure 1: Estimated Complete Prevalence Counts by Cancer Site, All Races Combined, California, January 1, 2013
5,849
8,455
8,757
11,669
16,415
19,337
23,590
26,949
35,395
35,660
36,170
44,895
46,543
61,522
62,675
67,882
68,927
105,874
131,583
279,151
333,716
0 50,000 100,000 150,000 200,000 250,000 300,000 350,000 400,000
Pancreas
Larynx
Liver and IBD
Stomach
Brain and CNS
Hodgkin Lymphoma
Ovary
Testis
Oral Cavity and Pharynx
Cervix Uteri
Leukemia
Kidney and Renal Pelvis
Lung and Bronchus
Non-Hodgkin Lymphoma
Urinary Bladder
Corpus and Uterus, NOS
Thyroid
Melanoma of the Skin
Colon and Rectum
Prostate
Breast (Female)
Number of prevalent cases
Cancer Prevalence in California Counties | Page 8
Limited-Duration Prevalence for Childhood and Adolescent Cancer, Age under 20 at Diagnosis
The twenty-five year limited-duration prevalence of cancers according to the International
Classification of Childhood Cancer (ICCC) is shown in Figure 2 for people who were diagnosed
under the age of twenty during 1988 to 2013. Childhood and adolescent cancers are
categorized differently than adult cancers; they are categorized according to the ICCC which
includes thirteen site groups. This classification is based on the form and structure of the tumor
(commonly referred to as tumor morphology) and primary site, with an emphasis on
morphology. Adult cancers are also categorized based on morphology and primary site, but the
emphasis is on primary site (e.g., breast, lung, etc.). Limited-duration prevalence is used
because the software COMPREV (https://surveillance.cancer.gov/comprev/) does not have a
completeness index for ICCC groups.
More than 30,000 people with a history of a childhood or adolescent cancer diagnosis between
1988 and2013 were alive in California on January 1, 2013. Lymphoid leukemias, lymphomas and
reticuloendothelial neoplasms, and central nervous system (CNS) and miscellaneous
intracranial and intraspinal neoplasms had the greatest prevalence. These three cancer groups
commonly occur in children and adolescents. They are the three most common cancers in
children ages 0 to 14 and the second, third, and fourth most common in adolescents ages 15 to
19.6 All three of these cancer groups have relatively high five-year survival rates (over 70%),6
which helps explain the high prevalence.
Children and adolescents diagnosed with cancer may experience treatment-related side effects
or complications many years after their diagnosis and treatment. Prevalence information
identifies the number of people alive who may experience late effects of treatment such as
increased risk of a second cancer, heart or lung problems, and infertility.7 It is important that
survivors of pediatric cancers be monitored for late effects long after their initial treatment. The
Children’s Oncology Group has developed long-term follow-up guidelines for managing late
effects in childhood cancer survivors that are intended to identify late effects, provide timely
intervention, increase quality of life, and decrease complication-related health care costs.8
Cancer Prevalence in California Counties | Page 9
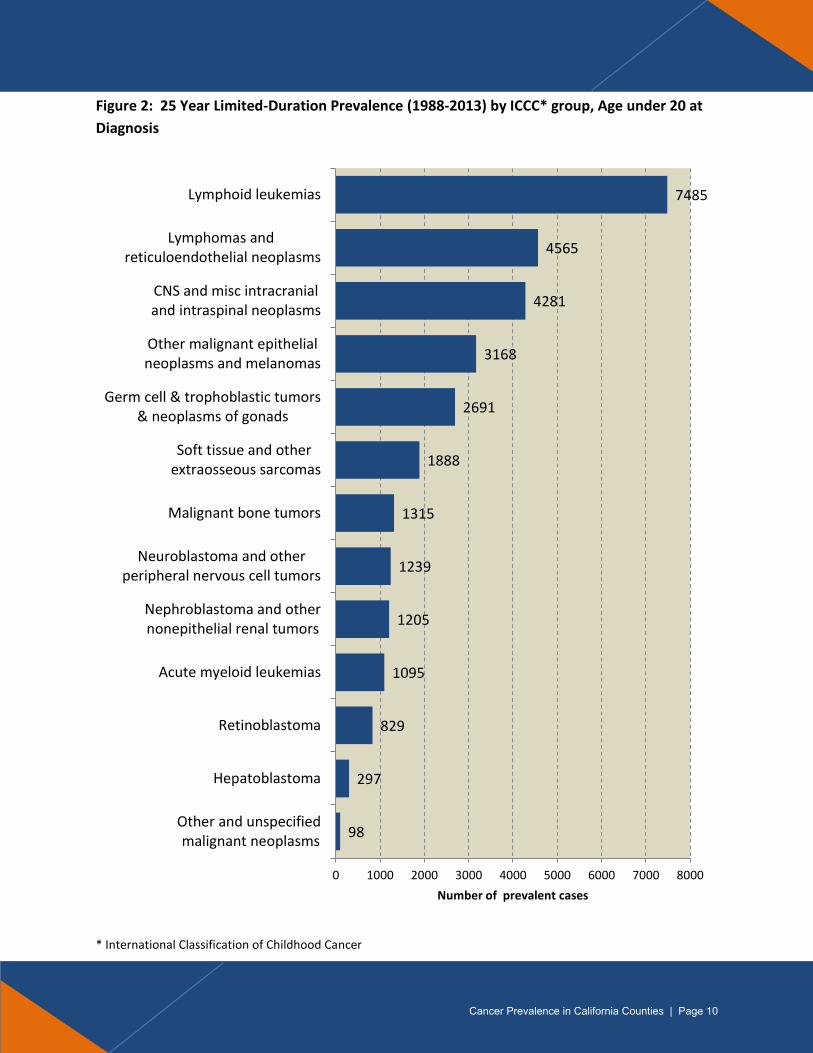
Figure 2: 25 Year Limited-Duration Prevalence (1988-2013) by ICCC* group, Age under 20 at
Diagnosis
* International Classification of Childhood Cancer
98
297
829
1095
1205
1239
1315
1888
2691
3168
4281
4565
7485
0 1000 2000 3000 4000 5000 6000 7000 8000
Other and unspecified malignant neoplasms
Hepatoblastoma
Retinoblastoma
Acute myeloid leukemias
Nephroblastoma and othernonepithelial renal tumors
Neuroblastoma and otherperipheral nervous cell tumors
Malignant bone tumors
Soft tissue and other extraosseous sarcomas
Germ cell & trophoblastic tumors& neoplasms of gonads
Other malignant epithelialneoplasms and melanomas
CNS and misc intracranialand intraspinal neoplasms
Lymphomas and reticuloendothelial neoplasms
Lymphoid leukemias
Number of prevalent cases
Cancer Prevalence in California Counties | Page 10

Complete Prevalence by Cancer Site and Age Group
The complete prevalence by cancer site and age group is shown in Figure 3. The total
prevalence counts, from greatest to least, are shown in the second column, while the age group
prevalence counts are shown in the subsequent columns with numbers indicating the top five
most prevalent cancers on January 1, 2013 in each age group. The most prevalent cancers
change with age group. Female breast cancer had the greatest prevalence for ages 20 to 49
years and 50 to 64 years, but it was the second most prevalent cancer after prostate cancer for
ages 65 to 74 years and 75 years and older. Thyroid cancer was the second most prevalent
cancer for ages 20 to 49 years and the fifth most prevalent cancer for ages 50 to 64, but it was
not one of the five most prevalent cancers for the other age groups. Prostate cancer was the
second most prevalent cancer for ages 50 to 64 years. Melanoma of the skin was the third most
prevalent cancer for ages 20 to 49 years and 50 to 64 years, while colorectal cancer was the
third most prevalent for ages 65 to 74 years and 75 years and older. Testicular cancer and
Hodgkin Lymphoma were the fourth and fifth most prevalent cancers in the 20 to 49 year age
group but were not one of the top five most prevalent cancers for the other age groups.
Urinary bladder cancer was the fourth most prevalent in the 75 year and older age group but
was not among the five most prevalent cancers for the other age groups. Uterine cancer was
the fifth most prevalent cancer in people 65 years and older but was not among the five most
prevalent cancers for the other age groups.
When comparing the cancer prevalence across age groups, the population size of the age group
must be considered. People ages 20 to 49 comprised 58% of the population, while persons age
75 and older comprised 7% of the population. Cancer prevalence, expressed as a percentage of
the population, increased across the age groups, increasing from 0.95% for people ages 20 to
49 years to 23.74% for people 75 years and older. This increase with age group likely reflects
the increasing incidence of most cancers with age. Among the cancers listed in Figure 3, three
have prevalence decreases in the older age groups. Cancers of the testis, brain and CNS, and
Hodgkin lymphoma show decreasing prevalence in people ages 65 to 74 years and in people
age 75 years and older; these cancers are more common in younger people.
Cancer Prevalence in California Counties | Page 11

Figu
re 3
. Es
tim
ate
d C
om
ple
te P
reva
len
ce o
n J
anu
ary
1, 2
01
3 b
y Si
te a
nd
Age
Gro
up
, Cal
ifo
rnia
Site
sTo
tal
Bre
ast
(Fem
ale)
33
3,7
09
❶2
7,9
84
❶1
05
,53
2❷
90
,99
9❷
10
9,1
94
Pro
stat
e2
79
,14
41
,66
7❷
51
,14
3❶
97
,42
0❶
12
8,9
14
Co
lon
an
d R
ectu
m1
31
,56
17
,12
9❹
31
,78
6❸
33
,08
7❸
59
,55
9
Mel
ano
ma
of
the
Skin
10
5,6
94
❸1
6,3
08
❸3
5,1
35
❹2
5,1
24
29
,12
7
Thyr
oid
68
,61
5❷
21
,70
7❺
26
,03
61
2,0
19
8,8
53
Co
rpu
s an
d U
teru
s, N
OS
67
,87
84
,02
91
9,0
79
❺1
8,2
26
❺2
6,5
44
Uri
nar
y B
lad
der
62
,64
81
,61
81
0,5
16
17
,11
5❹
33
,39
9
No
n-H
od
gkin
Lym
ph
om
a6
0,7
68
9,1
08
17
,84
81
5,2
05
18
,60
7
Lun
g an
d B
ron
chu
s4
6,5
15
1,4
41
9,5
23
15
,09
92
0,4
52
Kid
ney
an
d R
enal
Pel
vis
44
,06
25
,68
71
3,4
16
12
,09
31
2,8
66
Leu
kem
ia3
0,9
38
9,3
58
7,6
69
6,3
03
7,6
08
Cer
vix
Ute
ri3
5,6
53
7,2
06
12
,86
57
,17
38
,40
9
Ora
l Cav
ity
and
Ph
aryn
x3
5,2
55
3,9
61
12
,42
39
,29
49
,57
7
Test
is2
6,6
46
❹1
2,9
97
10
,11
32
,49
61
,04
0
Ova
ry2
3,4
10
4,0
37
8,2
24
5,4
91
5,6
58
Ho
dgk
in L
ymp
ho
ma
18
,79
6❺
9,5
24
6,3
66
1,8
34
1,0
72
Bra
in a
nd
CN
S1
4,2
08
7,5
79
4,5
26
1,4
20
68
3
Sto
mac
h1
1,6
63
91
12
,90
43
,08
24
,76
6
Live
r an
d IB
D8
,47
06
65
3,7
78
2,4
11
1,6
16
Lary
nx
8,4
52
24
21
,90
72
,59
53
,70
8
Pan
crea
s5
,83
85
55
1,7
76
1,6
69
1,8
38
Pre
vale
nce
Co
un
ts (
% o
f to
tal)
1,4
19
,92
3 (
10
0%
)
Po
pu
lati
on
(%
of
tota
l)2
7,8
86
,40
9 (
10
0%
)
Pre
vale
nce
= (
cou
nt/
po
p)*
10
05
.09
%
2,0
78
,71
9 (
7%
)
23
.74
%
16
,21
1,8
39
(5
8%
)
0.9
5%
6,9
78
,59
6 (
25
%)
5.6
3%
2,6
17
,25
5 (
9%
)
15
.00
%
20
-49
ye
ars
50
-64
ye
ars
65
-74
ye
ars
75
+ ye
ars
15
3,7
13
(1
1%
)3
92
,56
5 (
28
%)
38
0,1
55
(2
7%
)4
93
,49
0 (
35
%)
Cancer Prevalence in California Counties | Page 12

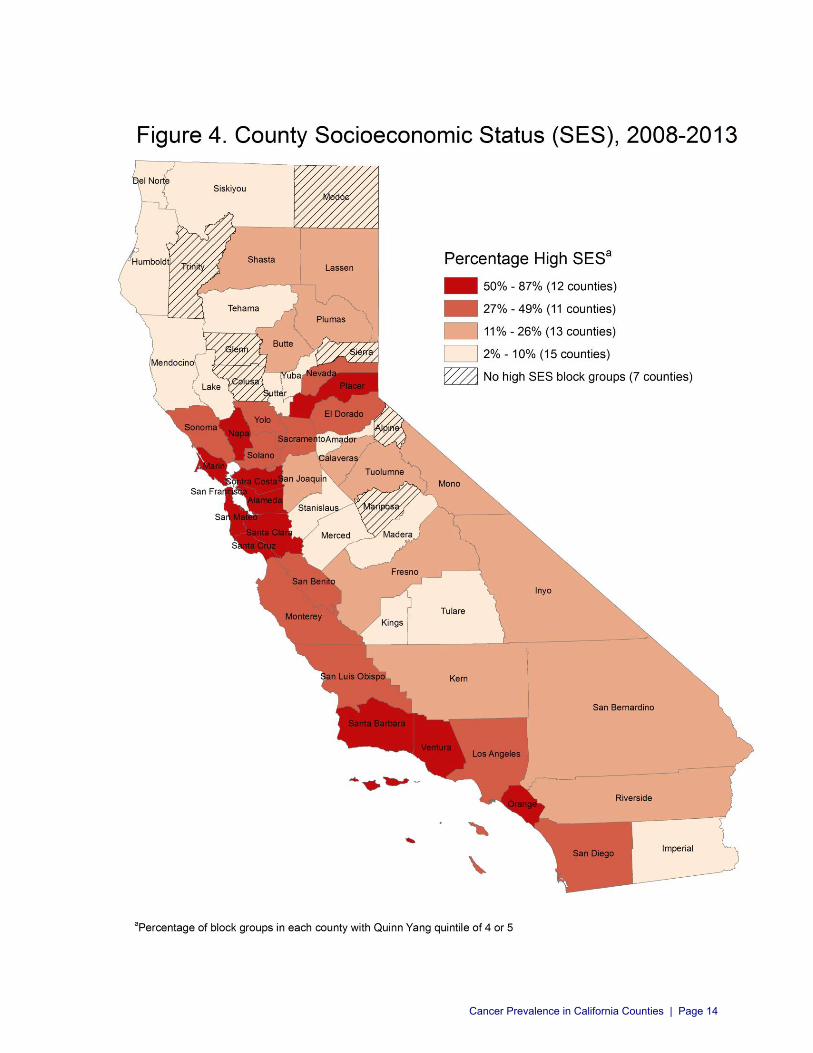
County Socioeconomic Status
Socioeconomic status (SES) is a measure of a person’s economic and social position based on
income, education, and occupation. Quinn Yang is an SES index based on census data that
provides neighborhood SES quintiles at the block group level.9 Designations are based on block
group measures of education, poverty, employment, home value, household income,
proportion of people with a blue collar job, and median rent. The lowest SES block groups are
given a designation of 1 while the highest SES block groups are given a designation of 5.
Because SES has been shown to be associated with many health outcomes and, given the
differences in SES among California counties, it may be useful to take SES into account when
interpreting variations in prevalence between counties. Figure 4 uses Quinn Yang quintiles to
show the percentage of block groups in each county that have the highest SES values (4 or 5).
This can be used in conjunction with the county prevalence information of selected cancers to
better understand the geographic variations.
Cancer Prevalence in California Counties | Page 13
Cancer Prevalence in California Counties | Page 14
Cancer Prevalence in California Counties | Page 15
Complete Prevalence by Region and County for Selected Cancers
Figures 6 through 27 show the complete prevalence by region and county for the twenty-one
common cancer sites detailed in this report. In each figure, the first column lists the regions and
counties within each region in descending order of population size. The second column shows
the prevalence count in each region and county. The third column shows the average
population for years 2012 and 2013 for each region and county. The fourth column is the
prevalence for each region and county calculated by dividing the count by the population and
multiplying that by 100. The color scale shows five group sizes for population and three or four
group sizes for prevalence. Because the prevalence takes into account the population sizes,
comparisons between regions and counties can be made.
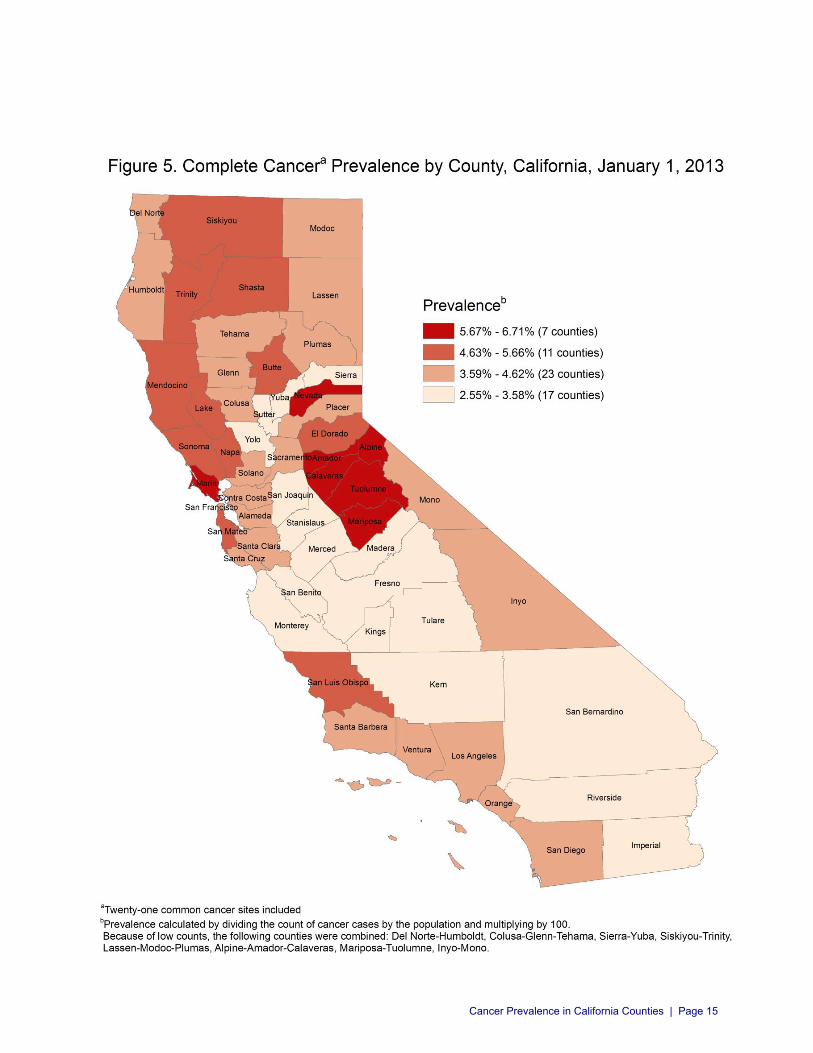
All Sites Combined
Figures 5 and 6 show the complete prevalence by region and county for twenty-one common
cancer sites (female breast, prostate, colon and rectum, melanoma of the skin, thyroid, corpus
and uterus, urinary bladder, non-Hodgkin lymphoma, lung and bronchus, kidney and renal
pelvis, leukemia, cervix uteri, oral cavity and pharynx, testis, ovary, Hodgkin lymphoma, brain
and CNS, stomach, liver and intrahepatic bile duct (IBD), larynx, and pancreas). Overall,
1,431,476 people with a history of cancer of one of these twenty-one sites were alive in
California on January 1, 2013. The counties with the highest prevalence were Marin, Nevada,
Alpine-Amador-Calaveras, and Mariposa-Tuolumne. The counties with the lowest prevalence
were Riverside, San Bernardino, all Central Valley counties, Imperial, Yolo, Sutter, Sierra-Yuba,
Monterey, and San Benito.
Cancer Prevalence in California Counties | Page 16

County Prevalence Count (a)Los Angeles-Orange 537,455 14,354,350 3.74%
Los Angeles 359,972 9,984,389 3.61%Orange 124,120 3,099,869 4.00%Ventura 34,898 837,019 4.17%Santa Barbara 18,465 433,073 4.26%
Bay Area 317,484 7,389,323 4.30%Santa Clara 72,887 1,849,043 3.94%Alameda 58,880 1,566,434 3.76%Contra Costa 48,046 1,086,241 4.42%San Francisco 37,609 832,438 4.52%San Mateo 35,866 743,037 4.83%Sonoma 23,246 492,821 4.72%Solano 17,331 422,570 4.10%Marin 16,809 257,110 6.54%Napa 6,810 139,629 4.88%
Inland Empire 131,618 4,361,625 3.02%Riverside 70,690 2,278,703 3.10%San Bernardino 60,928 2,082,922 2.93%
Central Valley 119,283 4,056,058 2.94%Fresno 28,673 951,436 3.01%Kern 23,448 859,821 2.73%San Joaquin 21,844 702,777 3.11%Stanislaus 17,113 523,479 3.27%Tulare 12,063 452,603 2.67%Merced 7,148 262,440 2.72%Madera 5,143 152,323 3.38%Kings 3,851 151,179 2.55%
San Diego-Imperial 127,631 3,370,391 3.79%San Diego 123,058 3,193,705 3.85%Imperial 4,573 176,686 2.59%
Sacramento Region 94,045 2,303,129 4.08%Sacramento 55,622 1,455,103 3.82%Placer 16,228 364,373 4.45%Yolo 6,914 204,224 3.39%El Dorado 9,321 181,185 5.14%Nevada 5,960 98,244 6.07%
Northern California 50,603 1,116,541 4.53%Butte 10,363 221,561 4.68%Shasta 9,259 178,682 5.18%Del Norte-Humboldt 7,189 162,609 4.42%Colusa-Glenn-Tehama 4,729 112,474 4.20%Sutter 3,239 95,012 3.41%Mendocino 4,298 87,292 4.92%Sierra-Yuba 2,585 76,226 3.39%Lake 3,190 63,923 4.99%Siskiyou-Trinity 3,109 57,498 5.41%Lassen-Modoc-Plumas 2,642 61,264 4.31%
Central Coast 42,159 1,028,218 4.10%Monterey 15,037 427,457 3.52%Santa Cruz 11,963 267,975 4.46%San Luis Obispo 13,248 275,541 4.81%San Benito 1,911 57,245 3.34%
High Sierra 11,198 187,005 5.99%Alpine-Amador-Calaveras 4,948 82,539 5.99%Mariposa-Tuolumne 4,818 71,792 6.71%Inyo-Mono 1,432 32,674 4.38%
California 1,431,476 38,166,640 3.75%
Total Population (b) Prevalence (a/b)*100
Prevalence2.55%-3.58% 3.59%-4.62% 4.63%5.66% 5.67%-6.71%Population Size
500,000-999,999 1,000,000-3,999,999 4,000,000-9,999,999 10,000,000-14,354,35032,674-99,999 100,000-499,999
Figure 6. Estimated Complete Prevalence by Region and County, California, January 1, 2013
All Sites Combined
Cancer Prevalence in California Counties | Page 17

18
Breast (Female)
The complete prevalence by region and county for female breast cancer is shown in Figure 7.
Overall, 333,716 women with a history of breast cancer were alive in California on January 1,
2013. The counties with the highest prevalence were Marin, Nevada, Mariposa-Tuolumne-Inyo-
Mono, and Alpine-Amador-Calaveras. For the most part, these counties also had high age-
adjusted incidence rates. Mariposa-Tuolumne, Marin, Nevada, and Alpine-Amador-Calaveras
were among the eleven highest incident rate counties in California for 2003 to 2012, ranking 1st
(Mariposa-Tuolumne), 3rd (Marin), 9th (Nevada), and 11th (Alpine-Amador-Calaveras).10 Inyo-
Mono had a lower incidence and ranked 27th in the state (see Appendix Table A1).
The low prevalence counties all had low age-adjusted incidence rates except for Yolo county
which had the seventh highest incidence rate for 2003 to 2012.10 This discrepancy could
represent a new trend of higher incidence in this county or poor survivorship. For female breast
cancer the median age at diagnosis is 62 years, and the five-year relative survival for all stages is
91.2%.5,11
Cancer Prevalence in California Counties | Page 18

County Prevalence Count (a)Los Angeles-Orange 126,093 7,262,935 1.74%
Los Angeles 83,879 5,059,459 1.66%Orange 29,634 1,566,314 1.89%Ventura 8,242 421,708 1.95%Santa Barbara 4,338 215,454 2.01%
Bay Area 76,280 3,723,446 2.05%Santa Clara 17,310 919,466 1.88%Alameda 14,396 798,294 1.80%Contra Costa 11,847 555,876 2.13%San Mateo 8,988 377,215 2.38%San Francisco 8,226 408,743 2.01%Sonoma 5,771 250,747 2.30%Marin 4,158 131,361 3.17%Solano 3,950 211,711 1.87%Napa 1,634 70,033 2.33%
Inland Empire 29,247 2,189,153 1.34%Riverside 15,868 1,143,345 1.39%San Bernardino 13,379 1,045,808 1.28%
Central Valley 26,602 2,012,218 1.32%Fresno 6,506 476,153 1.37%Kern 4,995 418,579 1.19%San Joaquin 5,045 352,871 1.43%Stanislaus 3,928 264,282 1.49%Tulare 2,686 225,470 1.19%Merced 1,545 129,855 1.19%Madera 1,107 78,196 1.42%Kings 790 66,812 1.18%
San Diego-Imperial 29,856 1,674,307 1.78%San Diego 28,888 1,588,313 1.82%Imperial 968 85,994 1.13%
Sacramento Region 22,368 1,174,326 1.90%Sacramento 13,346 742,739 1.80%Placer 3,804 186,465 2.04%El Dorado 2,120 90,564 2.34%Yolo 1,665 104,800 1.59%Nevada 1,433 49,758 2.88%
Northern California 11,334 553,966 2.05%Butte 2,466 111,648 2.21%Shasta 2,036 91,017 2.24%Del Norte-Humboldt 1,580 79,692 1.98%Colusa_Glenn-Tehama 1,016 55,872 1.82%Mendocino 950 43,751 2.17%Sutter 789 47,681 1.65%Lake 680 31,943 2.13%Siskiyou-Trinity 674 28,677 2.35%Sierra-Yuba 583 37,665 1.55%Lassen-Modoc-Plumas 560 26,020 2.15%
Central Coast 9,315 505,770 1.84%Monterey 3,305 207,766 1.59%San Luis Obispo 2,931 134,810 2.17%Santa Cruz 2,685 134,629 1.99%San Benito 394 28,565 1.38%
High Sierra 2,621 90,216 2.91%Mariposa-Tuolumne-Inyo-Mono 1,473 50,279 2.93%Alpine-Amador-Calaveras 1,148 39,937 2.87%
California 333,716 19,186,337 1.74%
Total Population (b) Prevalence (a/b)*100
Breast (Female)
Figure 7. Estimated Complete Prevalence by Region and County, California, January 1, 2013
Prevalence1.13%-1.63% 1.64%-2.14% 2.15%-2.65% 2.66%-3.17%Population Size
250,000-499,999 500,000-1,999,999 2,000,000-4,999,999 5,000,000-7,262,93515,774-49,999 50,000-249,999
Cancer Prevalence in California Counties | Page 19

Prostate
The complete prevalence by region and county for prostate cancer is shown in Figure 8. Overall,
279,151 men with a history of prostate cancer were alive in California on January 1, 2013. The
counties with the highest prevalence were Marin, Nevada, and Alpine-Amador-Calaveras. Marin
county had the highest age-adjusted incidence in the state for 2003 to 2012 (173.29 per
100,000) which can explain the high prevalence.10 Alpine-Amador-Calaveras and Nevada had
lower incidence rates for 2003 to 2012, ranking 21st and 27th in the state, respectively10 (see
Appendix Table A2). The high incidence in Marin could be a result of more screening with
prostate-specific antigen (PSA) or other factors. Screening with PSA results in more diagnoses
but the routine use of this test on men at average risk of the disease is not recommended
because of concerns about over-diagnosis and treatment of slow-growing cancers that are
unlikely to cause harm.5 The high prevalence and low incidence in Alpine-Amador-Calaveras
and Nevada could indicate good survivorship and possibly a more recent decreased use of
screening.
Most of the low prevalence counties also had low incidence rates from 2003 to 2012, except
San Joaquin and San Bernardino which had the 14th and 17th highest incidence rates in the
state10 (see Appendix Table A2). This discrepancy could represent newer trends of higher
incidence in these counties or poor survivorship. For prostate cancer the median age at
diagnosis is 66 years, and the five-year relative survival for all stages is close to 100%.5,12
Cancer Prevalence in California Counties | Page 20

County Prevalence Count (a)Los Angeles-Orange 103,135 7,091,415 1.45%
Los Angeles 70,173 4,924,930 1.42%Orange 22,739 1,533,555 1.48%Ventura 6,721 415,311 1.62%Santa Barbara 3,502 217,619 1.61%
Bay Area 62,858 3,665,877 1.71%Santa Clara 14,571 929,577 1.57%Alameda 11,598 768,140 1.51%Contra Costa 10,094 530,365 1.90%San Mateo 6,886 365,822 1.88%San Francisco 6,729 423,695 1.59%Sonoma 4,162 242,074 1.72%Marin 3,965 125,749 3.15%Solano 3,454 210,859 1.64%Napa 1,399 69,596 2.01%
Inland Empire 26,522 2,172,472 1.22%Riverside 14,761 1,135,358 1.30%San Bernardino 11,761 1,037,114 1.13%
Central Valley 22,688 2,043,840 1.11%Fresno 5,495 475,283 1.16%San Joaquin 4,506 349,906 1.29%Kern 4,310 441,242 0.98%Stanislaus 2,924 259,197 1.13%Tulare 2,284 227,133 1.01%Merced 1,342 132,585 1.01%Madera 1,110 74,127 1.50%Kings 717 84,367 0.85%
San Diego-Imperial 23,707 1,696,084 1.40%San Diego 22,785 1,605,392 1.42%Imperial 922 90,692 1.02%
Sacramento Region 18,375 1,128,803 1.63%Sacramento 10,570 712,364 1.48%Placer 3,292 177,908 1.85%El Dorado 2,015 90,621 2.22%Nevada 1,310 48,486 2.70%Yolo 1,188 99,424 1.19%
Northern California 10,167 562,575 1.81%Butte 2,133 109,913 1.94%Shasta 2,047 87,665 2.34%Del Norte-Humboldt 1,320 82,917 1.59%Colusa_Glenn-Tehama 949 56,602 1.68%Mendocino 853 43,541 1.96%Siskiyou-Trinity 677 28,821 2.35%Lake 626 31,980 1.96%Lassen-Modoc-Plumas 597 35,244 1.69%Sutter 526 47,331 1.11%Sierra-Yuba 439 38,561 1.14%
Central Coast 9,168 522,448 1.75%Monterey 3,184 219,691 1.45%San Luis Obispo 2,853 140,731 2.03%Santa Cruz 2,713 133,346 2.03%San Benito 418 28,680 1.46%
High Sierra 2,531 96,789 2.61%Mariposa-Tuolumne-Inyo-Mono 1,377 54,187 2.54%Alpine-Amador-Calaveras 1,154 42,602 2.71%
California 279,151 18,980,303 1.47%
Total Population (b) Prevalence (a/b)*100
Prevalence0.85%-1.42% 1.43%-1.99% 2.00%-2.57% 2.58%-3.15%Population Size
250,000-499,999 500,000-1,999,999 2,000,000-4,999,999 5,000,000-7,091,41516,900-49,999 50,000-249,999
Prostate
Figure 8. Estimated Complete Prevalence by Region and County, California, January 1, 2013
Cancer Prevalence in California Counties | Page 21
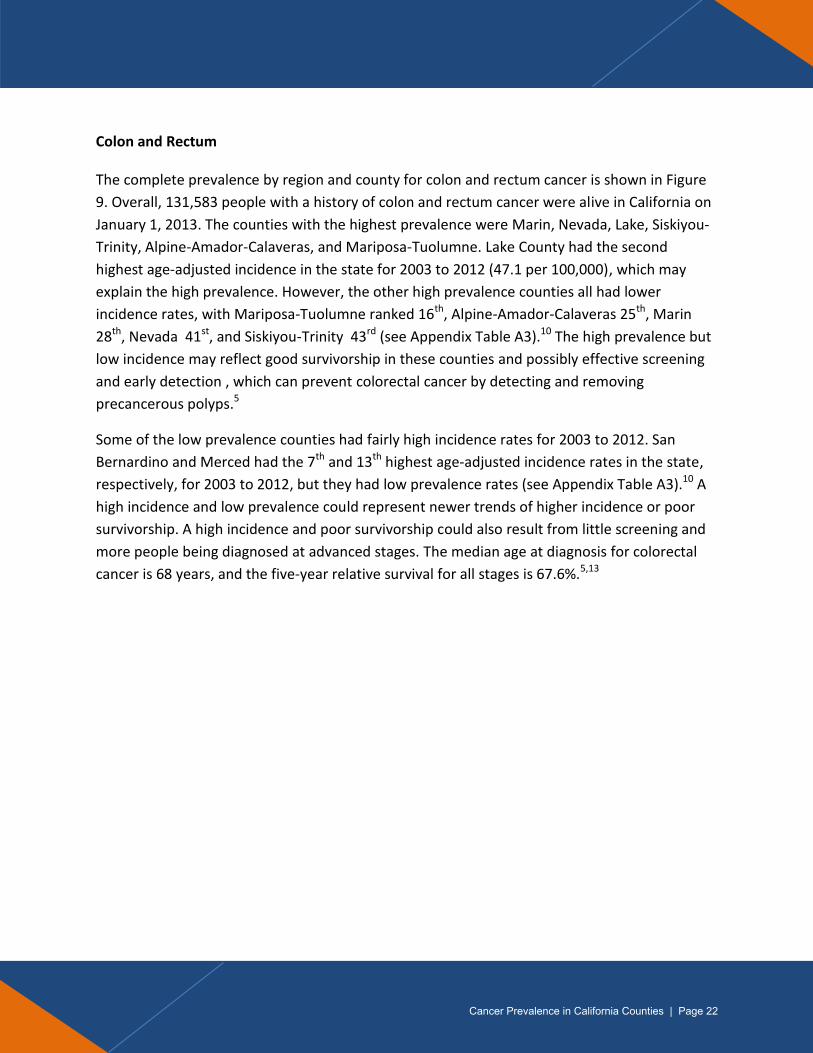
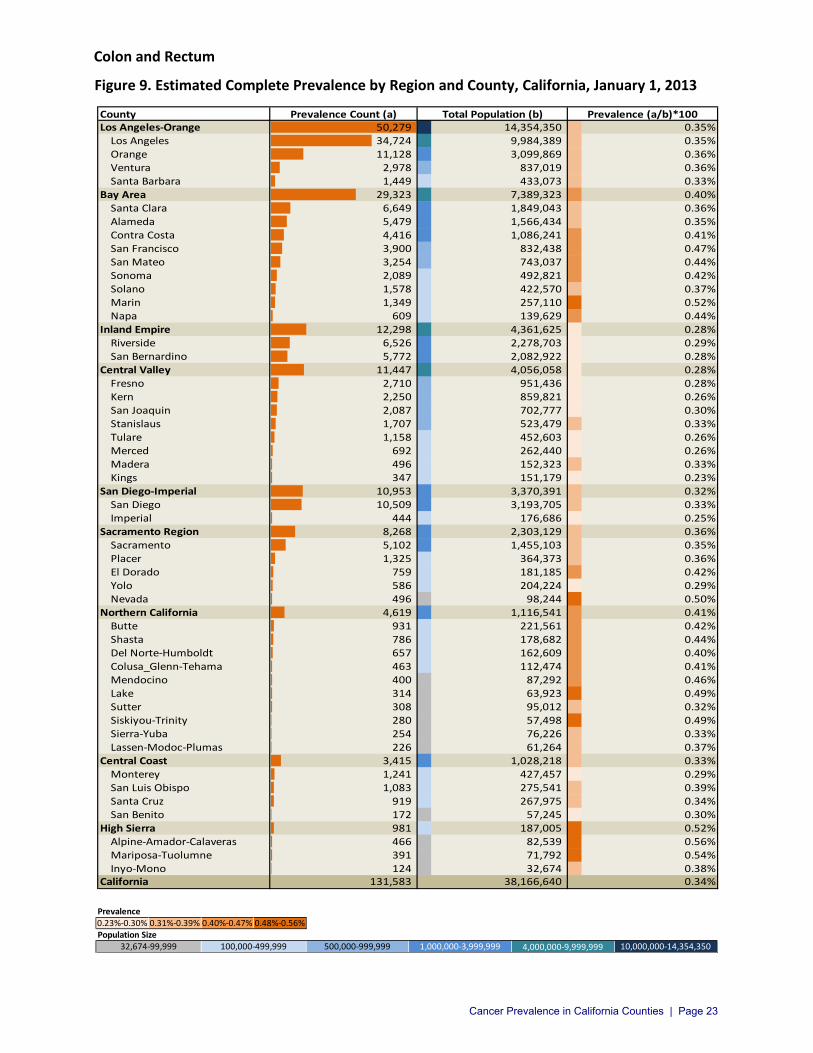
Colon and Rectum
The complete prevalence by region and county for colon and rectum cancer is shown in Figure
9. Overall, 131,583 people with a history of colon and rectum cancer were alive in California on
January 1, 2013. The counties with the highest prevalence were Marin, Nevada, Lake, Siskiyou-
Trinity, Alpine-Amador-Calaveras, and Mariposa-Tuolumne. Lake County had the second
highest age-adjusted incidence in the state for 2003 to 2012 (47.1 per 100,000), which may
explain the high prevalence. However, the other high prevalence counties all had lower
incidence rates, with Mariposa-Tuolumne ranked 16th, Alpine-Amador-Calaveras 25th, Marin
28th, Nevada 41st, and Siskiyou-Trinity 43rd (see Appendix Table A3).10 The high prevalence but
low incidence may reflect good survivorship in these counties and possibly effective screening
and early detection , which can prevent colorectal cancer by detecting and removing
precancerous polyps.5
Some of the low prevalence counties had fairly high incidence rates for 2003 to 2012. San
Bernardino and Merced had the 7th and 13th highest age-adjusted incidence rates in the state,
respectively, for 2003 to 2012, but they had low prevalence rates (see Appendix Table A3).10 A
high incidence and low prevalence could represent newer trends of higher incidence or poor
survivorship. A high incidence and poor survivorship could also result from little screening and
more people being diagnosed at advanced stages. The median age at diagnosis for colorectal
cancer is 68 years, and the five-year relative survival for all stages is 67.6%.5,13
Cancer Prevalence in California Counties | Page 22
County Prevalence Count (a)Los Angeles-Orange 50,279 14,354,350 0.35%
Los Angeles 34,724 9,984,389 0.35%Orange 11,128 3,099,869 0.36%Ventura 2,978 837,019 0.36%Santa Barbara 1,449 433,073 0.33%
Bay Area 29,323 7,389,323 0.40%Santa Clara 6,649 1,849,043 0.36%Alameda 5,479 1,566,434 0.35%Contra Costa 4,416 1,086,241 0.41%San Francisco 3,900 832,438 0.47%San Mateo 3,254 743,037 0.44%Sonoma 2,089 492,821 0.42%Solano 1,578 422,570 0.37%Marin 1,349 257,110 0.52%Napa 609 139,629 0.44%
Inland Empire 12,298 4,361,625 0.28%Riverside 6,526 2,278,703 0.29%San Bernardino 5,772 2,082,922 0.28%
Central Valley 11,447 4,056,058 0.28%Fresno 2,710 951,436 0.28%Kern 2,250 859,821 0.26%San Joaquin 2,087 702,777 0.30%Stanislaus 1,707 523,479 0.33%Tulare 1,158 452,603 0.26%Merced 692 262,440 0.26%Madera 496 152,323 0.33%Kings 347 151,179 0.23%
San Diego-Imperial 10,953 3,370,391 0.32%San Diego 10,509 3,193,705 0.33%Imperial 444 176,686 0.25%
Sacramento Region 8,268 2,303,129 0.36%Sacramento 5,102 1,455,103 0.35%Placer 1,325 364,373 0.36%El Dorado 759 181,185 0.42%Yolo 586 204,224 0.29%Nevada 496 98,244 0.50%
Northern California 4,619 1,116,541 0.41%Butte 931 221,561 0.42%Shasta 786 178,682 0.44%Del Norte-Humboldt 657 162,609 0.40%Colusa_Glenn-Tehama 463 112,474 0.41%Mendocino 400 87,292 0.46%Lake 314 63,923 0.49%Sutter 308 95,012 0.32%Siskiyou-Trinity 280 57,498 0.49%Sierra-Yuba 254 76,226 0.33%Lassen-Modoc-Plumas 226 61,264 0.37%
Central Coast 3,415 1,028,218 0.33%Monterey 1,241 427,457 0.29%San Luis Obispo 1,083 275,541 0.39%Santa Cruz 919 267,975 0.34%San Benito 172 57,245 0.30%
High Sierra 981 187,005 0.52%Alpine-Amador-Calaveras 466 82,539 0.56%Mariposa-Tuolumne 391 71,792 0.54%Inyo-Mono 124 32,674 0.38%
California 131,583 38,166,640 0.34%
Total Population (b) Prevalence (a/b)*100
Prevalence0.23%-0.30% 0.31%-0.39% 0.40%-0.47% 0.48%-0.56%Population Size
500,000-999,999 1,000,000-3,999,999 4,000,000-9,999,999 10,000,000-14,354,35032,674-99,999 100,000-499,999
Colon and Rectum
Figure 9. Estimated Complete Prevalence by Region and County, California, January 1, 2013
Cancer Prevalence in California Counties | Page 23
24
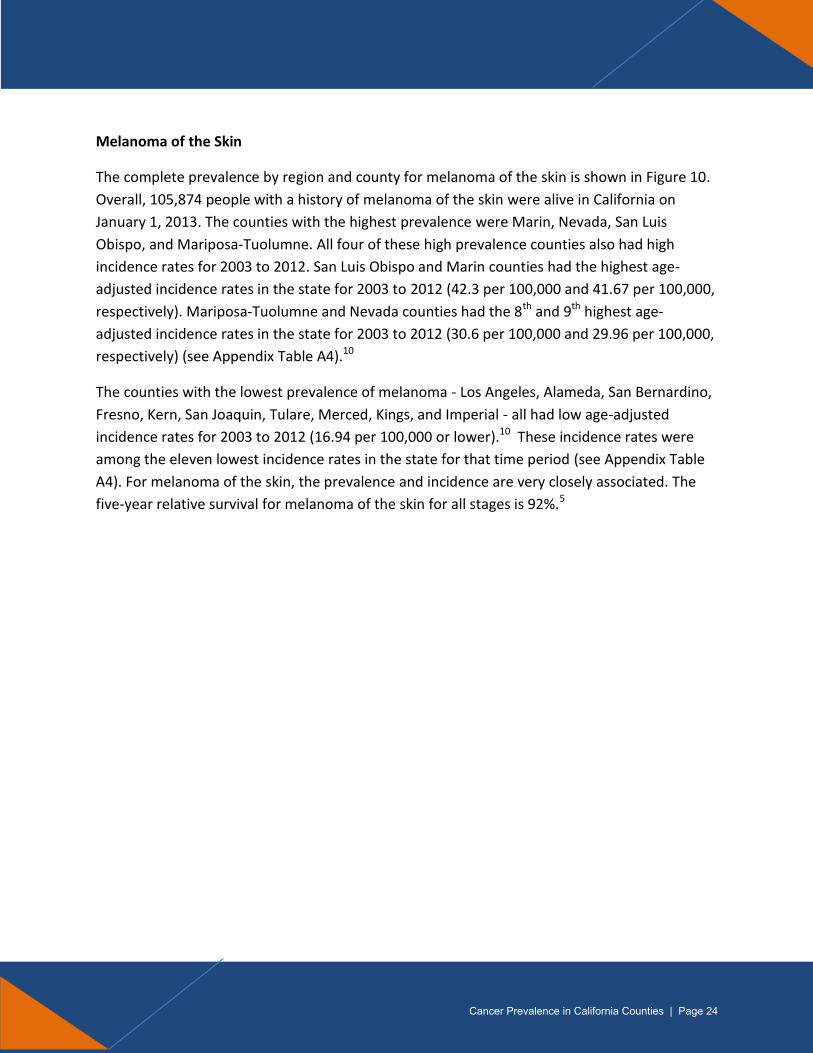
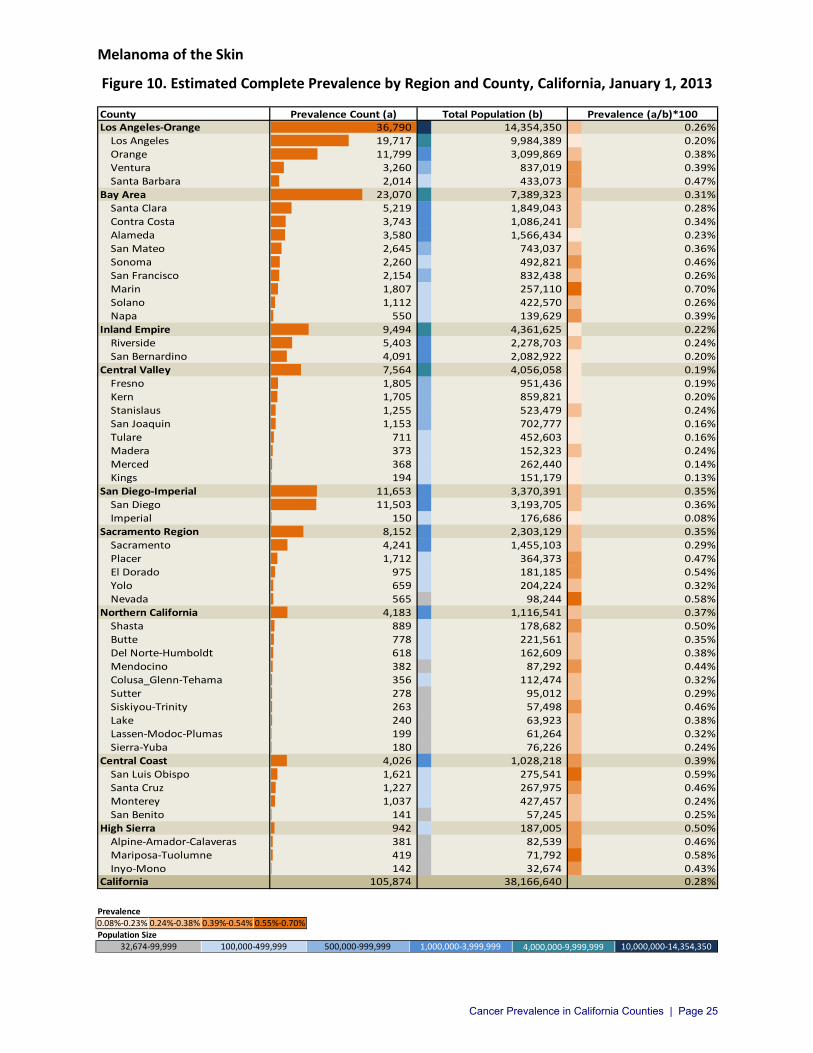
Melanoma of the Skin
The complete prevalence by region and county for melanoma of the skin is shown in Figure 10.
Overall, 105,874 people with a history of melanoma of the skin were alive in California on
January 1, 2013. The counties with the highest prevalence were Marin, Nevada, San Luis
Obispo, and Mariposa-Tuolumne. All four of these high prevalence counties also had high
incidence rates for 2003 to 2012. San Luis Obispo and Marin counties had the highest age-
adjusted incidence rates in the state for 2003 to 2012 (42.3 per 100,000 and 41.67 per 100,000,
respectively). Mariposa-Tuolumne and Nevada counties had the 8th and 9th highest age-
adjusted incidence rates in the state for 2003 to 2012 (30.6 per 100,000 and 29.96 per 100,000,
respectively) (see Appendix Table A4).10
The counties with the lowest prevalence of melanoma - Los Angeles, Alameda, San Bernardino,
Fresno, Kern, San Joaquin, Tulare, Merced, Kings, and Imperial - all had low age-adjusted
incidence rates for 2003 to 2012 (16.94 per 100,000 or lower).10 These incidence rates were
among the eleven lowest incidence rates in the state for that time period (see Appendix Table
A4). For melanoma of the skin, the prevalence and incidence are very closely associated. The
five-year relative survival for melanoma of the skin for all stages is 92%.5
Cancer Prevalence in California Counties | Page 24
County Prevalence Count (a)Los Angeles-Orange 36,790 14,354,350 0.26%
Los Angeles 19,717 9,984,389 0.20%Orange 11,799 3,099,869 0.38%Ventura 3,260 837,019 0.39%Santa Barbara 2,014 433,073 0.47%
Bay Area 23,070 7,389,323 0.31%Santa Clara 5,219 1,849,043 0.28%Contra Costa 3,743 1,086,241 0.34%Alameda 3,580 1,566,434 0.23%San Mateo 2,645 743,037 0.36%Sonoma 2,260 492,821 0.46%San Francisco 2,154 832,438 0.26%Marin 1,807 257,110 0.70%Solano 1,112 422,570 0.26%Napa 550 139,629 0.39%
Inland Empire 9,494 4,361,625 0.22%Riverside 5,403 2,278,703 0.24%San Bernardino 4,091 2,082,922 0.20%
Central Valley 7,564 4,056,058 0.19%Fresno 1,805 951,436 0.19%Kern 1,705 859,821 0.20%Stanislaus 1,255 523,479 0.24%San Joaquin 1,153 702,777 0.16%Tulare 711 452,603 0.16%Madera 373 152,323 0.24%Merced 368 262,440 0.14%Kings 194 151,179 0.13%
San Diego-Imperial 11,653 3,370,391 0.35%San Diego 11,503 3,193,705 0.36%Imperial 150 176,686 0.08%
Sacramento Region 8,152 2,303,129 0.35%Sacramento 4,241 1,455,103 0.29%Placer 1,712 364,373 0.47%El Dorado 975 181,185 0.54%Yolo 659 204,224 0.32%Nevada 565 98,244 0.58%
Northern California 4,183 1,116,541 0.37%Shasta 889 178,682 0.50%Butte 778 221,561 0.35%Del Norte-Humboldt 618 162,609 0.38%Mendocino 382 87,292 0.44%Colusa_Glenn-Tehama 356 112,474 0.32%Sutter 278 95,012 0.29%Siskiyou-Trinity 263 57,498 0.46%Lake 240 63,923 0.38%Lassen-Modoc-Plumas 199 61,264 0.32%Sierra-Yuba 180 76,226 0.24%
Central Coast 4,026 1,028,218 0.39%San Luis Obispo 1,621 275,541 0.59%Santa Cruz 1,227 267,975 0.46%Monterey 1,037 427,457 0.24%San Benito 141 57,245 0.25%
High Sierra 942 187,005 0.50%Alpine-Amador-Calaveras 381 82,539 0.46%Mariposa-Tuolumne 419 71,792 0.58%Inyo-Mono 142 32,674 0.43%
California 105,874 38,166,640 0.28%
Total Population (b) Prevalence (a/b)*100
Prevalence0.08%-0.23% 0.24%-0.38% 0.39%-0.54% 0.55%-0.70%Population Size
500,000-999,999 1,000,000-3,999,999 4,000,000-9,999,999 10,000,000-14,354,35032,674-99,999 100,000-499,999
Melanoma of the Skin
Figure 10. Estimated Complete Prevalence by Region and County, California, January 1, 2013
Cancer Prevalence in California Counties | Page 25

26
Thyroid
The complete prevalence by region and county for thyroid cancer is shown in Figure 11. Overall,
68,927 people with a history of thyroid cancer were alive in California on January 1, 2013. The
counties with the highest prevalence were Orange, Ventura, Santa Barbara, San Francisco, San
Mateo, Marin, Placer, El Dorado, Shasta, and Monterey. All of these counties except for San
Mateo, San Francisco, and Marin had age-adjusted incidence rates for 2003 to 2012 that were
among the eleven highest for the state. San Mateo had the 15th highest age-adjusted incidence
rate, San Francisco the 23rd highest, and Marin the 37th highest for 2003 to 2012 (see Appendix
Table A5).10 Thyroid cancer has the most rapidly rising rate in the United States, but some of
this rise has been attributed to more sensitive diagnostic procedures that have resulted in some
over-diagnoses of papillary thyroid tumors.14-16 Some of the rise, however, is attributed to
increases in obesity.17 The high prevalence and lower incidence counties may reflect good
survivorship and more recent decreases in risk factors.
The lowest prevalence counties - Tulare, Kings, Imperial, Mendocino, Sierra-Yuba, and Lake - all
also had low age-adjusted incidence rates ranking 25th (Kings), 38th (Tulare), 42nd (Imperial), 44th
(Sierra-Yuba), 45th (Lake), and 47th (Mendocino) in the state for 2003 to 2012 (see Appendix
Table A5).10 Thyroid cancer is more common in younger people with a median age at diagnosis
of 54 years for males and 49 years for females.4 The five-year relative survival for thyroid cancer
for all stages is 97.7%.6
Cancer Prevalence in California Counties | Page 26

County Prevalence Count (a)Los Angeles-Orange 28,721 14,354,350 0.20%
Los Angeles 19,337 9,984,389 0.19%Orange 6,574 3,099,869 0.21%Ventura 1,945 837,019 0.23%Santa Barbara 865 433,073 0.20%
Bay Area 13,428 7,389,323 0.18%Santa Clara 3,539 1,849,043 0.19%Alameda 2,434 1,566,434 0.16%Contra Costa 1,830 1,086,241 0.17%San Francisco 1,750 832,438 0.21%San Mateo 1,489 743,037 0.20%Sonoma 849 492,821 0.17%Solano 749 422,570 0.18%Marin 557 257,110 0.22%Napa 231 139,629 0.17%
Inland Empire 6,092 4,361,625 0.14%Riverside 3,175 2,278,703 0.14%San Bernardino 2,917 2,082,922 0.14%
Central Valley 6,220 4,056,058 0.15%Fresno 1,673 951,436 0.18%Kern 1,330 859,821 0.15%San Joaquin 1,000 702,777 0.14%Stanislaus 802 523,479 0.15%Tulare 539 452,603 0.12%Merced 389 262,440 0.15%Madera 286 152,323 0.19%Kings 201 151,179 0.13%
San Diego-Imperial 6,097 3,370,391 0.18%San Diego 5,882 3,193,705 0.18%Imperial 215 176,686 0.12%
Sacramento Region 4,299 2,303,129 0.19%Sacramento 2,661 1,455,103 0.18%Placer 768 364,373 0.21%El Dorado 377 181,185 0.21%Yolo 328 204,224 0.16%Nevada 165 98,244 0.17%
Northern California 1,819 1,116,541 0.16%Shasta 377 178,682 0.21%Butte 362 221,561 0.16%Del Norte-Humboldt 289 162,609 0.18%Colusa_Glenn-Tehama 187 112,474 0.17%Sutter 133 95,012 0.14%Lassen-Modoc-Plumas 119 61,264 0.19%Mendocino 105 87,292 0.12%Sierra-Yuba 87 76,226 0.11%Siskiyou-Trinity 87 57,498 0.15%Lake 73 63,923 0.11%
Central Coast 1,937 1,028,218 0.19%Monterey 834 427,457 0.20%Santa Cruz 519 267,975 0.19%San Luis Obispo 499 275,541 0.18%San Benito 85 57,245 0.15%
High Sierra 314 187,005 0.17%Alpine-Amador-Calaveras 135 82,539 0.16%Mariposa-Tuolumne 122 71,792 0.17%Inyo-Mono 57 32,674 0.17%
California 68,927 38,166,640 0.18%
Total Population (b) Prevalence (a/b)*100
Prevalence0.11%-0.13% 0.14%-0.16% 0.17%-0.19% 0.20%-0.23%Population Size
500,000-999,999 1,000,000-3,999,999 4,000,000-9,999,999 10,000,000-14,354,35032,674-99,999 100,000-499,999
Thyroid
Figure 11. Estimated Complete Prevalence by Region and County, California, January 1, 2013
Cancer Prevalence in California Counties | Page 27
28
Uterine Corpus
The complete prevalence by region and county for cancer of the uterine corpus (upper part of
the uterus) is shown in Figure 12. Overall, 67,882 women with a history of uterine cancer were
alive in California on January 1, 2013. The counties with the highest prevalence were Marin,
Napa, Nevada, Del Norte-Humboldt, Siskiyou-Trinity, Lassen-Modoc-Plumas, and Mariposa-
Tuolumne-Inyo-Mono. Del Norte-Humboldt had the highest age-adjusted incidence rate in the
state for 2003 to 2012, and Lassen-Modoc-Plumas had the third highest.10 Napa had the 11th
highest incidence rate, Marin had the 18th highest, and the rest (Nevada, Siskiyou-Trinity,
Mariposa-Tuolumne, Inyo-Mono) were ranked 27th to 42nd for this time period (see Appendix
Table A6).10 The high prevalence counties do not all have high age-adjusted incidence rates.
Obesity, diabetes, and hypertension are risk factors for uterine cancer.18 The high prevalence
and lower incidence counties may reflect more recent decreases in risk factors and good
survivorship.
The lowest prevalence counties also had low age-adjusted incidence rates for 2003 to 2012.
Among the lowest prevalence counties, San Bernardino had the highest age-adjusted incidence
rate, ranking 17th in the state, while the other low prevalence counties had age-adjusted
incidence rates that ranked 24th to 46th (see Appendix Table A6).10 The five-year relative survival
for uterine cancer for all stages is 83.4%.5
Cancer Prevalence in California Counties | Page 28

County Prevalence Count (a)Los Angeles-Orange 26,253 7,262,935 0.36%
Los Angeles 18,221 5,059,459 0.36%Orange 5,585 1,566,314 0.36%Ventura 1,558 421,708 0.37%Santa Barbara 889 215,454 0.41%
Bay Area 15,511 3,723,446 0.42%Santa Clara 3,257 919,466 0.35%Alameda 3,098 798,294 0.39%Contra Costa 2,396 555,876 0.43%San Francisco 1,866 408,743 0.46%San Mateo 1,794 377,215 0.48%Sonoma 1,186 250,747 0.47%Solano 845 211,711 0.40%Marin 713 131,361 0.54%Napa 356 70,033 0.51%
Inland Empire 5,997 2,189,153 0.27%Riverside 3,037 1,143,345 0.27%San Bernardino 2,960 1,045,808 0.28%
Central Valley 5,303 2,012,218 0.26%Fresno 1,116 476,153 0.23%Kern 1,081 418,579 0.26%San Joaquin 989 352,871 0.28%Stanislaus 761 264,282 0.29%Tulare 643 225,470 0.29%Merced 336 129,855 0.26%Kings 191 66,812 0.29%Madera 186 78,196 0.24%
San Diego-Imperial 5,856 1,674,307 0.35%San Diego 5,658 1,588,313 0.36%Imperial 198 85,994 0.23%
Sacramento Region 4,259 1,174,326 0.36%Sacramento 2,629 742,739 0.35%Placer 656 186,465 0.35%El Dorado 361 90,564 0.40%Yolo 321 104,800 0.31%Nevada 292 49,758 0.59%
Northern California 2,524 553,966 0.46%Butte 517 111,648 0.46%Del Norte-Humboldt 421 79,692 0.53%Shasta 416 91,017 0.46%Colusa_Glenn-Tehama 235 55,872 0.42%Mendocino 204 43,751 0.47%Siskiyou-Trinity 167 28,677 0.58%Lake 153 31,943 0.48%Sutter 145 47,681 0.30%Lassen-Modoc-Plumas 140 26,020 0.54%Sierra-Yuba 126 37,665 0.33%
Central Coast 1,730 505,770 0.34%Monterey 680 207,766 0.33%San Luis Obispo 536 134,810 0.40%Santa Cruz 458 134,629 0.34%San Benito 56 28,565 0.20%
High Sierra 449 90,216 0.50%Mariposa-Tuolumne-Inyo-Mono 256 50,279 0.51%Alpine-Amador-Calaveras 193 39,937 0.48%
California 67,882 19,186,337 0.35%
Total Population (b) Prevalence (a/b)*100
Prevalence0.20%-0.29% 0.30%-0.39% 0.40%-0.48% 0.49%-0.59%Population Size
250,000-499,999 500,000-1,999,999 2,000,000-4,999,999 5,000,000-7,262,93515,774-49,999 50,000-249,999
Uterine Corpus
Figure 12. Estimated Complete Prevalence by Region and County, California, January 1, 2013
Cancer Prevalence in California Counties | Page 29
Urinary Bladder
The complete prevalence by region and county for cancer of the urinary bladder is shown in
Figure 13. Overall, 62,675 people with a history of bladder cancer were alive in California on
January 1, 2013. The counties with the highest prevalence were Marin, Nevada, Lake, Siskiyou-
Trinity, Alpine-Amador-Calaveras, and Mariposa-Tuolumne. These counties also had high age-
adjusted incidence rates for 2003 to 2012. Lake County had the highest age-adjusted incidence
rate in the state for this time period, while the other counties - Siskiyou-Trinity, Mariposa-
Tuolumne, Alpine-Amador-Calaveras, Marin, and Nevada - ranked 3rd through 14th in the state.
(see Appendix Table A7).10 The median age at diagnosis for bladder cancer is 73 years, and the
five-year relative survival for all stages is 77.5%.19 Smoking, family history, and certain
exposures (e.g., paints, dyes, metals, petroleum products, arsenic) are risk factors for bladder
cancer.19 Men have incidence rates approximately four times higher than women.4
The low prevalence counties mostly had low age-adjusted incidence rates for 2003 to 2012. Of
the low prevalence counties, San Benito, Yolo, and Riverside had the highest age-adjusted
incidence rates, ranking 15th, 20th, and 22nd, respectively. The other low prevalence counties
had age-adjusted incidence rates that ranked 27th to 47th in the state (see Appendix Table A7).10
The counties with low prevalence and fairly high age-adjusted incidence rates may have poor
survivorship or newer trends of higher incidence.
Cancer Prevalence in California Counties | Page 30

County Prevalence Count (a)Los Angeles-Orange 22,425 14,354,350 0.16%
Los Angeles 14,763 9,984,389 0.15%Orange 5,169 3,099,869 0.17%Ventura 1,556 837,019 0.19%Santa Barbara 937 433,073 0.22%
Bay Area 13,777 7,389,323 0.19%Santa Clara 3,038 1,849,043 0.16%Alameda 2,343 1,566,434 0.15%Contra Costa 2,146 1,086,241 0.20%San Mateo 1,589 743,037 0.21%San Francisco 1,500 832,438 0.18%Sonoma 1,247 492,821 0.25%Marin 845 257,110 0.33%Solano 725 422,570 0.17%Napa 344 139,629 0.25%
Inland Empire 5,945 4,361,625 0.14%Riverside 3,389 2,278,703 0.15%San Bernardino 2,556 2,082,922 0.12%
Central Valley 5,133 4,056,058 0.13%Fresno 1,165 951,436 0.12%Kern 974 859,821 0.11%San Joaquin 970 702,777 0.14%Stanislaus 807 523,479 0.15%Tulare 507 452,603 0.11%Merced 341 262,440 0.13%Madera 213 152,323 0.14%Kings 156 151,179 0.10%
San Diego-Imperial 5,498 3,370,391 0.16%San Diego 5,347 3,193,705 0.17%Imperial 151 176,686 0.09%
Sacramento Region 4,444 2,303,129 0.19%Sacramento 2,459 1,455,103 0.17%Placer 817 364,373 0.22%El Dorado 498 181,185 0.27%Nevada 360 98,244 0.37%Yolo 310 204,224 0.15%
Northern California 2,848 1,116,541 0.26%Butte 622 221,561 0.28%Shasta 510 178,682 0.29%Del Norte-Humboldt 375 162,609 0.23%Colusa_Glenn-Tehama 287 112,474 0.26%Mendocino 262 87,292 0.30%Lake 222 63,923 0.35%Siskiyou-Trinity 209 57,498 0.36%Sutter 138 95,012 0.15%Lassen-Modoc-Plumas 115 61,264 0.19%Sierra-Yuba 108 76,226 0.14%
Central Coast 1,975 1,028,218 0.19%Monterey 713 427,457 0.17%San Luis Obispo 634 275,541 0.23%Santa Cruz 544 267,975 0.20%San Benito 84 57,245 0.15%
High Sierra 630 187,005 0.34%Alpine-Amador-Calaveras 310 82,539 0.38%Mariposa-Tuolumne 261 71,792 0.36%Inyo-Mono 59 32,674 0.18%
California 62,675 38,166,640 0.16%
Total Population (b) Prevalence (a/b)*100
Prevalence0.09%-0.15% 0.16%-0.23% 0.24%-0.30% 0.31%-0.38%Population Size
500,000-999,999 1,000,000-3,999,999 4,000,000-9,999,999 10,000,000-14,354,35032,674-99,999 100,000-499,999
Urinary Bladder
Figure 13. Estimated Complete Prevalence by Region and County, California, January 1, 2013
Cancer Prevalence in California Counties | Page 31
Non-Hodgkin Lymphoma
The complete prevalence by region and county for non-Hodgkin lymphoma is shown in Figure
14. Overall, 61,522 people with a history of non-Hodgkin lymphoma were alive in California on
January 1, 2013. The counties with the highest prevalence were Marin and Mariposa-Tuolumne.
These counties had the second and third highest age-adjusted incidence rates in the state for
2003 to 2012,10 which can explain the high prevalence. The county with the highest age-
adjusted incidence rate in the state for 2003 to 2012 was San Benito (see Appendix Table A8).10
However, San Benito is in the second lowest prevalence group (0.17%). The high incidence and
low prevalence in San Benito may represent poor survivorship. Non-Hodgkin lymphoma is more
common in older white men and in people with a weakened immune system.20 The median age
at diagnosis is 66 years, and the five-year relative survival for all stages is 69.9%.5,20
Some of the low prevalence counties had fairly high age-adjusted incidence rates which could
represent poor survivorship or newer trends of higher incidence. Sierra-Yuba and Yolo had the
17th and 21st highest age-adjusted incidence rates, respectively, in the state for 2003 to 2012,
but were in the lowest prevalence group (see Appendix Table A8).10 The other low prevalence
counties had low age-adjusted incidence rates.
Cancer Prevalence in California Counties | Page 32

County Prevalence Count (a)Los Angeles-Orange 22,900 14,354,350 0.16%
Los Angeles 15,257 9,984,389 0.15%Orange 5,314 3,099,869 0.17%Ventura 1,543 837,019 0.18%Santa Barbara 786 433,073 0.18%
Bay Area 14,678 7,389,323 0.20%Santa Clara 3,438 1,849,043 0.19%Alameda 2,725 1,566,434 0.17%Contra Costa 2,153 1,086,241 0.20%San Francisco 1,837 832,438 0.22%San Mateo 1,699 743,037 0.23%Sonoma 1,026 492,821 0.21%Solano 754 422,570 0.18%Marin 751 257,110 0.29%Napa 295 139,629 0.21%
Inland Empire 5,186 4,361,625 0.12%Riverside 2,792 2,278,703 0.12%San Bernardino 2,394 2,082,922 0.11%
Central Valley 4,966 4,056,058 0.12%Fresno 1,240 951,436 0.13%Kern 910 859,821 0.11%San Joaquin 900 702,777 0.13%Stanislaus 743 523,479 0.14%Tulare 500 452,603 0.11%Merced 304 262,440 0.12%Madera 192 152,323 0.13%Kings 177 151,179 0.12%
San Diego-Imperial 5,429 3,370,391 0.16%San Diego 5,226 3,193,705 0.16%Imperial 203 176,686 0.11%
Sacramento Region 3,860 2,303,129 0.17%Sacramento 2,280 1,455,103 0.16%Placer 674 364,373 0.18%El Dorado 385 181,185 0.21%Yolo 313 204,224 0.15%Nevada 208 98,244 0.21%
Northern California 2,183 1,116,541 0.20%Butte 439 221,561 0.20%Shasta 386 178,682 0.22%Del Norte-Humboldt 356 162,609 0.22%Colusa_Glenn-Tehama 200 112,474 0.18%Mendocino 186 87,292 0.21%Sutter 149 95,012 0.16%Lake 120 63,923 0.19%Siskiyou-Trinity 118 57,498 0.21%Sierra-Yuba 116 76,226 0.15%Lassen-Modoc-Plumas 113 61,264 0.18%
Central Coast 1,870 1,028,218 0.18%Monterey 699 427,457 0.16%San Luis Obispo 555 275,541 0.20%Santa Cruz 517 267,975 0.19%San Benito 99 57,245 0.17%
High Sierra 450 187,005 0.24%Mariposa-Tuolumne 206 71,792 0.29%Alpine-Amador-Calaveras 195 82,539 0.24%Inyo-Mono 49 32,674 0.15%
California 61,522 38,166,640 0.16%
Total Population (b) Prevalence (a/b)*100
Prevalence0.11%-0.15% 0.16%-0.19% 0.20%-0.24% 0.25%-0.29%Population Size
500,000-999,999 1,000,000-3,999,999 4,000,000-9,999,999 10,000,000-14,354,35032,674-99,999 100,000-499,999
Non-Hodgkin Lymphoma
Figure 14. Estimated Complete Prevalence by Region and County, California, January 1, 2013
Cancer Prevalence in California Counties | Page 33

Lung and Bronchus
The complete prevalence by region and county for lung and bronchus cancer is shown in Figure
15. Overall, 46,543 people with a history of lung and bronchus cancer were alive in California on
January 1, 2013. The counties with the highest prevalence were Lake, Siskiyou-Trinity, and
Mariposa-Tuolumne. These counties also had high age-adjusted incidence rates of lung and
bronchus cancer for 2003 to 2012, ranging from the highest in the state (Lake) and the fifth
(Siskiyou-Trinity) and sixth highest (Mariposa-Tuolumne) (see Appendix Table A9).10
Many of the low prevalence counties had fairly high incidence rates. The Central Valley counties
of Fresno, San Joaquin, Kern, Stanislaus, Merced, Madera, and Kings all had low prevalence but
relatively high age-adjusted incidence rates, ranging from 13th to 24th highest in the state.10
Lung cancer is the leading cancer killer, with a five-year relative survival for all stages of 18%.5
The median age at diagnosis is 70 years.21 Counties with a low prevalence but high incidence
likely have poor survivorship. Some of the other low prevalence counties had low age-adjusted
incidence rates. Los Angeles, Santa Cruz, Santa Clara, and San Benito had the four lowest age-
adjusted incidence rates in the state for 2003 to 2012 (see Appendix Table A9).10 Of note, the
high prevalence, high incidence counties were in the lowest SES groups, while the low
prevalence and low incidence counties were in the higher SES groups. Smoking is the biggest
risk factor for lung cancer, and in the U.S. smoking rates are generally higher among people
who have lower incomes or are living below the poverty level.22,23
Cancer Prevalence in California Counties | Page 34

County Prevalence Count (a)Los Angeles-Orange 16,430 14,354,350 0.11%
Los Angeles 10,684 9,984,389 0.11%Orange 4,193 3,099,869 0.14%Ventura 997 837,019 0.12%Santa Barbara 556 433,073 0.13%
Bay Area 10,103 7,389,323 0.14%Santa Clara 2,131 1,849,043 0.12%Alameda 1,861 1,566,434 0.12%Contra Costa 1,502 1,086,241 0.14%San Francisco 1,383 832,438 0.17%San Mateo 1,214 743,037 0.16%Sonoma 717 492,821 0.15%Solano 623 422,570 0.15%Marin 441 257,110 0.17%Napa 231 139,629 0.17%
Inland Empire 4,415 4,361,625 0.10%Riverside 2,523 2,278,703 0.11%San Bernardino 1,892 2,082,922 0.09%
Central Valley 4,106 4,056,058 0.10%Fresno 975 951,436 0.10%San Joaquin 818 702,777 0.12%Kern 773 859,821 0.09%Stanislaus 639 523,479 0.12%Tulare 345 452,603 0.08%Merced 265 262,440 0.10%Madera 177 152,323 0.12%Kings 114 151,179 0.08%
San Diego-Imperial 4,382 3,370,391 0.13%San Diego 4,230 3,193,705 0.13%Imperial 152 176,686 0.09%
Sacramento Region 3,367 2,303,129 0.15%Sacramento 2,061 1,455,103 0.14%Placer 588 364,373 0.16%El Dorado 303 181,185 0.17%Nevada 217 98,244 0.22%Yolo 198 204,224 0.10%
Northern California 2,092 1,116,541 0.19%Butte 449 221,561 0.20%Shasta 375 178,682 0.21%Del Norte-Humboldt 233 162,609 0.14%Colusa_Glenn-Tehama 209 112,474 0.19%Lake 181 63,923 0.28%Siskiyou-Trinity 156 57,498 0.27%Mendocino 148 87,292 0.17%Sutter 130 95,012 0.14%Sierra-Yuba 109 76,226 0.14%Lassen-Modoc-Plumas 102 61,264 0.17%
Central Coast 1,210 1,028,218 0.12%Monterey 444 427,457 0.10%San Luis Obispo 425 275,541 0.15%Santa Cruz 301 267,975 0.11%San Benito 40 57,245 0.07%
High Sierra 438 187,005 0.23%Mariposa-Tuolumne 207 71,792 0.29%Alpine-Amador-Calaveras 191 82,539 0.23%Inyo-Mono 40 32,674 0.12%
California 46,543 38,166,640 0.12%
Total Population (b) Prevalence (a/b)*100
Prevalence0.07%-0.12% 0.13%-0.17% 0.18%-0.23% 0.24%-0.29%Population Size
500,000-999,999 1,000,000-3,999,999 4,000,000-9,999,999 10,000,000-14,354,35032,674-99,999 100,000-499,999
Lung and Bronchus
Figure 15. Estimated Complete Prevalence by Region and County, California, January 1, 2013
Cancer Prevalence in California Counties | Page 35
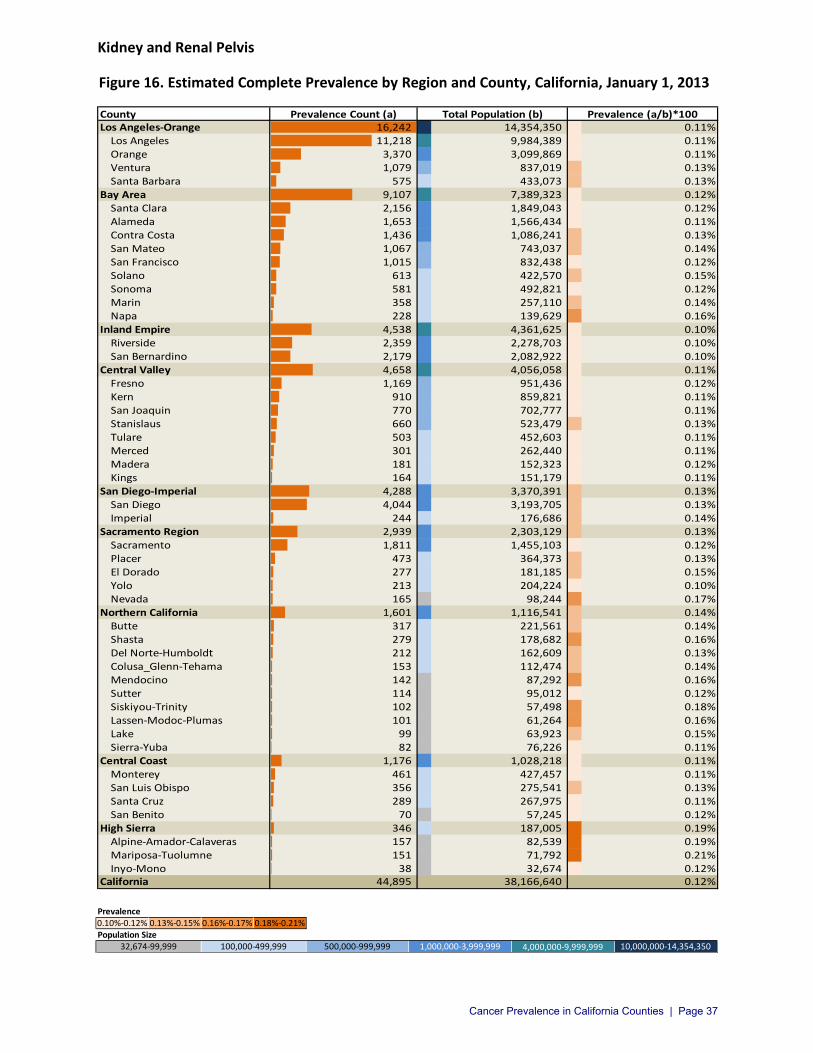
Kidney and Renal Pelvis
The complete prevalence by region and county for cancer of the kidney and renal pelvis is
shown in Figure 16. Overall, 44,895 people with a history of kidney and renal pelvis cancer were
alive in California on January 1, 2013. The counties with the highest prevalence were Alpine-
Amador-Calaveras and Mariposa-Tuolumne. These counties did not have the highest age-
adjusted incidence rates for 2003 to 2012. Mariposa-Tuolumne had the 11th highest age-
adjusted incidence rate in the state for this time period, while Alpine-Amador-Calaveras had the
34th highest (see Appendix Table A10).10 The discrepancy could represent more recent declines
in incidence rates or good survivorship. The five-year relative survival for all stages of kidney
and renal pelvis cancer is 73.7%, and the median age at diagnosis is 64 years.24 It is more
common in men than women, and smoking and over the counter pain medicines are the main
risk factors for renal cell carcinoma, the most common type of kidney and renal pelvis cancer.24
Some of the low prevalence counties had low age-adjusted incidence rates for 2003 to 2012,
including Santa Clara, Sutter, Los Angeles, Monterey, Orange, Sonoma, Inyo-Mono, San
Francisco, Alameda, and Santa Cruz, where age-adjusted incidence rates were among the
thirteen lowest in the state for that time period.10 However, some of the low prevalence
counties had high age-adjusted incidence rates, including Kings, Fresno, Merced, Tulare, and
Sierra-Yuba, where age-adjusted incidence rates ranged from 2nd to 10th highest in the state for
that time period (see Appendix Table A10).10 A low prevalence and high incidence rate may
represent poor survivorship. These low prevalence and high incidence rate counties had more
of the population in the lower SES groups.
Cancer Prevalence in California Counties | Page 36
County Prevalence Count (a)Los Angeles-Orange 16,242 14,354,350 0.11%
Los Angeles 11,218 9,984,389 0.11%Orange 3,370 3,099,869 0.11%Ventura 1,079 837,019 0.13%Santa Barbara 575 433,073 0.13%
Bay Area 9,107 7,389,323 0.12%Santa Clara 2,156 1,849,043 0.12%Alameda 1,653 1,566,434 0.11%Contra Costa 1,436 1,086,241 0.13%San Mateo 1,067 743,037 0.14%San Francisco 1,015 832,438 0.12%Solano 613 422,570 0.15%Sonoma 581 492,821 0.12%Marin 358 257,110 0.14%Napa 228 139,629 0.16%
Inland Empire 4,538 4,361,625 0.10%Riverside 2,359 2,278,703 0.10%San Bernardino 2,179 2,082,922 0.10%
Central Valley 4,658 4,056,058 0.11%Fresno 1,169 951,436 0.12%Kern 910 859,821 0.11%San Joaquin 770 702,777 0.11%Stanislaus 660 523,479 0.13%Tulare 503 452,603 0.11%Merced 301 262,440 0.11%Madera 181 152,323 0.12%Kings 164 151,179 0.11%
San Diego-Imperial 4,288 3,370,391 0.13%San Diego 4,044 3,193,705 0.13%Imperial 244 176,686 0.14%
Sacramento Region 2,939 2,303,129 0.13%Sacramento 1,811 1,455,103 0.12%Placer 473 364,373 0.13%El Dorado 277 181,185 0.15%Yolo 213 204,224 0.10%Nevada 165 98,244 0.17%
Northern California 1,601 1,116,541 0.14%Butte 317 221,561 0.14%Shasta 279 178,682 0.16%Del Norte-Humboldt 212 162,609 0.13%Colusa_Glenn-Tehama 153 112,474 0.14%Mendocino 142 87,292 0.16%Sutter 114 95,012 0.12%Siskiyou-Trinity 102 57,498 0.18%Lassen-Modoc-Plumas 101 61,264 0.16%Lake 99 63,923 0.15%Sierra-Yuba 82 76,226 0.11%
Central Coast 1,176 1,028,218 0.11%Monterey 461 427,457 0.11%San Luis Obispo 356 275,541 0.13%Santa Cruz 289 267,975 0.11%San Benito 70 57,245 0.12%
High Sierra 346 187,005 0.19%Alpine-Amador-Calaveras 157 82,539 0.19%Mariposa-Tuolumne 151 71,792 0.21%Inyo-Mono 38 32,674 0.12%
California 44,895 38,166,640 0.12%
Total Population (b) Prevalence (a/b)*100
Prevalence0.10%-0.12% 0.13%-0.15% 0.16%-0.17% 0.18%-0.21%Population Size
500,000-999,999 1,000,000-3,999,999 4,000,000-9,999,999 10,000,000-14,354,35032,674-99,999 100,000-499,999
Kidney and Renal Pelvis
Figure 16. Estimated Complete Prevalence by Region and County, California, January 1, 2013
Cancer Prevalence in California Counties | Page 37
Leukemia
The complete prevalence by region and county for leukemia is shown in Figure 17. Overall,
36,170 people with a history of leukemia were alive in California on January 1, 2013. The
counties with the highest prevalence were Marin, Napa, and Mariposa-Tuolumne. These
counties also had high age-adjusted incidence rates for 2003 to 2012. Napa and Mariposa-
Tuolumne had the first and second highest age-adjusted incidence rates in the state for that
time period, while Marin had the eighth highest (see Appendix Table A11).10
Many of the counties with a low prevalence also had low age-adjusted incidence rates for 2003
to 2012, including Imperial, San Bernardino, Monterey, Riverside, Kern, San Joaquin, Alameda,
Stanislaus, Sacramento, and Inyo-Mono, which ranked 35th to 47th in the state.10 However,
some counties had low prevalence but fairly high age-adjusted incidence rates, including Sierra-
Yuba, Sutter, Kings, Fresno, Tulare, and Madera, which had the 11th through 25th highest age-
adjusted incidence rates in the state (see Appendix Table A11).10 Having a low prevalence but
high incidence rate may represent newer trends of higher incidence rates or poor survivorship
in these counties. The five-year relative survival rate for leukemia is 58.1%.5 Leukemia occurs
most often in adults over the age of 55 years, but it is also the most common cancer in children
under the age of 15.25
Cancer Prevalence in California Counties | Page 38

County Prevalence Count (a)Los Angeles-Orange 14,106 14,354,350 0.10%
Los Angeles 9,614 9,984,389 0.10%Orange 3,143 3,099,869 0.10%Ventura 850 837,019 0.10%Santa Barbara 499 433,073 0.12%
Bay Area 7,599 7,389,323 0.10%Santa Clara 1,880 1,849,043 0.10%Alameda 1,404 1,566,434 0.09%Contra Costa 1,106 1,086,241 0.10%San Mateo 882 743,037 0.12%San Francisco 810 832,438 0.10%Sonoma 485 492,821 0.10%Solano 445 422,570 0.11%Marin 385 257,110 0.15%Napa 202 139,629 0.14%
Inland Empire 3,428 4,361,625 0.08%Riverside 1,740 2,278,703 0.08%San Bernardino 1,688 2,082,922 0.08%
Central Valley 3,319 4,056,058 0.08%Fresno 855 951,436 0.09%Kern 650 859,821 0.08%San Joaquin 531 702,777 0.08%Stanislaus 414 523,479 0.08%Tulare 373 452,603 0.08%Merced 244 262,440 0.09%Madera 131 152,323 0.09%Kings 121 151,179 0.08%
San Diego-Imperial 3,145 3,370,391 0.09%San Diego 3,020 3,193,705 0.09%Imperial 125 176,686 0.07%
Sacramento Region 2,068 2,303,129 0.09%Sacramento 1,161 1,455,103 0.08%Placer 354 364,373 0.10%El Dorado 238 181,185 0.13%Yolo 193 204,224 0.09%Nevada 122 98,244 0.12%
Northern California 1,215 1,116,541 0.11%Butte 266 221,561 0.12%Shasta 191 178,682 0.11%Del Norte-Humboldt 183 162,609 0.11%Colusa_Glenn-Tehama 146 112,474 0.13%Mendocino 91 87,292 0.10%Sutter 86 95,012 0.09%Siskiyou-Trinity 67 57,498 0.12%Sierra-Yuba 65 76,226 0.09%Lake 61 63,923 0.10%Lassen-Modoc-Plumas 59 61,264 0.10%
Central Coast 1,063 1,028,218 0.10%Monterey 376 427,457 0.09%San Luis Obispo 332 275,541 0.12%Santa Cruz 300 267,975 0.11%San Benito 55 57,245 0.10%
High Sierra 227 187,005 0.12%Mariposa-Tuolumne 110 71,792 0.15%Alpine-Amador-Calaveras 88 82,539 0.11%Inyo-Mono 29 32,674 0.09%
California 36,170 38,166,640 0.09%
Total Population (b) Prevalence (a/b)*100
Prevalence0.07%-0.08% 0.09%-0.10% 0.11%-0.12% 0.13%-0.15%Population Size
500,000-999,999 1,000,000-3,999,999 4,000,000-9,999,999 10,000,000-14,354,35032,674-99,999 100,000-499,999
Leukemia
Figure 17. Estimated Complete Prevalence by Region and County, California, January 1, 2013
Cancer Prevalence in California Counties | Page 39
40
Cervix Uteri
The complete prevalence by region and county for cervical cancer is shown in Figure 18.
Overall, 35,660 women with a history of cervical cancer were alive in California on January 1,
2013. The counties with the highest prevalence were Los Angeles, San Francisco, Madera,
Mendocino, and Mariposa-Tuolumne-Inyo-Mono. Madera, Mendocino, and Los Angeles had
high age-adjusted incidence rates for 2003 to 2012. Madera had the highest age-adjusted
incidence rate in the state followed by Mendocino (4th) and Los Angeles (7th).10 San Francisco
had a high prevalence but low age-adjusted incidence (36th),10 which may reflect good
survivorship (see Appendix Table A12).
Some of the counties with low prevalence also had low age-adjusted incidence rates. Placer and
San Luis Obispo had low prevalence and were 41st and 44th in the state, respectively, for age-
adjusted incidence rates for 2003 to 2012.10 Some counties had low prevalence but high age-
adjusted incidence rates, including Lassen-Modoc-Plumas, Riverside, and Sutter, which had the
14th, 17th, and 20th, respectively, highest age-adjusted incidence rates in the state for that time
period (see Appendix Table A12).10 Low prevalence and high incidence can represent poor
survivorship in these areas. A good screening test (Pap smear) exists which can detect cervical
cancer early and even identify precancerous changes that can be removed before they become
cancer.5,26 Counties with high prevalence but low incidence could have better screening efforts
that result in earlier detection and better survival. Counties with low prevalence but high
incidence may have poor screening, resulting in diagnosis at later stages when survival is poor.
The five-year relative survival for all stages of cervical cancer is 70.2%.5 The biggest risk factor
for cervical cancer is infection with human papillomavirus (HPV).5,26 An effective vaccine against
HPV exists and is recommended for preteens beginning at age 11 or 12 years.5
Cancer Prevalence in California Counties | Page 40

County Prevalence Count (a)Los Angeles-Orange 15,742 7,262,935 0.22%
Los Angeles 11,859 5,059,459 0.23%Orange 2,808 1,566,314 0.18%Ventura 696 421,708 0.17%Santa Barbara 379 215,454 0.18%
Bay Area 6,532 3,723,446 0.18%Santa Clara 1,686 919,466 0.18%Alameda 1,273 798,294 0.16%San Francisco 953 408,743 0.23%Contra Costa 777 555,876 0.14%San Mateo 705 377,215 0.19%Sonoma 432 250,747 0.17%Solano 375 211,711 0.18%Marin 207 131,361 0.16%Napa 124 70,033 0.18%
Inland Empire 3,141 2,189,153 0.14%San Bernardino 1,647 1,045,808 0.16%Riverside 1,494 1,143,345 0.13%
Central Valley 3,460 2,012,218 0.17%Fresno 799 476,153 0.17%Kern 782 418,579 0.19%San Joaquin 503 352,871 0.14%Tulare 445 225,470 0.20%Stanislaus 413 264,282 0.16%Merced 204 129,855 0.16%Madera 185 78,196 0.24%Kings 129 66,812 0.19%
San Diego-Imperial 2,866 1,674,307 0.17%San Diego 2,712 1,588,313 0.17%Imperial 154 85,994 0.18%
Sacramento Region 2,003 1,174,326 0.17%Sacramento 1,393 742,739 0.19%Placer 223 186,465 0.12%Yolo 164 104,800 0.16%El Dorado 153 90,564 0.17%Nevada 70 49,758 0.14%
Northern California 932 553,966 0.17%Butte 160 111,648 0.14%Shasta 155 91,017 0.17%Del Norte-Humboldt 142 79,692 0.18%Mendocino 114 43,751 0.26%Colusa_Glenn-Tehama 106 55,872 0.19%Sierra-Yuba 64 37,665 0.17%Lake 64 31,943 0.20%Sutter 49 47,681 0.10%Siskiyou-Trinity 45 28,677 0.16%Lassen-Modoc-Plumas 33 26,020 0.13%
Central Coast 796 505,770 0.16%Monterey 381 207,766 0.18%Santa Cruz 202 134,629 0.15%San Luis Obispo 163 134,810 0.12%San Benito 50 28,565 0.18%
High Sierra 188 90,216 0.21%Mariposa-Tuolumne-Inyo-Mono 111 50,279 0.22%Alpine-Amador-Calaveras 77 39,937 0.19%
California 35,660 19,186,337 0.19%
Total Population (b) Prevalence (a/b)*100
Prevalence0.10%-0.13% 0.14%-0.17% 0.18%-0.21% 0.22%-0.26%Population Size
250,000-499,999 500,000-1,999,999 2,000,000-4,999,999 5,000,000-7,262,93515,774-49,999 50,000-249,999
Cervix Uteri
Figure 18. Estimated Complete Prevalence by Region and County, California, January 1, 2013
Cancer Prevalence in California Counties | Page 41
Oral Cavity and Pharynx
The complete prevalence by region and county for cancer of the oral cavity and pharynx
(oropharyngeal cancer) is shown in Figure 19. Overall, 35,395 people with a history of
oropharyngeal cancer were alive in California on January 1, 2013. The counties with the highest
prevalence were Marin and Mariposa-Tuolumne. These counties had the 2nd and 3rd highest
age-adjusted incidence rates in the state for 2003 to 2012 (see Appendix Table A13).10
Stanislaus, Riverside, San Bernardino, Fresno, Sutter, Monterey, Imperial, Merced, Santa Clara,
San Benito, Madera, Los Angeles, Tulare, Inyo-Mono all had low prevalence and low age-
adjusted incidence rates for 2003 to 2012, ranging from 36th to 47th in the state.10 Sierra-Yuba,
Kings, and Kern all had low prevalence but fairly high age-adjusted incidence rates (Sierra-Yuba
12th, Kings 16th, Kern 17th),10 which could represent poor survivorship (see Appendix Table A13).
Primary risk factors for oropharyngeal cancer include tobacco use, frequent alcohol
consumption, and infection with human papillomavirus (HPV).27 The five-year relative survival
for all stages of oropharyngeal cancer is 66.5%.5
Cancer Prevalence in California Counties | Page 42

County Prevalence Count (a)Los Angeles-Orange 12,228 14,354,350 0.09%
Los Angeles 7,892 9,984,389 0.08%Orange 3,086 3,099,869 0.10%Ventura 797 837,019 0.10%Santa Barbara 453 433,073 0.10%
Bay Area 8,192 7,389,323 0.11%Santa Clara 1,717 1,849,043 0.09%Alameda 1,523 1,566,434 0.10%Contra Costa 1,167 1,086,241 0.11%San Francisco 1,107 832,438 0.13%San Mateo 932 743,037 0.13%Sonoma 653 492,821 0.13%Marin 459 257,110 0.18%Solano 454 422,570 0.11%Napa 180 139,629 0.13%
Inland Empire 3,240 4,361,625 0.07%Riverside 1,756 2,278,703 0.08%San Bernardino 1,484 2,082,922 0.07%
Central Valley 3,034 4,056,058 0.07%Kern 679 859,821 0.08%Fresno 677 951,436 0.07%San Joaquin 558 702,777 0.08%Stanislaus 420 523,479 0.08%Tulare 289 452,603 0.06%Merced 166 262,440 0.06%Kings 128 151,179 0.08%Madera 117 152,323 0.08%
San Diego-Imperial 3,494 3,370,391 0.10%San Diego 3,375 3,193,705 0.11%Imperial 119 176,686 0.07%
Sacramento Region 2,465 2,303,129 0.11%Sacramento 1,452 1,455,103 0.10%Placer 418 364,373 0.11%El Dorado 276 181,185 0.15%Yolo 174 204,224 0.09%Nevada 145 98,244 0.15%
Northern California 1,399 1,116,541 0.13%Shasta 264 178,682 0.15%Butte 246 221,561 0.11%Del Norte-Humboldt 206 162,609 0.13%Colusa_Glenn-Tehama 152 112,474 0.14%Mendocino 134 87,292 0.15%Lake 88 63,923 0.14%Sutter 87 95,012 0.09%Siskiyou-Trinity 83 57,498 0.14%Lassen-Modoc-Plumas 70 61,264 0.11%Sierra-Yuba 69 76,226 0.09%
Central Coast 1,051 1,028,218 0.10%San Luis Obispo 357 275,541 0.13%Monterey 347 427,457 0.08%Santa Cruz 299 267,975 0.11%San Benito 48 57,245 0.08%
High Sierra 292 187,005 0.16%Mariposa-Tuolumne 142 71,792 0.20%Alpine-Amador-Calaveras 125 82,539 0.15%Inyo-Mono 25 32,674 0.08%
California 35,395 38,166,640 0.09%
Total Population (b) Prevalence (a/b)*100
Prevalence0.06%-0.09% 0.10%-0.12% 0.13%-0.16% 0.17%-0.20%Population Size
500,000-999,999 1,000,000-3,999,999 4,000,000-9,999,999 10,000,000-14,354,35032,674-99,999 100,000-499,999
Oral Cavity and Pharynx
Figure 19. Estimated Complete Prevalence by Region and County, California, January 1, 2013
Cancer Prevalence in California Counties | Page 43
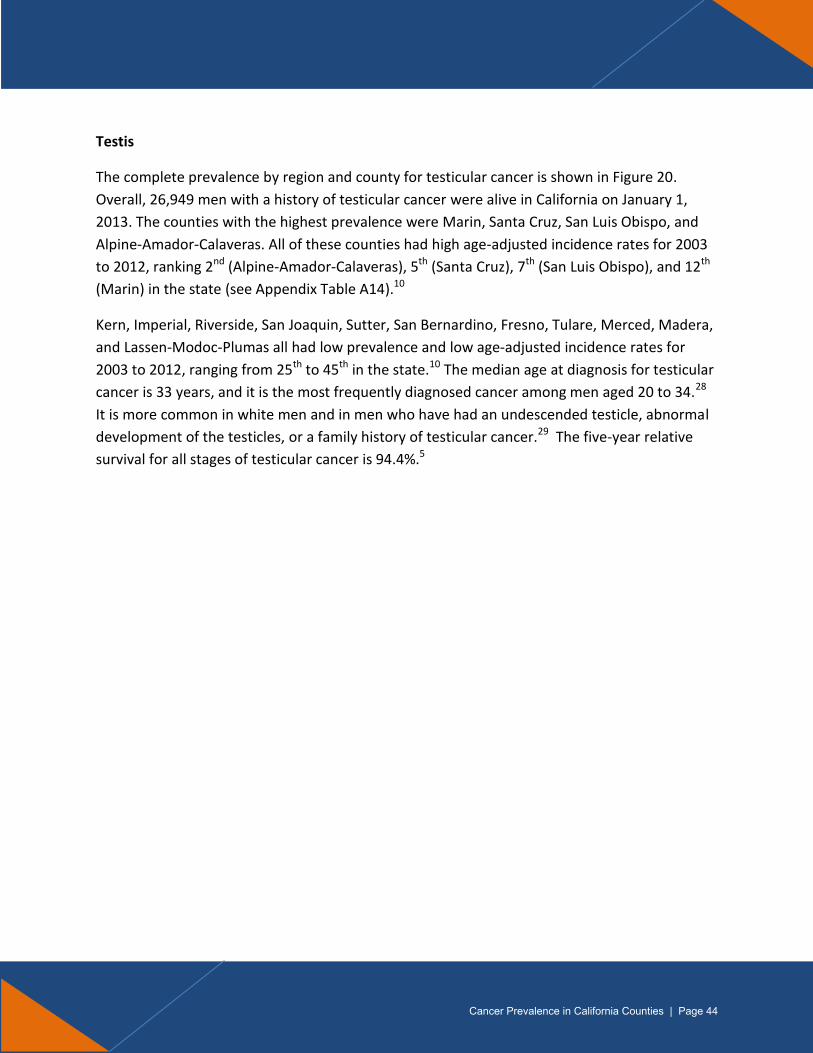
Testis
The complete prevalence by region and county for testicular cancer is shown in Figure 20.
Overall, 26,949 men with a history of testicular cancer were alive in California on January 1,
2013. The counties with the highest prevalence were Marin, Santa Cruz, San Luis Obispo, and
Alpine-Amador-Calaveras. All of these counties had high age-adjusted incidence rates for 2003
to 2012, ranking 2nd (Alpine-Amador-Calaveras), 5th (Santa Cruz), 7th (San Luis Obispo), and 12th
(Marin) in the state (see Appendix Table A14).10
Kern, Imperial, Riverside, San Joaquin, Sutter, San Bernardino, Fresno, Tulare, Merced, Madera,
and Lassen-Modoc-Plumas all had low prevalence and low age-adjusted incidence rates for
2003 to 2012, ranging from 25th to 45th in the state.10 The median age at diagnosis for testicular
cancer is 33 years, and it is the most frequently diagnosed cancer among men aged 20 to 34.28
It is more common in white men and in men who have had an undescended testicle, abnormal
development of the testicles, or a family history of testicular cancer.29 The five-year relative
survival for all stages of testicular cancer is 94.4%.5
Cancer Prevalence in California Counties | Page 44
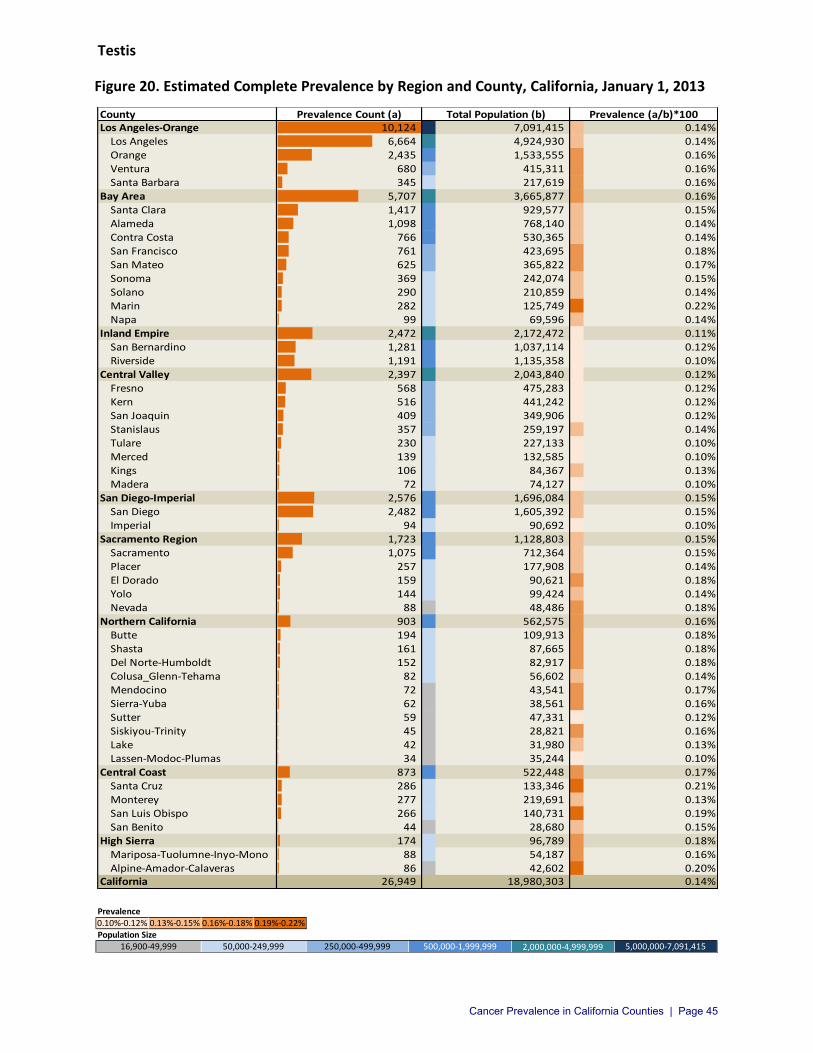
County Prevalence Count (a)Los Angeles-Orange 10,124 7,091,415 0.14%
Los Angeles 6,664 4,924,930 0.14%Orange 2,435 1,533,555 0.16%Ventura 680 415,311 0.16%Santa Barbara 345 217,619 0.16%
Bay Area 5,707 3,665,877 0.16%Santa Clara 1,417 929,577 0.15%Alameda 1,098 768,140 0.14%Contra Costa 766 530,365 0.14%San Francisco 761 423,695 0.18%San Mateo 625 365,822 0.17%Sonoma 369 242,074 0.15%Solano 290 210,859 0.14%Marin 282 125,749 0.22%Napa 99 69,596 0.14%
Inland Empire 2,472 2,172,472 0.11%San Bernardino 1,281 1,037,114 0.12%Riverside 1,191 1,135,358 0.10%
Central Valley 2,397 2,043,840 0.12%Fresno 568 475,283 0.12%Kern 516 441,242 0.12%San Joaquin 409 349,906 0.12%Stanislaus 357 259,197 0.14%Tulare 230 227,133 0.10%Merced 139 132,585 0.10%Kings 106 84,367 0.13%Madera 72 74,127 0.10%
San Diego-Imperial 2,576 1,696,084 0.15%San Diego 2,482 1,605,392 0.15%Imperial 94 90,692 0.10%
Sacramento Region 1,723 1,128,803 0.15%Sacramento 1,075 712,364 0.15%Placer 257 177,908 0.14%El Dorado 159 90,621 0.18%Yolo 144 99,424 0.14%Nevada 88 48,486 0.18%
Northern California 903 562,575 0.16%Butte 194 109,913 0.18%Shasta 161 87,665 0.18%Del Norte-Humboldt 152 82,917 0.18%Colusa_Glenn-Tehama 82 56,602 0.14%Mendocino 72 43,541 0.17%Sierra-Yuba 62 38,561 0.16%Sutter 59 47,331 0.12%Siskiyou-Trinity 45 28,821 0.16%Lake 42 31,980 0.13%Lassen-Modoc-Plumas 34 35,244 0.10%
Central Coast 873 522,448 0.17%Santa Cruz 286 133,346 0.21%Monterey 277 219,691 0.13%San Luis Obispo 266 140,731 0.19%San Benito 44 28,680 0.15%
High Sierra 174 96,789 0.18%Mariposa-Tuolumne-Inyo-Mono 88 54,187 0.16%Alpine-Amador-Calaveras 86 42,602 0.20%
California 26,949 18,980,303 0.14%
Total Population (b) Prevalence (a/b)*100
Prevalence0.10%-0.12% 0.13%-0.15% 0.16%-0.18% 0.19%-0.22%Population Size
250,000-499,999 500,000-1,999,999 2,000,000-4,999,999 5,000,000-7,091,41516,900-49,999 50,000-249,999
Testis
Figure 20. Estimated Complete Prevalence by Region and County, California, January 1, 2013
Cancer Prevalence in California Counties | Page 45
Ovary
The complete prevalence by region and county for ovarian cancer is shown in Figure 21.
Overall, 23,590 women with a history of ovarian cancer were alive in California on January 1,
2013. The counties with the highest prevalence were Marin, Nevada, Lake, and Mariposa-
Tuolumne-Inyo-Mono. These counties had high age-adjusted incidence rates for 2003 to 2012,
ranking 1st (Nevada), 3rd (Marin), 9th (Mariposa-Tuolumne), and 16th (Lake) in the state (see
Appendix Table A15).10
Fresno, Riverside, Kern, Stanislaus, Merced, San Joaquin, Kings, Imperial, and Madera all had
low prevalence and low age-adjusted incidence rates for 2003 to 2012, ranging from 26th to 46th
in the state.10 Tulare had a low prevalence but a fairly high age-adjusted incidence rate (14th),10
which could indicate poor survivorship. Women with a family history of the disease, especially
in a first degree relative, are at increased risk of ovarian cancer.30 The median age at diagnosis
for ovarian cancer is 63 years, and the five-year relative survival for all stages is 49.4%.5,30
Cancer Prevalence in California Counties | Page 46

County Prevalence Count (a)Los Angeles-Orange 9,416 7,262,935 0.13%
Los Angeles 6,425 5,059,459 0.13%Orange 2,089 1,566,314 0.13%Ventura 597 421,708 0.14%Santa Barbara 305 215,454 0.14%
Bay Area 5,287 3,723,446 0.14%Santa Clara 1,205 919,466 0.13%Alameda 1,027 798,294 0.13%Contra Costa 744 555,876 0.13%San Francisco 635 408,743 0.16%San Mateo 618 377,215 0.16%Sonoma 392 250,747 0.16%Solano 288 211,711 0.14%Marin 260 131,361 0.20%Napa 118 70,033 0.17%
Inland Empire 2,157 2,189,153 0.10%San Bernardino 1,127 1,045,808 0.11%Riverside 1,030 1,143,345 0.09%
Central Valley 1,818 2,012,218 0.09%Fresno 450 476,153 0.09%Kern 360 418,579 0.09%San Joaquin 314 352,871 0.09%Stanislaus 271 264,282 0.10%Tulare 213 225,470 0.09%Merced 109 129,855 0.08%Madera 57 78,196 0.07%Kings 44 66,812 0.07%
San Diego-Imperial 1,932 1,674,307 0.12%San Diego 1,867 1,588,313 0.12%Imperial 65 85,994 0.08%
Sacramento Region 1,378 1,174,326 0.12%Sacramento 783 742,739 0.11%Placer 242 186,465 0.13%El Dorado 129 90,564 0.14%Yolo 115 104,800 0.11%Nevada 109 49,758 0.22%
Northern California 741 553,966 0.13%Butte 133 111,648 0.12%Shasta 122 91,017 0.13%Del Norte-Humboldt 114 79,692 0.14%Mendocino 77 43,751 0.18%Colusa_Glenn-Tehama 70 55,872 0.13%Lake 69 31,943 0.22%Sutter 51 47,681 0.11%Siskiyou-Trinity 39 28,677 0.14%Lassen-Modoc-Plumas 38 26,020 0.15%Sierra-Yuba 28 37,665 0.07%
Central Coast 681 505,770 0.13%Monterey 250 207,766 0.12%San Luis Obispo 203 134,810 0.15%Santa Cruz 188 134,629 0.14%San Benito 40 28,565 0.14%
High Sierra 180 90,216 0.20%Mariposa-Tuolumne-Inyo-Mono 109 50,279 0.22%Alpine-Amador-Calaveras 71 39,937 0.18%
California 23,590 19,186,337 0.12%
Total Population (b) Prevalence (a/b)*100
Prevalence0.07%-0.10% 0.11%-0.14% 0.15%-0.17% 0.18%-0.22%Population Size
250,000-499,999 500,000-1,999,999 2,000,000-4,999,999 5,000,000-7,262,93515,774-49,999 50,000-249,999
Ovary
Figure 21. Estimated Complete Prevalence by Region and County, California, January 1, 2013
Cancer Prevalence in California Counties | Page 47

48
Hodgkin Lymphoma
The complete prevalence by region and county for Hodgkin lymphoma is shown in Figure 22.
Overall, 19,337 people with a history of Hodgkin lymphoma were alive in California on January
1, 2013. The counties with the highest prevalence were San Francisco, Solano, Napa, Del Norte-
Humboldt, Mendocino, Siskiyou-Trinity, and Santa Cruz. These counties had high age-adjusted
incidence rates for 2003 to 2012, ranking 1st (Siskiyou-Trinity), 4th (Solano), 5th (San Francisco),
7th (Mendocino), 10th (Santa Cruz), 11th (Del Norte-Humboldt), and 16th (Napa) in the state (see
Appendix Table A16).10
San Bernardino, Riverside, Kern, Tulare, Madera, Kings, and Imperial had low prevalence and
low age-adjusted incidence rates for 2003 to 2012, ranging from 24th to 44th in the state.10 San
Joaquin and Fresno had low prevalence but fairly high age-adjusted incidence rates (13th and
18th, respectively),10 which may indicate poor survivorship in these counties. The median age at
diagnosis for Hodgkin lymphoma is 39 years, and the five-year relative survival for all stages is
84.9%.5,31 Hodgkin lymphoma is more common in men and in people with a family history of
Hodgkin lymphoma or past infection with Epstein-Barr virus.31
Cancer Prevalence in California Counties | Page 48
County Prevalence Count (a)Los Angeles-Orange 7,304 14,354,350 0.05%
Los Angeles 5,059 9,984,389 0.05%Orange 1,543 3,099,869 0.05%Ventura 483 837,019 0.06%Santa Barbara 219 433,073 0.05%
Bay Area 4,352 7,389,323 0.06%Santa Clara 1,035 1,849,043 0.06%Alameda 857 1,566,434 0.05%San Francisco 595 832,438 0.07%Contra Costa 570 1,086,241 0.05%San Mateo 452 743,037 0.06%Solano 293 422,570 0.07%Sonoma 284 492,821 0.06%Marin 167 257,110 0.06%Napa 99 139,629 0.07%
Inland Empire 1,748 4,361,625 0.04%San Bernardino 914 2,082,922 0.04%Riverside 834 2,278,703 0.04%
Central Valley 1,648 4,056,058 0.04%Fresno 379 951,436 0.04%San Joaquin 298 702,777 0.04%Kern 287 859,821 0.03%Stanislaus 254 523,479 0.05%Tulare 185 452,603 0.04%Merced 127 262,440 0.05%Madera 65 152,323 0.04%Kings 53 151,179 0.04%
San Diego-Imperial 1,757 3,370,391 0.05%San Diego 1,696 3,193,705 0.05%Imperial 61 176,686 0.03%
Sacramento Region 1,221 2,303,129 0.05%Sacramento 762 1,455,103 0.05%Placer 186 364,373 0.05%Yolo 111 204,224 0.05%El Dorado 108 181,185 0.06%Nevada 54 98,244 0.05%
Northern California 632 1,116,541 0.06%Shasta 115 178,682 0.06%Butte 114 221,561 0.05%Del Norte-Humboldt 109 162,609 0.07%Mendocino 61 87,292 0.07%Colusa-Glenn-Tehama 55 112,474 0.05%Siskiyou-Trinity 41 57,498 0.07%Lassen-Modoc-Plumas 37 61,264 0.06%Sierra-Yuba 37 76,226 0.05%Sutter 32 95,012 0.03%Lake 31 63,923 0.05%
Central Coast 570 1,028,218 0.06%Monterey 205 427,457 0.05%Santa Cruz 176 267,975 0.07%San Luis Obispo 161 275,541 0.06%San Benito 28 57,245 0.05%
High Sierra 105 187,005 0.06%Mariposa-Tuolumne-Inyo-Mono 63 104,466 0.06%Alpine-Amador-Calaveras 42 82,539 0.05%
California 19,337 38,166,640 0.05%
Total Population (b) Prevalence (a/b)*100
Prevalence
0.03%-0.04% 0.05%-0.06% 0.07%Population Size
500,000-999,999 1,000,000-3,999,999 4,000,000-9,999,999 10,000,000-14,354,35032,674-99,999 100,000-499,999
Hodgkin Lymphoma
Figure 22. Estimated Complete Prevalence by Region and County, California, January 1, 2013
Cancer Prevalence in California Counties | Page 49
50
Brain and CNS
The complete prevalence by region and county for brain and central nervous system (CNS)
cancer is shown in Figure 23. Overall, 16,415 people with a history of brain and CNS cancer
were alive in California on January 1, 2013. The counties with the highest prevalence were
Sonoma, Marin, El Dorado, Colusa-Glenn-Tehama, Mendocino, Sierra-Yuba, Lassen-Modoc-
Plumas, and Alpine-Amador-Calaveras. These counties had high age-adjusted incidence rates
for 2003 to 2012, ranking 1st (Marin), 2nd (Sonoma), 9th (Sierra-Yuba), 12th (Lassen-Modoc-
Plumas), 13th (Colusa-Glenn-Tehama), and 15th (El Dorado) in the state.10 Mendocino and
Alpine-Amador-Calaveras had high prevalence but low age-adjusted incidence rates for 2003 to
2012, ranking 41st and 42nd in the state, respectively (see Appendix Table A17).10 This could
reflect good survivorship in these areas.
Riverside, Tulare, Madera, and Imperial had low prevalence and low age-adjusted incidence
rates for 2003 to 2012, ranging from 34th to 46th in the state.10 The cause of most adult brain
and spinal cord tumors is unknown.32 The median age at diagnosis for CNS cancer is 58 years,
and the five-year relative survival for all stages is 33.8%.32
Cancer Prevalence in California Counties | Page 50

County Prevalence Count (a)Los Angeles-Orange 5,946 14,354,350 0.04%
Los Angeles 3,971 9,984,389 0.04%Orange 1,430 3,099,869 0.05%Ventura 375 837,019 0.04%Santa Barbara 170 433,073 0.04%
Bay Area 3,700 7,389,323 0.05%Santa Clara 875 1,849,043 0.05%Alameda 711 1,566,434 0.05%Contra Costa 535 1,086,241 0.05%San Francisco 454 832,438 0.05%San Mateo 385 743,037 0.05%Sonoma 313 492,821 0.06%Solano 199 422,570 0.05%Marin 160 257,110 0.06%Napa 68 139,629 0.05%
Inland Empire 1,516 4,361,625 0.03%San Bernardino 763 2,082,922 0.04%Riverside 753 2,278,703 0.03%
Central Valley 1,614 4,056,058 0.04%Fresno 367 951,436 0.04%Kern 331 859,821 0.04%San Joaquin 318 702,777 0.05%Stanislaus 227 523,479 0.04%Tulare 147 452,603 0.03%Merced 120 262,440 0.05%Kings 58 151,179 0.04%Madera 46 152,323 0.03%
San Diego-Imperial 1,422 3,370,391 0.04%San Diego 1,364 3,193,705 0.04%Imperial 58 176,686 0.03%
Sacramento Region 1,076 2,303,129 0.05%Sacramento 649 1,455,103 0.04%Placer 199 364,373 0.05%El Dorado 103 181,185 0.06%Yolo 76 204,224 0.04%Nevada 49 98,244 0.05%
Northern California 554 1,116,541 0.05%Shasta-Siskiyou-Trinity 129 279,059 0.05%Butte 81 178,682 0.05%Del Norte-Humboldt 77 162,609 0.05%Colusa-Glenn-Tehama 63 112,474 0.06%Mendocino 51 87,292 0.06%Sutter 45 95,012 0.05%Sierra-Yuba 43 76,226 0.06%Lake 28 63,923 0.04%Lassen-Modoc-Plumas 37 61,264 0.06%
Central Coast 491 1,028,218 0.05%Monterey-San Benito 234 484,702 0.05%San Luis Obispo 134 275,541 0.05%Santa Cruz 123 267,975 0.05%
High Sierra 96 187,005 0.05%Maripo-Tuolumne-Inyo-Mono 49 104,466 0.05%Alpine-Amador-Calaveras 47 82,539 0.06%
California 16,415 38,166,640 0.04%
Total Population (b) Prevalence (a/b)*100
Prevalence0.03% 0.04% 0.05% 0.06%
Population Size500,000-999,999 1,000,000-3,999,999 4,000,000-9,999,999 10,000,000-14,354,35032,674-99,999 100,000-499,999
Brain and Central Nervous System
Figure 23. Estimated Complete Prevalence by Region and County, California, January 1, 2013
Cancer Prevalence in California Counties | Page 51
52
Stomach
The complete prevalence by region and county for stomach cancer is shown in Figure 24.
Overall, 11,669 people with a history of stomach cancer were alive in California on January 1,
2013. San Francisco had the highest prevalence, followed by Los Angeles, San Mateo, and
Marin. San Francisco, Los Angeles, and San Mateo had high age-adjusted incidence rates in
2003 to 2012, ranking 2nd, 3rd, and 6th in the state, respectively.10 Marin, however, ranked 38th
in the state for age-adjusted incidence during this time period (see Appendix Table A18).10 The
high prevalence but low incidence in Marin could indicate good survivorship.
Sonoma, Riverside, San Bernardino, Fresno, San Joaquin, Stanislaus, Tulare, Merced, Kings,
Madera, San Diego, Imperial, Placer-Nevada, Yolo, El Dorado, Shasta-Siskiyou-Trinity, Colusa-
Glenn-Tehama-Mendocino-Lake, Butte-Lassen-Modoc-Plumas, Sutter-Sierra-Yuba, Del Norte-
Humboldt, San Luis Obispo, Santa Cruz, and Alpine-Amador-Calaveras-Inyo-Mono all had low
prevalence. Of these low prevalence counties, Imperial, San Joaquin, Kings, Fresno, and San
Bernardino had high age-adjusted incidence rates for 2003 to 2012, ranking 1st (Imperial), 7th
(San Joaquin), 8th (Kings), 10th (Fresno), and 11th (San Bernardino) in the state (see Appendix
Table A18).10 Low prevalence but high incidence may reflect poor survivorship. Dietary factors
(e.g., high intake of smoked foods, low intake of fruits and vegetables), stomach disease,
smoking, and family history are risk factors for stomach cancer.33 Stomach cancer is more
common in men, and the median age at diagnosis is 69 years.33 The five-year relative survival
for all stages combined is 30.4%.33
Cancer Prevalence in California Counties | Page 52
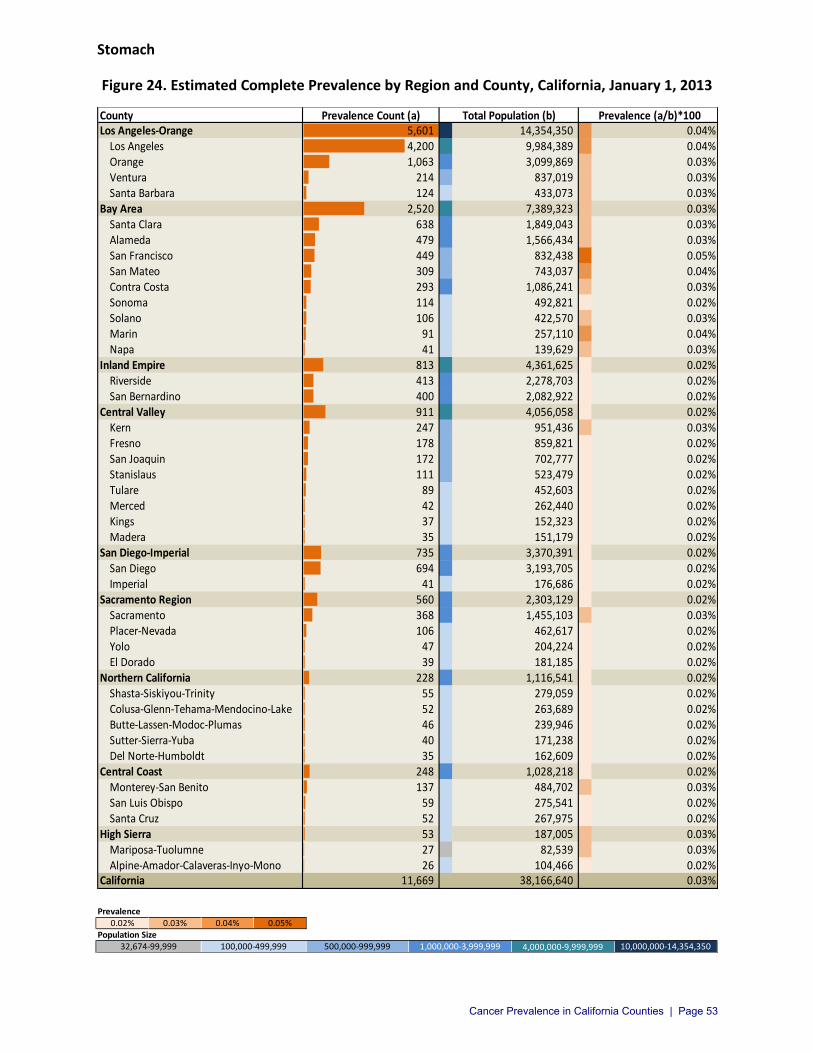
County Prevalence Count (a)Los Angeles-Orange 5,601 14,354,350 0.04%
Los Angeles 4,200 9,984,389 0.04%Orange 1,063 3,099,869 0.03%Ventura 214 837,019 0.03%Santa Barbara 124 433,073 0.03%
Bay Area 2,520 7,389,323 0.03%Santa Clara 638 1,849,043 0.03%Alameda 479 1,566,434 0.03%San Francisco 449 832,438 0.05%San Mateo 309 743,037 0.04%Contra Costa 293 1,086,241 0.03%Sonoma 114 492,821 0.02%Solano 106 422,570 0.03%Marin 91 257,110 0.04%Napa 41 139,629 0.03%
Inland Empire 813 4,361,625 0.02%Riverside 413 2,278,703 0.02%San Bernardino 400 2,082,922 0.02%
Central Valley 911 4,056,058 0.02%Kern 247 951,436 0.03%Fresno 178 859,821 0.02%San Joaquin 172 702,777 0.02%Stanislaus 111 523,479 0.02%Tulare 89 452,603 0.02%Merced 42 262,440 0.02%Kings 37 152,323 0.02%Madera 35 151,179 0.02%
San Diego-Imperial 735 3,370,391 0.02%San Diego 694 3,193,705 0.02%Imperial 41 176,686 0.02%
Sacramento Region 560 2,303,129 0.02%Sacramento 368 1,455,103 0.03%Placer-Nevada 106 462,617 0.02%Yolo 47 204,224 0.02%El Dorado 39 181,185 0.02%
Northern California 228 1,116,541 0.02%Shasta-Siskiyou-Trinity 55 279,059 0.02%Colusa-Glenn-Tehama-Mendocino-Lake 52 263,689 0.02%Butte-Lassen-Modoc-Plumas 46 239,946 0.02%Sutter-Sierra-Yuba 40 171,238 0.02%Del Norte-Humboldt 35 162,609 0.02%
Central Coast 248 1,028,218 0.02%Monterey-San Benito 137 484,702 0.03%San Luis Obispo 59 275,541 0.02%Santa Cruz 52 267,975 0.02%
High Sierra 53 187,005 0.03%Mariposa-Tuolumne 27 82,539 0.03%Alpine-Amador-Calaveras-Inyo-Mono 26 104,466 0.02%
California 11,669 38,166,640 0.03%
Total Population (b) Prevalence (a/b)*100
Prevalence0.02% 0.03% 0.04% 0.05%
Population Size500,000-999,999 1,000,000-3,999,999 4,000,000-9,999,999 10,000,000-14,354,35032,674-99,999 100,000-499,999
Stomach
Figure 24. Estimated Complete Prevalence by Region and County, California, January 1, 2013
Cancer Prevalence in California Counties | Page 53
54
Liver and Intrahepatic Bile Duct
The complete prevalence by region and county for liver and intrahepatic bile duct (IBD) cancer
is shown in Figure 25. Overall, 8,757 people with a history of liver and IBD cancer were alive in
California on January 1, 2013. San Francisco had the highest prevalence, followed by Santa
Clara, Alameda, San Mateo, Sonoma, Nevada, and Santa Cruz. Of these high prevalence
counties, San Francisco, Santa Clara, Alameda, and San Mateo had high age-adjusted incidence
rates in 2003 to 2012, ranking 1st, 2nd, 6th, and 12th in the state, respectively.10 Sonoma, Santa
Cruz, and Nevada had fairly low age-adjusted incidence rates, ranking 27th, 33rd, and 39th in the
state, respectively, for that time period (see Appendix Table A19).10 High prevalence but low
incidence in these three counties may represent good survivorship.
Most counties had a low prevalence (0.01%-0.02%) of liver and IBD cancer, and many of these
low prevalence counties also had low age-adjusted incidence rates for 2003 to 2012 (San Luis
Obispo-32nd, Riverside-37th, Marin-40th, Ventura-42nd, Placer-43rd, El Dorado-45th).10 Fresno,
Kings, Sacramento, Los Angeles, San Joaquin, and Lake had low prevalence but high age-
adjusted incidence rates from 2003 to 2012, ranking 3rd (Imperial), 4th (Fresno), 5th (Kings), 8th
(Sacramento), 9th (Los Angeles), 10th (San Joaquin), and 11th (Lake) in the state.10 Low
prevalence but high incidence can indicate poor survivorship. Liver cancer is more common in
men and in people with a history of hepatitis or cirrhosis.34 The median age at diagnosis is 63
years, and the five-year relative survival for all stages is 17.5%.34
Cancer Prevalence in California Counties | Page 54
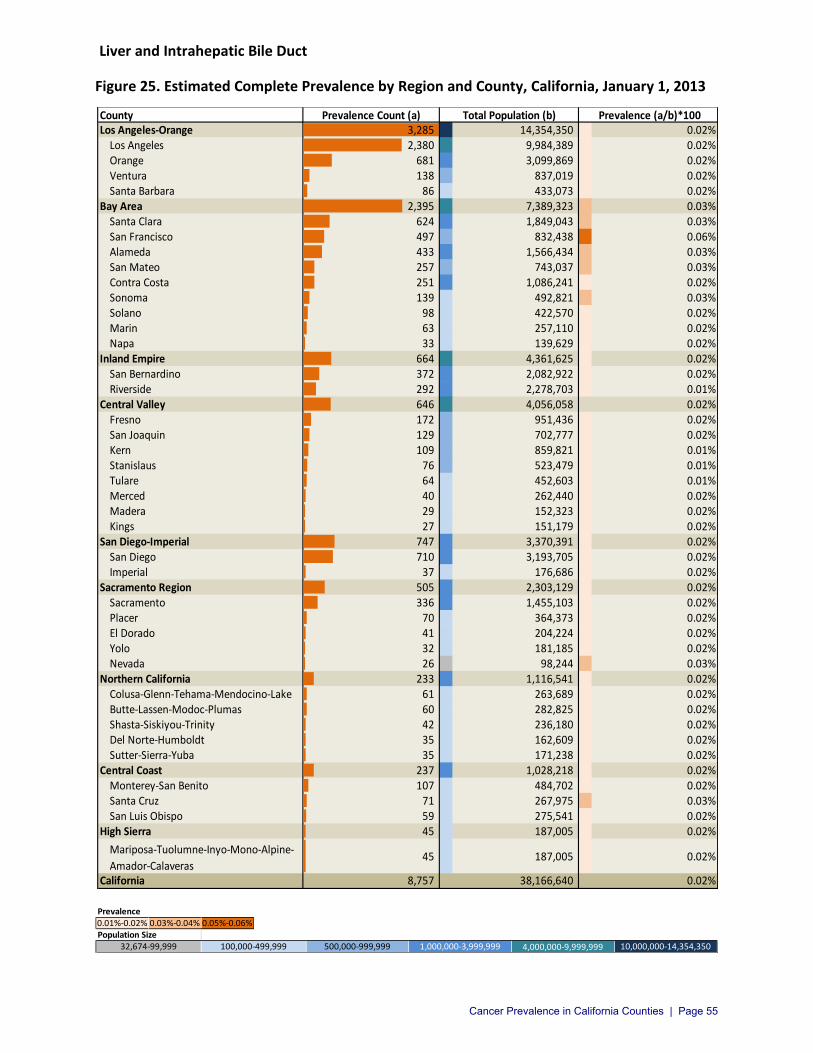
County Prevalence Count (a)Los Angeles-Orange 3,285 14,354,350 0.02%
Los Angeles 2,380 9,984,389 0.02%Orange 681 3,099,869 0.02%Ventura 138 837,019 0.02%Santa Barbara 86 433,073 0.02%
Bay Area 2,395 7,389,323 0.03%Santa Clara 624 1,849,043 0.03%San Francisco 497 832,438 0.06%Alameda 433 1,566,434 0.03%San Mateo 257 743,037 0.03%Contra Costa 251 1,086,241 0.02%Sonoma 139 492,821 0.03%Solano 98 422,570 0.02%Marin 63 257,110 0.02%Napa 33 139,629 0.02%
Inland Empire 664 4,361,625 0.02%San Bernardino 372 2,082,922 0.02%Riverside 292 2,278,703 0.01%
Central Valley 646 4,056,058 0.02%Fresno 172 951,436 0.02%San Joaquin 129 702,777 0.02%Kern 109 859,821 0.01%Stanislaus 76 523,479 0.01%Tulare 64 452,603 0.01%Merced 40 262,440 0.02%Madera 29 152,323 0.02%Kings 27 151,179 0.02%
San Diego-Imperial 747 3,370,391 0.02%San Diego 710 3,193,705 0.02%Imperial 37 176,686 0.02%
Sacramento Region 505 2,303,129 0.02%Sacramento 336 1,455,103 0.02%Placer 70 364,373 0.02%El Dorado 41 204,224 0.02%Yolo 32 181,185 0.02%Nevada 26 98,244 0.03%
Northern California 233 1,116,541 0.02%Colusa-Glenn-Tehama-Mendocino-Lake 61 263,689 0.02%Butte-Lassen-Modoc-Plumas 60 282,825 0.02%Shasta-Siskiyou-Trinity 42 236,180 0.02%Del Norte-Humboldt 35 162,609 0.02%Sutter-Sierra-Yuba 35 171,238 0.02%
Central Coast 237 1,028,218 0.02%Monterey-San Benito 107 484,702 0.02%Santa Cruz 71 267,975 0.03%San Luis Obispo 59 275,541 0.02%
High Sierra 45 187,005 0.02%
Mariposa-Tuolumne-Inyo-Mono-Alpine-
Amador-Calaveras45 187,005 0.02%
California 8,757 38,166,640 0.02%
Total Population (b) Prevalence (a/b)*100
Prevalence0.01%-0.02% 0.03%-0.04% 0.05%-0.06%Population Size
500,000-999,999 1,000,000-3,999,999 4,000,000-9,999,999 10,000,000-14,354,350100,000-499,99932,674-99,999
Liver and Intrahepatic Bile Duct
Figure 25. Estimated Complete Prevalence by Region and County, California, January 1, 2013
Cancer Prevalence in California Counties | Page 55
56
Larynx
The complete prevalence by region and county for cancer of the larynx is shown in Figure 26.
Overall, 8,455 people with a history of cancer of the larynx were alive in California on January 1,
2013. Mendocino-Lake had the highest prevalence, followed by San Francisco, San Mateo,
Sonoma, Solano, Marin, Napa, El Dorado, Nevada, Butte-Lassen-Modoc-Plumas, Shasta-
Siskiyou-Trinity, Del Norte-Humboldt, Sutter-Sierra-Yuba, Colusa-Glenn-Tehama, Mariposa-
Tuolumne-Inyo-Mono, and Alpine-Amador-Calaveras. Among these high prevalence counties,
Lake, Colusa-Glenn-Tehama, Del Norte-Humboldt, and Mendocino all had high age-adjusted
incidence rates in 2003 to 2012, ranging from 1st (Lake) to 10th (Mendocino).10 Some of these
high prevalence counties had low age-adjusted incidence rates in 2003 to 2012, including San
Mateo (30th), Nevada (32nd), El Dorado (35th), and Marin (44th), which may indicate good
survivorship (see Appendix Table A20).10
Fresno and Monterey-San Benito were the only counties in the lowest prevalence category.
These counties also had low age-adjusted incidence rates from 2003 to 2012 (33rd and 45th,
respectively).10 Tobacco products and alcohol are risk factors for laryngeal cancer.35 The median
age at diagnosis is 65 years, and the five-year relative survival for all stages is 60.7%.35
Cancer Prevalence in California Counties | Page 56
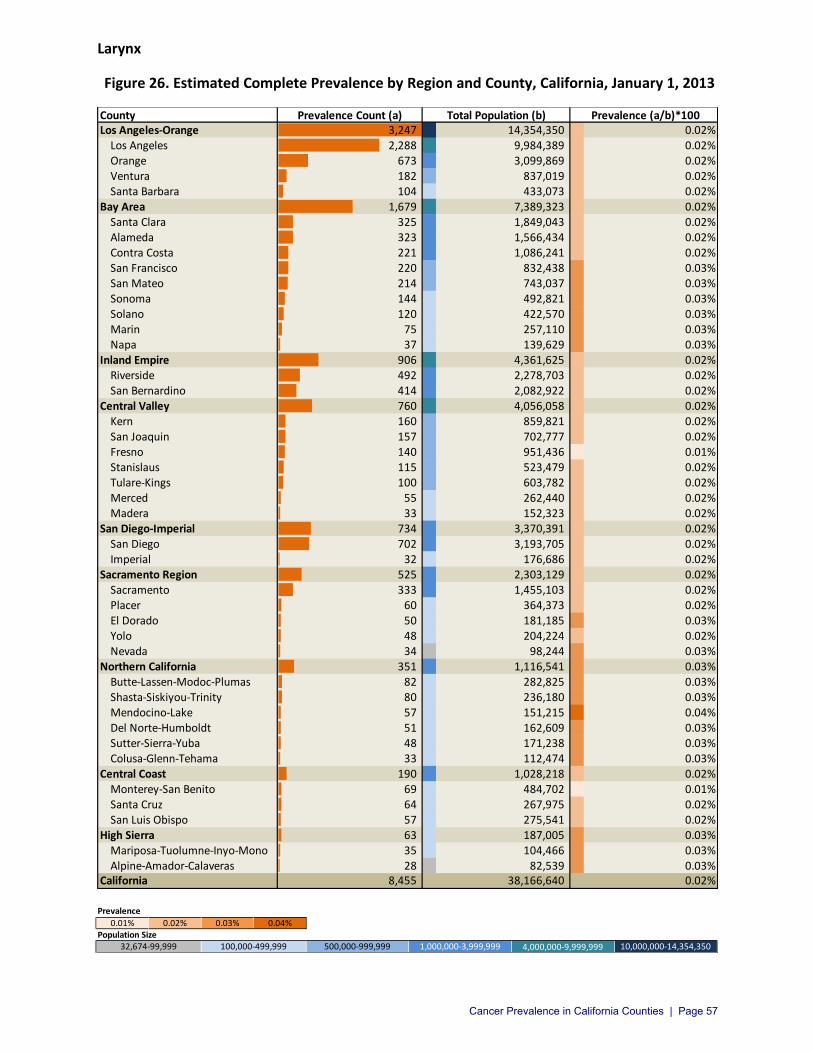
County Prevalence Count (a)Los Angeles-Orange 3,247 14,354,350 0.02%
Los Angeles 2,288 9,984,389 0.02%Orange 673 3,099,869 0.02%Ventura 182 837,019 0.02%Santa Barbara 104 433,073 0.02%
Bay Area 1,679 7,389,323 0.02%Santa Clara 325 1,849,043 0.02%Alameda 323 1,566,434 0.02%Contra Costa 221 1,086,241 0.02%San Francisco 220 832,438 0.03%San Mateo 214 743,037 0.03%Sonoma 144 492,821 0.03%Solano 120 422,570 0.03%Marin 75 257,110 0.03%Napa 37 139,629 0.03%
Inland Empire 906 4,361,625 0.02%Riverside 492 2,278,703 0.02%San Bernardino 414 2,082,922 0.02%
Central Valley 760 4,056,058 0.02%Kern 160 859,821 0.02%San Joaquin 157 702,777 0.02%Fresno 140 951,436 0.01%Stanislaus 115 523,479 0.02%Tulare-Kings 100 603,782 0.02%Merced 55 262,440 0.02%Madera 33 152,323 0.02%
San Diego-Imperial 734 3,370,391 0.02%San Diego 702 3,193,705 0.02%Imperial 32 176,686 0.02%
Sacramento Region 525 2,303,129 0.02%Sacramento 333 1,455,103 0.02%Placer 60 364,373 0.02%El Dorado 50 181,185 0.03%Yolo 48 204,224 0.02%Nevada 34 98,244 0.03%
Northern California 351 1,116,541 0.03%Butte-Lassen-Modoc-Plumas 82 282,825 0.03%Shasta-Siskiyou-Trinity 80 236,180 0.03%Mendocino-Lake 57 151,215 0.04%Del Norte-Humboldt 51 162,609 0.03%Sutter-Sierra-Yuba 48 171,238 0.03%Colusa-Glenn-Tehama 33 112,474 0.03%
Central Coast 190 1,028,218 0.02%Monterey-San Benito 69 484,702 0.01%Santa Cruz 64 267,975 0.02%San Luis Obispo 57 275,541 0.02%
High Sierra 63 187,005 0.03%Mariposa-Tuolumne-Inyo-Mono 35 104,466 0.03%Alpine-Amador-Calaveras 28 82,539 0.03%
California 8,455 38,166,640 0.02%
Total Population (b) Prevalence (a/b)*100
Prevalence
0.01% 0.02% 0.03% 0.04%Population Size
500,000-999,999 1,000,000-3,999,999 4,000,000-9,999,999 10,000,000-14,354,350100,000-499,99932,674-99,999
Larynx
Figure 26. Estimated Complete Prevalence by Region and County, California, January 1, 2013
Cancer Prevalence in California Counties | Page 57

58
Pancreas
The complete prevalence by region and county for cancer of the pancreas is shown in Figure 27.
Overall, 5,849 people with a history of cancer of the pancreas were alive in California on
January 1, 2013. Mariposa-Tuolumne had the highest prevalence, followed by El Dorado and
Nevada. These counties had high age-adjusted incidence rates for 2003 to 2012, ranking 2nd (El
Dorado), 6th (Nevada), and 13th (Mariposa-Tuolumne).10 Lake and Napa counties had high age-
adjusted incidence rates for 2003 to 2012 (1st and 5th in the state, respectively), but were in
lower prevalence groups (0.02%), which may indicate poor survivorship (see Appendix Table
A21).10
Los Angeles, Riverside, San Bernardino, Fresno, San Joaquin, Kern, Tulare-Kings, Stanislaus,
Merced, San Diego-Imperial, Sutter-Sierra-Yuba-Butte-Lassen-Modoc-Plumas, San Luis Obispo
had low prevalence. Most of these counties also had low age-adjusted incidence rates for 2003
to 2012, except for Butte, Merced, and San Joaquin, which ranked 3rd, 4th, and 16th in the state,
respectively (see Appendix Table A21).10 A low prevalence but high incidence can indicate poor
survivorship. Pancreatic cancer has a very poor survival, with a five-year relative survival for all
stages of only 7.6%.5 The median age at diagnosis is 70 years, and risk factors include smoking,
being overweight, and having a history of diabetes or chronic pancreatitis.36
Cancer Prevalence in California Counties | Page 58

County Prevalence Count (a)Los Angeles-Orange 2,203 14,354,350 0.02%
Los Angeles 1,488 9,984,389 0.01%Orange 507 3,099,869 0.02%Ventura 136 837,019 0.02%Santa Barbara 72 433,073 0.02%
Bay Area 1,350 7,389,323 0.02%Santa Clara 307 1,849,043 0.02%Alameda 246 1,566,434 0.02%Contra Costa 205 1,086,241 0.02%San Francisco 194 832,438 0.02%San Mateo 145 743,037 0.02%Sonoma 95 492,821 0.02%Solano 67 422,570 0.02%Marin 62 257,110 0.02%Napa 29 139,629 0.02%
Inland Empire 497 4,361,625 0.01%Riverside 274 2,278,703 0.01%San Bernardino 223 2,082,922 0.01%
Central Valley 520 4,056,058 0.01%Fresno 126 951,436 0.01%San Joaquin 90 702,777 0.01%Kern 85 859,821 0.01%Tulare-Kings 82 603,782 0.01%Stanislaus 69 523,479 0.01%Merced 36 262,440 0.01%
San Diego-Imperial 467 3,370,391 0.01%San Diego-Imperial 467 3,370,391 0.01%
Sacramento Region 411 2,303,129 0.02%Sacramento-Yolo 261 1,659,327 0.02%Placer 77 364,373 0.02%El Dorado 46 181,185 0.03%Nevada 27 98,244 0.03%
Northern California 178 1,116,541 0.02%Sutter-Sierra-Yuba-Butte-Lassen-Modoc-Plumas 64 454,063 0.01%Colusa-Glenn-Tehama-Mendocino-Lake 45 263,689 0.02%Shasta-Siskiyou-Trinity 40 236,180 0.02%Del Norte-Humboldt 29 162,609 0.02%
Central Coast 170 1,028,218 0.02%Monterey-San Benito 84 484,702 0.02%Santa Cruz 45 267,975 0.02%San Luis Obispo 41 275,541 0.01%
High Sierra 53 187,005 0.03%Mariposa-Tuolumne 27 71,792 0.04%Alpine-Amador-Calaveras-Inyo-Mono 26 115,213 0.02%
California 5,849 38,166,640 0.02%
Total Population (b) Prevalence (a/b)*100
Prevalence0.01% 0.02% 0.03% 0.04%
Population Size
500,000-999,999 1,000,000-3,999,999 4,000,000-9,999,999 10,000,000-14,354,350100,000-499,99932,674-99,999
Pancreas
Figure 27. Estimated Complete Prevalence by Region and County, California, January 1, 2013
Cancer Prevalence in California Counties | Page 59
60
Conclusion
This report provides an estimate of the burden of cancer in California. More than 1.4 million
people with a history of one of the twenty-one cancers described in this report were alive on
January 1, 2013. As detailed in this report, there are differences in cancer prevalence by cancer
site, age group, and county. Geographic differences may be due to regional and county
variations in risk factors or the availability of high quality cancer care. Disparities in access to
quality cancer care can result in differences in screening and treatment, which can affect
survivorship.
Because cancer prevalence is a function of both incidence and mortality, prevalence data need
to be interpreted carefully when pursuing interventions to lower the population burden of
cancer. For many cancer sites, differences in prevalence are not directly related to differences
in incidence but instead to differences in survivorship. Local health officers, can use the
prevalence estimates calculated in this report, in conjunction with incidence data, to inform the
assessment of cancer care in their counties. Findings may direct local resources towards
improvements in cancer prevention and care programs such as increased screening and early
detection efforts, cancer education classes, programs to decrease risk factors such as smoking,
support groups, and addressing barriers to treatment such as transportation to treatment and
lodging during treatment.
Cancer Prevalence in California Counties | Page 60

61
References
1. Ryerson AB, Eheman CR, Altekruse SF, et al. Annual Report to the Nation on the Status ofCancer, 1975-2012, featuring the increasing incidence of liver cancer. Cancer 2016;122:1312-37. 2. Farina KL. The economics of cancer care in the United States. The American journal of managedcare 2012;18:Sp38-9. 3. Mariotto AB, Yabroff KR, Shao Y, Feuer EJ, Brown ML. Projections of the cost of cancer care inthe United States: 2010-2020. Journal of the National Cancer Institute 2011;103:117-28. 4. Howlander N, Noone AM, Krapcho M, Garshell J, Miller D, et al. SEER Cancer Statistics Review, 1975-2013. National Cancer Institute. Bethesda, MD, based on November 2015 SEER data submission.2015.5. American Cancer Society, California Department of Public Health, California Cancer Registry.California Cancer Facts & Figures 2016. Oakland, CA: American Cancer Society, Inc.; 2016. 6. Maguire FB GB, Chen Y, Zhao QY, Morris CR, Parikh-Patel A, Kizer KW, Kwong SL, Snipes KP.Cancer in California, 1988-2013. Sacramento, CA; 2016. 7. American Cancer Society. Cancer Treatment and Survivorship Facts & Figures 2016-2017.Atlanta: American Cancer Society; 2016. 8. Children's Oncology Group. Long-Term Follow-up Guidelines for Survivors of Childhood,Adolescent and Young Adult Cancers. Monrovia, CA; 2013. 9. Yang J SC, Harrati A, Clarke C, Keegan THM, Gomez SL,. Developing an area-basedsocioeconomic measure from American Community Survey data. Fremont, California: Cancer Prevention Institute of California; 2014. 10. Age-Adjusted Cancer Incidence Rates by County in California, 2003-2012, based on December2015 extract. California Cancer Registry, 2015. (Accessed 5 Dec 2016, 2016, at http://cancer-rates.info/ca.) 11. SEER Cancer Statistics Fact Sheets: Female Breast Cancer. 2016. (Accessed 12/16/2016, athttps://seer.cancer.gov/statfacts/html/breast.html.) 12. SEER Cancer Fact Sheets: Prostate Cancer. 2016. (Accessed 12/16/2016, athttps://seer.cancer.gov/statfacts/html/prost.html.) 13. SEER Cancer Statistics Fact Sheets: Colon and Rectum Cancer. 2016. (Accessed 12/20/2016, athttps://seer.cancer.gov/statfacts/html/colorect.html.) 14. O'Grady TJ, Gates MA, Boscoe FP. Thyroid cancer incidence attributable to overdiagnosis in theUnited States 1981-2011. International journal of cancer 2015;137:2664-73. 15. Chen AY, Jemal A, Ward EM. Increasing incidence of differentiated thyroid cancer in the UnitedStates, 1988-2005. Cancer 2009;115:3801-7. 16. Aschebrook-Kilfoy B, Grogan RH, Ward MH, Kaplan E, Devesa SS. Follicular thyroid cancerincidence patterns in the United States, 1980-2009. Thyroid : official journal of the American Thyroid Association 2013;23:1015-21. 17. Schmid D, Ricci C, Behrens G, Leitzmann MF. Adiposity and risk of thyroid cancer: a systematicreview and meta-analysis. Obesity reviews : an official journal of the International Association for the Study of Obesity 2015;16:1042-54. 18. Endometrial Cancer Treatment (PDQ), General Information about Endometrial Cancer. 2016.(Accessed 12/5/2016, at https://www.cancer.gov/types/uterine/patient/endometrial-treatment-pdq#section/all ) 19. SEER Cancer Statistics Fact Sheets: Bladder Cancer. 2016. (Accessed 12/6/2016, athttp://seer.cancer.gov/statfacts/html/urinb.html.)
Cancer Prevalence in California Counties | Page 61
62
20. SEER Cancer Statistics Fact Sheets: Non-Hodgkin Lymphoma. 2016. (Accessed 12/6/2016, athttps://seer.cancer.gov/statfacts/html/nhl.html.) 21. SEER Cancer Statistics Fact Sheets: Lung and Bronchus Cancer. 2016. (Accessed 12/7/2016, athttps://seer.cancer.gov/statfacts/html/lungb.html.) 22. US Department of Health & Human Services. The Health Consequences of Smoking-50 Years ofProgress: A Report of the Surgeon General. Centers for Disease Control and Prevention, National Center for Chronic Disease Prevention and Health Promotion and Office on Smoking and Health,Atlanta; 2014. 23. Centers for Disease Control and Prevention. Current Cigarette Smoking Among Adults-UnitedStates, 2005-2014. Morbidity and Mortality Weekly Report 2015;64:1233-40. 24. SEER Cancer Statistics Fact Sheets: Kidney and Renal Pelvis Cancer. 2016. (Accessed athttps://seer.cancer.gov/statfacts/html/kidrp.html.) 25. Leukemia. 2016. (Accessed 12/9/2016, at https://www.cancer.gov/types/leukemia.)26. SEER Cancer Statistics Fact Sheets: Cervix Uteri Cancer. 2016. (Accessed 12/12/2016, athttps://seer.cancer.gov/statfacts/html/cervix.html.) 27. Oropharyngeal Cancer Treatment (PDQ)-Patient Version, General Information aboutOropharyngeal Cancer 2016. (Accessed 12/13/2016, at https://www.cancer.gov/types/head-and-neck/patient/oropharyngeal-treatment-pdq.) 28. SEER Cancer Statistics Fact Sheets: Testis Cancer. 2016. (Accessed 12/14/2016, athttps://seer.cancer.gov/statfacts/html/testis.html.) 29. Testicular Cancer Treatment (PDQ)-Patient Version. 2016. (Accessed 12/14/2016 at
30. SEER Cancer Statistics Fact Sheets: Ovarian Cancer. 2016. (Accessed 12/14/2016, athttps://seer.cancer.gov/statfacts/html/ovary.html.) 31. SEER Cancer Statistics Fact Sheets: Hodgkin Lymphoma. 2016. (Accessed 12/14/2016, athttps://seer.cancer.gov/statfacts/html/hodg.html.) 32. SEER Cancer Statistics Fact Sheets: Brain and Other Nervous System Cancer. 2016. (Accessed12/15/2016, at https://seer.cancer.gov/statfacts/html/brain.html.) 33. SEER Cancer Statistics Fact Sheets: Stomach Cancer. 2016. (Accessed 12/15/2016, athttps://seer.cancer.gov/statfacts/html/stomach.html.) 34. SEER Cancer Statistics Fact Sheets: Liver and Intrahepatic Bile Duct Cancer. 2016. (Accessed12/15/2016, at https://seer.cancer.gov/statfacts/html/livibd.html.) 35. SEER Cancer Statistics Fact Sheets: Larynx Cancer. 2016. (Accessed 12/15/2016, athttps://seer.cancer.gov/statfacts/html/laryn.html.) 36. SEER Cancer Statistics Fact Sheets: Pancreas Cancer. 2016. (Accessed 12/16/2016, athttps://seer.cancer.gov/statfacts/html/pancreas.html.)
Cancer Prevalence in California Counties | Page 62
https://www.cancer.gov/types/testicular/patient/testicular-treatment-pdq.)

63
Appendix A
Table A1. Invasive Cancer Incidence Rates for Female Breast, 2003 - 2012 Table A2. Invasive Cancer Incidence Rates for Prostate, 2003 - 2012
County Population at Risk Cases Age-adjusted Rate County Population at Risk Cases Age-adjusted Rate
Mariposa - Tuolumne 353404 786 146.22 Marin 1224264 2739 173.29
Placer 1691072 2950 143.57 Santa Cruz 1282788 2060 173.2
Marin 1262843 2492 142.86 San Benito 276476 376 171.46
Sonoma 2411753 4060 138.16 Monterey 2117475 2692 162.22
Butte 1098658 1808 136.86 Napa 668006 1224 160.6
San Mateo 3587812 5750 135.71 Contra Costa 5001174 7807 158.86
Yolo 994849 1205 134.15 San Luis Obispo 1355401 2366 155.29
Contra Costa 5245888 7904 133.77 Solano 2058544 2887 153.22
Nevada 494169 978 132.76 Shasta 866232 1628 149.19
Ventura 4065648 5708 132.28 San Mateo 3473681 5231 148.9
Alpine - Amador - Calaveras 404796 825 131.45 Santa Clara 8723646 10999 148.05
Napa 669875 1084 131.13 Butte 1074587 1762 146.18
El Dorado 886389 1460 130.5 El Dorado 885390 1592 146.08
San Diego 15053408 20231 129.94 San Joaquin 3337470 3867 144.56
Santa Barbara 2071864 2871 129.7 Placer 1616095 2656 143.69
San Luis Obispo 1288381 2055 129.38 Alameda 7268767 9279 143.42
Sacramento 7087050 9441 129.23 San Bernardino 9889934 10162 143.02
Solano 2054468 2833 129.16 Inyo - Mono 166994 286 142.24
Santa Cruz 1290029 1757 126.79 Sacramento 6810295 8315 140.21
Shasta 898261 1474 126.54 Ventura 4020639 5060 139.4
Orange 15031636 19670 125.42 Alpine - Amador - Calaveras 439035 952 139.27
Alameda 7547419 9832 123.4 Riverside 10271524 12745 138.52
Santa Clara 8621572 10986 123.11 Del Norte - Humboldt 819994 1161 137.21
Del Norte - Humboldt 790146 1124 120.09 Sonoma 2335440 3440 136.58
San Francisco 3885374 5386 119.99 San Diego 15154896 17799 136.36
Mendocino 438847 678 119.53 Los Angeles 48321199 53461 135.64
Inyo - Mono 156192 235 118.13 Nevada 483088 997 135.5
Riverside 10335856 12176 117.14 Santa Barbara 2086240 2594 133.63
Colusa - Glenn - Tehama 549664 747 117.11 Mariposa - Tuolumne 386675 771 133.45
Los Angeles 49649378 58023 116.91 Madera 700115 889 133.44
Stanislaus 2559720 2896 116.58 Fresno 4502635 4562 132.95
San Joaquin 3353281 3686 114.23 Orange 14745479 17194 132.91
Sierra - Yuba 360489 402 113.47 Colusa - Glenn - Tehama 554760 818 132.72
Siskiyou - Trinity 290323 484 112.65 Siskiyou - Trinity 290935 588 130.45
Kern 3874899 3890 112.58 Imperial 853421 854 129.68
Fresno 4510240 4654 112.46 Yolo 947564 947 127.35
San Bernardino 9965409 10028 112.22 Kings 844401 639 127.03
Monterey 1990369 2201 112.1 Mendocino 437483 660 126.5
San Benito 273656 282 108.14 Kern 4119412 3684 123.93
Kings 641970 584 107.85 Tulare 2123395 1897 123
Lake 319922 483 107.76 Stanislaus 2507903 2509 122.73
Merced 1235326 1142 107.26 Merced 1250865 1076 122.72
Lassen - Modoc - Plumas 273073 390 106.32 Lassen - Modoc - Plumas 372610 495 121.39
Sutter 460820 519 106.01 Sierra - Yuba 366689 387 118.8
Tulare 2116965 1956 105.21 San Francisco 3993664 4867 118.71
Madera 752878 768 103.02 Lake 319612 521 115.85
Imperial 796374 745 97.97 Sutter 455610 449 105.34
STATE 183692415 231639 122.19 STATE 181802502 219944 138.68
Note: All rates are per 100,000 and age-adjusted to the 2000 U.S. Standard Population; Rates generated on Dec 1, 2016; Based on December 2015 Extract.
Cancer Prevalence in California Counties | Page 63
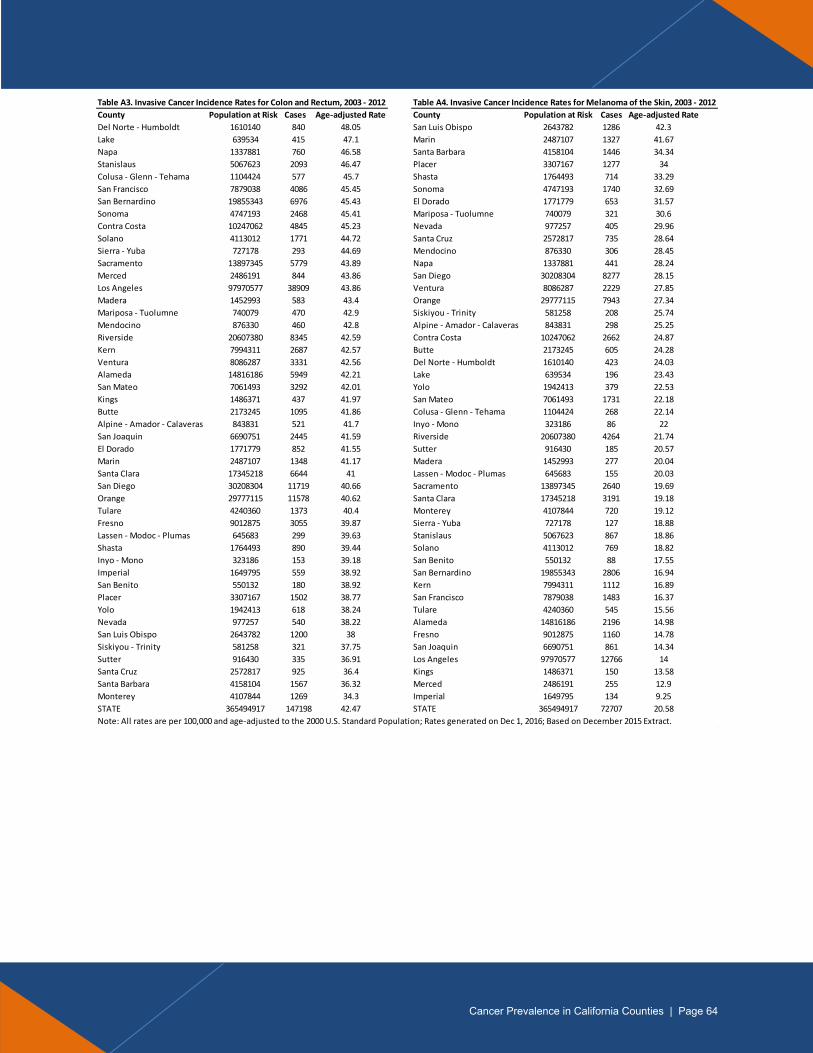
64
Table A3. Invasive Cancer Incidence Rates for Colon and Rectum, 2003 - 2012 Table A4. Invasive Cancer Incidence Rates for Melanoma of the Skin, 2003 - 2012
County Population at Risk Cases Age-adjusted Rate County Population at Risk Cases Age-adjusted Rate
Del Norte - Humboldt 1610140 840 48.05 San Luis Obispo 2643782 1286 42.3
Lake 639534 415 47.1 Marin 2487107 1327 41.67
Napa 1337881 760 46.58 Santa Barbara 4158104 1446 34.34
Stanislaus 5067623 2093 46.47 Placer 3307167 1277 34
Colusa - Glenn - Tehama 1104424 577 45.7 Shasta 1764493 714 33.29
San Francisco 7879038 4086 45.45 Sonoma 4747193 1740 32.69
San Bernardino 19855343 6976 45.43 El Dorado 1771779 653 31.57
Sonoma 4747193 2468 45.41 Mariposa - Tuolumne 740079 321 30.6
Contra Costa 10247062 4845 45.23 Nevada 977257 405 29.96
Solano 4113012 1771 44.72 Santa Cruz 2572817 735 28.64
Sierra - Yuba 727178 293 44.69 Mendocino 876330 306 28.45
Sacramento 13897345 5779 43.89 Napa 1337881 441 28.24
Merced 2486191 844 43.86 San Diego 30208304 8277 28.15
Los Angeles 97970577 38909 43.86 Ventura 8086287 2229 27.85
Madera 1452993 583 43.4 Orange 29777115 7943 27.34
Mariposa - Tuolumne 740079 470 42.9 Siskiyou - Trinity 581258 208 25.74
Mendocino 876330 460 42.8 Alpine - Amador - Calaveras 843831 298 25.25
Riverside 20607380 8345 42.59 Contra Costa 10247062 2662 24.87
Kern 7994311 2687 42.57 Butte 2173245 605 24.28
Ventura 8086287 3331 42.56 Del Norte - Humboldt 1610140 423 24.03
Alameda 14816186 5949 42.21 Lake 639534 196 23.43
San Mateo 7061493 3292 42.01 Yolo 1942413 379 22.53
Kings 1486371 437 41.97 San Mateo 7061493 1731 22.18
Butte 2173245 1095 41.86 Colusa - Glenn - Tehama 1104424 268 22.14
Alpine - Amador - Calaveras 843831 521 41.7 Inyo - Mono 323186 86 22
San Joaquin 6690751 2445 41.59 Riverside 20607380 4264 21.74
El Dorado 1771779 852 41.55 Sutter 916430 185 20.57
Marin 2487107 1348 41.17 Madera 1452993 277 20.04
Santa Clara 17345218 6644 41 Lassen - Modoc - Plumas 645683 155 20.03
San Diego 30208304 11719 40.66 Sacramento 13897345 2640 19.69
Orange 29777115 11578 40.62 Santa Clara 17345218 3191 19.18
Tulare 4240360 1373 40.4 Monterey 4107844 720 19.12
Fresno 9012875 3055 39.87 Sierra - Yuba 727178 127 18.88
Lassen - Modoc - Plumas 645683 299 39.63 Stanislaus 5067623 867 18.86
Shasta 1764493 890 39.44 Solano 4113012 769 18.82
Inyo - Mono 323186 153 39.18 San Benito 550132 88 17.55
Imperial 1649795 559 38.92 San Bernardino 19855343 2806 16.94
San Benito 550132 180 38.92 Kern 7994311 1112 16.89
Placer 3307167 1502 38.77 San Francisco 7879038 1483 16.37
Yolo 1942413 618 38.24 Tulare 4240360 545 15.56
Nevada 977257 540 38.22 Alameda 14816186 2196 14.98
San Luis Obispo 2643782 1200 38 Fresno 9012875 1160 14.78
Siskiyou - Trinity 581258 321 37.75 San Joaquin 6690751 861 14.34
Sutter 916430 335 36.91 Los Angeles 97970577 12766 14
Santa Cruz 2572817 925 36.4 Kings 1486371 150 13.58
Santa Barbara 4158104 1567 36.32 Merced 2486191 255 12.9
Monterey 4107844 1269 34.3 Imperial 1649795 134 9.25
STATE 365494917 147198 42.47 STATE 365494917 72707 20.58
Note: All rates are per 100,000 and age-adjusted to the 2000 U.S. Standard Population; Rates generated on Dec 1, 2016; Based on December 2015 Extract.
Cancer Prevalence in California Counties | Page 64

65
Table A5. Invasive Cancer Incidence Rates for Thyroid, 2003 - 2012 Table A6. Invasive Cancer Incidence Rates for Uterine Corpus, 2003 - 2012
County Population at Risk Cases Age-adjusted Rate County Population at Risk Cases Age-adjusted Rate
Placer 3307167 492 14.22 Del Norte - Humboldt 790146 271 27.83
Ventura 8086287 1066 13.1 Solano 2054468 589 25.96
Fresno 9012875 1049 12.88 Lassen - Modoc - Plumas 273073 96 25.69
Orange 29777115 3647 12.19 San Francisco 3885374 1139 24.99
Monterey 4107844 474 12.09 Alameda 7547419 2010 24.96
El Dorado 1771779 218 11.78 San Mateo 3587812 1072 24.71
Shasta 1764493 219 11.54 Sonoma 2411753 748 24.26
Kern 7994311 821 11.31 Contra Costa 5245888 1459 24.14
Los Angeles 97970577 10685 11.15 Sacramento 7087050 1790 23.96
Santa Cruz 2572817 293 11.14 Butte 1098658 319 23.49
Santa Barbara 4158104 449 11.03 Napa 669875 200 23.29
Merced 2486191 238 10.98 Mendocino 438847 139 23.27
Madera 1452993 154 10.95 Los Angeles 49649378 11636 23.19
San Diego 30208304 3278 10.91 Santa Clara 8621572 2033 22.63
San Mateo 7061493 809 10.63 Ventura 4065648 996 22.6
Sacramento 13897345 1449 10.54 San Diego 15053408 3587 22.56
Santa Clara 17345218 1840 10.48 San Bernardino 9965409 2033 22.38
Stanislaus 5067623 497 10.46 Marin 1262843 414 22.23
San Luis Obispo 2643782 286 10.37 Lake 319922 96 22.02
Yolo 1942413 184 10.3 Yolo 994849 196 21.86
Colusa - Glenn - Tehama 1104424 111 9.97 Santa Barbara 2071864 489 21.64
Sutter 916430 87 9.73 Colusa - Glenn - Tehama 549664 137 21.41
San Francisco 7879038 862 9.65 Sierra - Yuba 360489 77 21.35
Riverside 20607380 1896 9.64 San Benito 273656 54 21.35
Kings 1486371 133 9.61 Orange 15031636 3371 21.18
San Joaquin 6690751 593 9.57 Tulare 2116965 397 21.08
Alpine - Amador - Calaveras 843831 86 9.42 Nevada 494169 156 20.94
Nevada 977257 99 9.35 Placer 1691072 442 20.89
San Benito 550132 47 9.19 San Joaquin 3353281 680 20.59
Butte 2173245 200 9.14 Merced 1235326 220 20.54
Del Norte - Humboldt 1610140 154 9.12 Shasta 898261 245 20.53
Solano 4113012 376 9.03 Siskiyou - Trinity 290323 94 20.38
Lassen - Modoc - Plumas 645683 68 9.01 Riverside 10335856 2131 20.32
San Bernardino 19855343 1636 8.97 San Luis Obispo 1288381 333 20.19
Sonoma 4747193 446 8.9 Monterey 1990369 397 20.11
Contra Costa 10247062 952 8.9 Stanislaus 2559720 509 20.06
Marin 2487107 248 8.58 Mariposa - Tuolumne 353404 114 19.97
Tulare 4240360 309 8.42 Kern 3874899 692 19.76
Inyo - Mono 323186 32 8.26 Santa Cruz 1290029 281 19.74
Alameda 14816186 1254 8.21 Imperial 796374 147 19.3
Napa 1337881 118 8.2 El Dorado 886389 224 19.05
Imperial 1649795 117 7.69 Inyo - Mono 156192 36 18.21
Mariposa - Tuolumne 740079 63 7.29 Sutter 460820 91 18.1
Sierra - Yuba 727178 50 7.23 Madera 752878 130 17.5
Lake 639534 50 6.86 Fresno 4510240 714 17.11
Siskiyou - Trinity 581258 51 6.82 Kings 641970 92 16.97
Mendocino 876330 58 6.01 Alpine - Amador - Calaveras 404796 108 16.57
STATE 365494917 38244 10.55 STATE 183692415 43184 22.42
Note: All rates are per 100,000 and age-adjusted to the 2000 U.S. Standard Population; Rates generated on Dec 1, 2016; Based on December 2015 Extract.
Cancer Prevalence in California Counties | Page 65

66
Table A7. Invasive and in situ Cancer Incidence Rates for Urinary Bladder, 2003 - 2012 Table A8. Invasive Cancer Incidence Rates for Non-Hodgkin Lymphoma, 2003 - 2012
County Population at Risk Cases Age-adjusted Rate County Population at Risk Cases Age-adjusted Rate
Lake 639534 262 29.08 San Benito 550132 102 22.29
Mendocino 876330 309 27.86 Marin 2487107 693 21.92
Siskiyou - Trinity 581258 237 27.7 Mariposa - Tuolumne 740079 241 21.89
Butte 2173245 704 26.49 San Mateo 7061493 1687 21.85
Shasta 1764493 583 25.53 Santa Cruz 2572817 532 21.18
Mariposa - Tuolumne 740079 280 24.9 Butte 2173245 540 21.13
Alpine - Amador - Calaveras 843831 322 24.63 Del Norte - Humboldt 1610140 367 21.02
El Dorado 1771779 499 24.62 Santa Clara 17345218 3406 20.98
Del Norte - Humboldt 1610140 419 24.26 San Francisco 7879038 1848 20.89
Sonoma 4747193 1301 24.2 Contra Costa 10247062 2196 20.64
Colusa - Glenn - Tehama 1104424 297 23.94 Colusa - Glenn - Tehama 1104424 250 20.39
Marin 2487107 771 23.72 Napa 1337881 328 20.38
Napa 1337881 392 23.21 Solano 4113012 803 20.05
Nevada 977257 340 23.07 Sonoma 4747193 1061 20.03
San Benito 550132 101 22.62 Monterey 4107844 740 20
Placer 3307167 873 22.39 San Diego 30208304 5770 19.91
Santa Cruz 2572817 540 21.96 Sierra - Yuba 727178 129 19.9
Contra Costa 10247062 2210 21.04 Ventura 8086287 1569 19.84
Santa Barbara 4158104 909 20.83 Mendocino 876330 210 19.63
Yolo 1942413 329 20.65 Placer 3307167 746 19.57
Inyo - Mono 323186 80 20.43 Yolo 1942413 326 19.49
Riverside 20607380 3955 20.36 Santa Barbara 4158104 834 19.46
Ventura 8086287 1535 20.03 Orange 29777115 5524 19.44
Monterey 4107844 718 19.97 San Luis Obispo 2643782 601 19.43
San Mateo 7061493 1562 19.96 Sutter 916430 178 19.34
Sacramento 13897345 2556 19.85 Alameda 14816186 2770 19.23
Merced 2486191 371 19.71 Kings 1486371 211 18.97
Stanislaus 5067623 861 19.63 Merced 2486191 369 18.79
San Luis Obispo 2643782 624 19.55 Shasta 1764493 409 18.53
San Diego 30208304 5497 19.33 Los Angeles 97970577 16547 18.46
Lassen - Modoc - Plumas 645683 142 19.24 Alpine - Amador - Calaveras 843831 231 18.42
San Bernardino 19855343 2792 19.11 Sacramento 13897345 2410 18.18
San Joaquin 6690751 1090 19.04 Fresno 9012875 1403 18.15
Solano 4113012 725 19.03 El Dorado 1771779 377 18.09
Kern 7994311 1129 18.81 Stanislaus 5067623 822 18.09
Sierra - Yuba 727178 120 18.57 Nevada 977257 256 17.85
Orange 29777115 5122 18.55 Kern 7994311 1124 17.43
Kings 1486371 180 18.16 Lake 639534 148 17.35
Santa Clara 17345218 2823 18 San Bernardino 19855343 2735 17.15
Tulare 4240360 597 17.98 Lassen - Modoc - Plumas 645683 130 17
Los Angeles 97970577 15074 17.48 Tulare 4240360 587 17
Fresno 9012875 1275 17.05 Riverside 20607380 3300 16.79
Madera 1452993 226 16.94 San Joaquin 6690751 985 16.58
Alameda 14816186 2278 16.65 Siskiyou - Trinity 581258 145 16.4
Sutter 916430 148 16.3 Imperial 1649795 237 16.37
San Francisco 7879038 1440 16.01 Madera 1452993 222 16.25
Imperial 1649795 166 12.06 Inyo - Mono 323186 64 16.21
STATE 365494917 64764 19.1 STATE 365494917 66163 18.99
Note: All rates are per 100,000 and age-adjusted to the 2000 U.S. Standard Population; Rates generated on Dec 1, 2016; Based on December 2015 Extract.
Cancer Prevalence in California Counties | Page 66
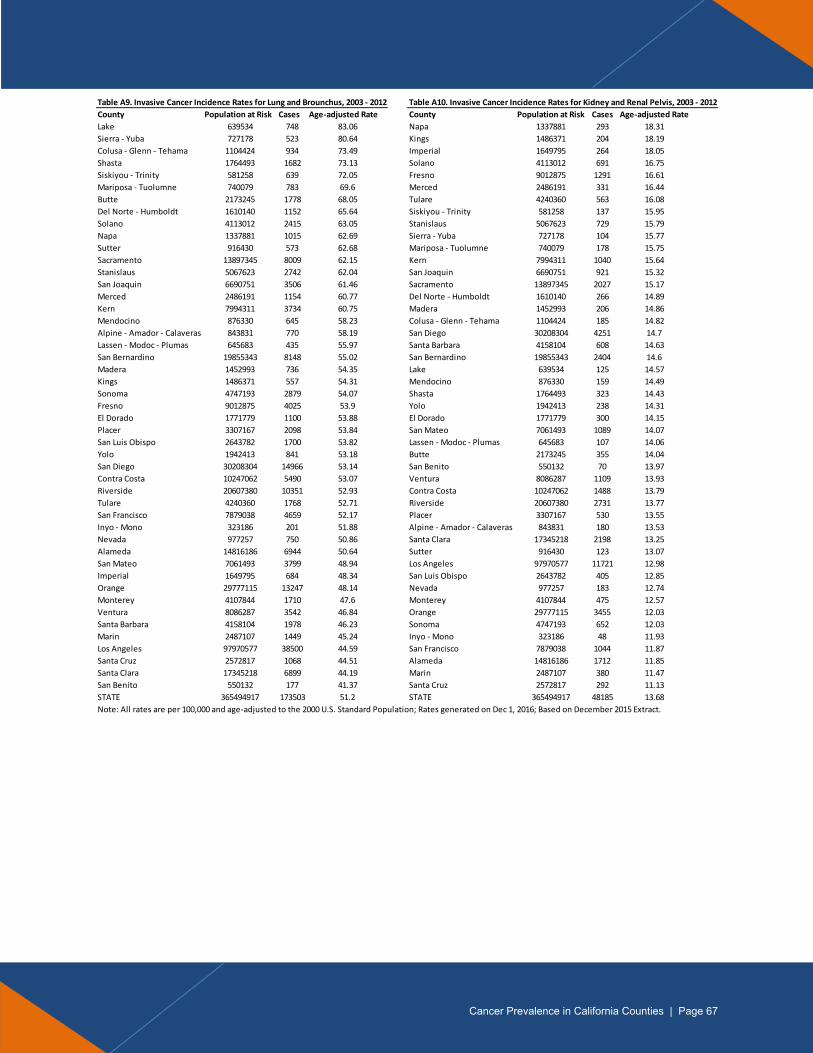
67
Table A9. Invasive Cancer Incidence Rates for Lung and Brounchus, 2003 - 2012 Table A10. Invasive Cancer Incidence Rates for Kidney and Renal Pelvis, 2003 - 2012
County Population at Risk Cases Age-adjusted Rate County Population at Risk Cases Age-adjusted Rate
Lake 639534 748 83.06 Napa 1337881 293 18.31
Sierra - Yuba 727178 523 80.64 Kings 1486371 204 18.19
Colusa - Glenn - Tehama 1104424 934 73.49 Imperial 1649795 264 18.05
Shasta 1764493 1682 73.13 Solano 4113012 691 16.75
Siskiyou - Trinity 581258 639 72.05 Fresno 9012875 1291 16.61
Mariposa - Tuolumne 740079 783 69.6 Merced 2486191 331 16.44
Butte 2173245 1778 68.05 Tulare 4240360 563 16.08
Del Norte - Humboldt 1610140 1152 65.64 Siskiyou - Trinity 581258 137 15.95
Solano 4113012 2415 63.05 Stanislaus 5067623 729 15.79
Napa 1337881 1015 62.69 Sierra - Yuba 727178 104 15.77
Sutter 916430 573 62.68 Mariposa - Tuolumne 740079 178 15.75
Sacramento 13897345 8009 62.15 Kern 7994311 1040 15.64
Stanislaus 5067623 2742 62.04 San Joaquin 6690751 921 15.32
San Joaquin 6690751 3506 61.46 Sacramento 13897345 2027 15.17
Merced 2486191 1154 60.77 Del Norte - Humboldt 1610140 266 14.89
Kern 7994311 3734 60.75 Madera 1452993 206 14.86
Mendocino 876330 645 58.23 Colusa - Glenn - Tehama 1104424 185 14.82
Alpine - Amador - Calaveras 843831 770 58.19 San Diego 30208304 4251 14.7
Lassen - Modoc - Plumas 645683 435 55.97 Santa Barbara 4158104 608 14.63
San Bernardino 19855343 8148 55.02 San Bernardino 19855343 2404 14.6
Madera 1452993 736 54.35 Lake 639534 125 14.57
Kings 1486371 557 54.31 Mendocino 876330 159 14.49
Sonoma 4747193 2879 54.07 Shasta 1764493 323 14.43
Fresno 9012875 4025 53.9 Yolo 1942413 238 14.31
El Dorado 1771779 1100 53.88 El Dorado 1771779 300 14.15
Placer 3307167 2098 53.84 San Mateo 7061493 1089 14.07
San Luis Obispo 2643782 1700 53.82 Lassen - Modoc - Plumas 645683 107 14.06
Yolo 1942413 841 53.18 Butte 2173245 355 14.04
San Diego 30208304 14966 53.14 San Benito 550132 70 13.97
Contra Costa 10247062 5490 53.07 Ventura 8086287 1109 13.93
Riverside 20607380 10351 52.93 Contra Costa 10247062 1488 13.79
Tulare 4240360 1768 52.71 Riverside 20607380 2731 13.77
San Francisco 7879038 4659 52.17 Placer 3307167 530 13.55
Inyo - Mono 323186 201 51.88 Alpine - Amador - Calaveras 843831 180 13.53
Nevada 977257 750 50.86 Santa Clara 17345218 2198 13.25
Alameda 14816186 6944 50.64 Sutter 916430 123 13.07
San Mateo 7061493 3799 48.94 Los Angeles 97970577 11721 12.98
Imperial 1649795 684 48.34 San Luis Obispo 2643782 405 12.85
Orange 29777115 13247 48.14 Nevada 977257 183 12.74
Monterey 4107844 1710 47.6 Monterey 4107844 475 12.57
Ventura 8086287 3542 46.84 Orange 29777115 3455 12.03
Santa Barbara 4158104 1978 46.23 Sonoma 4747193 652 12.03
Marin 2487107 1449 45.24 Inyo - Mono 323186 48 11.93
Los Angeles 97970577 38500 44.59 San Francisco 7879038 1044 11.87
Santa Cruz 2572817 1068 44.51 Alameda 14816186 1712 11.85
Santa Clara 17345218 6899 44.19 Marin 2487107 380 11.47
San Benito 550132 177 41.37 Santa Cruz 2572817 292 11.13
STATE 365494917 173503 51.2 STATE 365494917 48185 13.68
Note: All rates are per 100,000 and age-adjusted to the 2000 U.S. Standard Population; Rates generated on Dec 1, 2016; Based on December 2015 Extract.
Cancer Prevalence in California Counties | Page 67
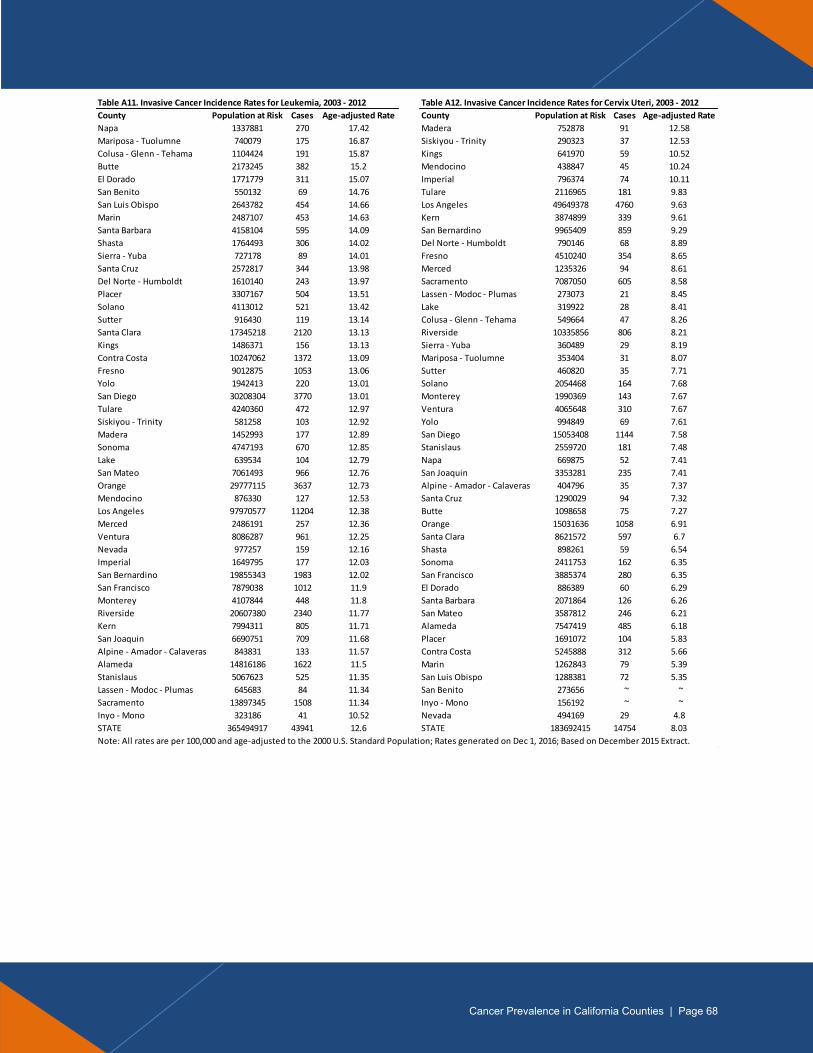
68
Table A11. Invasive Cancer Incidence Rates for Leukemia, 2003 - 2012 Table A12. Invasive Cancer Incidence Rates for Cervix Uteri, 2003 - 2012
County Population at Risk Cases Age-adjusted Rate County Population at Risk Cases Age-adjusted Rate
Napa 1337881 270 17.42 Madera 752878 91 12.58
Mariposa - Tuolumne 740079 175 16.87 Siskiyou - Trinity 290323 37 12.53
Colusa - Glenn - Tehama 1104424 191 15.87 Kings 641970 59 10.52
Butte 2173245 382 15.2 Mendocino 438847 45 10.24
El Dorado 1771779 311 15.07 Imperial 796374 74 10.11
San Benito 550132 69 14.76 Tulare 2116965 181 9.83
San Luis Obispo 2643782 454 14.66 Los Angeles 49649378 4760 9.63
Marin 2487107 453 14.63 Kern 3874899 339 9.61
Santa Barbara 4158104 595 14.09 San Bernardino 9965409 859 9.29
Shasta 1764493 306 14.02 Del Norte - Humboldt 790146 68 8.89
Sierra - Yuba 727178 89 14.01 Fresno 4510240 354 8.65
Santa Cruz 2572817 344 13.98 Merced 1235326 94 8.61
Del Norte - Humboldt 1610140 243 13.97 Sacramento 7087050 605 8.58
Placer 3307167 504 13.51 Lassen - Modoc - Plumas 273073 21 8.45
Solano 4113012 521 13.42 Lake 319922 28 8.41
Sutter 916430 119 13.14 Colusa - Glenn - Tehama 549664 47 8.26
Santa Clara 17345218 2120 13.13 Riverside 10335856 806 8.21
Kings 1486371 156 13.13 Sierra - Yuba 360489 29 8.19
Contra Costa 10247062 1372 13.09 Mariposa - Tuolumne 353404 31 8.07
Fresno 9012875 1053 13.06 Sutter 460820 35 7.71
Yolo 1942413 220 13.01 Solano 2054468 164 7.68
San Diego 30208304 3770 13.01 Monterey 1990369 143 7.67
Tulare 4240360 472 12.97 Ventura 4065648 310 7.67
Siskiyou - Trinity 581258 103 12.92 Yolo 994849 69 7.61
Madera 1452993 177 12.89 San Diego 15053408 1144 7.58
Sonoma 4747193 670 12.85 Stanislaus 2559720 181 7.48
Lake 639534 104 12.79 Napa 669875 52 7.41
San Mateo 7061493 966 12.76 San Joaquin 3353281 235 7.41
Orange 29777115 3637 12.73 Alpine - Amador - Calaveras 404796 35 7.37
Mendocino 876330 127 12.53 Santa Cruz 1290029 94 7.32
Los Angeles 97970577 11204 12.38 Butte 1098658 75 7.27
Merced 2486191 257 12.36 Orange 15031636 1058 6.91
Ventura 8086287 961 12.25 Santa Clara 8621572 597 6.7
Nevada 977257 159 12.16 Shasta 898261 59 6.54
Imperial 1649795 177 12.03 Sonoma 2411753 162 6.35
San Bernardino 19855343 1983 12.02 San Francisco 3885374 280 6.35
San Francisco 7879038 1012 11.9 El Dorado 886389 60 6.29
Monterey 4107844 448 11.8 Santa Barbara 2071864 126 6.26
Riverside 20607380 2340 11.77 San Mateo 3587812 246 6.21
Kern 7994311 805 11.71 Alameda 7547419 485 6.18
San Joaquin 6690751 709 11.68 Placer 1691072 104 5.83
Alpine - Amador - Calaveras 843831 133 11.57 Contra Costa 5245888 312 5.66
Alameda 14816186 1622 11.5 Marin 1262843 79 5.39
Stanislaus 5067623 525 11.35 San Luis Obispo 1288381 72 5.35
Lassen - Modoc - Plumas 645683 84 11.34 San Benito 273656 ~ ~
Sacramento 13897345 1508 11.34 Inyo - Mono 156192 ~ ~
Inyo - Mono 323186 41 10.52 Nevada 494169 29 4.8
STATE 365494917 43941 12.6 STATE 183692415 14754 8.03
Note: All rates are per 100,000 and age-adjusted to the 2000 U.S. Standard Population; Rates generated on Dec 1, 2016; Based on December 2015 Extract.
Cancer Prevalence in California Counties | Page 68
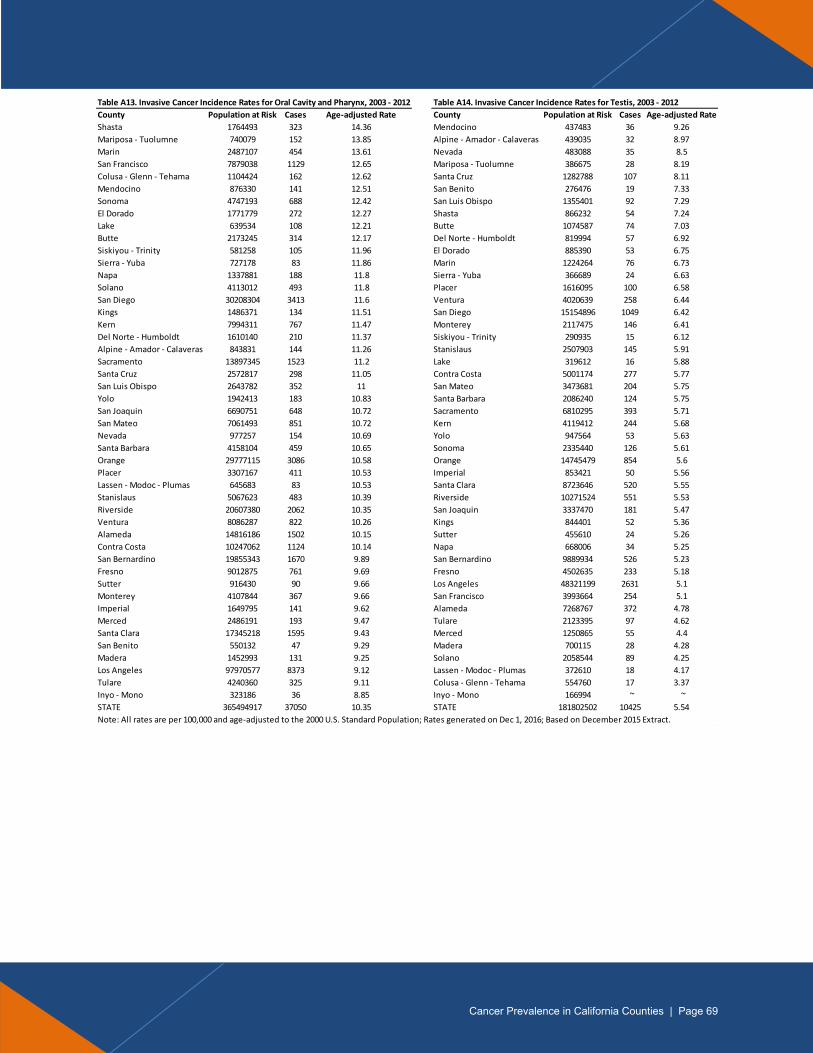
69
Table A13. Invasive Cancer Incidence Rates for Oral Cavity and Pharynx, 2003 - 2012 Table A14. Invasive Cancer Incidence Rates for Testis, 2003 - 2012
County Population at Risk Cases Age-adjusted Rate County Population at Risk Cases Age-adjusted Rate
Shasta 1764493 323 14.36 Mendocino 437483 36 9.26
Mariposa - Tuolumne 740079 152 13.85 Alpine - Amador - Calaveras 439035 32 8.97
Marin 2487107 454 13.61 Nevada 483088 35 8.5
San Francisco 7879038 1129 12.65 Mariposa - Tuolumne 386675 28 8.19
Colusa - Glenn - Tehama 1104424 162 12.62 Santa Cruz 1282788 107 8.11
Mendocino 876330 141 12.51 San Benito 276476 19 7.33
Sonoma 4747193 688 12.42 San Luis Obispo 1355401 92 7.29
El Dorado 1771779 272 12.27 Shasta 866232 54 7.24
Lake 639534 108 12.21 Butte 1074587 74 7.03
Butte 2173245 314 12.17 Del Norte - Humboldt 819994 57 6.92
Siskiyou - Trinity 581258 105 11.96 El Dorado 885390 53 6.75
Sierra - Yuba 727178 83 11.86 Marin 1224264 76 6.73
Napa 1337881 188 11.8 Sierra - Yuba 366689 24 6.63
Solano 4113012 493 11.8 Placer 1616095 100 6.58
San Diego 30208304 3413 11.6 Ventura 4020639 258 6.44
Kings 1486371 134 11.51 San Diego 15154896 1049 6.42
Kern 7994311 767 11.47 Monterey 2117475 146 6.41
Del Norte - Humboldt 1610140 210 11.37 Siskiyou - Trinity 290935 15 6.12
Alpine - Amador - Calaveras 843831 144 11.26 Stanislaus 2507903 145 5.91
Sacramento 13897345 1523 11.2 Lake 319612 16 5.88
Santa Cruz 2572817 298 11.05 Contra Costa 5001174 277 5.77
San Luis Obispo 2643782 352 11 San Mateo 3473681 204 5.75
Yolo 1942413 183 10.83 Santa Barbara 2086240 124 5.75
San Joaquin 6690751 648 10.72 Sacramento 6810295 393 5.71
San Mateo 7061493 851 10.72 Kern 4119412 244 5.68
Nevada 977257 154 10.69 Yolo 947564 53 5.63
Santa Barbara 4158104 459 10.65 Sonoma 2335440 126 5.61
Orange 29777115 3086 10.58 Orange 14745479 854 5.6
Placer 3307167 411 10.53 Imperial 853421 50 5.56
Lassen - Modoc - Plumas 645683 83 10.53 Santa Clara 8723646 520 5.55
Stanislaus 5067623 483 10.39 Riverside 10271524 551 5.53
Riverside 20607380 2062 10.35 San Joaquin 3337470 181 5.47
Ventura 8086287 822 10.26 Kings 844401 52 5.36
Alameda 14816186 1502 10.15 Sutter 455610 24 5.26
Contra Costa 10247062 1124 10.14 Napa 668006 34 5.25
San Bernardino 19855343 1670 9.89 San Bernardino 9889934 526 5.23
Fresno 9012875 761 9.69 Fresno 4502635 233 5.18
Sutter 916430 90 9.66 Los Angeles 48321199 2631 5.1
Monterey 4107844 367 9.66 San Francisco 3993664 254 5.1
Imperial 1649795 141 9.62 Alameda 7268767 372 4.78
Merced 2486191 193 9.47 Tulare 2123395 97 4.62
Santa Clara 17345218 1595 9.43 Merced 1250865 55 4.4
San Benito 550132 47 9.29 Madera 700115 28 4.28
Madera 1452993 131 9.25 Solano 2058544 89 4.25
Los Angeles 97970577 8373 9.12 Lassen - Modoc - Plumas 372610 18 4.17
Tulare 4240360 325 9.11 Colusa - Glenn - Tehama 554760 17 3.37
Inyo - Mono 323186 36 8.85 Inyo - Mono 166994 ~ ~
STATE 365494917 37050 10.35 STATE 181802502 10425 5.54
Note: All rates are per 100,000 and age-adjusted to the 2000 U.S. Standard Population; Rates generated on Dec 1, 2016; Based on December 2015 Extract.
Cancer Prevalence in California Counties | Page 69

70
Table A15. Invasive Cancer Incidence Rates for Ovary, 2003 - 2012 Table A16. Invasive Cancer Incidence Rates for Hodgkin Lymphoma, 2003 - 2012
County Population at Risk Cases Age-adjusted Rate County Population at Risk Cases Age-adjusted Rate
Nevada 494224 108 15.31 Siskiyou - Trinity 581217 22 3.87
Placer 1690872 307 14.65 Shasta 1764581 62 3.59
Marin 1263306 254 14.22 El Dorado 1771753 59 3.54
Sonoma 2412463 420 14.08 Solano 4113568 142 3.49
Butte 1098953 185 14 San Francisco 7882653 271 3.08
Solano 2055428 300 13.95 Lake 639527 22 3.07
Napa 670186 116 13.59 Mendocino 876475 27 3.02
El Dorado 886352 153 13.46 Nevada 977375 29 2.93
Mariposa - Tuolumne 353442 72 13.45 Sacramento 13898252 400 2.87
Alpine - Amador - Calaveras 404861 79 13.42 Santa Cruz 2572971 72 2.79
Alameda 7550673 1057 13.26 Del Norte - Humboldt 1610244 47 2.78
Del Norte - Humboldt 790197 125 13.23 Stanislaus 5068730 136 2.77
Mendocino 438942 78 13.22 San Joaquin 6691608 176 2.77
Tulare 2117794 248 13.15 Placer 3307221 88 2.74
San Mateo 3589922 561 13.07 Ventura 8087756 215 2.71
Lake 319882 62 13.04 Napa 1338322 37 2.69
Orange 15038209 2038 12.97 San Mateo 7064882 191 2.68
Ventura 4067179 557 12.9 Fresno 9013743 229 2.66
Los Angeles 49678941 6415 12.86 San Diego 30219158 803 2.6
San Luis Obispo 1288233 209 12.83 San Benito 550170 ~ ~
San Bernardino 9969085 1137 12.82 Santa Clara 17353490 437 2.53
Shasta 898249 148 12.68 Yolo 1943094 50 2.53
Contra Costa 5248376 748 12.67 Mariposa - Tuolumne 740101 18 2.5
Santa Cruz 1290361 173 12.59 Madera 1452985 35 2.5
San Diego 15060874 1978 12.54 Marin 2487557 59 2.49
Fresno 4511888 523 12.43 Imperial 1650904 41 2.46
San Francisco 3887453 566 12.41 Alameda 14819767 372 2.45
Santa Barbara 2072859 279 12.35 Los Angeles 98007955 2397 2.44
Santa Clara 8626602 1087 12.18 Butte 2173630 56 2.43
Sutter 460981 59 12.14 Santa Barbara 4158749 106 2.43
Yolo 995251 109 11.94 San Luis Obispo 2643455 67 2.41
Riverside 10340078 1247 11.93 Tulare 4240885 96 2.41
Kern 3876173 400 11.67 Lassen - Modoc - Plumas 645767 17 2.38
Inyo - Mono 156230 24 11.48 Contra Costa 10249027 240 2.38
Stanislaus 2560494 285 11.47 Orange 29784086 695 2.35
Monterey 1991270 228 11.37 Sonoma 4747576 114 2.35
Merced 1235715 123 11.34 Kings 1486399 34 2.31
Colusa - Glenn - Tehama 549624 72 11.21 San Bernardino 19860103 437 2.3
Sacramento 7088316 806 10.93 Monterey 4108255 92 2.3
San Joaquin 3354735 345 10.69 Riverside 20612241 454 2.25
Kings 642162 58 10.61 Merced 2486399 52 2.21
Lassen - Modoc - Plumas 273039 37 9.72 Sierra - Yuba 727225 15 2.2
Imperial 797454 75 9.71 Colusa - Glenn - Tehama 1104432 24 2.17
San Benito 273679 26 9.65 Kern 7995686 158 2.11
Siskiyou - Trinity 290332 45 9.41 Alpine - Amador - Calaveras 843965 18 2.05
Madera 753177 69 9.4 Inyo - Mono 323098 ~ ~
Sierra - Yuba 360491 30 8.95 Sutter 916412 ~ ~
STATE 183775007 24021 12.6 STATE 365593449 9146 2.5
Note: All rates are per 100,000 and age-adjusted to the 2000 U.S. Standard Population; Rates generated on Dec 1, 2016; Based on December 2015 Extract.
Cancer Prevalence in California Counties | Page 70
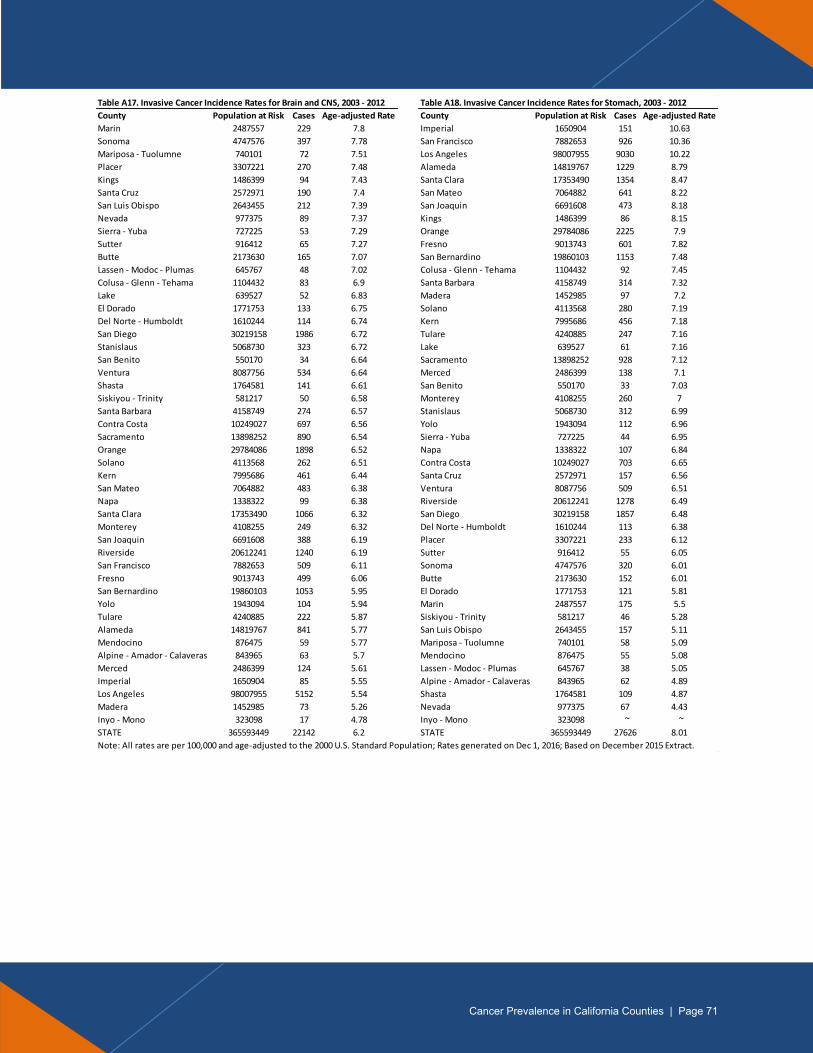
71
Table A17. Invasive Cancer Incidence Rates for Brain and CNS, 2003 - 2012 Table A18. Invasive Cancer Incidence Rates for Stomach, 2003 - 2012
County Population at Risk Cases Age-adjusted Rate County Population at Risk Cases Age-adjusted Rate
Marin 2487557 229 7.8 Imperial 1650904 151 10.63
Sonoma 4747576 397 7.78 San Francisco 7882653 926 10.36
Mariposa - Tuolumne 740101 72 7.51 Los Angeles 98007955 9030 10.22
Placer 3307221 270 7.48 Alameda 14819767 1229 8.79
Kings 1486399 94 7.43 Santa Clara 17353490 1354 8.47
Santa Cruz 2572971 190 7.4 San Mateo 7064882 641 8.22
San Luis Obispo 2643455 212 7.39 San Joaquin 6691608 473 8.18
Nevada 977375 89 7.37 Kings 1486399 86 8.15
Sierra - Yuba 727225 53 7.29 Orange 29784086 2225 7.9
Sutter 916412 65 7.27 Fresno 9013743 601 7.82
Butte 2173630 165 7.07 San Bernardino 19860103 1153 7.48
Lassen - Modoc - Plumas 645767 48 7.02 Colusa - Glenn - Tehama 1104432 92 7.45
Colusa - Glenn - Tehama 1104432 83 6.9 Santa Barbara 4158749 314 7.32
Lake 639527 52 6.83 Madera 1452985 97 7.2
El Dorado 1771753 133 6.75 Solano 4113568 280 7.19
Del Norte - Humboldt 1610244 114 6.74 Kern 7995686 456 7.18
San Diego 30219158 1986 6.72 Tulare 4240885 247 7.16
Stanislaus 5068730 323 6.72 Lake 639527 61 7.16
San Benito 550170 34 6.64 Sacramento 13898252 928 7.12
Ventura 8087756 534 6.64 Merced 2486399 138 7.1
Shasta 1764581 141 6.61 San Benito 550170 33 7.03
Siskiyou - Trinity 581217 50 6.58 Monterey 4108255 260 7
Santa Barbara 4158749 274 6.57 Stanislaus 5068730 312 6.99
Contra Costa 10249027 697 6.56 Yolo 1943094 112 6.96
Sacramento 13898252 890 6.54 Sierra - Yuba 727225 44 6.95
Orange 29784086 1898 6.52 Napa 1338322 107 6.84
Solano 4113568 262 6.51 Contra Costa 10249027 703 6.65
Kern 7995686 461 6.44 Santa Cruz 2572971 157 6.56
San Mateo 7064882 483 6.38 Ventura 8087756 509 6.51
Napa 1338322 99 6.38 Riverside 20612241 1278 6.49
Santa Clara 17353490 1066 6.32 San Diego 30219158 1857 6.48
Monterey 4108255 249 6.32 Del Norte - Humboldt 1610244 113 6.38
San Joaquin 6691608 388 6.19 Placer 3307221 233 6.12
Riverside 20612241 1240 6.19 Sutter 916412 55 6.05
San Francisco 7882653 509 6.11 Sonoma 4747576 320 6.01
Fresno 9013743 499 6.06 Butte 2173630 152 6.01
San Bernardino 19860103 1053 5.95 El Dorado 1771753 121 5.81
Yolo 1943094 104 5.94 Marin 2487557 175 5.5
Tulare 4240885 222 5.87 Siskiyou - Trinity 581217 46 5.28
Alameda 14819767 841 5.77 San Luis Obispo 2643455 157 5.11
Mendocino 876475 59 5.77 Mariposa - Tuolumne 740101 58 5.09
Alpine - Amador - Calaveras 843965 63 5.7 Mendocino 876475 55 5.08
Merced 2486399 124 5.61 Lassen - Modoc - Plumas 645767 38 5.05
Imperial 1650904 85 5.55 Alpine - Amador - Calaveras 843965 62 4.89
Los Angeles 98007955 5152 5.54 Shasta 1764581 109 4.87
Madera 1452985 73 5.26 Nevada 977375 67 4.43
Inyo - Mono 323098 17 4.78 Inyo - Mono 323098 ~ ~
STATE 365593449 22142 6.2 STATE 365593449 27626 8.01
Note: All rates are per 100,000 and age-adjusted to the 2000 U.S. Standard Population; Rates generated on Dec 1, 2016; Based on December 2015 Extract.
Cancer Prevalence in California Counties | Page 71
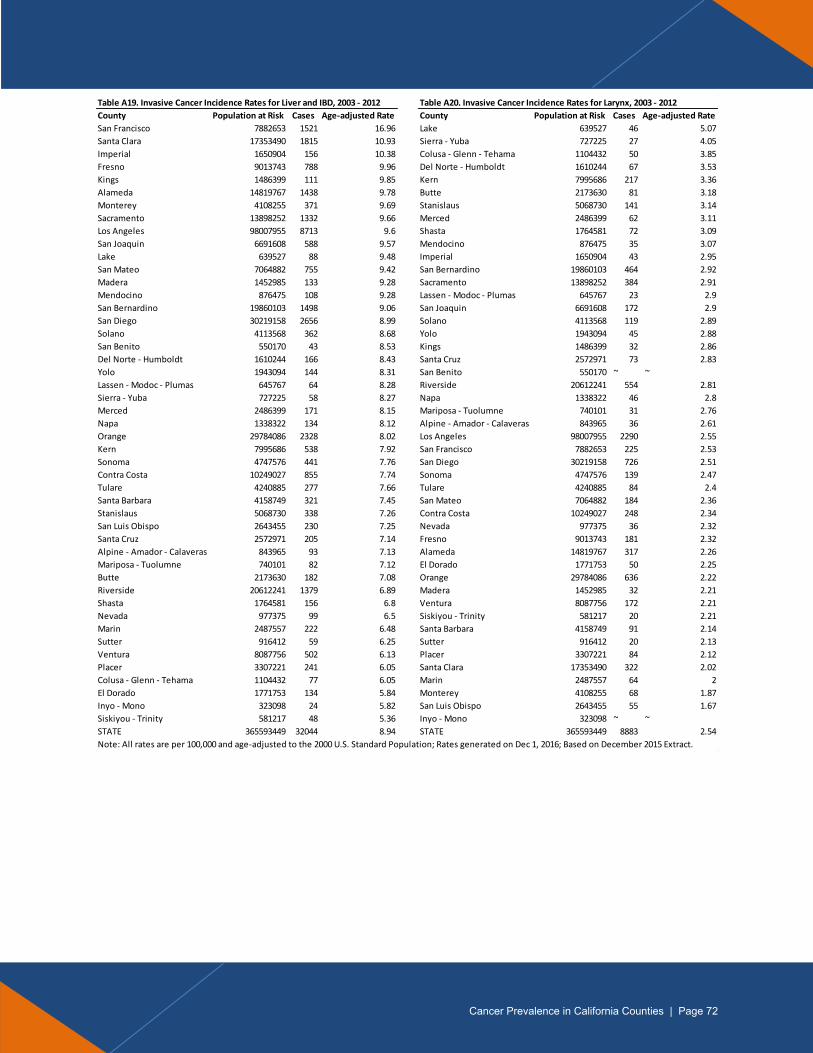
72
Table A19. Invasive Cancer Incidence Rates for Liver and IBD, 2003 - 2012 Table A20. Invasive Cancer Incidence Rates for Larynx, 2003 - 2012
County Population at Risk Cases Age-adjusted Rate County Population at Risk Cases Age-adjusted Rate
San Francisco 7882653 1521 16.96 Lake 639527 46 5.07
Santa Clara 17353490 1815 10.93 Sierra - Yuba 727225 27 4.05
Imperial 1650904 156 10.38 Colusa - Glenn - Tehama 1104432 50 3.85
Fresno 9013743 788 9.96 Del Norte - Humboldt 1610244 67 3.53
Kings 1486399 111 9.85 Kern 7995686 217 3.36
Alameda 14819767 1438 9.78 Butte 2173630 81 3.18
Monterey 4108255 371 9.69 Stanislaus 5068730 141 3.14
Sacramento 13898252 1332 9.66 Merced 2486399 62 3.11
Los Angeles 98007955 8713 9.6 Shasta 1764581 72 3.09
San Joaquin 6691608 588 9.57 Mendocino 876475 35 3.07
Lake 639527 88 9.48 Imperial 1650904 43 2.95
San Mateo 7064882 755 9.42 San Bernardino 19860103 464 2.92
Madera 1452985 133 9.28 Sacramento 13898252 384 2.91
Mendocino 876475 108 9.28 Lassen - Modoc - Plumas 645767 23 2.9
San Bernardino 19860103 1498 9.06 San Joaquin 6691608 172 2.9
San Diego 30219158 2656 8.99 Solano 4113568 119 2.89
Solano 4113568 362 8.68 Yolo 1943094 45 2.88
San Benito 550170 43 8.53 Kings 1486399 32 2.86
Del Norte - Humboldt 1610244 166 8.43 Santa Cruz 2572971 73 2.83
Yolo 1943094 144 8.31 San Benito 550170 ~ ~
Lassen - Modoc - Plumas 645767 64 8.28 Riverside 20612241 554 2.81
Sierra - Yuba 727225 58 8.27 Napa 1338322 46 2.8
Merced 2486399 171 8.15 Mariposa - Tuolumne 740101 31 2.76
Napa 1338322 134 8.12 Alpine - Amador - Calaveras 843965 36 2.61
Orange 29784086 2328 8.02 Los Angeles 98007955 2290 2.55
Kern 7995686 538 7.92 San Francisco 7882653 225 2.53
Sonoma 4747576 441 7.76 San Diego 30219158 726 2.51
Contra Costa 10249027 855 7.74 Sonoma 4747576 139 2.47
Tulare 4240885 277 7.66 Tulare 4240885 84 2.4
Santa Barbara 4158749 321 7.45 San Mateo 7064882 184 2.36
Stanislaus 5068730 338 7.26 Contra Costa 10249027 248 2.34
San Luis Obispo 2643455 230 7.25 Nevada 977375 36 2.32
Santa Cruz 2572971 205 7.14 Fresno 9013743 181 2.32
Alpine - Amador - Calaveras 843965 93 7.13 Alameda 14819767 317 2.26
Mariposa - Tuolumne 740101 82 7.12 El Dorado 1771753 50 2.25
Butte 2173630 182 7.08 Orange 29784086 636 2.22
Riverside 20612241 1379 6.89 Madera 1452985 32 2.21
Shasta 1764581 156 6.8 Ventura 8087756 172 2.21
Nevada 977375 99 6.5 Siskiyou - Trinity 581217 20 2.21
Marin 2487557 222 6.48 Santa Barbara 4158749 91 2.14
Sutter 916412 59 6.25 Sutter 916412 20 2.13
Ventura 8087756 502 6.13 Placer 3307221 84 2.12
Placer 3307221 241 6.05 Santa Clara 17353490 322 2.02
Colusa - Glenn - Tehama 1104432 77 6.05 Marin 2487557 64 2
El Dorado 1771753 134 5.84 Monterey 4108255 68 1.87
Inyo - Mono 323098 24 5.82 San Luis Obispo 2643455 55 1.67
Siskiyou - Trinity 581217 48 5.36 Inyo - Mono 323098 ~ ~
STATE 365593449 32044 8.94 STATE 365593449 8883 2.54
Note: All rates are per 100,000 and age-adjusted to the 2000 U.S. Standard Population; Rates generated on Dec 1, 2016; Based on December 2015 Extract.
Cancer Prevalence in California Counties | Page 72

73
Table A21. Invasive Cancer Incidence Rates for Pancreas, 2003 - 2012
County Population at Risk Cases Age-adjusted Rate
Lake 639527 123 13.95
El Dorado 1771753 276 13.34
Butte 2173630 342 13.01
Merced 2486399 248 12.99
Napa 1338322 212 12.88
Nevada 977375 186 12.8
Sacramento 13898252 1650 12.66
Solano 4113568 497 12.58
San Francisco 7882653 1131 12.54
Santa Barbara 4158749 532 12.37
Sonoma 4747576 676 12.34
Monterey 4108255 448 12.22
Mariposa - Tuolumne 740101 136 12.1
Alameda 14819767 1675 12.04
Santa Cruz 2572971 294 11.96
San Joaquin 6691608 693 11.89
Contra Costa 10249027 1256 11.86
Placer 3307221 465 11.86
Mendocino 876475 133 11.81
San Mateo 7064882 929 11.77
Shasta 1764581 265 11.74
Santa Clara 17353490 1842 11.63
Stanislaus 5068730 522 11.63
Sierra - Yuba 727225 78 11.6
Tulare 4240885 393 11.56
Marin 2487557 378 11.56
San Diego 30219158 3293 11.51
San Benito 550170 51 11.49
Madera 1452985 155 11.49
Colusa - Glenn - Tehama 1104432 148 11.47
San Bernardino 19860103 1724 11.38
Fresno 9013743 855 11.29
Los Angeles 98007955 9832 11.24
Riverside 20612241 2196 11.22
Kings 1486399 118 11.18
Orange 29784086 3125 11.16
Kern 7995686 686 10.97
Yolo 1943094 174 10.95
Lassen - Modoc - Plumas 645767 85 10.9
Ventura 8087756 839 10.82
San Luis Obispo 2643455 346 10.69
Siskiyou - Trinity 581217 93 10.6
Alpine - Amador - Calaveras 843965 143 10.58
Del Norte - Humboldt 1610244 193 10.57
Sutter 916412 93 10.11
Imperial 1650904 134 9.6
Inyo - Mono 323098 33 8.65
STATE 365593449 39696 11.55
Note: All rates are per 100,000 and age-adjusted to the 2000 U.S. Standard Population
Rates generated on Dec 1, 2016; Based on December 2015 Extract.
Cancer Prevalence in California Counties | Page 73